## Diagram: State Transition Diagram Illustrating Infinite Loops
### Overview
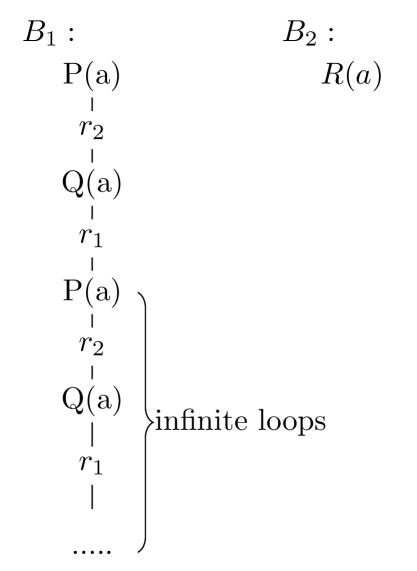
The image presents a state transition diagram with two branches, labeled B1 and B2. Branch B1 demonstrates a sequence of states and transitions that lead to an infinite loop. Branch B2 shows a single state.
### Components/Axes
* **Branch Labels:** B1 (top-left), B2 (top-right)
* **States:** P(a), Q(a), R(a)
* **Transitions:** r1, r2
* **Loop Indicator:** "infinite loops" with a bracket encompassing the repeating section of the B1 branch.
### Detailed Analysis
**Branch B1:**
* Starts with state P(a).
* Transitions to the next state via r2.
* Moves to state Q(a).
* Transitions to the next state via r1.
* Returns to state P(a), creating a loop.
* The sequence P(a) -> r2 -> Q(a) -> r1 repeats, indicated by the "infinite loops" label and a bracket.
* The diagram ends with "....." indicating the loop continues indefinitely.
**Branch B2:**
* Consists of a single state R(a).
* No transitions are shown.
### Key Observations
* Branch B1 demonstrates a cyclical process, while Branch B2 represents a static state.
* The "infinite loops" annotation highlights the repeating nature of the transitions in Branch B1.
### Interpretation
The diagram illustrates a scenario where a system can enter an infinite loop due to a specific sequence of states and transitions (Branch B1). This contrasts with a stable state (Branch B2) where no transitions occur. The diagram is likely used to explain or demonstrate a potential problem in a system's design or behavior, where a cyclical process prevents the system from reaching a desired outcome or termination point.