## Line Chart: Visual Encoder Size vs LLM Size
### Overview
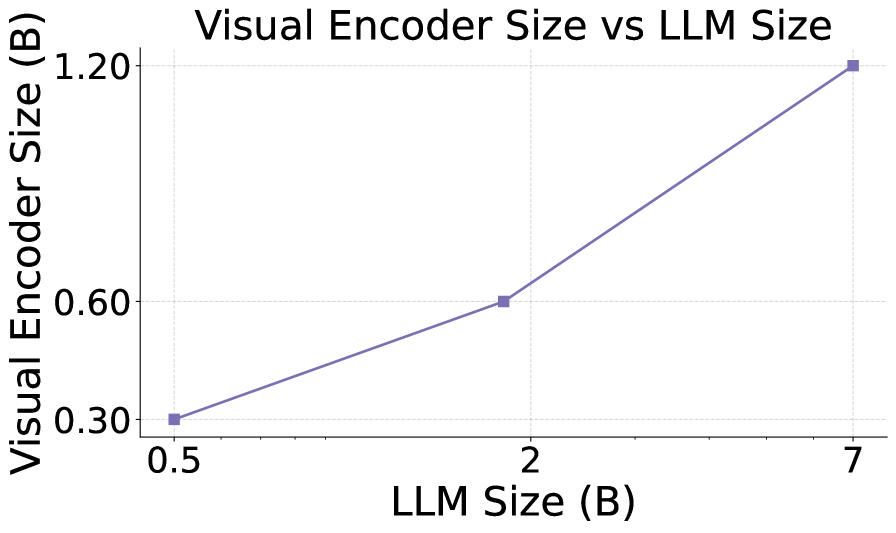
The image is a line chart that plots the relationship between Visual Encoder Size (in Billions) and LLM Size (in Billions). The chart shows a positive correlation, indicating that as the LLM size increases, the Visual Encoder size also increases.
### Components/Axes
* **Title:** Visual Encoder Size vs LLM Size
* **X-axis:**
* Label: LLM Size (B)
* Scale: 0.5, 2, 7
* **Y-axis:**
* Label: Visual Encoder Size (B)
* Scale: 0.30, 0.60, 1.20
* **Data Series:** A single line in a muted purple color.
### Detailed Analysis
The line chart shows the following data points:
* **LLM Size 0.5B:** Visual Encoder Size is approximately 0.3B.
* **LLM Size 2B:** Visual Encoder Size is approximately 0.6B.
* **LLM Size 7B:** Visual Encoder Size is approximately 1.2B.
The line slopes upward, indicating a positive correlation between LLM Size and Visual Encoder Size. The slope appears steeper between LLM Size 2B and 7B compared to the slope between 0.5B and 2B.
### Key Observations
* There is a clear positive correlation between LLM Size and Visual Encoder Size.
* The increase in Visual Encoder Size is more pronounced as LLM Size increases from 2B to 7B.
### Interpretation
The chart suggests that larger Language Learning Models (LLMs) require larger Visual Encoders. The non-linear increase suggests that the relationship might not be directly proportional; the visual encoder size increases at a faster rate as the LLM size grows. This could be due to the increased complexity and data processing demands of larger LLMs, requiring a more powerful visual encoder to effectively handle visual inputs.