# Unknown Title
## Church: a language for generative models
## Noah D. Goodman ∗ , Vikash K. Mansinghka ∗ , Daniel Roy, Keith Bonawitz & Joshua B. Tenenbaum
MIT BCS/CSAIL Cambridge, MA 02139
## Abstract
Formal languages for probabilistic modeling enable re-use, modularity, and descriptive clarity, and can foster generic inference techniques. We introduce Church , a universal language for describing stochastic generative processes. Church is based on the Lisp model of lambda calculus, containing a pure Lisp as its deterministic subset. The semantics of Church is defined in terms of evaluation histories and conditional distributions on such histories. Church also includes a novel language construct, the stochastic memoizer, which enables simple description of many complex non-parametric models. We illustrate language features through several examples, including: a generalized Bayes net in which parameters cluster over trials, infinite PCFGs, planning by inference, and various non-parametric clustering models. Finally, we show how to implement query on any Church program, exactly and approximately, using Monte Carlo techniques.
## 1 INTRODUCTION
Probabilistic models have proven to be an enormously useful tool in artificial intelligence, machine learning, and cognitive science. Most often these models are specified in a combination of natural and mathematical language, and inference for each new model is implemented by hand. Stochastic programming languages [e.g. 12, 14, 10] aim to tame the model-building process by giving a formal language which provides simple, uniform, and re-usable descriptions of a wide class of models, and supports generic inference techniques. In this paper we present the Church stochastic
∗ The first two authors contributed equally to this work.
programming language (named for computation pioneer Alonzo Church), a universal language for describing generative processes and conditional queries over them. Because this language is based on Church's lambda calculus, expressions, which represent generative models, may be arbitrarily composed and abstracted. The distinctive features of Church, and the main contributions of this paper, are: 1) a Lisp-like language specification in which we view evaluation as sampling and query as conditional sampling , 2) a stochastic memoizer , which allows separate evaluations to share generative history and enables easy description of non-parametric probabilistic models, and, 3) generic schemes for exact and approximate inference, which implement the query primitive, so that any Church program may be run without writing specialpurpose inference code.
## 2 THE CHURCH LANGUAGE
The Church language is based upon a pure subset of the functional language Scheme [6], a Lisp dialect. Church is a dynamically-typed, applicative-order language, in which procedures are first-class and expressions are values. Church expressions describe generative processes: the meaning of an expression is specified through a primitive procedure eval , which samples from the process, and a primitive procedure query , which generalizes eval to sample conditionally. In true Lisp spirit, eval and query are ordinary procedures that may be nested within a Church program. Randomness is introduced through stochastic primitive functions; memoization allows random computations to be reused.
Church expressions have the form:
$$\begin{align*}
\text{provide} & \text{expression } := c \vert x \vert ( e _ { 1 } a \widehat { wide } ( i f } e _ { 1 } e _ { 2 } e _ { tech- } ) | ( \lambda x. e ) \\
& = c \vert x \vert ( e _ { 1 } a \widehat { wide } ( i f } e _ { 1 } e _ { 2 } e _ { tech- } ) | ( \lambda x. e )
\end{align*}$$
Here x stands for a variable (from a countable set of variable symbols), e i for expressions, and c for a (primitive) constant. (We often write ' e as shorthand for (quote e ) .)
The constants include primitive data types (nil, Boolean, char, integer, fixed-precision real, etc.), and standard functions to build data structures (notably pair , first , and rest for lists) and manipulate basic types (e.g. and , not ) 1 . As in most programming languages, all primitive types are countable; real numbers are approximated by either fixed- or floating-precision arithmetic. A number of standard (deterministic) functions, such as the higher-order function map , are provided as a standard library, automatically defined in the global environment. Other standard Scheme constructs are provided-such as (let ((a a-def ) (b b-def ) ...) body ) , which introduces names that can be used in body , and is sugar for nested lambda s.
Church values include Church expressions, and procedures; if v 1 ...v n are Church values the list ( v 1 ...v n ) is a Church value. A Church environment is a list of pairs consisting of a variable symbol and a value (the variable is bound to the value); note that an environment is a Church value. Procedures come in two types: Ordinary procedures are triples, ( body , args , env ), of a Church expression (the body), a list of variable symbols (the formal parameters, or arguments), and an environment. Elementary random procedures are ordinary procedures that also have a distribution function -a probability function that reports the probability P ( value | env , args ) of a return value from evaluating the body (via the eval procedure described below) given env and values of the formal parameters 2 .
To provide an initial set of elementary random procedures we allow stochastic primitive functions, in addition to the usual constants, that randomly sample a return value depending only on the current environment. Unlike other constants, these random functions are available only wrapped into elementary random procedures: (fun, args, env, dist) , where dist = P ( value | env , args ) is the probability function for fun . We include several elementary random procedures, such as flip which flips a fair coin (or flips a weighted coin when called with a weight argument).
1 The primitive function gensym deserves special note: (eval '(gensym) env) returns a procedure ( c, x, env ) where c is a constant function which returns True if x is bound to the procedure ( c, x, env ), and False otherwise. Furthermore it is guaranteed that (gensym (gensym)) evaluates to False (i.e. each evaluation of gensym results in a unique value).
2 This definition implies that when the body of an elementary random procedure is not a constant, its distribution function represents the marginal probability over any other random choices made in evaluating the body. This becomes important for implementing query.
A Church expression defines a generative process via the recursive evaluation procedure, eval . This primitive procedure takes an expression and an environment and returns a value-it is an environment model, shared with Scheme, of Church's lambda calculus [4, 6]. The evaluation rules are given in Fig. 1. An evaluation history for an expression e is the sequence of recursive calls to eval , and their return values, made by (eval ' e env) . The probability of a finite evaluation history is the product of the probabilities for each elementary random procedure evaluation in this history 3 . The weight of an expression in a particular environment is the sum of the probabilities of all of its finite evaluation histories. An expression is admissible in an environment if it has weight one, and a procedure is admissible if its body is admissible in its environment for all values of its arguments. An admissible expression defines a distribution on evaluation histories (we make this claim precise in section 2.2). Note that an admissible expression can have infinite histories, but the set of infinite histories must have probability zero. Thus admissibility can be thought of as the requirement that evaluation of an expression halts with probability one. Marginalizing this distribution over histories results in a distribution on values, which we write µ ( e, env ). Thus, (eval ' e env) , for admissible e , returns a sample from µ ( e, env ).
The procedure eval allows us to interpret Church as a language for generative processes, but for useful probabilistic inference we must be able to sample from a distribution conditioned on some assertions (for instance the posterior probability of a hypothesis conditioned on observed data). The procedure (query ' e p env) is defined to be a procedure which samples a value from µ ( e, env ) conditioned on the predicate procedure p returning True when applied to the value of (eval ' e env) . The environment argument env is optional, defaulting to the current environment. (Note that the special case of query when the predicate p is the constant procedure (lambda (x) True) defines the same distribution on values as eval .) For example, one might write (query '(pair (flip) (flip)) (lambda (v) (+ (first v) (last v)))) to describe the conditional distribution of two flips given that at least one flip landed heads. If e or p are not admissible in env the query result is undefined. We describe this conditional distribution, and conditions for its welldefinedness, more formally in Theorem 2.3. In Section 4 we consider Monte Carlo techniques for implementing query .
3 However, if evaluating an elementary random procedure results in evaluating another elementary random procedure we take only the probability of the first, since it already includes the second.
- (eval ' c env) : For constant c , return c ( env ).
- (eval ' x env) : Look-up symbol x in env , return the value it is bound to.
- (eval '( e 1 e 2 ...) env) : Evaluate each (eval ' e i env) . The value of (eval ' e 1 env) should be a procedure ( body , x 2 ... , env2 ). Make env3 by extending env2 , binding x 2 ... to the return values of e 2 ... . Return the value of (eval body env3) .
- (eval '(lambda ( x... ) e ) env) : Return the procedure ( e , x... , env ).
- (eval '(if e 1 e 2 e 3 ) env) : If (eval e 1 env) returns True return the return value of (eval e 2 env) , otherwise of (eval e 3 env) .
- (eval '(quote e ) env) : Return the expression e (as a value).
- (eval '(define x e ) env) : Extend env by binding the value of (eval ' e env) to x ; return the extended environment.
Figure 1: An informal definition of the eval procedure. If preconditions of these descriptions fail the constant value error is returned. Note that constants represent (possibly stochastic) functions from environments to values-truly 'constant' constants return themselves.
It can be awkward in practice to write programs using query , because many random values must be explicitly passed from the query expression to the predicate through the return value. An alternative is to provide a means to name random values which are shared by all evaluations, building up a 'random world' within the query. To enable a this style of programming, we provide the procedure lex-query (for 'lexicalizing query') which has the form:
```
(lex-query '((A A-definition) (B B-definition) ...) )
'e 'p)
```
```
where the first argument binds a lexicon of symbols to definitions, which are available in the environment in which the remaining (query and predicate) expressions are evaluated. In this form the predicate is an expression, and the final environment argument is omittedthe current environment is used.
A program in Church consists of a sequence of Church expressions-this sequence is called the top level . Any definitions at the top level are treated as extending the global (i.e. initial) environment, which then is used to evaluate the remaining top-level expressions. For instance:
```
(define A e1) e2 is treated as: (eval 'e2 (eval '(define A e1) global-env)).
ne A c1 global-env). </doc>
```
## 2.1 Stochastic Memoization
In deterministic computation, memoization is a technique for efficient implementation that does not affect the language semantics: the first time a (purely functional) procedure is evaluated with given arguments its return value is recorded; thereafter evaluations of that procedure with those arguments directly return this value, without re-evaluating the procedure body. Memoization of a stochastic program can radically change the semantics: if flip is an ordinary random procedure (= (flip) (flip)) is True with probability 0 . 5, but if flip is memoized this expression is True with probability one. More generally, a collection of memoized functions has a random-world semantics as discussed in [10]. In Section 3 we use memoization together with lex-query to describe generative processes involving an unknown number of objects with persistent features, similar to the BLOG language [12].
To formally define memoization in Church, we imagine extending the notion of environment to allow countably many variables to be bound in an environment. The higher-order procedure mem takes an admissibleprocedure and returns another procedure: if (eval e env) returns the admissible procedure (body, args, env2) , then (eval '(mem e ) env) returns the memoized procedure (mfun e , args, env+) , where:
- env+ is env2 (notionally) extended with a symbol V val , for each value val , bound to a value drawn from the distribution µ ( ( e val ), env ).
- mfun e is a new constant function such that mfun e applied to the environment env+ extended with args bound to val returns the value bound to V val .
This definition implies that infinitely many random choices may be made when a memoized random procedure is created-the notion of admissibility must be extended to expressions which involve mem . In the next section we describe an appropriate extension of admissibility, such that admissible expressions still define a marginal distribution on values, and the conditional distributions defining query are well-formed.
Ordinary memoization becomes a semantically meaningful construct within stochastic languages. This suggests that there may be useful generalizations of mem , which are not apparent in non-stochastic computation. Indeed, instead of always returning the initial value or always re-evaluating, one could stochastically decide on each evaluation whether to use a previously computed value or evaluate anew. We define such a stochastic memoizer DPmem by using the Dirichlet process (DP) [20]-a distribution on discrete distributions
```
<doc> (define (DP alpha proc)
(let ((sticks (mem (lambda x (beta 1.0 alpha))))
(atoms (mem (lambda (proc))))
(lambda () (atoms (pick-a-stick sticks))))))
(define (pick-a-stick sticks j)
(if (< (random) (sticks j))
(pick-a-stick sticks (+ j 1)))))
(define (DPmem alpha proc)
(let ((dps (mem (lambda x (beta 1.0 alpha))))
(atoms (mem (lambda (proc))))
(lambda () (atoms (pick-a-stick sticks 1))))))
(define (DPalpha proc)
(let ((x (beta 1.0 alpha)))
(if (< (random) (sticks x))
(x (proc)))))
(define (DPmem args)
(apply proc args)))
Lemma
a given e
of the Dirichlet Process,
Proof sketch
a tree with </doc>
```
Figure 2: Church implementation of the Dirichlet Process, via stick breaking, and DPmem . (Evaluating (apply proc args) in env for args = (a 1 ...) is equivalent to (eval '(proc a 1 ...) env) .)
built from an underlying base measure. For an admissible procedure e , the expression (DPmem a e ) evaluates in env to a procedure which samples from a (fixed) sample from the DP with base measure µ ( e , env ) and concentration parameter a . (When a =0, DPmem reduces to mem , when a = ∞ , it reduces to the identity.) The notion of using the Dirichlet process to cache generative histories was first suggested in Johnson et al. [5], in the context of grammar learning. In Fig. 2 we write the Dirichlet Process and DPmem directly in Church, via a stick-breaking representation. This gives a definition of these objects, proves that they are semantically well-formed (provided the rest of the language is), and gives one possible implementation.
We pause here to explain choices made in the language definition. Programs written with pure functions, those that always return the same value when applied to the same arguments, have a number of advantages. It is clear that a random function cannot be pure, yet there should be an appropriate generalization of purity which maintains some locality of information. We believe the right notion of purity in a stochastic language is exchangeability : if an expression is evaluated several times in the same environment, the distribution on return values is invariant to the order of evaluations. This exchangeability is exploited by the Metropolis-Hastings algorithm for approximating query given in Section 4.
Mutable state (or an unpleasant, whole-program transformation into continuation passing style ) is necessary to implement Church, both to model randomness and to implement mem using finite computation. However, this statefulness preserves exchangeability. Understanding the ways in which other stateful language constructs-in particular, primitives for the construction and modification of mutable statemight aid in the description of stochastic processes remains an important area for future work.
## 2.2 Semantic Correctness
In this section we give formal statements of the claims above, needed to specify the semantics of Church, and sketch their proofs. Let Church -denote the set of Church expressions that do not include mem .
Lemma 2.1. If e ∈ Church -then the weight of e in a given environment is well-defined and ≤ 1 .
Proof sketch. Arrange the recursive calls to eval into a tree with an evaluation at each node and edges connecting successive applications of eval -if a node indicates the evaluation of an elementary random procedure there will be several edges descending from this node (one for each possible return value), and these edges are labeled with their probability. A history is a path from root to leaf in this tree and its probability is the product of the labels along the path. Let W n indicate the sum of probabilities of paths of length n or less. The claim is now that lim n →∞ W n converges and is bounded above by 1. The bound follows because the sum of labels below any random node is 1; convergence then follows from the monotone convergence theorem because the labels are non-negative.
We next extend the notion of admissibility to arbitrary Church expressions involving mem . To compute the probability of an evaluation history we must include the probability of calls to mem -that is, the probability of drawing each return value V val . Because there are infinitely many V val , the probability of many histories will then be zero, therefore we pass to equivalence classes of histories. Two histories are equivalent if they are the same up to the values bound to V val -in particular they must evaluate all memoized procedures on the same arguments with the same return values. The probability of an equivalence class of histories is the marginal probability over all unused arguments and return values, and this is non-zero. The weight of an expression can now be defined as the sum over equivalence classes of finite histories.
Lemma 2.2. The admissibility of a Church expression in a given environment is well defined, and any expression e admissible in environment env defines a distribution µ ( e, env ) on return values of (eval ' e env) .
Proof sketch: The proof is by induction on the number of times mem is used. Take as base case expressions without mem ; by Lemma 2.1 the weight is well defined, so the set of admissible expressions is also well defined.
This function provides persistent class assignments to objects, where classes are symbols drawn from a pool with DP prior:
```
(define drawclass (DPmem (define class (mem (lambda () 1.0 gensym)))) Toda (obj) (drawclass)))))
```
For the beta-binomial model there's a coin weight for each feature/class pair, and each object has features that depend only on it's type:
```
(define coin-weight (mem (lambda (feat obj) (flip (coin-weight feat (class obj))))) proba class) (beta 1 1))
(ht feat (class obj)))
is we
```
For a gaussian-mixture on continuous data (with known variance), we just change the code for generating values:
```
<doc> (define mean
(mem (lambda (obj-class) (normal 0.0 10.0))) )
(define cont-value
(mem (lambda (obj)
(normal (mean (class obj)) 1.0))))
3 </doc>
```
The infinite relational model [7] with continuous data is similar, but means depend on classes of two objects:
```
<doc> (define irm-mean
(mem (lambda (obj-class1 obj-class2)
(normal 0.0 10.0))))
(define irr-value
(mem (lambda (obj1 obj2)
(normal (irm-mean (class obj1) (class obj2)))))
Figure 3: Church expressions for infinite mixture type </doc>
```
Figure 3: Church expressions for infinite mixture type models, showing use of the random-world programming style in which objects have persistent properties. Functions beta and normal generate samples from these standard distributions.
Now, assume p = (body, args, env) is an admissible procedure with well defined distribution on return values. The return from (mem p) is well defined, because the underlying measure µ ( p, env ) is well defined. It is then straightforward to show that any expression involving (mem p) , but no other new memoized procedures, has a well defined weight. The induction step follows.
A subtlety in this argument comes if one wishes to express recursive memoized functions such as:
```
```
Prima facie this recursion seems to eliminate the memoization-free base case. However, any recursive definition (or set of definitions) may be re-written without recursion in terms of a fixed-point combinator: (define F (fix ...)) . With this replacement made we are reduced to the expected situation-application of fix may fail to halt, in which case F will be inadmissible, but the weight is well defined.
Lemma 2.2 only applies to expressions involving mem for admissible procedures-a relaxation is possible for partially admissible procedures in some situations. From Lemma 2.2 it is straightforward to prove:
Theorem 2.3. Assume expression e and procedure p are admissible in env , and let V be a random value distributed according to µ ( e , env ) . If there exists a value v in the support of µ ( e , env ) and True has non-zero probability under µ ( ( p v ) , env ) , then the conditional probability
```
<doc> P(V = val | (eval
’
p V) env) = True) </doc>
```
is well defined.
Theorem 2.3 shows that query is a well-posed procedure; in Section 4 we turn to the technical challenge of actually implementing query.
## 3 EXAMPLE PROGRAMS
In this section we describe a number of example programs, stressing the ability of Church to express a range of standard generative models. As our first example, we describe diagnostic causal reasoning in a simple scenario: given that the grass is wet on a given day, did it rain (or did the sprinkler come on)? In outline of this might take the form of the query:
```
(lex-query '((grass-is-wet ...) (rain ...) (sprinkler ...) (rain 'day2) (grass-is-wet 'day2)))
```
where we define a causal model by defining functions that describe whether it rained, whether the sprinkler was on, and whether the grass is wet. The function grass-is-wet will depend on both rain and sprinkler -first we define a noisy-or function:
```
<doc> memo-
(define (noisy-or a astreduc-
(or (and (flip astrength) a)
(and (flip bstrength) b)
(flip baserate)))
to ex-
(define (noisy-or a astreduc-
(or (and (flip astrength) a)
(and (flip bstrength) b)
(flip baserate))) </doc>
```
Using this noisy-or function, and a look-up table for various weights, we can fill in the causal model:
```
various weights, we can fill in the causal model:
(lex-query '(weight (lambda (ofwhat) (case ofwhat (('rain-str) 0.9) made (('rain-prior) 0.3) ...)))))
(noisy-or (rain day) (weight 'rain-str) (sprinkler day) (weight 'sprinkler-str) (grass-is-wet (mem (lambda (day) (ofwhat day))))))) </doc>
```
```
x()
```
```
```
Figure 4: Some examples of 'stochastic transition models'.
```
<doc> (rain (mem (lambda (day)
(flip (weight 'rain-prior))))
(sprinkler (mem (lambda (day)
(flip (weight 'sprinkler-prior))))
(rain 'day2)
))
(lex-query
; ...model definti
; (rain 'day2)
r)))
; (and
(mass-in-water 'a </doc>
```
```
rain(mem(lambda(day): (flip(weight('rain-prior'))))))
```
Note that we have used mem to make the grass-is-wet , rain , and sprinkler functions persistent. For example, (= (rain 'day2) (rain 'day2)) is always True (it either rained on day two or not), this is necessary since both the query and predicate expressions will evaluate (rain 'day2) .
A Bayes net representation of this example would have clearly exposed the dependencies involved (though it would need to be supplemented with descriptions of the form of these dependencies). The Church representation, while more complex, lends itself to intuitive extensions that would be quite difficult in a Bayes net formulation. For instance, what if we don't know the Bernoulli weights, but we do have observations of other days? We can capture this by drawing the weights from a hyper-prior, redefining the weight function to:
```
Answer: To generate the output, we need to understand the given code snippet and its purpose. The code appears to be a function definition in Python, which takes two arguments: `beta` and `i`. It then returns the value of `beta` raised to the power of `i`. However, there is an error in the code as it does not include the closing parenthesis for the function definition.
To fix this issue, we need to add a closing parenthesis at the end of the function definition. Here's the corrected code:
```python
def ofwhat(beta, i):
return beta ** i
```
Now, let's execute the code and test it with some sample inputs.
```python
def ofwhat(beta, i):
return beta ** i
# Test cases
print(ofwhat(2, 3)) # Output: 8
print(ofwhat(3, 4)) # Output: 81
print(ofwhat(4, 5)) # Output: 1024
```
```
If we now query conditioned on observations from other days, we implicitly learn the weight parameters of the model:
```
(lex-query
,...model definitions...)
,('rain 'day2)
,('and
(grass-is-wet 'day1)
(rain 'day1)
(not (sprinkler 'day1))
(grass-is-wet 'day2))))
```
Going further, perhaps the probability of rain depends on (unknown) types of days (e.g. those with cumulus clouds, cirrus clouds, etc.), and perhaps the probability of the sprinkler activating depends on orthogonal types of days (e.g. Mondays and Fridays versus other days). We can model this scenario by drawing the prior probabilities from two stochastically memoized beta distributions:
```
<doc> 0000000000000000000000000000000
```
With this simple change we have extended the original causal model into an infinite mixture of such models, in which days are co-clustered into two sets of types, based on their relationship to the wetness of the grass.
In the previous example we left the types of days implicit in the memoizer, using only the probability of rain or sprinkler. In Fig. 3 we have given Church implementations for several infinite mixture models [see 7] using a different idiom-making the types into persistent properties of objects, drawn from an underlying memoized gensym (recall that gensym is simply a procedure which returns a unique value on each evaluation). Once we have defined the basic structure, class to draw latent classes for objects, it is straightforward to define the latent information for each class (e.g. coin-weight ), and the observation model (e.g. value ). This basic structure may be used to easily describe more complicated mixture models, such as the continuous-data infinite relational model (IRM) from [7]. Fig. 3 describes forward sampling for these models; to describe a conditional model, these definitions must be made within the scope of a query. For instance, if we wished to query whether two objects have the same class, conditioned on observed features:
```
<code>
(let ((alice (class 'alice)))
(let ((bob (class 'bob))))
(if (= alice 'alice)
(println "Alice is blond")
(println "Bob is blond"))))
```
Another idiom (Fig. 4) allows us to write the common class of 'stochastic transition' models, which includes probabilistic context free grammars (PCFGs), hidden Markov models (HMMs), and their 'infinite' analogs. Writing the HDP-PCFG [8] and HDP-HMM [2] in Church provides a compact and clear specification to these complicated non-parametric models. If we memoize unfold and use this adapted-unfold on PCFG transitions we recover the Adaptor Grammar model of [5]; if we similarly 'adapt' the HDP-PCFG or HDP-HMM we get interesting new models that have not been considered in the literature.
Fig. 5(top) gives an outline for using Church to represent planning problems. This is based on the translation of planning into inference, given in Toussaint et al. [21], in which rewards are transformed into the probability of getting a single 'ultimate reward'. Inference on this representation results in decisions which softmaximizes the expected reward. Fig. 5(bottom) fills in this framework for a simple 'red-light' game: the state is a light color (red/green) and an integer position, a 'go' action advances one position forward
```
```
```
```
Figure 5: Top: The skeleton of planning-as-inference in Church (inspired by [21]). For simplicity, we assume an equal reward amount for each boolean 'state property' that is true. Reward is given only when the state reaches a 'terminal state', however the stochastic termination decision given by terminal? results in an infinite horizon with discount factor gamma . Bottom: A specific planning problem for the 'red-light' game.
except that going on a red light results in being sent back to position 0 with probability cheat-det . The goal is to be past position 5 when the game ends; other rewards (e.g. for a staged game) could be added by adding sp2 , sp3 , and so on.
## 4 CHURCH IMPLEMENTATION
Implementing Church involves two complications beyond the implementation of eval as shown in Fig. 1 (which is essentially the same as any lexically scoped, applicative order, pure Lisp [6]). First, we must find a way to implement mem without requiring infinite structures (such as the V val ). Second, we must implement query by devising a means to sample from the appropriate conditional distribution.
To implement mem we first note that the countably many V val are not all needed at once: they can be
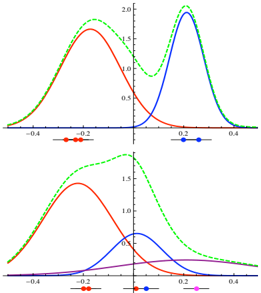
Figure 6: Posterior samples from the infinite gaussianmixture (with unknown variance) of Section 3, using the collapsed rejection algorithm for query . Two datasets are shown (as dots) with mixture components and posterior predictive distribution.
<details>
<summary>Image 1 Details</summary>
### Visual Description
## Probability Density Function Plots: Comparison of Distributions
### Overview
The image displays two vertically stacked plots, each showing multiple probability density functions (PDFs) or similar bell-shaped curves. The plots appear to compare different distributions or the same distributions under varying parameters. The top plot shows curves with higher peaks and narrower spreads, while the bottom plot shows broader, lower curves. All text in the image is in English.
### Components/Axes
**Top Plot:**
* **X-Axis:** Linear scale. Major tick marks and labels at -0.4, -0.2, 0, 0.2, 0.4.
* **Y-Axis:** Linear scale. Major tick marks and labels at 0, 0.5, 1.0, 1.5, 2.0.
* **Legend:** Positioned at the bottom center of the plot area. Contains four entries:
* A green dashed line segment labeled "0.2".
* A red solid line segment labeled "0.2".
* A blue solid line segment labeled "0.2".
* A green solid line segment labeled "0.2".
* **Data Series (Curves):**
1. **Green Dashed Line:** A symmetric, bell-shaped curve.
2. **Red Solid Line:** A symmetric, bell-shaped curve.
3. **Blue Solid Line:** A symmetric, bell-shaped curve.
4. **Green Solid Line:** A symmetric, bell-shaped curve that closely follows the green dashed line but with a slightly lower peak.
**Bottom Plot:**
* **X-Axis:** Linear scale. Major tick marks and labels at -0.4, -0.2, 0, 0.2, 0.4.
* **Y-Axis:** Linear scale. Major tick marks and labels at 0, 0.5, 1.0, 1.5.
* **Legend:** Positioned at the bottom center of the plot area. Contains four entries:
* A green dashed line segment labeled "0.2".
* A red solid line segment labeled "0.2".
* A blue solid line segment labeled "0.5".
* A purple solid line segment labeled "0.5".
* **Data Series (Curves):**
1. **Green Dashed Line:** A broad, bell-shaped curve.
2. **Red Solid Line:** A broad, bell-shaped curve.
3. **Blue Solid Line:** A broad, bell-shaped curve.
4. **Purple Solid Line:** A very broad, low-amplitude curve.
### Detailed Analysis
**Top Plot Analysis:**
* **Trend Verification:** All four curves are unimodal and symmetric, resembling Gaussian distributions. They are centered at different points along the x-axis.
* **Green Dashed Line (Legend: 0.2):** Peaks at approximately x = 0.1, y ≈ 2.0. The full width at half maximum (FWHM) is approximately 0.2 units (from x≈0.0 to x≈0.2).
* **Red Solid Line (Legend: 0.2):** Peaks at approximately x = -0.1, y ≈ 1.7. FWHM ≈ 0.2 units.
* **Blue Solid Line (Legend: 0.2):** Peaks at approximately x = 0.2, y ≈ 1.8. FWHM ≈ 0.15 units.
* **Green Solid Line (Legend: 0.2):** Peaks at approximately x = 0.1, y ≈ 1.9. It is slightly lower and possibly slightly wider than the green dashed line.
**Bottom Plot Analysis:**
* **Trend Verification:** All four curves are unimodal and symmetric, but are broader and lower in amplitude compared to the top plot.
* **Green Dashed Line (Legend: 0.2):** Peaks at approximately x = 0.0, y ≈ 1.5. FWHM ≈ 0.4 units.
* **Red Solid Line (Legend: 0.2):** Peaks at approximately x = -0.1, y ≈ 1.2. FWHM ≈ 0.35 units.
* **Blue Solid Line (Legend: 0.5):** Peaks at approximately x = 0.1, y ≈ 0.8. FWHM ≈ 0.3 units.
* **Purple Solid Line (Legend: 0.5):** Peaks at approximately x = 0.2, y ≈ 0.2. This is a very low, broad distribution.
### Key Observations
1. **Parameter Change:** The primary difference between the two plots is the spread (variance) of the distributions. The top plot shows narrow distributions (high precision), while the bottom plot shows broad distributions (low precision).
2. **Legend Discrepancy:** In the bottom plot, the blue and purple lines are associated with the label "0.5", while the green and red lines are associated with "0.2". This suggests the label may represent a parameter (like standard deviation) that is different for the blue/purple series in the bottom plot.
3. **Curve Relationships:** In both plots, the green dashed and green solid lines are very similar, suggesting they might represent a theoretical vs. empirical distribution, or a model with slightly different parameters.
4. **Amplitude vs. Width:** There is a clear inverse relationship between the peak height (amplitude) and the width of the curves. Narrower curves have higher peaks, conserving the total area under the curve (which must equal 1 for a PDF).
### Interpretation
These plots are likely demonstrating the effect of a parameter (such as standard deviation, σ) on the shape of a probability distribution, possibly a Gaussian. The labels "0.2" and "0.5" in the legends most plausibly refer to this parameter value.
* **Top Plot (All labels ≈ 0.2):** Shows distributions with a smaller parameter value (e.g., σ=0.2), resulting in tall, narrow peaks. The different colors (red, blue, green) likely represent distributions with different means (μ), as their peaks are centered at different x-values (-0.1, 0.1, 0.2).
* **Bottom Plot (Mixed labels 0.2 and 0.5):** Shows the effect of increasing the parameter for some distributions. The green and red curves (label 0.2) are broader than their counterparts in the top plot, which is inconsistent if the label is σ. This suggests the label might represent a different parameter, or the plots compare different models. The blue and purple curves (label 0.5) are significantly broader and lower, demonstrating how a larger parameter value (e.g., σ=0.5) flattens and widens the distribution. The purple curve is the most extreme example.
**Underlying Message:** The visualization effectively communicates how a single parameter controls the concentration of probability mass. A smaller value leads to high certainty (peaked distribution), while a larger value leads to high uncertainty (flat distribution). The multiple colored curves in each plot allow for comparison of this effect across different central values (means). The side-by-side (top-bottom) comparison starkly highlights the impact of changing the scale parameter.
</details>
created as needed, extending the environment env+ when they are created. (Note that this implementation choices is stateful, but may be implemented easily in full Scheme: the argument/return value pairs can be stored in an association list which grows as need.) 4
We now turn to query . The sampling-based semantics of Church allows us to define a simple rejection sampler from the conditional distribution defining query ; we may describe this as a Church expression:
```
(define (query exp pred env)
(let ((val (eval exp env)))
(if (pred val)
val
(query exp pred env))))
```
```
The ability to write query as a Church programa metacircular [1] implementation-provides a compelling argument for Church's modeling power. However, exact sampling using this algorithm will often be intractable. It is straightforward to implement a collapsed rejection sampler that integrates out randomness in the predicate procedure (accepting or rejecting a val with probability equal to the marginal probability that (p val) is true). We show results in Fig. 6 of this exact sampler used to query the infinite gaussianmixture model from Section 3.
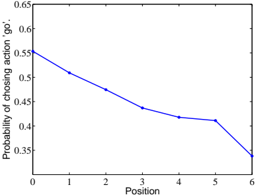
In Fig. 7 we show the result of running the collapsed rejection query for planning in the 'red-light' game, as shown in Fig. 5 (here gamma =0 . 2, cheat-det =0 . 7). The result is intuitive: when position is near 0 there is little to lose by 'cheating', as position nears 5 (the goal line) there is more to loose, hence the probability of cheating decreases; once past the goal line there is nothing to be gained by going, so the probability of cheating drops sharply. Note that the 'soft-max' formulation of planning used here results in fairly random behavior even in extreme positions.
4 A further optimization implements DPmem via the Chinese restaurant process representation of the DP [15].
Figure 7: Results from planning in the 'redlight' game (Fig. 5), showing the probability of 'cheating' (going when the light is red) versus position. The goal is to end the game past position 5.
<details>
<summary>Image 2 Details</summary>
### Visual Description
\n
## Line Chart: Probability of Choosing Action "go" vs. Position
### Overview
The image displays a 2D line chart plotting the probability of selecting a specific action ("go") against a sequential position. The chart shows a clear, generally decreasing trend in probability as the position number increases from 0 to 6.
### Components/Axes
* **Chart Type:** Simple line chart with a single data series.
* **X-Axis (Horizontal):**
* **Label:** "Position"
* **Scale:** Linear, integer values from 0 to 6.
* **Markers:** Major tick marks and labels at every integer (0, 1, 2, 3, 4, 5, 6).
* **Y-Axis (Vertical):**
* **Label:** "Probability of choosing action 'go'"
* **Scale:** Linear, ranging from 0.35 to 0.65.
* **Markers:** Major tick marks and labels at intervals of 0.05 (0.35, 0.40, 0.45, 0.50, 0.55, 0.60, 0.65).
* **Data Series:**
* **Representation:** A single, solid blue line connecting data points.
* **Legend:** Not present. The single line is unambiguously defined by the y-axis label.
* **Grid:** A light gray grid is present, aligning with the major ticks on both axes, aiding in value estimation.
### Detailed Analysis
**Data Points (Approximate Values):**
The following values are estimated based on the intersection of the blue line with the grid.
| Position (X) | Probability (Y) | Visual Trend Note |
| :--- | :--- | :--- |
| 0 | ~0.55 | Starting point, highest probability. |
| 1 | ~0.51 | Decrease from position 0. |
| 2 | ~0.48 | Continued decrease. |
| 3 | ~0.44 | Continued decrease. |
| 4 | ~0.42 | Decrease slows slightly. |
| 5 | ~0.41 | Very slight decrease, near plateau. |
| 6 | ~0.34 | Sharp decrease from position 5, lowest point. |
**Trend Verification:**
The blue line exhibits a consistent downward slope from left to right. The rate of decrease is relatively steady from position 0 to 4, becomes very shallow between positions 4 and 5, and then steepens significantly for the final segment from position 5 to 6.
### Key Observations
1. **Overall Negative Correlation:** There is a clear inverse relationship between Position and the Probability of choosing "go". As the position index increases, the likelihood of the "go" action decreases.
2. **Non-Linear Decay:** The decrease is not perfectly linear. The slope flattens noticeably between positions 4 and 5 before a final sharp drop.
3. **Range:** The probability spans a range of approximately 0.21 (from ~0.55 to ~0.34) across the 7 positions.
4. **Final Drop:** The most significant single-step decrease occurs between position 5 and position 6.
### Interpretation
This chart likely models a sequential decision-making process or a state-dependent policy. The "Position" could represent time steps, stages in a process, or a count of prior events.
* **What the data suggests:** The agent or system becomes progressively less inclined to choose the "go" action as it advances through positions. This could indicate increasing caution, accumulating cost/risk associated with "go", or a shifting strategy where alternative actions become more favorable later in the sequence.
* **How elements relate:** The x-axis (Position) acts as the independent variable driving the change in the dependent variable (Probability). The grid allows for precise correlation between specific positions and their associated decision probabilities.
* **Notable pattern:** The plateau between positions 4 and 5 is an interesting anomaly. It suggests a temporary stabilization in decision probability before a final, decisive drop. This could correspond to a specific phase in the underlying process where the incentive to choose "go" briefly holds steady.
* **Underlying implication:** If this represents a learned policy (e.g., from reinforcement learning), it shows the agent has learned that the value or appropriateness of the "go" action is highly context-dependent (position-dependent), with a strong negative bias in later stages.
</details>
## 4.1 A Metropolis-Hastings Algorithm
We now present a Markov chain Monte Carlo algorithm for approximately implementing query , as we expect (even collapsed) rejection sampling to be intractable in general. Our algorithm executes stochastic local search over evaluation histories, making small changes by proposing changes to the return values of elementary random procedures. These changes are constrained to produce the conditioned result, collapsing out the predicate expression via its marginal probability 5 . The use of evaluation histories, rather than values alone, can be viewed as an extreme form of data-augmentation: all random choices that lead to a value are made explicit in its history.
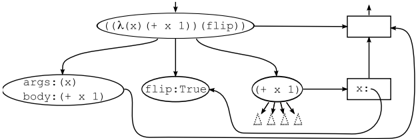
The key abstraction we use for MCMC is the computation trace . A computation trace is a directed, acyclic graph composed of two connected trees. The first is a tree of evaluations, where an evaluation node points to evaluation nodes for its recursive calls to eval . The second is a tree of environment extensions, where the node for an extended environment points to the node of the environment it extends. The evaluation node for each (eval ' e env) points to the environment node for env , and evaluation nodes producing values to be bound are pointed to by the environment extension of the binding. Traces are in one-to-one correspondence with equivalence classes of evaluation histories, described earlier 6 . Fig. 8 shows the fragment of a computation trace for evaluation of the expression ((lambda (x) (+ x 3)) (flip)) .
For each elementary random procedure p we need a Markov chain transition kernel K p that proposes a new return value for that procedure given its current arguments. A generic such kernel comes from re-
5 Handling the rejection problem on chain initialization (and queries across deterministic programs, more generally) is a challenge. Replacing all language primitives (including if ) with noisy alternatives and using tempering techniques provides one general solution, to be explored in future work.
6 Also note that the acyclicity of traces is a direct result of the purity of the Church language: if a symbol's value were mutated, its environment would point to the evaluation node that determined its new value, but that node would have been evaluated in the same environment.
Figure 8: A schematic computation trace.
<details>
<summary>Image 3 Details</summary>
### Visual Description
## Diagram: Computational Graph of a Function Application with Flip Operation
### Overview
The image displays a directed graph (flowchart) representing the computational steps or abstract syntax tree for evaluating a function application involving a lambda function and a `flip` operation. The diagram uses ovals to represent operations or function components and rectangles to represent variables or outputs, connected by arrows indicating data flow or evaluation order.
### Components/Axes
The diagram consists of the following labeled nodes and connections:
**Nodes (Ovals):**
1. **Top-center:** `(l (λ(x) (+ x 1)) (flip))` - The root expression, representing the application of a function `l` to two arguments: a lambda function `(λ(x) (+ x 1))` and a `flip` operation.
2. **Left-middle:** `args: (x)` / `body: (+ x 1)` - Decomposition of the lambda function, showing its argument list and body expression.
3. **Center:** `flip: True` - Represents the `flip` operation, which evaluates to the boolean value `True`.
4. **Right-middle:** `(+ x 1)` - The addition operation from the lambda's body.
**Nodes (Rectangles):**
1. **Top-right:** An empty rectangle. It receives arrows from the root node and the `x:` node.
2. **Bottom-right:** `x:` - Represents a variable binding or placeholder for the value of `x`.
**Connections (Arrows):**
* From the root node `(l ...)` to the `args/body` node.
* From the root node `(l ...)` to the `flip: True` node.
* From the root node `(l ...)` to the empty top-right rectangle.
* From the `args/body` node to the `(+ x 1)` node.
* From the `flip: True` node to the `(+ x 1)` node.
* From the `(+ x 1)` node to the `x:` rectangle.
* From the `x:` rectangle to the empty top-right rectangle.
### Detailed Analysis
The diagram illustrates a specific evaluation trace or structural breakdown:
1. **Root Decomposition:** The primary expression `(l (λ(x) (+ x 1)) (flip))` is broken down into its constituent parts: the function `l`, its first argument (the lambda), and its second argument (the `flip`).
2. **Lambda Expansion:** The lambda argument is further expanded into its formal parameters (`args: (x)`) and its executable body (`body: (+ x 1)`).
3. **Flip Evaluation:** The `flip` argument is shown to evaluate to the concrete value `True`.
4. **Operation Execution:** The body of the lambda, `(+ x 1)`, is depicted as an operation node. It receives input from the lambda's argument definition and, crucially, also from the evaluated `flip: True` node. This suggests the `flip` value may influence the addition operation (e.g., as a conditional flag).
5. **Variable Binding and Output:** The result of the `(+ x 1)` operation flows into a node labeled `x:`, which likely represents the binding of the result to the variable `x` or an intermediate value. This `x:` node, along with the original root expression, feeds into a final, unspecified output node (the empty top-right rectangle).
### Key Observations
* **Non-Standard Notation:** The diagram uses a mix of functional programming syntax (`λ`, `flip`) and flowchart conventions. The function `l` is not defined within the diagram.
* **Flip Integration:** The `flip: True` node has a direct connection to the `(+ x 1)` operation, which is atypical for a simple lambda calculus reduction. This implies `flip` is not just a passive argument but an active control parameter for the computation.
* **Ambiguous Output:** The final output node (top-right rectangle) is empty, leaving the ultimate result of the entire computation unspecified.
* **Spatial Flow:** The general flow is top-to-bottom and left-to-right, starting from the root expression and decomposing it into smaller, evaluatable components before converging towards an output.
### Interpretation
This diagram appears to model the evaluation of a **probabilistic or conditional programming construct**. The `flip` operation is commonly used in probabilistic programming languages to represent a fair coin flip (a Bernoulli trial with p=0.5). Here, it evaluates to `True`.
The connection from `flip: True` to `(+ x 1)` suggests the addition operation's behavior is conditional on the flip's outcome. For example, the expression `(l (λ(x) (+ x 1)) (flip))` might define a function `l` that takes a function and a boolean, and applies the function only if the boolean is true. The diagram captures the state where the flip is `True`, so the addition `(+ x 1)` is executed.
The graph essentially answers: "Given that `flip` is `True`, what are the components and intermediate steps involved in evaluating the main expression?" It isolates one possible execution path. The empty output node indicates the diagram's purpose is to illustrate the *process* and *dependencies* for this specific case, not to compute a final numerical result. The `x:` node likely holds the value `x+1` for some input `x`, which would be passed to the final function `l` along with the original expression.
</details>
evaluating (eval '( p args) env) ; however, a proper Church standard library could frequently supply more efficient proposal kernels for particular procedures (for instance a drift kernel for normal ). Our requirement is that we are able to sample a proposal from K p as well as evaluate its transition probability q p ( ·|· ).
If we simply apply K p to a trace, the trace can become 'inconsistent'-no longer representing a valid evaluation history from eval . To construct a complete Metropolis-Hastings proposal from K p , we must keep the computation trace consistent, and modify the proposal probabilities accordingly, by recursing along the trace updating values and potentially triggering new evaluations. For example, if we change the value of flip in (if (flip) e 1 e 2 ) from False to True we must: absorb the probability of (eval e 2 env) in the reverse proposal probability, evaluate e 1 and attach it to the trace, and include the probability of the resulting sub-trace in the forward proposal probability. (For a particular trace, the probability of the sub-trace for expression e is the probability of the equivalence class of evaluation histories corresponding to this subtrace.) The recursions for trace consistency and proposal computation are delicate but straightforward, and we omit the details due to space constraints 7 . Each step of our MCMC algorithm 8 consists of applying a kernel K p to the evaluations of a randomly chosen elementary random primitive in the trace, updating the trace to maintain consistency (collecting appropriate corrections to the proposal probability), and applying the Metropolis-Hastings criterion to accept or reject this proposal. (This algorithm ignores some details needed for queries containing nested queries, though we believe these to be straightforward.)
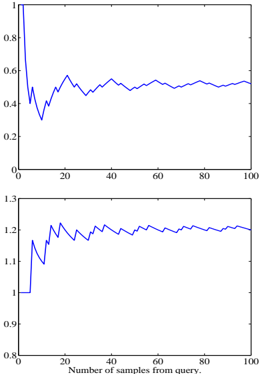
We have implemented and verified this algorithm on several examples that exercise all of the recursion and update logic of the system. In Fig. 9 we have shown convergence results for this algorithm running on the simple 'sprinkler' example of Section 3.
7 We implemented our MCMC algorithm atop the Blaise system [3], which simplifies these recursively triggered kernel compositions.
8 At the time of writing we have not implemented this algorithm for programs that use mem , though we believe the necessary additions to be straightforward.
<details>
<summary>Image 4 Details</summary>
### Visual Description
## Line Charts: Dual-Panel Time Series Analysis
### Overview
The image displays two vertically stacked line charts sharing a common x-axis. Both charts plot a single blue data series against the same independent variable. The charts appear to show the behavior of two different metrics or variables as a function of the number of samples processed from a query. No chart title, y-axis labels, or legend are present in the image.
### Components/Axes
* **X-Axis (Common to both charts):**
* **Label:** "Number of samples from query"
* **Scale:** Linear, ranging from 0 to 100.
* **Major Tick Marks:** At intervals of 20 (0, 20, 40, 60, 80, 100).
* **Top Chart Y-Axis:**
* **Label:** *Not present.*
* **Scale:** Linear, ranging from 0 to 1.
* **Major Tick Marks:** At intervals of 0.2 (0, 0.2, 0.4, 0.6, 0.8, 1.0).
* **Bottom Chart Y-Axis:**
* **Label:** *Not present.*
* **Scale:** Linear, ranging from 0.8 to 1.3.
* **Major Tick Marks:** At intervals of 0.1 (0.8, 0.9, 1.0, 1.1, 1.2, 1.3).
* **Data Series:** A single blue line in each chart. No legend is provided to identify the specific metric each line represents.
### Detailed Analysis
#### Top Chart
* **Trend Verification:** The line exhibits a sharp initial decline followed by damped oscillations that converge toward a stable value.
* **Data Point Extraction (Approximate):**
* At x ≈ 0, y ≈ 1.0 (starting point).
* At x ≈ 5, y drops sharply to a local minimum of ≈ 0.35.
* The line then rises to a local peak of ≈ 0.6 at x ≈ 20.
* Subsequent oscillations have decreasing amplitude. The line appears to stabilize around y ≈ 0.5 for x > 60.
* Final value at x = 100 is approximately 0.5.
#### Bottom Chart
* **Trend Verification:** The line shows a sharp initial increase followed by smaller fluctuations, converging toward a stable value higher than its starting point.
* **Data Point Extraction (Approximate):**
* At x ≈ 0, y = 1.0 (starting point).
* At x ≈ 5, y spikes to a local maximum of ≈ 1.2.
* It then dips to a local minimum of ≈ 1.1 at x ≈ 10.
* The line rises again, fluctuating between approximately 1.15 and 1.25 for the remainder of the series.
* It appears to stabilize around y ≈ 1.2 for x > 40.
* Final value at x = 100 is approximately 1.2.
### Key Observations
1. **Inverse Initial Behavior:** The two metrics react oppositely to the initial increase in samples. The top metric plummets while the bottom metric surges.
2. **Convergence:** Both series show a pattern of initial volatility followed by stabilization as the number of samples increases (x > 40-60).
3. **Different Scales:** The metrics operate on different numerical scales. The top chart's value is contained within [0,1], while the bottom chart's value stabilizes above its starting point of 1.0.
4. **Missing Context:** The lack of y-axis labels and a chart title makes it impossible to determine the units or the specific phenomena being measured (e.g., accuracy, error rate, confidence score, loss).
### Interpretation
The data suggests a system or process that undergoes a significant adjustment phase with a small number of samples before reaching a steady state. The inverse relationship in the initial phase is notable; it could indicate a trade-off between two competing objectives (e.g., precision vs. recall, speed vs. accuracy) that the system balances as it gathers more information.
The convergence of both lines implies that increasing the "Number of samples from query" beyond approximately 60 yields diminishing returns in terms of changing the measured metrics. The system appears to have learned or adapted sufficiently by that point.
**Without y-axis labels, the practical significance is ambiguous.** For example:
* If the top chart represents an error rate, the system improves (error decreases) and stabilizes at a moderate level (~0.5).
* If the top chart represents a similarity score, the system's confidence in its initial match decreases and stabilizes at a moderate similarity.
* The bottom chart, stabilizing at ~1.2, could represent a normalized performance metric where 1.0 is a baseline, indicating a 20% improvement over the baseline after processing samples.
The charts effectively visualize the *dynamics* and *convergence properties* of the underlying process but require additional metadata (axis labels, title, legend) to be fully interpretable in a technical context.
</details>
## 5 DISCUSSION
While Church builds on many other attempts to marry probability theory with computation, it is distinct in several important ways. First, Church is founded on the lambda calculus, allowing it to represent higherorder logic and separating it from many related languages. For example, unlike several widely used languages grounded in propositional logic (e.g. BUGS [9]) and first-order logic (e.g. the logic programming approaches of [13, 19], BLOG [12], and Markov logic [18]), generative processes in Church are first-class objects that can be arbitrarily composed and abstracted. The example programs in Section 3 illustrate the representational flexibility of Church; while some of these programs may be naturally represented in one or another existing language, we believe that no other language can easily represent all of these examples.
The stochastic functional language IBAL [14], based on the functional language ML, is quite similar to Church, but the two languages emphasize different aspects of functional programming. Other related work includes non-determistic [11] and weighted nondeterministic [16] extensions to Lisp. Unlike these approaches, the semantics of Church is fundamentally sampling-based: the denotation of admissible expressions as distributions follows from the semantics of evaluation rather than defining it. This semantics, combined with dynamic typing (cf. static typing of ML), permits the definition and exact implementation of query as an ordinary Church procedure, rather than a special transformation applied to the distribution denoted by a program. Because query is defined via sampling, describing approximate inference is particularly natural within Church.
A number of the more unusual features of Church as a stochastic programming language derive from its ba-
Figure 9: Convergence of one run of the MCMC algorithm on the 'sprinkler' example. (Each sample from query uses 30 MCMC steps.) Top: The probability of rain . Bottom: The expected value of (+ (rain) (sprinkler)) , showing explaining away. The sum is slightly above 1 . 0 because one cause is usually present, but both rarely are.
sis in Lisp. Since query and eval are the basic constructs defining the meaning of Church expressions, we have a metacircular [17] description of Church within Church. This provides clarity in reasoning about the language, and allows self-reflection within programs: queries may be nested within queries, and programs may reason about programs. Church expressions can serve both as a declarative notation for uncertain beliefs (via the distributions they represent) and as a procedural notation for stochastic and deterministic processes (via evaluation). Because expressions are themselves values, this generalizes the Lisp unification of programs and data to a unification of stochastic processes, Church expressions, and uncertain beliefs. These observations suggest exciting new modeling paradigms. For instance, eval nested within query may be used to learn programs, where the prior on programs is represented by another Church program. Issues of programming style then become issues of description length and inductive bias. As another example, query nested within query may be used to represent an agent reasoning about another agent.
Of course, Church's representational flexibility comes at the cost of substantially increased inference complexity. Providing efficient implementations of query is a critical challenge as our current implementation is not yet efficient enough for typical machine learning applications; this may be greatly aided by building on techniques used for inference in other probabilistic languages [e.g. 10, 14, 12]. For example, in Church, exact inference by enumeration could be seen as a program analysis that transforms expressions involving query into expressions involving only eval ; identifying and exploiting opportunities for such transformations seems appealing.
Probabilistic models and stochastic algorithms are finding increasingly widespread use throughout artificial intelligence and cognitive science, central to areas as diverse as vision, planning, and natural language understanding. As their usage grows and becomes more intricate, so does the need for formal languages supporting model exchange, reuse, and machine execution. We hope Church represents a significant step toward this goal.
## Acknowledgements
The authors would like to thank Gerry Sussman, Hal Abelson, Tom Knight, Brian Milch, David McAllester and Alexey Radul for helpful discussions. This work was funded in part by a grant from NTT Communication Sciences Laboratory.
## References
- [1] H. Abelson and G. Sussman. Structure and Interpretation of Computer Programs . MIT Press, 1996.
- [2] M.J. Beal, Z. Ghahramani, and C.E. Rasmussen. The infinite hidden Markov model. NIPS 14 , 2002.
- [3] K. A. Bonawitz. Composable Probabilistic Inference with Blaise . PhD thesis, MIT, 2008.
- [4] A. Church. A Set of Postulates for the Foundation of Logic. The Annals of Mathematics , 33(2):346-366, 1932.
- [5] M. Johnson, T. Griffiths, and S. Goldwater. Adaptor grammars: A framework for specifying compositional nonparametric Bayesian models. NIPS 19 , 2007.
- [6] R. Kelsey, W. Clinger, and J. Rees (eds.). Revised 5 Report on the Algorithmic Language Scheme. HigherOrder and Symbolic Computation , 11(1):7-105, 1998.
- [7] C. Kemp, J.B. Tenenbaum, T.L. Griffiths, T. Yamada, and N. Ueda. Learning systems of concepts with an infinite relational model. Proc. 21st Natl Conf. Artif. Intell., AAAI Press , 2006.
- [8] P. Liang, S. Petrov, M.I. Jordan, and D. Klein. The Infinite PCFG using Hierarchical Dirichlet Processes. Proc. EMNLP-CoNLL , 2007.
- [9] D.J. Lunn, A. Thomas, N. Best, and D. Spiegelhalter. WinBUGS-A Bayesian modelling framework: Concepts, structure, and extensibility. Statistics and Computing , 10(4):325-337, 2000.
- [10] D. McAllester, B. Milch, and N. D. Goodman. Random-world semantics and syntactic independence for expressive languages. Technical Report MIT-CSAIL-TR-2008-025, Massachusetts Institute of Technology, 2008.
- [11] J. McCarthy. A Basis for a Mathematical Theory of Computation. In Computer Programming and Formal Systems , pages 33-70, 1963.
- [12] B. Milch, B. Marthi, S. Russell, D. Sontag, D.L. Ong, and A. Kolobov. BLOG: Probabilistic models with unknown objects. Proc. IJCAI , 2005.
- [13] S. Muggleton. Stochastic logic programs. In L. de Raedt, editor, Advances in Inductive Logic Programming , pages 254-264. IOS Press, 1996.
- [14] A. Pfeffer. IBAL: A probabilistic rational programming language. Proc. IJCAI , 2001.
- [15] J. Pitman. Combinatorial stochastic processes, 2002. Notes for Saint Flour Summer School.
- [16] A. Radul. Report on the probabilistic language scheme. Technical Report MIT-CSAIL-TR-2007-059, Massachusetts Institute of Technology, 2007.
- [17] J.C. Reynolds. Definitional interpreters for higherorder programming. ACM Annual Conference , pages 717-740, 1972.
- [18] M. Richardson and P. Domingos. Markov logic networks. Machine Learning , 62(1):107-136, 2006.
- [19] T. Sato and Y. Kameya. PRISM: A symbolicstatistical modeling language. In International Joint Conference on Artificial Intelligence , 1997.
- [20] J. Sethuraman. A Constructive definition of Dirichlet priors. Statistica Sinica , 4, 1994.
- [21] M. Toussaint, S. Harmeling, and A. Storkey. Probabilistic inference for solving (PO)MDPs. Technical Report EDI-INF-RR-0934, University of Edinburgh, 2006.