2004.03573
Model: nemotron-free
## Neural Analogical Matching
Maxwell Crouse 1 * , Constantine Nakos 1 , Ibrahim Abdelaziz 2 , Kenneth Forbus 1
1 Qualitative Reasoning Group, Northwestern University
2 IBM Research, IBM T.J. Watson Research Center
{ mvcrouse, cnakos } @u.northwestern.edu, ibrahim.abdelaziz1@ibm.com, forbus@northwestern.edu
## Abstract
Analogy is core to human cognition. It allows us to solve problems based on prior experience, it governs the way we conceptualize new information, and it even influences our visual perception. The importance of analogy to humans has made it an active area of research in the broader field of artificial intelligence, resulting in data-efficient models that learn and reason in human-like ways. While cognitive perspectives of analogy and deep learning have generally been studied independently of one another, the integration of the two lines of research is a promising step towards more robust and efficient learning techniques. As part of a growing body of research on such an integration, we introduce the Analogical Matching Network: a neural architecture that learns to produce analogies between structured, symbolic representations that are largely consistent with the principles of Structure-Mapping Theory.
## 1 Introduction
Analogical reasoning is a form of inductive reasoning that cognitive scientists consider to be one of the cornerstones of human intelligence (Gentner 2003; Hofstadter 2001, 1995). Analogy shows up at nearly every level of human cognition, from low-level visual processing (Sagi, Gentner, and Lovett 2012) to abstract conceptual change (Gentner et al. 1997). Problem solving using analogy is common, with past solutions forming the basis for dealing with new problems (Holyoak, Junn, and Billman 1984; Novick 1988). Analogy also facilitates learning and understanding by allowing people to generalize specific situations into increasingly abstract schemas (Gick and Holyoak 1983).
Many different theories have been proposed for how humans perform analogy (Mitchell 1993; Chalmers, French, and Hofstadter 1992; Gentner 1983; Holyoak, Holyoak, and Thagard 1996). One of the most influential theories is StructureMapping Theory (SMT) (Gentner 1983), which posits that analogy involves the alignment of structured representations of objects or situations subject to certain constraints. Key characteristics of SMT are its use of symbolic representations and its emphasis on relational structure, which allow the same principles to apply to a wide variety of domains.
* Correspondence to mvcrouse@u.northwestern.edu , code available at https://github.com/mvcrouse/NeuralAnalogy.
Copyright © 2021, Association for the Advancement of Artificial Intelligence (www.aaai.org). All rights reserved.
Until now, the symbolic, structured nature of SMT has made it a poor fit for deep learning. The representations produced by deep learning techniques are incompatible with offthe-shelf SMT implementations like the Structure-Mapping Engine (SME) (Falkenhainer, Forbus, and Gentner 1989; Forbus et al. 2017), while the symbolic graphs that SMT assumes as input are challenging to encode with traditional neural methods. In this work, we describe how recent advances in graph representation learning can be leveraged to create deep learning systems that can learn to produce structural analogies consistent with SMT.
Contributions: We introduce the Analogical Matching Network (AMN), a neural architecture that learns to produce analogies between symbolic representations. AMN is trained on purely synthetic data and is demonstrated over a diverse set of analogy problems drawn from structure-mapping literature to produce outputs that are largely consistent with SMT. With AMN, we aim to push the boundaries of deep learning and extend them to an important area of human cognition; in particular, by showing how to design a deep learning system that conforms to a cognitive theory of analogical reasoning. It is our hope that future generations of neural architectures can reap the same benefits from analogy that symbolic reasoning systems and humans currently do.
## 2 Related Work
Many different computational models of analogy have been proposed (Mitchell 1993; Holyoak and Thagard 1989; O'Donoghue and Keane 1999; Forbus et al. 2017), each instantiating a different cognitive theory of analogy. The differences between them are compounded by the computational costs of analogical reasoning, a provably NP-Hard problem (Veale and Keane 1997). While these computational models are often used to test cognitive theories of human behavior, they are also useful tools for applied tasks. For instance, the Structure-Mapping Engine (SME) has been used in questionanswering (Ribeiro et al. 2019), computer vision (Chen et al. 2019), and machine reasoning (Klenk et al. 2005).
Many of the early approaches to analogy were connectionist (Gentner and Markman 1993). The STAR architecture of (Halford et al.) used tensor product representations of structured data to perform simple analogies of the form R ( x, y ) ⇒ S ( f ( x ) , f ( y )) . Drama (Eliasmith and Thagard
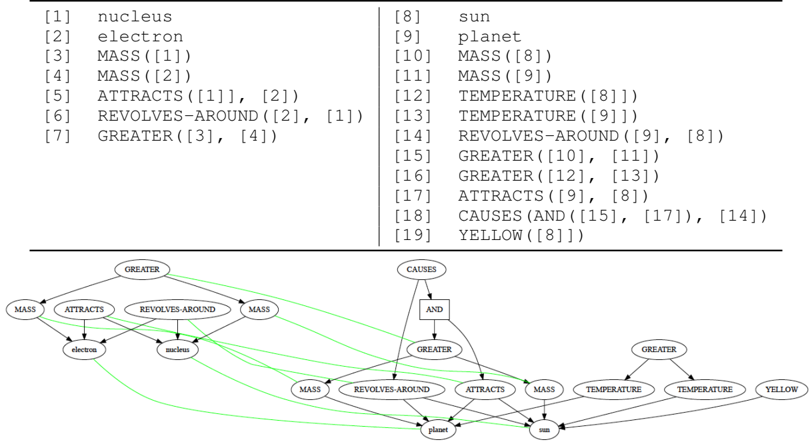
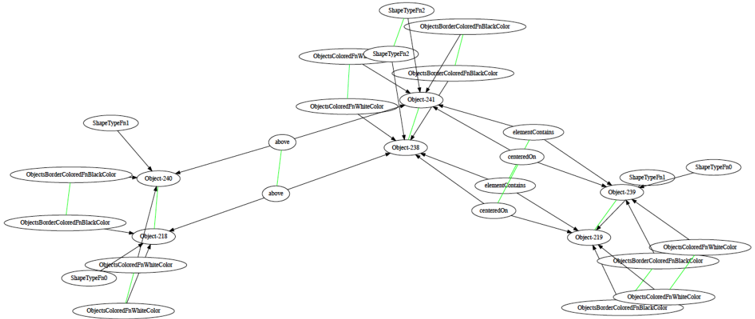
Figure 1: Relational and graph representations for models of the atom (left) and Solar System (right). Light green edges indicate the set of correspondences between the two graphs.
<details>
<summary>Image 1 Details</summary>
### Visual Description
## Flowchart with Logical Statements: Entity Relationships and Properties
### Overview
The image contains two primary components:
1. A **numbered list of logical/relational statements** (1–19) defining properties and interactions between entities.
2. A **directed flowchart** visualizing relationships between entities (e.g., nucleus, electron, sun, planet) via labeled edges (e.g., MASS, ATTRACTS, REVOLVES-AROUND).
---
### Components/Axes
#### List of Statements (Top Section)
- **Format**: `[N] [ENTITY/PROPERTY]` or `[N] [RELATION]([A], [B])`
- **Key Entities**:
- `nucleus` (1), `electron` (2), `sun` (8), `planet` (9)
- **Key Properties/Relations**:
- `MASS([X])` (3, 4, 10, 11), `ATTRACTS([A], [B])` (5, 17), `REVOLVES-AROUND([A], [B])` (6, 14), `GREATER([A], [B])` (7, 15, 16), `TEMPERATURE([X])` (12, 13), `CAUSES(AND([A], [B]), [C])` (18), `YELLOW([X])` (19).
#### Flowchart (Bottom Section)
- **Nodes**:
- `nucleus`, `electron`, `sun`, `planet`, `MASS`, `TEMPERATURE`, `YELLOW`.
- **Edges**:
- Directed arrows labeled with relations (e.g., `MASS`, `ATTRACTS`, `REVOLVES-AROUND`, `GREATER`, `CAUSES`, `YELLOW`).
- **Spatial Layout**:
- **Top-left**: `nucleus` and `electron` connected via `MASS`, `ATTRACTS`, and `REVOLVES-AROUND`.
- **Center**: `sun` and `planet` connected via `MASS`, `TEMPERATURE`, `GREATER`, and `YELLOW`.
- **Bottom**: `CAUSES` edge links `REVOLVES-AROUND` and `ATTRACTS` to `YELLOW`.
---
### Detailed Analysis
#### List of Statements
1. `[1] nucleus`
2. `[2] electron`
3. `[3] MASS([1])`
4. `[4] MASS([2])`
5. `[5] ATTRACTS([1], [2])`
6. `[6] REVOLVES-AROUND([2], [1])`
7. `[7] GREATER([3], [4])`
8. `[8] sun`
9. `[9] planet`
10. `[10] MASS([8])`
11. `[11] MASS([9])`
12. `[12] TEMPERATURE([8])`
13. `[13] TEMPERATURE([9])`
14. `[14] REVOLVES-AROUND([9], [8])`
15. `[15] GREATER([10], [11])`
16. `[16] GREATER([12], [13])`
17. `[17] ATTRACTS([9], [8])`
18. `[18] CAUSES(AND([15], [17]), [14])`
19. `[19] YELLOW([8])`
#### Flowchart Relationships
- **Nucleus-Electron**:
- `MASS` (3, 4), `ATTRACTS` (5), `REVOLVES-AROUND` (6).
- `GREATER` (7) indicates `MASS([1]) > MASS([2])`.
- **Sun-Planet**:
- `MASS` (10, 11), `TEMPERATURE` (12, 13), `REVOLVES-AROUND` (14).
- `GREATER` (15, 16) implies `MASS([8]) > MASS([9])` and `TEMPERATURE([8]) > TEMPERATURE([9])`.
- `ATTRACTS` (17) and `YELLOW` (19) are properties of the `sun`.
- **Causal Chain**:
- `CAUSES` (18) links `GREATER` (15, 16) and `ATTRACTS` (17) to `REVOLVES-AROUND` (14).
---
### Key Observations
1. **Hierarchical Structure**:
- `nucleus` and `electron` form a sub-system with mass and attraction properties.
- `sun` and `planet` form a larger system with mass, temperature, and color (yellow) properties.
2. **Causal Logic**:
- The `CAUSES` edge (18) suggests that the sun’s greater mass and attraction cause the planet to revolve around it.
3. **Color Property**:
- `YELLOW([8])` explicitly assigns the color yellow to the `sun`.
---
### Interpretation
This image models a simplified physical system using logical statements and a flowchart:
- **Entities**: `nucleus`, `electron`, `sun`, and `planet` are defined with properties (mass, temperature) and interactions (attraction, revolution).
- **Relationships**:
- The `nucleus` and `electron` interact via mass and attraction, with the electron revolving around the nucleus.
- The `sun` and `planet` share similar properties but differ in magnitude (greater mass/temperature for the sun).
- The `CAUSES` edge implies that the sun’s properties (mass, attraction) are the root cause of the planet’s orbital motion.
- **Notable Anomaly**:
- The `YELLOW` property is uniquely assigned to the `sun`, suggesting a categorical distinction (e.g., color as a defining trait).
This structure could represent a physics-based ontology or a simplified model of celestial mechanics, where logical rules govern entity behavior.
</details>
2001) was an implementation of the multi-constraint theory of analogy (Holyoak, Holyoak, and Thagard 1996) that used holographic representations similar to tensor products to embed structure. LISA (Hummel and Holyoak 1997, 2005) was a hybrid symbolic connectionist approach to analogy. It staged the mapping process temporally, generating mappings from elements that were activated at the same time.
Cognitive perspectives of analogy have gone relatively unexplored in deep learning research, with only a few recent works that address them (Hill et al. 2019; Zhang et al. 2019; Lu et al. 2019). Most prior deep learning works have considered analogies involving perceptual data (Mikolov, Yih, and Zweig 2013; Reed et al. 2015; Bojanowski et al. 2017; Zhou et al. 2019; Benaim et al. 2020). Such problems differ from those seen in the structure-mapping literature in that they typically do not require explicit graph matching and they involve only one relation which is unobserved.
Our approach is conceptually related to recent work on neural graph matching (Emami and Ranka 2018; Georgiev and Li´ o 2020; Wang, Yan, and Yang 2019). Such works generally focus on finding unconstrained maximum weight matchings and often interleave their networks with hardcoded algorithms (e.g., (Emami and Ranka 2018) applies the Hungarian algorithm to coerce its outputs into a permutation matrix). These considerations make them less applicable here, as 1) SMT is subject to unique constraints that make standard bipartite matching techniques insufficient and 2) we wish to explore the extent to which SMT is purely learnable.
## 3 Structure-Mapping Theory
In Structure-Mapping Theory (SMT) (Gentner 1983), analogy centers around the structural alignment of relational representations (see Figure 1). A relational representation is a set of logical expressions constructed from entities (e.g., sun ), attributes (e.g., YELLOW ), functions (e.g., TEMPERATURE ), and relations (e.g., GREATER ). Structural alignment is the process of producing a mapping between two relational representations (referred to as the base and target ). A mapping is a triple 〈 M,C,S 〉 , where M is a set of correspondences between the base and target, C is a set of candidate inferences (i.e., inferences about the target that can be made from the structure of the base), and S is a structural evaluation score that measures the quality of M . Correspondences are pairs of elements between the base and target (i.e., expressions or entities) that are identified as matching with one another. While entities can be matched together irrespective of their labels, there are more rigorous criteria for matching expressions. SMT asserts that matches should satisfy the following:
1. One-to-One : Each element of the base and target can be a part of at most one correspondence.
2. Parallel Connectivity : Two expressions can be in a correspondence with each other only if their arguments are also in correspondences with each other.
3. Tiered Identicality : Relations of expressions in a correspondence must match identically, but functions need not if their correspondence supports parallel connectivity.
4. Systematicity : Preference should be given to mappings with more deeply nested expressions.
To understand these properties, we use a classic analogy (see Figure 1) from (Gentner 1983; Falkenhainer, Forbus, and Gentner 1989), which draws an analogy between the Solar System and the Rutherford model of the atom. A set of correspondences M between the base (Solar System) and target (Rutherford atom) is a set of pairs of elements from both sets, e.g., { 〈 [1] , [8] 〉 , 〈 [2] , [9] 〉 } . The one-to-one constraint
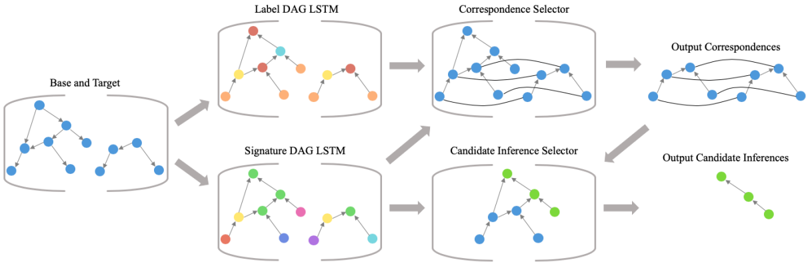
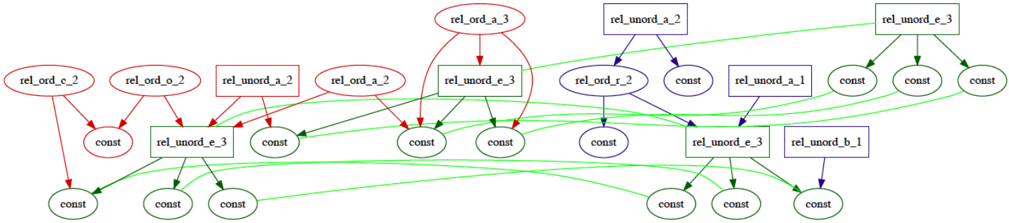
Figure 2: An overview of the model pipeline
<details>
<summary>Image 2 Details</summary>
### Visual Description
## Flowchart: Multi-Stage Data Processing Pipeline
### Overview
The image depicts a technical workflow for processing graph-structured data through a series of machine learning components. It illustrates a pipeline that transforms base and target graphs into structured correspondences and candidate inferences using label and signature DAG LSTMs, followed by selector mechanisms.
### Components/Axes
1. **Base and Target** (Leftmost block)
- Contains two graph structures with blue nodes
- Represents input data structures
2. **Label DAG LSTM** (Top middle block)
- Processes Base/Target into colored nodes (red, yellow, orange)
- Outputs to Correspondence Selector
3. **Signature DAG LSTM** (Bottom middle block)
- Processes Base/Target into colored nodes (green, purple, cyan)
- Outputs to Candidate Inference Selector
4. **Correspondence Selector** (Top right block)
- Takes output from Label DAG LSTM
- Produces Output Correspondences (blue nodes with connecting lines)
5. **Candidate Inference Selector** (Bottom right block)
- Takes output from Signature DAG LSTM
- Produces Output Candidate Inferences (green nodes with connecting lines)
### Flow Direction
- Arrows indicate data flow from left to right
- Base/Target → Label DAG LSTM → Correspondence Selector → Output Correspondences
- Base/Target → Signature DAG LSTM → Candidate Inference Selector → Output Candidate Inferences
### Key Observations
1. **Color Coding**:
- Label DAG LSTM uses warm colors (red/orange/yellow)
- Signature DAG LSTM uses cool colors (green/purple/cyan)
- Output Correspondences use blue nodes
- Output Candidate Inferences use green nodes
2. **Graph Transformation**:
- Input graphs (blue nodes) are transformed into DAG structures through LSTM processing
- Selectors refine these into final output structures with specific node color patterns
3. **Parallel Processing**:
- Two independent processing streams (Label vs Signature) handle different aspects of the input data
- Both streams converge on final output types (correspondences and inferences)
### Interpretation
This diagram represents a graph neural network architecture for relational data analysis. The Base and Target graphs likely represent input relational structures (e.g., social networks, molecular structures). The Label and Signature DAG LSTMs perform different types of graph representation learning:
- Label DAG LSTM focuses on structural correspondence learning (red/yellow/orange nodes)
- Signature DAG LSTM captures graph signatures for inference tasks (green/purple/cyan nodes)
The Correspondence Selector and Candidate Inference Selector act as attention mechanisms, refining the LSTM outputs into final predictions. The color coding suggests different feature spaces or confidence levels in the learned representations. The parallel processing streams indicate a multi-task learning approach where the model simultaneously learns structural correspondences and inference capabilities from the same input data.
The architecture demonstrates how graph neural networks can decompose complex relational data processing into modular components, each specializing in different aspects of the learning task. The final outputs (correspondences and inferences) likely represent different types of predictions or relationships that the model has learned from the input graphs.
</details>
restricts each element to be a member of at most one correspondence. Thus, if 〈 [7] , [15] 〉 was a member of M , then 〈 [7] , [16] 〉 could not be added to M . Parallel connectivity enforces correspondence between arguments if the parents are in correspondence. In this example, if 〈 [7] , [15] 〉 was a member of M , then both 〈 [3] , [10] 〉 and 〈 [4] , [11] 〉 would need to be members of M . Parallel connectivity also respects argument order when dealing with ordered relations. Tiered identicality is not relevant in this example; however, if [10] used the label WEIGHT instead of MASS , tiered identicality could be used to match [3] and [10] , since such a correspondence would allow for a match between their parents. The last property, systematicity, results in larger correspondence sets being preferred over smaller ones. Note that the singleton set { 〈 [1] , [8] 〉 } satisfies SMT's constraints, but it is clearly not useful by itself. Systematicity captures the natural preference for larger, more interesting matches.
Candidate inferences are statements from the base that are projected into the target to fill in missing structure (Bowdle and Gentner 1997; Gentner and Markman 1998). Given a set of correspondences M , candidate inferences are created from statements in the base that are supported by expressions in M but are not part of M themselves. In Figure 1, one candidate inference would be CAUSES(AND([7],[5]),[6]) , derived from [18] by substituting its arguments with the expressions they correspond to in the target. In this work, we adopt SME's default criteria for computing candidate inferences. Valid candidate inferences are all statements that have some dependency that is included in the correspondences or an ancestor that is a candidate inference (e.g., an expression whose parent has arguments in the correspondences).
The concepts above carry over naturally into graphtheoretic notions. The base and target are considered semiordered directed-acyclic graphs (DAGs) G B = 〈 V B , E B 〉 and G T = 〈 V T , E T 〉 , where V B and V T are sets of nodes and E B and E T are sets of edges. Each node corresponds to some expression and has a label given by its relation, function, attribute, or entity name. Structural alignment is the process of finding a maximum weight bipartite matching M ⊆ V B × V T , where M satisfies the pairwise-disjunctive constraints imposed by parallel connectivity. Finding candidate inferences is then determining the subset of nodes from
V B \ { b i : 〈 b i , t j 〉 ∈ M } with support in M .
## 4 Model
## 4.1 Model Components
Given a base G B = 〈 V B , E B 〉 and target G T = 〈 V T , E T 〉 , AMN produces a set of correspondences M ⊆ V B × V T and a set of candidate inferences I ∈ V B \ { b i : 〈 b i , t j 〉 ∈ M } . A key design choice of this work was to avoid using rules or architectures that force particular outputs whenever possible. AMN is not forced to output correspondences that satisfy the constraints of SMT; instead, conformance with SMT is reinforced through performance on training data. Our architecture uses Transformers (Vaswani et al. 2017) and pointer networks (Vinyals, Fortunato, and Jaitly 2015) and takes inspiration from the work of (Kool, Van Hoof, and Welling 2018). A high-level overview is given in Figure 2, which shows how each of the three main components (graph embedding, correspondence selection, and candidate inference selection) interact with one another.
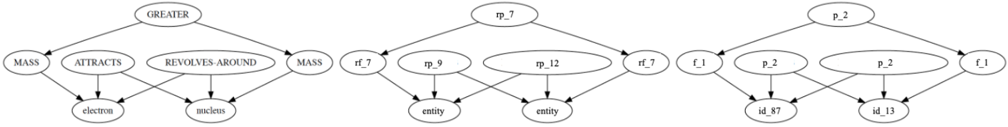
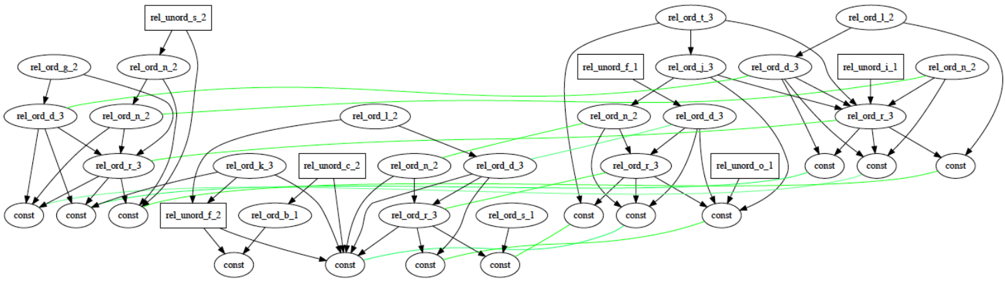
Representing Structure: When embedding the nodes of G B and G T , there are representational concerns to keep in mind. First, as matching should be done on the basis of structure, the labels of entities should not be taken into account during the alignment process. Second, because SMT's constraints require AMN to be able to recognize when a node is part of multiple correspondences, AMN should maintain distinguishable representations for distinct nodes, even if those nodes have the same labels. Last, the architecture should not be vocabulary dependent, i.e., AMN should generalize to symbols it has never seen before. To achieve each of these, AMNfirst parses the original input into two separate graphs, a label graph and a signature graph (see Figure 3).
The label graph will be used to get an estimate of structural similarities. To generate the label graph, AMN substitutes each entity node's label with a generic entity token. This is intentional, as it reflects that entity labels have no inherent utility for producing matchings according to SMT. Then, each function and predicate node is assigned a randomly chosen generic label (from a fixed set of such labels) based off its arity and orderedness. Assignments are made consistently across the entire graph, e.g., every instance of MASS in both
Figure 3: Original graph (left), its label graph (middle), and its signature graph (right)
<details>
<summary>Image 3 Details</summary>
### Visual Description
## Diagram Analysis: Conceptual Relationships and Network Structures
### Overview
The image contains three interconnected diagrams illustrating relationships between entities, physical properties, and networked systems. Each diagram uses nodes (ovals) and directed arrows to represent connections, with labels indicating specific attributes or relationships.
---
### Components/Axes
#### Diagram 1 (Left):
- **Nodes**:
- `MASS` (top-left)
- `ATTRACTS` (center-left)
- `GREATER` (top-center)
- `electron` (bottom-left)
- `nucleus` (bottom-center)
- **Arrows**:
- `MASS` → `ATTRACTS` (bidirectional)
- `MASS` → `GREATER` (unidirectional)
- `ATTRACTS` → `electron` and `nucleus` (bidirectional)
- `GREATER` → `nucleus` (unidirectional)
#### Diagram 2 (Center):
- **Nodes**:
- `rp_7` (top-center)
- `p_7` (center-left)
- `p_12` (center-right)
- `entity` (bottom-center)
- `rf_7` (bottom-left)
- **Arrows**:
- `rp_7` → `p_7` and `p_12` (bidirectional)
- `p_7` and `p_12` → `entity` (bidirectional)
- `rf_7` → `entity` (unidirectional)
#### Diagram 3 (Right):
- **Nodes**:
- `p_2` (top-center)
- `f_1` (center-left)
- `id_87` (bottom-left)
- `id_13` (bottom-right)
- **Arrows**:
- `p_2` → `p_2` (self-loop, bidirectional)
- `p_2` → `id_87` and `id_13` (bidirectional)
- `f_1` → `id_87` and `id_13` (bidirectional)
---
### Detailed Analysis
#### Diagram 1: Physical Relationships
- **Key Labels**:
- `MASS` is central, governing `ATTRACTS` and `GREATER`.
- `ATTRACTS` connects to both `electron` and `nucleus`, suggesting mutual influence.
- `GREATER` explicitly links `MASS` to `nucleus`, implying a hierarchical relationship.
- **Flow**:
- Mass influences attraction and magnitude, with the nucleus being the focal point of both.
#### Diagram 2: Networked Entities
- **Key Labels**:
- `rp_7` and `rf_7` act as intermediaries between parameters (`p_7`, `p_12`) and `entity`.
- `p_7` and `p_12` are parameters influencing `entity`, while `rf_7` directly modifies it.
- **Flow**:
- Parameters (`p_7`, `p_12`) and reference (`rf_7`) converge on `entity`, indicating a multi-input system.
#### Diagram 3: Parameter-Driven IDs
- **Key Labels**:
- `p_2` governs itself (self-loop) and distributes influence to `id_87` and `id_13`.
- `f_1` independently affects both IDs, suggesting parallel pathways.
- **Flow**:
- `p_2` and `f_1` jointly determine the state of `id_87` and `id_13`.
---
### Key Observations
1. **Hierarchical Influence**: In Diagram 1, `MASS` is the root node, with `nucleus` as the primary dependent.
2. **Bidirectional Relationships**: Most connections (e.g., `ATTRACTS`, `p_7`/`p_12` → `entity`) imply mutual dependency.
3. **Self-Regulation**: `p_2`’s self-loop suggests autoregulation in Diagram 3.
4. **Convergence Points**: `entity` (Diagram 2) and `id_87`/`id_13` (Diagram 3) act as sinks for multiple inputs.
---
### Interpretation
These diagrams likely represent:
1. **Physical Systems**: Diagram 1 models atomic/molecular interactions (mass, attraction, nucleus dominance).
2. **Data/Process Networks**: Diagrams 2 and 3 resemble system architectures, where parameters (`p_7`, `p_12`, `p_2`) and functions (`f_1`) govern entity states.
3. **Interconnectedness**: Bidirectional arrows emphasize feedback loops, critical in dynamic systems (e.g., physics, engineering, or data science).
**Notable Patterns**:
- **Centralization**: `MASS` (Diagram 1) and `p_2` (Diagram 3) dominate their respective systems.
- **Modularity**: Separate diagrams suggest modular components (e.g., physical laws vs. computational processes).
**Underlying Logic**:
- The diagrams abstractly map cause-effect relationships, with labels like `rp_7`/`rf_7` hinting at computational or symbolic representations (e.g., "reference parameter 7").
- The use of `id_87`/`id_13` implies unique identifiers, possibly in a database or algorithmic context.
---
### Conclusion
The diagrams collectively illustrate how foundational properties (`MASS`, `p_2`) influence downstream entities through direct and indirect pathways. Their structure aligns with principles of systems theory, emphasizing interdependence and feedback.
</details>
the base and target would be assigned the same generic replacement label. This substitution means the original label is not used in the matching process, which allows AMN to generalize to new symbols.
The label graph is not sufficient to produce representations that can be used for matching, as it represents a node by only label-based features which are shared amongst different nodes, an issue known as the type-token distinction (Kahneman, Treisman, and Gibbs 1992; Wetzel 2006). To contend with this, a signature graph is constructed that represents nodes in a way that respects object identity. To construct the signature graph, AMN replaces each distinct entity with a unique identifier (drawn from a fixed set of possible identifiers). It then assigns each function and predicate a new label based solely on its arity and orderedness, ignoring the original symbol. For instance, ATTRACTS and REVOLVES-AROUND would be assigned the same label as they are both ordered binary predicates.
As all input graphs will be DAGs, AMN uses two separate DAG LSTMs (Crouse et al. 2019) to embed the nodes of the label and signature graphs (equations detailed in Appendix 7.4). Each node embedding is computed as a function of its complete set of dependencies in the original graph. The set of label structure embeddings is written as L V = { l v : v ∈ V } and the set of signature embeddings is written as S V = { s v : v ∈ V } . Before passing these embeddings to the next step, each element of S V is scaled to unit length, i.e. each s v becomes s v / ‖ s v ‖ , which gives our network an efficiently checkable criterion for whether or not two nodes are likely to be equal, i.e., when the dot product of two signature embeddings is 1.
Correspondence Selector: The graph embedding procedure yields two sets of node embeddings (label structure and signature embeddings) for the base and target. We utilize the set of embedding pairs for each node of V B and V T , writing l v to denote the label structure embedding of node v from L V and s v the signature embedding of node v from S V . We first define the set of unprocessed correspondences C (0)
<!-- formula-not-decoded -->
<!-- formula-not-decoded -->
where [ · ; · ] denotes vector concatenation, is the tiered identicality threshold that governs how much the subgraphs rooted at two nodes may differ and still be considered for correspondence (in this work, we set = 1e -5 ). The first element of each correspondence in C (0) , i.e., h c = [ l b ; l t ; s b ; s t ] , is then passed through an N -layered Transformer encoder (equations detailed in Appendix 7.4) to produce a set of encoded
<!-- formula-not-decoded -->
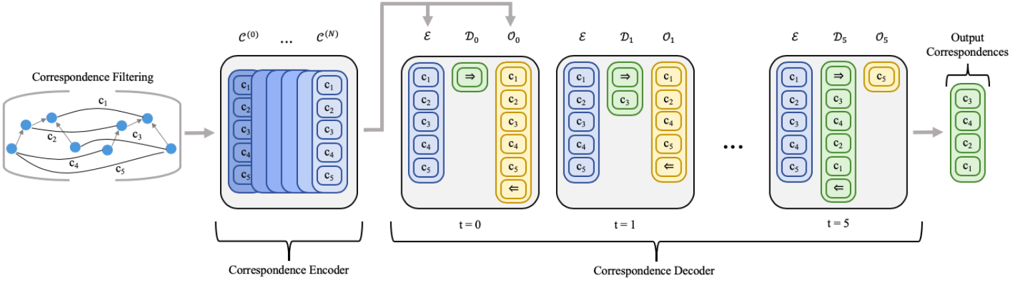
The Transformer decoder selects a subset of correspondences that constitutes the best analogical match (see Figure 4). The attention-based transformations are only performed on the initial element of each tuple, i.e., h d in 〈 h d , s b , s t 〉 . We let D t be the processed set of all selected correspondences at timestep t (after the N attention layers) and O t be the set of all remaining correspondences (with D 0 = { START-TOK } and O 0 = E ∪ { END-TOK } ). The decoder generates compatibility scores α od between each pair of elements, i.e., 〈 o, d 〉 ∈ O t ×D t . These are combined with the signature embedding similarities to produce a final compatibility π od
<!-- formula-not-decoded -->
where FFN is a two layer feed-forward network with ELU activations (Clevert, Unterthiner, and Hochreiter 2015). Recall that the signature components, i.e. s b and s t , were scaled to unit length. Thus, we would expect closeness in the original graph to be reflected by dot-product similarity and identicality to be indicated by a maximum value dot-product, i.e. s b o s b d = 1 or s t o s t d = 1 . Once each pair has been scored, AMNselects an element of O t to be added to D t +1 . For each o ∈ O t , we compute its value to be
<!-- formula-not-decoded -->
where FFN is a two layer feed-forward network with ELU activations. A softmax is applied to these scores and the highest valued element is added to D t +1 . The use of maximum, minimum, and average is intended to let the network capture both individual and aggregate evidence. Individual evidence is given by a pairwise interaction between two correspondences (e.g., two correspondences that together violate the one-toone constraint). Conversely, aggregate evidence is given by the interaction of a correspondence with everything selected thus far (e.g., a correspondence needed for several parallel connectivity constraints). When END-TOK is selected, the set of correspondences M returned is the set of node pairs from V B and V T associated with elements in D .
Candidate Inference Selector: The output of the correspondence selector is a set of correspondences M . The candidate inferences associated with M are drawn from the nodes of the base graph V B that were not used in M . Let V in and V out be the subsets of V B that were / were not used in M , respectively. We first extract all signature embeddings for both sets, i.e., S in = { s b : b ∈ V in } and S out = { s b : b ∈ V out } . In this module there are no Transformer components, with AMNoperating directly on S in and S out .
Figure 4: The correspondence selection process, where ⇒ and ⇐ are the start and stop tokens and E , D t , and O t are the sets of encoded, selected, and remaining correspondences
<details>
<summary>Image 4 Details</summary>
### Visual Description
## Flowchart: Neural Correspondence Processing Pipeline
### Overview
The diagram illustrates a neural network architecture for processing correspondences through three stages: filtering, encoding, and decoding. The pipeline includes temporal dynamics in the decoding phase and concludes with refined output correspondences.
### Components/Axes
1. **Correspondence Filtering**
- Input nodes: c₁, c₂, c₃, c₄, c₅
- Arrows represent correspondence relationships (labeled c₁–c₅)
- Output: Filtered correspondence set
2. **Correspondence Encoder**
- Input: Filtered correspondences
- Structure: 5xN matrix (rows: c₁–c₅, columns: C⁰–Cᴺ)
- Output: Encoded feature vectors
3. **Correspondence Decoder**
- Temporal dimension: t=0 to t=5
- Components per timestep:
- **Encoder (E)**: Blue blocks (c₁–c₅)
- **Decoder (Dₜ)**: Yellow blocks (c₁–c₅)
- **Output (Oₜ)**: Green blocks (c₁–c₅)
- Arrows between components:
- Green arrows with "⇒" (forward) and "⇐" (backward) symbols
- Final output: Refined correspondence set
4. **Output Correspondences**
- Final nodes: c₃, c₄, c₂, c₁ (reordered subset)
- Color: Green
### Detailed Analysis
- **Encoder**: Processes filtered correspondences into a latent space (C⁰–Cᴺ) with 5-dimensional features per correspondence.
- **Decoder Dynamics**:
- t=0: Initial encoding (blue) → Initial decoding (yellow)
- t=1–5: Iterative refinement with bidirectional interactions (green arrows)
- Each timestep shows progressive reordering of correspondence relationships
- **Output**: Final correspondence set shows permutation of original nodes (c₃→c₄→c₂→c₁)
### Key Observations
1. Temporal evolution in decoding phase shows progressive reordering of correspondences
2. Bidirectional arrows (⇒/⇐) suggest attention mechanisms or message passing
3. Output correspondence order differs from input (c₁→c₅ → c₃→c₄→c₂→c₁)
4. Color coding distinguishes input (blue), processing (yellow), and output (green)
### Interpretation
This architecture demonstrates a temporal neural network for correspondence refinement:
1. **Filtering Stage**: Initial relationship pruning/selection
2. **Encoding**: Dimensionality reduction into latent space
3. **Temporal Decoding**: Iterative refinement through bidirectional interactions
4. **Output**: Optimized correspondence set with reordered relationships
The green arrows' bidirectional nature implies the model learns both forward and inverse mappings between correspondences. The final output's reordered nodes suggest the network prioritizes certain relationships based on learned features. The temporal dimension (t=0–5) indicates multi-step processing for context-aware correspondence optimization.
</details>
AMNwill select elements from S out to return. Like before, we let D t be the set of all selected elements from S out and O t be the set of all remaining elements from S out at timestep t . AMNcomputes compatibility scores between pairs of output options with candidate inference and previously selected nodes, i.e. α od for each 〈 o, d 〉 ∈ O t × ( D t ∪S in ) . The compatibility scores are given by a simple single-headed attention computation (see Appendix 7.4). Unlike the correspondence encoder-decoder, there are no other values to combine these scores with, so they are used directly to compute a value v o for each element of O t . AMNcomputes this value as
<!-- formula-not-decoded -->
A softmax is used and the highest valued element is added to D t +1 . Once the end token is selected, decoding stops and the set of nodes associated with elements in D is returned.
Loss Function: As both the correspondence and candidate inference components use a softmax, the loss function is categorical cross entropy. Teacher forcing is used to guide the decoder to select the correct choices during training. With L corr the loss for correspondence selection and L ci the loss for candidate inference selection, the final loss is given as L = L corr + λ L ci (with λ a hyperparameter), which is minimized with Adam (Kingma and Ba 2014).
## 4.2 Model Scoring
Structural Match Scoring: In order to avoid counting erroneous correspondence predictions towards the score of the output correspondences M , we first identify all correspondences that are either degenerate or violate the constraints of SMT. Degenerate correspondences are correspondences between constants that have no higher-order structural support in M (i.e., if either has no parent that participates in a correspondence in M ). To determine if a correspondence 〈 b, t 〉 violates SMT, we check whether the subgraphs of the base and target rooted at b and t satisfy the one-to-one matching, parallel connectivity, and tiered identicality constraints (see Section 3). The check can be computed in time linear with the size of the corresponding subgraphs. Let the valid subset of M be M val . A correspondence m is considered a root correspondence if there does not exist another correspondence m ′ such that m ′ ∈ M val and a node in m ′ is an ancestor of a node in m . We define M root ⊆ M val to be the set of all such root correspondences. For a correspondence m = 〈 b, t 〉 in M val , its score s ( m ) is given as the size of the subgraph rooted at b in the base. The structural match score for M is then sum of scores for all correspondences in M root , i.e., s ( M ) = ∑ m ∈ M root s ( m ) . This repeatedly counts nodes that appear in the dependencies of multiple correspondences, which leads to higher scores for more interconnected matchings (in keeping with the systematicity preference of SMT).
Structural Evaluation Maximization: Dynamically assigning labels to each example allows AMN to handle neverbefore-seen symbols, but its inherent randomness can lead to significant variability in terms of outputs. AMN combats this by running each test problem r times and returning the mapping M = arg max M i ∑ j J ( M i , M j ) , where J ( M i , M j ) is the Jaccard index (intersection over union) between the correspondence sets produced by the i -th and j -th runs. Intuitively, this is the run that shared the most correspondences with other runs and had the fewest unshared extra correspondences.
## 5 Experiments
## 5.1 Data Generation and Training
AMN was trained on 100,000 synthetic analogy examples, with the hyperparameters used for AMN provided in Appendix 7.1 (in the supplementary material). A single example consisted of base and target graphs, a set of correspondences, and a set of nodes from the base to be candidate inferences. Construction of synthetic examples begins with generating DAGs. Each DAG consists of a set of k ∈ [2 , 7] layers (with the particular k for a graph chosen at random). Each node is assigned an arity a , with the maximum arity being a = 3 . Nodes at layer i can be connected to a nodes from lower layers (i.e., layer j with j < i ) selected at random. Nodes with arity a = 0 are considered entities and nodes with non-zero
Figure 5: AMN output correspondences for an example from the Geometric Analogies domain
<details>
<summary>Image 5 Details</summary>
### Visual Description
## Network Diagram: Object Relationship Hierarchy
### Overview
The image depicts a hierarchical network diagram illustrating relationships between multiple objects (labeled Object-218 to Object-241). Nodes represent objects with attributes (shape type, color, border color), while edges indicate spatial ("above") and containment ("elementContains") relationships. The diagram uses black text on white background with green-highlighted edges for emphasis.
### Components/Axes
- **Nodes**:
- Labeled with Object IDs (e.g., Object-218, Object-238)
- Attributes include:
- ShapeTypeFn0/Fn1/Fn2
- ObjectBorderColorFnBlackColor
- ObjectColoredFnWhiteColor
- **Edges**:
- Directed arrows indicating relationships
- Labels: "above", "elementContains"
- **Color Coding**:
- Green edges highlight specific connections (e.g., Object-241→Object-238, Object-239→Object-238)
- No explicit legend present; color usage inferred from context
### Detailed Analysis
1. **Central Node (Object-241)**:
- Connected to Object-238 (via "elementContains")
- Connected to Object-239 (via "elementContains")
- Attributes: ShapeTypeFn2, ObjectBorderColorFnBlackColor
2. **Vertical Alignment**:
- Object-240 → Object-238 ("above")
- Object-239 → Object-238 ("above")
3. **Containment Hierarchy**:
- Object-241 contains Object-238 and Object-239
- Object-238 contains Object-240
- Object-239 contains Object-219
4. **Attribute Patterns**:
- 60% of nodes use "WhiteColor" for ObjectColoredFn
- 40% use "BlackColor" for ObjectBorderColor
- ShapeTypeFn0 appears in 3 nodes (Object-218, Object-239, Object-240)
### Key Observations
- **Spatial Organization**: Objects form a vertical chain with Object-238 as the lowest node
- **Attribute Consistency**: Black border color dominates (5/8 nodes), white fill color dominates (5/8 nodes)
- **Complex Relationships**: Single node (Object-241) has dual containment relationships
- **Edge Emphasis**: Green-highlighted edges suggest priority connections in the hierarchy
### Interpretation
This diagram likely represents a spatial data structure modeling:
1. **Object Containment**: Parent-child relationships through "elementContains" edges
2. **Positional Awareness**: "above" edges indicate z-axis or layer ordering
3. **Attribute Inheritance**: Shared color/shape properties suggest template-based object creation
The green-highlighted edges (3 instances) may indicate:
- Primary containment paths
- Critical spatial relationships
- System-defined hierarchy anchors
Notable anomalies include:
- Object-238 having both "above" and "elementContains" relationships
- Object-219 being the only node without direct containment relationships
- ShapeTypeFn2 appearing exclusively at the root node (Object-241)
The structure suggests a recursive data model where objects can contain other objects while maintaining spatial positioning, potentially for:
- UI component nesting
- 3D object arrangement
- Hierarchical data visualization
</details>
arities (i.e., a > 0 ) are randomly assigned as predicates or functions and randomly designated as ordered or unordered.
To generate a training example, we first generate a set of random DAGs C , which will later become the correspondences. Next, we construct the base B by generating graphs above C . As each DAG is constructed in layers, this simply means that C is considered the lowest layers of B . Likewise, for the target T we build another set of graphs above C . The nodes of C are thus shared with both B and T . Each node of C is duplicated, producing one node for B and one node for T , and the resulting pair of nodes becomes a correspondence. Any element in B that was an ancestor of a node from C or a descendent of such an ancestor was considered a candidate inference. In Appendix 7.2 we provide a figure showing each component of a training example. During training, each generated example was turned into a batch of 8 inputs by repeatedly running the encoding procedure (which dynamically assigns node labels) over the original base and target.
## 5.2 Experimental Domains
Though training was done with synthetic data, we evaluated the effectiveness of AMN on both synthetic data and data used in previous analogy experiments. The corpus of previous analogy examples was taken from the public release of SME 1 . Importantly, AMN was not trained on the corpus of existing analogy examples (AMN never learned from a real-world analogy example). In fact, there was no overlap between the symbols (i.e., entities, functions, and predicates) used in that corpus and the symbols used for the synthetic data. We briefly describe each of the domains AMN was evaluated on below (detailed descriptions can be found in (Forbus et al. 2017)).
1. Synthetic : this domain consisted of 1000 examples generated with the same parameters as the training data (useful as a sanity check for AMN's performance).
2. Visual Oddity : this problem setting was initially proposed to explore cultural differences to geometric reasoning in (Dehaene et al. 2006). The work of (Lovett and Forbus 2011) modeled the findings of the original experiment
1 http://www.qrg.northwestern.edu/software/sme4/index.html
- computationally with qualitative visual representations and analogy. We extracted 3405 analogical comparisons from the computational experiment.
3. Moral Decision Making : this domain was taken from (Dehghani et al. 2008a), which introduced a computational model of moral decision making that used SME to reason through moral dilemmas. From the works of (Dehghani et al. 2008a,b), we extracted 420 analogical comparisons.
4. Geometric Analogies : this domain is from one of the first computational analogy experiments (Evans 1964). Each problem was an incomplete analogy of the form A : B :: C : ? , where each of A , B , and C were manually encoded geometric figures and the goal was to select the figure that best completed the analogy from an encoded set of possible answers. While in the original work all figures had to be manually encoded, in (Lovett et al. 2009; Lovett and Forbus 2012) it was shown that the analogy problems could be solved with structure-mapping over automatic encodings (produced by the CogSketch system (Forbus et al. 2011)). From that work we extracted 866 analogies.
## 5.3 Results and Discussion
Table 1a shows the results for AMN across different values of r , where r denotes the re-run hyperparameter detailed in Section 4.2. When evaluating on the synthetic data, the comparison set of correspondences was given by the data generator; whereas when evaluating on the three other analogy domains, the comparison set of correspondences was given by the output of SME. It is important to note that we are using SME as our stand-in for SMT (as it is the most widely accepted computational model of SMT). Thus, we do not want significantly different results from SME in the correspondence selection experiments (e.g., substantially higher or lower structural evaluation scores). Matching SME's performance (i.e., not producing higher or lower values) gives evidence that we are modeling SMT.
In the Struct. Perf. column, the numbers reflect the average across examples of the structural evaluation score of AMN divided by that of the comparison correspondence sets. For the other columns of Table 1a, the numbers represent average
(a) AMN correspondence prediction results for performance ratio (left), solution type rate (middle, ↑ better), and error rate (right, ↓ better)
| Domain | r | Struct. Perf. | Larger | Equiv. | Err. Free | 1-to-1 Err. | PC Err. | Degen. Err. |
|-----------|-----|-----------------|----------|----------|-------------|---------------|-----------|---------------|
| Synthetic | 1 | 0.713 | 0 | 0.313 | 0.346 | 0.007 | 0.102 | 0.02 |
| Synthetic | 16 | 0.952 | 0.001 | 0.683 | 0.695 | 0.005 | 0.02 | 0.011 |
| Oddity | 1 | 0.774 | 0.061 | 0.404 | 0.484 | 0.153 | 0.225 | 0 |
| Oddity | 16 | 0.955 | 0.074 | 0.485 | 0.564 | 0.131 | 0.139 | 0 |
| MoralDM | 1 | 0.61 | 0.014 | 0.021 | 0.093 | 0.002 | 0.17 | 0.03 |
| MoralDM | 16 | 0.958 | 0.081 | 0.164 | 0.329 | 0 | 0.041 | 0.016 |
| Geometric | 1 | 0.871 | 0.064 | 0.533 | 0.649 | 0.039 | 0.116 | 0 |
| Geometric | 16 | 1.04 | 0.069 | 0.714 | 0.788 | 0.029 | 0.043 | 0 |
(b) AMN candidate inference prediction results
| Domain | r | Avg. CI F1 | Avg. CI Prec. | Avg. CI Rec. | Avg. CI Acc. | Avg. CI Spec. |
|-----------|-----|--------------|-----------------|----------------|----------------|-----------------|
| Synthetic | 16 | 0.9 | 0.867 | 0.967 | 0.861 | 0.735 |
| Oddity | 16 | 0.992 | 0.995 | 0.994 | 0.991 | 0.911 |
| MoralDM | 16 | 0.899 | 0.834 | 0.985 | 0.832 | 0.439 |
| Geometric | 16 | 0.958 | 0.955 | 0.99 | 0.951 | 0.917 |
Table 1: AMN experimental results
fractions of examples or correspondences (e.g., 0.684 should be interpreted as 68.4%). Candidate inference prediction performance was measured relative to the set of correspondences AMNgenerated, i.e., all candidate inferences were computed from the predicted correspondences, and treated as the true positives. In many problems from the non-synthetic domains, every non-correspondence node was a candidate inference (which can lead to inflated precision and recall values). Thus, we also report the specificity (i.e., true negative rate) of AMN for only problems with non-candidate inference nodes.
the same / larger structural evaluation score as compared to gold set of correspondences. The Equiv. column provides the best indication that AMN could model SMT. It shows that 50% of AMN's outputs were SMT-satisfying, error-free analogical matches with the exact same structural score as SME (the lead computational model of SMT) in two of the non-synthetic analogy domains.
In addition to our main results, we also provide qualitative examples of AMN's outputs on real analogy problems and ablation studies for various aspects of AMN's design. Both the matching shown in Figure 5 as well as the solar system analogy shown in Figure 1 were produced by AMN. Further examples of AMN's outputs can be found in Appendix 7.5. Ablation experiments regarding the impact of both the signature graph and unit normalization of signature embeddings (each detailed in Section 4.1) are given in Appendix 7.3.
Analysis: The left side of Table 1a shows the average ratio of AMN's performance (labeled Struct. Perf.), as measured by structural evaluation score, against the comparison method's performance (i.e., data generator correspondences or SME). As can be seen, AMN produced matches with structural evaluation scores at 95-104% the level of SME on the non-synthetic domains, which indicates that it was finding similar structural matches. This is ideal as it shows that AMN matches SME's systematicity preference, and thus likely conforms fairly well to SMT in terms of systematicity.
The middle of Table 1a gives us the best sense of how well AMN modeled SMT. We observe AMN's performance in terms of the proportion of larger , equivalent , and error-free matches it produces (labeled Larger, Equiv., and Err. Free, respectively). Error-free matches do not contain degenerate correspondences or SMT constraint violations, whereas equivalent and larger matches are both error-free and have
The right side of Table 1a shows the frequency of the different types of errors, including violations of the one-to-one / parallel connectivity constraints, and degenerate correspondences (labeled 1-to-1 Err., PC Err., and Degen. Err.). It shows that AMN had fairly low error rates across domains (except for Visual Oddity). Importantly, degenerate correspondences were very infrequent, which is significant because it verifies that AMN leveraged higher-order relational structure.
Table 1b shows that AMN was fairly effective in predicting candidate inferences. The high accuracy (labeled Avg. CI Acc.) scores for both the Visual Oddity and Geometric Analogies domains indicate that AMN was able to capture the notion of structural support when determining candidate inferences. The non-zero specificity (labeled Avg. CI Spec.) results show that, while it more often classified nodes as candidate inferences, it was capable of distinguishing noncandidate inference nodes as well.
## 6 Conclusions
In this paper, we introduced the Analogical Matching Network, a neural approach that learned to produce analogies consistent with Structure-Mapping Theory. AMN was trained on completely synthetic data and was capable of performing well on a varied set of analogies drawn from previous work involving analogical reasoning. AMN demonstrated renaming invariance, structural sensitivity, and the ability to find solutions in a combinatorial search space, all of which are key properties of symbolic reasoners and are known to be important to human reasoning.
Ba, J. L.; Kiros, J. R.; and Hinton, G. E. 2016. Layer normalization. arXiv preprint arXiv:1607.06450 .
Benaim, S.; Mokady, R.; Bermano, A.; Cohen-Or, D.; and Wolf, L. 2020. Structural-analogy from a Single Image Pair. arXiv preprint arXiv:2004.02222 .
Bojanowski, P.; Grave, E.; Joulin, A.; and Mikolov, T. 2017. Enriching word vectors with subword information. Transactions of the Association for Computational Linguistics 5: 135-146.
Bowdle, B. F.; and Gentner, D. 1997. Informativity and asymmetry in comparisons. Cognitive Psychology 34(3): 244-286.
Chalmers, D. J.; French, R. M.; and Hofstadter, D. R. 1992. High-level perception, representation, and analogy: A critique of artificial intelligence methodology. Journal of Experimental & Theoretical Artificial Intelligence 4(3): 185-211.
Chen, K.; Rabkina, I.; McLure, M. D.; and Forbus, K. D. 2019. Human-Like Sketch Object Recognition via Analogical Learning. In Proceedings of the AAAI Conference on Artificial Intelligence , volume 33, 1336-1343.
Clevert, D.-A.; Unterthiner, T.; and Hochreiter, S. 2015. Fast and accurate deep network learning by exponential linear units (elus). arXiv preprint arXiv:1511.07289 .
Crouse, M.; Abdelaziz, I.; Cornelio, C.; Thost, V.; Wu, L.; Forbus, K.; and Fokoue, A. 2019. Improving Graph Neural Network Representations of Logical Formulae with Subgraph Pooling. arXiv preprint arXiv:1911.06904 .
Dehaene, S.; Izard, V.; Pica, P.; and Spelke, E. 2006. Core knowledge of geometry in an Amazonian indigene group. Science 311(5759): 381-384.
Dehghani, M.; Tomai, E.; Forbus, K.; Iliev, R.; and Klenk, M. 2008a. MoralDM: A Computational Modal of Moral Decision-Making. In Proceedings of the Annual Meeting of the Cognitive Science Society .
Dehghani, M.; Tomai, E.; Forbus, K. D.; and Klenk, M. 2008b. An Integrated Reasoning Approach to Moral Decision-Making. In AAAI , 1280-1286.
Eliasmith, C.; and Thagard, P. 2001. Integrating structure and meaning: A distributed model of analogical mapping. Cognitive Science 25(2): 245-286.
Emami, P.; and Ranka, S. 2018. Learning permutations with sinkhorn policy gradient. arXiv preprint arXiv:1805.07010 .
Evans, T. G. 1964. A program for the solution of a class of geometric-analogy intelligence-test questions. Technical report, AIR FORCE CAMBRIDGE RESEARCH LABS LG HANSCOM FIELD MASS.
Falkenhainer, B.; Forbus, K. D.; and Gentner, D. 1989. The structure-mapping engine: Algorithm and examples. Artificial Intelligence 41(1): 1-63.
Forbus, K.; Usher, J.; Lovett, A.; Lockwood, K.; and Wetzel, J. 2011. CogSketch: Sketch understanding for cognitive science research and for education. Topics in Cognitive Science 3(4): 648-666.
Forbus, K. D.; Ferguson, R. W.; Lovett, A.; and Gentner, D. 2017. Extending SME to handle large-scale cognitive modeling. Cognitive Science 41(5): 1152-1201.
Gentner, D. 1983. Structure-mapping: A theoretical framework for analogy. Cognitive Science 7(2): 155-170.
Gentner, D. 2003. Why we're so smart. Language in mind: Advances in the study of language and thought 195235.
Gentner, D.; Brem, S.; Ferguson, R. W.; Markman, A. B.; Levidow, B. B.; Wolff, P.; and Forbus, K. D. 1997. Analogical reasoning and conceptual change: A case study of Johannes Kepler. The Journal of the Learning Sciences 6(1): 3-40.
Gentner, D.; and Markman, A. B. 1993. Analogy-Watershed or Waterloo? Structural alignment and the development of connectionist models of analogy. In Advances in Neural Information Processing Systems , 855-862.
Gentner, D.; and Markman, A. B. 1998. Analogy-based reasoning. In The handbook of brain theory and neural networks , 91-93. MIT Press.
Georgiev, D.; and Li´ o, P. 2020. Neural Bipartite Matching. arXiv preprint arXiv:2005.11304 .
Gick, M. L.; and Holyoak, K. J. 1983. Schema induction and analogical transfer .
Halford, G. S.; Wilson, W. H.; Guo, J.; Gayler, R. W.; Wiles, J.; and Stewart, J. ???? Connectionist implications for processing capacity limitations in analogies .
Hill, F.; Santoro, A.; Barrett, D. G.; Morcos, A. S.; and Lillicrap, T. 2019. Learning to make analogies by contrasting abstract relational structure. International Conference on Learning Representations .
Hofstadter, D. 1995. Fluid concepts and creative analogies: Computer models of the fundamental mechanisms of thought. Basic books.
Hofstadter, D. R. 2001. Analogy as the core of cognition. The Analogical Mind: Perspectives from Cognitive Science 499-538.
Holyoak, K. J.; Holyoak, K. J.; and Thagard, P. 1996. Mental leaps: Analogy in creative thought .
Holyoak, K. J.; Junn, E. N.; and Billman, D. O. 1984. Development of analogical problem-solving skill. Child Development 2042-2055.
Holyoak, K. J.; and Thagard, P. 1989. Analogical mapping by constraint satisfaction. Cognitive Science 13(3): 295-355.
Hummel, J. E.; and Holyoak, K. J. 1997. Distributed representations of structure: A theory of analogical access and mapping. Psychological Review 104(3): 427.
Hummel, J. E.; and Holyoak, K. J. 2005. Relational reasoning in a neurally plausible cognitive architecture: An overview of the LISA project. Current Directions in Psychological Science 14(3): 153-157.
Kahneman, D.; Treisman, A.; and Gibbs, B. J. 1992. The reviewing of object files: Object-specific integration of information. Cognitive Psychology 24(2): 175-219.
Kingma, D. P.; and Ba, J. 2014. Adam: A method for stochastic optimization. arXiv preprint arXiv:1412.6980 .
Klenk, M.; Forbus, K. D.; Tomai, E.; Kim, H.; and Kyckelhahn, B. 2005. Solving everyday physical reasoning problems by analogy using sketches. In AAAI Conference on Artificial Intelligence .
Kool, W.; Van Hoof, H.; and Welling, M. 2018. Attention, learn to solve routing problems! arXiv preprint arXiv:1803.08475 .
Lovett, A.; and Forbus, K. 2011. Cultural commonalities and differences in spatial problem-solving: A computational analysis. Cognition 121(2): 281-287.
Lovett, A.; and Forbus, K. 2012. Modeling multiple strategies for solving geometric analogy problems. In Proceedings of the Annual Meeting of the Cognitive Science Society , volume 34.
Lovett, A.; Tomai, E.; Forbus, K.; and Usher, J. 2009. Solving geometric analogy problems through two-stage analogical mapping. Cognitive Science 33(7): 1192-1231.
Lu, H.; Liu, Q.; Ichien, N.; Yuille, A. L.; and Holyoak, K. J. 2019. Seeing the Meaning: Vision Meets Semantics in Solving Pictorial Analogy Problems. In CogSci , 2201-2207.
Mikolov, T.; Yih, W.-t.; and Zweig, G. 2013. Linguistic regularities in continuous space word representations. In Proceedings of the 2013 conference of the north american chapter of the association for computational linguistics: Human language technologies , 746-751.
Mitchell, M. 1993. Analogy-making as perception: A computer model .
Novick, L. R. 1988. Analogical transfer, problem similarity, and expertise. Journal of Experimental Psychology: Learning, memory, and cognition 14(3): 510.
O'Donoghue, T. V. D.; and Keane, M. 1999. Computability as a limiting cognitive constraint: Complexity concerns in metaphor comprehension about which cognitive linguists should be aware. In Cultural, Psychological and Typological Issues in Cognitive Linguistics: Selected papers of the biannual ICLA meeting in Albuquerque, July 1995 , volume 152, 129. John Benjamins Publishing.
Paszke, A.; Gross, S.; Massa, F.; Lerer, A.; Bradbury, J.; Chanan, G.; Killeen, T.; Lin, Z.; Gimelshein, N.; Antiga, L.; et al. 2019. PyTorch: An imperative style, high-performance deep learning library. In Advances in Neural Information Processing Systems , 8024-8035.
Reed, S. E.; Zhang, Y.; Zhang, Y.; and Lee, H. 2015. Deep visual analogy-making. In Advances in Neural Information Processing Systems , 1252-1260.
Ribeiro, D.; Hinrichs, T.; Crouse, M.; Forbus, K.; Chang, M.; and Witbrock, M. 2019. Predicting State Changes in Procedural Text using Analogical Question Answering .
Sagi, E.; Gentner, D.; and Lovett, A. 2012. What difference reveals about similarity. Cognitive Science 36(6): 1019-1050.
Tai, K. S.; Socher, R.; and Manning, C. D. 2015. Improved Semantic Representations From Tree-Structured Long ShortTerm Memory Networks. In Proceedings of the 53rd Annual Meeting of the Association for Computational Linguistics and the 7th International Joint Conference on Natural Language Processing (Volume 1: Long Papers) , 1556-1566.
Vaswani, A.; Shazeer, N.; Parmar, N.; Uszkoreit, J.; Jones, L.; Gomez, A. N.; Kaiser, Ł.; and Polosukhin, I. 2017. Attention is all you need. In Advances in Neural Information Processing Systems , 5998-6008.
Veale, T.; and Keane, M. T. 1997. The competence of suboptimal theories of structure mapping on hard analogies. In IJCAI , 232-237.
Vinyals, O.; Fortunato, M.; and Jaitly, N. 2015. Pointer networks. In Advances in Neural Information Processing Systems , 2692-2700.
Wang, R.; Yan, J.; and Yang, X. 2019. Learning combinatorial embedding networks for deep graph matching. In Proceedings of the IEEE International Conference on Computer Vision , 3056-3065.
Wetzel, L. 2006. Types and tokens .
Zhang, C.; Gao, F.; Jia, B.; Zhu, Y.; and Zhu, S.-C. 2019. Raven: A dataset for relational and analogical visual reasoning. In Proceedings of the IEEE Conference on Computer Vision and Pattern Recognition , 5317-5327.
Zhou, L.; Cui, P.; Yang, S.; Zhu, W.; and Tian, Q. 2019. Learning to learn image classifiers with visual analogy. In Proceedings of the IEEE Conference on Computer Vision and Pattern Recognition , 11497-11506.
## 7 Appendix
## 7.1 Model Details
In the DAG LSTM, the node embeddings were 32dimensional vectors and the edge embeddings were 16dimensional vectors. For all Transformer components, our model used multi-headed attention with 2 attention layers each having 4 heads. In each multi-headed attention layer, the query and key vectors were projected to 128-dimensional vectors. The feed forward networks used in the Transformer components had one hidden layer with a dimensionality twice that of the input vector size. The feed forward networks used to compute the values in the correspondence selector used two 64-dimensional hidden layers. The λ parameter applied to the candidate inference loss L ci was set to λ = 0 . 1 in our experiments. The models were constructed with the Pytorch (Paszke et al. 2019) library.
## 7.2 Training Data Generation
In Figure 6, the dark green nodes indicate the initial random graphs C after being copied into the base and target. The red and blue nodes show the graphs built around B and T . The light green edges indicate the gold set of correspondences generated from C . On average, each example consisted of 26.9 expressions and 14.3 entities in the base (41.2 distinct items in total), 27.0 expressions and 14.3 entities in the target (41.3 distinct items in total), and 26.8 correspondences.
Figure 6: Synthetic example with a base (red), target (blue), and shared subgraphs (green)
<details>
<summary>Image 6 Details</summary>
### Visual Description
## Flowchart Diagram: System Relationship Structure
### Overview
The image depicts a complex flowchart diagram illustrating relationships between nodes labeled with "rel_ord" (ordered relationships) and "rel_unord" (unordered relationships). The diagram uses color-coded arrows (red, green, blue) to represent different types of connections between nodes, with "const" nodes serving as terminal points.
### Components/Axes
- **Nodes**:
- Labeled with identifiers like `rel_ord_c_2`, `rel_unord_e_3`, `rel_ord_a_3`, etc.
- Two node types:
- Red-bordered ovals (e.g., `rel_ord_c_2`)
- Green-bordered rectangles (e.g., `rel_unord_e_3`)
- **Arrows**:
- Red arrows (→) connecting ordered relationship nodes
- Green arrows (→) connecting unordered relationship nodes
- Blue arrows (→) connecting cross-node relationships
- **Terminal Nodes**:
- Labeled "const" (constant) at the bottom of the diagram
### Detailed Analysis
1. **Left Section (Red Arrows)**:
- `rel_ord_c_2` → `rel_ord_o_2` → `rel_unord_a_2` → `rel_unord_e_3`
- All connections use red arrows, suggesting ordered relationship dependencies
2. **Center Section (Green Arrows)**:
- `rel_unord_e_3` connects to multiple "const" nodes via green arrows
- Branching structure indicates multiple unordered relationship outcomes
3. **Right Section (Blue Arrows)**:
- `rel_unord_a_2` → `rel_ord_r_2` → `rel_unord_a_1` → `rel_unord_b_1`
- Cross-node relationships shown through blue arrows
4. **Terminal Connections**:
- All paths eventually terminate at "const" nodes
- Multiple "const" nodes per relationship type suggest parallel processing paths
### Key Observations
- **Color Consistency**: Red arrows only connect ordered relationships, green only unordered, blue only cross-node
- **Node Hierarchy**: Ordered relationships (red) appear to feed into unordered relationships (green)
- **Complexity**: 12+ nodes with 20+ connections create a dense network
- **Terminal Pattern**: All paths end at "const" nodes, suggesting final state determination
### Interpretation
This diagram appears to model a system where:
1. Ordered relationships (red) establish initial parameters
2. These parameters feed into unordered relationship processing (green)
3. Cross-node relationships (blue) enable system-wide coordination
4. All processes ultimately resolve to constant states ("const")
The color-coding suggests a strict separation of relationship types, with ordered relationships serving as input to unordered processing. The multiple terminal "const" nodes per relationship type implies parallel processing paths or alternative resolution states. The absence of feedback loops suggests a linear progression toward final states, though the dense connections indicate complex intermediate processing.
</details>
## 7.3 Additional Experiments
Unit Normalization for Signature Embeddings: In Section 4.1, we described how signature embeddings were scaled to unit length to provide a simple criterion for whether two nodes were likely the same node (i.e., they have a dot product of 1). Intuitively, this feature would be most important for allowing AMN to follow SMT's one-to-one constraint, as it gives AMN the ability to determine which nodes have already been selected for correspondence. To measure the importance of this feature, we performed a simple experiment where we did not scale the signature embeddings to unit length (keeping all other components of AMN the same). We retrained AMN following the same training methodology as before, and tested AMN on the synthetic domain.
Interestingly, we found that performance in all categories (not just conformance to SMT's one-to-one constraint) became significantly worse. The structural performance of AMNdropped from 0.948 to 0.750, indicating that systematicity was impacted. The fraction of problems that were equivalent to the gold standard correspondence set (i.e., no SMT errors and the same structural evaluation score as the gold standard) dropped from 0.671 to 0.278. In terms of errors, the percent of correspondences that violated one-to-one increased from 0.6% to 1.6% and those violating parallel connectivity increased from 2.1% to 12.0%. Degenerate errors remained about the same, increasing from 0.9% to 1.2%, likely reflecting that the dot product of two signature embeddings still incorporates their shared descendants.
Value of the Signature Graph: Given that label graph captures almost all of the graph structure, it is natural to question whether the signature graph is necessary for producing SMT-conforming matchings. To determine the value of the signature graph, we performed an experiment where we completely excised the signature embeddings from AMN, leaving only the label graph for correspondence and candidate inference selection. We retrained this ablated version of AMN with the standard training methodology and tested it on the synthetic set of analogy problems.
Without the signature graph, AMN's performance plummeted in all categories. The one-to-one error rate increased from 0.6% to 92.4% and the parallel connectivity error rate increased from 1.2% to 99.4%. Consequently, the number of error free matches dropped to 0. This matches our intuitions, that without a distinction between the labels of objects and the objects themselves, AMN is incapable of modeling SMT.
## 7.4 Background
DAG LSTMs: DAG LSTMs extend Tree LSTMs (Tai, Socher, and Manning 2015) to DAG-structured data. As with Tree LSTMs, DAG LSTMs compute each node embedding as the aggregated information of all their immediate predecessors (the equations for the DAG LSTM are identical to those of the Tree LSTM). The difference between the two is that DAG LSTMs stage the computation of a node's embedding based on the order given by a topological sort of the input graph. Batching of computations is done by grouping together updates of independent nodes (where two nodes are independent if they are neither ancestors nor predecessors of one another). As in (Crouse et al. 2019), for a node, v , its initial node embedding, s v , is assigned based on its label and arity. The DAG LSTM then computes the final embedding h v to be
<!-- formula-not-decoded -->
where is element-wise multiplication, σ is the sigmoid function, P is the predecessor function that returns the arguments for a node, U ( e vw ) i , U ( e vw ) o , U ( e vw ) c , and U ( e vw ) f are learned matrices per edge type. i and o represent input and output gates, c and ˆ c are memory cells, and f is a forget gate.
Multi-Headed Attention: The multi-headed attention (MHA) mechanism of (Vaswani et al. 2017) is used in our work to compare correspondences against one another. In this work, MHA is given two inputs, a query vector q and a list of key vectors to compare the query vector against 〈 k 1 , . . . , k n 〉 . In N -headed attention, N separate attention transformations are computed. For transformation i we have
<!-- formula-not-decoded -->
where each of W ( q ) i , W ( k ) i , and W ( v ) i are learned matrices and b ˆ q is the dimensionality of ˆ q i . The final output vector q ′ for input q is then given as a combination of its N transformations
<!-- formula-not-decoded -->
where each W ( o ) i is a distinct learned matrix for each i . In implementation, the comparisons of query and key vectors are batched together and performed as efficient matrix multiplications.
Transformer Encoder-Decoder: The Transformer-based encoder-decoder is given two inputs, a comparison set C and an output set O . At a high level, C will be encoded into a new set E , which will inform a selection process that picks elements of O to return. In the context of pointer networks, the set O begins as the encoded input set, i.e., O = E .
Encoder: First, the elements of C , i.e. h c ∈ C , are passed through N layers of an attention-based transformation. For element h c in the i -th layer (i.e., h ( i -1) c ) this is performed as follows
<!-- formula-not-decoded -->
<!-- formula-not-decoded -->
where LN denotes the use of layer normalization (Ba, Kiros, and Hinton 2016), MHA ( i ) C (Appendix 7.4) denotes the use of self multi-headed attention for layer i (i.e., attention between h ( i ) c and the other elements of C ( i -1) ), and FFN ( i ) is a two-layer feed-forward neural network with ELU (Clevert, Unterthiner, and Hochreiter 2015) activations. After N layers of processing, the set of encoded inputs E is given by E = C ( N )
Decoder: With encoded comparison elements E and a set of potential outputs O , the objective of the decoder is to use E to inform the selection of some subset of output options D ⊆ O to return. Decoding happens sequentially; at each timestep t ∈ { 1 , . . . , n } the decoder selects an element from O ∪ { END-TOK } (where END-TOK is a learned triple) to add to D . If END-TOK is chosen, the decoding procedure stops and D is returned.
Let D t be the set of elements that have been selected by timestep t and O t be the remaining unselected elements at timetstep t . First, D t is processed with an N -layered attention-based transformation. For an element h ( i -1) d this is given by
<!-- formula-not-decoded -->
where MHA ( i ) D denotes the use of self multi-headed attention, MHA ( i ) E denotes the use of multi-headed attention against elements of E , and FFN ( i ) is a two-layer feed-forward neural network with ELU activations. We will consider the already selected outputs to be the transformed selected outputs, i.e., D t = D ( N ) t . For a pair, 〈 h o , h d 〉 ∈ O t × D t , we compute their compatibility as α od
<!-- formula-not-decoded -->
where W q and W k are learned matrices, b o is the dimensionality of h o , and FFN is a two layer feed-forward network with ELU activations. This defines a matrix H ∈ R |O t |×|D t | of compatibility scores. One can then apply some operation (e.g., max pooling) to produce a vector of values v t ∈ R |O t | which can be fed into a softmax to produce a distribution over options from O t . The highest probability element δ ∗ from the distribution is then added to the set of selected outputs, i.e., D = D t ∪ { δ ∗ } .
## 7.5 AMNExample Outputs
For the outputs from the non-synthetic domains (all but the first figure), only small subgraphs of the original graphs are shown (the original graphs were too large to be displayed)
<details>
<summary>Image 7 Details</summary>
### Visual Description
## Flowchart Diagram: Relational Order and Unorder Nodes
### Overview
The image depicts a complex flowchart diagram with interconnected nodes and directional arrows. The diagram appears to represent a system of relational orders and unorders, with nodes labeled using a consistent naming convention (e.g., `rel_ord_`, `rel_unord_`, `const`). Arrows indicate directional relationships between nodes, with some arrows highlighted in green. The structure suggests a hierarchical or networked system with multiple layers of connections.
---
### Components/Axes
- **Nodes**:
- Labeled with identifiers such as `rel_ord_g_2`, `rel_unord_s_2`, `rel_ord_n_2`, `rel_ord_d_3`, `rel_ord_r_3`, `rel_unord_c_2`, `rel_unord_f_1`, `rel_unord_i_1`, and `const`.
- Nodes are grouped into clusters (e.g., left, central, right sections).
- **Arrows**:
- Black arrows represent primary directional relationships.
- Green arrows indicate secondary or alternative pathways (e.g., loops or feedback connections).
- **No explicit legend** is visible, but color coding (green vs. black) may imply different relationship types.
---
### Detailed Analysis
#### Node Labels and Connections
1. **Left Section**:
- Nodes: `rel_ord_g_2`, `rel_ord_n_2`, `rel_ord_d_3`, `rel_ord_r_3`, `rel_unord_s_2`, `rel_unord_c_2`, `rel_unord_f_2`, `rel_unord_b_1`.
- Connections:
- `rel_ord_g_2` → `rel_unord_s_2` (black arrow).
- `rel_ord_n_2` → `rel_unord_c_2` (black arrow).
- `rel_ord_d_3` → `rel_unord_f_2` (black arrow).
- `rel_ord_r_3` → `rel_unord_b_1` (black arrow).
- Green arrows form loops between `rel_ord_g_2`, `rel_ord_n_2`, and `rel_ord_d_3`.
2. **Central Section**:
- Nodes: `rel_ord_l_2`, `rel_ord_k_3`, `rel_ord_b_1`, `rel_ord_s_1`, `rel_ord_j_3`, `rel_ord_t_3`, `rel_ord_i_1`, `rel_ord_n_2`, `rel_ord_d_3`, `rel_ord_r_3`.
- Connections:
- `rel_ord_l_2` → `rel_unord_c_2` (black arrow).
- `rel_ord_k_3` → `rel_unord_f_1` (black arrow).
- `rel_ord_j_3` → `rel_unord_i_1` (black arrow).
- Green arrows connect `rel_ord_l_2` to `rel_ord_k_3` and `rel_ord_j_3`.
3. **Right Section**:
- Nodes: `rel_ord_l_2`, `rel_ord_j_3`, `rel_ord_t_3`, `rel_ord_i_1`, `rel_ord_n_2`, `rel_ord_d_3`, `rel_ord_r_3`, `rel_unord_o_1`.
- Connections:
- `rel_ord_l_2` → `rel_unord_o_1` (black arrow).
- `rel_ord_j_3` → `rel_unord_o_1` (black arrow).
- `rel_ord_t_3` → `rel_unord_o_1` (black arrow).
- Green arrows link `rel_ord_l_2` to `rel_ord_j_3` and `rel_ord_t_3`.
#### "const" Nodes
- Multiple nodes labeled `const` are present, likely representing fixed or constant values. These are connected to other nodes via black arrows, suggesting they are inputs or reference points.
---
### Key Observations
1. **Hierarchical Structure**:
- The diagram is divided into three main sections (left, central, right), each with distinct node clusters.
- The central section acts as a hub, connecting multiple nodes from the left and right sections.
2. **Repetition of Labels**:
- Labels like `rel_ord_n_2`, `rel_ord_d_3`, and `rel_ord_r_3` appear in multiple sections, indicating shared or overlapping relationships.
3. **Green Arrows**:
- Green arrows form loops and alternative pathways, suggesting feedback mechanisms or redundant connections.
4. **Absence of Numerical Data**:
- No numerical values, scales, or quantitative data are present. The diagram focuses on structural relationships.
---
### Interpretation
- **Purpose**: The diagram likely represents a workflow, dependency graph, or relational system where nodes symbolize entities (e.g., processes, variables) and arrows denote interactions or dependencies.
- **Key Relationships**:
- The central node `rel_unord_c_2` appears to be a critical junction, connecting multiple nodes from the left and right sections.
- The repeated use of `rel_ord_` and `rel_unord_` suggests a system where "order" and "unorder" states are dynamically managed.
- **Anomalies**:
- The green arrows introduce ambiguity, as their purpose (e.g., alternative paths, exceptions) is not explicitly defined.
- The lack of a legend or key limits the ability to interpret color-coded relationships definitively.
---
### Conclusion
This diagram illustrates a complex network of relational orders and unorders, with a focus on structural relationships rather than quantitative data. The use of `const` nodes and directional arrows suggests a system designed to model dependencies, feedback loops, or hierarchical processes. Further clarification on the meaning of green arrows and node labels would enhance interpretability.
</details>
Figure 7: AMN output for an example from the Synthetic domain
Figure 8: AMN output for an example from the Visual Oddity domain
<details>
<summary>Image 8 Details</summary>
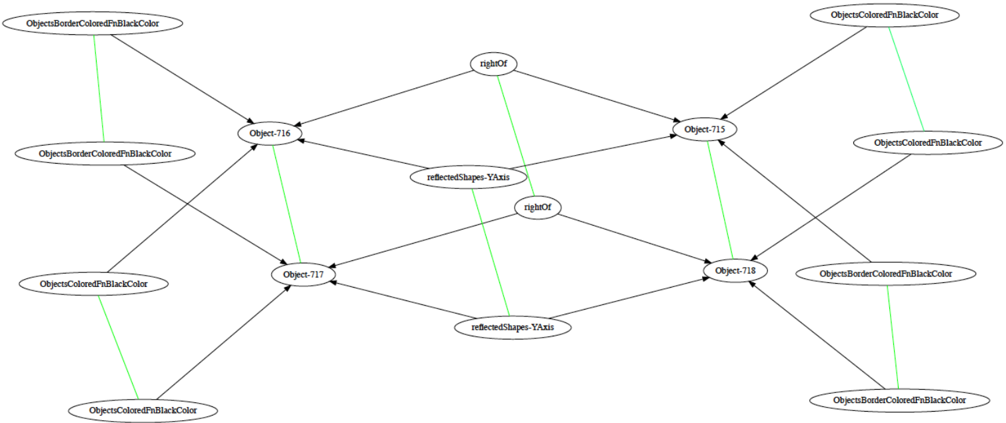
### Visual Description
```markdown
## Network Diagram: Object Relationships and Spatial Attributes
### Overview
The image depicts a network diagram illustrating relationships between objects, their attributes, and spatial or geometric properties. Nodes represent objects with identifiers (e.g., "Object-716") and color attributes (e.g., "ObjectsColoredFnBlackColor"). Edges connect nodes, with green edges labeled with specific relationship types (e.g., "rightOf," "reflectedShapes-YAxis") and black edges representing unlabelled connections. The diagram emphasizes directional relationships and shared attributes among objects.
### Components/Axes
- **Nodes**:
- Labeled with object identifiers (e.g., "Object-716," "Object-715," "Object-717," "Object-718").
- Some nodes have color attributes (e.g., "ObjectsColoredFnBlackColor," "ObjectsBorderColoredFnBlackColor").
- **Edges**:
- **Green edges**: Labeled with relationship types (e.g., "rightOf," "reflectedShapes-YAxis").
- **Black edges**: Unlabelled, likely representing generic connections.
- **Legend**: No explicit legend is present, but edge colors (green/black) and node attributes (color labels) imply categorical distinctions.
### Detailed Analysis
- **Nodes**:
- **Object-716**: Connected to "Object-715" (green edge: "rightOf"), "Object-717" (green edge: "reflectedShapes-YAxis"), and "ObjectsColoredFnBlackColor" (black edge).
- **Object-715**: Connected to "Object-716" (green edge: "rightOf"), "Object-718" (green edge: "reflectedShapes-YAxis"), and "ObjectsColoredFnBlackColor" (black edge).
- **Object-717**: Connected to "Object-716" (green edge: "reflectedShapes-YAxis"), "Object-718" (green edge: "rightOf"), and "ObjectsColoredFnBlackColor" (black edge).
- **Object-718**: Connected to "Object-715" (green edge: "reflectedShapes-YAxis"), "Object-717" (green edge: "rightOf"), and "ObjectsColoredFnBlackColor" (black edge).
- **ObjectsColoredFnBlackColor**: Multiple nodes share this attribute, connected to various objects via black edges.
- **ObjectsBorderColoredFnBlackColor**: Similar to the above, with black edges connecting to other nodes.
- **Edges**:
- **Green edges** (labeled):
- "rightOf": Indicates spatial positioning (e.g., Object-716 is to the right of Object-715).
- "reflectedShapes-YAxis": Suggests geometric reflection along the Y-axis (e.g., Object-716's shape is reflected along the Y-axis relative to Object-717).
- **Black edges**: No labels, possibly representing default or unclassified relationships.
### Key Observations
1. **Spatial Relationships**: Green edges with labels like "rightOf" and "reflectedShapes-YAxis" define directional and geometric relationships between objects.
2. **Color Attributes**: Nodes with "ObjectsColoredFnBlackColor" and "ObjectsBorderColoredFnBlackColor" share a common color attribute, suggesting a shared property or category.
3. **Directionality**: Arrows on edges indicate one-way relationships (e.g., "rightOf" implies a specific spatial hierarchy).
4. **Repetition**: Multiple nodes share identical labels (e.g., "ObjectsColoredFnBlackColor"),
</details>
Figure 9: AMN output for an example from the Moral Decision Making domain
<details>
<summary>Image 9 Details</summary>
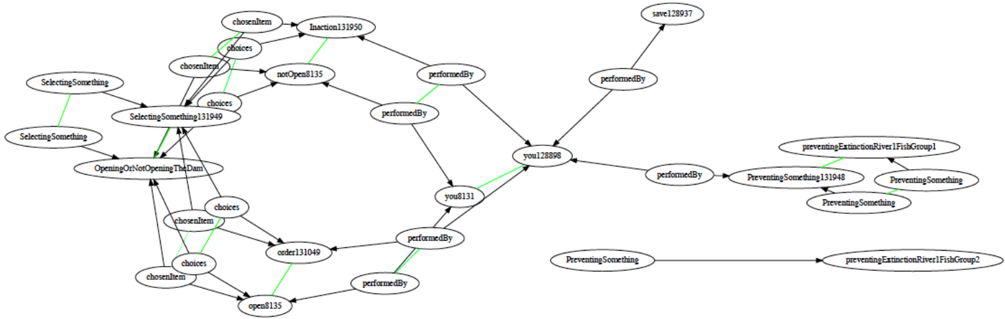
### Visual Description
## Flowchart Diagram: Decision Process for Environmental Actions
### Overview
The diagram illustrates a complex decision-making process involving multiple nodes (actions/choices) and directed edges (relationships/outcomes). It depicts a network of interconnected decisions, with nodes representing actions (e.g., "SelectingSomething," "PreventingSomething") and edges indicating causality or dependencies (e.g., "performedBy," "choices"). The structure suggests a branching logic tree with feedback loops and parallel pathways.
### Components/Axes
- **Nodes**:
- Actions: `SelectingSomething`, `OpeningOrNotOpeningTheDam`, `PreventingSomething`, `saves`, `open`, `notOpen`, `chosenItem`, `choices`
- Entities: `you128898`, `you8131`
- Outcomes: `preventingExtinctionRiver1FishGroup1`, `preventingExtinctionRiver1FishGroup2`
- **Edges**:
- Relationships: `performedBy`, `choices`, `saves`, `preventingSomething`
- Labels include numeric identifiers (e.g., `(131949)`, `(131950)`) likely representing unique instances or versions.
### Detailed Analysis
- **Central Nodes**:
- `SelectingSomething` (appears 3x) acts as a root node with multiple outgoing edges labeled `choices` leading to `OpeningOrNotOpeningTheDam` and `PreventingSomething`.
- `OpeningOrNotOpeningTheDam` branches into `open8135` (via `choices`) and `notOpen8135` (via `notOpen`).
- **Feedback Loops**:
- `you128898` and `you8131` are connected via `performedBy` edges, suggesting iterative actions or shared responsibility.
- `PreventingSomething` nodes link to `preventingExtinctionRiver1FishGroup1` and `preventingExtinctionRiver1FishGroup2`, indicating targeted conservation efforts.
- **Numeric Identifiers**:
- Nodes/edges include numbers in parentheses (e.g., `(131949)`, `(131950)`), possibly denoting timestamps, versions, or unique identifiers for tracking decision paths.
### Key Observations
1. **Branching Logic**: The diagram emphasizes decision points (e.g., `choices` edges) leading to divergent outcomes.
2. **Circular Flow**: Nodes like `SelectingSomething` and `PreventingSomething` form loops, implying recurring actions or adaptive strategies.
3. **Entity Roles**: `you128898` and `you8131` are central actors, with `performedBy` edges linking them to multiple actions.
4. **Environmental Focus**: The `preventingExtinctionRiver1FishGroup` nodes suggest ecological conservation as a primary goal.
### Interpretation
This diagram models a decision-making framework for environmental management, where actors (`you128898`, `you8131`) repeatedly select actions (`SelectingSomething`) that branch into operational choices (e.g., opening/closing a dam). These choices trigger downstream effects, such as preventing species extinction in specific fish groups. The numeric identifiers imply a need to track decision paths or versions, possibly for auditing or optimization. The circular dependencies suggest iterative refinement of strategies, where outcomes of one action influence subsequent decisions. The emphasis on "preventing" actions highlights proactive measures to mitigate ecological risks, with fish group preservation as a critical metric.
</details>