## Online Learning in Iterated Prisoner's Dilemma to Mimic Human Behavior
Baihan Lin 1 , ∗ , Djallel Bouneffouf 2 and Guillermo Cecchi 2
1 Columbia University, New York, USA
2 IBM Research, Yorktown Heights, NY, USA
baihan.lin@columbia.edu, djallel.bouneffouf@ibm.com, gcecchi@us.ibm.com
Abstract. As an important psychological and social experiment, the Iterated Prisoner's Dilemma (IPD) treats the choice to cooperate or defect as an atomic action. We propose to study the behaviors of online learning algorithms in the Iterated Prisoner's Dilemma (IPD) game, where we investigate the full spectrum of reinforcement learning agents: multi-armed bandits, contextual bandits and reinforcement learning. We evaluate them based on a tournament of iterated prisoner's dilemma where multiple agents can compete in a sequential fashion. This allows us to analyze the dynamics of policies learned by multiple self-interested independent reward-driven agents, and also allows us study the capacity of these algorithms to fit the human behaviors. Results suggest that considering the current situation to make decision is the worst in this kind of social dilemma game. Multiples discoveries on online learning behaviors and clinical validations are stated, as an effort to connect artificial intelligence algorithms with human behaviors and their abnormal states in neuropsychiatric conditions. 3
Keywords: Online learning, Bandits, Contextual bandits, Reinforcement learning, Iterated Prisoner's Dilemma, Behavioral modeling
## 1 Introduction
Social dilemmas expose tensions between cooperation and defection. Understanding the best way of playing the iterated prisoner's dilemma (IPD) has been of interest to the scientific community since the formulation of the game seventy years ago [5]. To evaluate the algorithm a round robin computer tournament was proposed, where algorithms competed against each others [2]. The winner was decided on the average score a strategy achieved. Using this framework, we propose here to focus on studying reward driven online learning algorithm with different type of attentions mechanism, where we define attention "as the behavioral and cognitive process of selectively concentrating on a discrete stimulus while ignoring other perceivable stimuli" [21]. Following this definition, we
3 The data and codes to reproduce all the empirical results can be accessed at https://github.com/doerlbh/dilemmaRL.
analyze three algorithms classes: the no-attention-to-the-context online learning agent (the multi armed bandit algorithms) outputs an action but does not use any information about the state of the environment (context); the contextual bandit algorithm extends the model by making the decision conditional on the current state of the environment, and finally reinforcement learning as an extension of contextual bandits which makes decision conditional on the current state of the environment and the next state of the unknown environments. This paper mainly focuses on an answer to two questions:
- -Does attending to the context for an online learning algorithm helps on the task of maximizing the rewards in an IPD tournament, and how do different attention biases shape behavior?
- -Does attending to the context for an online learning algorithm helps to mimic human behavior?
To answer these questions, we have performed two experimenters: (1) The first one where we have run a tournament of the iterated prisoner's dilemma: Since the seminal tournament in 1980 [5], a number of IPD tournaments have been undertaken [2,12,10]. In this work, we adopt a similar tournament setting, but also extended it to cases with more than two players. Empirically, we evaluated the algorithms in four settings of the Iterated Prisoner's Dilemma: pairwise-agent tournament, three-agent tournament, 'mental'-agent tournament. (2) Behavioral cloning prediction task: where we train the the three types of algorithm to mimic the human behavior on some training set and then test them in a test set. Our main results are the following:
- -We observe that contextual bandits are not performing well in the tournament, which means that considering the current situation to make decision is the worst in this kind of social dilemma game. Basically we should either do not care about the current situation or caring about more situations, but not just the current one.
- -We observe that bandit algorithms (without context) is the best in term of fitting the human data, which implies that humans may not consider the context when they play the iterated prisoner's dilemma.
This paper is organized as follows. We first review related works and introduces some background concepts. Then we explain the two experiments we have performed. Experimental evaluation highlights the empirical results we have got. Finally, the last section concludes the paper and points out possible directions for future works.
As far as we are aware, this is the first work that evaluated the online learning algorithms in social gaming settings. Although the agents that we evaluated here are not newly proposed by us, we believe that given this understudied information asymmetry problem setting, our work helps the community understand how the inductive bias of different methods yield different behaviors in social agent settings (e.g. iterated prisoners' dilemma), and thus provides a nontrivial contribution to the fields, both in understanding machine learning algorithms, and in studying mechanistic models of human behaviors in social settings.
## 2 Related Work
There is much computational work focused on non understanding the strategy space and finding winning strategies in the iterated prisoner's dilemma; Authors in [22] present and discuss several improvements to the Q-Learning algorithm, allowing for an easy numerical measure of the exploitability of a given strategy. [18] propose a mechanism for achieving cooperation and communication in MultiAgent Reinforcement Learning settings by intrinsically rewarding agents for obeying the commands of other agents. We are interested in investigating how algorithms are behaving and also how they are modeling the human decisions in the IPD, with the larger goal of understanding human decision-making. Forinstance, In [39] authors have proposed an active modeling technique to predict the behavior of IPD players. The proposed method can model the opponent player's behavior while taking advantage of interactive game environments. The data showed that the observer was able to build, through direct actions, a more accurate model of an opponent's behavior than when the data were collected through random actions. [15] they propose the first predictive model of human cooperation able to organize a number of different experimental findings that are not explained by the standard model and they show also that the model makes satisfactorily accurate quantitative predictions of population average behavior in one-shot social dilemmas. To the best of our knowledge no study has been exploring the full spectrum of reinforcement learning agents: multi-armed bandits, contextual bandits and reinforcement learning in social dilemma.
## 3 Background
Multi-Armed Bandit (MAB): The multi-armed bandit (MAB) algorithm models a sequential decision-making process, where at each time point a the algorithm selects an action from a given finite set of possible actions, attempting to maximize the cumulative reward over time [23,3].
Contextual Bandit Algorithm (CB). Following [24], this problem is defined as follows. At each time point (iteration) t ∈ { 1 , ..., T } , an agent is presented with a context ( feature vector ) x t ∈ R N before choosing an arm k ∈ A = { 1 , ..., K } . We will denote by X = { X 1 , ..., X N } the set of features (variables) defining the context. Let r t = ( r 1 t , ..., r t K ) denote a reward vector, where r k t ∈ [0 , 1] is a reward at time t associated with the arm k ∈ A . Herein, we will primarily focus on the Bernoulli bandit with binary reward, i.e. r k t ∈ { 0 , 1 } . Let π : X → A denote a policy. Also, D c,r denotes a joint distribution over ( x , r ) . We will assume that the expected reward is a linear function of the context, i.e. E [ r k t | x t ] = µ T k x t , where µ k is an unknown weight vector associated with arm k .
Reinforcement Learning (RL). Reinforcement learning defines a class of algorithms for solving problems modeled as Markov decision processes (MDP) [46]. An MDP is defined by the tuple ( S , A , T , R , γ ) , where S is a set of possible states, A is a set of actions, T is a transition function defined as T ( s, a, s ′ ) = Pr( s ′ | s, a ) , where s, s ′ ∈ S and a ∈ A , and R : S × A × S ↦→ R is a reward function, γ
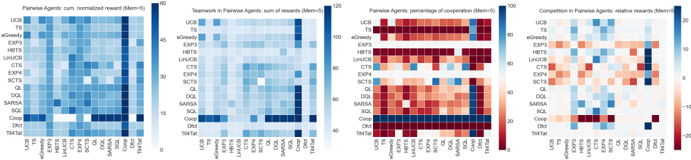
Fig. 1: Success, Teamwork, Cooperation & Competition in two-agent tournament.
<details>
<summary>Image 1 Details</summary>
### Visual Description
## Heatmap Charts: Pairwise Agent Analysis
### Overview
The image presents four heatmaps comparing the performance of different pairwise agents across various metrics. The agents are compared based on cumulative normalized reward, teamwork (sum of rewards), percentage of cooperation, and relative rewards in competition. Each heatmap visualizes the interactions between the same set of agents, allowing for a direct comparison of their behavior under different evaluation criteria.
### Components/Axes
**General Components:**
* **Agents (Rows & Columns):** The same set of agents are listed on both the x and y axes of each heatmap. The agents are: UCB, TS, eGreedy, EXP3, HBTS, LinUCB, CTS, EXP4, SCTS, QL, DQL, SARSA, SQL, Coop, Dfct, and Tit4Tat.
* **Color Scales:** Each heatmap has its own color scale, indicating the range of values represented by the colors.
* **Titles:** Each heatmap has a title indicating the metric being visualized.
**Specific Axes and Scales:**
1. **Pairwise Agents: cum. normalized reward (Mem=5):**
* Y-axis: Agent types (UCB, TS, eGreedy, EXP3, HBTS, LinUCB, CTS, EXP4, SCTS, QL, DQL, SARSA, SQL, Coop, Dfct, Tit4Tat).
* X-axis: Agent types (UCB, TS, eGreedy, EXP3, HBTS, LinUCB, CTS, EXP4, SCTS, QL, DQL, SARSA, SQL, Coop, Dfct, Tit4Tat).
* Color Scale: Blue, ranging from approximately 0 to 60, representing the cumulative normalized reward.
2. **Teamwork in Pairwise Agents: sum of rewards (Mem=5):**
* Y-axis: Agent types (UCB, TS, eGreedy, EXP3, HBTS, LinUCB, CTS, EXP4, SCTS, QL, DQL, SARSA, SQL, Coop, Dfct, Tit4Tat).
* X-axis: Agent types (UCB, TS, eGreedy, EXP3, HBTS, LinUCB, CTS, EXP4, SCTS, QL, DQL, SARSA, SQL, Coop, Dfct, Tit4Tat).
* Color Scale: Blue, ranging from approximately 40 to 120, representing the sum of rewards.
3. **Pairwise Agents: percentage of cooperation (Mem=5):**
* Y-axis: Agent types (UCB, TS, eGreedy, EXP3, HBTS, LinUCB, CTS, EXP4, SCTS, QL, DQL, SARSA, SQL, Coop, Dfct, Tit4Tat).
* X-axis: Agent types (UCB, TS, eGreedy, EXP3, HBTS, LinUCB, CTS, EXP4, SCTS, QL, DQL, SARSA, SQL, Coop, Dfct, Tit4Tat).
* Color Scale: Ranges from red to blue, with red representing low cooperation (0) and blue representing high cooperation (100).
4. **Competition in Pairwise Agents: relative rewards (Mem=5):**
* Y-axis: Agent types (UCB, TS, eGreedy, EXP3, HBTS, LinUCB, CTS, EXP4, SCTS, QL, DQL, SARSA, SQL, Coop, Dfct, Tit4Tat).
* X-axis: Agent types (UCB, TS, eGreedy, EXP3, HBTS, LinUCB, CTS, EXP4, SCTS, QL, DQL, SARSA, SQL, Coop, Dfct, Tit4Tat).
* Color Scale: Ranges from red to blue, with red representing negative relative rewards (-20) and blue representing positive relative rewards (20).
### Detailed Analysis
**1. Pairwise Agents: cum. normalized reward (Mem=5):**
* The diagonal elements (interaction of an agent with itself) show moderate to high rewards, indicated by medium to dark blue shades.
* Coop, Dfct, and Tit4Tat show high rewards when interacting with each other (dark blue).
* Other agents show varying degrees of reward when interacting with Coop, Dfct, and Tit4Tat, generally lower than the self-interaction rewards.
**2. Teamwork in Pairwise Agents: sum of rewards (Mem=5):**
* The diagonal elements show moderate rewards (light blue).
* Coop, Dfct, and Tit4Tat show high rewards when interacting with each other (dark blue).
* Interactions between other agents are generally low to moderate (light blue).
**3. Pairwise Agents: percentage of cooperation (Mem=5):**
* The diagonal elements show varying degrees of cooperation.
* Coop, Dfct, and Tit4Tat show very high cooperation with each other (dark blue).
* Other agents show low cooperation with Dfct (red).
* UCB, TS, eGreedy, EXP3, HBTS, LinUCB, CTS, EXP4, SCTS, QL, DQL, SARSA, SQL show high cooperation with each other (dark blue).
**4. Competition in Pairwise Agents: relative rewards (Mem=5):**
* The diagonal elements show near-zero relative rewards (white/light shades).
* Coop, Dfct, and Tit4Tat show negative relative rewards when interacting with other agents (red).
* Other agents show positive relative rewards when interacting with Coop, Dfct, and Tit4Tat (blue).
### Key Observations
* **Coop, Dfct, and Tit4Tat:** These agents consistently show high cooperation and teamwork among themselves but are exploited by other agents in competitive scenarios.
* **UCB, TS, eGreedy, EXP3, HBTS, LinUCB, CTS, EXP4, SCTS, QL, DQL, SARSA, SQL:** These agents tend to cooperate with each other and exploit Coop, Dfct, and Tit4Tat in competitive settings.
* **Diagonal Elements:** The diagonal elements in the cooperation and competition heatmaps are generally neutral, indicating that agents neither strongly cooperate nor compete with themselves.
### Interpretation
The heatmaps provide a comprehensive view of how different agents interact in pairwise scenarios. The data suggests that:
* **Cooperative Strategies:** Coop, Dfct, and Tit4Tat are effective in environments that reward cooperation but are vulnerable to exploitation in competitive environments.
* **Exploitative Strategies:** UCB, TS, eGreedy, EXP3, HBTS, LinUCB, CTS, EXP4, SCTS, QL, DQL, SARSA, SQL are more successful in competitive environments, likely due to their ability to exploit cooperative strategies.
* **Trade-off:** There is a clear trade-off between cooperation and competitiveness. Agents that prioritize cooperation may achieve high rewards in collaborative settings but are easily exploited in competitive ones.
The "Mem=5" likely refers to a memory parameter, indicating that the agents consider the past 5 interactions when making decisions. This parameter influences the agents' strategies and their ability to adapt to different environments.
</details>
<!-- formula-not-decoded -->
is a discount factor that decreases the impact of the past reward on current action choice. Typically, the objective is to maximize the discounted long-term reward, assuming an infinite-horizon decision process, i.e. to find a policy function π : S ↦→ A which specifies the action to take in a given state, so that the cumulative reward is maximized: max π ∑ ∞ t =0 γ t R ( s t , a t , s t +1 ) .
## 4 Experimental Setup
Here, we describe the two main experiments we run, Iterated Prisoner's Dilemma (IPD) and Behavioral Cloning with Demonstration Rewards (BCDR).
## 4.1 Iterated Prisoner's Dilemma (IPD)
The Iterated Prisoner's Dilemma (IPD) can be defined as a matrix game G = [ N, { A i } i ∈ N , { R i } i ∈ N ] , where N is the set of agents, A i is the set of actions available to agent i with A being the joint action space A 1 ×··· × A n , and R i is the reward function for agent i . A special case of this generic multi-agent IPD is the classical two-agent case (Table 1). In this game, each agent has two actions: cooperate (C) and defect (D), and can receive one of the four possible rewards: R (Reward), P (Penalty), S (Sucker), and T (Temptation). In the multi-agent setting, if all agents Cooperates (C), they all receive Reward (R); if all agents defects (D), they all receive Penalty (P); if some agents Cooperate (C) and some Defect (D), cooperators receive Sucker (S) and defector receive Temptation (T). The four payoffs satisfy the following inequalities: T > R > P > S and 2 R > T + S . The PD is a one round game, but is commonly studied in a manner where the prior outcomes matter to understand the evolution of cooperative behaviour from complex dynamics [6].
## 4.2 Behavioral Cloning with Demonstration Rewards
Here we define a new type of multi-agent online learning setting, the Behavior Cloning with Demonstration Rewards (BCDR), present a novel training procedure
and agent for solving this problem. In this setting, and similar to [8,7,37] the agent first goes through a constraint learning phase where it is allowed to query the actions and receive feedback r e k ( t ) ∈ [0 , 1] about whether or not the chosen decision matches the teacher's action (from demonstration). During the deployment (testing) phase, the goal of the agent is to maximize both r k ( t ) ∈ [0 , 1] , the reward of the action k at time t , and the (unobserved) r e k ( t ) ∈ [0 , 1] , which models whether or not the taking action k matches which action the teacher would have taken. During the deployment phase, the agent receives no feedback on the value of r e k ( t ) , where we would like to observe how the behavior captures the teacher's policy profile. In our specific problem, the human data plays the role of the teacher, and the behavioral cloning aims to train our agents to mimic the human behaviors.
## 4.3 Online Learning Agents
We briefly outlined the different types of online learning algorithms we have used: Multi-Armed Bandit (MAB): The multi-armed bandit algorithm models a sequential decision-making process, where at each time point a the algorithm selects an action from a given finite set of possible actions, attempting to maximize the cumulative reward over time [23,3,13]. In the multi-armed bandit agent pool, we have Thompson Sampling (TS) [48], Upper Confidence Bound (UCB) [3], epsilon Greedy (eGreedy) [46], EXP3 [4] and the Human Based Thompson Sampling (HBTS) [14].
Contextual Bandit (CB). Following [24], this problem is defined as follows. At each time point (iteration), an agent is presented with a context ( feature vector ) before choosing an arm. In the contextual bandit agent pool, we have Contextual Thompson Sampling (CTS) [1], LinUCB [26], EXP4 [11] and Split Contextual Thompson Sampling (SCTS) [29,33].
Reinforcement Learning (RL). Reinforcement learning defines a class of algorithms for solving problems modeled as Markov decision processes (MDP) [46]. An MDP is defined by the tuple with a set of possible states, a set of actions and a transition function. In the reinforcement learning agent pool, we have QLearning (QL), Double Q-Learning (DQL) [19], State-action-reward-state-action (SARSA) [44] and Split Q-Learning (SQL) [28,32]. We also selected three most popular handcrafted policy for Iterated Prisoner's Dilemma: 'Coop' stands for always cooperating, 'Dfct' stands for always defecting and 'Tit4Tat' stands for following what the opponent chose for the last time (which was the winner approach in the 1980 IPD tournament [5]).
The choices of the agents evaluated in this work are the most common online learning agents in bandits, contextual bandits and reinforcement learning (the three online learning classes). We thought that competing them against one another, and competing the three online learning classes against one another might be an interesting experiment to study how the inductive bias of different methods yield different behaviors in social agent settings (e.g. iterated prisoners' dilemma).
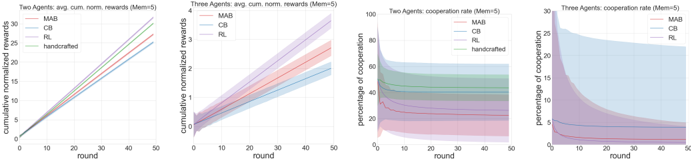
Fig. 2: Cumulative reward and cooperation rate averaged by class in two- and three-player setting.
<details>
<summary>Image 2 Details</summary>
### Visual Description
## Chart: Agent Performance Comparison
### Overview
The image presents four line charts comparing the performance of different agents (MAB, CB, RL, and handcrafted) in two scenarios: two agents and three agents. The charts depict cumulative normalized rewards and cooperation rates over 50 rounds. Shaded areas around the lines indicate variability or confidence intervals.
### Components/Axes
**Chart 1: Two Agents: avg. cum. norm. rewards (Mem=5)**
* **X-axis:** round (0 to 50)
* **Y-axis:** cumulative normalized rewards (0 to 30)
* **Legend (top-left):**
* MAB (red)
* CB (blue)
* RL (purple)
* handcrafted (green)
**Chart 2: Three Agents: avg. cum. norm. rewards (Mem=5)**
* **X-axis:** round (0 to 50)
* **Y-axis:** cumulative normalized rewards (0 to 4)
* **Legend (top-left):**
* MAB (red)
* CB (blue)
* RL (purple)
**Chart 3: Two Agents: cooperation rate (Mem=5)**
* **X-axis:** round (0 to 50)
* **Y-axis:** percentage of cooperation (0 to 100)
* **Legend (top-right):**
* MAB (red)
* CB (blue)
* RL (purple)
* handcrafted (green)
**Chart 4: Three Agents: cooperation rate (Mem=5)**
* **X-axis:** round (0 to 50)
* **Y-axis:** percentage of cooperation (0 to 30)
* **Legend (top-right):**
* MAB (red)
* CB (blue)
* RL (purple)
### Detailed Analysis
**Chart 1: Two Agents: avg. cum. norm. rewards (Mem=5)**
* **MAB (red):** Linearly increasing from approximately 0 to 28 over 50 rounds.
* **CB (blue):** Linearly increasing from approximately 0 to 25 over 50 rounds.
* **RL (purple):** Linearly increasing from approximately 0 to 29 over 50 rounds.
* **handcrafted (green):** Linearly increasing from approximately 0 to 31 over 50 rounds.
**Chart 2: Three Agents: avg. cum. norm. rewards (Mem=5)**
* **MAB (red):** Increasing from approximately 0 to 2 over 50 rounds, with a shaded area indicating variability.
* **CB (blue):** Increasing from approximately 0 to 1.5 over 50 rounds, with a shaded area indicating variability.
* **RL (purple):** Increasing from approximately 0 to 2.5 over 50 rounds, with a shaded area indicating variability.
**Chart 3: Two Agents: cooperation rate (Mem=5)**
* **MAB (red):** Decreasing from approximately 20 to 5 over 50 rounds, with a shaded area indicating variability.
* **CB (blue):** Decreasing from approximately 30 to 10 over 50 rounds, with a shaded area indicating variability.
* **RL (purple):** Decreasing from approximately 30 to 10 over 50 rounds, with a shaded area indicating variability.
* **handcrafted (green):** Decreasing from approximately 80 to 50 over 50 rounds, with a shaded area indicating variability.
**Chart 4: Three Agents: cooperation rate (Mem=5)**
* **MAB (red):** Decreasing from approximately 5 to 1 over 50 rounds, with a shaded area indicating variability.
* **CB (blue):** Relatively constant at approximately 5 over 50 rounds, with a shaded area indicating variability.
* **RL (purple):** Decreasing from approximately 30 to 5 over 50 rounds, with a shaded area indicating variability.
### Key Observations
* In the two-agent reward scenario, the handcrafted agent achieves the highest cumulative normalized rewards, closely followed by RL and MAB. CB performs slightly worse.
* In the three-agent reward scenario, RL achieves the highest cumulative normalized rewards, followed by MAB and then CB. The rewards are significantly lower compared to the two-agent scenario.
* In the two-agent cooperation rate scenario, the handcrafted agent starts with a high cooperation rate but decreases over time. MAB, CB, and RL all start with lower cooperation rates and decrease over time.
* In the three-agent cooperation rate scenario, RL starts with a high cooperation rate that decreases significantly over time. MAB and CB have low and relatively constant cooperation rates.
### Interpretation
The charts suggest that the handcrafted agent performs well in the two-agent reward scenario but has a high initial cooperation rate that decreases over time. RL performs well in both reward scenarios but has a high initial cooperation rate that decreases significantly in the three-agent scenario. MAB and CB generally have lower rewards and cooperation rates compared to RL and the handcrafted agent. The three-agent scenario results in lower rewards and cooperation rates compared to the two-agent scenario, indicating increased complexity or competition among the agents. The shaded areas indicate the variability in the performance of the agents, which should be considered when interpreting the results.
</details>
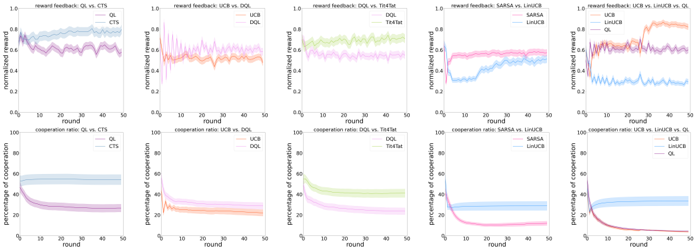
Fig. 3: Reward feedbacks and cooperation rates in some two-player and the three-player settings.
<details>
<summary>Image 3 Details</summary>
### Visual Description
## Chart Type: Multiple Line Graphs
### Overview
The image presents ten line graphs arranged in two rows of five. The top row displays "reward feedback" as a function of "round" for different algorithm comparisons. The bottom row shows the "cooperation ratio" as a function of "round" for the same algorithm comparisons. Each graph plots the performance of two or three algorithms over 50 rounds, with shaded regions indicating uncertainty or variance.
### Components/Axes
**General Axes:**
* **x-axis:** "round", ranging from 0 to 50 in increments of 10.
* **y-axis (top row):** "normalized reward", ranging from 0.0 to 1.0 in increments of 0.2.
* **y-axis (bottom row):** "percentage of cooperation", ranging from 0 to 100 in increments of 20.
**Specific Graph Details (Top Row - Reward Feedback):**
1. **Graph 1:** "reward feedback: QL vs. CTS"
* QL (light blue): Starts around 0.8, fluctuates, and stabilizes around 0.75.
* CTS (purple): Starts around 0.85, fluctuates, and stabilizes around 0.75.
2. **Graph 2:** "reward feedback: UCB vs. DQL"
* UCB (pink): Starts around 0.1, increases rapidly, and stabilizes around 0.7.
* DQL (orange): Starts around 0.1, increases rapidly, and stabilizes around 0.7.
3. **Graph 3:** "reward feedback: DQL vs. Tit4Tat"
* DQL (light green): Starts around 0.6, fluctuates slightly around 0.7.
* Tit4Tat (light orange): Starts around 0.6, fluctuates slightly around 0.7.
4. **Graph 4:** "reward feedback: SARSA vs. LinUCB"
* SARSA (pink): Starts around 0.4, increases to around 0.6.
* LinUCB (light blue): Starts around 0.3, increases to around 0.6.
5. **Graph 5:** "reward feedback: UCB vs. LinUCB vs. QL"
* UCB (orange): Starts around 0.4, increases to around 0.8.
* LinUCB (purple): Starts around 0.4, increases to around 0.7.
* QL (light blue): Starts around 0.2, fluctuates around 0.3.
**Specific Graph Details (Bottom Row - Cooperation Ratio):**
1. **Graph 1:** "cooperation ratio: QL vs. CTS"
* QL (light blue): Starts around 60, remains relatively stable.
* CTS (purple): Starts around 50, decreases to around 30.
2. **Graph 2:** "cooperation ratio: UCB vs. DQL"
* UCB (pink): Starts around 20, remains relatively stable.
* DQL (orange): Starts around 30, decreases to around 20.
3. **Graph 3:** "cooperation ratio: DQL vs. Tit4Tat"
* DQL (light green): Starts around 50, decreases to around 20.
* Tit4Tat (light orange): Starts around 50, decreases to around 20.
4. **Graph 4:** "cooperation ratio: SARSA vs. LinUCB"
* SARSA (pink): Starts around 50, decreases to around 10.
* LinUCB (light blue): Starts around 40, decreases to around 30.
5. **Graph 5:** "cooperation ratio: UCB vs. LinUCB vs. QL"
* UCB (orange): Starts around 40, decreases to around 10.
* LinUCB (purple): Starts around 40, decreases to around 10.
* QL (light blue): Starts around 40, remains relatively stable around 30.
### Detailed Analysis
**Reward Feedback (Top Row):**
* **QL vs. CTS:** Both algorithms perform similarly, with slight fluctuations around a normalized reward of 0.75.
* **UCB vs. DQL:** Both algorithms show a rapid increase in normalized reward, stabilizing around 0.7.
* **DQL vs. Tit4Tat:** Both algorithms maintain a relatively stable normalized reward around 0.7.
* **SARSA vs. LinUCB:** Both algorithms show an increase in normalized reward, reaching around 0.6.
* **UCB vs. LinUCB vs. QL:** UCB and LinUCB outperform QL, reaching higher normalized reward values.
**Cooperation Ratio (Bottom Row):**
* **QL vs. CTS:** QL maintains a higher and more stable cooperation ratio compared to CTS, which decreases over time.
* **UCB vs. DQL:** Both algorithms have relatively low and stable cooperation ratios.
* **DQL vs. Tit4Tat:** Both algorithms show a decrease in cooperation ratio over time.
* **SARSA vs. LinUCB:** Both algorithms show a decrease in cooperation ratio over time, with SARSA decreasing more sharply.
* **UCB vs. LinUCB vs. QL:** UCB and LinUCB show a decrease in cooperation ratio, while QL maintains a more stable ratio.
### Key Observations
* **Reward Feedback:** UCB and DQL algorithms tend to achieve higher normalized rewards compared to QL in some scenarios.
* **Cooperation Ratio:** QL tends to maintain a more stable cooperation ratio compared to other algorithms, which often decrease over time.
* **SARSA and LinUCB:** These algorithms show similar trends in both reward feedback and cooperation ratio.
* **Tit4Tat:** Performs similarly to DQL in both reward feedback and cooperation ratio.
### Interpretation
The graphs compare the performance of different reinforcement learning algorithms in terms of reward feedback and cooperation ratio over a series of rounds. The data suggests that the choice of algorithm can significantly impact both the achieved reward and the level of cooperation. QL appears to be more stable in maintaining cooperation, while UCB and DQL may achieve higher rewards in certain scenarios. The decreasing cooperation ratios for many algorithms suggest a potential trade-off between maximizing reward and maintaining cooperative behavior. The shaded regions indicate the variability in performance, highlighting the importance of considering the robustness of each algorithm.
</details>
## 5 Results: Algorithms' Tournament
Game settings. The payoffs are set as the classical IPD game: T = 5 , R = 3 , P = 1 , S = 0 . Following [42], we create create standardized payoff measures from the R, S, T, P values using two differences between payoffs associate with important game outcomes, both normalized by the difference between the temptation to defect and being a sucker when cooperating as the other defects.
State representations. In most IPD literature, the state is defined the pair of previous actions of self and opponent. Studies suggest that only one single previous state is needed to define any prisoner's dilemma strategy [41]. However, as we are interested in understanding the role of three levels of information (no information, with context but without state, and with both context and state), we expand the state representation to account for the past n pairs of actions as the history (or memory) for the agents. For CB algorithms, this history is their context. For RL algorithms, this history is their state representation. In the following sections, we will present the results in which the memory is set to be the past 5 action pairs.
Learning settings. In all experiments, the discount factor γ was set to be 0.95. The exploration is included with -greedy algorithm with set to be 0.05 (except for the algorithms that already have an exploration mechanism).
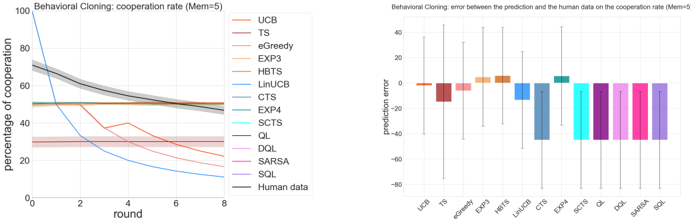
Fig. 4: Behavioral Cloning: bandits modeled human data the best with the lowest prediction error.
<details>
<summary>Image 4 Details</summary>
### Visual Description
## Chart Type: Behavioral Cloning Performance
### Overview
The image presents two charts related to behavioral cloning performance, specifically focusing on cooperation rate. The left chart is a line graph showing the percentage of cooperation over rounds for various algorithms and human data. The right chart is a bar graph displaying the prediction error between the algorithms and human data on the cooperation rate. Both charts are titled "Behavioral Cloning" and specify a memory parameter (Mem=5).
### Components/Axes
**Left Chart (Cooperation Rate):**
* **Title:** Behavioral Cloning: cooperation rate (Mem=5)
* **X-axis:** round (values from 0 to 8, incrementing by 2)
* **Y-axis:** percentage of cooperation (values from 0 to 100, incrementing by 20)
* **Legend (Top-Right):**
* UCB (light-coral)
* TS (brown)
* eGreedy (orange)
* EXP3 (dark-khaki)
* HBTS (dark-goldenrod)
* LinUCB (steelblue)
* CTS (cadetblue)
* EXP4 (medium-turquoise)
* SCTS (cyan)
* QL (purple)
* DQL (orchid)
* SARSA (violet)
* SQL (medium-purple)
* Human data (gray)
**Right Chart (Prediction Error):**
* **Title:** Behavioral Cloning: error between the prediction and the human data on the cooperation rate (Mem=5)
* **X-axis:** Algorithm names (UCB, TS, eGreedy, EXP3, HBTS, LinUCB, CTS, EXP4, SCTS, QL, DQL, SARSA, SQL)
* **Y-axis:** prediction error (values ranging from -80 to 40, incrementing by 20)
* **Colors:** The bars are colored to match the corresponding algorithms in the left chart's legend.
### Detailed Analysis
**Left Chart (Cooperation Rate):**
* **Human data (gray):** Starts at approximately 70% and gradually decreases to around 50% by round 8.
* **LinUCB (steelblue):** Starts at 100% and rapidly decreases to approximately 15% by round 8.
* **CTS (cadetblue):** Starts at approximately 50% and remains relatively stable around that value.
* **UCB (light-coral):** Starts at approximately 30%, dips slightly, then rises to approximately 25% by round 8.
* **TS (brown):** Starts at approximately 30%, dips slightly, then rises to approximately 20% by round 8.
The other algorithms (eGreedy, EXP3, HBTS, EXP4, SCTS, QL, DQL, SARSA, SQL) show relatively low cooperation rates, generally below 10-20% and remain relatively stable.
**Right Chart (Prediction Error):**
* **UCB (light-coral):** Prediction error is approximately 0.
* **TS (brown):** Prediction error is approximately -15.
* **eGreedy (orange):** Prediction error is approximately -5.
* **EXP3 (dark-khaki):** Prediction error is approximately 5.
* **HBTS (dark-goldenrod):** Prediction error is approximately 5.
* **LinUCB (steelblue):** Prediction error is approximately -10.
* **CTS (cadetblue):** Prediction error is approximately -30.
* **EXP4 (medium-turquoise):** Prediction error is approximately -1.
* **SCTS (cyan):** Prediction error is approximately -30.
* **QL (purple):** Prediction error is approximately -30.
* **DQL (orchid):** Prediction error is approximately -30.
* **SARSA (violet):** Prediction error is approximately -30.
* **SQL (medium-purple):** Prediction error is approximately -30.
The error bars indicate the variability in the prediction error for each algorithm.
### Key Observations
* LinUCB has a high initial cooperation rate that drops sharply over rounds.
* CTS maintains a relatively stable cooperation rate.
* The human data shows a gradual decrease in cooperation rate over rounds.
* CTS, SCTS, QL, DQL, SARSA, and SQL have the largest negative prediction errors.
* EXP3 and HBTS have small positive prediction errors.
### Interpretation
The charts compare the performance of various algorithms in mimicking human cooperation behavior through behavioral cloning. The cooperation rate chart shows how the algorithms' cooperation levels change over time, while the prediction error chart quantifies how well each algorithm's predictions match the actual human data.
The large negative prediction errors for CTS, SCTS, QL, DQL, SARSA, and SQL suggest that these algorithms consistently underestimate the human cooperation rate. Conversely, the small positive prediction errors for EXP3 and HBTS indicate a slight overestimation. LinUCB's rapid decline in cooperation rate suggests it may be overfitting to the initial conditions or failing to adapt effectively over time. The human data provides a baseline for comparison, showing a gradual decrease in cooperation, which the algorithms attempt to replicate with varying degrees of success.
</details>
The learning rate was polynomial α t ( s, a ) = 1 /n t ( s, a ) 0 . 8 , which was shown in previous work to be better in theory and in practice [16]. All experiments were performed and averaged for at least 100 runs, and over 50 steps of dueling actions from the initial state.
Reported measures. To capture the behavior of the algorithms, we report five measures: individual normalized rewards, collective normalized rewards, difference of normalized rewards, the cooperation rate and normalized reward feedback at each round. We are interested in the individual rewards since that is what online learning agents should effectively maximize their expected cumulative discounted reward for. We are interested in the collective rewards because it might offer important insights on the teamwork of the participating agents. We are interested in the difference between each individual player's reward and the average reward of all participating players because it might capture the internal competition within a team. We record the cooperation rate as the percentage of cooperating in all rounds since it is not only a probe for the emergence of strategies, but also the standard measure in behavioral modeling to compare human data and models [36,30,31]. Lastly, we provided reward feedback at each round as a diagnostic tool to understand the specific strategy emerged from each game. (The color codes throughout this paper are set constant for each of the 14 agents, such that all handcrafted agents have green-ish colors, MAB agents red-ish, CB agents blue-ish and RL agents purple-ish).
## 5.1 Multi-Agent Tournament
Results for two-agent tournament. We record the behaviors of the agents playing against each other (and with themselves). Figure 1 summarizes the reward and behavior patterns of the tournament. We first notice that MAB and RL algorithms learn to cooperate when their opponent is Coop , yielding a high mutual reward, while CB algorithms mostly decide to defect on Coop to exploit its trust. From the cooperation heatmap, we also observe that RL algorithms appear to be more defective when facing an MAB or CB algorithm than facing another RL algorithm. MAB algorithms are more defective when facing a CB algorithm than facing an RL or another MAB algorithm. Adversarial algorithms EXP3 and
EXP4 fail to learn any distinctive policy. We also note interesting teamwork and competition behaviors in the heatmaps of collective rewards and relative rewards: CB algorithms are the best team players, yielding an overall highest collective rewards, followed by RL; RL are the most competitive opponents, yielding an overall highest relative rewards, followed by MAB.
Figure 2 summarizes the averaged reward and cooperation for each of the three classes, where we observe handcrafted algorithms the best, followed by RL algorithms and then MAB algorithms. CB algorithms receive the lowest final rewards among the four agent classes. Surprisingly, it also suggests that a lower cooperation rate don't imply a higher reward. The most cooperative learning algorithm class is CB, followed by RL. MAB, the most defective agents, don't score the highest.
Detailed probing into specific games (Figure 3) uncovers more diverse strategies than these revealed by the cooperation rates. For instance, in the game of QL vs. CTS, we observe that CTS converges to a fixed cooperation rate within the first few rounds and stayed constant since then, while the QL gradually decays its cooperation rate. In the game of UCB1 vs. DQL, UCB1 seemed to oscillate between a high and low cooperation rate within the first few rounds (because it is built to explore all actions first), while DQL gradually decays its cooperation rate. In DQL vs. Tit4Tat, we observe a seemingly mimicking effect of DQL to a tit-for-tat-like behaviors. In the game of SARSA vs. LinUCB, LinUCB converges to a fixed cooperation rate with the first few rounds and stays constant since then, while SARSA slowly decays its cooperation rate. There seems to be a universality of the three classes within the first few rounds.
Cognitive interpretations of these learning systems. The main distinctions between the three classes of algorithms are the complexity of the learning mechanism and the cognitive system they adopt. In MAB setting, there is no attention to any contexts, and the agents aim to most efficiently allocate a fixed limited set of cognitive resources between competing (alternative) choices in a way that maximizes their expected gain. In CB setting, the agents apply an attention mechanism to the current context, and aim to collect enough information about how the context vectors and rewards relate to each other, so that they can predict the next best action to play by looking at the feature vectors. In RL setting, the agents not only pay attention to the current context, but also apply the attention mechanism to multiple contexts relate to different states, and aim to use the past experience to find out which actions lead to higher cumulative rewards. Our results suggest that in the Iterate Prisoner's Dilemma of two learning systems, an optimal learning policy should hold memory for different state representations and allocate attention to different contexts across the states, which explained the overall best performance by RL algorithms. This further suggests that in zero-sum games like the IPD, participating learning systems tend to undergo multiple states. The overall underperformance of CB suggests that the attention to only the current context was not sufficient without the state representation, because the learning system might mix the the context-dependent reward mappings of multiple states, which can oversimplify the policy and potentially mislead the
learning as an interfering effect. On the other hand, MAB ignores the context information entirely, so they are not susceptible to the interfering effect from the representations of different contexts. Their learned policies, however, don't exhibit any interesting flexibility to account for any major change in the state (e.g., the opponent may just finish a major learning episode and switch strategies).
Results for three-agent tournament. Here we wish to understand how all three classes of algorithms interact in the same arena. For each game, we pick one algorithm from each class (one from MAB, one from CB and one from RL) to make our player pool. We observe in Figure 2 a very similar pattern as the two-player case: RL agents demonstrate the best performance (highest final rewards) followed by MAB, and CB performed the worst. However, in three-agent setting, although CB is still the most cooperative, and RL became the most defective. More detailed probing into the specific games (Figure 3) demonstrate more diverse strategies than these revealed by the cooperation rates. Take the game UCB1 vs. LinUCB vs. QL as an example, MAB algorithms start off as the most defective but later start to cooperate more in following rounds, while RL algorithms became more and more defective. CB in both cases stays cooperative at a relatively high rate.
## 6 Behavioral Cloning with Human Data
We collate the human data comprising 168,386 individual decisions from many human subjects experiments [2,12,10] that used real financial incentives and transparently conveyed the rules of the game to the subjects. As a a standard procedure in experimental economics, subjects anonymously interact with each other and their decisions to cooperate or defect at each time period of each interaction are recorded. They receive payoffs proportional to the outcomes in the same or similar payoff as the one we use in Table 1. Following the similar preprocessing steps as [36,30,31], we can construct the comprehensive collection of game structures and individual decisions from the description of the experiments in the published papers and the publicly available data sets. This comprehensive dataset consists of behavioral trajectories of different time horizons, ranging from 2 to 30 rounds, but most of these experimental data only host full historical information of at most past 9 actions. We further select only those trajectories with these full historical information, which comprise 8,257 behavioral trajectories. We randomly select 8,000 of them as training set and the other 257 as test set.
In the training phase, all agents are trained with the demonstration rewards as feedback sequentially for the trajectories in the training set. In the testing phase, we paused all the learning, and tested on 257 trajectories independently, recorded their cooperation rate. In each test trajectory, we compared their evolution of cooperation rate to that of the human data and compute a prediction error.
Figure 4 summarizes the testing results of all the agents in predicting the actions and their cooperation rates from human data. From the heatmap of the cooperation rates, we observe that the behavioral policy that each agent cloned from the data varies by class. RL algorithms all seem to learn to defect at all
costs ('tragedy of the commons'). CB algorithms mostly converge to a policy that adopted a fixed cooperation rate. Comparing with the other two, MAB algorithms learn a more diverse cooperation rates across test cases. The line plot on the right confirms our understanding.The cooperation rate by the real humans (the black curve) tends to decline slowly from around 70% to around 40%. UCB1 and epsilon Greedy both captured the decaying properties, mimicing the strategy of the human actions. The prediction error analysis matches this intuition. The UCB1 and epsilon greedy (or MAB algorithms in general), appear to be best capturing human cooperation.
## 7 Clinical Evidences and Implications
Evidence has linked dopamine function to reinforcement learning via midbrain neurons and connections to the basal ganglia, limbic regions, and cortex. Neuron firing rates computationally represent reward magnitude, expectancy, and violations (prediction error) and other value-based signals [45], allowing an animal to update and maintain value expectations associated with particular states and actions. When functioning properly, this helps an animal develop a policy to maximize outcomes by approaching/choosing cues with higher expected value and avoiding cues associated with loss or punishment. This is similar to reinforcement learning widely used in computing and robotics [46], suggesting mechanistic overlap in humans and AI. Evidence of Q-learning and actor-critic models have been observed in spiking activity in midbrain dopamine neurons in primates [9] and in human striatum by blood-oxygen-level-dependent imaging (BOLD) [38].
The literature on the reward processing abnormalities in particular neurological and psychiatric disorders is quite extensive; below we summarize some of the recent developments in this fast-growing field. It is well-known that the neuromodulator dopamine plays a key role in reinforcement learning processes. Parkinson's disease (PD) patients, who have depleted dopamine in the basal ganglia, tend to have impaired performance on tasks that require learning from trial and error. For example, [17] demonstrate that off-medication PD patients are better at learning to avoid choices that lead to negative outcomes than they are at learning from positive outcomes, while dopamine medication typically used to treat PD symptoms reverses this bias. Alzheimer's disease (AD) is the most common cause of dementia in the elderly and, besides memory impairment, it is associated with a variable degree of executive function impairment and visuospatial impairment. As discussed in [40], AD patients have decreased pursuit of rewarding behaviors, including loss of appetite; these changes are often secondary to apathy, associated with diminished reward system activity. Moveover, poor performance on certain tasks is associated with memory impairments. Frontotemporal dementia (bvFTD) usually involves a progressive change in personality and behavior including disinhibition, apathy, eating changes, repetitive or compulsive behaviors, and loss of empathy [40], and it is hypothesized that those changes are associated with abnormalities in reward processing. For instance, alterations in eating habits with a preference for carbohydrate sweet rich foods and overeating in bvFTD
patients can be associated with abnormally increased reward representation for food, or impairment in the negative (punishment) signal associated with fullness. Authors in [34] suggest that the strength of the association between a stimulus and the corresponding response is more susceptible to degradation in Attentiondeficit/hyperactivity disorder (ADHD) patients, which suggests problems with storing the stimulus-response associations. Among other functions, storing the associations requires working memory capacity, which is often impaired in ADHD patients. [43] demonstrated that patients suffering from addictive behavior have heightened stimulus-response associations, resulting in enhanced reward-seeking behavior for the stimulus which generated such association. [47] suggested that chronic pain can elicit in a hypodopaminergic (low dopamine) state that impairs motivated behavior, resulting into a reduced drive in chronic pain patients to pursue the rewards. Reduced reward response may underlie a key system mediating the anhedonia and depression, which are common in chronic pain.
## 8 Discussion
The broader motivation of this work is to increase the two-way traffic between artificial intelligence and neuropsychiatry, in the hope that a deeper understanding of brain mechanisms revealed by how they function ('neuro') and dysfunction ('psychiatry') can provide for better AI models, and conversely AI can help to conceptualize the otherwise bewildering complexity of the brain.
The behavioral cloning results suggest that bandit algorithms (without context) are the best in term of fitting the human data, which open the hypothesis that human are not considering the context when they are playing the iterated prisoner's dilemma. This discovery proposes new modeling effort on human study in the bandit framework, and points to future experimental designs which incorporate these new parametric settings and control conditions. In particular, we propose that our approach may be relevant to study reward processing in different mental disorders, for which some mechanistic insights are available. A body of recent literature has demonstrated that a spectrum of neurological and psychiatric disease symptoms are related to biases in learning from positive and negative feedback [35]. Studies in humans have shown that when reward signaling in the direct pathway is over-expressed, this may enhance state value and incur pathological reward-seeking behavior, like gambling or substance use. Conversely, enhanced aversive error signals result in dampened reward experience thereby causing symptoms like apathy, social withdrawal, fatigue, and depression. Both genetic predispositions and experiences during critical periods of development can predispose an individual to learn from positive or negative outcomes, making them more or less at risk for brain-based illnesses [20]. This highlight our need to understand how intelligent systems learn from rewards and punishments, and how experience sampling may impact reinforcement learning during influential training periods. Simulation results of the mental variants matches many of the clinical implications presented here, but also points to other complications from the social setting that deserve future investigation.
The approach proposed in the present manuscript, we hope, will contribute to expand and deepen the dialogue between AI and neuropsychiatry.
## 9 Conclusion
In this work, we explore the full spectrum of online learning agents: multi-armed bandits, contextual bandits and reinforcement learning. To quantitatively study their behaviors, we evaluate them based on a series of tournaments of iterated prisoner's dilemma. This allows us to analyze the dynamics of policies learned by multiple self-interested independent reward driven agents, where we observe that the contextual bandit is not performing well in the tournament, which means that considering the current situation to make decision is the worst in this kind of game. Basically we should either not care about the current situation or caring about more situations, but not just the current one. We have also studied the capacity of these algorithms to fit the human behavior. We observed that bandit algorithms (without context) are the best in term of fitting the human data, which opens the hypothesis that human are not considering the context when they are playing the IPD. Next steps include extending our evaluations to other sequential social dilemma environments with more complicated and mixed incentive structure, such as fruit Gathering game and Wolfpack hunting game [25,49], comparing these mechanistic decision making models with predictive modeling surrogate models [30,31], and building reinforcement learning-based recommendation systems that model properties of human decision making [27].
## References
1. Agrawal, S., Goyal, N.: Thompson sampling for contextual bandits with linear payoffs. In: ICML (3). pp. 127-135 (2013)
2. Andreoni, J., Miller, J.H.: Rational cooperation in the finitely repeated prisoner's dilemma: Experimental evidence. Econ. J. 103 (1993)
3. Auer, P., Cesa-Bianchi, N., Fischer, P.: Finite-time analysis of the multiarmed bandit problem. Machine Learning 47 (2-3), 235-256 (2002)
4. Auer, P., Cesa-Bianchi, N., Freund, Y., Schapire, R.E.: The nonstochastic multiarmed bandit problem. SIAM Journal on Computing 32 (1) (2002)
5. Axelrod, R.: Effective choice in the prisoner's dilemma. Journal of conflict resolution 24 (1980)
6. Axelrod, R., Hamilton, W.D.: The evolution of cooperation. Science (1981)
7. Balakrishnan, A., Bouneffouf, D., Mattei, N., Rossi, F.: Incorporating behavioral constraints in online AI systems. In: Proceedings of AAAI (2019)
8. Balakrishnan, A., Bouneffouf, D., Mattei, N., Rossi, F.: Using multi-armed bandits to learn ethical priorities for online ai systems. IBM Journal of Research and Development 63 (2019)
9. Bayer, H.M., Glimcher, P.W.: Midbrain Dopamine Neurons Encode a Quantitative Reward Prediction Error Signal. Neuron 47 (1), 129-141 (jul 2005)
10. Bereby-Meyer, Y., Roth, A.E.: The speed of learning in noisy games: Partial reinforcement and the sustainability of cooperation. American Economic Review 96 (4), 1029-1042 (2006)
11. Beygelzimer, A., Langford, J., Li, L., Reyzin, L., Schapire, R.: Contextual bandit algorithms with supervised learning guarantees. In: AISTATS (2011)
12. Bó, P.D.: Cooperation under the shadow of the future: experimental evidence from infinitely repeated games. American economic review 95 (2005)
13. Bouneffouf, D., Rish, I.: A survey on practical applications of multi-armed and contextual bandits. CoRR abs/1904.10040 (2019)
14. Bouneffouf, D., Rish, I., Cecchi, G.A.: Bandit models of human behavior: Reward processing in mental disorders. In: AGI. Springer (2017)
15. Capraro, V.: A model of human cooperation in social dilemmas. PloS one 8 (8) (2013)
16. Even-Dar, E., Mansour, Y.: Learning rates for q-learning. Journal of Machine Learning Research 5 (Dec), 1-25 (2003)
17. Frank, M.J., Seeberger, L.C., O'reilly, R.C.: By carrot or by stick: cognitive reinforcement learning in parkinsonism. Science 306 (5703), 1940-1943 (2004)
18. Gupta, Gaurav: Obedience-based multi-agent cooperation for sequential social dilemmas (2020)
19. Hasselt, H.V.: Double q-learning. In: NIPS (2010)
20. Holmes, A.J., Patrick, L.M.: The Myth of Optimality in Clinical Neuroscience. Trends in Cognitive Sciences 22 (3), 241-257 (feb 2018)
21. Johnson, A., Proctor, R.W.: Attention: Theory and practice. Sage (2004)
22. Kies, M.: Finding best answers for the iterated prisoner's dilemma using improved q-learning. Available at SSRN 3556714 (2020)
23. Lai, T.L., Robbins, H.: Asymptotically efficient adaptive allocation rules. Advances in Applied Mathematics 6 (1), 4-22 (1985)
24. Langford, J., Zhang, T.: The epoch-greedy algorithm for multi-armed bandits with side information. In: NIPS (2008)
25. Leibo, J.Z., Zambaldi, V., Lanctot, M., Marecki, J., Graepel, T.: Multi-agent reinforcement learning in sequential social dilemmas. arXiv preprint (2017)
26.
Li, L., Chu, W., Langford, J., Wang, X.: Unbiased offline evaluation of contextual- bandit-based news article recommendation algorithms. In: WSDM (2011)
27. Lin, B.: Supervisorbot: Nlp-annotated real-time recommendations of psychotherapy treatment strategies with deep reinforcement learning. arXiv preprint (2022)
28. Lin, B., Bouneffouf, D., Cecchi, G.: Split q learning: reinforcement learning with two-stream rewards. In: Proceedings of the 28th IJCAI (2019)
29. Lin, B., Bouneffouf, D., Cecchi, G.: Unified models of human behavioral agents in bandits, contextual bandits, and rl. arXiv preprint arXiv:2005.04544 (2020)
30. Lin, B., Bouneffouf, D., Cecchi, G.: Predicting human decision making in psychological tasks with recurrent neural networks. PloS one 17 (5), e0267907 (2022)
31. Lin, B., Bouneffouf, D., Cecchi, G.: Predicting human decision making with lstm. In: 2022 International Joint Conference on Neural Networks (IJCNN) (2022)
32. Lin, B., Bouneffouf, D., Reinen, J., Rish, I., Cecchi, G.: A story of two streams: Reinforcement learning models from human behavior and neuropsychiatry. In: Proceedings of the 19th AAMAS. pp. 744-752 (2020)
33. Lin, B., Cecchi, G., Bouneffouf, D., Reinen, J., Rish, I.: Models of human behavioral agents in bandits, contextual bandits and rl. In: International Workshop on Human Brain and Artificial Intelligence. pp. 14-33. Springer (2021)
34. Luman, M., Van Meel, C.S., Oosterlaan, J., Sergeant, J.A., Geurts, H.M.: Does reward frequency or magnitude drive reinforcement-learning in attentiondeficit/hyperactivity disorder? Psychiatry research 168 (3) (2009)
35. Maia, T.V., Frank, M.J.: From reinforcement learning models to psychiatric and neurological disorders. Nature Neuroscience 14 (2), 154-162 (2011)
36. Nay, J.J., Vorobeychik, Y.: Predicting human cooperation. PloS one (2016)
37. Noothigattu, R., Bouneffouf, D., Mattei, N., Chandra, R., Madan, P., Varshney, K.R., Campbell, M., Singh, M., Rossi, F.: Teaching AI agents ethical values using reinforcement learning and policy orchestration. In: Proceedings of the 28th IJCAI. pp. 6377-6381 (2019)
38. O'Doherty, J., Dayan, P., Schultz, J., Deichmann, R., Friston, K., Dolan, R.J.: Dissociable Roles of Ventral and Dorsal Striatum in Instrumental. Science 304 (16 April), 452-454 (2004)
39. Park, H., Kim, K.J.: Active player modeling in the iterated prisoner's dilemma. Computational intelligence and neuroscience 2016 (2016)
40. Perry, D.C., Kramer, J.H.: Reward processing in neurodegenerative disease. Neurocase 21 (1), 120-133 (2015)
41. Press, W.H., Dyson, F.J.: Iterated prisoner's dilemma contains strategies that dominate any evolutionary opponent. PNAS 109 (26), 10409-10413 (2012)
42. Rapoport, A., Chammah, A.M., Orwant, C.J.: Prisoner's dilemma: A study in conflict and cooperation, vol. 165. University of Michigan press (1965)
43. Redish, A.D., Jensen, S., Johnson, A., Kurth-Nelson, Z.: Reconciling reinforcement learning models with behavioral extinction and renewal: implications for addiction, relapse, and problem gambling. Psychological review 114 (3), 784 (2007)
44. Rummery, G.A., Niranjan, M.: On-line Q-learning using connectionist systems, vol. 37. University of Cambridge, Cambridge, England (1994)
45. Schultz, W., Dayan, P., Montague, P.R.: A Neural Substrate of Prediction and Reward. Science 275 (5306), 1593-1599 (mar 1997)
46. Sutton, R.S., Barto, A.G., et al.: Introduction to reinforcement learning, vol. 135. MIT Press (1998)
47. Taylor, A.M., Becker, S., Schweinhardt, P., Cahill, C.: Mesolimbic dopamine signaling in acute and chronic pain: implications for motivation, analgesia, and addiction. Pain 157 (6), 1194 (2016)
48. Thompson, W.: On the likelihood that one unknown probability exceeds another in view of the evidence of two samples. Biometrika (1933)
49. Wang, W., Hao, J., Wang, Y., Taylor, M.: Towards cooperation in sequential prisoner's dilemmas: a deep multiagent reinforcement learning approach. arXiv preprint arXiv:1803.00162 (2018)