## A NOVEL MULTI-STEP FINITE-STATE AUTOMATON FOR ARBITRARILY DETERMINISTIC TSETLIN MACHINE LEARNING
## A PREPRINT
## K. Darshana Abeyrathna
Centre for Artificial Intelligence Research University of Agder Grimstad, Norway darshana.abeyrathna@uia.no
## Rishad Shafik
Microsystems Research Group School of Engineering Newcastle University, UK rishad.shafik@newcastle.ac.uk
## Adrian Wheeldon
## Ole-Christoffer Granmo
Centre for Artificial Intelligence Research University of Agder Grimstad, Norway ole.granmo@uia.no
## Alex Yakovlev
Microsystems Research Group School of Engineering Newcastle University, UK alex.yakovlev@newcastle.ac.uk
Jie Lei
Microsystems Research Group School of Engineering Newcastle University, UK adrian.wheeldon@newcastle.ac.uk
## Morten Goodwin
Centre for Artificial Intelligence Research University of Agder Grimstad, Norway morten.goodwin@uia.no
July 7, 2020
## ABSTRACT
Due to the high energy consumption and scalability challenges of deep learning, there is a critical need to shift research focus towards dealing with energy consumption constraints. Tsetlin Machines (TMs) are a recent approach to machine learning that has demonstrated significantly reduced energy usage compared to neural networks alike, while performing competitively accuracy-wise on several benchmarks. However, TMs rely heavily on energy-costly random number generation to stochastically guide a team of Tsetlin Automata to a Nash Equilibrium of the TM game. In this paper, we propose a novel finite-state learning automaton that can replace the Tsetlin Automata in TM learning, for increased determinism. The new automaton uses multi-step deterministic state jumps to reinforce sub-patterns. Simultaneously, flipping a coin to skip every d 'th state update ensures diversification by randomization. The d -parameter thus allows the degree of randomization to be finely controlled. E.g., d = 1 makes every update random and d = ∞ makes the automaton completely deterministic. Our empirical results show that, overall, only substantial degrees of determinism reduces accuracy. Energy-wise, random number generation constitutes switching energy consumption of the TM, saving up to 11 mW power for larger datasets with high d values. We can thus use the new d -parameter to trade off accuracy against energy consumption, to facilitate low-energy machine learning.
Microsystems Research Group School of Engineering Newcastle University, UK jie.lei@newcastle.ac.uk
## 1 Introduction
State-of-the-art deep learning (DL) requires massive computational resources, resulting in high energy consumption [1] and scalability challenges [2]. There is thus a critical need to shift research focus towards dealing with energy consumption constraints [3]. Tsetlin Machines [4] (TMs) are a recent approach to machine learning (ML) that has demonstrated significantly reduced energy usage compared to neural networks alike [5]. Using a linear combination of conjunctive clauses in propositional logic, the TM has obtained competitive performance in terms of accuracy [6, 7, 8], memory footprint [5, 8], energy [5], and learning speed [5, 8] on diverse benchmarks (image classification, regression and natural language understanding). Furthermore, the rules that TMs build seem to be interpretable, similar to the branches in a decision tree (e.g., in the form if X satisfies condition A and not condition B then Y = 1) [6]. The reported small memory footprint and low energy consumption make the TM particularly attractive for addressing the scalability and energy challenge in ML.
Recent progress on TMs. Recent research reports several distinct TM properties. The TM can be used in convolution, providing competitive performance on MNIST, Fashion-MNIST, and Kuzushiji-MNIST, in comparison with CNNs, K-Nearest Neighbor, Support Vector Machines, Random Forests, Gradient Boosting, BinaryConnect, Logistic Circuits and ResNet [8]. The TM has also achieved promising results in text classification by using the conjunctive clauses to capture textual patterns [6]. By introducing clause weights, it has been demonstrated that the number of clauses can be reduced by up to 50 × , without loss of accuracy [9]. Further, hyper-parameter search can be simplified with multi-granular clauses, eliminating the pattern specificity parameter [10]. By indexing the clauses on the features that falsify them, up to an order of magnitude faster inference and learning has been reported [11]. Additionally, regression TMs compare favorably with Regression Trees, Random Forest Regression, and Support Vector Regression [7]. In [12], the TM is equipped with integer weighted clauses, learnt by a stochastic searching on the line (SSL) automaton. The integer weighted TM outperforms simple Multi-Layered Artificial Neural Networks, Decision Trees, Support Vector Machines, K-Nearest Neighbor, Random Forest, Gradient Boosted Trees (XGBoost), Explainable Boosting Machines (EBMs), as well as the standard TM. For continuous features, a scheme for adaptive threshold-based binarization using SSLs was proposed in [13]. Instead of using TAs to represent all unique thresholds, as in [14], merely two SSLs per feature adaptively adjust the thresholds. Finally, TMs have recently been shown to be fault-tolerant, completely masking stuck-at faults [15].
Paper Contributions. TMs rely heavily on energy-costly random number generation to stochastically guide a team of TAs to a Nash Equilibrium of the TM game. In this paper, we propose a novel finite state learning automaton that can replace the TAs of the TM, for increased determinism. The new automaton uses multi-step deterministic state jumps to reinforce sub-patterns. Simultaneously, flipping a coin to skip every d 'th state update ensures diversification by randomization. The d -parameter thus allows the degree of randomization to be finely controlled. We further evaluate the scheme empirically on five datasets, demonstrating that the new d -parameter can be used to trade off accuracy against energy consumption.
## 2 A Multi-Step Finite-State Learning Automaton
The origins of Learning Automata (LA) [16] can be traced back to the work of M. L. Tsetlin in the early 1960s [17]. The objective of an LA is to learn the optimal action through trial and error in a stochastic environment. Various types of LAs are available depending on the nature of the application [18]. Due to their computational simplicity, we here focus on two-action finite-state LA, which we extend by introducing a novel periodically changing structure (variable structure).
In general, the action that an LA performs next is decided by the present state of the LA (the memory). An LA interacts with its environment iteratively. In each iteration, the environment randomly produces a reward or a penalty, responding to the action selected by the LA according to an unknown probability distribution. If the LA receives a reward, it reinforces the action performed by moving to a 'deeper' state. If the action results in a penalty, the LA state moves towards the middle state, to weaken the performed action, ultimately jumping to the other action. In this manner, with a sufficient number of states, a LA converges to the action with the highest probability of producing rewards - the optimal action - with probability arbitrarily close to 1 . 0 [16].
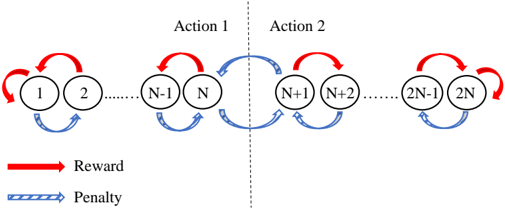
The transitions between states can be be deterministic or stochastic. Deterministic transitions occur with probability 1 . 0 , while stochastic transitions are randomly performed based on a preset probability. If the transition probabilities are changing, we have a variable structure automaton, otherwise, we have one with fixed structure. The pioneering Tsetlin Automaton (TA), depicted in Figure 1, is a deterministic fixed-structure finite-state automaton [17]. The state transition graph in the figure depicts a TA with 2 N memory states. States 1 to N maps to Action 1 and states N +1 to 2 N maps to Action 2.
Action 1 Action 2
1 2 3 ....… N-3 N-2 N-1 N N+1 N+2 N+3 N+4 ……. 2N-2 2N-1 2N
Figure 1: Transition graph of a two-action Tsetlin Automaton with 2N memory states.
<details>
<summary>Image 1 Details</summary>
### Visual Description
## Diagram: Sequential Action-Reward/Penalty System
### Overview
The diagram illustrates a sequential decision-making process involving two distinct actions (Action 1 and Action 2) with nodes labeled 1 to 2N. Arrows indicate transitions between nodes, with red arrows representing rewards and blue arrows representing penalties. A dashed vertical line separates the two actions, emphasizing their distinct operational domains.
### Components/Axes
- **Nodes**: Labeled sequentially from 1 to 2N, divided into two groups:
- **Action 1**: Nodes 1 to N
- **Action 2**: Nodes N+1 to 2N
- **Arrows**:
- **Red (Reward)**: Connect consecutive nodes within each action (e.g., 1→2, N-1→N, N+1→N+2, 2N-1→2N).
- **Blue (Penalty)**: Connect nodes across the dashed line (e.g., N→N+1, N+1→N).
- **Legend**: Located at the bottom, explicitly labeling red as "Reward" and blue as "Penalty".
- **Dashed Line**: Vertically divides the diagram into "Action 1" (left) and "Action 2" (right).
### Detailed Analysis
- **Action 1 (Nodes 1–N)**:
- Nodes are connected in a linear sequence via red arrows, indicating a reward-driven flow.
- Example transitions: 1→2, 2→3, ..., N-1→N.
- **Action 2 (Nodes N+1–2N)**:
- Similarly structured with red arrows connecting consecutive nodes: N+1→N+2, ..., 2N-1→2N.
- **Cross-Action Transitions**:
- Blue arrows (penalties) link the terminal node of Action 1 (N) to the initial node of Action 2 (N+1) and vice versa.
- Example transitions: N→N+1 (penalty), N+1→N (penalty).
### Key Observations
1. **Symmetry**: Both actions have identical internal reward structures (N nodes with sequential red arrows).
2. **Penalty Mechanism**: Switching between actions incurs penalties, represented by bidirectional blue arrows between nodes N and N+1.
3. **Cyclical Flow**: Within each action, nodes form a closed loop (e.g., 1→2→...→N→1), suggesting repetitive reward accumulation.
### Interpretation
This diagram likely models a **reinforcement learning environment** where an agent must choose between two action sequences (Action 1 or Action 2) to maximize cumulative rewards. The penalty for switching actions suggests a trade-off between exploiting high-reward sequences and exploring alternative paths. The symmetry implies equal viability of both actions, but the penalty discourages frequent switching, favoring consistency within a single action sequence. The cyclical nature of each action hints at a Markov decision process with finite states and deterministic transitions.
</details>
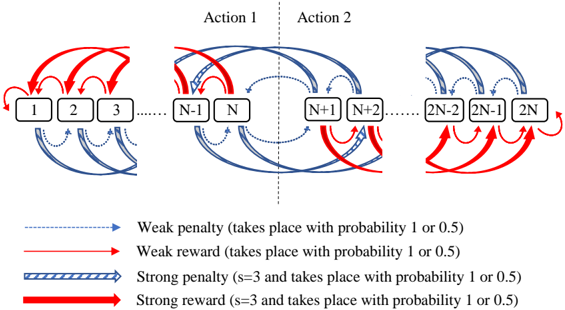
Figure 2: Transition graph of the Multi-Step Variable Structure Finite-State Learning Automaton.
<details>
<summary>Image 2 Details</summary>
### Visual Description
## Diagram: Action-Based Reward/Penalty Flowchart
### Overview
The diagram illustrates a two-phase process (Action 1 and Action 2) involving sequential node transitions with probabilistic rewards and penalties. Nodes are labeled numerically (1 to 2N), split into two groups: 1–N (left) and N+1–2N (right). Arrows represent transitions between nodes, differentiated by color/style to denote reward/penalty strength and probability.
### Components/Axes
- **Nodes**:
- Left group: 1, 2, 3, ..., N-1, N
- Right group: N+1, N+2, ..., 2N-2, 2N-1, 2N
- **Arrows**:
- **Red solid**: Strong reward (s=3, probability 1 or 0.5)
- **Blue dashed**: Weak penalty (probability 1 or 0.5)
- **Blue striped**: Strong penalty (s=3, probability 1 or 0.5)
- **Red dashed**: Weak reward (probability 1 or 0.5)
- **Legend**: Located at the bottom, centered. Colors/styles map to reward/penalty types.
- **Actions**:
- **Action 1**: Left-to-right flow (nodes 1–N).
- **Action 2**: Right-to-left flow (nodes N+1–2N).
### Detailed Analysis
1. **Action 1 (Left Group)**:
- Nodes 1–3: Red solid arrows (strong reward) point to N-1 and N.
- Nodes N-1 and N: Blue dashed arrows (weak penalty) loop back to earlier nodes (1–3).
- Nodes 4–N: Mixed red dashed (weak reward) and blue dashed (weak penalty) arrows.
2. **Action 2 (Right Group)**:
- Nodes N+1 and N+2: Blue dashed arrows (weak penalty) point to 2N-2 and 2N-1.
- Nodes 2N-2 and 2N-1: Red solid arrows (strong reward) point to 2N.
- Node 2N: Red dashed arrows (weak reward) loop back to N+1 and N+2.
3. **Probabilities**:
- Weak penalties/rewards: 50% chance (probability 0.5) or certainty (1).
- Strong penalties/rewards: s=3 (magnitude) with same probabilities.
### Key Observations
- **Feedback Loops**: Arrows from N-1/N and 2N-2/2N-1 loop back to earlier nodes, suggesting cyclical processes.
- **Asymmetry**: Action 1 emphasizes rewards (red arrows dominate), while Action 2 focuses on penalties (blue arrows dominate).
- **Node 2N**: Acts as a terminal node with weak reward feedback to Action 2’s start.
### Interpretation
The diagram models a decision-making system where actions trigger state transitions with probabilistic outcomes. Action 1 prioritizes high-reward paths (strong rewards to N-1/N), while Action 2 introduces risk via penalties (weak penalties to 2N-2/2N-1). Feedback loops imply iterative refinement or failure recovery. The use of "s=3" for strong penalties/rewards suggests a scaling factor for impact magnitude.
**Notable Anomalies**:
- Node 2N’s weak reward feedback to Action 2’s start creates a closed loop, potentially indicating a reset mechanism.
- Mixed arrow types within nodes 4–N (Action 1) suggest variable outcomes for intermediate states.
This structure could represent a reinforcement learning environment, workflow optimization, or risk-reward analysis framework. The probabilistic nature of transitions highlights uncertainty in outcomes, critical for modeling real-world systems.
</details>
While the TA changes state in single steps, the deterministic Krinsky Automaton introduces multi-step state transitions [16]. The purpose is to reinforce an action more strongly when it is rewarded, and more weakly when penalized. The Krinsky Automaton behaves as a TA when the response from the environment is a penalty. However, when it is a reward, any state from 2 to N transitions to state 1 , and any state from N +1 to 2 N -1 transitions to state 2 N . In effect, N consecutive penalties are needed to offset a single reward.
Another variant of LA is the Krylov Automaton. A Krylov Automaton makes both deterministic and stochastic single-step transitions [16]. The state transitions of the Krylov Automaton is identical to those of a TA for rewards. However, when it receives a penalty, it performs the corresponding TA state change randomly, with probability 0 . 5 .
We now introduce our new type of LA, the multi-step variable-structure finite-state LA (MVF-LA), shown in Figure 2. The MVF-LA has two kinds of feedback, strong and weak. As covered in the next section, strong feedback is required by the TM to strongly reinforce frequent sub-patterns, while weak feedback is required to make the TM forget infrequent ones. To achieve this, weak feedback only triggers one-step transitions. Strong feedback, on the other hand, triggers s -step transitions. Thus, a single strong feedback is offset by s instances of weak feedback. Further, MVF-LA has a variable structure that changes periodically . That is, the MVF-LA switches between two different transition graph structures, one deterministic and one stochastic. The deterministic structure is as shown in the figure, while the stochastic structure introduces a transition probability 0 . 5 , for every transition. The switch between structure is performed so that every d 'th transition is stochastic, while the remaining transitions are deterministic.
## 3 The Arbitrarily Deterministic TM (ADTM)
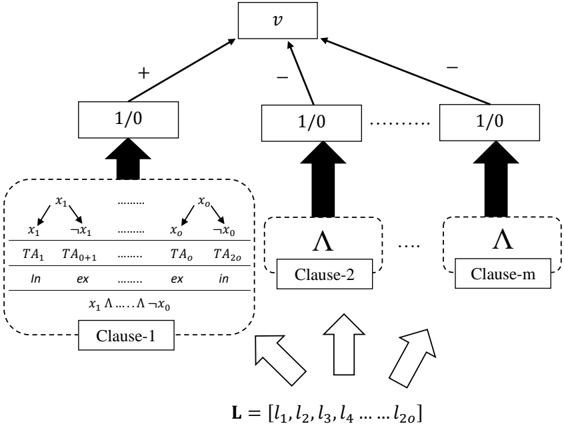
In this section, we introduce the details of the ADTM, shown in Figure 3, where the TA is replaced with the new MVF-LA. The purpose of the ADTM is to control stochasticity, thus allowing management of energy consumption.
## 3.1 ADTMInference
Input Features. Like the TM, an ADTM takes a feature vector of o propositional variables as input, X = [ x 1 , x 2 , x 3 , . . . , x o ] , to be classified into one of two classes, y = 0 or y = 1 . These features are extended with their negation, to produce a set of literals: L = [ x 1 , x 2 , . . . , x o , ¬ x 1 , ¬ x 2 , . . . , ¬ x o ] =[ l 1 , l 2 , . . . , l 2 o ] .
Figure 3: The ADTM structure.
<details>
<summary>Image 3 Details</summary>
### Visual Description
## Flowchart Diagram: Logical/Computational Process
### Overview
The diagram illustrates a hierarchical structure with a central node labeled "v" branching into three identical nodes labeled "1/0". Each "1/0" node connects to a clause (Clause-1, Clause-2, Clause-m), which then feed into a list L = [l₁, l₂, l₃, ..., l₂₀]. The leftmost section contains a detailed table with variables, transformations, and logical operators.
### Components/Axes
1. **Central Node**:
- Label: "v" (top-center)
- Connections:
- "+" arrow to left "1/0" node
- "-" arrow to middle "1/0" node
- "-" arrow to right "1/0" node
2. **"1/0" Nodes**:
- Three identical nodes arranged horizontally below "v"
- Each connects upward to "v" and downward to a clause
3. **Clauses**:
- Clause-1 (left): Contains a table with variables and transformations
- Clause-2 (middle): Simple label
- Clause-m (right): Simple label
4. **List L**:
- Positioned at bottom-center
- Contains elements l₁ to l₂₀
- Connected by arrows from all three clauses
5. **Left Table (Clause-1 Details)**:
- Variables: x₁, x₀, x₁', x₀'
- Transformations:
- "In" ↔ "ex"
- "TA₁" ↔ "TA₀₊₁"
- "TA₀" ↔ "TA₂₀"
- Logical operators: Λ (lambda), ¬ (negation)
### Detailed Analysis
- **Top Section**:
- "v" acts as a root node with dual polarity (+/-) influencing three identical "1/0" nodes
- Arrows suggest conditional branching based on "v"
- **Clause-1 Table**:
- Variables x₁ and x₀ appear in pairs with primed/non-primed states
- Transformations suggest state changes ("In"↔"ex", "TA" subscripts)
- Logical operators Λ and ¬ indicate boolean operations
- **Clause Connections**:
- Clause-1 contains detailed variable logic
- Clause-2 and Clause-m are abstracted as generic clauses
- All clauses feed into list L through downward arrows
- **List L**:
- Contains 20 elements (l₁ to l₂₀)
- Positioned as final output of the process
- Arrows from clauses suggest aggregation or combination
### Key Observations
1. Symmetry in "1/0" nodes suggests binary decision points
2. Clause-1's table implies complex state transformations
3. List L's size (20 elements) may represent output states or results
4. Use of Λ (lambda) suggests function application or binding
5. ¬ (negation) indicates inverse logic operations
### Interpretation
This diagram appears to represent a computational logic process or formal system:
- "v" could represent a variable or initial condition
- The "1/0" nodes may represent binary states or decisions
- Clauses process these states through transformations (Clause-1's table) and logical operations
- List L likely represents the final output states or results
- The structure resembles a state machine or formal proof system, with Clause-1 showing detailed variable manipulation while later clauses abstract the process
- The use of mathematical notation (Λ, ¬) and binary states suggests formal logic or computer science applications
- The hierarchical flow from "v" to clauses to L implies a top-down processing model
</details>
Clauses. Patterns are represented by m conjunctive clauses. As shown for Clause-1 in the figure, a clause in the TM comprises of 2 o TAs, each controlling the inclusion of a specific literal. Let the set I j , I j ⊆ { 1 , . . . , 2 o } denote the indexes of the literals that are included in clause j . When evaluating clause j on input literals L , the literals included in the clause are ANDed: c j = ∧ k ∈ I j l k , j = 1 , . . . , m . Note that the output of an empty clause, I j = ∅ , is 1 during learning and 0 during inference.
Classification. In order to identify the sub-patterns associated with both of the classes of a two-class ADTM, the clauses are grouped in two. The number of clauses employed is a user set parameter m . Half of the clauses are assigned positive polarity ( c + j ). The other half is assigned negative polarity ( c -j ). The clause outputs, in turn, are combined into a classification decision through summation and thresholding using the unit step function u ( v ) = 1 if v ≥ 0 else 0 :
<!-- formula-not-decoded -->
That is, classification is based on a majority vote, with the positive clauses voting for y = 0 and the negative for y = 1 .
## 3.2 The MVF-LA Game and Orchestration Scheme
The MVF-LAs in ADTM are updated by so-called Type I and Type II feedback. Depending on the class of the current training sample ( X,y ) and the polarity of the clause (positive or negative), the type of feedback is decided. Clauses with positive polarity receive Type I feedback when the target output is y = 1 , and Type II feedback when the target output is y = 0 . For clauses with negative polarity, Type I feedback replaces Type II, and vice versa. In the following, we focus only on clauses with positive polarity.
Type I feedback: The number of clauses which receive Type I feedback is controlled by selecting them stochastically according to Eqn. 2:
<!-- formula-not-decoded -->
Above, v = ∑ m/ 2 j =1 c + j ( X ) -∑ m/ 2 j =1 c -j ( X ) is the aggregated clause output and T is a user set parameter that decides how many clauses should be involved in learning a particular sub-pattern. Further, Type I feedback consists of two kinds of sub-feedback: Type Ia and Type Ib. Type Ia feedback stimulates recognition of patterns by reinforcing the include action of MVF-LAs whose corresponding literal value is 1 , however, only when the clause output also is 1 . Note that an action is reinforced either by rewarding the action itself, or by penalizing the other action. Type Ia feedback is strong , with step size s (cf. Figure 2). Type Ib feedback combats over-fitting by reinforcing the exclude actions of MVF-LAs when the corresponding literal is 0 or when the clause output is 0 . Type Ib feedback is weak to facilitate learning of frequent patterns (cf. Figure 2).
Table 1: Performance of TM and ADTM with different d on Bankruptcy dataset.
| | TM | ADTM | ADTM | ADTM | ADTM | ADTM | ADTM |
|------|-------|--------|--------|--------|--------|--------|--------|
| | TM | d=1 | d=10 | d=100 | d=500 | d=1000 | d=5000 |
| F1 | 0.998 | 1.000 | 1.000 | 1.000 | 0.999 | 0.999 | 0.988 |
| Acc. | 0.998 | 1.000 | 1.000 | 1.000 | 0.999 | 0.999 | 0.987 |
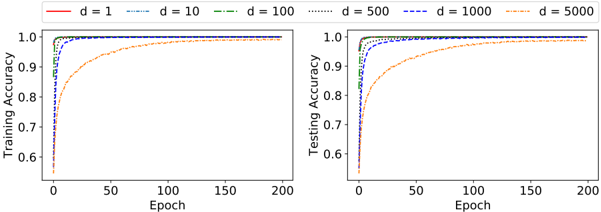
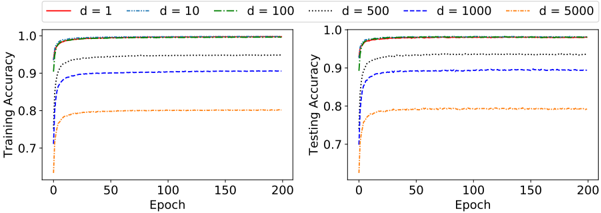
Figure 4: Training and testing accuracy per epoch on the Bankruptcy dataset.
<details>
<summary>Image 4 Details</summary>
### Visual Description
## Line Graphs: Training and Testing Accuracy vs. Epochs for Different Dimensions
### Overview
The image contains two line graphs comparing training and testing accuracy across different model dimensions (d=1, 10, 100, 500, 1000, 5000) over 200 training epochs. Both graphs share identical axes and legend structures but differ in their y-axis labels ("Training Accuracy" vs. "Testing Accuracy").
### Components/Axes
- **X-Axis**: Epochs (0 to 200, linear scale)
- **Y-Axis (Left Chart)**: Training Accuracy (0.6 to 1.0, linear scale)
- **Y-Axis (Right Chart)**: Testing Accuracy (0.6 to 1.0, linear scale)
- **Legend**: Located in the top-left corner, with six line styles:
- Red solid: d=1
- Blue dashed: d=10
- Green dash-dot: d=100
- Orange dotted: d=500
- Purple dash-dot-dot: d=1000
- Yellow solid-dot: d=5000
### Detailed Analysis
#### Training Accuracy (Left Chart)
- **d=1 (Red)**: Starts at ~0.6, rises sharply to ~0.95 by epoch 50, plateaus at ~0.98 by epoch 100.
- **d=10 (Blue)**: Begins at ~0.65, reaches ~0.92 by epoch 50, plateaus at ~0.97 by epoch 100.
- **d=100 (Green)**: Starts at ~0.68, climbs to ~0.94 by epoch 50, plateaus at ~0.98 by epoch 100.
- **d=500 (Orange)**: Begins at ~0.7, rises to ~0.95 by epoch 50, plateaus at ~0.99 by epoch 100.
- **d=1000 (Purple)**: Starts at ~0.72, reaches ~0.96 by epoch 50, plateaus at ~0.99 by epoch 100.
- **d=5000 (Yellow)**: Begins at ~0.75, climbs to ~0.97 by epoch 50, plateaus at ~0.995 by epoch 100.
#### Testing Accuracy (Right Chart)
- **d=1 (Red)**: Starts at ~0.6, rises to ~0.85 by epoch 50, plateaus at ~0.92 by epoch 100.
- **d=10 (Blue)**: Begins at ~0.63, reaches ~0.88 by epoch 50, plateaus at ~0.94 by epoch 100.
- **d=100 (Green)**: Starts at ~0.66, climbs to ~0.90 by epoch 50, plateaus at ~0.96 by epoch 100.
- **d=500 (Orange)**: Begins at ~0.68, rises to ~0.92 by epoch 50, plateaus at ~0.97 by epoch 100.
- **d=1000 (Purple)**: Starts at ~0.70, reaches ~0.94 by epoch 50, plateaus at ~0.98 by epoch 100.
- **d=5000 (Yellow)**: Begins at ~0.73, climbs to ~0.95 by epoch 50, plateaus at ~0.99 by epoch 100.
### Key Observations
1. **Convergence Speed**: Lower dimensions (d=1, 10) converge faster but plateau at lower accuracy levels.
2. **Accuracy Trade-off**: Higher dimensions (d=1000, 5000) achieve higher final accuracy but require more epochs to stabilize.
3. **Training-Testing Gap**: Testing accuracy consistently lags training accuracy by ~0.05–0.10, indicating overfitting in higher-dimensional models.
4. **Diminishing Returns**: Beyond d=100, accuracy improvements become marginal despite increased computational complexity.
### Interpretation
The graphs demonstrate a classic trade-off between model complexity (dimension) and performance. Lower-dimensional models (d=1–10) train quickly but underfit, while higher-dimensional models (d=1000–5000) overfit less but require more epochs to converge. The persistent gap between training and testing accuracy suggests regularization or data augmentation might improve generalization. Notably, d=5000 achieves near-perfect testing accuracy (~0.99) but at the cost of slower convergence, highlighting the need for careful dimension selection based on computational constraints and performance requirements.
</details>
Type II feedback: Clauses are also selected stochastically for receiving Type II feedback:
<!-- formula-not-decoded -->
Type II feedback combats false positive clause output by seeking to alter clauses that output 1 so that they instead output 0 . This is achieved simply by reinforcing inclusion of literals of value 0 . Thus, when the clause output is 1 and the corresponding literal value of an MVF-LA is 0 , the include action of the MVF-LA is reinforced. Type II feedback is strong , with step size s . Recall that in all of the above MVF-LA update steps, the parameter d decides the determinism of the updates.
## 4 Empirical Evaluation
We now study the performance of ADTM empirically using five real-world datasets. As baselines, ADTM is compared against regular TMs and seven other state-of-the-are machine learning approaches: Artificial Neural Networks (ANNs), Support Vector Machines (SVMs), Decision Trees (DTs), K-Nearest Neighbor (KNN), Random Forest (RF), Gradient Boosted Trees (XGBoost) [19], and Explainable Boosting Machines (EBMs) [20]. For comprehensiveness, three ANN architectures are used: ANN-1 - with one hidden layer of 5 neurons; ANN-2 - with two hidden layers of 20 and 50 neurons each, and ANN-3 - with three hidden layers and 20, 150, and 100 neurons. Performance of these predictive models are summarized in Table 6. We compute both F1-score (F1) and accuracy (Acc.) as performance measures. However, due to the class imbalance, we emphasize F1-score when comparing the performance of the different predictive models.
## 4.1 Bankruptcy
The Bankruptcy dataset contains historical records of 250 companies 1 . The outcome, Bankruptcy or Non-bankruptcy, is characterized by six categorical features. We thus binarize the features using thresholding [14] before we feed them into the ADTM. We first tune the hyper-parameters of the TM and the best performance is reported in Table 1, for m = 100 (number of clauses), s = 3 (step size for MVF-LA), and T = 10 (summation target). Each MVF-LA contains 100 states per action. The impact of determinism is reported in Table 1, for varying levels of determinism. As seen, performance is indistinguishable for d -values 1 , 10 , and 100 , and the ADTM achieves its highest classification accuracy. However, notice the slight decrease of F1-score and accuracy when determinism is further increased to 500 , 1000 , and 5000 .
Figure 4 shows how training and testing accuracy evolve over the training epochs. Only high determinism seems to influence learning speed and accuracy significantly. The performance of the other considered machine learning models
1 Available from https://archive.ics.uci.edu/ml/datasets/qualitative\_bankruptcy.
Table 2: Performance of TM and ADTM with different d on Balance Scale dataset.
| | TM | ADTM | ADTM | ADTM | ADTM | ADTM | ADTM |
|------|-------|--------|--------|--------|--------|--------|--------|
| | TM | d=1 | d=10 | d=100 | d=500 | d=1000 | d=5000 |
| F1 | 0.945 | 0.982 | 0.983 | 0.982 | 0.968 | 0.951 | 0.911 |
| Acc. | 0.948 | 0.980 | 0.981 | 0.980 | 0.935 | 0.894 | 0.793 |
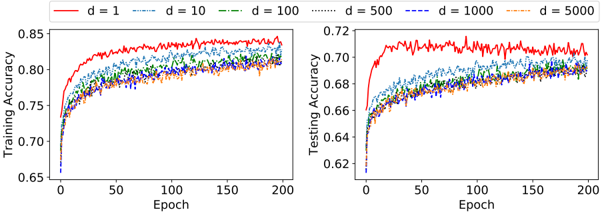
Figure 5: Training and testing accuracy per epoch on the Balance Scale dataset.
<details>
<summary>Image 5 Details</summary>
### Visual Description
## Line Graph: Training and Testing Accuracy vs. Epochs
### Overview
The image contains two line graphs side-by-side, comparing **Training Accuracy** (left) and **Testing Accuracy** (right) across 200 epochs. Each graph displays six data series representing different values of a parameter `d` (likely model complexity or depth), ranging from `d = 1` to `d = 5000`. Accuracy values are plotted on the y-axis (0.7–1.0), and epochs on the x-axis (0–200). Both graphs share identical legends and axis labels.
---
### Components/Axes
- **X-Axis (Epochs)**: Labeled "Epoch" with ticks at 0, 50, 100, 150, 200.
- **Y-Axis (Accuracy)**: Labeled "Training Accuracy" (left) and "Testing Accuracy" (right), scaled from 0.7 to 1.0.
- **Legends**:
- Located at the top of each panel.
- Colors/styles correspond to `d` values:
- `d = 1`: Solid red
- `d = 10`: Dashed blue
- `d = 100`: Dash-dot green
- `d = 500`: Dotted gray
- `d = 1000`: Dash-dot blue
- `d = 5000`: Dotted orange
---
### Detailed Analysis
#### Training Accuracy (Left Panel)
- **Trends**:
- All lines show rapid initial improvement, plateauing by ~50 epochs.
- Higher `d` values (e.g., `d = 5000`) start lower and plateau at lower accuracy (~0.78).
- Lower `d` values (e.g., `d = 1`) achieve higher plateaus (~0.95).
- **Key Data Points**:
- `d = 1`: Peaks at ~0.95 by 50 epochs.
- `d = 5000`: Peaks at ~0.78 by 50 epochs.
#### Testing Accuracy (Right Panel)
- **Trends**:
- Similar shape to training accuracy but with slightly lower plateaus.
- `d = 1` and `d = 10` achieve ~0.93, while `d = 5000` plateaus at ~0.79.
- Lines converge as epochs increase, indicating diminishing returns.
---
### Key Observations
1. **Performance Degradation with Higher `d`**:
- Accuracy decreases as `d` increases, suggesting overfitting or excessive complexity.
- `d = 1` and `d = 10` outperform larger `d` values in both training and testing.
2. **Convergence of Curves**:
- All lines flatten after ~50 epochs, indicating saturation of model capacity.
3. **Testing vs. Training Gap**:
- Testing accuracy is consistently ~0.02–0.03 lower than training accuracy, hinting at mild overfitting for smaller `d` values.
---
### Interpretation
The data demonstrates a trade-off between model complexity (`d`) and generalization performance. Lower `d` values (`d = 1`, `d = 10`) achieve higher accuracy on both training and testing datasets, while larger `d` values (e.g., `d = 5000`) underperform, likely due to overfitting. The convergence of curves after 50 epochs suggests that further training provides minimal benefit, emphasizing the importance of early stopping or regularization. The slight gap between training and testing accuracy for smaller `d` values indicates a need for careful validation to avoid overfitting. This analysis aligns with principles of model selection in machine learning, where simplicity often balances performance and generalizability.
</details>
is compiled in Table 6. The best performance in terms of F1-score for the other models is obtained by ANN-3. However, ANN-3 is outperformed by the ADTM for all d -values except when d = 5000 .
## 4.2 Balance Scale
The Balance Scale dataset 2 contains three classes: balance scale tip to the right, tip to the left, or in balance. The class is decided by the size of the weight on both sides of the scale and the distance to each weight from the center. Hence the classes are characterized by four features. However, to make the output binary, we remove the 'balanced" class ending up with 576 data samples. The ADTM is equipped with 100 clauses. Each MVF-LA is given 100 states per action. The remaining two parameters, i.e., s value and T are fixed at 3 and 10 , respectively. Table 2 contains the results of TM and ADTM obtained on the Balance Scale dataset. Even though ADTM uses the same number of clauses as the TM, the performance with regards to F1-score and accuracy is better with ADTM when all the MVF-LAs updates are stochastic ( d = 1 ). The performance of the ADTM remains the same until the determinism-parameter surpasses 100 . After that, performance degrades gradually.
Progress of training and testing accuracy per epoch can be found in Figure 5. Each ADTM setup reaches its peak training and testing accuracy and becomes stable within a fewer number of training epochs. As can be seen, accuracy is maintained up to d = 100 , thus reducing random number generation to 1% without accuracy loss. From the results listed in Table 6 for the other machine learning approaches, EBM achieves the highest F1-score and accuracy.
## 4.3 Breast Cancer
The Breast Cancer dataset 3 contains 286 patients records related to the recurrence of breast cancer (201 with nonrecurrence and 85 with recurrence). The recurrence of breast cancer has to be estimated using nine features: Age, Menopause, Tumor Size, Inv Nodes, Node Caps, Deg Malig, Side (left or right), the Position of the Breast, and whether Irradiated or not. However, some of the patient samples miss some of the feature values. These samples are removed from the dataset in the present experiment.
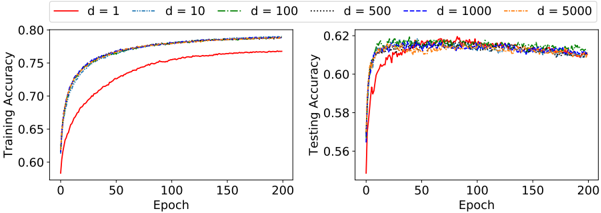
The ADTM is arranged with the following parameter setup: m = 100 , s = 5 , T = 10 , and the number of states in MVF-LA per action is 100 . The classification accuracy of the TM and ADTM are summarized in Table 3. In contrast to the previous two datasets, the performance of both TM and ADTM is considerably lower, and further decreases with increasing determinism. However, the F1 measures obtained by all the other considered machine learning models are also low, i.e., less than 0 . 500 . The highest F1-score is obtained by ANN-1 and KNN, which both are lower than what is achieved with ADTM for d -values up to 100 .
2 Available from http://archive.ics.uci.edu/ml/datasets/balance+scale.
3 Available from https://archive.ics.uci.edu/ml/datasets/Breast+Cancer
Table 3: Performance of TM and ADTM with different d on Breast Cancer dataset.
| | TM | ADTM | ADTM | ADTM | ADTM | ADTM | ADTM |
|------|-------|--------|--------|--------|--------|--------|--------|
| | TM | d=1 | d=10 | d=100 | d=500 | d=1000 | d=5000 |
| F1 | 0.531 | 0.568 | 0.531 | 0.501 | 0.490 | 0.501 | 0.488 |
| Acc. | 0.703 | 0.702 | 0.698 | 0.691 | 0.690 | 0.690 | 0.693 |
Figure 6: Training and testing accuracy per epoch on the Breast Cancer dataset.
<details>
<summary>Image 6 Details</summary>
### Visual Description
## Line Graphs: Training and Testing Accuracy vs. Epochs
### Overview
The image contains two side-by-side line graphs comparing training and testing accuracy across 200 epochs for different dimensionality values (`d = 1, 10, 100, 500, 1000, 5000`). Each graph uses distinct line styles and colors to represent the `d` values, with legends positioned at the top of each plot.
---
### Components/Axes
- **Left Graph (Training Accuracy)**:
- **X-axis**: "Epoch" (0 to 200, linear scale).
- **Y-axis**: "Training Accuracy" (0.65 to 0.85, linear scale).
- **Legend**:
- Red solid line: `d = 1`
- Blue dashed line: `d = 10`
- Green dash-dot line: `d = 100`
- Orange dotted line: `d = 500`
- Purple dash-dot-dot line: `d = 1000`
- Yellow dash-dot line: `d = 5000`
- **Right Graph (Testing Accuracy)**:
- **X-axis**: "Epoch" (0 to 200, linear scale).
- **Y-axis**: "Testing Accuracy" (0.62 to 0.72, linear scale).
- **Legend**: Same color/style mappings as the left graph.
---
### Detailed Analysis
#### Training Accuracy (Left Graph)
- **`d = 1` (Red solid line)**:
- Starts at ~0.70, rises sharply to ~0.85 by epoch 50, then plateaus with minor fluctuations.
- **`d = 10` (Blue dashed line)**:
- Begins at ~0.68, increases gradually to ~0.82 by epoch 150, then stabilizes.
- **`d = 100` (Green dash-dot line)**:
- Starts at ~0.67, rises to ~0.80 by epoch 100, then converges with higher `d` values.
- **`d = 500` (Orange dotted line)**:
- Begins at ~0.66, increases to ~0.79 by epoch 150, then overlaps with `d = 1000` and `d = 5000`.
- **`d = 1000` (Purple dash-dot-dot line)** and **`d = 5000` (Yellow dash-dot line)**:
- Both start at ~0.65, rise to ~0.78 by epoch 150, and plateau near the same level as `d = 500`.
#### Testing Accuracy (Right Graph)
- **`d = 1` (Red solid line)**:
- Starts at ~0.65, rises to ~0.70 by epoch 50, then fluctuates between ~0.68–0.71.
- **`d = 10` (Blue dashed line)**:
- Begins at ~0.64, increases to ~0.67 by epoch 100, then stabilizes.
- **`d = 100` (Green dash-dot line)**:
- Starts at ~0.63, rises to ~0.66 by epoch 150, then converges with higher `d` values.
- **`d = 500` (Orange dotted line)**:
- Begins at ~0.62, increases to ~0.66 by epoch 150, then overlaps with `d = 1000` and `d = 5000`.
- **`d = 1000` (Purple dash-dot-dot line)** and **`d = 5000` (Yellow dash-dot line)**:
- Both start at ~0.62, rise to ~0.66 by epoch 150, and plateau near the same level as `d = 500`.
---
### Key Observations
1. **Convergence of Lines**:
- For both training and testing accuracy, higher `d` values (e.g., `d ≥ 100`) show similar performance after ~100 epochs, suggesting diminishing returns for larger dimensions.
2. **Overfitting**:
- Testing accuracy consistently lags behind training accuracy, especially for smaller `d` values (e.g., `d = 1` and `d = 10`), indicating potential overfitting.
3. **Initial Performance**:
- Lower `d` values (`d = 1`, `d = 10`) achieve higher early training accuracy but struggle to generalize (testing accuracy remains lower).
4. **Stability**:
- Lines for `d ≥ 100` exhibit smoother convergence and less volatility in later epochs compared to smaller `d` values.
---
### Interpretation
The graphs demonstrate that increasing dimensionality (`d`) improves model performance up to a point, after which gains plateau. This suggests that the optimal `d` for this task lies between 100 and 500, as further increases do not significantly enhance accuracy. The persistent gap between training and testing accuracy for smaller `d` values highlights overfitting risks, where the model memorizes training data but fails to generalize. The convergence of lines for larger `d` values implies that the model’s capacity stabilizes, and additional complexity does not improve performance. This aligns with principles of model generalization, where excessive complexity can harm rather than help.
</details>
The training and testing accuracy progress per epoch is reported in Figure 6, showing a clear degradation of performance with increasing determinism.
Table 4: Performance of TM and ADTM with different d on Liver Disorders dataset.
| | TM | ADTM | ADTM | ADTM | ADTM | ADTM | ADTM |
|------|-------|--------|--------|--------|--------|--------|--------|
| | TM | d=1 | d=10 | d=100 | d=500 | d=1000 | d=5000 |
| F1 | 0.648 | 0.705 | 0.694 | 0.692 | 0.692 | 0.689 | 0.692 |
| Acc. | 0.533 | 0.610 | 0.610 | 0.612 | 0.612 | 0.610 | 0.611 |
Figure 7: Training and testing accuracy per epoch on the Liver Disorders dataset.
<details>
<summary>Image 7 Details</summary>
### Visual Description
## Line Graphs: Training and Testing Accuracy vs. Epochs
### Overview
The image contains two line graphs comparing training and testing accuracy across different model dimensions (d=1, 10, 100, 500, 1000, 5000) over 200 epochs. The graphs show how accuracy evolves during training and testing phases for varying model complexities.
### Components/Axes
- **Left Graph (Training Accuracy)**:
- **X-axis**: Epoch (0 to 200, linear scale).
- **Y-axis**: Training Accuracy (0.60 to 0.80, linear scale).
- **Legend**: Located at the top-right. Colors and line styles correspond to dimensions:
- Red solid: d=1
- Blue dashed: d=10
- Green dash-dot: d=100
- Purple dotted: d=500
- Dark blue dash-dot-dot: d=1000
- Orange dotted: d=5000
- **Right Graph (Testing Accuracy)**:
- **X-axis**: Epoch (0 to 200, linear scale).
- **Y-axis**: Testing Accuracy (0.56 to 0.62, linear scale).
- **Legend**: Same as the left graph, with identical color/style mappings.
### Detailed Analysis
#### Training Accuracy (Left Graph)
- **d=1 (Red)**: Starts at ~0.60, rises steeply to ~0.75 by epoch 50, then plateaus. Final accuracy ~0.75.
- **d=10 (Blue Dashed)**: Similar trajectory to d=1 but slightly higher (~0.77 by epoch 50, plateauing at ~0.78).
- **d=100 (Green Dash-Dot)**: Reaches ~0.78 by epoch 50, plateaus at ~0.79.
- **d=500 (Purple Dotted)**: Peaks at ~0.79 by epoch 50, stabilizes at ~0.795.
- **d=1000 (Dark Blue Dash-Dot-Dot)**: Slightly higher than d=500 (~0.798 by epoch 50, plateauing at ~0.80).
- **d=5000 (Orange Dotted)**: Highest training accuracy (~0.80 by epoch 50, plateauing at ~0.805).
#### Testing Accuracy (Right Graph)
- **d=1 (Red)**: Starts at ~0.56, rises to ~0.60 by epoch 50, then plateaus at ~0.60.
- **d=10 (Blue Dashed)**: Reaches ~0.61 by epoch 50, plateaus at ~0.61.
- **d=100 (Green Dash-Dot)**: Peaks at ~0.615 by epoch 50, stabilizes at ~0.61.
- **d=500 (Purple Dotted)**: Slightly higher (~0.618 by epoch 50, plateauing at ~0.615).
- **d=1000 (Dark Blue Dash-Dot-Dot)**: Peaks at ~0.62 by epoch 50, stabilizes at ~0.615.
- **d=5000 (Orange Dotted)**: Highest testing accuracy (~0.618 by epoch 50, plateauing at ~0.615).
### Key Observations
1. **Training vs. Testing**: Training accuracy consistently exceeds testing accuracy across all dimensions, suggesting potential overfitting in lower dimensions (e.g., d=1, d=10).
2. **Diminishing Returns**: Higher dimensions (d=500, 1000, 5000) achieve similar performance, indicating minimal gains beyond d=100.
3. **Convergence**: Lines for d=100, 500, 1000, and 5000 converge in both graphs, suggesting saturation of model capacity.
4. **Early Epoch Behavior**: All dimensions show rapid improvement in the first 50 epochs, followed by stabilization.
### Interpretation
The data demonstrates that increasing model dimensionality improves both training and testing accuracy up to a point (d=100–500). Beyond this, performance plateaus, implying that excessive complexity does not yield significant benefits. The gap between training and testing accuracy widens for lower dimensions (d=1–10), highlighting overfitting risks. The convergence of lines in both graphs suggests that models with d≥100 achieve near-optimal performance, making them preferable for balancing accuracy and computational efficiency. The testing accuracy ceiling (~0.62) indicates inherent limitations in the dataset or task complexity.
</details>
## 4.4 Liver Disorders
The Liver Disorders dataset 4 was created by BUPA Medical Research and Development Ltd. (hereafter 'BMRDL') during the 1980s as part of a larger health-screening database. The dataset consists of 7 attributes. However, McDermott and Forsyth [21] claim that many researchers have used the dataset incorrectly, considering the Selector attribute as the class label. Based on the recommendation of McDermott and Forsythof, we here instead use the Number of Half-Pint Equivalents of Alcoholic Beverages as the dependent variable, binarized using the threshold ≥ 3 . The Selector attribute is discarded. The remaining attributes represent the results of various blood tests, and we use them as features.
Here, ADTM is given 10 clauses per class, with s = 3 and T = 10 . Each MVF-LA action possesses 100 states. The performance of ADTM for different levels of determinism is summarized in Table 4. For d = 1 , the F1-score of
4 Available from https://archive.ics.uci.edu/ml/datasets/Liver+Disorders.
Table 5: Performance of TM and ADTM with different d on Heart Disease dataset.
| | TM | ADTM | ADTM | ADTM | ADTM | ADTM | ADTM |
|------|-------|--------|--------|--------|--------|--------|--------|
| | TM | d=1 | d=10 | d=100 | d=500 | d=1000 | d=5000 |
| F1 | 0.687 | 0.759 | 0.766 | 0.767 | 0.760 | 0.762 | 0.605 |
| Acc. | 0.672 | 0.778 | 0.780 | 0.783 | 0.773 | 0.781 | 0.633 |
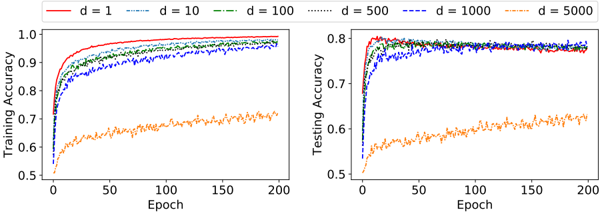
Figure 8: Training and testing accuracy per epoch on the Heart Disease dataset.
<details>
<summary>Image 8 Details</summary>
### Visual Description
## Line Graphs: Training and Testing Accuracy vs. Epochs
### Overview
The image contains two side-by-side line graphs comparing training and testing accuracy across different model dimensions (`d`). Each graph tracks performance over 200 epochs, with accuracy ranging from 0.5 to 1.0. The graphs use color-coded lines to represent six `d` values: 1, 10, 100, 500, 1000, and 5000.
### Components/Axes
- **Left Graph (Training Accuracy)**:
- **X-axis**: Epoch (0 to 200, linear scale).
- **Y-axis**: Training Accuracy (0.5 to 1.0, linear scale).
- **Legend**: Located at the top-right, mapping colors to `d` values:
- Red: `d = 1`
- Blue: `d = 10`
- Green: `d = 100`
- Dotted green: `d = 500`
- Dotted blue: `d = 1000`
- Orange: `d = 5000`
- **Right Graph (Testing Accuracy)**:
- **X-axis**: Epoch (0 to 200, linear scale).
- **Y-axis**: Testing Accuracy (0.5 to 0.8, linear scale).
- **Legend**: Same as the left graph, positioned at the top-right.
### Detailed Analysis
#### Training Accuracy (Left Graph)
- **Trends**:
- All lines (except `d = 5000`) rapidly converge to ~0.95–1.0 by epoch 50–100.
- `d = 5000` (orange) remains flat at ~0.6–0.7 throughout, with minor fluctuations.
- Lines for `d = 1`, `d = 10`, and `d = 100` show slight divergence in early epochs but stabilize.
- **Key Data Points**:
- `d = 1` (red): Peaks at ~0.98 by epoch 50.
- `d = 5000` (orange): Stays at ~0.65–0.70 across all epochs.
#### Testing Accuracy (Right Graph)
- **Trends**:
- Lines for `d = 1`, `d = 10`, and `d = 100` plateau near ~0.75–0.80 by epoch 50.
- `d = 500`, `d = 1000`, and `d = 5000` show similar performance, hovering between ~0.70–0.75.
- `d = 5000` (orange) again lags, reaching ~0.60–0.65 by epoch 200.
- **Key Data Points**:
- `d = 100` (green): Peaks at ~0.78 by epoch 50.
- `d = 5000` (orange): Remains at ~0.60–0.65 throughout.
### Key Observations
1. **Convergence of Higher `d` Values**: Models with `d ≥ 100` achieve near-identical training and testing accuracy, suggesting diminishing returns beyond this threshold.
2. **Performance Gap for `d = 5000`**: The orange line (`d = 5000`) underperforms in both training and testing, indicating potential overfitting or instability at extreme dimensions.
3. **Early Epoch Behavior**: All models except `d = 5000` show rapid improvement in the first 50–100 epochs, followed by stabilization.
### Interpretation
The graphs demonstrate that increasing model dimensionality (`d`) improves performance up to a point (`d = 100`), after which further increases yield negligible gains. The drastic drop in performance for `d = 5000` suggests that excessively high dimensions may introduce noise or overfitting, reducing generalization. This aligns with common machine learning principles where model complexity must balance with data capacity. The testing accuracy plateau near 0.75–0.80 implies a practical upper bound for this dataset, regardless of `d` beyond 100.
</details>
ADTM is better than what is achieved with the standard TM. In contrast to the performance on previous datasets, the performance of ADTM on Liver Disorders dataset with respect to F1-score does not decrease significantly with d . Instead, it fluctuates around 0 . 690 . Unlike the other datasets, the ADTM with d = 1 actually requires more training rounds than for larger d -values, before it learns the final MVF-LA actions. The ADTM with d = 1 is also unable to reach a similar level of training accuracy, compared to higher d -values. Despite the diverse learning speed, testing accuracy becomes similar after roughly 50 training rounds. The other considered machine learning models obtain somewhat similar F1-scores on the same dataset, with DT, RF, and EBM peaking with scores higher than 0 . 700 .
## 4.5 Heart Disease
The Heart Disease dataset 5 concerns prediction of heart disease. To this end, 13 features are available, selected among 75. Out of the 13 features, 6 are real-valued, 3 are binary, 3 are nominal, and one is ordered. In this case, the ADTM is built on 100 clauses. The number of state transitions when the feedback is strong, s , is equal to 3 while the target, T , is equal to 10 . The number of states per MVF-LA action in the ADTM is 100 . As one can see in Table 5, the ADTM provides better performance than TM in terms of F1-score and accuracy when d = 1 . The F1-measure increases with the d -value and peaks at d = 100 . Then it fluctuates and reaches its lowest value of 0 . 605 when d = 5000 .
Figure 8 shows that the training and testing accuracy for d = 5000 is consistently low over the training epochs, compared to the training and testing accuracy of other d -values. The other d -values, after initial variations, perform similarly roughly from the 75 th epoch and onward. Out of other machine learning algorithms, EBM provides the best F1-score. Even though ANN-1, ANN-2, DT, RF, and XGBoost obtain better F1-scores than TM, the F1 scores of ADTM when d equals to 1 , 10 , 100 , 500 , and 1000 are the highest ones.
## 5 Effects of Determinism on Energy Consumption
In the hardware implementation of TM, power is consumed by the pseudorandom number generators (PRNGs) when generating a new random number [5]. This is referred to as switching power . In the TM, every TA update is randomized, and switching power is consumed by the PRNGs on every cycle. Additionally, power is also consumed by the PRNGs whilst idle. We term this leakage power . Leakage power is always consumed by the PRNGs whilst they are powered up, even when not generating new numbers.
In the ADTM with hybrid TA where the determinism parameter d is introduced, d = 1 would be equivalent to a TM where every TA update is randomized. d = ∞ means the ADTM is fully deterministic, and no random numbers are required from the PRNG. If a TA update is randomized only on the d th cycle, the PRNGs need only be actively switched (and therefore consume switching power ) for 1 d portion of the entire training procedure. The switching power consumed by the PRNGs accounts for 7% of the total system power when using a traditional TA (equivalent to d = 1 ). With
5 Available from https://archive.ics.uci.edu/ml/datasets/Statlog+%28Heart%29.
Table 6: Classification accuracy of state-of-the-art machine learning models on all the datasets.
| | Bankruptcy | Bankruptcy | Balance Scale | Balance Scale | Breast Cancer | Breast Cancer | Liver Disorder | Liver Disorder | Heart Disease | Heart Disease |
|---------|--------------|--------------|-----------------|-----------------|-----------------|-----------------|------------------|------------------|-----------------|-----------------|
| | F1 | Acc. | F1 | Acc. | F1 | Acc. | F1 | Acc. | F1 | Acc. |
| ANN-1 | 0.995 | 0.994 | 0.990 | 0.990 | 0.458 | 0.719 | 0.671 | 0.612 | 0.738 | 0.772 |
| ANN-2 | 0.996 | 0.995 | 0.995 | 0.995 | 0.403 | 0.683 | 0.652 | 0.594 | 0.742 | 0.769 |
| ANN-3 | 0.997 | 0.997 | 0.995 | 0.995 | 0.422 | 0.685 | 0.656 | 0.602 | 0.650 | 0.734 |
| DT | 0.993 | 0.993 | 0.986 | 0.986 | 0.276 | 0.706 | 0.728 | 0.596 | 0.729 | 0.781 |
| SVM | 0.994 | 0.994 | 0.887 | 0.887 | 0.384 | 0.678 | 0.622 | 0.571 | 0.679 | 0.710 |
| KNN | 0.995 | 0.994 | 0.953 | 0.953 | 0.458 | 0.755 | 0.638 | 0.566 | 0.641 | 0.714 |
| RF | 0.949 | 0.942 | 0.859 | 0.860 | 0.370 | 0.747 | 0.729 | 0.607 | 0.713 | 0.774 |
| XGBoost | 0.983 | 0.983 | 0.931 | 0.931 | 0.367 | 0.719 | 0.656 | 0.635 | 0.701 | 0.788 |
| EBM | 0.993 | 0.992 | 1.000 | 1.000 | 0.389 | 0.745 | 0.710 | 0.629 | 0.783 | 0.824 |
Table 7: Comparative power per datapoint with two different d values.
| | Bankruptcy | Breast Cancer | Balance Scale | Liver Disorder | Heart Disease |
|----------------|--------------|-----------------|-----------------|------------------|-----------------|
| Power (d=1) | 6.94 mW | 15.8 mW | 7.7 mW | 12.6 mW | 148 mW |
| Power (d=5000) | 6.45 mW | 14.7 mW | 7.2 mW | 11.8 mW | 137.6 mW |
d = 100 this is reduced to 0.07% of the system power, and with d = 5000 this is reduced further to 0.001% of the same. It can be seen that as d increases in the ADTM, the switching power consumed by the PRNGs tends to zero.
In the special case of d = ∞ the PRNGs are no longer required for TA updates since the TAs are fully deterministic we can omit these PRNGs from the design and prevent their leakage power from being consumed. The leakage power of the PRNGs accounts for 32% of the total system power. On top of the switching power savings this equates to 39% of system power, meaning large power and therefore energy savings can be made in the ADTM.
Table 7 shows comparative training power consumption per datapoint (i.e. all TAs being updated concurrently) for two different d values: d =1 and d =5000. Typically, the overall power is higher for bigger datasets as they require increased number of concurrent TAs as well as PRNGs. As can be seen, the increase in d value reduces the power consumption by 11 mW in the case of Heart Disease dataset. This saving is made by reducing the switching activity in the PRNGs as explained above. More savings are made by larger d values as the PRNG concurrent switching activities are reduced.
## 6 Conclusion
In this paper, we proposed a novel finite-state learning automaton (MFV-LA) that can replace the Tsetlin Automaton in TM learning, for increased determinism, and thus reduced energy usage. The new automaton uses multi-step deterministic state jumps to reinforce sub-patterns. Simultaneously, flipping a coin to skip every d 'th state update ensures diversification by randomization. The new d -parameter thus allows the degree of randomization to be finely controlled. E.g., d = 1 makes every update random and d = ∞ makes the automaton fully deterministic. Our empirical results show that, overall, only substantial degrees of determinism reduces accuracy. Energy-wise, the pseudorandom number generator contributes to switching energy consumption within the TM, which can be completely eliminated with d = ∞ . We can thus use the new d -parameter to trade off accuracy against energy consumption, to facilitate low-energy machine learning.
## Acknowledgement
The authors gratefully acknowledge the contributions from Jonathan Edwards at Temporal Computing on strategies for deterministic Tsetlin Machine learning.
## References
- [1] Emma Strubell, Ananya Ganesh, and Andrew McCallum. Energy and Policy Considerations for Deep Learning in NLP. In ACL , 2019.
- [2] J. Chen and X. Ran. Deep Learning With Edge Computing: A Review. Proc. of the IEEE , 107(8):1655-1674, 2019.
- [3] Eva García-Martín, Crefeda Faviola Rodrigues, Graham Riley, and Håkan Grahn. Estimation of energy consumption in machine learning. Journal of Parallel and Distributed Computing , 134:75 - 88, 2019.
- [4] Ole-Christoffer Granmo and B John Oommen. Solving Stochastic Nonlinear Resource Allocation Problems Using a Hierarchy of Twofold Resource Allocation Automata. IEEE Transaction on Computers , 2010.
- [5] Adrian Wheeldon, Rishad Shafik, Tousif Rahman, Jie Lei, Alex Yakovlev, and Ole-Christoffer Granmo. Learning Automata based Energy-efficient AI Hardware Design for IoT. Philosophical Transactions of the Royal Society A , 2020.
- [6] Geir Thore Berge, Ole-Christoffer Granmo, Tor Oddbjørn Tveit, Morten Goodwin, Lei Jiao, and Bernt Viggo Matheussen. Using the Tsetlin Machine to Learn Human-Interpretable Rules for High-Accuracy Text Categorization with Medical Applications. IEEE Access , 7:115134-115146, 2019.
- [7] K. Darshana Abeyrathna, Ole-Christoffer Granmo, Xuan Zhang, Lei Jiao, and Morten Goodwin. The Regression Tsetlin Machine - A Novel Approach to Interpretable Non-Linear Regression. Philosophical Transactions of the Royal Society A , 378, 2019.
- [8] Ole-Christoffer Granmo, Sondre Glimsdal, Lei Jiao, Morten Goodwin, Christian W Omlin, and Geir Thore Berge. The Convolutional Tsetlin Machine. arXiv preprint arXiv:1905.09688 , 2019.
- [9] Adrian Phoulady, Ole-Christoffer Granmo, Saeed Rahimi Gorji, and Hady Ahmady Phoulady. The Weighted Tsetlin Machine: Compressed Representations with Clause Weighting. In Ninth International Workshop on Statistical Relational AI (StarAI 2020) , 2020.
- [10] Saeed Rahimi Gorji, Ole-Christoffer Granmo, Adrian Phoulady, and Morten Goodwin. A Tsetlin Machine with Multigranular Clauses. In Lecture Notes in Computer Science: Proceedings of the Thirty-ninth International Conference on Innovative Techniques and Applications of Artificial Intelligence (SGAI-2019) , volume 11927. Springer, 2019.
- [11] Saeed Gorji et al. Increasing the Inference and Learning Speed of Tsetlin Machines with Clause Indexing. In International Conference on Industrial, Engineering and Other Applications of Applied Intelligent Systems . Springer, 2020.
- [12] K Darshana Abeyrathna, Ole-Christoffer Granmo, and Morten Goodwin. Extending the tsetlin machine with integer-weighted clauses for increased interpretability. arXiv preprint arXiv:2005.05131 , 2020.
- [13] K Darshana Abeyrathna, Ole-Christoffer Granmo, and Morten Goodwin. Adaptive Sparse Representation of Continuous Input for Tsetlin Machines Based on Stochastic Searching on the Line. In Preparation , 2020.
- [14] Kuruge Darshana Abeyrathna, Ole-Christoffer Granmo, Xuan Zhang, and Morten Goodwin. A scheme for continuous input to the Tsetlin Machine with applications to forecasting disease outbreaks. In International Conference on Industrial, Engineering and Other Applications of Applied Intelligent Systems , pages 564-578. Springer, 2019.
- [15] Rishad Shafik, Adrian Wheeldon, and Alex Yakovlev. Explainability and Dependability Analysis of Learning Automata based AI Hardware. In IEEE 26th International Symposium on On-Line Testing and Robust System Design (IOLTS) . IEEE, 2020.
- [16] Kumpati S Narendra and Mandayam AL Thathachar. Learning Automata: An Introduction . Courier Corporation, 2012.
- [17] Michael Lvovitch Tsetlin. On behaviour of finite automata in random medium. Avtomat. i Telemekh , 22(10):13451354, 1961.
- [18] MALThathachar and P S Sastry. Networks of Learning Automata: Techniques for Online Stochastic Optimization . Kluwer Academic Publishers, 2004.
- [19] Tianqi Chen and Carlos Guestrin. Xgboost: A scalable tree boosting system. In Proceedings of the 22nd acm sigkdd international conference on knowledge discovery and data mining , pages 785-794, 2016.
- [20] Harsha Nori, Samuel Jenkins, Paul Koch, and Rich Caruana. Interpretml: A unified framework for machine learning interpretability. arXiv preprint arXiv:1909.09223 , 2019.
- [21] James McDermott and Richard S Forsyth. Diagnosing a disorder in a classification benchmark. Pattern Recognition Letters , 73:41-43, 2016.