## Number of Sunspot Groups from the Galileo-Scheiner controversy revisited
V.M.S. Carrasco 1,2 , M.C. Gallego 1,2 , J.M. Vaquero 2,3
1 Departamento de Física, Universidad de Extremadura, 06071 Badajoz, Spain [e-mail: vmscarrasco@unex.es]
2 Instituto Universitario de Investigación del Agua, Cambio Climático y Sostenibilidad (IACYS), Universidad de Extremadura, 06006 Badajoz, Spain
3 Departamento de Física, Universidad de Extremadura, 06800 Mérida, Spain
Abstract:
We revise the sunspot observations made by Galileo Galilei and Christoph
Scheiner in the context of their controversy on the nature of sunspots. Their sunspot records not included in the current sunspot group database, used as a basis to calculate
the sunspot group number, are analyzed. Within the documentary sources consulted in this work, we can highlight the sunspot observations by Scheiner included in the letters
sent under the pseudonym
Apelles to Marcus Welser and the first sunspot observations
made by Galileo, which can be consulted in
Le opere di Galileo Galilei
. These sunspot observations would extend the temporal coverage for these two observers and filling
some gaps in the current group database in the earliest period where the data available is sparse. Moreover, we have detected changes in the quality of the sunspot drawings
made by Galileo and Scheiner in their observation series affecting to the number of groups recorded by the two observers. We also compare these records with sunspot
observations made by other astronomers of that time. According to this comparison and regarding the same observation days, Scheiner was generally the astronomer who
reported more sunspot groups while Harriot, Cigoli, and Galileo recorded a similar number of
groups.
We conclude these observational method used by the observers.
Keywords:
Sun: activity; Sun: sunspots; astronomical data bases: miscellaneous
1. Introduction
The sunspot number index is a measure of solar activity calculated from the number of sunspots observed on the solar photosphere (Clette & Lefèvre 2016; Hoyt & Schatten
1998). This is the most used index to study long-term solar activity and it is employed in studies of different scientific fields such as solar physics or Earth sciences (Kopp et
differences are
mainly because
of the
al. 2016; Usoskin 2017). Thus, its reliability is fundamental. Recently, several corrections were applied to the sunspot number to fix scaling problems in the 19th and 20th centuries (Clette et al. 2014) and an ongoing global effort is carried out in order to provide a recalibration of these indices (Muñoz-Jaramillo & Vaquero 2019).
Sunspots have been observed before the telescopic era (Yau & Stephenson 1988; Vaquero, Gallego & García 2002). However, the systematic record of sunspot observations did not start until the use of the telescope as an astronomical instrument (Vaquero & Vázquez 2009; Arlt & Vaquero 2020). The first sunspot record available of the telescopic era was made by Thomas Harriot on 18 December 1610 (all dates in this work are referred to the Gregorian calendar). Since this record, several astronomers made sunspot observations in those first years of telescopic observations. According to the current sunspot group database (Vaquero et al. 2016, hereafter V16), the observers with the highest number of sunspot records in the two first decades of telescopic era (1610 - 1629) were Christoph Scheiner (766 observation days), Thomas Harriot (210), Charles Malapert (187), Daniel Mögling (126), and Joachim Jungius (104). It is important to note that the observational coverage in this early period is low. For the period 1610 - 1629, the observational coverage is around 20 % according to V16 and if we only consider the first decade, from December 1610 to 1619, it is even lower (15 %). For this reason, the incorporation of new information on sunspot observations made in those first years of the telescopic era is fundamental to understand how solar activity evolved in that period. We highlight that, recently, Neuhäuser & Neuhäuser (2016), Carrasco (2019), and Carrasco et al. (2019a) found some problems in the sunspot counting from the records of the first years of telescopic observations. Furthermore, Carrasco et al. (2019b) found by revisiting Malapert records, on the one hand, the two first solar cycles of the telescopic era had the shape of the standard 11-year solar cycle and, on the other hand, the solar activity level calculated from Malapert (1633) was onethird greater than that obtained from V16 considering the same documentary source. Recently, Vokhmyanin, Arlt & Zolotova (2020) calculated sunspot areas and positions from Harriot's drawings. In this context, it is also interesting to revisit the sunspot observations made by astronomers of that time like, for example, Galileo and Scheiner. We also note that these first observations precede the Maunder Minimum (Eddy 1976; Usoskin et al. 2015), the period between 1645 and 1715 characterized by a long and
prolonged low solar activity, which makes difficult to connect the first data with modern observation series (Muñoz-Jaramillo & Vaquero 2019). Thus, this gives a significant importance to any new sunspot data series from that early era.
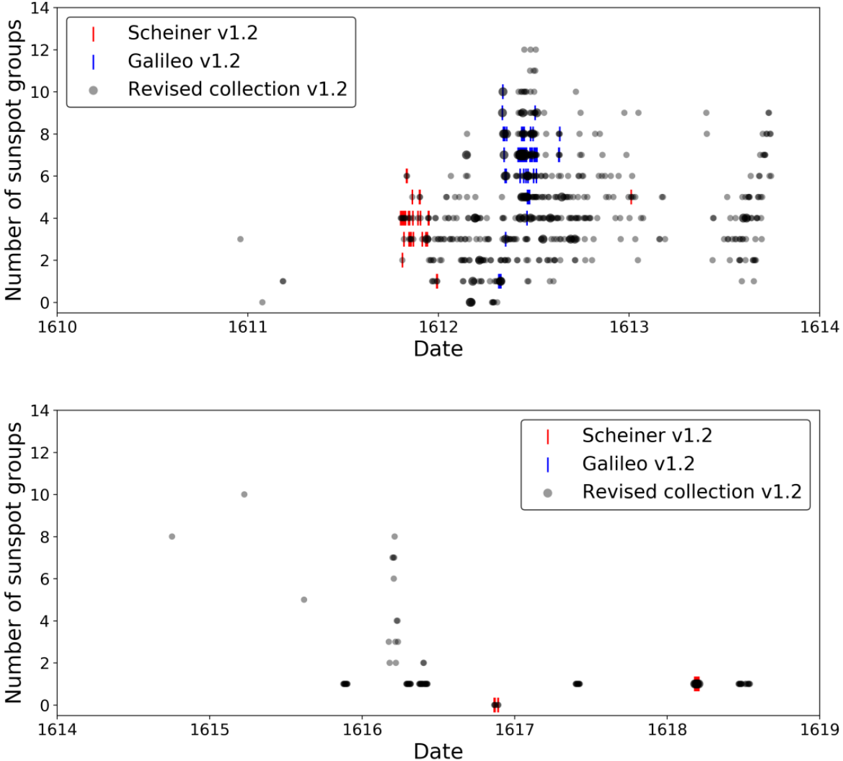
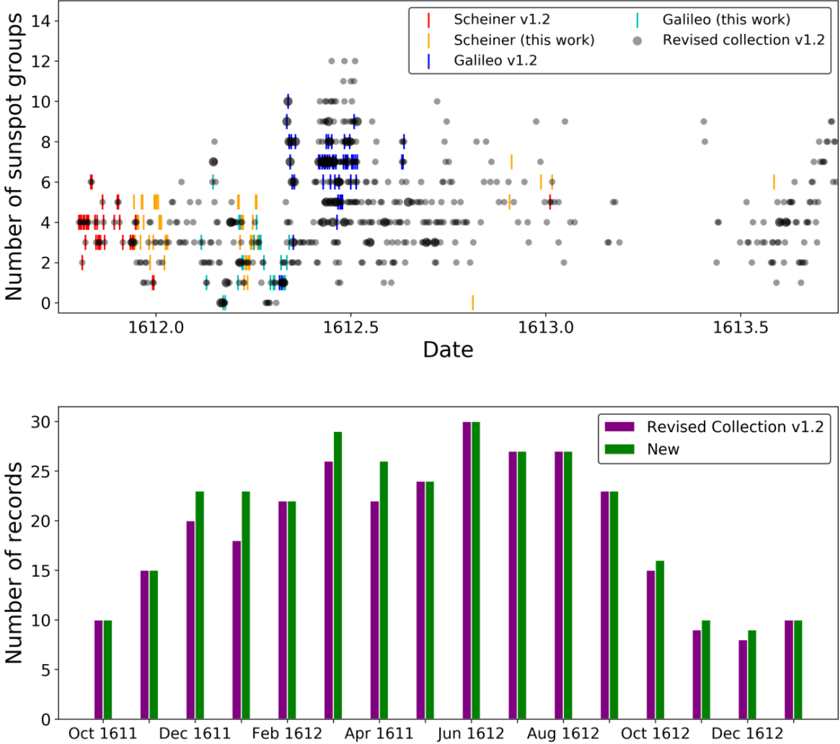
There are 51 observation days by Galileo Galilei in V16. Although he did not record many sunspot observations, Galileo was an important sunspot observer. He is the fourth most active sunspot observer if we consider records made during the first decade of telescopic era. Galileo indicated that he observed sunspots in 1610 (Galilei 1895a) and therefore he could be the first astronomer who observed sunspots by telescope but he did not record the exact date. Furthermore, he made very detailed sunspot drawings from May to August 1612 and had a great debate with Scheiner about the nature of sunspots (Sakurai 1980; Galilei & Scheiner 2010). While Scheiner defended the Aristotelian ideas about a perfect Sun, Galileo demonstrated that sunspots are on the solar 'surface' (today photosphere). The sunspot observations involved in this famous controversy of the history of the astronomy have allowed us to know the level of solar activity in those first years of the telescopic era. Although these sunspot reports are widely known in the context of this discussion, some of them are not included in V16. Christoph Scheiner was also one of the most important sunspot observers of that time because of his number of sunspot records and the outstanding quality of his drawings published in Rosa Ursina (Scheiner, 1630). The sunspot observations included in this documentary source were made in 1620s, except one of the sunspot drawings made by Malapert (in 1618). We highlight that Casas et al. (2006) estimated the solar differential rotation from the Galileo's drawings and, more recently, Arlt et al. (2016) and Vokhmyanin & Zolotova (2018) calculated the sunspot positions from the observations published by Scheiner from 1611 to 1631 and Galileo from May to August 1612, respectively. Figure 1 represents the daily number of sunspot groups recorded from 1610 to 1618 according to V16, including the sunspot observations made by Scheiner (red bars) and Galileo (blue bars). We have selected, among the different countings from Galileo's observations in V16, the observer with the station number 3 because it has the greatest observational coverage for this observer.
In this work, we analyze the sunspot observations made by Scheiner from December 1611 to August 1613 and Galileo from February to May 1612. Surprisingly, despite of
the fame of these astronomers, these observations are not included in the last revised collection of sunspot group numbers by V16 nor in the previous version (Hoyt & Schatten 1998). We describe the sunspot observations in Section 2. Section 3 includes the sunspot counting carried out from these observations and a comparison to the sunspot observations carried out by other astronomers of that time. Finally, the main conclusions of this work are shown in Section 4.
Figure 1. Daily number of sunspot groups recorded by Scheiner (red color) and Galileo (blue color) included in V16, and all the sunspot records available in V16 (grey color) during the period 1610 - 1613 (top panel) and 1614 - 1618 (bottom panel). The sizes of dots are function of the number of identical values recorded by all the observers in the same date such that greater sizes depict greater number of observations per day.
<details>
<summary>Image 1 Details</summary>
### Visual Description
\n
## Scatter Plot: Sunspot Group Observations (1610-1619)
### Overview
The image presents two scatter plots displaying the number of sunspot groups observed over time, from approximately 1610 to 1619. Three datasets are plotted: observations by Scheiner v1.2 (red), Galileo v1.2 (blue), and a revised collection v1.2 (gray). The plots aim to compare the sunspot observations made by these different observers.
### Components/Axes
* **X-axis:** Date, ranging from 1610 to 1619.
* **Y-axis:** Number of sunspot groups, ranging from 0 to 14.
* **Legend (Top-Right of each plot):**
* Scheiner v1.2 (represented by red vertical lines/markers)
* Galileo v1.2 (represented by blue vertical lines/markers)
* Revised collection v1.2 (represented by gray circles)
### Detailed Analysis or Content Details
**Plot 1 (1610-1614):**
* **Scheiner v1.2 (Red):** A cluster of observations between approximately 1611.5 and 1612.5, with the number of sunspot groups ranging from approximately 2 to 6. There is a slight upward trend initially, followed by a decrease.
* **Galileo v1.2 (Blue):** A dense cluster of observations between approximately 1612 and 1613, with the number of sunspot groups ranging from approximately 2 to 10. The data appears relatively scattered, with a peak around 8-10 sunspot groups.
* **Revised collection v1.2 (Gray):** Scattered observations throughout the period, with the number of sunspot groups ranging from approximately 0 to 10. There is a higher density of observations between 1612 and 1614, generally clustering between 2 and 6 sunspot groups.
**Plot 2 (1614-1619):**
* **Scheiner v1.2 (Red):** Very few observations. One observation at approximately 1616.8 with around 2 sunspot groups, and another at approximately 1617.5 with around 1 sunspot group.
* **Galileo v1.2 (Blue):** Very few observations. One observation at approximately 1616.8 with around 2 sunspot groups, and another at approximately 1617.5 with around 1 sunspot group.
* **Revised collection v1.2 (Gray):** Scattered observations between 1614 and 1616, ranging from approximately 0 to 8 sunspot groups. Observations become sparse after 1616, with a few points around 1-2 sunspot groups between 1617 and 1619.
### Key Observations
* The period between 1612 and 1613 shows the highest concentration of sunspot observations across all three datasets.
* There is a general agreement between the three datasets during the peak observation period (1612-1613), although there is some variation in the reported number of sunspot groups.
* Observations become significantly sparser after 1614, particularly for Scheiner and Galileo.
* The revised collection provides a more continuous record, even during periods of sparse observations from the other two sources.
### Interpretation
The data suggests a period of heightened sunspot activity around 1612-1613, as observed by all three researchers. The differences in reported numbers likely reflect variations in observational techniques, instrument quality, or subjective interpretation. The decline in observations after 1614 could be due to a genuine decrease in sunspot activity, or it could be a result of reduced observational effort by Scheiner and Galileo. The revised collection attempts to reconcile these observations, providing a more complete, though still incomplete, picture of sunspot activity during this period. The fact that all three observers generally agree during the peak period lends credibility to the existence of a significant solar event around 1612-1613. The sparse data after 1614 makes it difficult to draw firm conclusions about long-term trends.
</details>
## 2. Documentary sources and observations
Christoph Scheiner recorded sunspot observations from 1611 to 1640 and he is clearly the observer with the highest number of sunspot records before the Maunder Minimum (Arlt et al. 2016; Engvold & Zirker 2016; Vaquero et al. 2016). Scheiner (1630) published a great number of drawings including his own sunspots records and sunspot observations made by other astronomers as, for example, Charles Malapert (Carrasco et al. 2019b). In particular, the sunspot drawings made by Scheiner in 1620s have extraordinary quality due to its high level of detail. Thus, ' Rosa Ursina ' could be considered the main documentary source of observations and discussion about sunspots regarding the first years of the telescopic era.
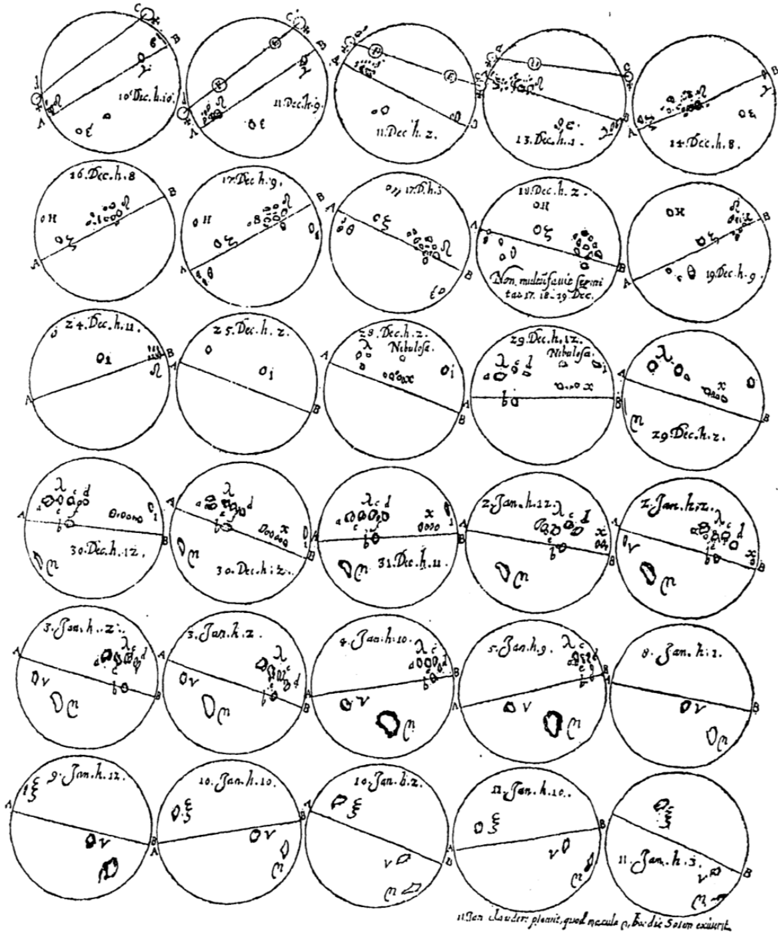
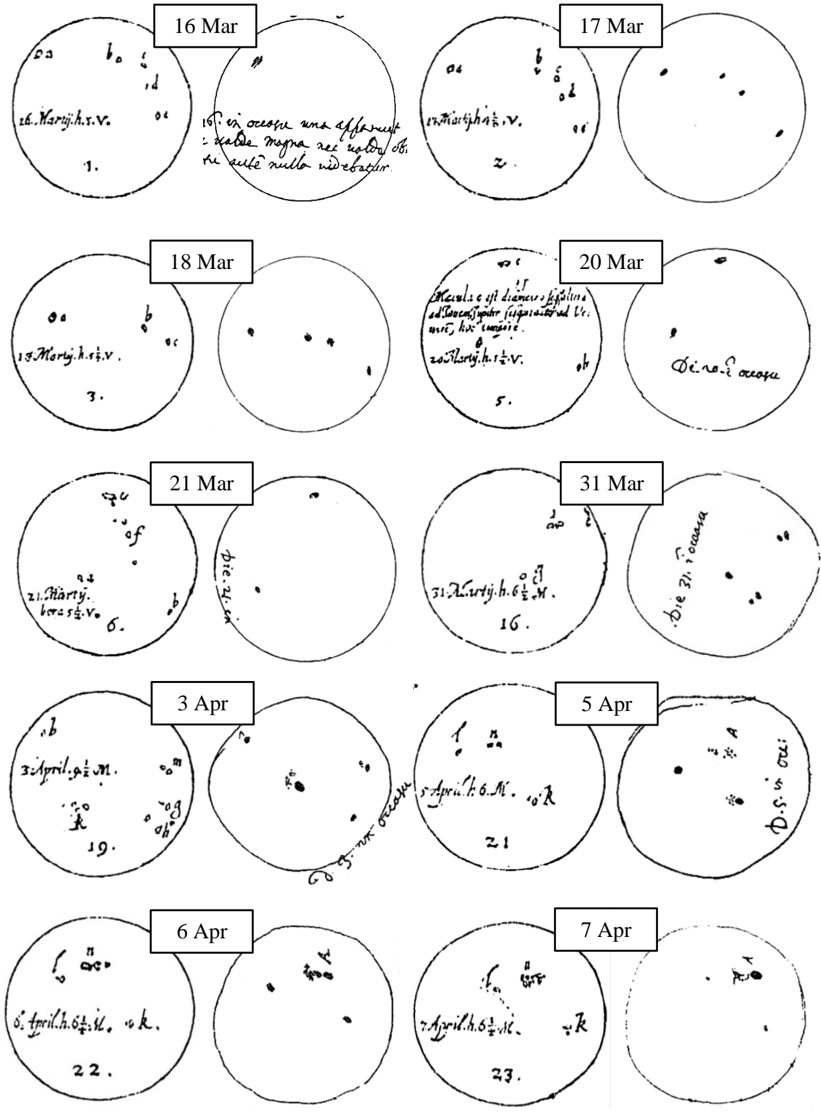
The first sunspot drawing set recorded by Scheiner includes observations made from 21 October 1611 to 14 December 1611. Another very similar series of observations was published by Scheiner (1612) and includes his sunspot records made from 10 December 1611 to 11 January 1612 and for March-April 1612. They are part of the letters Scheiner sent to Marcus Welser signed under the pseudonym Apelles . These drawings can be consulted, for example, on the website of the Lincean Academy Archive (https://bibdig.museogalileo.it). Furthermore, four sunspot drawings made in 1612 (23 October, 27 and 29 November, and 26 December) and one more in 1613 (6 January 1613) were published by Scheiner (1615). Other sunspot drawing made by Scheiner on 1 August 1613 was sent by Welser to Galileo in a letter written in October 1613 (Galilei 1895b). Figure 2 includes all these observations, except ten common observation days with Galileo and other common observation day with Colonna on 1 August 1613. These last drawings are represented in other figures (Figure 5, 6, and 7) to reduce the extension of Figure 2. Note that the original disc diameter of the sunspot observations made by Scheiner between 1611 December 14 to 1612 April 7 is about 22.7 mm (Arlt et al. 2016). Thus, 0.1 mm on the discs corresponds to 0.5º in heliographic coordinates in the disc centre. These sunspot records made by Scheiner were not included in V16. We must point out here that the level of detail included in the sunspot drawings made by Scheiner from 1611 to 1613 is significantly lower than in the sunspot drawings published by Scheiner (1630) in Rosa Ursina . For example, sunspots are represented by simple dots without penumbra in these first drawings while complex formation of sunspots and facular regions can be found in Rosa Ursina . We note that a transit of Venus in front of the Sun was expected on 11 December 1611 according to some
predictions computed using the Ptolemaic system. Scheiner (1615) represented his estimation for Venus' size in the four sunspot drawings made at the end of 1612 (dot 'A') in order to compare its shape and size with those of the sunspots recorded those days. Scheiner estimated the apparent diameter for Venus in 3 minutes of arc (Galilei & Scheiner 2010, p. 66). However, Arlt & Vaquero (2020) indicated the expected size of Venus provided by Scheiner in those drawings is actually a bit smaller than half that size in its lower conjunction and, moreover, no Venus' transit occurred but an upper conjunction.
<details>
<summary>Image 2 Details</summary>
### Visual Description
\n
## Diagram: Celestial Observations - Sun's Declination and Azimuth
### Overview
The image presents a series of 24 circular diagrams, arranged in a 4x6 grid. Each diagram appears to represent a specific date and time, documenting astronomical observations, likely related to the sun's position. The diagrams contain hand-drawn lines, symbols, and text, indicating declination, azimuth, and potentially other astronomical parameters. The overall impression is of a historical astronomical record, possibly related to solar observations over a year.
### Components/Axes
Each circular diagram contains the following elements:
* **Date:** A date is inscribed on each circle, formatted as "Day. Month.h.x", where "Day" is a number (1-31), "Month" is a shortened month name (Dec, Jan), "h" is a number (1-12), and "x" is a letter (z, h, s).
* **Circles:** Each diagram is a circle, with a central point.
* **Lines:** Lines are drawn within each circle, radiating from the center. These lines likely represent the sun's azimuth and declination.
* **Symbols:** Various symbols are present within the circles, including crosses, dots, and lettered markings (e.g., "a", "b", "0", "1", "2").
* **Text:** Additional text is present within some circles, including abbreviations and numbers.
* **Footer Text:** A line of text at the bottom of the image reads: "uher claudere placet quod macula a die Sole existent." (Latin).
### Detailed Analysis / Content Details
The diagrams are arranged in rows and columns. Here's a breakdown of the dates and some observed details from each circle, noting the uncertainty due to handwriting and image quality:
**Row 1:**
1. 10.Dec.h.i: Lines and symbols present.
2. 11.Dec.h.g: Lines and symbols present.
3. 11.Dec.h.z: Lines and symbols present.
4. 13.Dec.h.i: Lines and symbols present.
5. 14.Dec.h.s: Lines and symbols present.
6. 19.Dec.h.g: Lines and symbols present.
**Row 2:**
7. 24.Dec.h.u: Lines and symbols present.
8. 25.Dec.h.z: Lines and symbols present.
9. 29.Dec.h.z: Lines and symbols present. Text: "Non mutatur facie formi" and "castr. it. 19.Dec".
10. 29.Dec.h.k: Lines and symbols present.
11. 29.Dec.h.z: Lines and symbols present.
12. 30.Dec.h.k: Lines and symbols present.
**Row 3:**
13. 30.Dec.h.iz: Lines and symbols present.
14. 30.Dec.h.z: Lines and symbols present.
15. 31.Dec.h.k: Lines and symbols present.
16. 2.Jan.h.iz: Lines and symbols present.
17. 3.Jan.h.iz: Lines and symbols present.
18. 4.Jan.h.g: Lines and symbols present.
**Row 4:**
19. 5.Jan.h.i: Lines and symbols present.
20. 6.Jan.h.z: Lines and symbols present.
21. 7.Jan.h.s: Lines and symbols present.
22. 8.Jan.h.i: Lines and symbols present.
23. 9.Jan.h.i: Lines and symbols present.
24. 10.Jan.h.s: Lines and symbols present.
**Footer Text Translation:**
The Latin text "uher claudere placet quod macula a die Sole existent" translates to: "It pleases me to close [this] because a spot exists from the sun by day."
### Key Observations
* The diagrams are consistently formatted, suggesting a systematic approach to observation.
* The dates progress sequentially, starting in December and continuing into January, indicating a record spanning the winter solstice.
* The symbols and lines within each circle vary, likely representing changes in the sun's position over time.
* The presence of the Latin text suggests the observations were made by someone familiar with classical scholarship.
* The reference to a "spot" in the footer text hints at possible sunspot observations.
### Interpretation
This diagram represents a historical record of solar observations, likely made by an astronomer or scholar interested in tracking the sun's movement. The consistent format and sequential dates suggest a deliberate attempt to document changes in the sun's declination and azimuth over a period of time. The inclusion of symbols and annotations indicates a level of detail and analysis beyond simple recording of position. The Latin text adds a layer of historical context, suggesting the observer was part of a scholarly tradition. The mention of a "spot" could indicate early observations of sunspots, which were a subject of scientific interest in the 16th and 17th centuries.
The diagrams likely represent a visual method for recording and analyzing astronomical data before the widespread use of precise instruments and mathematical calculations. The hand-drawn nature of the diagrams suggests a reliance on visual observation and subjective interpretation. The overall impression is of a valuable historical document that provides insight into the methods and practices of early astronomy. The arrangement of the circles in a grid format suggests an attempt to organize and compare observations over time, potentially to identify patterns or trends.
</details>
Figure 2. Sunspot observations made by Scheiner from 10 December 1611 to 6 January 1613. Note that: (i) dot 'A' in the drawings corresponding to 23 October, 27 and 29 November, and 26 December 1612 represents the planet Venus, and (ii) dot 'I' on the last drawing (6 January 1613) does not represent a sunspot and red squares depict different sunspot groups according to this work (6 in this case) in order to show an example of how groups have been counted [Source: Galilei 1895a; Scheiner 1615].
<details>
<summary>Image 3 Details</summary>
### Visual Description
\n
## Petri Dish Observations: Bacterial Growth Study
### Overview
The image depicts a series of 21 petri dishes, each containing bacterial growth. Each dish is labeled with a date, initials, and potentially strain information. The dishes appear to document a time-series experiment observing bacterial colony formation. The bottom row contains a key to symbols used within the dishes.
### Components/Axes
The image lacks traditional axes. The "axes" are the arrangement of the petri dishes in a roughly 3x7 grid. Each dish is labeled with the following information:
* **Number:** 1-21, sequentially arranged.
* **Date:** Appears in the format "Month. Day" (e.g., "23. OCT").
* **Initials:** A combination of letters (e.g., "h.s.v.", "h.M.").
* **Strain/Description:** Additional text describing the bacterial strain or observation (e.g., "Clavula r. Imum aper. dis.", "Diphtheriae & squamosae...").
* **Symbols:** Small symbols within the dishes represent specific observations.
The bottom row (dishes 19-21) contains a key explaining the symbols:
* **A:** A square with a diagonal line.
* **B:** A square with a cross.
* **C:** A square with a dot.
* **D:** A square with a diagonal line and a dot.
### Detailed Analysis or Content Details
Here's a transcription of the labels for each petri dish:
1. "19. März h.s.v. i"
2. "20. März h.s.v. i"
3. "21. März h.s.v. i"
4. "22. März h.s.v. i"
5. "23. März h.s.v. i"
6. "Clavula r. Imum aper. dis."
7. "26. März h.s.v. &"
8. "27. März h.s.v."
9. "28. März h.s.v. i"
10. "29. März h.s.v. i"
11. "30. März h.s.v. &"
12. "April. h.s.v. i"
13. "2. April. h.s.v."
14. "3. April. h.s.v."
15. "4. April. h.M. &"
16. "17. Nou. h.s.v. i"
17. "18. Nou. h.s.v. i"
18. "19. Nou. h.s.v. i"
19. "20. Dec. h.s.v. M. Diphtheriae & squamosae..."
20. "21. Dec. h.s.v. M. Bacilla from specimen, malignant..."
21. "23. OCT: A B C D"
The dishes show varying degrees of bacterial growth, ranging from sparse colonies to more confluent growth. The symbols within the dishes (A, B, C, D) appear to indicate different characteristics of the colonies, such as morphology or staining properties.
### Key Observations
* The experiment appears to have started in March and continued into December, with a gap in October.
* The "h.s.v." strain appears to be the most frequently studied, appearing in multiple dishes across different dates.
* The dishes labeled "April" and "December" show different growth patterns and potentially different strains.
* The key in the bottom row suggests a systematic way of categorizing the observed colonies.
### Interpretation
This image documents a microbiological study, likely focused on identifying and characterizing bacterial strains. The sequential labeling of the petri dishes suggests a time-course experiment, where the growth of bacteria was monitored over several months. The use of initials ("h.s.v.", "h.M.") likely refers to the researcher or the source of the bacterial cultures. The symbols (A, B, C, D) represent a qualitative assessment of the colonies, potentially based on their appearance under a microscope.
The experiment seems to have involved multiple strains, including "Clavula r. Imum aper. dis." and strains isolated from specimens ("Diphtheriae & squamosae...", "Bacilla from specimen, malignant..."). The varying growth patterns observed in the dishes suggest differences in the growth rates or environmental requirements of the different strains. The gap in October might represent a pause in the experiment or a change in the experimental protocol.
The image provides a snapshot of a scientific investigation, highlighting the importance of careful observation and documentation in microbiological research. The data suggests a systematic approach to studying bacterial growth and characterization, using both quantitative (time-series data) and qualitative (symbol-based assessment) methods. The image is a historical record of early microbiological work, demonstrating the methods used to study bacteria before the advent of modern techniques.
</details>
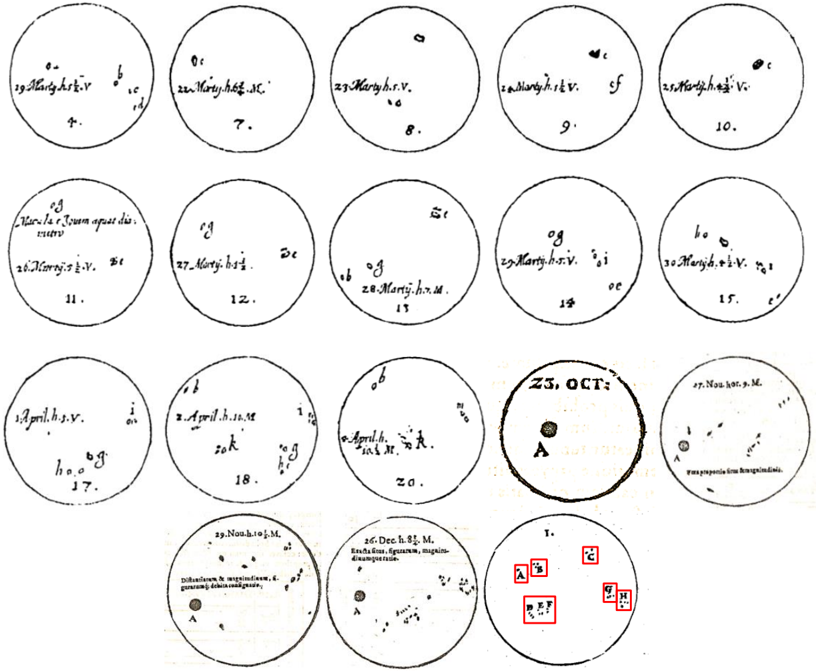
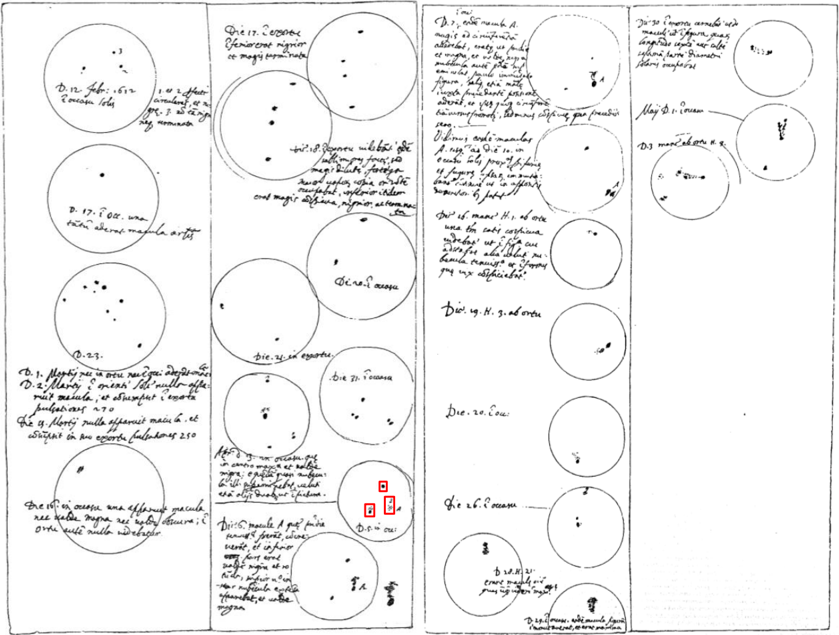
Galileo Galilei mentioned that he observed sunspots from 1610 although there are no exact dated records until 1612 (Galilei 1895a). Instead, he published his sunspot drawings made from February to August 1612. The drawings corresponding to JuneAugust were published in Istoria e dimostrazioni intorno alle macchie solari (Galilei 1613) and those for 3-11 May 1612 are included in the letters sent by Galileo to Cardinal Maffeo Barberini (later Pope Urban VIII) whose original manuscripts are preserved at the Vatican Library (Vokhmyanin & Zolotova, 2018). These observations represent the most detailed sunspot drawings made in the first ten years of the telescopic era and the group counting from them is included in V16. However, most of the sunspot
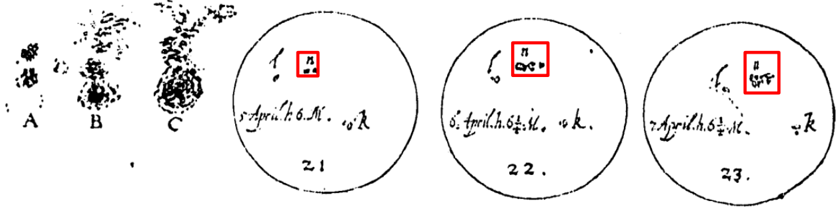
observations made by Galileo before 3 May 1612 were not taken into account in V16. These sunspot drawings can be consulted in the Frammenti attenenti alle lettere sulle macchie solari included in Le opere di Galileo Galilei (Galilei 1895a). Furthermore, textual descriptions are included in these drawings and even information about spotless days (2 and 4 March 1612) can be extracted. Galileo also reported in a comment that he observed sunspots on 1 March 1612, but he did not publish the sunspot drawing corresponding to this date and did not specify the number of groups or single sunspots. These observations made by Galileo but missing in V16 are shown in Figure 3.
Figure 3. Sunspot observations made by Galileo from 12 February 1612 to 3 May 1612. Red symbols depicted on the drawing corresponding to 5 April 1612 are an example to show how groups (3 in this case) have been counted in this work [Source: Galilei 1895a].
<details>
<summary>Image 4 Details</summary>
### Visual Description
\n
## Diagram: Astronomical Observations & Notes
### Overview
The image presents a hand-drawn diagram resembling a series of astronomical observations or sketches, arranged in a grid-like pattern. Each cell contains circular representations, likely depicting celestial bodies or fields of view, accompanied by handwritten notes in Latin. The overall impression is that of a scientific record from a historical period, possibly related to early astronomy or astrology.
### Components/Axes
The diagram is organized into a 3x4 grid of cells. Each cell contains:
* **Circular Representation:** A large circle, potentially representing a field of view or the outline of a celestial object. Within these circles are smaller dots representing stars or other points of interest.
* **Handwritten Notes:** Extensive notes written in Latin, surrounding or within the circles. These notes appear to describe the observations, including dates, positions, and possibly interpretations.
* **Date/Time Indicators:** Dates and times are frequently mentioned within the notes, such as "Die 17. Decembr." (December 17th) and "Die 9. Martii" (March 9th).
* **Red Square:** One cell contains a small red square with additional markings.
### Detailed Analysis / Content Details
Due to the handwriting and age of the document, precise transcription is difficult. Here's a breakdown of the content, cell by cell, with approximate interpretations:
**Row 1:**
* **Cell 1 (Top-Left):** "Die 17. Decembr." followed by notes about "stella" (star) and "nova" (new star). Mentions "in capite" (in the head).
* **Cell 2:** "Die 17. Decembr." with notes about "stella nigrior" (darker star) and "in media regione" (in the middle region).
* **Cell 3:** Extensive notes in Latin, discussing observations and possibly interpretations. Mentions "nova stella" and "in regione" (in the region).
* **Cell 4:** "Martij die 9. hora 1." (March 9th, hour 1) with notes about a "stella" and its position.
**Row 2:**
* **Cell 5:** "Die 17. Decembr." with notes about a "nova stella" and "sub dracone" (under the dragon - a constellation).
* **Cell 6:** "Die 16. Decembr." with notes about a "nova stella" and its position.
* **Cell 7:** "Die 16. Decembr." with notes about a "nova stella" and its position.
* **Cell 8:** "Die 9. Martii." with notes about a "nova stella" and its position.
**Row 3:**
* **Cell 9:** "Die 9. Martii." with notes about "stella" and its position. Mentions "in regione" (in the region).
* **Cell 10:** "Die 16. Martii." with notes about a "nova stella" and its position.
* **Cell 11:** Contains a red square with markings. Notes mention "nova stella" and "in regione" (in the region).
* **Cell 12:** "Die 20. Martii." with notes about a "nova stella" and its position.
**Additional Notes:**
* The notes frequently refer to "nova stella" (new star), suggesting the observations relate to a supernova or a newly discovered celestial object.
* References to constellations like "draco" (dragon) are present.
* The notes include descriptions of the stars' brightness and color ("nigrior" - darker).
* The handwriting is cursive and difficult to decipher completely.
### Key Observations
* The diagram focuses on observations of "nova stella" (new stars) across a period of time in December and March.
* The notes are detailed and attempt to pinpoint the position of these stars within specific regions of the sky.
* The use of Latin suggests a historical context, likely pre-modern astronomy.
* The red square in Cell 11 might indicate a particularly significant observation or a point of interest.
### Interpretation
This diagram appears to be a record of observations made by an astronomer (or astrologer) in the 17th or 18th century, documenting the appearance of a new star (likely a supernova). The meticulous notes and attempts to locate the star within constellations demonstrate a scientific approach to observation, even if influenced by the astrological beliefs of the time. The repeated mention of "nova stella" suggests a significant astronomical event that captured the observer's attention. The grid format and consistent notation indicate a systematic approach to data collection. The diagram provides a valuable glimpse into the practices of early astronomy and the methods used to record and interpret celestial phenomena. The red square could signify a particularly bright or noteworthy observation, perhaps marking a turning point in the observer's understanding of the event. The notes are not merely descriptive; they attempt to contextualize the observations within a broader cosmological framework.
</details>
## 3. Analysis and discussion of the sunspot records
## 3.1. The sunspot counting
We have analyzed the documentary sources that include sunspot observations which were not incorporated to V16. Thus, the total number of records studied in this work has been 77. Regarding these records, 51 were performed by Scheiner and 26 by Galileo. All the observations made by Galileo were carried out in 1612. We have analyzed 14 records made by Scheiner in December 1611 in addition to his 61 observations in 1612 and 2 in 1613. Figure 4 (top panel) depicts the sunspot counting from October 1611 to October 1613 according to the sunspot observations made by Galileo (cyan color) and Scheiner (orange color) analyzed in this work, and all the daily sunspot group numbers included in V16 (black color) highlighting the sunspot records made by Galileo (blue color) and Scheiner (red color) included in V16. Through the observations analyzed in this work, we can fill some gaps in V16 in days where there is no information, namely, 3 days in December 1611 (16, 19, and 28 December 1611) and 15 days in 1612 (2-3, 810 January, 25 and 29-30 March, 2, 5 and 19-20 April, 23 October, 29 November, and 26 December 1612). In this way, the number of days with sunspot records would increase from 48 to 51 in 1611 and from 251 to 266 in 1612 in V16. Figure 4 (bottom panel) represents a comparison for the period October 1610 - January 1613 between the monthly number of observation days according to V16 (purple) and the same but including the sunspot observations analyzed in this work (green). We have represented data until January 1613 in Figure 4 (bottom panel) because from January to August 1613 (last observation analyzed in this work) no gaps would be filled in V16 from this work. In particular, for each observer, the total number of sunspot observations recorded by Galileo would increase from 51 to 72 and the amount of sunspot records made by Scheiner from December 1611 to August 1613 would increase from 33 to 78. In this work, we have counted sunspot groups by searching similar distributions to modern group classifications (McIntosh 1990). Examples of our group counts can be seen in Figure 2 (6 January 1613) and Figure 3 (5 April 1612) marked by red squares. We note that the sunspot group counting in the historical observations is sometimes not trivial and the interpretation of what is a sunspot group can slightly vary from author to author. Moreover, the number of sunspot groups included in V16 on 13, 29 and 30 December 1611 corresponding to Scheiner's observations and on 26 April 1612 regarding Galileo's records must be corrected according to this new analysis. This new counting is
publicly available on the website of the Historical Archive of Sunspot Observations (HASO, haso.unex.es).
Figure 4. (Top panel) Daily number of groups recorded by Galileo (cyan color) and Scheiner (orange color) analyzed in this work. The daily group counting included in V16 for the period October 1610 - October 1613 according to Galileo and Scheiner, in addition to the entire sunspot observation set are represented in blue, red, and black color respectively. The sizes of dots are function of the number of identical values recorded by all the observers in the same date such that greater sizes depict greater number of observations per day. (Bottom panel) Monthly number of observation days according to V16 (purple) and that including the sunspot observations analyzed in this work in V16 (green) for the period October 1610 - January 1613.
<details>
<summary>Image 5 Details</summary>
### Visual Description
## Scatter Plot & Bar Chart: Sunspot Observations
### Overview
The image contains two charts. The top chart is a scatter plot showing the number of sunspot groups observed over time (from approximately 1612.0 to 1613.5) by different observers (Scheiner and Galileo) and a revised collection. The bottom chart is a bar chart showing the number of records (observations) made in each month from October 1611 to December 1612, categorized as "Revised Collection v1.2" and "New".
### Components/Axes
**Top Chart (Scatter Plot):**
* **X-axis:** Date, ranging from approximately 1612.0 to 1613.5.
* **Y-axis:** Number of sunspot groups, ranging from 0 to 14.
* **Legend (top-right):**
* Scheiner v1.2 (Red)
* Galileo (this work) (Blue)
* Scheiner v1.2 (Orange)
* Galileo v1.2 (Purple)
* Revised collection v1.2 (Black)
**Bottom Chart (Bar Chart):**
* **X-axis:** Months from October 1611 to December 1612.
* **Y-axis:** Number of records, ranging from 0 to 30.
* **Legend (top-right):**
* Revised Collection v1.2 (Grey)
* New (Purple)
### Detailed Analysis or Content Details
**Top Chart (Scatter Plot):**
* **Scheiner v1.2 (Red):** Data points are sparse, mostly between 1 and 5 sunspot groups. There's a cluster around 1612.2 with values between 1 and 3.
* **Galileo (this work) (Blue):** Shows a higher density of data points, with a peak around 1612.2-1612.3, reaching up to approximately 10 sunspot groups. Generally fluctuates between 2 and 8.
* **Scheiner v1.2 (Orange):** Similar to the red data, sparse and mostly between 1 and 4 sunspot groups.
* **Galileo v1.2 (Purple):** Also sparse, with values generally between 1 and 5.
* **Revised collection v1.2 (Black):** The most dense data set, showing a consistent number of sunspot groups between 2 and 8, with peaks around 1612.2-1612.3 reaching up to 10. There's a clear upward trend from 1612.0 to 1612.3, followed by a decline.
**Bottom Chart (Bar Chart):**
* **Revised Collection v1.2 (Grey):** Shows a peak in February 1612 with approximately 28 records. Generally high from February to August 1612, then declines. Values are approximately: Oct 1611 (18), Dec 1611 (22), Feb 1612 (28), Apr 1612 (29), Jun 1612 (24), Aug 1612 (26), Oct 1612 (23), Dec 1612 (10).
* **New (Purple):** Shows a peak in April 1612 with approximately 27 records. Generally lower than the Revised Collection, but follows a similar trend. Values are approximately: Oct 1611 (10), Dec 1611 (14), Feb 1612 (21), Apr 1612 (27), Jun 1612 (16), Aug 1612 (18), Oct 1612 (16), Dec 1612 (8).
### Key Observations
* The scatter plot shows that Galileo generally observed more sunspot groups than Scheiner.
* The "Revised collection v1.2" data in the scatter plot appears to be a combination or smoothing of the individual observations.
* The bar chart indicates a peak in observational activity around April 1612 for both the "Revised Collection" and "New" data.
* The number of records (observations) decreases significantly towards the end of 1612.
* The "Revised Collection" consistently has more records than the "New" data.
### Interpretation
The data suggests a period of increased sunspot activity around 1612, as observed by both Scheiner and Galileo. The differences in their observations could be due to variations in their instruments, observational techniques, or locations. The "Revised collection v1.2" likely represents an attempt to reconcile these different observations and create a more comprehensive dataset.
The bar chart reveals a seasonal pattern in observational activity, with a peak in the spring (around April 1612) and a decline towards the end of the year. This could be related to weather conditions affecting visibility or the availability of time for observations. The higher number of records in the "Revised Collection" suggests that it incorporates data from multiple sources or includes more detailed observations.
The decline in records towards the end of 1612 could indicate a decrease in interest in sunspot observations or a change in priorities for the observers. The data provides valuable insights into the early history of sunspot research and the challenges faced by early astronomers. The combination of the scatter plot and bar chart allows for a nuanced understanding of both the observed sunspot activity and the process of data collection and revision.
</details>
## 3.2. Comparing sunspot observations
By comparing all the sunspot observations made by Galileo analyzed in this work with those already included in V16, we realized of an important fact. There is a significant difference between two sunspot drawings made by Galileo on 3 May 1612. The number of sunspot groups recorded by Galileo for this date according to the sunspot drawing analyzed in this work is three. It is significantly lower than the nine groups recorded by Galileo according to V16 for the same day. This last value agrees with the observation corresponding to 3 May included in a more detailed sunspot drawing set made by Galileo from 3 to 11 May 1612 (Vokhmyanin & Zolotova, 2018). One difference between both observations is that the sunspot drawing with three groups was made after the sunrise while the observations where we can see nine groups were made in the afternoon (see page 82 in Galilei & Scheiner 2010). Thus, in the drawing made after sunrise, we can see that only the two largest groups and other big spot were recorded. However, the most remarkable difference between both records was because of the change in the observation method by Galileo. The first sunspot observations made by Galileo were carried out by telescope, for example, through the clouds. Benedetto Castelli, student of Galileo, discovered that one could project the solar image to observe the Sun in anytime during the day and not only behind clouds (Galilei & Scheiner 2010). Castelli completed this method projecting the Sun on a sheet that included a predetermined size of the solar disc, adjusting the solar disc to the circle of the sheet. Thus, Galileo made the first drawing on 3 May 1612, just after the sunrise, observing sunspots through the telescope and the drawing at the end of that day using the new methodology by projecting the solar image in a circle of 12.5 cm. The level of detail between these two drawings show the transition from old to new methodology and gives an idea on how affected to the number of sunspot groups recorded in the observation series by Galileo.
Table 1. Comparison between the daily number of sunspot groups obtained from the sunspot drawings made by Galileo and Scheiner analysed in this work for the same observation days.
| DATE | GALILEO | SCHEINER |
|-----------|-----------|------------|
| 16/3/1612 | 1 | 5 |
| 17/3/1612 | 4 | 5 |
|-------------|-----|-----|
| 18/3/1612 | 4 | 3 |
| 20/3/1612 | 2 | 4 |
| 21/3/1612 | 2 | 4 |
| 31/3/1612 | 3 | 3 |
| 3/4/1612 | 4 | 5 |
| 5/4/1612 | 3 | 3 |
| 6/4/1612 | 3 | 3 |
| 7/4/1612 | 3 | 3 |
Regarding the solar activity level recorded by Galileo and Scheiner, we note that the daily group number average recorded by Galileo according to V16 for the period AprilAugust 1612 is equal to 6.39 while the daily average of the group number recorded by Galileo taking into account the observations included in V16 in addition to the observations analyzed in this work is 5.25 (February-August 1612). In the case of Scheiner, the average of the group number for the period October-December 1611 according to V16 is 3.67 and it is very similar to the group average (3.74) adding to the calculation the sunspot observations made by Scheiner analyzed in this work. We found ten days with drawings by both observers (Table 1). Generally, Scheiner recorded more groups than Galileo. The group average obtained from Scheiner's records for these ten observation days is 3.8 while that one obtained from Galileo's observations is 2.9. Scheiner observed more groups than Galileo in five days. The greatest difference in the group counting occurred on 16 March 1612 when Scheiner recorded five groups while Galileo only one. Galileo recorded more groups than Scheiner only on 18 March 1612 when he recorded four groups and Scheiner three groups. They observed the same number of groups in four observation days (31 March and 5-7 April 1612). Figure 5 shows comparisons between the sunspot drawings made by Galileo and Scheiner in those ten common observation days. We can also see that: (i) Galileo did not record several groups recorded by Scheiner on the solar limb (group 'b' on 20 - 21 March and group 'e' on 31 March) and the significant group 'f' on 20 - 21 March, (ii) Galileo sometimes recorded one group in places where Scheiner recorded more than one (2
groups in groups 'b', 'c', and 'd' on 21 March and one group in groups 'g' and 'h' recorded by Scheiner on 3 April), and (iii) Galileo recorded a few groups not recorded by Scheiner (one group on 18 March and other below group 'g' recorded by Scheiner on 31 March corresponding to group 'h' assigned by Scheiner the previous days).
<details>
<summary>Image 6 Details</summary>
### Visual Description
\n
## Petri Dish Observations: Bacterial Growth Study
### Overview
The image presents a series of twelve circular diagrams, resembling petri dishes, arranged in a roughly 3x4 grid. Each "dish" appears to document bacterial growth, with small dots representing colonies and handwritten notes detailing observations. Dates are provided above each dish, ranging from March 16th to April 7th. The notes are primarily in Russian, with some Latin characters.
### Components/Axes
The primary components are the circular representations of petri dishes, dates above each dish, and handwritten notes within and around each dish. There are no explicit axes or legends in the traditional sense. The "axes" are implicitly defined by the circular boundaries of the dishes. The data points are the small dots representing bacterial colonies.
### Detailed Analysis or Content Details
Here's a breakdown of each dish, including date, transcribed text, and approximate colony counts. Note that colony counting is difficult due to overlapping dots and varying clarity.
1. **16 Mar:**
- Text: "16. Martj.h.v.v. 1."
- Colonies: Approximately 10-15.
- Additional Text (right side): "въ особе для аффекта. – Наблюд. точн. въ ротѣ об. не встр. никѣмъ никѣмъ" (Translation: "Specifically for the effect. - Observation precisely in the mouth of the subject. Not encountered anywhere.")
2. **17 Mar:**
- Text: "17. Martj.h.v.v. 2."
- Colonies: Approximately 8-12.
3. **18 Mar:**
- Text: "18. Martj.h.v.v. 3."
- Colonies: Approximately 12-18.
4. **20 Mar:**
- Text: "20. Martj.h.v.v. 5."
- Additional Text (right side): "Осн. въ особу" (Translation: "Mainly in the subject")
- Colonies: Approximately 10-15.
5. **21 Mar:**
- Text: "21. Martj.h.v.v. 6."
- Additional Text (right side): "Дн. 27 го посеща" (Translation: "Day 27 visited")
- Colonies: Approximately 15-20.
6. **31 Mar:**
- Text: "31. Martj.h.v.v. 16."
- Colonies: Approximately 10-15.
7. **3 Apr:**
- Text: "3. April.h.v.v. 19."
- Colonies: Approximately 12-18.
- Additional Text (right side): "Сл. въ особу" (Translation: "Following in the subject")
8. **5 Apr:**
- Text: "5. April.h.v.v. 21."
- Colonies: Approximately 15-20.
- Additional Text (right side): "Д.С. въ особу" (Translation: "D.S. in the subject")
9. **6 Apr:**
- Text: "6. April.h.v.v. 22."
- Colonies: Approximately 10-15.
10. **7 Apr:**
- Text: "7. April.h.v.v. 23."
- Colonies: Approximately 8-12.
11. **19 Mar:**
- Text: "19. Martj.h.v.v."
- Colonies: Approximately 10-15.
12. **20 Mar:**
- Text: "20. Martj.h.v.v."
- Colonies: Approximately 10-15.
### Key Observations
- Colony counts appear relatively consistent across the time period, ranging from approximately 8 to 20 colonies per dish.
- The handwritten notes in Russian suggest the study involves observations related to a "subject" (особу).
- The notes on March 16th and April 3rd specifically mention observations "in the mouth of the subject" and "following in the subject," respectively.
- The dates are not consecutive, suggesting observations were not made daily.
- The notation "h.v.v." appears consistently after the date, potentially representing a specific experimental condition or identifier.
### Interpretation
This image documents a time-series study of bacterial growth, likely related to a medical or biological investigation involving a human subject. The consistent colony counts suggest a stable growth environment or a controlled inoculation process. The Russian notes indicate the source of the bacteria is linked to the subject's mouth, and the study is tracking the bacteria's presence or behavior within the subject. The "h.v.v." notation could be a code for the specific strain of bacteria being studied, the method of inoculation, or a patient identifier. The sporadic dates suggest the study wasn't a continuous monitoring process, but rather involved periodic sampling and observation. The phrase "для аффекта" (for the effect) suggests the study is investigating the impact of something on bacterial growth, potentially a treatment or environmental factor. The notes about not encountering the bacteria elsewhere suggest it is localized to the subject's mouth. This is a historical document, likely from a period when medical record-keeping was less standardized, relying heavily on handwritten notes and observations.
</details>
Figure 5. Comparison between the sunspot drawings made by Scheiner (drawings at first and third columns) and Galileo (drawings at second and fourth columns) for the ten common observation days. Note that some Galileo's drawings are rotated in order to show the same orientation as Scheiner's drawings [Source: Galilei 1895a].
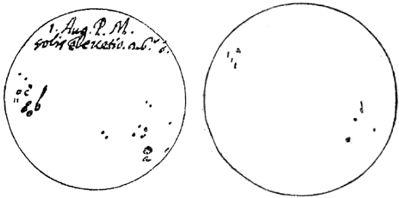
Although Scheiner generally recorded more groups than Galileo, we want to highlight a comment made by Scheiner assuming that Galileo's observations were better. The possible reasons of this fact, according to Scheiner, could be several factors such as the telescope used by Galileo or even the sight of Galileo. Scheiner compared his observations of the greatest sunspot group observed for the period 5 - 7 April 1612 with those made by Galileo and concluded that his records were similar to those by Galileo as well as the proportion of sizes and shapes of sunspots but he found differences in the accuracy for single sunspots (Galilei & Scheiner 2010, p. 225): '… From this it is clear that Galileo does not disagree with me at all about the main shapes and the conformation of all the spots with respect to each other, but only departs from me somewhat in the precision suitable for single spots. This could result either from the strength of the light or from the shortcomings of the tube, or from the intervention of the medium, or, finally, from weakness of the eyes…'. Figure 6 shows a comparison between the records made by Galileo (group A, B, and C) and Scheiner (red squares in the drawings) of the greatest sunspot group observed for the period 5 - 7 April 1612. We can see that the detail level provided by Galileo for that group is greater than that found in the sunspot drawings made by Scheiner.
Figure 6. Comparison of the greatest sunspot group observed for the period 5 - 7 April 1612 according to Galileo (group A, B, and C) and Scheiner (groups in the red squares in the sunspot drawings) [Source: Scheiner 1612].
<details>
<summary>Image 7 Details</summary>
### Visual Description
\n
## Diagram: Microscopic Observations
### Overview
The image presents a series of microscopic observations, likely of biological samples, arranged in a row. The observations are labeled A, B, C, 21, 22, and 23. Each observation, except A, B, and C, is contained within a circular frame. Within the circular frames, there are smaller, rectangular boxes containing the number "n" and a symbol resembling a small square. There is also handwritten text below each circular frame.
### Components/Axes
The image lacks traditional axes or a legend. The components are:
* **A, B, C:** Dense clusters of dots, representing microscopic structures.
* **21, 22, 23:** Circular frames containing dot clusters and a labeled box.
* **"n" Boxes:** Small rectangular boxes within the circles, containing the letter "n" and a square symbol.
* **Handwritten Text:** Text below each circular frame. The text appears to be in German.
### Content Details
Let's transcribe the handwritten text and attempt a translation:
* **21:** "5. April h. 6 ¼. v.k." - Translation: "5th April hour 6:15 a.m. v.k." (v.k. likely initials of the observer)
* **22:** "6. April h. 6 ¼. v.k." - Translation: "6th April hour 6:15 a.m. v.k."
* **23:** "7. April h. 6 ¼. v.k." - Translation: "7th April hour 6:15 a.m. v.k."
The dot clusters within the circles appear to be somewhat dispersed in 21, more concentrated in 22, and even more concentrated in 23. The "n" boxes are positioned in the top-right corner of each circle.
### Key Observations
* The observations are time-series data, spanning three days (April 5th, 6th, and 7th) at the same time (6:15 a.m.).
* The density of the dot clusters appears to increase over time (from 21 to 23).
* The "n" boxes suggest a count or measurement related to the observed structures.
* The handwritten notes indicate the date, time, and the initials of the observer.
### Interpretation
This diagram likely documents a biological process occurring over time. The increasing density of the dot clusters from observation 21 to 23 suggests a growth, aggregation, or concentration of the observed material. The "n" boxes likely represent a quantitative measurement of the observed structures, perhaps a cell count or a measure of density. The consistent time of observation (6:15 a.m.) suggests a controlled experiment or a regular monitoring schedule. The German text indicates the origin of the data and the observer. Without further context, it's difficult to determine the exact nature of the biological process being observed, but the data strongly suggests a dynamic change occurring over the three-day period. The initial observations A, B, and C may be control samples or initial conditions for the time-series observations 21, 22, and 23. The difference in presentation (no circle, no time stamp) suggests they are qualitatively different.
</details>
We can also compare some of the sunspot observations made by Scheiner and Galileo not included in V16 analyzed in this work with records made by other astronomers who observed in the same observation days as Galileo and Scheiner (Table 2).
Table 2. Number of sunspot groups recorded by Galileo (G), Scheiner (S) according to this work, and Harriot (H), Cigoli (CI), Jungius (J), and Colonna (CO) included in V16 for common observations days. The maximum daily number of groups for each day is indicated in bold when there are different number of groups recorded each day.
| DATE | G | S | H | CI | J | CO | DATE | G | S | H | CI | J | CO |
|------------|-----|-----|-----|------|-----|------|------------|-----|-----|-----|------|-----|------|
| 10/12/1611 | | 5 | 3 | | | | 21/3/1612 | 2 | 4 | 3 | 4 | | |
| 13/12/1611 | | 4 | 3 | | | | 22/3/1612 | | 1 | 2 | 4 | | |
| 14/12/1611 | | 4 | 2 | | | | 23/3/1612 | | 2 | 1 | 2 | | |
| 17/12/1611 | | 5 | 2 | | | | 24/3/1612 | | 2 | | 1 | | |
| 18/12/1611 | | 5 | 2 | | | | 26/3/1612 | | 2 | 2 | | | |
| 24/12/1611 | | 3 | 1 | | | | 27/3/1612 | | 2 | 2 | | | |
| 25/12/1611 | | 2 | 3 | | | | 28/3/1612 | | 3 | 2 | | | |
| 31/12/1611 | | 5 | 3 | | | | 31/3/1612 | 3 | 3 | 3 | | | |
| 4/1/1612 | | 4 | 2 | | | | 1/4/1612 | | 3 | 2 | | | |
| 5/1/1612 | | 4 | 3 | | | | 3/4/1612 | 4 | 5 | 4 | | | |
| 11/1/1612 | | 3 | 3 | | | | 4/4/1612 | | 3 | 3 | | | |
| 12/2/1612 | 3 | | 3 | | | | 6/4/1612 | 3 | 3 | 3 | | | |
| 17/2/1612 | 1 | | 1 | | | | 7/4/1612 | 3 | 3 | 3 | | | |
| 23/2/1612 | 6 | | | 6 | | | 10/4/1612 | 2 | | 2 | | | |
| 2/3/1612 | 0 | | 0 | 0 | | | 16/4/1612 | 1 | | 0 | | | |
| 4/3/1612 | 0 | | 0 | 0 | | | 29/4/1612 | 1 | | 2 | 1 | | |
| 16/3/1612 | 1 | 5 | | 4 | | | 30/4/1612 | 1 | | 2 | 1 | | |
| 17/3/1612 | 4 | 5 | | 4 | | | 1/5/1612 | 2 | | 2 | 1 | | |
| 18/3/1612 | 4 | 3 | | 2 | | | 3/5/1612 | 3 | | 4 | 3 | | |
| 19/3/1612 | | 4 | 1 | 2 | | | 27/11/1612 | | 5 | 6 | | | |
| 20/3/1612 | 2 | 4 | 2 | 2 | | | 1/8/1613 | | 6 | | | 2 | 3 |
Regarding these observations, Galileo recorded sunspot drawings in 16 observation days when Harriot also observed and 12 in the case of Cigoli. Taking into account only the observation days when Galileo and Harriot observed the same day: i) the average of the sunspot group number recorded by Harriot is 2.1 while it is 1.9 according to Galileo, and ii) Harriot observed a greater number of groups than Galileo in four days and, on the contrary, Galileo in only one In addition, Harriot recorded two groups on 1 March 1612 when Galileo reported in a note that he observed sunspots but without specifying the number of groups or single sunspots. In the case of the comparison between Galileo
and Cigoli regarding only days when both astronomers observed: i) the group average calculated from Cigoli's records is 2.3 while it is 2.2 from Galileo's observations, and ii) Galileo observed more groups than Cigoli in two days and Cigoli recorded more groups in other two days. We highlight one comment recorded by Cigoli in a letter sent to Galileo in March 1612 (Galilei 1895b, p. 287) to show him his sunspot observations: (English translation) 'I do not think I wrote to Your Excellence that I have a telescope, and it's very good, so much that I see the clock of Saint Peter's and the hand of the clock from Santa Maria Maggiore, but I do not see the numbers as clearly as with your telescope; but if you can give me some advice for more accurate, let me know'. Although Cigoli recorded observations similar to Galileo regarding the number of groups and even more groups in two observation days, the telescope used by Galileo to observe sunspots was better than that employed by Cigoli according to Cigoli's comment. From the change in the observation method by Galileo on 3 May 1612, we can see significant differences in the number of groups recorded by both observers. Thus, on 3 and 6 May 1612, Cigoli recorded 3 and 4 groups while Galileo observed 9 and 7 groups, according to V16, using the new methodology. Furthermore, in the common eight observation days when Galileo, Harriot, and Cigoli recorded observations, we can find differences in the group number recorded by the three observers in five days. Moreover, the daily average of the group number recorded by Harriot in those eight days (1.9) was higher than that by Galileo (1.4) and Cigoli (1.5).
Scheiner also made observations in observation days when Harriot and Cigoli observed. Scheiner and Harriot have 26 observation days in the same date while Cigoli and Scheiner 9 days. Regarding the observation days when Scheiner and Harriot observed the same day: i) the average of the group number recorded by Harriot in the matching 26 observation days is 2.5, significantly lower than the average of the group number according to Scheiner's records that it is 3.5, and ii) Scheiner recorded in 16 of the 26 observation days in common a greater number of groups than Harriot while Harriot only in three days recorded one group more than Scheiner In the case of the comparison with Cigoli: i) the average of the group number in accordance with Cigoli's records regarding those 9 days is 2.8 and 3.3 according to Scheiner, and ii) Cigoli recorded more groups than Scheiner on 22 March 1612, and Scheiner recorded more groups than Cigoli in five different days. The observation day number in which Harriot, Cigoli and
Scheiner observed the same day was five and the daily average of the group number recorded by each one was 1.8, 2.8, and 3.0, respectively. Furthermore, according to V16, Jungius observed five groups on 6 January 1613 when Scheiner recorded 6 groups (groups A, B, C, D-E-F, G, and H in Figure 2). We note that one observation made by Scheiner on 5 January 1613 recording five groups is included in V16. After studying the sunspot observations made by Scheiner, we think that this last sunspot record could be the same record presented in this work but with a misreading by V16 in the observation day. In addition, Scheiner, Colonna, and Jungius observed on 1 August 1613. Figure 7 (top panel) shows the sunspot drawings made by Scheiner and Colonna for that date. Although we can count six groups from Scheiner's drawing and, according to V16, Colonna recorded 3 groups, actually Colonna only recorded two groups less than Scheiner: one group next to facula 'a' on the solar limb and other with two sunspots closer to the apparent solar center. We also note that Jungius recorded two groups that day according to V16.
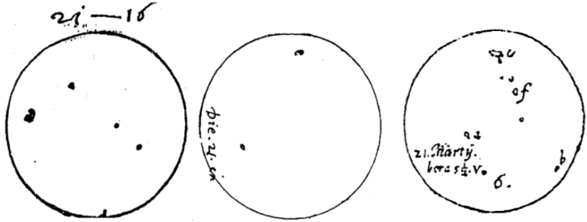
We can compare the observations made by Galileo, Scheiner, Cigoli, and Harriot only in one common observation day (21 March 1612). We have available the sunspot drawings made by Galileo, Scheiner, and Cigoli, but not that one by Harriot. Figure 7 (bottom panel) shows the sunspot drawings made by Cigoli, Galileo, and Scheiner on 21 March 1612. The group number recorded by Cigoli and Scheiner is the same (four groups) while Galileo only recorded two groups. We can see the sunspot positions recorded by Cigoli are slightly displaces to those made by Scheiner and Galileo, in particular, the sunspot corresponding to group 'a' assigned by Scheiner. We note that Harriot observed three sunspot groups in this day according to V16.
<details>
<summary>Image 8 Details</summary>
### Visual Description
\n
## Diagram: Bacterial Colony Observations
### Overview
The image presents two circular diagrams, likely representing petri dishes or similar growth media, with scattered dark dots indicating bacterial colonies. Each diagram is labeled with text, and some colonies within the left diagram are marked with letters. The image appears to be a historical scientific record of bacterial growth patterns.
### Components/Axes
The image consists of two circular areas, each representing a growth medium. The left circle has text at the top and labeled colonies. The right circle is unlabeled except for the colonies themselves. There are no explicit axes or scales.
### Detailed Analysis or Content Details
**Left Circle:**
* **Label:** "1. Aug. P.M. solir. Heretic. c.s." (English translation: "1. August Post Meridiem [after noon]. Soil. Heretic. c.s.")
* Colonies are scattered throughout the circle, with a higher concentration towards the bottom-right quadrant.
* Three colonies are labeled:
* "a" - Located in the top-left quadrant.
* "b" - Located slightly below and to the right of "a".
* "c" - Located in the bottom-right quadrant.
* A fourth colony is labeled "2" in the bottom-right quadrant.
**Right Circle:**
* The circle contains a smaller number of colonies, concentrated towards the top-left quadrant.
* There are four colonies labeled with numbers:
* "1" - Located in the top-left quadrant.
* "2" - Located slightly below and to the right of "1".
* "3" - Located in the bottom-right quadrant.
* "4" - Located slightly above and to the left of "3".
The size of the dots representing colonies appears relatively consistent within each diagram, suggesting similar growth rates or colony sizes.
### Key Observations
* The left circle shows a greater density of colonies compared to the right circle.
* The distribution of colonies differs between the two circles. The left circle has a more dispersed pattern, while the right circle has a more localized concentration.
* The labeling on the left circle suggests a specific experimental setup involving soil samples ("solir") and a designation ("Heretic"). The "c.s." is unclear without further context.
* The time stamp "Aug. P.M." indicates the observation was made in the afternoon of August.
### Interpretation
The image likely represents a comparative study of bacterial growth in different conditions or from different sources. The left circle, with its detailed labeling and higher colony count, may represent a primary experimental sample. The right circle could be a control sample or a variation of the experiment. The labeling of individual colonies ("a", "b", "c", "1", "2", "3", "4") suggests the researcher was tracking the growth of specific strains or observing morphological differences. The term "Heretic" is intriguing and could refer to a specific type of soil or a particular experimental condition considered unconventional at the time. The image provides a snapshot of early microbiological research, demonstrating the methods used to observe and document bacterial growth before the advent of modern techniques. The lack of quantitative data (e.g., colony counts, measurements) limits a more precise interpretation, but the visual differences in colony density and distribution suggest meaningful variations in growth conditions or bacterial populations.
</details>
Figure 7. (Top panel) Sunspot drawings made by Scheiner (left) and Colonna (right) on 1 August 1613. Note that: (i) marks 'a', 'b', and 'c' in Scheiner's drawing are facular regions and (ii) Colonna's drawing was rotated to show sunspots in the same orientation as Scheiner [Source: Galilei 1895b]. (Bottom panel) Sunspot drawings made by Cigoli (left), Galileo (middle), and Scheiner (right) on 21 March 1612. Note that Galileo's drawing was rotated to show sunspots with the same orientation as the other drawings [Source: Galilei 1895a,b].
<details>
<summary>Image 9 Details</summary>
### Visual Description
\n
## Diagram: Celestial Observations
### Overview
The image presents three circular diagrams, likely representing observations of celestial bodies (stars or planets) at different times. Each diagram contains a series of dots within a circle, accompanied by handwritten annotations. The diagrams appear to be hand-drawn, possibly from a historical astronomical record.
### Components/Axes
Each diagram consists of:
* **Circle:** Represents the field of view or the celestial sphere.
* **Dots:** Represent observed celestial objects.
* **Handwritten Annotations:** Labels indicating dates or other observational details.
The annotations are as follows:
* **Diagram 1 (Left):** "21 - 16" positioned at the top.
* **Diagram 2 (Center):** "Die. 24. ex" positioned at the center-left. (German: "Die" translates to "The", "24" is the day, and "ex" is likely an abbreviation for "exspectata" meaning "expected" or "observed").
* **Diagram 3 (Right):** "21. Marty. brash. v. 6." positioned at the bottom-right. (German: "Marty" likely refers to March, "brash" is likely an abbreviation for "Brasilia" or a location, and "v. 6" could be volume 6 or a page number).
* "24" is also present at the top of the third diagram.
There are no explicit axes or scales. The relative positions of the dots within the circles are the primary data points.
### Detailed Analysis or Content Details
The diagrams show varying densities of dots.
* **Diagram 1:** Contains approximately 6 dots, distributed somewhat evenly within the circle.
* **Diagram 2:** Contains approximately 8 dots, also distributed relatively evenly.
* **Diagram 3:** Contains approximately 10 dots, clustered more towards the top-right quadrant of the circle.
The dots themselves are small and appear to be of uniform size. The annotations are written in a cursive script, suggesting a historical context.
### Key Observations
* The number of observed objects varies between the three diagrams.
* The distribution of objects differs, with Diagram 3 showing a noticeable clustering.
* The annotations suggest observations were made on different dates ("21-16", "Die 24", "21 Marty").
* The annotations are in a mix of numerical and textual formats, and include German words.
### Interpretation
These diagrams likely represent a series of astronomical observations recorded over time. The varying number and distribution of dots could indicate changes in the visibility of celestial objects due to their movement, atmospheric conditions, or the observer's location. The annotations provide a temporal context for these observations. The use of German suggests the observations were made by a German-speaking astronomer or in a German-speaking region.
The clustering in Diagram 3 could represent a specific constellation or a group of stars that were particularly prominent on that date. The diagrams, while simple, provide valuable insights into historical astronomical practices and the methods used to record celestial phenomena. The lack of precise coordinates or scales suggests these were qualitative observations rather than precise measurements. The diagrams are not providing quantitative data, but rather a visual record of what was observed.
</details>
## 4. Conclusions
Galileo Galilei and Christoph Scheiner carried out sunspot observations during the first years of the telescopic era generating an intense debate about the nature of this phenomenon. Some of their sunspot records were not included in the sunspot group databases (Hoyt & Schatten 1998; Vaquero et al. 2016). We here analyze these sunspot observations in order to incorporate them into V16. We can fill 18 observation days in V16 where no record is available. Moreover, we can extend the observational coverage: (i) for Scheiner, from 33 records for the period October - December 1611 included in V16 to 78 until August 1613 and (ii) for Galileo, from 51 records included in V16 for the period May - August 1612 to 72 records regarding his sunspot records from February 1612. Furthermore, the values corresponding to the group number recorded for Scheiner on 13, 29 and 30 December 1611 and Galileo on 26 April 1612 must be corrected according to this new analysis.
We have detected changes in the quality of the sunspot observations made by Galileo and Scheiner. We found a significant improvement in the quality of Galileo's sunspot drawings from 3 May 1612. This fact was because he changed the observation method from observing sunspots through the telescope to drawings where sunspots were recorded by projecting the Sun on a sheet. We can see that this fact had an impact in the
number of sunspot groups recorded by Galileo by comparing his sunspot observations with Harriot's and Cigoli's records. According to the comparison to Harriot: (i) the daily average of the number of groups recorded by Galileo and Harriot from February to 3 May in the 16 common observation days is 1.9 and 2.1, respectively, while it is 6.8 and 4.2 from 3 May to August (24 common observation days) according to V16, respectively. In the case of Scheiner, we can also see a remarkable change in the sunspot drawings made in 1620s published by Scheiner (1630) in Rosa Ursina and his first sunspot records from 1611 to 1613 analyzed in this work. This was also due to a change in Scheiner's methodology. Scheiner passed to observe the Sun through the telescope with colored glasses in his first drawings to adopt the projection method in 1620s. Note that: (i) Carrasco et al. (2019c) indicated that Scheiner used the helioscope in 1620s, which allowed him to change his methodology and to improve the sunspot observations, and (ii) Arlt et al. (2016) pointed out the telescope used by Scheiner in 1620s had a Keplerian setup providing better image quality. Thus, this significant improvement in the quality of the observations of both astronomers affected to their group counts.
Scheiner generally recorded more groups than Galileo, Harriot, and Cigoli who recorded a similar number of groups. We concluded that the differences found in these comparisons were mainly because of the observational method employed by the observers. While Scheiner observed the Sun through colored glasses, the others astronomers observed when the Sun was, for example, behind clouds or through misty air (Galilei 1895a,b; Vokhmyanin, Arlt & Zolotova 2020). On 3 May 1612, Galileo started to use a new methodology to observe the Sun by projecting the solar image on a sheet and it improved his capacity to record sunspots. This fact has been proven by comparing the number of sunspot groups recorded by Galileo with those by Harriot and Cigoli before and after on 3 May 1612, date from which Galileo significantly recorded more groups than Cigoli and Harriot. Thus, the comparison carried out in this work can help to redefine the scale of the group number series over this important part of the 400year sunspot record. The sunspot observations made by Galileo observing directly by telescope (before 3 May 1612) and those made by projection (from 3 May 1612) should be considered like two independent observational sets. Thus, we will avoid problems of inhomogeneity. Moreover, the sunspot observations made by Galileo on 3 May 1612
from both methodologies could be used to calibrate both observational sets. Similarly, the sunspot observations made by Scheiner in 1610s and those made in 1620s should be considered as independent for the future reconstruction of the group number index.
This work shows up the need to continue the review work of the available information about the past solar activity. We have shown that the observations here analyzed can increase the observational coverage in the earliest period of the telescopic era but this coverage must be improved because the number of records in that period is still scarce. Other documentary sources with new information should be studied. Thereby, we will be able to improve our knowledge about long-term solar activity and to make more reliable future predictions.
## Acknowledgements
This research was supported by the Economy and Infrastructure Counselling of the Junta of Extremadura through project IB16127 and grant GR18097 (co-financed by the European Regional Development Fund) and by the Ministerio de Economía y Competitividad of the Spanish Government (CGL2017-87917-P). Authors acknowledge to the Lincean Academy Archive the information provided about the sunspot observations made by Scheiner in March-April 1612.
Disclosure of Potential Conflicts of Interest The authors declare that they have no conflicts of interest.
## References
- Arlt, R., Vaquero, J.M., 2020, Historical sunspot records, Living Rev. Solar Phys., 17, 1. DOI: 10.1007/s41116-020-0023-y.
- Arlt R., Senthamizh Pavai V., Schmiel C., Spada F., 2016, Sunspot positions, areas, and group tilt angles for 1611-1631 from observations by Christoph Scheiner, A&A, 595, A104. DOI: 10.1051/0004-6361/201629000.
- Carrasco V.M.S., 2019, Improving sunspot records: misreading of 'Rosa Ursina' by Scheiner, Observatory, 139, 153.
- Carrasco V.M.S., Vaquero J.M., Gallego M.C., Villalba Álvarez J., Hayakawa H., 2019a, Two debatable cases for the reconstruction of the solar activity around the
Maunder Minimum: Malapert and Derham, MNRAS: Letters, 485, L53. DOI: 10.1093/mnrasl/slz027.
- Carrasco V.M.S., Gallego M.C., Villalba Álvarez J., Vaquero J.M., 2019b, Sunspot observations by Charles Malapert during the period 1618-1626: a key data set to understand solar activity before the Maunder minimum, MNRAS, 488, 3884. DOI: 10.1093/mnras/stz1867.
- Carrasco V.M.S., Vaquero J.M., Gallego M.C., Muñoz-Jaramillo, A., de Toma G., Galaviz P., Arlt R., Senthamizh Pavai V., Sánchez-Bajo F., Villalba Álvarez J., Gómez J.M., 2019c, Sunspot Characteristics at the Onset of the Maunder Minimum Based on the Observations of Hevelius, ApJ, 886, 18. DOI: 10.3847/15384357/ab4ade.
- Casas R., Vaquero J.M., Vázquez M., 2006, Solar Rotation in the 17th century, Solar Phys., 234, 379. DOI: 10.1007/s11207-006-0036-2.
- Clette F., Lefèvre L., 2016, The New Sunspot Number: Assembling All Corrections, Solar Phys., 291, 2629. DOI: 10.1007/s11207-016-1014-y.
- Clette F., Svalgaard L., Vaquero J.M., Cliver E.W., 2014, Revisiting the Sunspot Number. A 400-year perspective on the solar cycle, Space Sci. Rev., 186, 35. DOI: 10.1007/s11214-014-0074-2.
- Eddy, J.A., 1976, The Maunder Minimum, Science, 192, 1189. DOI: 10.1126/science.192.4245.1189.
- Engvold O., Zirker J.B., 2016, The Parallel Worlds of Christoph Scheiner and Galileo Galilei, J. Hist. Astron., 47, 332. DOI: 10.1177/0021828616662406.
- Galilei G., 1613, Istoria e dimostrazioni intorno alle macchie Solari, Mascardi, Rome.
- Galilei G., 1895a, Le opere de Galileo Galilei vol. 5, G. Barbèra, Florence.
- Galilei G., 1895b, Le opere de Galileo Galilei vol. 11, G. Barbèra, Florence.
- Galilei G., Scheiner C., 2010, On sunspots, Galileo Galilei and Christoph Scheiner, University of Chicago Press, Chicago.
- Hoyt D.V., Schatten K.H., 1998, Group Sunspot Numbers: A New Solar Activity Reconstruction, Solar Phys., 179, 189. DOI: 10.1023/A:1005007527816.
- Kopp G., Krivova N., Wu C.J., Lean J., 2016, The Impact of the Revised Sunspot Record on Solar Irradiance Reconstructions, Solar Phys., 291, 2951. DOI: 10.1007/s11207-016-0853-x.
- Malapert C., 1633, Austriaca sidera heliocyclia astronomicis hypothesibus illigata, Baltazaris Belleri, Douai.
- McIntosh P.S., 1990, The classification of sunspot groups, Solar Phys., 125, 251. DOI: 10.1007/BF00158405.
- Muñoz-Jaramillo A, Vaquero J.M., 2019, Visualization of the challenges and limitations of the long-term sunspot number record, Nature Astron., 3, 205, DOI: 10.1038/s41550-018-0638-2.
- Neuhäuser R., Neuhäuser D.L., 2016, Sunspot numbers based on historic records in the 1610s: Early telescopic observations by Simon Marius and others, Astron. Nachr., 337, 581. DOI: 10.1002/asna.201512292.
- Sakurai K., 1980, The Solar Activity in the Time of Galileo, J. Hist. Astron., 11, 164. DOI: 10.1177/002182868001100302.
- Scheiner C., 1612, De maculis solaribus et stellis circa Jovem errantibus accuratior disquisitio, Augustae Vindelicorum, Ausburg.
- Scheiner C., 1615, Sol ellipticus: hoc est novuum et perpetuum Solis contrahi soliti Phaenomenon, quod noviter inventum Strenae loco, C. Mangius, Augsburg.
- Scheiner C., 1630, Rosa Ursina Sive Sol, Andrea Fei, Bracciano.
- Usoskin I.G., 2017, A history of solar activity over millennia, Living Rev. Solar Phys., 14, 3. DOI: 10.1007/s41116-017-0006-9.
- Usoskin, I.G., Arlt, R., Asvestari, E., et al., 2015, The Maunder minimum (1645-1715) was indeed a Grand minimum: A reassessment of multiple datasets, A&A, 581, A95. DOI: 10.1051/0004-6361/201526652.
- Vaquero J.M., Vázquez M., 2009, The Sun Recorded Through History, Springer, Berlin. DOI: 10.1007/978-0-387-92789-3.
Vaquero J.M., Gallego M.C., García J.A., 2002, A 250-year cycle in naked-eye observations of sunspots, Geophys. Res. Lett., 29, 58. DOI: 10.1029/2002GL014782.
- Vaquero J.M., Svalgaard L., Carrasco V.M.S., Clette F., Lefèvre L., Gallego M.C., Arlt R., Aparicio A.J.P., Richard J.-G., Howe R., 2016, A Revised Collection of Sunspot Group Numbers, Solar Phys., 291, 3061. DOI: 10.1007/s11207-016-0982-2.
- Vokhmyanin M.V., Zolotova N.V., 2018, Sunspot Positions and Areas from Observations by Galileo Galilei, Solar Phys., 293, 31. DOI: 10.1007/s11207-0181245-1.
- Vokhmyanin M.V., Arlt, R., Zolotova N.V., 2020, Sunspot Positions and Areas from Observations by Thomas Harriot, Solar Phys., 295, 39. DOI: 10.1007/s11207-02001604-4.
- Yau K.K.C., Stephenson F.R.: 1988, A revised catalogue of Far Eastern observations of sunspots (165 BC to AD 1918), Quart. J. Roy. Astron. Soc., 29, 175.