# Visually Informed Binaural Audio Generation without Binaural Audios
**Authors**: Xudong Xu, Hang Zhou, Ziwei Liu, Bo Dai, Xiaogang Wang, Dahua Lin
## Visually Informed Binaural Audio Generation without Binaural Audios
Xudong Xu 1 * Hang Zhou 1 * Ziwei Liu 2 Bo Dai 2 Xiaogang Wang 1 Dahua Lin 1 1 CUHK - SenseTime Joint Lab, The Chinese University of Hong Kong 2 S-Lab, Nanyang Technological University
{xx018@ie,zhouhang@link,xgwang@ee,dhlin@ie}.cuhk.edu.hk , {ziwei.liu,bo.dai}@ntu.edu.sg
## Abstract
Stereophonic audio, especially binaural audio, plays an essential role in immersive viewing environments. Recent research has explored generating visually guided stereophonic audios supervised by multi-channel audio collections. However, due to the requirement of professional recording devices, existing datasets are limited in scale and variety, which impedes the generalization of supervised methods in real-world scenarios. In this work, we propose PseudoBinaural , an effective pipeline that is free of binaural recordings. The key insight is to carefully build pseudo visual-stereo pairs with mono data for training. Specifically, we leverage spherical harmonic decomposition and head-related impulse response (HRIR) to identify the relationship between spatial locations and received binaural audios. Then in the visual modality, corresponding visual cues of the mono data are manually placed at sound source positions to form the pairs. Compared to fully-supervised paradigms, our binaural-recording-free pipeline shows great stability in cross-dataset evaluation and achieves comparable performance under subjective preference. Moreover, combined with binaural recordings, our method is able to further boost the performance of binaural audio generation under supervised settings 1 .
## 1. Introduction
Auditory and visual experiences are implicitly but strongly connected. In immersive environments, the perception of sound is impacted by visual scenes [48]. Therefore, researchers have explored ways to generate stereophonic audios with visual guidance, in order to improve the user experience in multimedia products. Specifically, supervised learning methods [22, 14, 20, 49] have been considered for this purpose.
* Equal contribution.
1 Code, models and demo videos are available at https:// sheldontsui.github.io/projects/PseudoBinaural .
However, it is noteworthy that fully-supervised learning methods, despite the positive results that they achieve under constrained settings, would face significant difficulties in real-world applications. 1) They rely on videos associated with stereophonic recordings, which we refer to as 'visualstereo' pairs [22, 14]. Obtaining a high-quality collection of real stereo data requires complicated and professional recording systems ( e.g. microphone arrays or dummy heads), thus is both resource-demanding and time-consuming. 2) The models trained on datasets collected under controlled environments may overfit to the layout of the rooms, rather than capturing the general associations between sound effects and the visual locations of the sound sources. The resultant models would also have poor generalization capability.
The privilege of learning representations from unlabeled data has been well discussed in different fields of deep learning [43, 18, 3, 23, 25]. This inspires us to explore an alternative approach, namely, to use only mono audios which can be acquired much more easily compared to binaural audios. We note that mono audios have been successfully applied in learning visually informed sound separation [9, 1, 13, 46, 45, 15]. Zhou et al. [49] recently leverage mono audios for stereo generation. However, their stereophonic learning procedure still depends on stereo data.
In this work, we propose PseudoBinaural , a novel pipeline that generates visually coherent binaural audios without accessing any recorded binaural data. Our key insight is to carefully build pseudo visual-stereo pairs from mono data. Two questions need to be identified in order to achieve our goal. Given a spatial location, 1) what is the relationship between a mono audio and its binaural counterpart sourcing from that location? 2) How should visual cues be organized to represent the source visually? Our solution is to utilize two mappings. A Mono-Binaural-Mapping to reproduce binaural audios of a single source positioned at any spatial location, and a Visual-Coordinate-Mapping that associates visual modality with spatial locations. Specifically, the Mono-Binaural-Mapping is achieved by adopting spherical harmonic decomposition [8]. A head-related impulse response (HRIR) [6] is then used to render binaural
̂
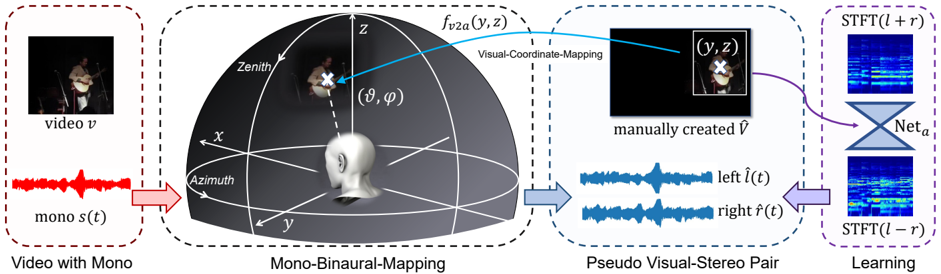
Figure 1: The pipeline of our method. Given one mono source, we create a pseudo visual-stereo pair { ˆ V , ( ˆ l, ˆ r ) } by assigning the source direction ϑ = ( ϑ, ϕ ) in the spherical coordinates according to our manually created ˆ V . Then mono source s ( t ) is converted to binaural channels ( ˆ l ( t, ϑ ) , ˆ r ( t, ϑ )) through our Mono-Binaural-Mapping procedure by leveraging spherical harmonics decomposition. Within this pipeline, multiple sources can be linearly blended together to build training pairs. Then mono-to-binaural networks can be trained on the created pseudo data.
<details>
<summary>Image 1 Details</summary>
### Visual Description
\n
## Diagram: Spatial Audio Processing Pipeline
### Overview
This diagram illustrates a pipeline for converting monaural audio from a video source into a pseudo-stereo pair, and then using this to train a neural network for spatial audio processing. The pipeline consists of four main stages: Video with Mono, Mono-Binaural-Mapping, Pseudo Visual-Stereo Pair, and Learning. The diagram uses a spherical coordinate system to map visual information to spatial audio cues.
### Components/Axes
The diagram is divided into four sections, each enclosed by a dashed-line rectangle and labeled:
1. **Video with Mono:** Contains a video frame and a monaural audio waveform.
2. **Mono-Binaural-Mapping:** Depicts a 3D spherical coordinate system with labels for Azimuth, Zenith, and the coordinates (θ, φ).
3. **Pseudo Visual-Stereo Pair:** Shows two video frames with corresponding left and right audio waveforms.
4. **Learning:** Illustrates a neural network (Net<sub>a</sub>) processing Short-Time Fourier Transform (STFT) representations of the audio.
Key labels include:
* **video v:** Represents the input video.
* **mono ˆf(t):** Represents the monaural audio waveform.
* **f<sub>v2a</sub>(y, z):** Represents the visual-coordinate mapping function.
* **manually created ˆf:** Represents the manually created audio.
* **left ˆf(t):** Represents the left audio channel waveform.
* **right ˆf(t):** Represents the right audio channel waveform.
* **Net<sub>a</sub>:** Represents the neural network.
* **STFT(t + r):** Represents the Short-Time Fourier Transform of the left channel.
* **STFT(t - r):** Represents the Short-Time Fourier Transform of the right channel.
* **Azimuth:** Angle in the x-y plane.
* **Zenith:** Angle from the z-axis.
* **(θ, φ):** Spherical coordinates.
* **(y, z):** Visual coordinates.
### Detailed Analysis or Content Details
1. **Video with Mono:** A video frame showing a person playing a violin is present. Below it is a red waveform labeled "mono ˆf(t)". The waveform appears to be a typical audio signal with varying amplitude over time.
2. **Mono-Binaural-Mapping:** A 3D sphere is shown with a coordinate system (x, y, z). A person is positioned within the sphere, and an arrow points from the person to the coordinates (θ, φ). Another arrow points from the coordinates (y, z) to the next stage. The sphere is bisected by the x-y plane, labeled "Azimuth", and the z-axis is labeled "Zenith".
3. **Pseudo Visual-Stereo Pair:** Two video frames are shown, both displaying the same person playing the violin. Above the left frame is a blue waveform labeled "left ˆf(t)", and above the right frame is a blue waveform labeled "right ˆf(t)".
4. **Learning:** Two spectrograms are shown, one labeled "STFT(t + r)" and the other labeled "STFT(t - r)". These represent the Short-Time Fourier Transform of the left and right audio channels, respectively. Both spectrograms are fed into a neural network labeled "Net<sub>a</sub>". The network has a triangular shape, suggesting a processing or transformation stage.
### Key Observations
The diagram demonstrates a process of mapping visual information from a video to spatial audio cues. The use of spherical coordinates suggests an attempt to represent sound source location in 3D space. The creation of a pseudo-stereo pair from monaural audio indicates a method for generating spatial audio effects. The neural network is likely trained to learn the relationship between visual cues and spatial audio characteristics.
### Interpretation
This diagram outlines a system for generating spatial audio from video content. The core idea is to use visual information (the position of sound sources in the video frame) to create a binaural audio experience. The "Mono-Binaural-Mapping" stage is crucial, as it defines how visual coordinates are translated into spatial audio cues (left/right channel differences). The neural network is then trained to refine this mapping, potentially learning to create more realistic and immersive spatial audio. The use of STFTs suggests that the network operates in the frequency domain, allowing it to manipulate the spectral characteristics of the audio to create spatial effects. The manually created audio suggests a ground truth or target for the mapping process. The diagram suggests a data-driven approach to spatial audio rendering, where the neural network learns to associate visual cues with appropriate audio spatialization. The system could be used for applications such as virtual reality, augmented reality, or immersive video playback.
</details>
audios from the zero- and first-order terms of the decomposition. As for the Visual-Coordinate-Mapping, we pre-define a correspondence between pixel coordinates and spherical coordinates, so that we can easily manipulate visual content to meet the designation of the corresponding source direction.
Existing models for visually informed binaural audio generation can be readily adapted to train on our pseudo visual-stereo pairs. In order to make the best use of mono data, we further propose a new way of leveraging the task of audio-visual source separation [46, 15] to assist the training. The inference procedure is to simply apply the trained models to videos with mono audios and generate corresponding binaural audios. Our framework renders stable performances on two datasets and in-the-wild scenarios. Moreover, we can mix our pseudo data with real stereophonic recordings to further boost the performance of binaural audio generation under the supervised setting.
Our contributions can be summarized as follows: 1) We identify the mapping between source directions and binaural audios with theoretical analysis. 2) By manipulating the visual modality, pseudo visual-stereo pairs can be generated for model training without relying on any recorded binaural data. 3) Extensive experiments validate the effectiveness and stability of our method on a variety of scenes. Moreover, our pseudo visual-stereo data can serve as a strong augmentation under the supervised setting.
## 2. Related Work
Visually Informed Stereophonic Audio Generation. While stereo is strongly correlated with visual information, only few papers have proposed to guide the generation of stereo with vision. Li et al. [19] combine a synthesized early reverberation and a measured late reverberation tail for the generation of stereo sound in the desired room. However, the usage of such method is restricted to specific rooms and serves for 360 ◦ videos. Morgado et al. [22] propose to recover ambisonics based on the datasets collected from YouTube. They assume that their end-to-end network is able to separate sound sources and reformulate them with learnable weights. Lu et al. [20] leverage flow with corresponding classifier for stereo generation. Specifically, Gao et al. [14] collect the FAIR-Play dataset using professional bianural audio collecting mics in a music room. Then they propose the Mono2bianural pipeline for converting mono audios to bianural ones in a U-Net framework. Their data is precious yet limited, models trained on their lab-collected data are difficult to generalize well on in-the-wild scenarios. Very recently, Zhou et al. [49] leverage mono data and propose to tackle stereophonic audio generation and source separation at the same time. Nevertheless, their method uses mono data to train separation only. All the above methods rely on recorded stereophonic data and visual-stereo pairs for training. We target to generate visually guided binaural audios without any binaural data.
Visually Indicated Sound Source Separation. The task of visually guided sound source separation aims at separating a mixed audio into independent ones, according to their sound source's visual appearances. It has long been an interest of research for both human speech [10, 21, 26, 9, 1] and music [27, 13, 46, 45, 15, 11, 38, 35]. Recent learningbased methods [1, 46, 45, 15, 42] all leverage the Mix-andSeparate training pipeline that creates training pairs using collected solo data. Our work also exploits the same type of data to build training samples for binaural generation. We also adopt the setting of separating two sources [49] to boost the final performance.
Sound Source Localization. One of the most important features for human auditory system is to localize sound by the subtle differences of intensity, spectral and time cues between ears [7]. In the audio domain, previous research
mostly relies on microphone arrays to perform direction of arrival estimation [44]. Multi-modality works learn audiovisual associations [4, 5, 37, 36, 47, 41, 50] and propose to localize the responses of sound in the visual domains [46, 32, 28, 17] a different type of 'source localization". Recent works [12, 39] propose to detect the position of vehicles with stereo audio, which deals with the opposite of our task. Normally, the visualization of activation is used to show auditorily associated visual information [4, 26, 25, 5, 45, 22, 14]. Our model also shows the ability of source localization by training only on our pseudo visual-stereo pairs.
## 3. Methodology
Different from previous completely learning-based and data-driven methods that rely on the ground-truth stereo, we train networks on self-created pseudo visual-stereo pairs. Our method is thus called PseudoBinaural . The overall pipeline is illustrated in Fig. 1.
## 3.1. Mapping Mono to Binaural
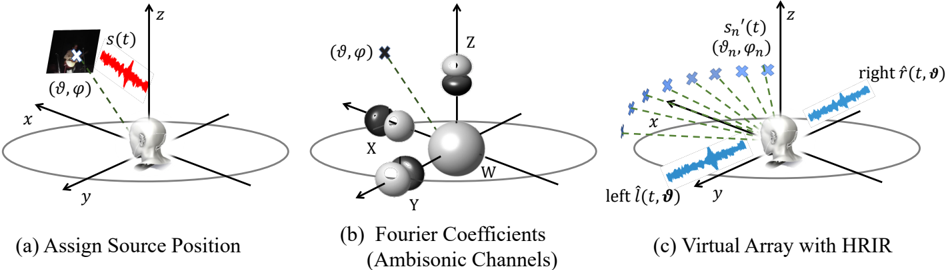
The key of our method relies on identifying the relationship between mono and stereo. This whole procedure, as illustrated in Fig. 2, is called Mono-Binaural-Mapping . Given a mono audio with an arbitrarily assigned source position ϑ = ( ϑ, ϕ ) (Fig. 2 a ), our goal is to first convert it to binaural channels with correct auditory sense of location. We empirically choose spherical harmonic decomposition for its expressive ability and its substantial connection with ambisonics (Fig. 2 b ). Finally, the decomposed coefficients are transformed to virtual array and rendered to audios with HRIR (Fig. 2 c ).
Spherical Harmonic Decomposition. The Laplace spherical harmonics represent a complete set of orthonormal basis defined on sphere surface [8]. The normalized form of spherical harmonics defined at azimuth angle ϑ and zenith angle ϕ in spherical coordinates can be represented as:
<!-- formula-not-decoded -->
where P | m | l (cos ϕ ) is the associated Legendre polynomials, integer l is its order and m is the degree, limited to [ -l, l ] . N | m | l is a normalization factor. Real spherical harmonics can serve as a type of generalized Fourier series, to decompose any function f :
<!-- formula-not-decoded -->
The coefficients Ψ l m are the analogs of Fourier coefficients which can be represented as ( ∗ denotes the conjunction):
<!-- formula-not-decoded -->
Decomposed Coefficients for Mono Source. Here we follow the simplest assumption that only the impulse response from the direction ϑ = ( ϑ, ϕ ) of a single sound source s ( t ) is received, the Fourier coefficients can be derived from Eq. (3) as:
<!-- formula-not-decoded -->
This is the same as the encoding of ambisonics, where the Ψ l m ( ϑ ) can also be regarded as ambisonics' components. For simplicity, ϑ is omitted in the following representations associated with this pre-defined direction.
The zero- and first-order components ( l = 0 , 1 ) that contribute most to 3D audio effect are leveraged in our model. Based on Eq. (1) and Eq. (4), the coefficients { Ψ 0 0 , Ψ 1 1 , Ψ -1 1 , Ψ 0 1 } ( ϑ omitted) can be written as:
<!-- formula-not-decoded -->
which correspond to the W, X, Y and Z channels of ambisonics, respectively. W is the omnidirectional base channel, X, Y and Z are the orthogonal channels lie along 3D Cartesian axes as illustrated in Fig. 2 (b).
Weadopt the Schmidt semi-normalization (SN3D) [40] to Eq. (1), which can be written as N l m = √ (2 -δ m ) ( l -| m | )! ( l + | m | )! , where δ m = 1 if m = 0 else 0 .
Binaural Decoding. Regarding the decomposed coefficients as ambisonic channels, we can roughly predict the left and right binaural channels ˆ l ( t ) and ˆ r ( t ) using simple transformation: ˆ l ( t ) = W + Yand ˆ r ( t ) = W -Y. However, this paradigm is unable to recover real binaural.
On the other hand, binaural sound can be directly synthesized given a source position with the head-related impulse response (HRIR). One set of HRIR data can serve as filters h r ( ϑ ) and h l ( ϑ ) with respect to the direction ϑ of the sound source. The transferred binaural sound can be represented as ˆ l ( t ) = h l ( ϑ ) s ( t ) and ˆ r ( t ) = h r ( ϑ ) s ( t ) , where is the convolution operation. However, open-sourced HRIR [2] are recorded in the free-field, thus cannot recover binaurals in a normal scene owing to reverberations.
Our solution is to leverage the binaural rendering technique that combines ambisonics with HRIR [24]. A virtual speaker array is pre-defined to make up for the reverberations as shown in Fig. 2 (c). Denoting the Fourier coefficients (ambisonic channels) as vectors Ψ( ϑ ) = s ( t ) Y ( ϑ ) = [Ψ 0 0 , Ψ 1 1 , Ψ -1 1 , Ψ 0 1 ] T (Refer to Eq. 5), we can further decompose Ψ( ϑ ) into M virtual speakers at directions Θ = [ ϑ ′ 1 , . . . , ϑ ′ M ] to analog the multi-source effect caused by room reverberations. We define the matrix D (Θ) = [ Y ( ϑ ′ 1 ) , . . . , Y ( ϑ ′ M )] , each column representing
𝑧𝑧
̂
Figure 2: The steps for the Mono-Binaural-Mapping procedure. (a) Firstly the mono sound source s ( t ) is assigned at direction ϑ = ( ϑ, ϕ ) . (b) Then through spherical harmonics decomposition of the source, we can derive the zero- and first-order spherical-based Fourier coefficients (which are also ambisonic channels). The figure represents the directions of the channels. (c) Finally, the Fourier coefficients can be transferred to a set of speaker array with fixed positions, and generate binaural with HRIR.
<details>
<summary>Image 2 Details</summary>
### Visual Description
\n
## Diagram: Spatial Audio Processing Pipeline
### Overview
The image depicts a three-part diagram illustrating a spatial audio processing pipeline. It shows how a sound source position is translated into ambisonic coefficients and then into signals for a virtual array of speakers using Head-Related Impulse Responses (HRIRs). Each part of the diagram is labeled (a), (b), and (c) and has a descriptive title.
### Components/Axes
Each sub-diagram features a 3D Cartesian coordinate system (x, y, z). The diagrams also include the following labels:
* **(a) Assign Source Position:** Labels include 's(t)' representing the sound source, 'x', 'y', 'z' for the coordinate axes, and 'θ, φ' representing spherical coordinates. A small inset image shows a waveform with a crosshair indicating a source location.
* **(b) Fourier Coefficients (Ambisonic Channels):** Labels include 'θ, φ' representing spherical coordinates, 'w' representing a central ambisonic channel, and 'x', 'y', 'z' for the coordinate axes. Black and white spheres represent ambisonic channels.
* **(c) Virtual Array with HRIR:** Labels include 'sn(t)' and '(vn, φn)' representing the nth virtual source, 'right f(t, θ)' and 'left f(t, θ)' representing the output signals for the right and left channels, 'x', 'y', 'z' for the coordinate axes. Blue waveforms represent the signals, and green dashed lines represent HRIRs.
### Detailed Analysis or Content Details
**(a) Assign Source Position:**
This diagram shows a sound source 's(t)' positioned in 3D space defined by Cartesian coordinates (x, y, z) and spherical coordinates (θ, φ). The inset image shows a waveform with a cross indicating the source location. The waveform appears to be a short burst or transient signal.
**(b) Fourier Coefficients (Ambisonic Channels):**
This diagram illustrates the decomposition of the sound source into a set of ambisonic coefficients. A central white sphere labeled 'w' represents the W channel (omnidirectional). Surrounding it are black and white spheres representing other ambisonic channels. Dashed lines connect the source position (θ, φ) to each of these spheres, indicating the calculation of the coefficients. The spheres are positioned along the x, y, and z axes.
**(c) Virtual Array with HRIR:**
This diagram depicts the final stage of the pipeline, where the ambisonic coefficients are used to drive a virtual array of speakers. The nth virtual source 'sn(t)' is defined by coordinates (vn, φn). Green dashed lines represent Head-Related Impulse Responses (HRIRs) that convolve with the ambisonic signals to create binaural signals for the left and right channels: 'left f(t, θ)' and 'right f(t, θ)'. Blue waveforms represent the output signals for the left and right channels. The waveforms appear to be complex and varied, suggesting the effect of the HRIRs.
### Key Observations
* The pipeline progresses from a single sound source to a representation in the ambisonic domain and finally to binaural signals for playback.
* The use of spherical coordinates (θ, φ) is consistent throughout the diagram, indicating their importance in representing sound source location.
* HRIRs are crucial for creating the spatial impression by accounting for the listener's head and ear shape.
* The ambisonic representation allows for efficient encoding and decoding of spatial audio.
### Interpretation
This diagram illustrates a common approach to spatial audio rendering. The process begins by defining the location of a sound source in 3D space. This location is then used to calculate a set of ambisonic coefficients, which represent the sound field. Finally, these coefficients are convolved with HRIRs to create binaural signals that can be played back over headphones or speakers to create a realistic spatial experience. The diagram highlights the key steps involved in this process and the importance of each component. The use of ambisonics allows for a compact and efficient representation of the sound field, while HRIRs provide the necessary cues for localization. The diagram suggests a system designed for virtual or augmented reality applications where accurate spatial audio is critical for immersion. The diagram does not provide any numerical data, but rather a conceptual overview of the process.
</details>
the harmonics for each virtual source. The virtual audio signals s ′ ( t ) = [ s ′ 1 ( t ) , . . . , s ′ M ( t )] T can be constraint as:
<!-- formula-not-decoded -->
As the matrix D (Θ) T D (Θ) is of full-column rank, the virtual signals can be computed:
<!-- formula-not-decoded -->
Finally, we take advantage of HRIR filters to acquire the desired left and right channels:
<!-- formula-not-decoded -->
<!-- formula-not-decoded -->
The above is the binaural audio generated from a single mono source s ( t ) from direction ϑ .
## 3.2. Creating Pseudo Visual-Stereo Pairs
With the Mono-Binaural-Mapping. there are two questions left to achieve visually informed binaural generation: 1) How to leverage the visual information, and 2) how to connect the direction of the sound source with visual information. To this end, we create pseudo visual information and define a Visual-Coordinate-Mapping .
Pseudo Visual Information Creation. As illustrated in Fig. 1, assuming that the listener is facing towards the x axis in 3D Cartesian coordinates, frontal-view scenes can thus be projected to the y -z image plane. Given a video v k with a single sound source, we can place the center of the sound source v ′ k to a random position in the image plane. More specifically, the cropped frames v ′ k are placed to a background image ˆ V according to ˆ V ( y, z ) = v ′ k .
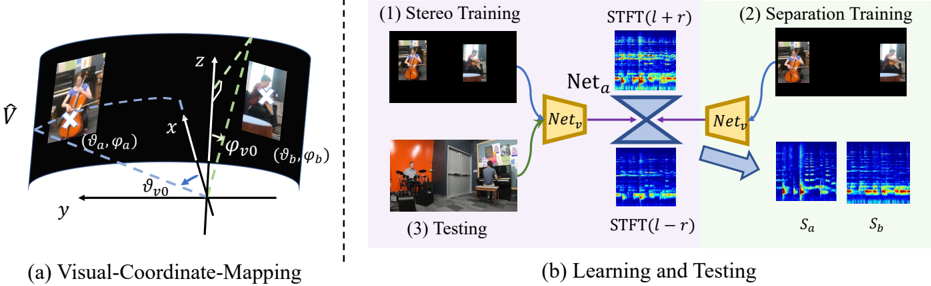
Visual-Coordinate-Mapping. We then define the mapping f v 2 a from pixel position ( y, z ) on frontal-view images to spherical angles ϑ = f v 2 a ( y, z ) . In the spherical coordinate, the frontal-view image plane is defined as part of a cylinder centered at the coordinate origin as shown in Fig. 3 (a).
Based on the fact that the effective visual field of humans is approximately 120 degrees [34], we define the border azimuth angle as ϑ v 0 = π/ 3 . So that objects within ˆ V are distributed within ϑ ∈ [ -ϑ v 0 , ϑ v 0 ] . The ratio between the height and width of the background image is set to H/W = 1 / 2 , thus the top edge of the image is corresponding to ϕ v 0 = π/ 2 -arctan( π/ 3) . The range is ϕ ∈ [ π/ 2 -arctan( π/ 3) , π/ 2 + arctan( π/ 3)] . In this way, for each point in the image plane, we can find an angle in the spherical coordinate. We have also explored other field of view settings and find subtle differences.
Create Pseudo Visual-Stereo Pairs. By calculating the corresponding angle ϑ k in spherical coordinates, a pair of binaural audios { ˆ r k ( t, ϑ k ) , ˆ l k ( t, ϑ k ) } can be recovered from the mono audio s k ( t ) accompanying v k ( t ) through Eq. (8).
Audio recordings collected in real-world scenarios are mostly mixed,therefore, we propose to mix multiple solo videos together in one scene to create pseudo visual-stereo pairs { ˆ V , ( ˆ l, ˆ r ) } . Each time, we assemble a random number of K independent mono videos s ( t ) = { s 1 ( t ) , . . . , s K ( t ) } together to form a pseudo visual-stereo pair. The self-created binaural can be written as ˆ l ( t ) = ∑ K k =1 ˆ l k ( t, ϑ k ) and ˆ r ( t ) = ∑ K k =1 ˆ r k ( t, ϑ k ) . The manually built visual information is ˆ V , where ˆ V ( ϑ k ) = v k , k ∈ [1 , K ] .
Note that the patch size and audio amplitude are both directly proportional to the reciprocal of the depth. Therefore, the mono audio is firstly normalized according to its wave amplitude, and the corresponding cropped patch v ′ k is normalized in the same scale as the audio. When the pseudo scene is assembled, v ′ k is randomly resized and placed on ˆ V
Figure 3: (a) Mapping from visual positions in the image domain to spherical angles. Normally we place the image ˆ V at the frontal-view to be part of a cylinder. The borders of the image are corresponding to the angles ϕ v 0 and ϑ v 0 . (b) Network details. The input to the audio UNet Net a is the STFT of a mono audio. The output is the prediction of the STFT difference between the left and right channels. During training, Net v extract the visual feature f v from our self-created image ˆ V , and concatenate it to the audio UNet. During testing, this network can be applied to normal frames.
<details>
<summary>Image 3 Details</summary>
### Visual Description
## Diagram: Visual-Coordinate Mapping and Learning/Testing Pipeline
### Overview
The image presents a diagram illustrating a system for audio-visual source separation. It is divided into two main parts: (a) a visual-coordinate mapping scheme and (b) a learning and testing pipeline. The left side depicts a curved visual field mapped onto a 3D coordinate system, while the right side shows a process involving stereo training, separation training, and testing using neural networks and spectrograms.
### Components/Axes
**Part (a): Visual-Coordinate Mapping**
* **Axes:** x, y, z – representing a 3D coordinate system.
* **Angles:** φ<sub>v0</sub>, φ<sub>v</sub> – angles defining the visual field.
* **Points:** (x<sub>a</sub>, y<sub>a</sub>), (x<sub>b</sub>, y<sub>b</sub>) – points on the curved visual field.
* **Vector:** A vector labeled 'v̂' pointing outwards from the origin.
* **Curved Surface:** A curved surface representing the visual field, with images of musicians displayed on it.
**Part (b): Learning and Testing**
* **Stages:** (1) Stereo Training, (2) Separation Training, (3) Testing.
* **Inputs:** Images of musicians, spectrograms labeled STFT(l + r) and STFT(l - r).
* **Networks:** Net<sub>a</sub>, Net<sub>v</sub>, Net<sub>t</sub> – neural networks used in the pipeline.
* **Outputs:** Spectrograms labeled S<sub>a</sub> and S<sub>b</sub>.
* **Arrows:** Blue arrows indicating the flow of data through the networks.
### Detailed Analysis or Content Details
**Part (a): Visual-Coordinate Mapping**
The diagram shows a curved surface representing a visual field. The x, y, and z axes define a 3D coordinate system. Two points, (x<sub>a</sub>, y<sub>a</sub>) and (x<sub>b</sub>, y<sub>b</sub>), are marked on the curved surface. The angles φ<sub>v0</sub> and φ<sub>v</sub> are defined relative to the y-axis and a vector 'v̂'. The curved surface appears to represent a wide-angle view, with images of musicians visible on it.
**Part (b): Learning and Testing**
* **(1) Stereo Training:** Two images of musicians are shown as input. These are processed to generate spectrograms STFT(l + r) and STFT(l - r). These spectrograms are then fed into two neural networks, Net<sub>a</sub> and Net<sub>v</sub>, which appear to be connected in a cross-shaped configuration.
* **(2) Separation Training:** An image of a musician is shown as input. This is processed by a neural network Net<sub>t</sub>, which outputs two spectrograms, S<sub>a</sub> and S<sub>b</sub>.
* **(3) Testing:** An image of a room with musicians is shown as input. This image is processed to generate spectrograms STFT(l + r) and STFT(l - r). These spectrograms are then fed into Net<sub>t</sub>, which presumably performs source separation.
The spectrograms are visually represented as heatmaps, with varying color intensities indicating different frequency and amplitude levels. The color scheme appears to range from dark blue (low intensity) to yellow/white (high intensity).
### Key Observations
* The system utilizes a combination of visual and auditory information for source separation.
* Neural networks play a central role in the learning and testing pipeline.
* Spectrograms are used to represent the auditory information.
* The stereo training stage appears to involve learning relationships between visual and auditory cues.
* The separation training stage aims to isolate individual sound sources.
### Interpretation
The diagram illustrates a system designed to separate audio sources based on both visual and auditory information. The visual-coordinate mapping suggests an attempt to represent the visual field in a way that facilitates the integration of visual and auditory cues. The learning and testing pipeline demonstrates how neural networks can be trained to perform source separation using stereo and monaural audio inputs. The use of spectrograms indicates that the system operates in the frequency domain.
The system likely leverages the fact that visual cues (e.g., the location of a musician) can provide information about the source of a sound. By combining visual and auditory information, the system can potentially achieve more accurate and robust source separation than systems that rely solely on auditory cues. The stereo training stage is crucial for learning the correspondence between visual and auditory information, while the separation training stage focuses on isolating individual sound sources. The testing stage demonstrates how the trained system can be used to separate sources in a real-world scenario.
</details>
to represent objects at different depths. Only mono audios are used in building the data.
## 3.3. Learning
We leverage neural networks for learning from mono and visual guidance to pseudo binaural output. Previous networks and training paradigms from Mono2Binaural [14] and Sep-Stereo [49] can be readily adapted to train on our data. The learning procedure is depicted in Fig. 3 (b).
Stereo Training. The main part of our learning procedure is to directly train networks using our pseudo visual-stereo pairs. The whole training procedure is basically following [14, 49]. It consists of a backbone U-Net [31] audio network Net a , and a ResNet18 [16] visual network Net v . The audios are all processed in the complex TimeFrequency domain in form of Short-Time Fourier Transformation (STFT). Mono is created from the left and right channels s m ( t ) = ˆ l ( t ) + ˆ r ( t ) and the input to Net a is the transformed mono spectrum S m = STFT ( s m ( t )) . Net a returns the complex mask M for final predictions. The training objective is the difference of the left and right spectrums S D = STFT ( ˆ l ( t ) -ˆ r ( t )) , which can be written as:
<!-- formula-not-decoded -->
Then the predicted difference spectrum is transferred back to the difference audio ˜ s D = ISTFT ( M∗ S m ) . The predicted left and right can be computed as ˜ l ( t ) = ( s m ( t ) + ˜ s D ( t )) / 2 and ˜ r ( t ) = ( s m ( t ) -˜ s D ( t )) / 2 .
Separation Training. Specifically, we leverage the task of separating two sources inspired by Sep-Stereo [49]. We care less about the performance on separation, but more about its benefits on distinguishing sound sources. Thus different from their visual feature rearrangement, we directly place two sources at separate edges when creating the pseudo visual input ˆ V (as shown in Fig. 3 (b)). The network input would be the pseudo pair { ˆ V , ( s a , s b ) } , where s a and s b are the individual mono audio signals. Then we leverage one APNet branch from [49] to predict the original STFTs S a and S b . In this way, the backbone network can learn better the association between the sources' visual and audio information. Please refer to the supplementary materials for details.
## 4. Experiments
## 4.1. Datasets
We emphasize creating binaurals for music, which is an important scenario for stereo production. We will at first show our analysis on the FAIR-Play dataset, then introduce other datasets we use.
Revisiting FAIR-Play. Collected in a music room, FAIRPlay [14] is one of the most influential datasets in this field. However, by carefully examining the dataset, we find that the original train-test splits are somewhat problematic. The whole dataset contains 1 , 871 clips cut from several different long camera recordings with approximately the same camera view and scene layouts. The clips are randomly divided into 10 different train-test splits. As a result, the scenes within train and test splits are overlapped, probably originate from the same recording. This would lead to serious overfitting problems. The models might learn layouts of the room instead of visual-stereo association that we desired.
In order to evaluate the true generalization ability of different models on this dataset, we take efforts to re-organize the FAIR-Play dataset through reconstructing the original videos and re-splitting them. Specifically, we first run a clustering algorithm on all the clips to roughly group them according to the scenes. Then by matching the first and last
Table 1: Quantitative results of binaural audio generation on FAIR-Play and MUSIC-Stereo dataset.Except for SNR, the lower the score, the better the results. The upper half shows the results of standard benchmarks and our PseudoBinaural method. The lower half shows the augmentation results and our ablation studies on different binaural decoding schemes (Sec. 3.1). Our method outperforms previous methods when augmented with binaural recordings. Moreover, our chosen decoding scheme achieves the best performance among three decoding methods.
| | FAIR-Play | FAIR-Play | FAIR-Play | FAIR-Play | FAIR-Play | MUSIC-Stereo | MUSIC-Stereo | MUSIC-Stereo | MUSIC-Stereo | MUSIC-Stereo |
|---------------------------|-------------|-------------|-------------|-------------|-------------|----------------|----------------|----------------|----------------|----------------|
| Method | STFT | ENV | Mag | D phase | SNR ↑ | STFT | ENV | Mag | D phase | SNR ↑ |
| Mono-Mono | 1.024 | 0.145 | 2.049 | 1.571 | 4.968 | 1.014 | 0.144 | 2.027 | 1.568 | 7.858 |
| Mono2Binaural [14] | 0.917 | 0.137 | 1.835 | 1.504 | 5.203 | 0.942 | 0.138 | 1.885 | 1.550 | 8.255 |
| PseudoBinaural (w/o sep.) | 0.951 | 0.140 | 1.914 | 1.539 | 5.037 | 0.953 | 0.139 | 1.902 | 1.564 | 8.129 |
| PseudoBinaural (Ours) | 0.944 | 0.139 | 1.901 | 1.522 | 5.124 | 0.943 | 0.139 | 1.886 | 1.562 | 8.198 |
| Sep-Stereo [49] | 0.906 | 0.136 | 1.811 | 1.495 | 5.221 | 0.929 | 0.135 | 1.803 | 1.544 | 8.306 |
| Augment-HRIR | 0.896 | 0.137 | 1.791 | 1.472 | 5.255 | 0.940 | 0.138 | 1.866 | 1.550 | 8.259 |
| Augment-ambisonic | 0.912 | 0.139 | 1.823 | 1.477 | 5.220 | 0.909 | 0.137 | 1.817 | 1.546 | 8.277 |
| Augment-PseudoBinaural | 0.878 | 0.134 | 1.768 | 1.467 | 5.316 | 0.891 | 0.132 | 1.762 | 1.539 | 8.419 |
frame of each clip within groups, we find the original order of the clips and concatenate them to recover the recorded videos. Finally, we select the videos whose scenes are completely absent in other videos as the validate and test sets. In this way, we create 5 different splits in which train and test sets are not overlapped. In our experiments, we re-train all supervised models (including Mono2Binaural [14] and Sep-Stereo [49]) and report the average results on the five splits. Please be noted that our model is also trained on this dataset, using only the solo part and mono audios .
MUSIC-Stereo [46, 45]. Containing 21 different types of instruments, MUSIC(21) is originally collected for visually guided sound separation. We select all the videos with binaural audio from MUSIC(21) and MUSIC-duet [46] to form a new dataset MUSIC-Stereo. Composed of solo and duet parts, it includes 1 , 120 unique videos of different musical performances. MUSIC-Stereo lasts 49.7 hours in total, which is 10 times larger than the FAIR-Play dataset. Following the post-processing steps in [14], we cut these videos into 17 , 940 10s clips and split them into training, validation, and test sets in an 8:1:1 ratio. Similar to FAIR-Play, only the solo part and mono audios are exploited for our model's training.
YT-Music [22]. This dataset is collected from 360 ◦ videos on YouTube in the ambisonic format. The audios are transferred to binaural in the same way as our decoding scheme. With distinct vision configurations and stereo audio characteristics, YT-MUSIC is the most challenging dataset.
## 4.2. Evaluation Metrics
Previous Metrics. The evaluation protocol within this field is basically the STFT distance and the envelope distance (ENV) between recovered audios and recorded ones [22, 14]. The STFT distance represents the mean square error com- puted on predicted spectrums, and the ENV distance is performed on raw audio waves through Hilbert transform [33]. To evaluate the predicted binaural audios more comprehensively, we also adopt two widely-used metrics Magnitude Distance (Mag) and Signal-to-noise Ratio (SNR) from [22]. The Mag distance reflects the L 2 deviation on the magnitude of spectrums and SNR is operated on the waveform directly. Newly Proposed Metric. In 3D audio sensation, audiences care more about sensing the source direction, where the phase of binaural audio is the key. As illustrated in [30], phase errors will introduce perceivable distortions but are always neglected during the optimization. Inspired by this, we further propose a new metric named Difference Phase Distance ( D phase ), which is performed on the Time-Frequency domain. Note that, the binaural audio is completely determined by the difference between left and right spectrums 3.3. Hence, D phase is to evaluate the phase distortion between the ground-truth difference S D and the predicted one ˜ S D = M∗ S m :
<!-- formula-not-decoded -->
where the phase is represented by the angle values, thus D phase ∈ [0 , 2 π ] . It's worth emphasizing that D phase is sensitive to the audio directions, i.e. , switching left and right channels would bring a significant change on this metric.
## 4.3. Quantitative Results
Binaural-Recording-Free Evaluation. Since no binauralrecording-free method has been proposed before, supervised method Mono2Binaural [14] whose backbone we borrow from, can be served as our baseline and upper bound. The evaluation is made on our newly-split FAIR-Play [14] and MUSIC-Stereo. For comparison, Mono2Binaural is trained with both visual frames and binaural audio, whereas our
Table 2: Cross-dataset evaluation results on five metrics. While the model trained on FAIR-Play is used for testing on the others, the model trained on MUSIC-Stereo is for the evaluation on FAIR-Play. PseudoBinaural presents better generalization ability than the supervised method Mono2Binaural on all datasets.
| | Mono2Binaural [14] | Mono2Binaural [14] | Mono2Binaural [14] | Mono2Binaural [14] | Mono2Binaural [14] | PseudoBinaural (Ours) | PseudoBinaural (Ours) | PseudoBinaural (Ours) | PseudoBinaural (Ours) | PseudoBinaural (Ours) |
|--------------|----------------------|----------------------|----------------------|----------------------|----------------------|-------------------------|-------------------------|-------------------------|-------------------------|-------------------------|
| Dataset | STFT | ENV | Mag | D phase | SNR ↑ | STFT | ENV | Mag | D phase | SNR ↑ |
| FAIR-Play | 0.996 | 0.142 | 1.993 | 1.562 | 5.876 | 0.959 | 0.140 | 1.917 | 1.496 | 6.057 |
| MUSIC-Stereo | 0.971 | 0.140 | 1.942 | 1.552 | 7.933 | 0.952 | 0.139 | 1.904 | 0.574 | 8.099 |
| YT-MUSIC | 0.717 | 0.118 | 1.435 | 1.597 | 9.214 | 0.653 | 0.111 | 1.306 | 1.357 | 9.848 |
method PseudoBinaural only leverages frames and mono audio to do the training. Please be noted that we do not rely on an extra dataset. The result of Mono-Mono is also listed, which copies the mono input two times as the stereo channels. This method should have no stereo effect at all, thus outperforming it means the success of generating the sense of directions. As the whole model of ours includes the separation training described in Sec. 3.3, we also evaluation the ablation of this module (w/o sep.) . Table 1 shows the results of these methods on all metrics.
With no supervision, it is reasonable that our PseudoBinaural cannot outperform the supervised setting. However, the fact that our model outperforms Mono-Mono on all metrics proves the effectiveness of our proposed method. In line with previous work [49], introducing the separation task in the training framework can further improve the overall performance of generated binaural audio.
Augmentation to Binaural Audio Training. Since our method just relies on the pseudo visual-stereo pairs, a natural idea is to leverage both pseudo data and recorded ones to boost the performance of the traditional fully-supervised approach. As demonstrated in the lower half of Table 1, our method, denoted as Augment-PseudoBinaural , can surpass the traditional setting Mono2Binaural [14] on all 5 metrics. Moreover, compared to Sep-Stereo [49], which incorporates extra data, we create pseudo pairs with the same set of collected data, providing more effective and complementary information to guide the training. Consequently, our method outperforms theirs on both FAIR-Play and MUSIC-Stereo.
Cross-Dataset Evaluation. Wespecifically show the results of cross-dataset evaluation in Table. 2 to prove that 1) supervised methods can easily overfit to a specific domain and 2) the generalization ability of our method. YT-MUSIC [22] with special 360 ◦ videos and ambisonics sounds is also used for evaluation. Here we use the non-augmented version of PseudoBinaural for evaluation. For Mono2Binaural , the model evaluated on FAIR-Play is trained on MUSIC-Stereo, and the model tested on MUSIC-Stereo and YT-MUSIC is trained on FAIR-Play. During cross-testing on FAIR-Play and MUSIC-Stereo, the visual to angle mapping f v 2 a is defined in the frontal view. But when cross-testing on YTMUSIC, the video is defined in the form of 360 ◦ .
Table 3: Ablation study on the number K of mono videos to mix based on FAIR-Play dataset. When K is a mixture of the three different numbers, the ratio is empirically set to 1 : 2 : 3 = 0 . 4 : 0 . 5 : 0 . 1 .
| K | STFT | ENV | Mag | D phase | SNR ↑ |
|-------|--------|-------|-------|-----------|---------|
| 1 | 0.965 | 0.143 | 1.914 | 1.483 | 4.976 |
| 2 | 0.935 | 0.141 | 1.871 | 1.48 | 5.026 |
| 3 | 0.967 | 0.142 | 1.936 | 1.527 | 5.004 |
| 1,2 | 0.895 | 0.136 | 1.793 | 1.479 | 5.282 |
| 1,2,3 | 0.878 | 0.134 | 1.768 | 1.467 | 5.316 |
We can see from the table that our method stably outperforms Mono2Binaural in all cross-dataset evaluations. The supervised method tends to perform badly when testing in a different domain, while our recording-free method generalizes well by training only on mono data.
Ablation Study. The lower half of Table 1 presents our ablation studies on different binaural decoding schemes. As written in Sec. 3.1, binaural audios can be decoded directly from HRIR or ambisonic . It can be seen that our way of combining both leads to the best results.
When preparing pseudo visual-stereo pairs, the number of mono videos to mix is also another important hyperparameter for consideration. As shown in Table 3, a fixed mixing number K always fails to construct various training samples, introducing inconsistency with those naturally collected datasets. Hence, an empirical ratio of 1 : 2 : 3 = 0 . 4 : 0 . 5 : 0 . 1 for the number K is applied to ensure the diversity of generated visual-stereo pairs.
Additionally, we evaluate the choice of visual field-ofview (FOV) when building the Visual-Coordinate-Mapping . The influential parameter is the border azimuth angle ϑ v 0 which is set to π/ 3 (Sec. 3.2). The results are shown in Table 4, that our choice achieves the best results.
## 4.4. Qualitative Results
User Study 2 . In total 30 users with normal hearing participated in our study to perform the quality evaluation. There
2 Please refer to https : / / sheldontsui . github . io / projects/PseudoBinaural for demo videos.
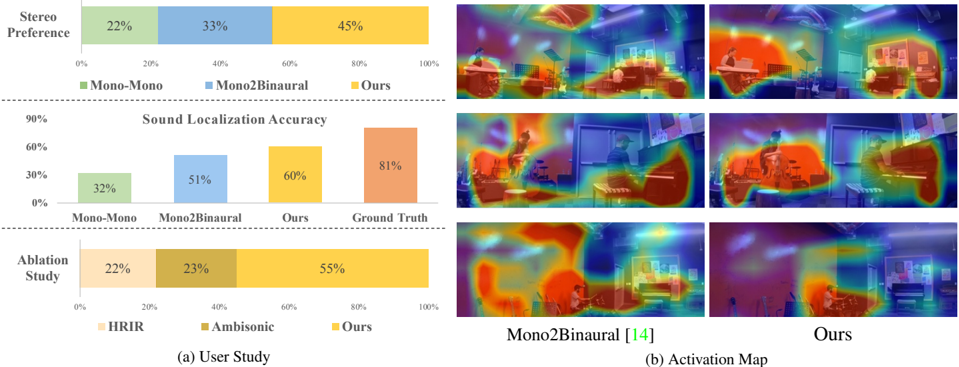
Figure 4: Qualitative results. (a) shows the results of our user studies. It can be seen that the users slightly prefer our approach over supervised Mono2Binaural [14]. (b) is the visualization of the activation maps of ours and Mono2Binaural. While the attention of theirs is messier, the results of ours are more compact. We focus more on sound sources.
<details>
<summary>Image 4 Details</summary>
### Visual Description
## Bar Charts & Activation Maps: Spatial Audio Performance Comparison
### Overview
The image presents a comparison of spatial audio performance across different methods: Mono-Mono, Mono2Binaural, and "Ours" (presumably a novel method). The comparison is done through three bar charts representing user study results (Stereo Preference, Sound Localization Accuracy, and Ablation Study) and corresponding activation maps visualizing where sound is perceived to originate.
### Components/Axes
The image is divided into three rows, each containing a bar chart on the left and two activation maps on the right.
* **Stereo Preference Chart:**
* X-axis: Categories - Mono-Mono, Mono2Binaural, Ours.
* Y-axis: Percentage (0% to 100%).
* Legend:
* Mono-Mono (Green)
* Mono2Binaural (Blue)
* Ours (Yellow)
* **Sound Localization Accuracy Chart:**
* X-axis: Categories - Mono-Mono, Mono2Binaural, Ours, Ground Truth.
* Y-axis: Percentage (0% to 90%).
* Legend:
* Mono-Mono (Green)
* Mono2Binaural (Blue)
* Ours (Yellow)
* Ground Truth (Orange)
* **Ablation Study Chart:**
* X-axis: Categories - HRIR, Ambisonic, Ours.
* Y-axis: Percentage (0% to 100%).
* Legend:
* HRIR (Green)
* Ambisonic (Blue)
* Ours (Yellow)
* **Activation Maps:** These are heatmaps overlaid on images of a room. The color intensity represents the perceived sound source location. The maps are paired with the corresponding bar charts. The rightmost column is labeled "(b) Activation Map".
### Detailed Analysis or Content Details
**Stereo Preference:**
* Mono-Mono: Approximately 22%.
* Mono2Binaural: Approximately 33%.
* Ours: Approximately 45%.
* Trend: Preference increases from Mono-Mono to Mono2Binaural to "Ours".
**Sound Localization Accuracy:**
* Mono-Mono: Approximately 32%.
* Mono2Binaural: Approximately 51%.
* Ours: Approximately 60%.
* Ground Truth: Approximately 81%.
* Trend: Accuracy increases from Mono-Mono to Mono2Binaural to "Ours", approaching Ground Truth.
**Ablation Study:**
* HRIR: Approximately 22%.
* Ambisonic: Approximately 23%.
* Ours: Approximately 55%.
* Trend: Performance significantly increases with "Ours" compared to HRIR and Ambisonic.
**Activation Maps:**
* The activation maps show heat distributions overlaid on room images. The intensity of the heat indicates the perceived sound source location.
* The maps corresponding to Mono2Binaural show a more diffuse heat distribution, indicating less accurate localization.
* The maps corresponding to "Ours" show a more focused heat distribution, indicating more accurate localization.
* The maps are positioned in a 3x2 grid, with the first column corresponding to Mono2Binaural and the second column corresponding to "Ours".
### Key Observations
* "Ours" consistently outperforms Mono-Mono and Mono2Binaural in all three metrics.
* Sound Localization Accuracy is closest to Ground Truth with "Ours", but still has a gap.
* The Ablation Study shows that "Ours" benefits significantly from its full configuration, outperforming both HRIR and Ambisonic individually.
* Activation maps visually confirm the quantitative results, showing more focused localization with "Ours".
### Interpretation
The data suggests that the proposed method ("Ours") significantly improves spatial audio performance compared to baseline methods like Mono-Mono and Mono2Binaural. The increased stereo preference and sound localization accuracy indicate a more immersive and realistic audio experience. The ablation study highlights the importance of the complete method, as individual components (HRIR, Ambisonic) do not achieve the same level of performance. The activation maps provide visual evidence supporting the quantitative findings, demonstrating that "Ours" leads to more accurate sound source localization. The gap between "Ours" and "Ground Truth" suggests there is still room for improvement, but the results are promising. The study appears to be evaluating a method for creating spatial audio from mono sources, and the results indicate a substantial improvement in perceived spatialization.
</details>
are three sets of studies, each with 20 videos selected from the test set of FAIR-Play [14] and MUSIC-Stereo [45], most of which are duets. 1) The users are asked to watch one video and listen to the binaural audios generated by PseudoBinaural , Mono2Binaural [14] or Mono-Mono . The question is which one of the three methods creates the best stereo sensation. The results show the percentage of the users' Stereo Preferences. 2) The users are asked to listen to the audio generated by the above methods without viewing videos, and decide where is the specific instrument (left, right, or center). Ground truth audios are also included for reference. The results show the Sound Localization Accuracy of these methods. 3) A subjective Ablation Study is conducted to show the influence of different choices of binaural decoding methods. The users are asked to tell which decoding diagram, direct HRIR, ambisonic, or ours, creates the best 3D hearing experience.
The results are shown in Fig 4 (a). From the first and second experiments, we can see that users find our method slightly better than supervised Mono2Binaural on both the two measurements. This is enough to validate that our results are highly competitive to supervised methods in subjective evaluations, which is extremely important for auditory tasks. In the sound localization experiment, users can only achieve 81% accuracy even given the ground-truth audio, which demonstrates the misguiding caused by the room reverberations. The subjective ablation study shows that our decoding procedure apparently creates the best sense of hearing among all decoding choices.
Visualization. We also visualize the activation map generated by our method and Mono2Binaural [14] on the visual domain. In Fig. 4 (b) we can see that Pseu-
Table 4: Ablation study on the border azimuth angle ϑ v 0 . The horizontal visual field-of-view is 2 ϑ v 0 .
| ϑ v 0 | π/ 6 | π/ 4 | π/ 3 | 5 π/ 12 | π/ 2 |
|---------|--------|--------|--------|-----------|--------|
| STFT ↓ | 0.923 | 0.896 | 0.878 | 0.884 | 0.886 |
| SNR ↑ | 5.138 | 5.181 | 5.316 | 5.302 | 5.271 |
doBinaural can successfully attend to sound sources while Mono2Binaural [14] would focus on less important areas. For example, their approach would attend to the ceiling for all three scenes shown, which is not the sound source.
## 5. Conclusion
In this work, we propose PseudoBinaural, a binauralrecording-free method for generating binaural audios from corresponding mono audios and visual cues. For the first time, the problem of visually informed binaural audio generation is tackled without binaural audio recordings. Based on the theoretical analysis of Mono-BinauralMapping, the created pseudo visual-stereo pairs can be capitalized to train models for binaural audio generation. Extensive experiments validate that our framework can be very competitive both quantitatively and qualitatively. More impressively, augmented with real binaural audio recordings, our PseudoBinaural could outperform current state-of-the-art methods on various standard benchmarks.
Acknowledgements. This work is supported by the Collaborative Research Grant from SenseTime (CUHK Agreement No. TS1712093), the General Research Fund (GRF) of Hong Kong (No. 14205719, 14202217, 14203118, 14208619), NTU NAP and A*STAR through the Industry Alignment Fund - Industry Collaboration Projects Grant.
## References
- [1] Triantafyllos Afouras, Joon Son Chung, and Andrew Zisserman. The conversation: Deep audio-visual speech enhancement. Proceedings of the Interspeech , 2018. 1, 2
- [2] V Ralph Algazi, Richard O Duda, Dennis M Thompson, and Carlos Avendano. The cipic hrtf database. In Proceedings of the 2001 IEEE Workshop on the Applications of Signal Processing to Audio and Acoustics (Cat. No. 01TH8575) , 2001. 3
- [3] Humam Alwassel, Dhruv Mahajan, Lorenzo Torresani, Bernard Ghanem, and Du Tran. Self-supervised learning by cross-modal audio-video clustering. Advances in neural information processing systems (NeurIPS) , 2020. 1
- [4] Relja Arandjelovic and Andrew Zisserman. Look, listen and learn. In Proceedings of the IEEE International Conference on Computer Vision (ICCV) , 2017. 3
- [5] Relja Arandjelovic and Andrew Zisserman. Objects that sound. In Proceedings of the European Conference on Computer Vision (ECCV) , 2018. 3
- [6] Durand R Begault and Leonard J Trejo. 3-d sound for virtual reality and multimedia. 2000. 1
- [7] Jens Blauert. Spatial hearing: the psychophysics of human sound localization . MIT press, 1997. 2
- [8] R. Courant and D. Hilbert. Methods of mathematical physics . Wiley classics library. Interscience Publishers, 1962. 1, 3
- [9] Ariel Ephrat, Inbar Mosseri, Oran Lang, Tali Dekel, Kevin Wilson, Avinatan Hassidim, William T Freeman, and Michael Rubinstein. Looking to listen at the cocktail party: a speakerindependent audio-visual model for speech separation. ACM Transactions on Graphics (TOG) , 2018. 1, 2
- [10] John W Fisher III, Trevor Darrell, William T Freeman, and Paul A Viola. Learning joint statistical models for audiovisual fusion and segregation. In Advances in neural information processing systems (NeurIPS) , 2001. 2
- [11] Chuang Gan, Deng Huang, Hang Zhao, Joshua B Tenenbaum, and Antonio Torralba. Music gesture for visual sound separation. In Proceedings of the IEEE Conference on Computer Vision and Pattern Recognition (CVPR) , 2020. 2
- [12] Chuang Gan, Hang Zhao, Peihao Chen, David Cox, and Antonio Torralba. Self-supervised moving vehicle tracking with stereo sound. In Proceedings of the IEEE International Conference on Computer Vision (ICCV) , 2019. 3
- [13] Ruohan Gao, Rogerio Feris, and Kristen Grauman. Learning to separate object sounds by watching unlabeled video. In Proceedings of the European Conference on Computer Vision (ECCV) , 2018. 1, 2
- [14] Ruohan Gao and Kristen Grauman. 2.5 d visual sound. In Proceedings of the IEEE Conference on Computer Vision and Pattern Recognition (CVPR) , 2019. 1, 2, 3, 5, 6, 7, 8, 11, 12
- [15] Ruohan Gao and Kristen Grauman. Co-separating sounds of visual objects. In Proceedings of the IEEE International Conference on Computer Vision (ICCV) , 2019. 1, 2, 11
- [16] Kaiming He, Xiangyu Zhang, Shaoqing Ren, and Jian Sun. Deep residual learning for image recognition. In Proceedings of the IEEE conference on computer vision and pattern recognition (CVPR) , 2016. 5
- [17] Di Hu, Rui Qian, Minyue Jiang, Xiao Tan, Shilei Wen, Errui Ding, Weiyao Lin, and Dejing Dou. Discriminative sounding objects localization via self-supervised audiovisual matching. In Advances in Neural Information Processing Systems (NeurIPS) , 2020. 3
- [18] Bruno Korbar, Du Tran, and Lorenzo Torresani. Cooperative learning of audio and video models from self-supervised synchronization. In Advances in Neural Information Processing Systems (NeurIPS) , 2018. 1
- [19] Dingzeyu Li, Timothy R. Langlois, and Changxi Zheng. Scene-aware audio for 360 videos. ACM Transactions on Graphics (TOG) , 2018. 2
- [20] Yu-Ding Lu, Hsin-Ying Lee, Hung-Yu Tseng, and MingHsuan Yang. Self-supervised audio spatialization with correspondence classifier. In 2019 IEEE International Conference on Image Processing (ICIP) , 2019. 1, 2
- [21] Hari Krishna Maganti, Daniel Gatica-Perez, and Iain McCowan. Speech enhancement and recognition in meetings with an audio-visual sensor array. IEEE Transactions on Audio, Speech, and Language Processing (TASLP) , 2007. 2
- [22] Pedro Morgado, Nuno Nvasconcelos, Timothy Langlois, and Oliver Wang. Self-supervised generation of spatial audio for 360 video. In Advances in Neural Information Processing Systems (NeurIPS) , 2018. 1, 2, 3, 6, 7
- [23] Pedro Morgado, Nuno Vasconcelos, and Ishan Misra. Audiovisual instance discrimination with cross-modal agreement. In Proceedings of the IEEE Conference on Computer Vision and Pattern Recognition (CVPR) , 2021. 1
- [24] Markus Noisternig, Alois Sontacchi, Thomas Musil, and Robert Holdrich. A 3d ambisonic based binaural sound reproduction system. In Audio Engineering Society Conference: 24th International Conference: Multichannel Audio, The New Reality . Audio Engineering Society, 2003. 3
- [25] Andrew Owens and Alexei A Efros. Audio-visual scene analysis with self-supervised multisensory features. Proceedings of the European Conference on Computer Vision (ECCV) , 2018. 1, 3
- [26] Andrew Owens, Phillip Isola, Josh McDermott, Antonio Torralba, Edward H Adelson, and William T Freeman. Visually indicated sounds. In Proceedings of the IEEE Conference on Computer Vision and Pattern Recognition (CVPR) , 2016. 2, 3
- [27] Sanjeel Parekh, Slim Essid, Alexey Ozerov, Ngoc QK Duong, Patrick Pérez, and Gaël Richard. Motion informed audio source separation. In IEEE International Conference on Acoustics, Speech and Signal Processing (ICASSP) , 2017. 2
- [28] Rui Qian, Di Hu, Heinrich Dinkel, Mengyue Wu, Ning Xu, and Weiyao Lin. Multiple sound sources localization from coarse to fine. Proceedings of the European Conference on Computer Vision (ECCV) , 2020. 3
- [29] Shaoqing Ren, Kaiming He, Ross Girshick, and Jian Sun. Faster r-cnn: Towards real-time object detection with region proposal networks. In Advances in neural information processing systems (NeurIPS) , 2015. 11
- [30] Alexander Richard, Dejan Markovic, Israel D. Gebru, Steven Krenn, Gladstone Alexander Butler, Fernando Torre, and Yaser Sheikh. Neural synthesis of binaural speech. In Interna-
tional Conference on Learning Representations (ICLR) , 2021. 6
- [31] Olaf Ronneberger, Philipp Fischer, and Thomas Brox. U-net: Convolutional networks for biomedical image segmentation. In International Conference on Medical image computing and computer-assisted intervention , 2015. 5
- [32] Arda Senocak, Tae-Hyun Oh, Junsik Kim, Ming-Hsuan Yang, and In So Kweon. Learning to localize sound source in visual scenes. In Proceedings of the IEEE Conference on Computer Vision and Pattern Recognition (CVPR) , 2018. 3
- [33] Julius Orion Smith. Mathematics of the discrete Fourier transform (DFT): with audio applications . 2007. 6
- [34] John Smythies. A note on the concept of the visual field in neurology, psychology, and visual neuroscience. Perception , 1996. 4
- [35] Yapeng Tian, Di Hu, and Chenliang Xu. Cyclic co-learning of sounding object visual grounding and sound separation. In Proceedings of the IEEE Conference on Computer Vision and Pattern Recognition (CVPR) , 2021. 2
- [36] Yapeng Tian, Dingzeyu Li, and Chenliang Xu. Unified multisensory perception: weakly-supervised audio-visual video parsing. Proceedings of the European Conference on Computer Vision (ECCV) , 2020. 3
- [37] Yapeng Tian, Jing Shi, Bochen Li, Zhiyao Duan, and Chenliang Xu. Audio-visual event localization in unconstrained videos. In Proceedings of the European Conference on Computer Vision (ECCV) , 2018. 3
- [38] Yapeng Tian, Chenliang Xu, and Dingzeyu Li. Deep audio prior. arXiv preprint arXiv:1912.10292 , 2019. 2
- [39] Arun Balajee Vasudevan, Dengxin Dai, and Luc Van Gool. Semantic object prediction and spatial sound super-resolution with binaural sounds. Proceedings of the European Conference on Computer Vision (ECCV) , 2020. 3
- [40] DE Winch, DJ Ivers, JPR Turner, and RJ Stening. Geomagnetism and schmidt quasi-normalization. Geophysical Journal International , 2005. 3
- [41] Yu Wu, Linchao Zhu, Yan Yan, and Yi Yang. Dual attention matching for audio-visual event localization. In Proceedings of the IEEE International Conference on Computer Vision (ICCV) , 2019. 3
- [42] Xudong Xu, Bo Dai, and Dahua Lin. Recursive visual sound separation using minus-plus net. In Proceedings of the IEEE International Conference on Computer Vision (ICCV) , 2019. 2
- [43] Karren Yang, Bryan Russell, and Justin Salamon. Telling left from right: Learning spatial correspondence of sight and sound. In Proceedings of the IEEE Conference on Computer Vision and Pattern Recognition (CVPR) , 2020. 1, 12
- [44] Qilin Zhang, Habti Abeida, Ming Xue, William Rowe, and Jian Li. Fast implementation of sparse iterative covariancebased estimation for source localization. The Journal of the Acoustical Society of America (JASA) , 2012. 3
- [45] Hang Zhao, Chuang Gan, Wei-Chiu Ma, and Antonio Torralba. The sound of motions. Proceedings of the IEEE International Conference on Computer Vision (ICCV) , 2019. 1, 2, 3, 6, 8
- [46] Hang Zhao, Chuang Gan, Andrew Rouditchenko, Carl Vondrick, Josh McDermott, and Antonio Torralba. The sound of pixels. In Proceedings of the European Conference on Computer Vision (ECCV) , 2018. 1, 2, 3, 6, 11
- [47] Hang Zhou, Yu Liu, Ziwei Liu, Ping Luo, and Xiaogang Wang. Talking face generation by adversarially disentangled audio-visual representation. In Proceedings of the AAAI Conference on Artificial Intelligence (AAAI) , 2019. 3
- [48] Hang Zhou, Ziwei Liu, Xudong Xu, Ping Luo, and Xiaogang Wang. Vision-infused deep audio inpainting. In Proceedings of the IEEE International Conference on Computer Vision (ICCV) , 2019. 1
- [49] Hang Zhou, Xudong Xu, Dahua Lin, Xiaogang Wang, and Ziwei Liu. Sep-stereo: Visually guided stereophonic audio generation by associating source separation. Proceedings of the European Conference on Computer Vision (ECCV) , 2020. 1, 2, 5, 6, 7, 11
- [50] Ye Zhu, Yu Wu, Hugo Latapie, Yi Yang, and Yan Yan. Learning audio-visual correlations from variational cross-modal generation. IEEE International Conference on Acoustics, Speech and Signal Processing (ICASSP) , 2021. 3
## Appendices
## A. Demo Video Descriptions
In the demo video, we show our prediction results and the comparisons between our predictions and that of the baseline method [14] on FAIR-Play, MUSIC-Stereo and Youtube-ASMR E, respectively. The video is encoded in H.264 codec.
## B. Separation Training Details
The task of visually guided sound source separation [46, 15] aims at separating a mixed audio into independent ones, according to their sound source's visual appearances. We adopt the setting with a mixture of two sources, which is kept the same as Sep-Stereo [49] for fair comparisons. The backbone audio network Net a is shared across stereo and separation learning, following [49].
During training, we follow the Mix-and-Separate pipeline [46, 15] to mix two mono audios ( s a and s b ) of two solo videos as input in the form of STFTs. This can be written as S mix = S a + S b . The network renders complex masks M a and M b to predict the STFTs of the audios themselves. We use two APNet [49] structures for the prediction of complex masks. The loss function can be written as:
<!-- formula-not-decoded -->
This training is done in parallel with stereo, thus the overall loss function is:
<!-- formula-not-decoded -->
The weight λ sep is empirically set to 1 in our experiments. We observe that it would not affect the results much when λ sep ∈ [0 . 5 , 1 . 5] .
## C. Implementation Details
Following [14], we use Python package Audiolab to resample the audio at 16kHz, which significantly accelerates the IO process during training. Besides, our follow the same details for our network structure and the training protocol as in Mono2Binaural [14] and Sep-Stereo [49]. The spectrograms are of size 257 × 64 × 2 , and the visual inputs are 224 × 448 × 3 images. During testing, we find an inappropriate normalization operation in the demo-generating script presented in the public code of [14] and [49]. Specifically, since the ground-truth binaural audio is unknown in advance, the normalization step should be implemented in the mono audio instead. After fixing this bug, we discover the hop length of sliding window will not affect the inference performance. Hence, the sliding window is set to 0.1s for all the experiments.
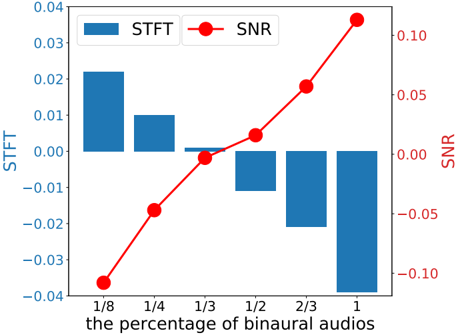
Figure 5: The curve of our relative performances w.r.t the percentage of binaural audios we use on FAIR-Play. It can be observed that our approach can reach their full performance using only 1 / 3 of the ground-truth binaural audios.
<details>
<summary>Image 5 Details</summary>
### Visual Description
\n
## Chart: STFT and SNR vs. Percentage of Binaural Audios
### Overview
The image presents a combined bar and line chart illustrating the relationship between the Short-Time Fourier Transform (STFT) and Signal-to-Noise Ratio (SNR) as a function of the percentage of binaural audios. The chart displays STFT values as blue bars and SNR values as a red line with circular markers. A secondary y-axis on the right side of the chart displays the SNR scale.
### Components/Axes
* **X-axis:** "the percentage of binaural audios" with markers at 1/8, 1/4, 1/3, 1/2, 2/3, and 1.
* **Left Y-axis:** "STFT" with a scale ranging from -0.04 to 0.04.
* **Right Y-axis:** "SNR" with a scale ranging from -0.10 to 0.10.
* **Legend:** Located in the top-left corner, identifying the blue bars as "STFT" and the red line with circles as "SNR".
* **Data Series:**
* STFT (Blue Bars)
* SNR (Red Line with Circles)
### Detailed Analysis
**STFT (Blue Bars):**
The STFT values generally decrease as the percentage of binaural audios increases.
* At 1/8: Approximately 0.023.
* At 1/4: Approximately 0.011.
* At 1/3: Approximately 0.001.
* At 1/2: Approximately -0.004.
* At 2/3: Approximately -0.008.
* At 1: Approximately -0.002.
**SNR (Red Line with Circles):**
The SNR values increase as the percentage of binaural audios increases. The line exhibits a curved, upward trend.
* At 1/8: Approximately -0.035.
* At 1/4: Approximately -0.020.
* At 1/3: Approximately -0.005.
* At 1/2: Approximately 0.010.
* At 2/3: Approximately 0.030.
* At 1: Approximately 0.085.
### Key Observations
* There is an inverse relationship between STFT and SNR. As STFT decreases, SNR increases.
* The SNR shows a more pronounced increase between 1/2 and 2/3 of the binaural audios.
* The STFT values become negative after 1/3 of the binaural audios, indicating a shift in the signal characteristics.
### Interpretation
The chart suggests that increasing the percentage of binaural audios improves the signal-to-noise ratio (SNR) while simultaneously decreasing the Short-Time Fourier Transform (STFT) value. This could indicate that the addition of binaural information enhances the clarity of the signal (higher SNR) but potentially reduces the complexity or magnitude of the frequency components captured by the STFT. The negative STFT values at higher percentages of binaural audios might signify a phase shift or a change in the signal's spectral distribution. The data suggests a trade-off between signal complexity (as measured by STFT) and signal clarity (as measured by SNR) when incorporating binaural audio. The steep increase in SNR between 1/2 and 2/3 suggests a threshold effect where adding more binaural information yields a disproportionately large improvement in signal quality.
</details>
While creating the pseudo visual-stereo pairs, we leverage the off-the-shelf human detector and instrument detector of Faster RCNN [29, 15] to crop the visual patches from the videos with mono audios. The center of the cropped patches is placed in an arbitrary position on a blank background. For the generation of pseudo binaurals, the number of speakers in the virtual array is defined as N = 8 following the common practice. The speakers are uniformly placed around the frontal part of the head.
As for the activation map in Fig.4, it comes from the feature map of the last convolutional layer in the visual network. For a specific image input, the corresponding feature map is averagely pooled along the channel dimension and normalized to [0 , 1] . And then, we deploy a bilinear upsampling operation on the feature map, making the size align with the original input image. In the end, we set the transparency ratio of upsampled feature map as 0.4, and combine it with the input image to obtain the final activation map.
## D. More Ablation Studies
## D.1. Ablation Study on the Amount of Binaural Recordings
Similar to the extensive analysis in [49], we provide an ablation study on the amount of binaural recording audios used in the augmentation experiments. Fig 5 shows the relative performance gains w.r.t the percentage of binaural audios used on FAIR-Play. The curve is drawn in a relative setting, where the performance of Mono2Binaural serves as the reference (zero in both metrics). As illustrated in Fig 5, Augment-PseudoBinaural can achieve the comparable performance based on only 1 / 3 of the ground-truth binaural
Table 5: Quantitative results of binaural audio generation on Youtube-ASMR dataset with five evaluation metrics. Note that, our method PseudoBinaural still outperforms Mono-Mono on the non-musical dataset. Owing to the huge data amount and relatively simpler scenarios in Youtube-ASMR dataset, Augment-PseudoBinaural can only achieve a minor improvement over the supervised counterpart [14].
| Method | STFT | ENV | Mag | D phase | SNR ↑ |
|------------------------|--------|-------|-------|-----------|---------|
| Mono-Mono | 0.286 | 0.07 | 0.571 | 1.57 | 2.111 |
| Mono2Binaural [14] | 0.198 | 0.055 | 0.395 | 1.396 | 3.855 |
| PseudoBinaural (Ours) | 0.252 | 0.064 | 0.504 | 1.517 | 2.634 |
| Augment-PseudoBinaural | 0.196 | 0.055 | 0.394 | 1.394 | 3.86 |
Table 6: Results for different mixes of K on FAIR-Play.
| Mix ratio | 1 : 1 : 1 | 4 : 5 : 1 | 4 : 1 : 5 | 1 : 5 : 4 |
|-------------|-------------|-------------|-------------|-------------|
| STFT ↓ | 0.88 | 0.878 | 0.884 | 0.885 |
| SNR ↑ | 5.312 | 5.316 | 5.31 | 5.306 |
audios, which further demonstrates the effectiveness of our proposed method.
## D.2. Ablation Study on Mix Ratios of K
We conduct an ablation study on the selection of different mix ratios. The portions are the partitions of videos with one, two and three mixed sources used during training. During our implementation, the ratios are selected as 4 : 5 : 1. The ablation results on FAIR-Play are listed in Table 6. It indicates that the influence of different mix ratios is minor.
## E. Experiment on Youtube-ASMR Dataset
Youtube-ASMR introduced by Yang et al . [43] is a largescale video dataset collected from YouTube. It consists of approximately 300K 10-second video clips with spatial audio and lasts about 904 hours in total. In an ASMR video, only an individual actor or 'ASMRtist' is speaking or making different sounds towards a dummy head or the microphone arrays while facing the cameras. Compared to FAIR-Play or MUSIC-Stereo, the binaural scenarios in Youtube-ASMR dataset are relatively simpler since a typical sample just contains one sound source and the visual scene only involves a face in most cases. Similarly, the supervised method Mono2Binaural [14] and our approach are also implemented on this non-musical dataset. As shown in Tabel 5, PseudoBinaural can still surpass Mono-Mono on all the metrics, while the augmentation version only improves modestly over the supervised paradigm [14].
## F. Limitations
There are also certain limitations in our work. The first is the domain gap between self-created images and real images.
One direction towards solving this problem is through better blending techniques to the background. The second is that we do not specifically model room reverberations, particularly cannot be adapted to any given environment. Domain adaptation techniques for vision might be useful for it. Moreover, our method does rely on the videos that contains only one visual and auditory sound source.