# Neuro-Symbolic Inductive Logic Programming with Logical Neural Networks
**Authors**: Prithviraj Sen, Breno W. S. R. de Carvalho, Ryan Riegel, Alexander Gray
## Neuro-Symbolic Inductive Logic Programming with Logical Neural Networks
Prithviraj Sen, Breno W. S. R. de Carvalho, Ryan Riegel, Alexander Gray
IBM Research of substituting logical connectives besides learning the rules themselves. Neural logic machine (NLM) (Dong et al. 2019) achieves this but at the cost of interpretability. More precisely, it models propositional formulae (consisting of conjunctions, disjunctions and/or negations) with multi-layer perceptrons (MLP). Once trained, it may not be possible to interpret NLM as rules since there exists no standard translation from MLP to logic. What is needed is an extension of classical logic with ties strong enough to be amenable to interpretation and can learn not only rules but also the logical connectives using gradient-based optimization.
## Abstract
Recent work on neuro-symbolic inductive logic programming has led to promising approaches that can learn explanatory rules from noisy, real-world data. While some proposals approximate logical operators with differentiable operators from fuzzy or real-valued logic that are parameter-free thus diminishing their capacity to fit the data, other approaches are only loosely based on logic making it difficult to interpret the learned 'rules'. In this paper, we propose learning rules with the recently proposed logical neural networks (LNN). Compared to others, LNNs offer strong connection to classical Boolean logic thus allowing for precise interpretation of learned rules while harboring parameters that can be trained with gradient-based optimization to effectively fit the data. We extend LNNs to induce rules in first-order logic. Our experiments on standard benchmarking tasks confirm that LNN rules are highly interpretable and can achieve comparable or higher accuracy due to their flexible parameterization.
## 1 Introduction
Inductive logic programming (ILP) (Muggleton 1996) has been of long-standing interest where the goal is to learn logical rules from labeled data. Since rules are explicitly symbolic, they provide certain advantages over black box models. For instance, learned rules can be inspected, understood and verified forming a convenient means of storing learned knowledge. Consequently, a number of approaches have been proposed to address ILP including, but not limited to, statistical relational learning (Getoor and Taskar 2007) and more recently, neuro-symbolic methods.
Since logical operators such as conjunction and disjunction are not differentiable, one issue that most neuro-symbolic ILP techniques have to address is how to learn rules using gradient-based optimization. A popular solution is to employ extensions from fuzzy or real-valued logic that are either differentiable or have subgradients available. For instance, NeuralLP (Yang, Yang, and Cohen 2017) substitutes logical conjunction with product t -norm ( x ∧ y ≡ xy ) and logic tensor networks (Donadello, Serafini, and d'Avila Garcez 2017) with Łukasiewicz t -norm ( x ∧ y ≡ max(0 , x + y -1) ). In an interesting experiment, Evans and Grefenstette (2018) show that among the various options, product t -norm seems to lead to the best ILP result. This indicates that the learning approach, rather than the user, should be in charge
In this paper, we propose ILP with the recently proposed logical neural nerworks (LNN) (Riegel et al. 2020). Instead of forcing the user to choose a function that mimics a logical connective, LNNs employ constraints to ensure that neurons behave like conjunctions or disjunctions. By decoupling neuron activation from the mechanism to ensure that it behaves like a logical connective, LNNs offer tremendous flexibility in how to parameterize neurons thus ensuring that they fit the data better while maintaining close connections with classical Boolean logic which, in turn, facilitates principled interpretation. We propose first-order extensions of LNNs that can tackle ILP. Since vanilla backpropagation is insufficient for constraint optimization, we propose flexible learning algorithms capable of handling a variety of (linear) inequality and equality constraints. We experiment with diverse benchmarks for ILP including gridworld and knowledge base completion (KBC) that call for learning of different kinds of rules and show how our approach can tackle both effectively. In fact, our KBC results represents a 4 -16% relative improvement (in terms of mean reciprocal rank) upon the current best rule-based KBC results on popular KBC benchmarks. Additional, we show that joint learning of rules and logical connectives leads to LNN rules that are easier to interpret vs. other neuro-symbolic ILP approaches.
## 2 Related Work
∂ ILP (Evans and Grefenstette 2018) is another neurosymbolic ILP technique whose main parameter is a tensor with one cell per candidate logic program. Since the number of candidates is exponential in both the number of available predicates and the number of constituent rules in the program, ∂ ILP's complexity is exponential making it impractical for anything but the smallest learning task.
To reign in the complexity, ∂ ILP asks the user to specify the ILP task using a template consisting of two rules each containing a maximum of two predicates. In reality, most neuro-symbolic ILP approaches ask the user to specify a template. NeuralLP's (Yang, Yang, and Cohen 2017) template is meant for link prediction in incomplete knowledge bases (sometimes called open path or chain rule) which only includes binary predicates and is of the form T ( X 1 , X n ) ← R 1 ( X 1 , X 2 ) ∧ R 2 ( X 2 , X 3 ) ∧ . . . R n -1 ( X n -1 , X n ) positing that the head predicate T ( X 1 , X n ) can be modeled as a path from X 1 to X n . NLM (Dong et al. 2019) is restricted to learning rules where the head and body predicates each contain the same set of variables. For instance, to model the rule learned by NeuralLP, NLM would first need to add arguments to R 1 so that the new predicate contains all variables including X 3 , . . . X n . In contrast, our approach can use more flexible templates that can express programs beyond two rules, allows the use of n -ary predicates ( n possibly > 2 ), and allows the head to have fewer variables than the body thus going beyond all of the above mentioned approaches.
Neural theorem provers (NTP) (Rockt¨ aschel and Riedel 2017) generalize the notion of unification by embedding logical constants into a high-dimensional latent space. NTPs can achieve ILP by learning the embedding for the unknown predicate which forms part of the rule, and subsequently comparing with embeddings of known predicates. NTPs can have difficulty scaling to real-world tasks since the decision to unify two constants is no longer Boolean-valued leading to an explosion of proof paths that need to be explored. To improve scalability, recent proposals either greedily choose (GNTP (Minervini et al. 2020a)) or learn to choose (CTP (Minervini et al. 2020b)) most promising proof paths. We compare against CTP in Section 5.
Lifted relational neural networks (LRNN) (Sourek et al. 2017) model conjunctions using (generalized) sigmoid but fix certain parameters to ensure that it behaves similar to Łukasiewicz t -norm. This limits how well LRNN can model the data, which is contrary to our goal as stated in the previous section. While other combinations of logic and neural networks exist, e.g. logic tensor networks (Donadello, Serafini, and d'Avila Garcez 2017), RelNN (Kazemi and Poole 2018), DeepProbLog (Manhaeve et al. 2018), to the best of our knowledge, none of these learn rules to address ILP.
## 3 Generalized Propositional Logic with Logical Neural Networks
Logical neural networks (LNN) (Riegel et al. 2020) allow the use of almost any parameterized function as a logical connective. We illustrate how LNNs generalize conjunction ( ∧ ). Let 0 denote false and 1 denote true . Let a, b ∈ { 0 , 1 } and x, y ∈ [0 , 1] denote Boolean-valued and continuous-valued variables, respectively. While Boolean logic defines the output of ∧ when x, y attain the extremities of their permissible domains (shown in Figure 1 (a)), to fully define real-valued logic's ∧ we need to also extend its definition to x, y ∈ (0 , 1) . Intuitively, the characteristic shape of ∧ is to produce a 1) low output when either input is low , and 2) high output when both inputs are high . A simple way to capture low vs. high is
Figure 1: (a) Truth table for ∧ in Boolean logic, and (b) Shape of ∧ extended to real-valued logic.
| a | b | a ∧ b | x | y | x ∧ y |
|-----|-------|---------|--------------|--------------|--------------|
| 0 | 0 | 0 | [0 , 1 - α ] | [0 , 1 - α ] | [0 , 1 - α ] |
| 0 | 1 | 0 | [0 , 1 - α ] | (1 - α, 1] | [0 , 1 - α ] |
| 1 | 0 | 0 | (1 - α, 1] | [0 , 1 - α ] | [0 , 1 - α ] |
| 1 | 1 (a) | 1 | [ α, 1] | [ α, 1] (b) | [ α, 1] |
via a user-defined hyperparameter α ∈ ( 1 2 , 1] : x ∈ [0 , 1 -α ] constitutes low and x ∈ [ α, 1] constitutes high . Figure 1 (b) expresses ∧ for real-valued logic in terms of α .
LNNs propose constraints to enforce the shape of ∧ . Let f : [0 , 1] × [0 , 1] → [0 , 1] denote a monotonically increasing function (in both inputs). In other words, f ( x, y ′ ) ≥ f ( x, y ) ∀ y ′ ≥ y and f ( x ′ , y ) ≥ f ( x, y ) ∀ x ′ ≥ x . In accordance with figure 1 (b), LNNs enforce the following constraints:
$$f ( x , y ) \leq 1 - a , \forall x , y \in [0 , 1 - a ] f ( x , y ) \leq 1 - a , \forall x \in [0 , 1 - a ] , \forall y \in ( 1 - a , 1 ] f ( x , y ) \geq a , \forall x , y \in [a , 1]$$
Since f is monotonically increasing, we can move all constraints to their corresponding extremities and eliminate the first constraint since it is redundant given the second and third.
$$f ( 1 - \alpha , 1 ) \leq 1 - \alpha , f ( 1 , 1 - \alpha )$$
Further simplifications may be obtained for specific choice of f . For inspiration, we look towards triangular norm ( t -norm) (Esteva and Godo 2001) which is defined as a symmetric, associative and non-decreasing function T : [0 , 1] 2 → [0 , 1] satisfying boundary condition T (1 , x ) = x, ∀ x ∈ [0 , 1] . Popular t -norms include product t -norm, xy , and Łukasiewicz t -norm, max(0 , x + y -1) . We extend the latter to define LNN-∧ (other t -norms may also be extended similarly):
$$\begin{array}{ll}
LNN- \lambda ( x , y ; \beta , w _ { 1 } , w _ { 2 } ) = \\
\{ 0 & if \beta - w _ { 1 } ( 1 - x ) - w _ { 2 } ( 1 - y ) < 0 \\
\{ 1 & if \beta - w _ { 1 } ( 1 - x ) - w _ { 2 } ( 1 - y ) > 1 \\
\{ \beta - w _ { 1 } ( 1 - x ) - w _ { 2 } ( 1 - y ) \text{ otherwise}
\end{array}$$
where β, w 1 , w 2 denote learnable parameters subject to the following constraints translated from above 1 :
$$the$$
To ensure that LNN-∧ is monotonically increasing, we also need to enforce non-negativity of w 1 , w 2 . It is easy to extend LNN-∧ to an n -ary conjunction ( n ≥ 2 ):
$$\underline{LNN- \lambda ( x ; \beta , w ) = } \text{re} \{ u _ { 1 } ( \beta - w ^ { T } ( 1 - x ) ) , \beta - a w \leq ( 1 - a ) 1 ^ { T } w \geq a ^ { ( 1 ) } \}$$
1 We remove the upper and lower clamps since they do not apply in the active region of the constraints.
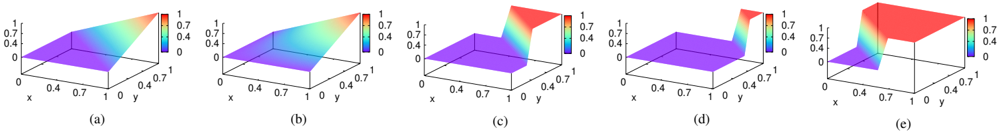
Figure 2: (a) Lukasiewicz t -norm vs. (b) Product t -norm vs. LNN-∧ with (c) α = 0 . 7 , (d) α = 0 . 9 . (e) LNN-∨ ( α = 0 . 7 ).
<details>
<summary>Image 1 Details</summary>
### Visual Description
\n
## 3D Surface Plots: Visualization of Functions
### Overview
The image presents five 3D surface plots, labeled (a) through (e). Each plot visualizes a function of two variables, 'x' and 'y', with the surface height representing the function's value. The color gradient on each surface indicates the function's value, ranging from approximately 0 (blue/purple) to 1 (red/yellow). All plots share the same x and y axis scales, ranging from 0 to 1.
### Components/Axes
* **X-axis:** Labeled "x", ranging from 0 to 1.
* **Y-axis:** Labeled "y", ranging from 0 to 1.
* **Z-axis:** Implicitly represents the function value, ranging from 0 to 1.
* **Color Scale:** A gradient from blue/purple (low values, ~0) to red/yellow (high values, ~1).
* **Labels:** (a), (b), (c), (d), (e) identify each individual plot.
### Detailed Analysis or Content Details
**Plot (a):**
* The surface slopes upward from left to right and from bottom to top.
* The lowest values (blue/purple) are near x=0 and y=0.
* The highest values (red/yellow) are near x=1 and y=1.
* The surface appears to be a plane.
**Plot (b):**
* Similar to (a), the surface slopes upward from left to right and from bottom to top.
* The color distribution is similar to (a), with blue/purple at the origin and red/yellow at x=1, y=1.
* The surface appears to be a plane.
**Plot (c):**
* The surface is relatively flat, with a slight upward slope from left to right.
* The color is predominantly purple, indicating low function values.
* The highest values (red/yellow) are concentrated near x=1 and y=0.7.
**Plot (d):**
* The surface has a more pronounced upward slope from left to right.
* The color distribution is more varied than (c), with a larger area of purple and a significant region of red/yellow.
* The highest values (red/yellow) are concentrated near x=1 and y=0.7.
**Plot (e):**
* The surface exhibits a complex shape with a peak near x=0.4 and y=0.7.
* The color distribution is highly varied, with a clear peak of red/yellow and surrounding areas of blue/purple.
* The surface appears to have a saddle-like shape.
### Key Observations
* Plots (a) and (b) are very similar, suggesting they represent the same or very similar functions.
* Plot (c) represents a function with generally low values.
* Plot (d) is a variation of (c) with higher values.
* Plot (e) represents a more complex function with a distinct peak.
* All plots have a maximum value of approximately 1 and a minimum value of approximately 0.
### Interpretation
The image demonstrates the visualization of different functions of two variables using 3D surface plots. The color gradient provides an additional dimension of information, allowing for a quick assessment of the function's value at different points in the x-y plane. The varying shapes and color distributions suggest that the functions represented by each plot have different mathematical properties. The plots could be used to illustrate concepts in multivariable calculus, such as partial derivatives, gradients, and level curves. The differences between the plots suggest that small changes in the function's equation can lead to significant changes in its behavior. Without knowing the specific equations, it's difficult to provide a more detailed interpretation. However, the visual representation allows for a qualitative understanding of the functions' characteristics.
</details>
where relu1 ( x ) denotes max(0 , min(1 , x )) (Krizhevsky 2010) and, x , w and 1 denote vectors of continuous-valued inputs, weights, and 1 s, respectively.
Note that, Figure 1 (b) does not enforce constraints on 1 -α < x,y < α . Essentially, α acts as a tunable knob that controls the size of this unconstrained region where we can learn LNN operators without impedance which is an arguably better approach than choosing a parameter-less t -norm that would arbitrarily interpolate from Boolean-logic's ∧ to real-valued logic's ∧ . Figure 2 illustrates how Łukasiewicz (Figure 2 (a)) and product (Figure 2 (b)) t -norms differ from LNN-∧ learned by fitting to the four rows in Figure 1 (a)'s truth-table. Even pictorially, LNN-∧ looks distinctly conjunction-like, i.e., when either x or y is low it produces a value close to 0 while rising quickly to 1 when both x, y are high. When α = 0 . 9 (Figure 2 (d)), the region devoid of constraints is larger than at α = 0 . 7 (Figure 2 (c)) ( ∵ [0 . 1 , 0 . 9] ⊃ [0 . 3 , 0 . 7] ), so the curve can rise later to provide a better fit . In contrast, Łukasiewicz t -norm remains at 0 until the x + y = 1 line, post which it increases linearly. Product t -norm is similar, adding a slight, upward curve.
Other propositional logic operators include negation ( ¬ ) and disjunction ( ∨ ). LNN negation is given by 1 -x and LNN disjunction, LNN-∨ , is defined in terms of LNN-∧ :
$$\begin{array}{ll}
L N - \lambda ( 1 - x ; \beta , w ) = 1 \\
L N - \lambda ( 1 - x ; \beta , w ) = 0
\end{array}$$
where constraints defined in Equation 1 apply. Figure 2 (e) pictorially depicts LNN-∨ (with α = 0 . 7 ). In contrast to Figure 2 (c), it clearly shows how maximum output is achieved for smaller values of x, y , as a disjunction operator should.
## 4 Learning First-Order LNNs
Following previous work (Yang, Yang, and Cohen 2017; Evans and Grefenstette 2018; Dong et al. 2019), we also utilize program templates expressed in higher-order logic to be fed by the user to guide the learning in the right direction. Our definition of a program template draws inspiration from metainterpretive learning (Muggleton et al. 2014). In contrast to previous work on neuro-symbolic AI however, our definition of a program template is more general and includes as special cases the templates utilized by Evans and Grefenstette (considers only rules whose body contains up to 2 predicates), Yang, Yang, and Cohen (considers only binary predicates) and Dong et al. (considers only rules whose head includes all variables contained in the body). After introducing our logic program template, we then describe how to combine it with data to construct a neural network that may then be trained to learn the logic program of interest.
Let pred ( X 1 , . . . X n ) denote an n -ary predicate which returns true ( 1 ) or false ( 0 ) for every possible joint assignment of X 1 , . . . X n to constants in the knowledge base. The main construct in first-order logic (FOL) is a rule or clause :
$$1 k - 6 h A \cdot \ldots b m$$
where b 1 , . . . b m denote predicates in its body and h denotes the head predicate. If the conjunction of all predicates in the body is true then the head is also true. The head h in a clause may contain fewer logical variables than the body b 1 , . . . b m which means that there must exist an assignment to the missing variables in the head for it to hold. More precisely, if B = b 1 , . . . b m denotes the body and is defined over logical variables Y then h ( X ) , such that X ⊆ Y , is true if ∃ Y \ X : B ( Y ) is true . Assignments that lead to the predicate being true are also called facts .
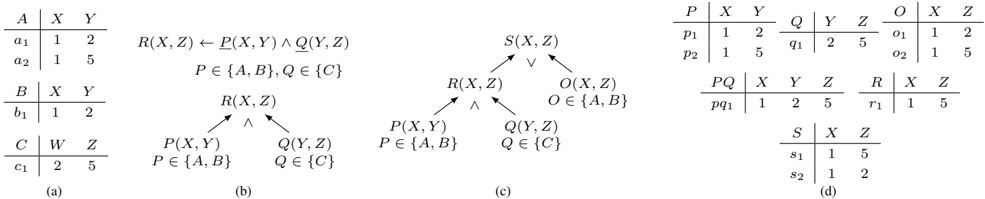
Figure 3 (a) introduces a toy knowledge base (KB) which will serve as a running example. The KB contains three binary predicates, each containing their respective facts along with a unique identifier for easy reference. Thus, A ( X,Y ) 's facts are A (1 , 2) (denoted a 1 ) and A (1 , 5) (denoted a 2 ). Figure 3 (b) shows a template for learning R ( X,Z ) with three crucial pieces of information: 1) the first predicate in its body P is binary and while we do not know the identity of this predicate we know its domain Dom ( P ) is { A,B } , 2) to keep the example simple, the second predicate in the body Q has a singleton domain ( { C } ), and lastly 3) the second argument in the first predicate should be equal to the first argument in the second predicate indicated by repeated use of Y . Figure 3 (b) (bottom) expresses the same template as a tree where P ( X,Y ) and Q ( Y, Z ) are annotated with their respective domains forming children of R ( X,Z ) whose label ∧ indicates that the predicates in its body are to be conjuncted together.
Figure 3 (c) shows a more complex template that disjuncts R ( X,Z ) with O ( X,Z ) , such that Dom ( O ) = { A,B } , to produce S ( X,Z ) . Figure 3 (d) shows generated facts (with unknown truth-values) that can be possibly produced when this template is combined with the KB from Figure 3 (a). P, Q and O contain the union of all facts included in the predicates in their respective domains. Since p 1 and q 1 are the only two facts that agree on value of Y , PQ , the predicate produced by the body of R , contains only one generated fact. R is obtained by dropping Y , which is then unioned with O to produce S . By comparing generated facts in S with labels in the training data, it is possible to learn a full program which in this case constitutes learning: 1) which predicates to replace P, Q and O with, and 2) the logical connectives, LNN-∧ and LNN-∨ , used to model R and S with, respectively. We next state a more formal problem definition.
Figure 3: (a) A toy KB. (b) An example rule template (top) and its tree form (bottom). (c) A more complex program template. (d) Generated facts for our running example.
<details>
<summary>Image 2 Details</summary>
### Visual Description
\n
## Relational Database Schemas and Logical Expressions
### Overview
The image presents four distinct representations related to relational database schemas and logical expressions. The first three (a, b, c) depict relational schemas with associated attributes and a logical expression. The fourth (d) shows multiple relational schemas with attributes and values.
### Components/Axes
The image consists of:
* **(a)** A relational schema labeled 'A' with attributes 'X' and 'Y', and values 1, 2, and 5. A schema labeled 'B' with attributes 'X' and 'Y', and values 1, 2. A schema labeled 'C' with attributes 'W' and 'Z', and values 2, 5.
* **(b)** A logical expression: `R(X, Z) ← P(X, Y) ∧ Q(Y, Z)` with the conditions `P ∈ {A, B}` and `Q ∈ {C}`.
* **(c)** A logical expression: `S(X, Z) ∨ (R(X, Z) ∧ O(X, Z))` with the condition `O ∈ {A, B}`.
* **(d)** Four relational schemas: 'P' with attributes 'X', 'Y', and values 1, 2, 5. 'Q' with attributes 'Y', 'Z', and values 2, 5. 'O' with attributes 'X', 'Z', and values 1, 5. 'R' with attributes 'X', 'Z', and values 1, 5. 'S' with attributes 'X', 'Z', and values 1, 5, 1, 2.
### Detailed Analysis or Content Details
**(a) Relational Schemas:**
* **A:** Attributes X, Y. Values: (X=1, Y=2), (X=1, Y=5).
* **B:** Attributes X, Y. Values: (X=1, Y=2).
* **C:** Attributes W, Z. Values: (W=2, Z=5).
**(b) Logical Expression:**
* `R(X, Z) ← P(X, Y) ∧ Q(Y, Z)`: R(X, Z) is true if both P(X, Y) and Q(Y, Z) are true.
* `P ∈ {A, B}`: P can be either schema A or schema B.
* `Q ∈ {C}`: Q must be schema C.
**(c) Logical Expression:**
* `S(X, Z) ∨ (R(X, Z) ∧ O(X, Z))`: S(X, Z) is true, or both R(X, Z) and O(X, Z) are true.
* `O ∈ {A, B}`: O can be either schema A or schema B.
**(d) Relational Schemas:**
* **P:** Attributes X, Y. Values: (X=1, Y=2), (X=1, Y=5). Labeled as p1, p2.
* **Q:** Attributes Y, Z. Values: (Y=2, Z=5). Labeled as q1.
* **O:** Attributes X, Z. Values: (X=1, Z=5). Labeled as o1, o2.
* **R:** Attributes X, Z. Values: (X=1, Z=5). Labeled as r1.
* **S:** Attributes X, Z. Values: (X=1, Z=5), (X=1, Z=2). Labeled as s1, s2.
### Key Observations
* The schemas in (a) are simple, containing only a few tuples.
* The logical expressions in (b) and (c) define dependencies between schemas.
* Schema (d) provides specific data instances for the schemas P, Q, O, R, and S.
* The schemas in (d) share common attributes (X, Y, Z) which is relevant to the logical expressions in (b) and (c).
### Interpretation
The image illustrates a scenario involving relational database schemas and how logical expressions can be used to define relationships and dependencies between them. The schemas in (a) represent potential sources of data, while the logical expressions in (b) and (c) specify how data from these schemas can be combined to derive new information. Schema (d) provides concrete data instances that can be used to test and evaluate the logical expressions.
The use of set notation (e.g., `P ∈ {A, B}`) indicates that the logical expressions are designed to be flexible and can operate on different schemas depending on the specific context. The logical expressions are likely part of a larger database query or rule system. The schemas and expressions together represent a fragment of a knowledge base or a data integration system. The logical expressions define rules for inferring new facts from existing data. The schemas provide the structure for storing and organizing the data. The data instances in schema (d) are used to validate the correctness of the rules and to demonstrate how the system can be used to answer queries.
</details>
Let T = ( V , E , L ) denote a tree-structured program template where V denotes the set of nodes, E denotes the set of edges and L denotes a mapping from V to node labels. L maps T 's leaves to the corresponding domain of predicates in the KB. In the worst case, the domain can be the subset of predicates in the KB that agrees with the arity of the leaf. L maps internal nodes to a logical operator {∧ , ∨ , ¬} . The ILP task can then be stated as, given T , a knowledge base KB, and truth-values corresponding to generated facts in the root of T , to learn all logical connectives involved along with selecting predicates for each leaf in T .
In the remainder of this section, we describe how to achieve the above ILP task given ground truth values for generated facts belonging to the root of the template. Let ψ ( v ) denote the truth value associated with (generated) fact v . Our strategy is to build a neural network that connects the truth values of generated facts from the root of the template to other (generated) facts in its lineage right down to the facts in the base KB whose truth values are defined to be 1 . The whole neural network can then be trained end-to-end using backpropagation. Let V ( X ) denote any node in T whose predicate is defined over variables X and whose children in T is denoted by N ( V ) . Also, let V ( x ) denote a fact obtained by the substitution X = x and F ( V ) denote all facts of V .
## 4.1 Combining Base Facts
Let V ( X ) denote a leaf in T with domain L ( V ) then F ( V ) is given by ⋃ P ∈L ( V ) F ( P ) . Computing ψ ( V ( X = x )) corresponding to X = x requires truth values of all facts corresponding to the same substitution. We provide two options that associate parameters with predicates in L ( V ) : 1) attention (Yang, Yang, and Cohen 2017) and 2) our proposed LNNpred operator:
$$\begin{array}{ll}
1) \psi ( V ( x ) ) = \sum _ { P \in C ( V ) } w p ( P ( x ) ) \\
2) \psi ( V ( x ) ) = 1 - relu ( \beta - \sum _ { P \in C ( V ) } w p ( P ( x ) ) )
\end{array}$$
where β , w P denote learnable parameters. One issue with attention is that it may lack sparsity assigning a majority of predicates in L ( V ) non-zero weights thus hampering interpretability. To address this, we propose an alternate parameterization, LNNpred , that is a simpler version of LNN-∨
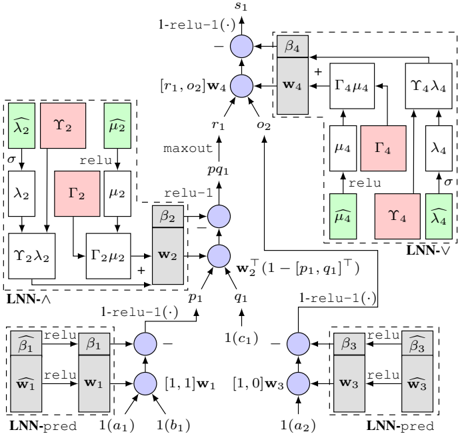
and lacks all constraints except for non-negativity of w P (since we do not require disjunctive semantics). As an example, the lower left corner of Figure 4 shows how to compute ψ ( p 1 ) from ψ ( a 1 ) , ψ ( b 1 ) since a 1 , b 1 form the lineage for p 1 (Figure 3). Here, β 1 , w 1 denote LNNpred 's parameters.
## 4.2 Combining Facts with Conjunction
We handle conjunctions in two steps: 1) first construct the result of the body of the clause, and then 2) construct the head, dropping variables if needed. Let V ( Y ) in T be such that L ( V ) = ∧ and N ( V ) denote its children. Also, let I ( X ) denote the intermediate predicate produced from the body of V ( Y ) potentially containing additional variables such that X ⊇ Y . We use LNN-∧ to compute ψ of I ( x ) :
$$\sum _ { s \in S } \varphi ( I ( x ) ) = r e l u 1 ( b - \sum _ { P \in P ( X _ { var } ( P ) ) } w p ( 1 - v ) ( P ( X _ { var } ( P ) ) ) )$$
where var ( P ) denotes predicate P 's arguments and x var denotes the substitution restricted to variables in var. When X ⊃ Y , multiple facts from F ( I ) may combine to produce a fact in V ( Y ) and we use maxout for this:
$$V : y ( V ( y ) ) = \maxout ( y ( I )$$
where maxout ( { x 1 , . . . } ) (Goodfellow et al. 2013) returns the maximum of the set. Figure 4 shows how ψ ( pq 1 ) is computed from ψ ( p 1 ) , ψ ( q 1 ) where β 2 , w 2 denotes LNN-∧ 's parameters. Since pq 1 is the only intermediate fact leading to r 1 , we do not need maxout in this case. However, if that was not the case, Figure 4 shows where maxout would appear.
## 4.3 Combining Facts with Disjunction
Given V ( X ) in T such that L ( V ) = ∨ , ψ ( V ( x )) can be computed using LNN-∨ :
$$\phi ( V ( x ) ) = 1 - \text{relu} ( \beta - \sum _ { P \in N ( V ) } w p ^{\psi}( P ( x ) )$$
In Figure 4 shows how ψ ( s 1 ) is computed from ψ ( r 1 ) and ψ ( o 2 ) where β r , w 4 denotes LNN-∨ 's parameters.
## 4.4 Other Operations and Extensions
Implementing negation is more involved since it requires that we consider assignments that may lead to facts in V but are
Figure 4: Neural network constructed for s 1 ∈ F ( S ) . σ denotes softmax .
<details>
<summary>Image 3 Details</summary>
### Visual Description
\n
## Diagram: Latent Neural Network (LNN) Architecture
### Overview
The image depicts a diagram of a Latent Neural Network (LNN) architecture, showcasing the flow of information through various layers and components. The diagram is composed of several interconnected blocks representing different operations and layers within the network. The diagram is grayscale.
### Components/Axes
The diagram consists of several labeled blocks and connections. Key components include:
* **LNN-Λ:** A block labeled "LNN-Λ" enclosed in a dashed box.
* **LNN-V:** A block labeled "LNN-V" enclosed in a dashed box.
* **LNN-pred:** Two blocks labeled "LNN-pred" enclosed in dashed boxes.
* **Boxes with Greek Letters:** Several boxes containing Greek letters (λ, γ, μ, Γ, β) in various colors (red, green, gray).
* **Circles with Plus Signs:** Representing addition operations.
* **Circles with Arrows:** Representing connections and transformations.
* **Rectangles with "relu" and "maxout":** Representing activation functions.
* **Labels:** s1, r1, o2, p1, q1, c1, a1, a2, b1, b2.
* **Weights:** w1, w2, w3, w4.
* **Functions:** l-relu-1(), σ (sigma).
### Detailed Analysis or Content Details
The diagram can be broken down into sections:
**1. LNN-Λ (Top-Left):**
* Input: λ2, γ2, μ2.
* Operations: σ (sigma), relu, Γ2, μ2.
* Output: r1, o2.
**2. Central Processing (Top-Center):**
* Input: r1, o2, w4.
* Operation: maxout.
* Output: p1, q1.
**3. LNN-V (Top-Right):**
* Input: Γ4μ4.
* Operations: relu, γ4, λ4.
* Output: λ4.
**4. LNN-pred (Bottom-Left):**
* Input: a1, w1.
* Operations: relu, β1.
* Output: 1(c1).
**5. LNN-pred (Bottom-Right):**
* Input: a2, w3.
* Operations: relu, β3.
* Output: b1, b2.
**Connections and Functions:**
* l-relu-1() is applied to several outputs.
* w1 is connected to a1 and β1.
* w2 is connected to p1 and q1.
* w3 is connected to a2 and β3.
* w4 is connected to r1 and o2.
* The output of the maxout function (p1, q1) is connected to the LNN-V block.
* The output of the LNN-V block is connected back to the LNN-Λ block via Γ4μ4.
### Key Observations
* The diagram shows a recurrent structure with feedback loops between LNN-Λ and LNN-V.
* The use of multiple activation functions (relu, maxout, l-relu-1) suggests a complex non-linear transformation of the input data.
* The presence of Greek letters within boxes likely represents parameters or latent variables within the network.
* The diagram is highly symbolic and doesn't provide specific numerical values.
### Interpretation
The diagram illustrates the architecture of a Latent Neural Network, designed to learn and represent latent variables within the data. The LNN-Λ block likely functions as an encoder, mapping input data to a latent space. The LNN-V block could be a decoder, reconstructing the input from the latent representation. The LNN-pred blocks likely perform prediction or classification based on the latent variables. The feedback loops suggest a mechanism for refining the latent representation over time. The use of maxout and relu activation functions indicates a desire to capture complex non-linear relationships in the data. The diagram is a high-level representation of the network's structure and doesn't provide details about the training process or specific applications. The diagram is a conceptual illustration of the network's architecture, rather than a concrete implementation. The diagram is a technical illustration of a neural network architecture, likely intended for researchers or engineers working in the field of machine learning.
</details>
not present in its child predicate P . Given a universe of all possible assignments U , we express ψ ( V ( x )) as:
$$\frac { 1 } { 2 } \times 1 = 1 - \frac { 1 } { 2 } \times 1 = \frac { 1 } { 2 }$$
where ψ ( P ( x )) is defined as 0 if P ( x ) / ∈ F ( P ) .
Note that, any LNN operator introduced for V ( X ) is shared across all V ( x ) ∈ F ( V ) since the result of ILP should be agnostic of individual facts. Thus, even though the (sub)network constructed for V ( x ) may differ from V ( x ′ ) 's, e.g., s 2 's neural network (not shown) is simpler than s 1 's, gradient updates flow to the same LNN parameters. For simplicity, we only discussed templates comprising a tree of Horn clauses but the ideas presented here can easily extend to DAG-structured templates and going beyond equality conditions in the body of a clause, e.g., R ( X,Z ) ← P ( X,Y ) ∧ Q ( Y ′ , Z ) ∧ Y > Y ′ .
## 4.5 Learning Constrained Activations
So far, we have shown how to construct a neural network from a KB and template comprising parameters of LNN operators but we have not addressed how to enforce constraints on said parameters. More precisely, β i , w i , ∀ i = 1 , . . . 4 in Figure 4 need to satisfy the respective constraints associated with the LNN operators they form parameters for (as described in Section 3). Since backpropagation does not handle constraints, we propose to apply a recently proposed approach to 'fold' in a system of linear constraints as layers into the neural network (Frerix, Nießner, and Cremers 2020). We note that Riegel et al. (2020) also devise a training algorithm for learning LNN operators but this is tightly connected to a specific kind of LNN operator called tailored activation. For the small systems of inequality constraints introduced by LNN-∧ , LNN-∨ and LNNpred , the approach presented here conveniently allows learning all (constrained) parameters of LNNs using vanilla backpropagation alone.
Frerix, Nießner, and Cremers (2020) recently showed how to handle a system of linear inequality constraints of the form A z ≤ b where A denotes a matrix containing coefficients in the constraints, z denotes the parameters (in our case, some concatenation of β and w ), and b denotes the constants in the constraints. We begin with the Minkowski-Weyl theorem:
Theorem 4.1. A set C = { z | A z ≤ b } is a convex polyhedron if and only if:
<!-- formula-not-decoded -->
where Υ and Γ contain a finite number of rays and vertices, respectively.
which states that there exists a translation from A , b to Υ , Γ obtained via the double-description method (Motzkin et al. 1953). Assuming we can generate non-negative vectors µ, λ and additionally ensure that λ sums to 1 , then one can access a point z = [ β, w ] from the feasible set C by computing Υ µ +Γ λ . Sampling vectors µ, λ can be achieved, for instance, by using relu (Nair and Hinton 2010) and softmax :
<!-- formula-not-decoded -->
Additionally, these operations can be easily included into any neural network as additional layers. For instance, Figure 4 contains in dashed boxes the above set of layers needed to generate w i , β i , ∀ i = 1 , . . . 4 . The resulting neural network is self-contained, and can be trained by vanilla backpropagation end-to-end thus ensuring that the learned LNN parameters satisfy their respective constraints.
## 5 Experiments
Our experiments compare ILP with LNN against other neurosymbolic ILP approaches on standard benchmarks. We evaluate rules in terms of application-specific goodness metrics and interpretability.
## 5.1 Gridworld
The goal in Gridworld is to learn rules that can help an agent move across an N × N regular grid. Some of the cells on the grid are deemed obstacles that the agent cannot step onto, and the agent's goal is to arrive at the cell which has been deemed the destination.
Predicates, Template and Rewards : We include two kinds of base predicates to describe the grid 1) HasObstacle -dir ( X,Y ) is true if the cell next to X,Y in direction dir contains an obstacle, 2) HasTarget -dir ( X,Y ) is true if the destination lies in direction dir from cell X,Y . There are four directions, North, South, East, and West, and including their negated counterparts, ¬ HasObstacle -dir ( X,Y ) and ¬ HasTarget -dir ( X,Y ) , brings the total number of base predicates to 8 . The template is S ( X,Y ) ← P ( X,Y ) ∧ Q ( X,Y ) where P 's domain includes all HasObstacle -dir predicates and their negated counterparts, and Q 's domain includes all HasTarget -dir predicates and their negated counterparts. We set α = 0 . 8 and use a simple reward mechanism: +1 for moving towards the destination, -1 for moving
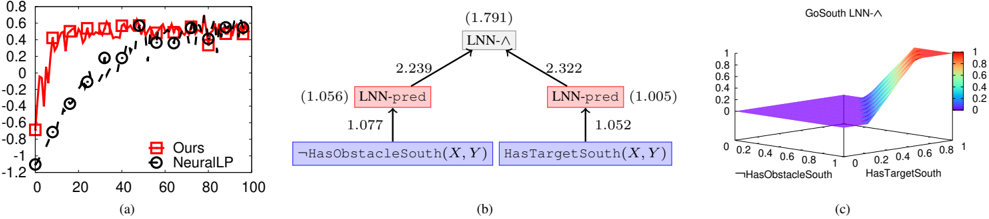
Figure 5: Gridworld: (a) Avg. Rewards vs. Training Grids. (b) LNN Rule and (c) LNN-∧ for GoSouth(X,Y).
<details>
<summary>Image 4 Details</summary>
### Visual Description
\n
## Chart/Diagram Type: Performance Comparison & Neural Network Architecture Visualization
### Overview
The image presents a comparison of two methods ("Ours" and "NeuralLP") in a scatter plot (a), a diagram of a neural network architecture (b), and a 3D surface plot (c) visualizing a function related to the network's output. The overall theme appears to be evaluating the performance of a novel method ("Ours") against a baseline ("NeuralLP") in a reinforcement learning or similar context, potentially involving navigation or path planning.
### Components/Axes
**(a) Scatter Plot:**
* **X-axis:** Labeled "0", "20", "40", "60", "80", "100". Units are not specified.
* **Y-axis:** Scale ranges from approximately -1.2 to 0.8. Units are not specified.
* **Data Series 1:** "Ours" - Represented by red squares with error bars.
* **Data Series 2:** "NeuralLP" - Represented by black circles with error bars.
* **Legend:** Located at the bottom-left, clearly labeling the two data series.
**(b) Neural Network Diagram:**
* **Nodes:** Labeled "LNN-A" (with value 1.791), "LNN-pred" (with value 1.056 and 1.005).
* **Inputs:** "HasObstacleSouth(X,Y)" and "HasTargetSouth(X,Y)".
* **Arrows:** Indicate the flow of information and are labeled with numerical weights (2.239, 3.222, 1.077, 1.052).
* **Node Color:** "LNN-pred" nodes are colored red. Input nodes are colored blue.
**(c) 3D Surface Plot:**
* **X-axis:** "HasObstacleSouth(X,Y)" - Scale ranges from 0 to 0.8.
* **Y-axis:** "HasTargetSouth(X,Y)" - Scale ranges from 0 to 0.8.
* **Z-axis:** Represents the output value, ranging from approximately 0 to 1.
* **Color Map:** A gradient from blue (low values) to red (high values) is used to represent the output value on the surface.
* **Title:** "GoSouth LNN-A" is positioned at the top-right.
### Detailed Analysis or Content Details
**(a) Scatter Plot:**
* **"Ours" (Red Squares):** The data points generally cluster around positive Y-values, starting around Y=0.2 at X=0 and increasing to around Y=0.6 at X=100. There is significant variance, indicated by the error bars. The trend is generally upward, but with considerable fluctuation.
* **"NeuralLP" (Black Circles):** The data points start around X=0 and Y=0.2, then decrease to approximately Y=-0.8 at X=40, and then increase again to around Y=0.4 at X=100. The trend is initially downward, then upward. Error bars are also present.
* **Approximate Data Points ("Ours"):** (0, 0.2), (20, 0.3), (40, 0.4), (60, 0.5), (80, 0.55), (100, 0.6).
* **Approximate Data Points ("NeuralLP"):** (0, 0.2), (20, 0.1), (40, -0.8), (60, -0.2), (80, 0.2), (100, 0.4).
**(b) Neural Network Diagram:**
* The diagram shows a simple neural network with two input nodes ("HasObstacleSouth(X,Y)" and "HasTargetSouth(X,Y)") connected to a hidden layer node ("LNN-pred") and then to an output node ("LNN-A").
* The weights connecting the inputs to "LNN-pred" are 1.077 and 1.052, respectively.
* The weights connecting "LNN-pred" to "LNN-A" are 2.239 and 3.222, respectively.
**(c) 3D Surface Plot:**
* The surface plot shows a complex relationship between the input variables "HasObstacleSouth(X,Y)" and "HasTargetSouth(X,Y)" and the output value.
* The surface is relatively flat near the origin (0,0).
* There is a significant peak in the output value when "HasObstacleSouth(X,Y)" is around 0.6 and "HasTargetSouth(X,Y)" is around 0.4.
* The surface is generally higher when "HasTargetSouth(X,Y)" is high and "HasObstacleSouth(X,Y)" is low.
### Key Observations
* The "Ours" method consistently achieves higher Y-values than "NeuralLP" for most of the X-axis range in the scatter plot.
* "NeuralLP" exhibits a more pronounced dip in performance around X=40.
* The neural network diagram shows a relatively simple architecture.
* The 3D surface plot suggests a non-linear relationship between the input variables and the output.
### Interpretation
The data suggests that the "Ours" method outperforms "NeuralLP" in the evaluated task, as indicated by the consistently higher values in the scatter plot. The dip in "NeuralLP" performance around X=40 might indicate a specific scenario where the method struggles. The neural network diagram provides insight into the architecture of the "Ours" method, showing how the input features ("HasObstacleSouth(X,Y)" and "HasTargetSouth(X,Y)") are processed to generate the output "LNN-A". The 3D surface plot visualizes the function represented by the network, revealing the complex interplay between the input features and the output. The peak in the surface plot suggests that the network is particularly sensitive to certain combinations of obstacle and target presence. The weights in the neural network diagram indicate the relative importance of different connections. The higher weights connecting "LNN-pred" to "LNN-A" suggest that the hidden layer plays a crucial role in determining the final output. Overall, the image presents a compelling case for the effectiveness of the "Ours" method and provides valuable insights into its underlying mechanisms.
</details>
away, and -2 for stepping on an obstacle. The learning objective is to maximize rewards on randomly generated 5 × 5 grids with 3 obstacles sampled uniformly at random. We test the learned rules on grids with 12 obstacles.
Results : We compare our approach based on LNNpred and LNN-∧ , against NeuralLP which uses attention and product t -norm. Figure 5 (a) shows mean rewards averaged across all cells of 50 test grids produced by the learned rules on the y-axis vs. number of training grids observed on the x-axis. NeuralLP requires a lot more grids before it can learn the desired rules whereas we learn almost perfect rules after observing as few as 20 training grids. Essentially, in comparison to product t -norm, due to the extra learnable parameters in LNN-∧ , we can learn with fewer learning iterations. Figure 5 (b) shows the weights for the LNN rule for GoSouth ( X,Y ) on the edges and biases in parenthesis. This rule allows the agent to go South if 1) target is in that direction and, 2) there is no obstacle to the immediate South of the current cell. Despite the leaves of the template containing 8 predicates each in their respective domains, the learned LNNpred s are quite sparse and thus highly interpretable. The left LNNpred assigns 1 non-zero weight to ¬ HasObstacleSouth out of all HasObstacle -dir predicates and their negated counterparts, and the right LNNpred assigns 1 non-zero weight to HasTargetSouth out of all HasTarget -dir predicates and their negated counterparts. This may be due to the use of relu1 in LNNpred whose sparsity-inducing properties have been noted before (Krizhevsky 2010). In Figure 5 (c), we also plot GoSouth ( X,Y ) 's learned LNN-∧ .
## 5.2 Knowledge Base Completion
Knowledge base completion (KBC) is a standard benchmark for ILP. We experiment with publicly available KBC datasets Kinship, UMLS (Kok and Domingos 2007), WN18RR (Dettmers et al. 2018), and FB15K-237 (Toutanova and Chen 2015) 2 (see Table 1 for statistics). We compare against a host of rule-based KBC approaches: NeuralLP (Yang, Yang, and Cohen 2017), DRUM (Sadeghian et al. 2019), CTP (Minervini et al. 2020b) which is an improvement on neural theorem provers (Rockt¨ aschel and Riedel 2017), and the recently proposed RNNLogic 3 (Qu et al. 2021).
2 All available at github.com/shehzaadzd/MINERVA
3 We compare with rules-only RNNLogic ('w/o embd.'), since using embeddings is out of scope of this work.
Table 1: Statistics of KBC datasets.
| Name | Vertices | Predicates | Facts | Queries |
|-----------|------------|--------------|---------|-----------|
| UMLS | 135 | 49 | 5216 | 661 |
| Kinship | 104 | 26 | 10686 | 1074 |
| WN18RR | 40945 | 11 | 86835 | 3134 |
| FB15K-237 | 14505 | 237 | 272115 | 20466 |
Task Description and Template : A popular abstraction of the KBC task is to complete edges or triples missing from the knowledge graph (KG). More precisely, given a query 〈 h, r, ? 〉 , where h denotes a source vertex and r denotes a relation from the KG, most KBC approaches provide a ranked list of destination vertices. Most of the aforementioned rulebased KBC approaches exclusively focus on learning chain FOL rules as discussed in Section 2. There are at least two prevalent approaches to learn chain rules for KBC. The first approach (Yang, Yang, and Cohen 2017; Sadeghian et al. 2019) represents each predicate in the body as a mixture of relations present in the KG, and subsequently combines these via a conjunction operator. Figure 3 (c)'s template captures this where the subtree rooted at R defines chain rules of length 2 predicates and O captures length 1 thus enabling learning of chain rules capturing multi-hop paths of length up to 2 . The only change we need to make to this template is to include all relations in the KG into the domains of the leaves. It is also easy to extend the template to learn longer chain rules. A different approach, pioneered by MINERVA (Das et al. 2018) and RNNLogic (Qu et al. 2021), is to define the chain rule as a mixture over all possible paths that can exist in the KG. This latter approach leads to more effective KBC and thus we report results by expressing it in our LNN framework as follows: 1) Express each possible multi-hop path as a base relation, and 2) Use one LNN-pred operator to express a mixture over all multi-hop paths.
Metrics and Methodology : We learn a chain rule per relation present in the KG. Following previous work (Yang, Yang, and Cohen 2017), we also add inverse relations to the KG which switches the source and destination vertices. We also include inverse triples into our test set. We compute filtered ranks for destinations (Bordes et al. 2013), which removes all true triples ranked above, and compute the following metrics based on Sun et al. (2020)'s suggestions. Let n denote the number of destinations that have a score strictly greater than
Table 2: KBC Results: Bold font denotes best in row. CTP does not scale to WN18RR, FB15K-237. * indicates results copied from original paper.
| | | NeuralLP | DRUM | CTP | RNNLogic | Ours |
|---------|---------|------------|--------|-------|------------|--------|
| Kinship | Hits@10 | 89.1 | 86.1 | 93.9 | 91.1 | 98.4 |
| Kinship | Hits@3 | 63 | 48.2 | 79.7 | 72.9 | 89.3 |
| Kinship | MRR | 48.8 | 40 | 70.3 | 64.5 | 81.9 |
| | Hits@10 | 93 | 97.9 | 97.0 | 91.1 | 99.4 |
| | Hits@3 | 75.4 | 91.2 | 91.0 | 82.1 | 98.3 |
| | MRR | 55.3 | 61.8 | 80.1 | 71.0 | 90 |
| | Hits@10 | 50.2 | 52.1 | - | 53.1 ∗ | 55.5 |
| | Hits@3 | 43.3 | 44.6 | - | 47.5 ∗ | 49.7 |
| | MRR | 33.7 | 34.8 | - | 45.5 ∗ | 47.3 |
| | Hits@10 | 32.8 | 33.1 | - | 44.5 ∗ | 47 |
| | Hits@3 | 19.8 | 20 | - | 31.5 ∗ | 34.2 |
| | MRR | 17.4 | 17.5 | - | 28.8 ∗ | 30.7 |
destination t 's and let the number of destinations assigned the same score as t 's be denoted by m (including t ), then we compute t 's mean reciprocal rank (MRR) and Hits@K as:
<!-- formula-not-decoded -->
where δ () denotes the Dirac delta function. For each method, we report averages across all test set triples. We learn chain rules containing up to 3 predicates for Kinship and UMLS, 4 for FB15K-237, and 5 for WN18RR in the body of the rule. We provide additional details including the training algorithm used and hyperparameter tuning in Appendix A.
Results : Table 2 reports results for all methods. While CTP improves upon the efficiency of neural theorem provers (Rockt¨ aschel and Riedel 2017), it still does not scale beyond Kinship and UMLS (indicated by -). Also, we copy previously published results for RNNLogic on WN18RR and FB15K-237 4 (indicated by ∗ ). On the smaller datasets, CTP is the best baseline but our results are significantly better producing 16 . 5% and 12 . 4% relative improvements in MRR on Kinship and UMLS, respectively. On the larger datasets, RNNLogic is the current state-of-the-art within rule-based KBC and we outperform it producing 4% and 6 . 6% relative improvements in MRR on WN18RR and FB15K-237, respectively. Despite both learning a mixture over relation sequences appearing on KG paths, one reason for our relative success could be that RNNLogic uses an inexact training algorithm (Qu et al. 2021), relying on expectation-maximization, ELBO bound, whereas we employ no such approximations. Learned Rules for FB15K-237 : Table 3 presents a few rules learned from FB15K-237. Rule 1 in Table 3 infers the language a person speaks by exploiting knowledge of the language spoken in her/his country of nationality. In terms of multi-hop path, this looks like: P ( person ) nationality -→ N ( nation ) spoken in -→ L ( language ) . Similarly, Rule 2 uses the film country relation instead of nationality to infer the language used in a film. Besides spoken in, FB15K-237 contains
4 Despite exchanging multiple emails with its authors, we were unable to run RNNLogic code on the larger KBC datasets.
Table 3: Learned rules from FB15K-237.
| 1) | person language ( P,L ) ← | nationality ( P,N ) ∧ spoken in ( L,N ) |
|----------------------------------|----------------------------------|---------------------------------------------------------------------------------------|
| 2) | film language ( F,L ) ← | film country ( F,C ) ∧ spoken in ( L,C ) |
| 3) tv program language ( P,L ) ← | 3) tv program language ( P,L ) ← | country of tv program ( P,N ) ∧ official language ( N,L ) |
| 4) | burial place ( P,L ) ← | nationality ( P,N ) ∧ located in ( L,N ) |
| 5) | tv program country ( P,N ) ← | tv program actor ( P,A ) ∧ born in ( A,L ) ∧ located in ( L,N ) |
| 6) | film release region ( F,R ) ← | film crew ( F,P ) ∧ marriage location ( P,L ) ∧ located in ( L,R ) |
| 7) | marriage location ( P,L ) ← | celebrity friends ( P,F ) ∧ marriage location ( F,L ′ ) ∧ location adjoins ( L ′ ,L ) |
other relations that can be utilized to infer language such as the official language spoken in a country. Rule 3 uses this relation to infer the language spoken in a TV program by first exploiting knowledge of its country of origin. Rules 5, 6 and 7 are longer rules containing 3 relations each in their body. Rule 5 infers a TV program's country by first exploiting knowledge of one of its actor's birth place and then determining which country the birth place belongs to. Rule 6 is similar but uses a film crew member's marriage location instead to infer the region where the film was released. Lastly, Rule 7 infers the marriage location of a celebrity by exploiting knowledge of where their friends got married.
Additional KBC Results : Due to space constraints, in Appendix B we report results on the Countries dataset (Bouchard, Singh, and Trouillon 2015) for which ground truth rules are known. On Countries, our KBC accuracy is comparable to other approaches and the learned LNN rules form a close match with the ground truth rules specified in Nickel, Rosasco, and Poggio (2016).
## 6 Conclusion
Our experiments show that learning rules and logical connectives jointly is not only possible but leads to more accurate rules than other neuro-symbolic ILP approaches. Templates provide a flexible way to express a wide range of ILP tasks. The templates used for Gridworld and KBC are distinct, yet we outperformed baselines in both cases. LNN rules use weights sparingly and are eminently interpretable while LNN operators' constraint formulation ensures close ties to classical logic's precise semantics compared to other approaches (e.g., NLM). While our neural network requires grounding the KB, our approach is still scalable enough to tackle the larger KBC benchmarks whereas others are not (e.g., CTP). In terms of future work, we aim to combine the ideas presented here with embedding of predicates and constants in a high-dimensional latent space to hopefully further improve performance. We would also like to extend our approach to learn more general Prolog-style rules.
## References
Bordes, A.; Usunier, N.; Garcia-Duran, A.; Weston, J.; and Yakhnenko, O. 2013. Translating embeddings for modeling multi-relational data. In NeurIPS .
Bouchard, G.; Singh, S.; and Trouillon, T. 2015. On Approx- imate Reasoning Capabilities of Low-Rank Vector Spaces. In AAAI .
Das, R.; Dhuliawala, S.; Zaheer, M.; Vilnis, L.; Durugkar, I.; Krishnamurthy, A.; Smola, A.; and McCallum, A. 2018. Go for a Walk and Arrive at the Answer: Reasoning Over Paths in Knowledge Bases using Reinforcement Learning. In ICLR .
Dettmers, T.; Minervini, P.; Stenetorp, P.; and Riedel, S. 2018. Convolutional 2d knowledge graph embeddings. In Thirtysecond AAAI conference on artificial intelligence .
Donadello, I.; Serafini, L.; and d'Avila Garcez, A. S. 2017. Logic Tensor Networks for Semantic Image Interpretation. In IJCAI .
Dong, H.; Mao, J.; Lin, T.; Wang, C.; Li, L.; and Zhou, D. 2019. Neural Logic Machines. In ICLR .
Esteva, F.; and Godo, L. 2001. Monoidal t-norm based logic: Towards a logic for left-continuous t-norms. Fuzzy Sets and Systems .
Evans, R.; and Grefenstette, E. 2018. Learning Explanatory Rules from Noisy Data. JAIR .
Frerix, T.; Nießner, M.; and Cremers, D. 2020. Homogeneous Linear Inequality Constraints for Neural Network Activations. In CVPR Workshops .
Getoor, L.; and Taskar, B. 2007. Introduction to Statistical Relational Learning (Adaptive Computation and Machine Learning) . The MIT Press.
Goodfellow, I.; Warde-Farley, D.; Mirza, M.; Courville, A.; and Bengio, Y. 2013. Maxout Networks. In ICML .
Kazemi, S. M.; and Poole, D. 2018. RelNN: A Deep Neural Model for Relational Learning. In AAAI .
Kok, S.; and Domingos, P. 2007. Statistical predicate invention. In Proceedings of the 24th international conference on Machine learning , 433-440.
Krizhevsky, A. 2010. Convolutional deep belief networks on CIFAR-10. Unpublished Manuscript.
Manhaeve, R.; Dumancic, S.; Kimmig, A.; Demeester, T.; and Raedt, L. D. 2018. DeepProbLog: Neural Probabilistic Logic Programming. CoRR .
Minervini, P.; Bosnjak, M.; Rockt¨ aschel, T.; Riedel, S.; and Grefenstette, E. 2020a. Differentiable reasoning on large knowledge bases and natural language. In AAAI .
Minervini, P.; Riedel, S.; Stenetorp, P.; Grefenstette, E.; and Rockt¨ aschel, T. 2020b. Learning Reasoning Strategies in End-to-End Differentiable Proving. In ICML .
Motzkin, T. S.; Raiffa, H.; Thompson, G. L.; and Thrall, R. M. 1953. The double description method. Contributions to the Theory of Games .
Muggleton, S. 1996. Learning from positive data. In Worshop on ILP .
Muggleton, S. H.; Lin, D.; Pahlavi, N.; and TamaddoniNezhad, A. 2014. Meta-interpretive Learning: Application to Grammatical Inference. Machine Learning .
Nair, V.; and Hinton, G. 2010. Rectified Linear Units Improve Restricted Boltzmann Machines. In ICML .
Nickel, M.; Rosasco, L.; and Poggio, T. 2016. Holographic Embeddings of Knowledge Graphs. In AAAI .
Qu, M.; Chen, J.; Xhonneux, L.-P.; Bengio, Y.; and Tang, J. 2021. { RNNL } ogic: Learning Logic Rules for Reasoning on Knowledge Graphs. In ICLR .
Riegel, R.; Gray, A.; Luus, F.; Khan, N.; Makondo, N.; Akhalwaya, I. Y.; Qian, H.; Fagin, R.; Barahona, F.; Sharma, U.; Ikbal, S.; Karanam, H.; Neelam, S.; Likhyani, A.; and Srivastava, S. 2020. Logical Neural Networks. CoRR .
Rockt¨ aschel, T.; and Riedel, S. 2017. End-to-End Differentiable Proving. In NeurIPS .
Sadeghian, A.; Armandpour, M.; Ding, P.; and Wang, D. Z. 2019. DRUM: End-To-End Differentiable Rule Mining On Knowledge Graphs. In NeurIPS .
Sourek, G.; Svatos, M.; Zelezny, F.; Schockaert, S.; and Kuzelka, O. 2017. Stacked Structure Learning for Lifted Relational Neural Networks. In International Conference on Inductive Logic Programming .
Sun, Z.; Vashishth, S.; Sanyal, S.; Talukdar, P.; and Yang, Y. 2020. A Re-evaluation of Knowledge Graph Completion Methods. In ACL .
Toutanova, K.; and Chen, D. 2015. Observed versus latent features for knowledge base and text inference. In Proceedings of the 3rd workshop on continuous vector space models and their compositionality , 57-66.
Yang, F.; Yang, Z.; and Cohen, W. W. 2017. Differentiable Learning of Logical Rules for Knowledge Base Reasoning. In NeurIPS .
## A Implementation Details for KBC Experiments
Given a training knowledge graph G = 〈V , R , E〉 whose vertices are given by V , edges are given by E and relations are given by R , we learn a chain FOL rule for each r ∈ R independently. Each edge in E is given by a triple 〈 h, r, t 〉 where h, t ∈ V denote source and destination vertices, and r ∈ R denotes a relation. Following previous work (Yang, Yang, and Cohen 2017), we also add inverse relations. In other words, for each r ∈ R we introduce a new relation r -1 by adding for each 〈 h, r, t 〉 ∈ E a new triple 〈 t, r -1 , h 〉 to G . Learning to predict destinations for a given relation r in the augmented set of relations is essentially a binary classification task where 〈 h, r, t 〉 ∈ E and 〈 h, r, t 〉 / ∈ E , ∀ h, t ∈ V , denote positive and negative examples, respectively.
Training Algorithm & Hyperparameter Settings : In each iteration, we sample uniformly at random a mini-batch of positive triples B + from 〈 h, r, t 〉 ∈ E and negative triples B -from 〈 h, r, t 〉 / ∈ E , ∀ h, t ∈ V , such that | B + | = | B -| to minimize the following loss:
<!-- formula-not-decoded -->
where γ denotes the margin hyperparameter. We use Adagrad ( ? ) with step size ∈ { 0 . 1 , 1 . 0 } , margin γ ∈ { 0 . 1 , 0 . 5 , 1 . 0 , 2 . 0 } and batch size | B + | = | B -| = 8 . We use the validation set to perform hyperparameter tuning and
## NeuralLP
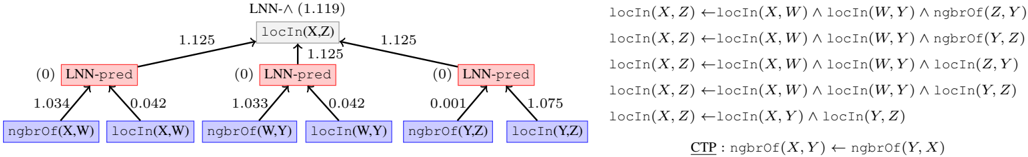
Figure 6: LNN-rule (left) vs. NeuralLP's (5) rules (top right) vs. CTP's rule (bottom right) for Countries-S3.
<details>
<summary>Image 5 Details</summary>
### Visual Description
\n
## Diagram: Logical Network Prediction Structure
### Overview
The image depicts a diagram representing a logical network prediction structure. It shows a tree-like structure with nodes representing predicates and edges representing relationships and associated weights. The diagram also includes a block of logical rules written in a formal language.
### Components/Axes
The diagram consists of:
* **Root Node:** `LNN-Λ (1.119)` - A node labeled "LNN-Λ" with a value of 1.119.
* **Intermediate Nodes:** `locIn(X,Z)` - Three intermediate nodes labeled "locIn(X,Z)".
* **Leaf Nodes:** `LNN-pred` - Three leaf nodes labeled "LNN-pred".
* **Bottom Nodes:** `ngbrOf(W)`, `locIn(X,W)`, `ngbrOf(W,Y)`, `locIn(W,Y)`, `ngbrOf(Y,Z)`, `locIn(Y,Z)` - Six bottom nodes representing input features.
* **Edge Weights:** Numerical values associated with each edge, indicating the strength of the relationship.
* **Logical Rules:** A block of text on the right side of the diagram containing logical rules.
### Detailed Analysis or Content Details
The diagram can be broken down as follows:
1. **Root to First Intermediate:** The root node `LNN-Λ (1.119)` connects to the first `locIn(X,Z)` node with a weight of 1.125.
2. **First Intermediate to Leaf:** The first `locIn(X,Z)` node connects to the first `LNN-pred` node with a weight of 1.125.
3. **Leaf to Bottom Nodes:** The first `LNN-pred` node connects to `ngbrOf(W)` with a weight of 1.034, to `locIn(X,W)` with a weight of 0.042.
4. **Root to Second Intermediate:** The root node `LNN-Λ (1.119)` connects to the second `locIn(X,Z)` node with a weight of 1.125.
5. **Second Intermediate to Leaf:** The second `locIn(X,Z)` node connects to the second `LNN-pred` node with a weight of 1.125.
6. **Leaf to Bottom Nodes:** The second `LNN-pred` node connects to `ngbrOf(W,Y)` with a weight of 1.033, to `locIn(W,Y)` with a weight of 0.042.
7. **Root to Third Intermediate:** The root node `LNN-Λ (1.119)` connects to the third `locIn(X,Z)` node with a weight of 1.125.
8. **Third Intermediate to Leaf:** The third `locIn(X,Z)` node connects to the third `LNN-pred` node with a weight of 1.125.
9. **Leaf to Bottom Nodes:** The third `LNN-pred` node connects to `ngbrOf(Y,Z)` with a weight of 0.001, to `locIn(Y,Z)` with a weight of 1.075.
The logical rules on the right side are:
```
locIn(X,Z) ←locIn(X,W) ∧ locIn(W,Y) ∧ ngbrOf(Z,Y)
locIn(X,Z) ←locIn(X,W) ∧ locIn(W,Y) ∧ ngbrOf(Y,Z)
locIn(X,Z) ←locIn(X,W) ∧ locIn(W,Y) ∧ locIn(Y,Z)
locIn(X,Z) ←locIn(X,W) ∧ locIn(W,Y) ∧ locIn(Y,Z)
locIn(X,Z) ←locIn(X,Y) ∧ locIn(Y,Z)
CTP: ngbrOf(X,Y) ← ngbrOf(Y,X)
```
### Key Observations
* The structure is symmetrical, with the root node branching out to three identical sub-structures.
* The weights associated with the connections from the leaf nodes to the bottom nodes vary significantly, suggesting different levels of importance for each input feature.
* The logical rules
</details>
Table 4: AUC-PR Results on Countries
| | NLM | NTP- λ | CTP | NeuralLP | Ours |
|----|-------------|--------------|------------|------------|----------|
| S1 | 58.06 ± 2.4 | 100 ± 0 | 99.6 ± 0.5 | 100 ± 0 | 100 ± 0 |
| S2 | 40.57 ± 5.3 | 93.04 ± 0.4 | 92.4 ± 1.7 | 75.1 ± 0.3 | 92.3 ± 0 |
| S3 | 53.37 ± 2.8 | 77.26 ± 17.0 | 55.4 ± 3.5 | 92.2 ± 0.2 | 91.3 ± 0 |
learn rules of length up to 4 for FB15K-237, 5 for WN18RR, and 3 for Kinship, UMLS.
## B Additional KBC Experiments
Besides the experiments presented in Section 5, we also experiment with the Countries dataset (Bouchard, Singh, and Trouillon 2015) which contains 272 vertices, 1158 facts and 2 predicates locatedIn ( X,Y ) (abbreviated locIn ) and neighborOf ( X,Y ) (abbreviated ngbrOf ). Following previous work (Das et al. 2018), we report area under the precision-recall curve (AUC-PR).
Nickel, Rosasco, and Poggio (2016) permute the facts in this dataset to pose 3 learning tasks { S 1 , S 2 , S 3 } each corresponding to learning a different rule. S1 and S2's rules contain 2 predicates in their bodies, whereas S3's body contains 3 . We use S ( X,Z ) ← P ( X,Y ) ∧ Q ( Y, Z ) as template for S1 and S2, and S ( X,Z ) ← P ( X,W ) ∧ Q ( W,Y ) ∧ O ( Y, Z ) for S3, where Dom ( P ) = Dom ( Q ) = Dom ( O ) = { locIn , ngbrOf } . We compare against NeuralLP 5 (Yang, Yang, and Cohen 2017), neural theorem provers 6 (NTPλ ) (Rockt¨ aschel and Riedel 2017), conditional theorem provers 7 (CTP) (Minervini et al. 2020b) and neural logic machines 8 (NLM) (Dong et al. 2019).
Table 4 reports averages across 3 runs. The NLM implementation we report results with is quite pessimistic almost never predicting a link. All other approaches achieve perfect AUC-PR on S1. We outperform NeuralLP on S2 and NTP shows high variance on S3 9 perhaps due to its excessive parameterization (NTP learns embeddings for predicates and vertices). CTP performs well on the first two tasks but fails on S3. To find out why, we take a close look at the learned rules next.
5 github.com/fanyangxyz/Neural-LP
6 github.com/uclnlp/ntp
7 github.com/uclnlp/ctp
8 github.com/google/neural-logic-machines
9 NTP's high variance on S2 is also noted in Das et al. (2018).
The goal in S2 and S3 (Countries) is to learn the following rules (Nickel, Rosasco, and Poggio 2016):
<!-- formula-not-decoded -->
We compare the rules learned by our approach, NeuralLP and CTP for Countries-S3. NeuralLP produces a weighted list of 5 rules (see Figure 6 top right, weights omitted) none of which capture the correct rule shown above. CTP learns that ngbrOf is a symmetric relation (Minervini et al. 2020b) which makes sense (Figure 6 bottom right). Unfortunately however, all facts that need to be proved in the test set of Countries-S3 pertain to locIn predicate which explains why CTP's AUC-PR for Countries-S3 is so poor (Table 4). In contrast, the learned LNN-rule shown in Figure 6 (left) is a near perfect translation of the correct logical rule into real-valued logic. Note that, the leftmost and middle LNNpred s place a large weight on ngbrOf vs. a small weight on locIn while the rightmost LNNpred does the opposite, which lines up perfectly with the rule to be learned.
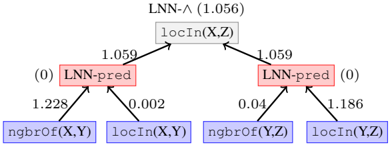
We also compared the rules learned for S2. Just as in the case of S3, for S2, the learned LNN rule's (shown in Figure 7) left LNNpred places a large weight on ngbrOf while placing a small weight on locIn whereas the right LNNpred does the opposite, closely matching the correct FOL rule shown above. The list of rules learned by NeuralLP (weight depicted in parenthesis) is shown below:
<!-- formula-not-decoded -->
none of which match the correct rule to be learned for S2. CTP learns the following rule (Minervini et al. 2020b):
Figure 7: LNN rule learned from Countries-S2
<details>
<summary>Image 6 Details</summary>
### Visual Description
\n
## Diagram: LNN-pred Dependency Graph
### Overview
The image depicts a directed acyclic graph representing dependencies in a model labeled "LNN-pred". The graph shows how different features or components influence the final prediction. The nodes represent these features, and the edges represent the strength of the dependency, indicated by numerical values.
### Components/Axes
The diagram consists of rectangular nodes connected by directed arrows. Each arrow is labeled with a numerical value representing the weight or strength of the dependency. The nodes are labeled with feature names like "LNN-pred", "locIn(X,Z)", "ngbrOf(X,Y)", and "locIn(X,Y)". There is a top-level node labeled "LNN-Λ (1.056)". Some nodes have a "(0)" label next to them.
### Detailed Analysis
The graph can be described as follows:
* **Top Node:** "LNN-Λ (1.056)" is at the top center.
* **Second Layer:** Two "LNN-pred" nodes (both colored in a light red) are positioned below "LNN-Λ". Both have a "(0)" label.
* **Connections to Top Node:** Each "LNN-pred" node is connected to "LNN-Λ" with an edge weight of 1.059.
* **Third Layer:** Below the "LNN-pred" nodes are four nodes colored in light blue: "ngbrOf(X,Y)", "locIn(X,Y)", "ngbrOf(Y,Z)", and "locIn(Y,Z)".
* **Connections to Second Layer:**
* The left "LNN-pred" node is connected to "ngbrOf(X,Y)" with a weight of 1.228 and to "locIn(X,Y)" with a weight of 0.002.
* The right "LNN-pred" node is connected to "ngbrOf(Y,Z)" with a weight of 0.04 and to "locIn(Y,Z)" with a weight of 1.186.
* **Node Labels:** The nodes are labeled with function-like names, suggesting they represent features or operations within the model. The "locIn" and "ngbrOf" labels suggest location-based and neighborhood-based features, respectively.
### Key Observations
* The "LNN-pred" nodes appear to be central to the model, receiving input from multiple features.
* The weights connecting "LNN-pred" to "ngbrOf(X,Y)" and "locIn(Y,Z)" are significantly higher (1.228 and 1.186) than the weights connecting "LNN-pred" to "locIn(X,Y)" and "ngbrOf(Y,Z)" (0.002 and 0.04). This suggests that these features have a stronger influence on the prediction.
* The "(0)" label next to the "LNN-pred" nodes might indicate a default value or a specific state.
* The top node "LNN-Λ" acts as a convergence point for the two "LNN-pred" nodes.
### Interpretation
This diagram represents a simplified dependency graph for a model, likely related to a location-based prediction task ("locIn" suggests location). The "LNN-pred" nodes likely represent intermediate predictions, and the graph shows how these predictions are influenced by neighborhood features ("ngbrOf") and location information ("locIn"). The higher weights on the connections to "ngbrOf(X,Y)" and "locIn(Y,Z)" suggest that the model relies more heavily on these features for making predictions. The "LNN-Λ" node could represent a final aggregation or combination of the "LNN-pred" outputs. The "(0)" labels on the "LNN-pred" nodes could indicate a baseline or initial state for these predictions. The graph provides a visual representation of the model's architecture and the relative importance of different features.
</details>
```
```
Not only does this rule not match the correct rule to be learned, it is also not very useful from the perspective of proving facts in the test set which pertain to predicate locIn exclusively.