## The Abduction of Sherlock Holmes: A Dataset for Visual Abductive Reasoning
Jack Hessel* 1 , Jena D. Hwang* 1 , Jae Sung Park 2 , Rowan Zellers 2 , Chandra Bhagavatula 1 , Anna Rohrbach 3 , Kate Saenko 4 , and Yejin Choi 1 , 2
1 Allen Institute for AI { jackh,jenah,chandrab } @allenai.org 2 Paul G. Allen School of Computer Science & Engineering, University of Washington { jspark96,rowanz,yejin } @cs.washington.edu 3 University of California, Berkeley anna.rohrbach@berkeley.edu 4 Boston University and MIT-IBM Watson AI saenko@bu.edu
Abstract. Humans have remarkable capacity to reason abductively and hypothesize about what lies beyond the literal content of an image. By identifying concrete visual clues scattered throughout a scene, we almost can't help but draw probable inferences beyond the literal scene based on our everyday experience and knowledge about the world. For example, if we see a '20 mph' sign alongside a road, we might assume the street sits in a residential area (rather than on a highway), even if no houses are pictured. Can machines perform similar visual reasoning?
We present Sherlock , an annotated corpus of 103K images for testing machine capacity for abductive reasoning beyond literal image contents. We adopt a free-viewing paradigm: participants first observe and identify salient clues within images (e.g., objects, actions) and then provide a plausible inference about the scene, given the clue. In total, we collect 363K (clue, inference) pairs, which form a first-of-its-kind abductive visual reasoning dataset. Using our corpus, we test three complementary axes of abductive reasoning. We evaluate the capacity of models to: i) retrieve relevant inferences from a large candidate corpus; ii) localize evidence for inferences via bounding boxes, and iii) compare plausible inferences to match human judgments on a newlycollected diagnostic corpus of 19K Likert-scale judgments. While we find that fine-tuning CLIP-RN50x64 with a multitask objective outperforms strong baselines, significant headroom exists between model performance and human agreement. Data, models, and leaderboard available at http://visualabduction.com/ .
You know my method.
It is founded upon the observation of trifles.
## 2 J. Hessel et al.
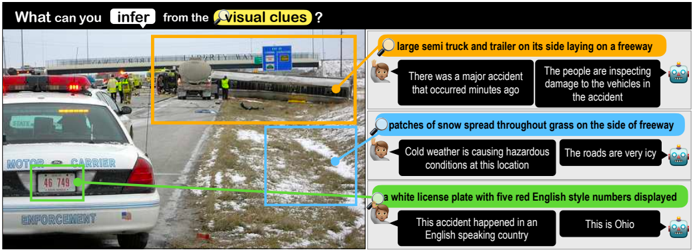
Fig. 1: We introduce Sherlock : a corpus of 363K commonsense inferences grounded in 103K images. Annotators highlight localized clues (color bubbles) and draw plausible abductive inferences about them (speech bubbles). Our models are able to predict localized inferences (top predictions are shown), but we quantify a large gap between machine performance and human agreement.
<details>
<summary>Image 1 Details</summary>
### Visual Description
\n
## Image: Accident Scene Analysis - Visual Clues
### Overview
The image presents a photograph of an accident scene on a freeway, accompanied by text boxes highlighting inferences based on visual clues. The scene depicts a large truck overturned on the side of the road, with emergency personnel present. The image is divided into a main photographic section and three text-bubble sections with associated cartoon faces and icons.
### Components/Axes
The image consists of:
* **Main Image:** A photograph of a freeway accident scene.
* **Text Bubble 1 (Top-Right):** Yellow background, associated with a cartoon face and a lightbulb icon.
* **Text Bubble 2 (Center-Right):** Light blue background, associated with a cartoon face and a snowflake icon.
* **Text Bubble 3 (Bottom-Right):** Dark blue background, associated with a cartoon face and a location pin icon.
* **Annotations:** Three colored lines (yellow, light blue, green) originating from the main image and pointing to the corresponding text bubbles.
* **Vehicle License Plate:** Visible on a police vehicle in the foreground.
### Detailed Analysis or Content Details
**Main Image Details:**
* A large semi-truck and trailer are overturned on the side of a freeway.
* Several emergency vehicles (police cars, ambulances) are present.
* Emergency personnel are visible inspecting the vehicles.
* Patches of snow are visible on the grass alongside the freeway.
* The freeway appears to be slightly elevated.
* Overhead freeway signs are visible.
**Text Bubble 1 (Yellow):**
* Text: "large semi truck and trailer on its side laying on a freeway"
* Text: "There was a major accident that occurred minutes ago"
* Text: "The people are inspecting damage to the vehicles in the accident"
**Text Bubble 2 (Light Blue):**
* Text: "patches of snow spread throughout grass on the side of freeway"
* Text: "Cold weather is causing hazardous conditions at this location"
* Text: "The roads are very icy"
**Text Bubble 3 (Dark Blue):**
* Text: "a white license plate with five red English style numbers displayed"
* Text: "This accident happened in an English speaking country"
* Text: "This is Ohio"
**Vehicle License Plate:**
* The license plate on the police vehicle reads "46 749".
### Key Observations
* The accident appears recent, given the presence of emergency personnel.
* Weather conditions (snow and ice) likely contributed to the accident.
* The accident occurred in Ohio, an English-speaking country.
* The license plate number provides a potential identifier for the police vehicle.
* The image is designed to encourage inference and observation skills.
### Interpretation
The image and accompanying text demonstrate a scenario where visual clues are used to infer information about an event. The combination of the photograph and the text bubbles guides the viewer to identify key details and draw conclusions about the accident. The annotations explicitly link specific visual elements to the inferred statements. The presence of snow and ice suggests that weather played a role in the accident, while the license plate and location information pinpoint the event to Ohio. The overall purpose of the image is likely educational, aimed at developing observational and analytical skills. The cartoon faces and icons add a playful element, making the learning process more engaging. The image is not presenting quantitative data, but rather qualitative observations and inferences.
</details>
## 1 Introduction
The process of making the most plausible inference in the face of incomplete information is called abductive reasoning, [47] personified by the iconic visual inferences of the fictional detective Sherlock Holmes. 5 Upon viewing a scene, humans can quickly synthesize cues to arrive at abductive hypotheses that go beyond the what's captured in the frame. Concrete cues are diverse: people take into account the emotion and mood of the agents, speculate about the rationale for the presence/absence of objects, and zero-in on small, contextual details; all the while accounting for prior experiences and (potential mis)conceptions. 6 Fig. 1 illustrates: snow may imply dangerous road conditions, an Ohio licence plate may suggest the location of the accident, and a blue sign may indicate this road is an interstate. Though not all details are equally important, certain salient details shape our abductive inferences about the scene as a whole [56]. This type of visual information is often left unstated.
We introduce Sherlock , a new dataset of 363K commonsense inferences grounded in 103K images. Sherlock makes explicit typically-unstated cognitive processes: each image is annotated with at least 3 inferences which pair depicted details (called clues) with commonsense conclusions that aim to go beyond what is literally pictured (called inferences). Sherlock is more diverse than many existing visual commonsense corpora like Visual Commonsense Reasoning [75]
5 While Holmes rarely makes mistakes, he frequently misidentifies his mostly abductive process of reasoning as 'deductive.' [39,8]
6 The correctness of abductive reasoning is certainly not guaranteed. Our goal is to study perception and reasoning without endorsing specific inferences (see § 3.1).
Table 1: Comparison between Sherlock and prior annotated corpora addressing visual abductive reasoning from static images. Sherlock showcases a unique data collection paradigm, leading to a rich variety of non-human centric (i.e., not solely grounded in human references) visual abductive inferences.
| Dataset | # Images | Format | bboxes? | free- viewing? | human- centric? |
|----------------------|------------|----------------|-----------|------------------|-------------------|
| VCR [75] | 110K | QA | ✓ | | ✓ |
| VisualCOMET [44] | 59K | If/Then KB | ✓ | | ✓ |
| Visual7W [79] | 47K | QA | ✓ | partial | |
| Visual Madlibs [72] | 11K | FiTB | ✓ | partial | ✓ |
| Abstract Scenes [65] | 4.3K | KB | | | |
| Why In Images [49] | 792 | KB | | | ✓ |
| BD2BB [48] | 3.2K | If/Then | | ✓ | ✓ |
| FVQA [66] | 2.2K | QA+KB | | | |
| OK-VQA [36] | 14K | QA | | ✓ | |
| KB-VQA [67] | 700 | QA | ✓ | | |
| Sherlock | 103K | clue/inference | ✓ | ✓ | |
and VisualCOMET [44], 7 due to its free-viewing data collection paradigm: we purposefully do not pre-specify the types of clues/inferences allowed, leaving it to humans to identify the most salient and informative elements and their implications. Other forms of free-viewing like image captions may not be enough: a typical caption for Fig. 1 may mention the accident and perhaps the snow, but smaller yet important details needed to comprehend the larger scene (like the blue freeway sign or the Ohio plates) may not be mentioned explicitly [5]. Dense captioning corpora [22] attempts to overcome this problem by highlighting all details, but it does so without accounting for which details are salient (and why).
Using our corpus, we propose three complementary tasks that evaluate different aspects of machine capacity for visual abductive reasoning:
1. Retrieval of Abductive Inferences: given an image+region, the algorithm scores a large set of candidate inferences and is rewarded for assigning a high score to the gold annotation.
2. Localization of Evidence: the algorithm selects a bounding box within the image that provides the best evidence for a given inference.
3. Comparison of Plausibility: the algorithm scores a small set of plausible inferences for a given image+region, and is rewarded for aligning its scores with human judgments over those sets.
In our setup, a single model undertakes all of these tasks: we ask algorithms to score the plausibility of an inference given an image and a bounding box contained within it. 8 We can directly compare models in their capacity to perform abductive reasoning, without relying on indirect generation evaluation metrics.
Model predicted inferences are given in Fig. 1. The model is a fine-tuned CLIP [51] augmented to allow bounding boxes as input, enabling users to specify particular regions for the model to make abductive inferences about. Our best model, a multitask version of CLIP RN50x64 , outperforms strong baselines like UNITER [9] and LXMERT [61] primarily because it pays specific attention to the
7 For instance, 94% of visual references in [75] are about depicted actors, and [44] even requires KB entries to explicitly regard people; see Fig. 2.
8 We reserve generative evaluations (e.g., BLEU/CIDEr) for future work: shortcuts (e.g., outputting the technically correct 'this is a photo' for all inputs) make generation evaluation difficult in the abductive setting (see § 6). Nonetheless, generative models can be evaluated in our setup; we experiment with one in § 5.1.
## 4 J. Hessel et al.
<details>
<summary>Image 2 Details</summary>
### Visual Description
\n
## Visual Reasoning & Event Decomposition: Scene Analysis
### Overview
The image presents a scene from a movie, likely a bar or pub setting, alongside associated reasoning and event decomposition information. The left side shows a still from the movie with bounding boxes identifying objects and people. The right side contains a question about the action of "Person1" and potential answers, as well as a breakdown of the event and related causal relationships using VisualCOMET.
### Components/Axes
The image is divided into two main sections:
* **Left Side (Sherlock):** Movie scene with bounding box annotations.
* **Right Side (Visual Commonsense Reasoning (VCR) & VisualCOMET):** Question, multiple-choice answers, event description, and causal relationships.
The left side has the following annotations:
* **Person1:** Bounding box around a man in a striped shirt.
* **Person5:** Bounding box around a person partially visible on the left.
* **Clue A:** Bounding box around a beer sign (Lite).
* **Clue B:** Bounding box around USD hanging on a pitcher.
The right side contains:
* **Question:** "What is Person1 doing?"
* **Answers:**
1. He is dancing.
2. He is giving a speech.
3. Person1 is getting his medicine.
4. He is ordering a drink from Person5.
* **Event:** "Person5 mans the register and takes order."
* **Before:** "Person5 needed to write down orders."
* **Because:** "Person5 wanted to have everyone pay for their orders."
### Detailed Analysis or Content Details
**Left Side Annotations:**
* **Clue A:** "a beer sign on the wall" - "this is the USA"
* **Clue B:** "USD hanging on a pitcher" - "alcohol is served here"
**Right Side Content:**
* The question asks about the action of "Person1".
* The provided answers are: dancing, giving a speech, getting medicine, and ordering a drink from "Person5".
* The event identified is "Person5 mans the register and takes order".
* The preceding condition is "Person5 needed to write down orders".
* The motivation is "Person5 wanted to have everyone pay for their orders".
### Key Observations
* The clues (Clue A and Clue B) suggest the scene is set in the United States and involves alcohol consumption.
* The event decomposition focuses on the actions of "Person5" as a bartender or server.
* The question about "Person1" is likely related to their interaction with "Person5" in the bar setting.
* The answers provided suggest a range of possible actions, but "ordering a drink from Person5" seems most plausible given the context.
### Interpretation
The image demonstrates a visual reasoning task where the goal is to understand the actions and relationships between people in a scene. The VisualCOMET component breaks down the event into its constituent parts – the event itself, the preceding condition, and the underlying motivation. This approach allows for a more nuanced understanding of the scene beyond simply identifying objects and people. The clues provided (beer sign, USD) help to establish the context and narrow down the possible interpretations. The question and answers format tests the ability to infer the actions of individuals based on the visual information and common sense knowledge. The overall setup suggests a system designed to mimic human-level visual reasoning and understanding of everyday events. The image is not presenting numerical data or trends, but rather a qualitative analysis of a visual scene.
</details>
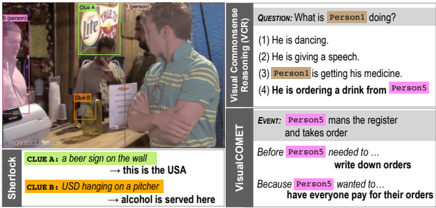
Fig. 2: Side-by-side comparison of VCR [75], VisualCOMET [44], and Sherlock on a representative instance. Sherlock showcases a wider range of (non-human centric) situational contexts.
correct input bounding box. We additionally show that 1) for all tasks, reasoning about the full context of the image (rather than just the region corresponding to the clue) results in the best performance; 2) a text-only model cannot solve the comparison task even when given oracle region descriptions; and 3) a multi-task model fit on both clues/inferences at training time performs best even when only inferences are available at test time.
We foresee Sherlock as a difficult diagnostic benchmark for vision-andlanguage models. On our comparison task, in terms of pairwise accuracy, our best model lags significantly below human agreement (headroom also exists for retrieval and localization). We release code, data, and models at http: //visualabduction.com/ .
## 2 Related Work
Abductive reasoning. Abduction, a form of everyday reasoning first framed byPeirce, [46,47]; involves the creating of explanatory hypothesesbased on limited evidence. Humans use abduction to reconcile seemingly disconnected observations to arrive at meaningful conclusions [56] but readily retract in presence of new evidence [1]. In linguistics, abduction for communicated meaning (in an impoverished conversational context) is systematized through conversational maxims [15]. In images, [5] show that different object types have different likelihoods of being mentioned in image captions (e.g., 'fireworks' is always mentioned if depicted, but 'fabric' is not), but that object type alone does not dictate salience for abductive inferences, e.g., a TV in a living room may not be as conceptually salient as a TV in a bar, which may signal a particular type of bar. Abductive reasoning has recently received attention in language processing tasks [6,50,11,45], proof writing [60], and discourse processing [17,42], etc.
Beyond visual recognition. Several tasks that go beyond image description/recognition have been proposed, including visual and analogical reasoning [43,77,21,3], scene semantics [23], commonsense interactions [65,49], temporal/causal reasoning [26,71], and perceived importance [5]. Others have explored commonsense reasoning tasks posed over videos, which usually have more input available than a single frame [63,20,31,74,13,32,78,12,34,19] (inter alia).
Visual abductive reasoning. Sherlock builds upon prior grounded visual abductive reasoning efforts (Table 1). Corpora like Visual Commonsense Reasoning (VCR) [75], VisualCOMET [44], and Visual7W [79] are most similar to Sherlock in providing benchmarks for rationale-based inferences (i.e., the why and how). But, Sherlock differs in format and content (Fig. 2). Instead of annotated QA pairs like in [79,75] where one option is definitively correct, free-text clue/inference pairs allow for broader types of image descriptions, lending itself to softer and richer notions of reasoning (see § 4)-inferences are not definitively correct vs. incorrect, rather, they span a range of plausibility. Deviating from the constrained, human-centric annotation of [44], Sherlock clue/inference pairs support a broader range of topics via our open-ended annotation paradigm (see § 3). Sherlock 's inferences can be grounded on any number of visual objects in an image, from figures central to the image (e.g., persons, animals, objects) to background cues (e.g., time, location, circumstances).
## 3 Sherlock Corpus
The Sherlock corpus contains a total of 363K abductive commonsense inferences grounded in 81K Visual Genome [29] images (photographs from Flickr) and 22K Visual Commonsense Reasoning (VCR) [75] images (still-frames from movies). Images have an average of 3.5 observation pairs , each consisting of: : an observable entity or object in the image, along with bounding box(es)
- clue specifying it (e.g., 'people wearing nametags').
- inference : an abductive inference associated with the clue; not immediately obvious from the image content (e.g., 'the people don't know each other').
Both clues and inferences are represented via free text in English; both have an average length of seven tokens; per clue, there are a mean/median of 1.17/1.0 bounding boxes per clue. We divide the 103K annotated images into a training/validation/test set of 90K/6.6K/6.6K. Further details are available in § A.
Annotation process. We crowdsource our dataset via Amazon Mechanical Turk (MTurk). For each data collection HIT, a manually qualified worker is given an image and prompted for 3 to 5 observation pairs . For each observation pair , the worker is asked to write a clue, highlight the regions in the image corresponding to the clue, and write an inference triggered by the clue. To discourage purely deductive reasoning, the workers are actively encouraged to think beyond the literally depicted scene, while working within real-world expectations. Crowdworkers also self-report Likert ratings of confidence in the correctness of their abductive inferences along a scale of 'definitely' = 3/3, 'likely' = 2/3, and 'possibly' = 1/3. The resulting inferences span this range (31%, 51%, 18%, respectively). To validate corpus quality, we run a validation round for 17K observation pairs in which crowdworkers provide ratings for acceptability (is the annotation reasonable?), bboxes (are the boxes reasonably placed for the clue?), and interestingness (how interesting is the annotation?). We find that 97.5% of the observation pairs are acceptable with 98.3% accurate box placement; and 71.9% of inferences are found to be interesting.
<details>
<summary>Image 3 Details</summary>
### Visual Description
## Chord Diagram: Clue Topics vs. Inference Topics
### Overview
The image is a chord diagram visualizing the relationships between "Clue Topics" and "Inference Topics". The thickness of the chords represents the strength of the association between the two topics. The diagram displays the distribution of connections from each clue topic to various inference topics. Percentages are associated with each topic, indicating their prevalence.
### Components/Axes
* **Left Axis (Clue Topics):** Lists the following categories with associated percentages:
* Eating & Dining (11%)
* Nature Scenes (7%)
* Everyday Outdoor Scenes (10%)
* Environment & Landscape (6%)
* Gatherings (8%)
* Signs & Writings (7%)
* Everyday Objects (16%)
* Attire (11%)
* Actions & Activities (10%)
* Vehicles & Traffic (9%)
* **Right Axis (Inference Topics):** Lists the following categories with associated percentages:
* Eating & Dining (11%)
* Time and Weather (12%)
* Nature & Animals (14%)
* Everyday Scenes (15%)
* Object & Categorization (17%)
* Occasions & Events (11%)
* Persons & Characterization (15%)
* Vehicles & Travel (15%)
### Detailed Analysis
The diagram consists of curved lines (chords) connecting each Clue Topic on the left to one or more Inference Topics on the right. The thickness of each chord indicates the strength of the relationship.
* **Eating & Dining (11%):** Shows strong connections to itself (Eating & Dining - 11%), and moderate connections to Occasions & Events (approximately 6%), and Time and Weather (approximately 3%).
* **Nature Scenes (7%):** Primarily connects to Nature & Animals (approximately 6%), and a weaker connection to Time and Weather (approximately 1%).
* **Everyday Outdoor Scenes (10%):** Connects strongly to Everyday Scenes (approximately 8%), and moderately to Nature & Animals (approximately 2%).
* **Environment & Landscape (6%):** Shows a moderate connection to Nature & Animals (approximately 4%) and a weaker connection to Everyday Scenes (approximately 1%).
* **Gatherings (8%):** Connects to Occasions & Events (approximately 6%) and Persons & Characterization (approximately 2%).
* **Signs & Writings (7%):** Primarily connects to Object & Categorization (approximately 5%) and Everyday Scenes (approximately 2%).
* **Everyday Objects (16%):** Shows the strongest connection to Object & Categorization (approximately 12%), and moderate connections to Everyday Scenes (approximately 3%) and Persons & Characterization (approximately 1%).
* **Attire (11%):** Connects to Persons & Characterization (approximately 8%) and Occasions & Events (approximately 3%).
* **Actions & Activities (10%):** Connects to Persons & Characterization (approximately 7%) and Everyday Scenes (approximately 3%).
* **Vehicles & Traffic (9%):** Connects to Vehicles & Travel (approximately 7%) and Everyday Scenes (approximately 2%).
### Key Observations
* **Self-Loops:** Several Clue Topics have strong connections to themselves (e.g., Eating & Dining to Eating & Dining).
* **Object & Categorization:** Everyday Objects has the strongest overall connection to Object & Categorization.
* **Persons & Characterization:** Attire, Actions & Activities, and Gatherings all show significant connections to Persons & Characterization.
* **Everyday Scenes:** Several Clue Topics (Everyday Outdoor Scenes, Environment & Landscape, Signs & Writings, Everyday Objects, Actions & Activities, Vehicles & Traffic) connect to Everyday Scenes.
* **Uneven Distribution:** The Clue Topics are not evenly distributed in terms of their connections. Everyday Objects has the most connections, while Nature Scenes has the fewest.
### Interpretation
This chord diagram illustrates how different "Clue Topics" are interpreted or lead to different "Inference Topics". The diagram suggests that certain clues are more directly related to specific inferences. For example, observing "Eating & Dining" strongly suggests an inference related to "Eating & Dining" itself, indicating a direct and obvious connection. The strong link between "Everyday Objects" and "Object & Categorization" suggests that identifying everyday objects often leads to categorization tasks.
The connections to "Persons & Characterization" from clues like "Attire" and "Actions & Activities" highlight the role of these clues in inferring information about people. The prevalence of connections to "Everyday Scenes" suggests that many clues contribute to understanding general everyday situations.
The varying thickness of the chords indicates the strength of these associations. Thicker chords represent more frequent or reliable inferences based on the given clues. The diagram provides a visual representation of the relationships between observed clues and the inferences that can be drawn from them, potentially useful in fields like image understanding, scene interpretation, or cognitive modeling.
</details>
## 3.1 Dataset Exploration
Sherlock 's abductive inferences cover a wide variety of real world experiences from observations about unseen yet probable details of the image (e.g., 'smoke at an outdoor gathering' → 'something is being grilled') to elaborations on the expected social context (e.g., 'people wearing nametags' → '[they] don't know each other'). Some inferences are highly likely to be true (e.g., 'wet pavement' → 'it has rained recently'); others are less definitively verifiable, but nonetheless plausible (e.g., 'large trash containers' → 'there is a business nearby'). Even the inferences crowdworkers specify as 3/3 confident are almost always abductive, e.g., wet pavement strongly but not always indicate rain. Through a rich array of natural observations, Sherlock provides a tangible view into the abductive inferences people use on an everyday basis (more examples in Fig. 14).
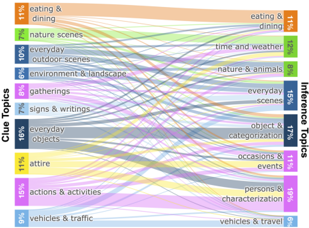
Assessing topic diversity. To gauge the diversity of objects and situations represented in Sherlock , we run an LDA topic model [7] over the observation pairs . The topics span a range of common everyday objects, entities, and situations (Fig. 3). Inference topics associated with the clues include withincategory associations (e.g., 'baked potatoes on a ceramic plate' → 'this [is] a side dish') and cross-category associations (e.g., 'a nametag' (attire) → 'she works here' (characterization)). Many topics are not human centric; compared to VCR/VisualCOMET in which 94%/100% of grounded references are to people. A manual analysis of 150 clues reveals that only 36% of Sherlock observation pairs are grounded on people.
Intended use cases. We manually examine of 250 randomly sampled observation pairs to better understand how annotators referenced protected characteristics (e.g., gender, color, nationality). A majority of inferences (243/250) are not directly about protected characteristics, though, a perceived gender is often made explicit via pronoun usage, e.g., 'she is running.' As an additional check, we pass 30K samples of our corpus through the Perspective API. 9 A manual examination of 150 cases marked as 'most toxic' reveals mostly false positives (89%), though 11% of this sample do contain lewd content (mostly prompted by
9 https://www.perspectiveapi.com/ ; November 2021 version. The API (which itself is imperfect and has biases [18,38,55]) assigns toxicity value 0-1 for a given input text. Toxicity is defined as 'a rude, disrespectful, or unreasonable comment that is likely to make one leave a discussion.'
Fig. 3: Overview of the topics represented in the clues and inferences in Sherlock . This analysis shows that Sherlock covers a variety of topics commonly accessible in the natural world. Color of the connections reflect the clue topic.
<details>
<summary>Image 4 Details</summary>

### Visual Description
Icon/Small Image (24x26)
</details>
<details>
<summary>Image 5 Details</summary>
### Visual Description
\n
## Screenshot: Scene Description and Textual Information
### Overview
The image presents a screenshot containing a photograph of a street scene alongside a block of descriptive text and a question mark with an arrow pointing to it. The text appears to be a series of observations about the scene depicted in the photograph.
### Components/Axes
The screenshot is divided into three main areas:
1. **Photograph:** Occupies the left side of the image, showing a street with people and vehicles.
2. **Text Block:** Located to the right of the photograph, containing multiple sentences describing the scene.
3. **Question/Assertion Area:** At the bottom, featuring a small icon and a question mark with an arrow pointing to the right, followed by the text "It is not during rush hour".
### Detailed Analysis or Content Details
**Photograph:** The photograph shows a street scene with trees lining the sides. There are people walking and vehicles present. The image has a pinkish hue.
**Text Block:** The following text is present:
"The traffic is bad in this area
this man needs glasses to see
Pots, pans, and food are stored here.
it has many items the person likes to eat.
the person is on the go
he is baking cookies for a party he is
attending tomorrow
this is the person drinking the tea.
there's no one inside the building"
**Question/Assertion Area:** The text "It is not during rush hour" is displayed in bold, larger font.
### Key Observations
The text block provides a narrative description of the scene in the photograph, making observations about people, objects, and activities. The final statement, "It is not during rush hour," seems to be a conclusion or assertion about the scene, potentially answering the question implied by the question mark.
### Interpretation
The image appears to be part of a visual reasoning or scene understanding task. The text block provides clues about the scene, and the question/assertion area suggests a task of inferring information from the image and text. The statement "It is not during rush hour" implies that the traffic, while "bad," is not at its peak, or that other visual cues suggest a non-rush hour time. The pinkish hue of the image may be a stylistic choice or a result of image processing. The overall purpose seems to be to test the ability to integrate visual and textual information to draw conclusions about a scene. The text is descriptive and observational, rather than providing concrete data. It is a qualitative description of a scene.
</details>
- (a) Retrieval of abductive inferences
<details>
<summary>Image 6 Details</summary>
### Visual Description
\n
## Diagram: Scene Understanding with Robot
### Overview
The image depicts a scene understanding diagram. A photograph of a store interior with people is shown below a series of text boxes connected to the image via lines. A robot icon with a question mark is positioned centrally between the text boxes and the image, suggesting it is attempting to interpret the scene. The diagram illustrates how a robot might associate textual descriptions with visual elements in an image.
### Components/Axes
The diagram consists of the following components:
* **Image:** A photograph of a store interior with multiple people.
* **Text Boxes (Top):** Three light blue rectangular boxes containing text.
* **Connecting Lines:** White lines with arrowheads connecting the text boxes to specific areas within the image.
* **Robot Icon:** A red robot icon with a question mark on its screen, positioned centrally.
* **Dashed Rectangle:** A dashed white rectangle encompassing the image and the connecting lines.
### Detailed Analysis or Content Details
The text boxes contain the following information:
1. "People can purchase them" - This line points to a group of people in the image, likely customers.
2. "She is there for shopping" - This line points to a woman in the image, presumably a shopper.
3. "The price for the towels" - This line points to a display of towels in the image.
The image shows a store interior with several people browsing. The focus appears to be on a display of towels. The people are of varying ages and genders. The lighting is bright.
### Key Observations
The diagram highlights the robot's attempt to understand the scene by associating textual descriptions with visual elements. The question mark on the robot's screen suggests uncertainty or a need for further information. The lines indicate the robot's focus on specific objects or actions within the image.
### Interpretation
This diagram demonstrates a basic concept in computer vision and artificial intelligence: scene understanding. The robot is attempting to interpret the visual information in the image and relate it to human-understandable concepts (purchasing, shopping, price). The diagram suggests that the robot is using contextual clues to make these associations. The question mark implies that the robot may not be entirely confident in its interpretations and may require additional data or processing to achieve a more accurate understanding of the scene. The diagram is a simplified representation of a complex process, but it effectively illustrates the challenges and potential of AI in understanding the world around us. The diagram does not provide any numerical data or quantifiable measurements. It is a conceptual illustration of a process.
</details>
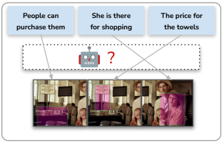
(b) Localization of evidence
<details>
<summary>Image 7 Details</summary>
### Visual Description
\n
## Screenshot: Image Recognition Interface
### Overview
The image depicts a user interface for an image recognition or labeling task. It shows a grayscale historical photograph with a pink bounding box highlighting a group of people, along with associated text descriptions and a comparison interface with a robot icon. The interface appears to be designed to assess the accuracy of image recognition or to gather human feedback on image labels.
### Components/Axes
The interface is divided into three main sections:
1. **Image Area (Top):** Displays the grayscale photograph with a pink bounding box around a group of people.
2. **Human Labels (Bottom-Left):** Contains a list of text descriptions associated with the image.
3. **Robot Labels (Bottom-Right):** Displays a question mark and a robot icon, presumably representing the machine's interpretation of the image.
### Content Details
The text descriptions in the bottom-left section are as follows:
* “they are part of an organization”
* “they are porters”
* “this is during WWII”
* “they are saying goodbye”
The image itself shows a large group of people, likely soldiers, standing in formation. A single individual is walking in front of the group. The background appears to be buildings and a street. The pink bounding box encompasses the majority of the group of people.
### Key Observations
The interface presents a comparison between human-provided labels and a machine's interpretation (represented by the robot icon). The question mark suggests that the machine's label is either unknown or needs verification. The labels provided by humans are descriptive and contextual, indicating a historical event (WWII) and the roles of the people involved (porters).
### Interpretation
This interface is likely part of a system designed to train or evaluate image recognition models. The human-provided labels serve as ground truth, while the robot icon represents the model's prediction. The comparison allows for assessing the model's accuracy and identifying areas for improvement. The image itself depicts a poignant scene from WWII, potentially involving soldiers departing or returning from service. The labels suggest the image captures a moment of farewell and highlights the role of porters in supporting military operations. The interface is designed to gather human feedback to improve the accuracy of image recognition systems in understanding historical contexts and identifying specific roles within those events. The use of a robot icon and question mark suggests a focus on machine learning and the challenges of automated image understanding.
</details>
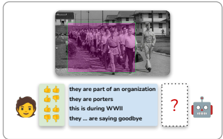
- (c) Comparison of plausibility
Fig. 4: We pose three tasks over Sherlock : In retrieval , models are tasked with finding the ground-truth inference across a wide range of inferences, some much more plausible/relevant than others. In localization , models must align regions within the same image to several inferences written about that image. For comparison , we collect 19K Likert ratings from human raters across plausible candidates, and models are evaluated in their capacity to reconstruct human judgments across the candidates. Despite intrinsic subjectivity, headroom exists between human agreement and model performance, e.g., on the comparison task.
visual content in the R-rated VCR movies) or stigmas related to, e.g., gender and weight. See § A.4 for a more complete discussion.
While our analysis suggests that the relative magnitude of potentially offensive content is low in Sherlock , we still advocate against deployed use-cases that run the risk of perpetuating potential biases: our aim is to study abductive reasoning without endorsing the correctness or appropriateness of particular inferences. We foresee Sherlock as 1) a diagnostic corpus for measuring machine capacity for visual abductive reasoning; 2) a large-scale resource to study the types of inferences people may make about images; and 3) a potentially helpful resource for building tools that require understanding abductions specifically, e.g., for detecting purposefully manipulative content posted online, it could be useful to specifically study what people might assume about an image (rather than what is objectively correct; more details in Datasheet ( § F) [14]).
## 4 From Images to Abductive Inferences
We operationalize our corpus with three tasks, which we call retrieval, localization, and comparison. Notationally, we say that an instance within the Sherlock corpus consists of an image i , a region specified by N bounding boxes r = {⟨ x 1 i , x 2 i , y 1 i , y 2 i ⟩} N i =1 , 10 a clue c corresponding to a literal description of r 's contents, and an in F erence f that an annotator associated with i , r , and c . We consider:
10 As discussed in § 3, N has a mean/median of 1.17/1.0 across the corpus.
1. Retrieval of Abductive Inferences: For a given image/region pair ( i , r ), how well can models select the ground-truth inference f from a large set of candidates ( ∼ 1K) covering a broad swath of the corpus?
2. Localization of Evidence: Given an image i and an inference f written about an (unknown) region within the image, how well can models locate the proper region?
3. Comparison of Plausibility: Given an image/region pair ( i , r ) and a small set ( ∼ 10) of relevant inferences, can models predict how humans will rank their plausibility?
Each task tests a complementary aspect of visual abductive reasoning (Fig. 4): retrieval tests across a broad range of inferences, localization tests within-images, and comparison tests for correlation with human judgement. Nonetheless, the same model can undertake all three tasks if it implements the following interface:
## Sherlock Abductive Visual Reasoning Interface
- Input: An image i , a region r within i , and a candidate inference f .
- Target: A score s , where s is proportional to the plausibility that f could be inferred from ( i , r ).
That is, we assume a model m : ( i , r , f ) → R that scores inference f 's plausibility for ( i , r ). Notably, the interface takes as input inferences, but not clues: our intent is to focus evaluation on abductive reasoning, rather than the distinct setting of literal referring expressions. 11 Clues can be used for training m ; as we will see in § 5 our best performing model, in fact, does use clues at training time.
## 4.1 Retrieval of Abductive Inferences
For retrieval evaluation, at test time, we are given an ( i , r ) pair, and a large ( ∼ 1K) 12 set of candidate inferences f ∈ F , only one of which was written by an annotator for ( i , r ); the others are randomly sampled from the corpus. In the im → txt direction, we compute the mean rank of the true item (lower=better) and P @1 (higher=better); in the txt → im direction, we report mean rank (lower=better).
## 4.2 Localization of Evidence
Localization assesses a model's capacity select a regions within an image that most directly supports a given inference. Following prior work on literal referring expression localization [28,25,73] (inter alia), we experiment in two settings: 1) we are given all the ground-truth bounding boxes for an image, and 2) we are given only automatic bounding box proposals from an object detection model.
11 In § B.1, for completeness, we give results on the retrieval and localization setups, but testing on clues instead.
12 Our validation/test sets contain about 23K inferences. For efficiency we randomly split into 23 equal sized chunks of about 1K inferences, and report retrieval averaged over the resulting splits.
Table 2: Test results for all models across all three tasks. CLIP RN50x64 outperforms all models in all setups, but significant headroom exists, e.g., on Comparison between the model and human agreement.
| | Retrieval | Retrieval | Retrieval | Localization | Comparison |
|-----------------------------|--------------------|-------------|---------------|-----------------------|--------------------------|
| | im → txt ( ↓ ) txt | → im ( ↓ | @1 im → txt ( | GT-Box/Auto-Box ( ↑ ) | Val/Test Human Acc ( ↑ ) |
| Random | 495.4 | 495.4 | 0.1 | 30.0/7.9 | 1.1/-0.6 |
| Bbox Position/Size | 257.5 | 262.7 | 1.3 | 57.3/18.8 | 5.5/1.4 |
| LXMERT | 51.1 | 48.8 | 14.9 | 69.5/30.3 | 18.6/21.1 |
| UNITER Base | 40.4 | 40.0 | 19.8 | 73.0/33.3 | 20.0/22.9 |
| CLIP ViT-B/16 | 19.9 | 21.6 | 30.6 | 85.3/38.6 | 20.1/21.3 |
| CLIP RN50x16 | 19.3 | 20.8 | 31.0 | 85.7/38.7 | 21.6/23.7 |
| CLIP RN50x64 | 19.3 | 19.7 | 31.8 | 86.6/39.5 | 25.1/26.0 |
| ↰ + multitask clue learning | 16.4 | 17.7 | 33.4 | 87.2 / 40.6 | 26.6 / 27.1 |
| Human + (Upper Bound) | - | - | - | 92.3/(96.2) | 42.3/42.3 |
GTbounding boxes. We assume an image i , the set of 3+ inferences F written for that image, and the (unaligned) set of regions R corresponding to F . The model must produce a one-to-one assignment of F to R in the context of i . In practice, we score all possible F × R pairs via the abductive visual reasoning interface, and then compute the maximum linear assignment [30] using lapjv's implementation of [24]. The evaluation metric is the accuracy of this assignment, averaged over all images. To quantify an upper bound, a human rater performed the assignment for 101 images, achieving an average accuracy of 92.3%.
Auto bounding boxes. We compute 100 bounding box proposals per image by applying Faster-RCNN [54] with a ResNeXt101 [69] backbone trained on Visual Genome to all the images in our corpus. Given an image i and an inference f that was written about the image, we score all 100 bounding box proposals independently and take the highest scoring one as the prediction. We count a prediction as correct if it has IoU > 0 . 5 with a true bounding box that corresponds to that inference, 13 and incorrect otherwise. 14
## 4.3 Comparison of Plausibility
We assess model capacity to make fine-grained assessments given a set of plausible inferences. For example, in Fig. 4c (depicting a group of men marching and carrying bags), human raters are likely to say that they are military men and that the photo was taken during WWII, and unlikely to see them as porters despite them carrying bags. Our evaluation assumes that a performant model's predictions should correlate with the (average) relative judgments made by humans, and we seek to construct a corpus that supports evaluation of such reasoning.
13 Since the annotators were able to specify multiple bounding boxes per observation pair , we count a match to any of the labeled bounding boxes.
14 A small number of images do not have a ResNeXt bounding box with IoU > 0 . 5 with any ground truth bounding box: in § 5.1, we show that most instances (96.2%) are solvable with this setup.
Constructing sets of plausible inferences. We use a performant model checkpoint fine-tuned for the Sherlock tasks 15 to compute the similarity score between all ( i , r , f ) triples in the validation/test sets. Next, we perform several filtering steps: 1) we only consider pairs where the negative inference received a higher score than the ground-truth according to the model; 2) we perform soft text deduplication to downsample inferences that are semantically similar; and 3) we perform hard text deduplication, only allowing inferences to appear verbatim 3x times. Then, through an iterative process, we uniquely sample a diverse set of 10 inferences per ( i , r ) that meet these filtering criteria. This results in a set of 10 plausible inference candidates for each of 485/472 validation/test images. More details are in § E. In a retrieval sense, these plausible inferences can be viewed as 'hard negatives:' i.e., none are the gold annotated inference, but a strong model nonetheless rates them as plausible.
Human rating of plausible inferences. Using MTurk, we collect two annotations of each candidate inference on a three-point Likert scale ranging from 1 (bad: 'irrelevant'/'verifiably incorrect') to 3 (good: 'statement is probably true; the highlighted region supports it.'). We collect 19K annotations in total (see § E for full details). Because abductive reasoning involves subjectivity and uncertainty, we expect some amount of intrinsic disagreement between raters. 16 We measure model correlation with human judgments on this set via pairwise accuracy. For each image, for all pairs of candidates that are rated differently on the Likert scale, the model gets an accuracy point if it orders them consistently with the human rater's ordering. Ties are broken randomly but consistently across all models. For readability, we subtract the accuracy of a random model (50%) and multiply by two to form the final accuracy metric.
## 5 Methods and Experiments
Training objective. To support the interface described in § 4, we train models m : ( i , r , f ) → R that score inference f 's plausibility for ( i , r ). We experiment with several different V+L backbones as detailed below; for each, we train by optimizing model parameters to score truly corresponding ( i , r , f ) triples more highly than negatively sampled ( i , r , f fake ) triples.
LXMERT [61] is a vision+language transformer [64] model pre-trained on Visual Genome [29] and MSCOCO [33]. The model is composed of three transformer encoders [64]: an object-relationship encoder (which takes in ROI features+locations with a max of 36, following [2]), a language encoder that processes word tokens, and a cross modality encoder. To provide region information r , we calculate the ROI feature of r and always place it in the first object token to the visual encoder (this is a common practice for, e.g., the VCR dataset [75]).
15 Specifically, a CLIP RN50x16 checkpoint that achieves strong validation retrieval performance (comparable to the checkpoint of the reported test results in § 5.1); model details in § 5.
16 In § 5.1, we show that models achieve significantly less correlation compared to human agreement.
We follow [9] to train the model in 'image-text retrieval' mode by maximizing the margin m = . 2 between the cosine similarity scores of positive triple ( i , r , f ) and two negative triples ( i , r , f fake ) and ( i fake , r fake , f ) through triplet loss.
UNITER [9] consists of a single, unified transformer that takes in image and text embeddings. We experiment with the Base version pre-trained on MSCOCO [33], Visual Genome [29], Conceptual Captions [57], and SBU Captions [41]. We apply the same strategy of region-of-reference-first passing and train with the same triplet loss following [9].
CLIP. We finetune the ViT-B/16 , RN50x16 , and RN50x50 versions of CLIP [51]. Text is represented via a 12-layer text transformer. For ViT-B/16 , images are represented by a 12-layer vision transformer [10], whereas for RN50x16 / RN50x64 , images are represented by EfficientNet-scaled ResNet50 [16,62].
We modify CLIP to incorporate the bounding box as input. Inspired by a similar process from [76,70], to pass a region to CLIP, we simply draw a bounding box on an image in pixel space-we use a green-bordered / opaque purple box as depicted in Fig. 5b (early experiments proved this more effective than modifying CLIP's architecture). To enable CLIP to process the widescreen images of VCR, we apply it twice to the input using overlapping square regions, i.e., graphically, like this: [ 1 [ 2 ] 1 ] 2 , and average the resulting embeddings. We finetune using InfoNCE [59,40]. We sample a batch of truly corresponding ( i , r , f ) triples, render the regions r in their corresponding images, and then construct all possible negative ( i , r , f fake ) triples in the batch by aligning each inference to each ( i , r ). We use the biggest minibatch size possible using 8 GPUs with 48GB of memory each: 64, 200, and 512 for RN50x64 , RN50x16 , and ViT-B/16 , respectively.
Multitask learning. All models thus far only utilize inferences at training time. We experiment with a multitask learning setup using CLIP that additionally trains with clues. In addition to training using our abductive reasoning objective, i.e., InfoNCE on inferences, we mix in an additional referring expression objective, i.e., InfoNCE on clues. Evaluation remains the same: at test time, we do not assume access to clues. At training time, for each observation, half the time we sample an inference (to form ( i , r , f ), and half the time we sample a clue (to form ( i , r , c )). The clue/inference mixed batch of examples is then handed to CLIP, and a gradient update is made with InfoNCE as usual. To enable to model to differentiate between clues/inferences, we prefix the texts with clue: / inference: , respectively.
Baselines. In addition to a random baseline, we consider a content-free version of our CLIP ViT-B/16 model that is given only the position/size of each bounding box. In place of the image, we pass a mean pixel value across the entire image and draw the bounding box on the image using an opaque pink box (see § 5.2).
## 5.1 Results
Table 2 contains results for all the tasks: In all cases, our CLIP-based models perform best, with RN50x64 outperforming its smaller counterparts. Incorporating the multitask objective pushes performance further. While CLIP performs the
| | P @1 ( ↑ ) | Val/Test Human ( ↑ ) |
|------------------------------|--------------|------------------------|
| CLIP ViT-B/16 | 30.5 | 20.1/21.2 |
| ↰ Position only | 1.3 | 5.5/1.4 |
| ↰ No Region | 18.1 | 16.8/19.0 |
| input ↰ No Context | 24.8 | 18.1/17.8 |
| ↰ Only context | 18.9 | 17.4/16.3 |
| ↰ Trained w/ only Clues | 23 | 16.2/19.7 |
| ↰ Crop no Widescreen | 27.8 | 23.1/21.8 |
| model ↰ Resize no Widescreen | 27.7 | 19.4/20.6 |
| ↰ Zero shot w/ prompt | 12 | 10.0/9.5 |
(a)
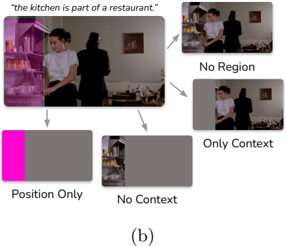
Fig. 5: We perform ablations by varying the input data, top (a), and the modeling components, bottom (a). Figure (b) depicts our image input ablations, which are conducted by drawing in pixel-space directly, following [76]. Having no context may make it difficult to situate the scene more broadly; here: neatly stacked cups could be in a bar, a hotel, a store, etc. Access only the context of the dining room is also insufficient. For modeling, bottom (a), cropping/resizing decreases performance on retrieval ( P @1), but not comparison (Val/Test Human).
<details>
<summary>Image 8 Details</summary>
### Visual Description
\n
## Diagram: Visual Representation of Contextual Understanding
### Overview
The image presents a diagram illustrating different approaches to visual understanding, specifically focusing on how a system might interpret an image based on position, context, or a combination of both. The central image depicts two people in what appears to be a kitchen or restaurant setting. This image is then processed in three different ways, resulting in three modified images and one textual statement.
### Components/Axes
The diagram consists of:
* **Original Image:** A color photograph of two people in a kitchen/restaurant.
* **Textual Statement:** “the kitchen is part of a restaurant.” located at the top-left.
* **Processed Images:** Four smaller images derived from the original, each representing a different processing method.
* "No Region" - The original image.
* "Only Context" - The original image.
* "Position Only" - The left portion of the image is colored bright pink, the rest is gray.
* "No Context" - The image is entirely gray.
* **Label (b):** Located at the bottom-center, indicating this is part of a larger figure.
### Detailed Analysis or Content Details
The diagram demonstrates how different aspects of an image contribute to understanding.
* **Original Image:** Shows two people, one standing near a cabinet filled with items, and another standing further back. The environment suggests a kitchen or restaurant.
* **Textual Statement:** Provides a semantic relationship between "kitchen" and "restaurant."
* **"No Region"**: This image is identical to the original, implying that no specific region of the image was isolated for analysis.
* **"Only Context"**: This image is also identical to the original, suggesting that only contextual information was used.
* **"Position Only"**: This image highlights the left portion of the original image in bright pink, while the rest is grayed out. This indicates that only the positional information of the left side of the image was considered.
* **"No Context"**: This image is entirely gray, indicating that no contextual information was used.
### Key Observations
The diagram highlights the importance of both positional and contextual information in visual understanding. The "Position Only" image demonstrates that focusing solely on position can isolate specific elements, while the "No Context" image shows that removing context can render the image uninterpretable. The "No Region" and "Only Context" images suggest that using the entire image and its inherent context can provide a complete understanding.
### Interpretation
This diagram likely illustrates a concept in computer vision or artificial intelligence, specifically related to scene understanding and object recognition. It demonstrates how a system might process an image by focusing on different aspects: the position of objects, the context of the scene, or a combination of both. The textual statement provides a semantic understanding that complements the visual information. The diagram suggests that a robust understanding of an image requires integrating both positional and contextual information. The different processing methods (Position Only, No Context) represent simplified approaches that may be useful in specific scenarios but are insufficient for complete scene understanding. The diagram is a visual aid for explaining the complexities of visual perception and the challenges of building intelligent systems that can "see" and understand the world like humans do.
</details>
best, UNITER is more competitive on comparison and less competitive on retrieval and localization. We speculate this has to do with the nature of each task: retrieval requires models to reason about many incorrect examples, whereas, the inferences in the comparison task are usually relevant to the objects in the scene. In § C, we provide ablations that demonstrate CLIP models outperform UNITER even when trained with a smaller batch size. Compared to human agreement on comparison, our best model only gets 65% of the way there (27% vs. 42 %).
## 5.2 Ablations
We perform data and model ablations on CLIP ViT-B/16 . Results are in Fig. 5. Input ablations. Each part of our visual input is important. Aside from the position only model, the biggest drop-off in performance results from not passing the region as input to CLIP, e.g., P @1 for im → txt retrieval nearly halves, dropping from 31 to 18, suggesting that CLIP relies on the local region information to reason about the image. Removing the region's content ('Only Context') unsurprisingly hurts performance, but so does removing the surrounding context ('No Context'). That is, the model performs the best when it can reason about the clue and its full visual context jointly. On the text side, we trained a model with only clues; retrieval and comparison performance both drop, which suggests that clues and inferences carry different information (additional results in § B.1). Model ablations. Weconsidered two alternate image processing configurations. Instead of doing two CLIP passes per image to facilitate widescreen processing ( § 5), we consider (i) center cropping and (ii) pad-and-resizing. Both take less computation, but provide less information to the model. Cropping removes the
<details>
<summary>Image 9 Details</summary>

### Visual Description
Icon/Small Image (23x26)
</details>
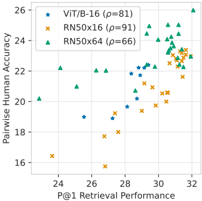
Fig. 6: Validation retrieval perf. ( P @1) vs. comparison acc. for CLIP checkpoints.
<details>
<summary>Image 10 Details</summary>
### Visual Description
\n
## Scatter Plot: Performance Comparison of Vision Transformer and ResNet Models
### Overview
This image presents a scatter plot comparing the performance of three different models – VIT/B-16, RN50x16, and RN50x64 – based on two metrics: P@1 Retrieval Performance and Pairwise Human Accuracy. Each point on the plot represents a data instance, and the color of the point indicates the model used. A legend in the top-left corner identifies each model and its associated correlation coefficient (ρ).
### Components/Axes
* **X-axis:** P@1 Retrieval Performance (ranging approximately from 23.5 to 32.5)
* **Y-axis:** Pairwise Human Accuracy (ranging approximately from 16 to 26)
* **Legend:** Located in the top-left corner, containing:
* VIT/B-16 (Blue circles) – ρ = 81
* RN50x16 (Orange crosses) – ρ = 91
* RN50x64 (Green triangles) – ρ = 66
* **Gridlines:** Present to aid in reading values.
### Detailed Analysis
The plot displays data points for each model distributed across the performance space.
**VIT/B-16 (Blue circles):**
The trend for VIT/B-16 is generally upward, with increasing Pairwise Human Accuracy as P@1 Retrieval Performance increases.
* Approximately (24.5, 18.5)
* Approximately (25.5, 19.5)
* Approximately (27, 21)
* Approximately (28, 21.5)
* Approximately (28.5, 22.5)
* Approximately (29, 22.5)
* Approximately (29.5, 23)
* Approximately (30, 23.5)
* Approximately (30.5, 24)
* Approximately (31, 24.5)
* Approximately (31.5, 25)
* Approximately (32, 25.5)
**RN50x16 (Orange crosses):**
The trend for RN50x16 is also generally upward, but with more scatter than VIT/B-16.
* Approximately (24, 16.5)
* Approximately (25, 18)
* Approximately (26, 19)
* Approximately (27, 20)
* Approximately (28, 20.5)
* Approximately (29, 21.5)
* Approximately (30, 22)
* Approximately (30.5, 22.5)
* Approximately (31, 23)
* Approximately (31.5, 23.5)
* Approximately (32, 24)
**RN50x64 (Green triangles):**
The trend for RN50x64 is also upward, but with a wider spread of data points.
* Approximately (24, 21)
* Approximately (25, 21.5)
* Approximately (26, 22)
* Approximately (27, 22.5)
* Approximately (28, 23)
* Approximately (29, 23.5)
* Approximately (30, 24)
* Approximately (31, 24.5)
* Approximately (32, 25)
### Key Observations
* RN50x16 exhibits the highest correlation coefficient (ρ = 91), suggesting a strong positive relationship between P@1 Retrieval Performance and Pairwise Human Accuracy.
* VIT/B-16 has a moderate correlation (ρ = 81).
* RN50x64 has the lowest correlation (ρ = 66).
* The data points for RN50x16 and RN50x64 are more dispersed than those for VIT/B-16, indicating greater variability in performance.
* At the higher end of P@1 Retrieval Performance (around 32), all three models achieve relatively high Pairwise Human Accuracy (around 24-26).
### Interpretation
The scatter plot demonstrates the trade-off between P@1 Retrieval Performance and Pairwise Human Accuracy for the three models. The correlation coefficients suggest that RN50x16 is the most consistent in achieving high accuracy when retrieval performance is good. The wider spread of data points for RN50x64 indicates that its performance is more sensitive to variations in retrieval performance. VIT/B-16 falls in between, offering a balance between consistency and performance. The upward trends for all models suggest that improving P@1 Retrieval Performance generally leads to improved Pairwise Human Accuracy, but the strength of this relationship varies depending on the model. The data suggests that RN50x16 is the most reliable model for achieving high accuracy given good retrieval performance, while RN50x64 may be more prone to fluctuations.
</details>
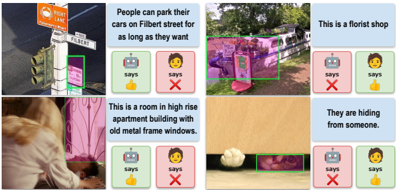
Fig. 7: Error analysis: examples of false positives and false negatives predicted by our model on the comparison task's validation set.
<details>
<summary>Image 11 Details</summary>
### Visual Description
\n
## Image Collection: Scene Understanding & Captioning Evaluation
### Overview
The image presents a 2x3 grid of scenes, each accompanied by a textual caption and two "evaluation" icons: a robot with a thumbs-up and a human face with an "X". The scenes appear to be real-world photographs, and the captions describe the content of each image. The evaluation icons likely represent machine vs. human assessment of the caption's accuracy.
### Components/Axes
The image is structured as a grid. Each cell contains:
1. A photograph of a scene.
2. A textual caption describing the scene.
3. Two evaluation icons:
* A robot icon with a thumbs-up.
* A human face icon with a red "X".
### Detailed Analysis or Content Details
**Row 1, Column 1:**
* **Image:** A street corner with traffic lights and street signs. A street sign reads "Filbert Street". Another sign above reads "Right Lane". The traffic light is green. A pink bounding box surrounds a sign.
* **Caption:** "People can park their cars on Filbert Street for as long as they want."
* **Evaluation:** Robot - Thumbs Up; Human - X
**Row 1, Column 2:**
* **Image:** A street scene with a colorful, graffiti-covered structure. A pink bounding box surrounds the structure.
* **Caption:** "This is a florist shop."
* **Evaluation:** Robot - Thumbs Up; Human - X
**Row 1, Column 3:**
* **Image:** A street scene with a colorful, graffiti-covered structure. A pink bounding box surrounds the structure.
* **Caption:** "This is a florist shop."
* **Evaluation:** Robot - Thumbs Up; Human - X
**Row 2, Column 1:**
* **Image:** A blurry interior shot, showing a person's back and a window with metal frames. Pink bounding box surrounds the window.
* **Caption:** "This is a room in high rise apartment building with old metal frame windows."
* **Evaluation:** Robot - Thumbs Up; Human - X
**Row 2, Column 2:**
* **Image:** A close-up of a textured surface (possibly a wall or ceiling). A pink bounding box surrounds a small area with some indistinct shapes.
* **Caption:** "They are hiding from someone."
* **Evaluation:** Robot - Thumbs Up; Human - X
**Row 2, Column 3:**
* **Image:** A close-up of a textured surface (possibly a wall or ceiling). A pink bounding box surrounds a small area with some indistinct shapes.
* **Caption:** "They are hiding from someone."
* **Evaluation:** Robot - Thumbs Up; Human - X
### Key Observations
* In all six cases, the robot evaluation gives a "thumbs up" indicating a positive assessment of the caption.
* In all six cases, the human evaluation gives an "X", indicating a negative assessment of the caption.
* The captions are often inaccurate or misleading given the visual content of the images. For example, the "florist shop" caption is applied to a graffiti-covered structure.
* The pink bounding boxes appear to highlight areas the system is focusing on, but these areas don't necessarily correspond to the correct objects or concepts.
### Interpretation
This image appears to be a visual demonstration of the limitations of current image captioning and scene understanding systems. The robot (representing the AI) consistently generates captions that are deemed incorrect by humans. This suggests that while the AI can identify objects and generate text, it lacks the contextual understanding and common sense reasoning necessary to accurately describe the scene. The pink bounding boxes indicate the AI is detecting *something* in the image, but it's misinterpreting what that something is. The consistent disagreement between the robot and human evaluations highlights the gap between current AI capabilities and human-level perception. This is likely a test set used to evaluate the performance of a vision-language model. The "X" marks likely indicate that the captions are factually incorrect or lack relevant details. The image demonstrates the need for more sophisticated AI models that can better understand the nuances of visual scenes and generate more accurate and informative captions.
</details>
sides of images, whereas pad-and-resize lowers the resolution significantly. The bottom half of the table in Fig. 5a reports the results: both configurations lower performance on retrieval tasks, but there's less impact for comparison.
Better retrieval → better comparison. In Fig. 6, we observe a high correlation between the retrieval performance of our (single-task) CLIP model checkpoints ( P @1) and the comparison human accuracy for the comparison task. For the smaller RN50x16 and ViT-B/16 models, this effect cannot simply be explained by training time; for RN50x16 , pearson corr. between training steps and comparison performance is 81, whereas, the correlation between P @1 and comparison performance is 91. Overall, it's plausible that a model with higher precision at retrieval could help further bridge the gap on the comparison task.
Oracle text-only models are insufficient. One potential concern with our setup is that clues may map one-to-one onto inferences, e.g., if all soccer balls in our corpus were mapped onto 'the owner plays soccer' (and vice versa). We compare to an oracle baseline that makes this pessimistic assumption (complementing our 'No Context' ablation, which provides a comparable context-free visual reference to the clue). We give the model oracle access to the ground-truth clues. Following [6], we use T5-Large v1.1 [52] to map clues to inferences with no access to the image by fitting P (inference | clue) in a sequence-to-sequence fashion; training details are in § B. The resulting text-only clue → inference model, when given the clue 'chipped paint and rusted umbrella poles' , estimates likely inferences, for example: 'the area is in a disrepair' , 'the city does not care about its infrastructure.' , etc. The text-only oracle under-performs vs. CLIP despite the fact that, unlike CLIP, it's given the ground-truth clue : on comparison, it achieves 22.8/19.3 val/test accuracy; significantly lower than 26.6/27.1 that our best vision+language model achieves. This is probably because global scene context cannot be fully summarized via a local referring expression. In the prior 'chipped paint and rusted umbrella poles' example, the true inference, 'this beach furniture does not get put inside at night' , requires additional visual context beyond the clue-chipped paint and a rusty umbrella alone may not provide enough context to infer that this furniture is beach furniture.
## 5.3 Error Analysis
We conduct a quantitative error analysis of multitask CLIP RN50x64 for the comparison task. We select 340 validation images with highest human agreement, and split images into two groups: one where the model performed above average, and one where the model performed below average. We attempt to predict into which group an image will fall using logistic regression in 5-fold cross-validation. Overall, errors are difficult to predict. Surface level image/text features of the images/inferences are not very predictive of errors: relative to a 50% ROC AUC baseline, CLIP ViT-B/16 image features achieve 55%, whereas the mean SentenceBERT [53] embedding of the inference achieves 54%. While not available a priori , more predictive than content features of model errors are human Likert ratings: a single-feature mean human agreement model achieves 57% AUC, (more human agreement = better model performance).
Fig. 7 gives qualitative examples of false positives/negatives. The types of abductive reasoning the model falls short on are diverse. In the boat example, the model fails to notice that a florist has set up shop on a ship deck; in the window example, the model misinterprets the bars over the windows as being outside the building versus inside and attached to a bed-frame. The model is capable of reading some simple signs, but, as highlighted by [37], reasoning about the semantics of written text placed in images remains a challenge, e.g., a 'no parking' sign is misidentified as an 'okay to park' sign. Overall: the difficult-tocategorize nature of these examples suggests that the Sherlock corpus makes for difficult benchmark for visual abductive reasoning.
## 6 Conclusion
We introduce Sherlock , a corpus of visual abductive reasoning containing 363K clue/inference observation pairs across 103K images. Our work complements existing abductive reasoning corpora, both in format (free-viewing, free-text) and in diversity (not human-centric). Our work not only provides a challenging vision+language benchmark, but also, we hope it can serve as a resource for studying visual abductive reasoning more broadly. Future work includes:
1. Salience: in Sherlock , annotators specify salient clues; how/why does salience differ from other free-viewing setups, like image captioning?
2. Ambiguity: when/why do people (justifiably) come to different conclusions?
3. Generative evaluation metrics: generation evaluation in abductive setting, i.e., without definitive notions of correctness, remains a challenge.
Acknowledgments. This work was funded by DARPA MCS program through NIWC Pacific (N66001-19-2-4031), the DARPA SemaFor program, and the Allen Institute for AI. AR was additionally in part supported by the DARPA PTG program, as well as BAIR's industrial alliance program. We additionally thank the UC Berkeley Semafor group for the helpful discussions and feedback.
## References
1. Aliseda, A.: The logic of abduction: an introduction. In: Springer Handbook of Model-Based Science, pp. 219-230 (2017)
2. Anderson, P., He, X., Buehler, C., Teney, D., Johnson, M., Gould, S., Zhang, L.: Bottom-up and top-down attention for image captioning and visual question answering. In: CVPR (2018)
3. Antol, S., Agrawal, A., Lu, J., Mitchell, M., Batra, D., Zitnick, C.L., Parikh, D.: VQA: Visual Question Answering. In: ICCV (2015)
4. Bender, E.M., Friedman, B.: Data statements for natural language processing: Toward mitigating system bias and enabling better science. TACL 6 , 587-604 (2018)
5. Berg, A.C., Berg, T.L., Daume, H., Dodge, J., Goyal, A., Han, X., Mensch, A., Mitchell, M., Sood, A., Stratos, K., et al.: Understanding and predicting importance in images. In: CVPR (2012)
6. Bhagavatula, C., Bras, R.L., Malaviya, C., Sakaguchi, K., Holtzman, A., Rashkin, H., Downey, D., tau Yih, W., Choi, Y.: Abductive commonsense reasoning. In: ICLR (2020)
7. Blei, D.M., Ng, A.Y., Jordan, M.I.: Latent dirichlet allocation. JMLR 3 , 993-1022 (2003)
8. Carson, D.: The abduction of sherlock holmes. International Journal of Police Science & Management 11 (2), 193-202 (2009)
9. Chen, Y.C., Li, L., Yu, L., Kholy, A.E., Ahmed, F., Gan, Z., Cheng, Y., Liu, J.: UNITER: Universal image-text representation learning. In: ECCV (2020)
10. Dosovitskiy, A., Beyer, L., Kolesnikov, A., Weissenborn, D., Zhai, X., Unterthiner, T., Dehghani, M., Minderer, M., Heigold, G., Gelly, S., et al.: An image is worth 16x16 words: Transformers for image recognition at scale. In: ICLR (2021)
11. Du, L., Ding, X., Liu, T., Qin, B.: Learning event graph knowledge for abductive reasoning. In: ACL (2021)
12. Fang, Z., Gokhale, T., Banerjee, P., Baral, C., Yang, Y.: Video2Commonsense: Generating commonsense descriptions to enrich video captioning. In: EMNLP (2020)
13. Garcia, N., Otani, M., Chu, C., Nakashima, Y.: KnowIT vqa: Answering knowledge-based questions about videos. In: AAAI (2020)
14. Gebru, T., Morgenstern, J., Vecchione, B., Vaughan, J.W., Wallach, H., Iii, H.D., Crawford, K.: Datasheets for datasets. Communications of the ACM (2021)
15. Grice, H.P.: Logic and conversation. In: Speech acts, pp. 41-58. Brill (1975)
16. He, K., Zhang, X., Ren, S., Sun, J.: Deep residual learning for image recognition. In: CVPR (2016)
17. Hobbs, J.R., Stickel, M.E., Appelt, D.E., Martin, P.: Interpretation as abduction. Artificial intelligence 63 (1-2), 69-142 (1993)
18. Hosseini, H., Kannan, S., Zhang, B., Poovendran, R.: Deceiving google's perspective api built for detecting toxic comments. arXiv preprint arXiv:1702.08138 (2017)
19. Ignat, O., Castro, S., Miao, H., Li, W., Mihalcea, R.: WhyAct: Identifying action reasons in lifestyle vlogs. In: EMNLP (2021)
20. Jang, Y., Song, Y., Yu, Y., Kim, Y., Kim, G.: Tgif-QA: Toward spatio-temporal reasoning in visual question answering. In: CVPR (2017)
21. Johnson, J., Hariharan, B., Van Der Maaten, L., Fei-Fei, L., Lawrence Zitnick, C., Girshick, R.: Clevr: A diagnostic dataset for compositional language and elementary visual reasoning. In: CVPR (2017)
22. Johnson, J., Karpathy, A., Fei-Fei, L.: Densecap: Fully convolutional localization networks for dense captioning. In: CVPR (2016)
23. Johnson, J., Krishna, R., Stark, M., Li, L.J., Shamma, D., Bernstein, M., Fei-Fei, L.: Image retrieval using scene graphs. In: CVPR (2015)
24. Jonker, R., Volgenant, A.: A shortest augmenting path algorithm for dense and sparse linear assignment problems. Computing 38 (4), 325-340 (1987)
25. Kazemzadeh, S., Ordonez, V., Matten, M., Berg, T.: ReferItGame: Referring to objects in photographs of natural scenes. In: EMNLP (2014)
26. Kim, H., Zala, A., Bansal, M.: CoSIm: Commonsense reasoning for counterfactual scene imagination. In: NAACL (2022)
27. Kingma, D.P., Ba, J.: Adam: A method for stochastic optimization. arXiv preprint arXiv:1412.6980 (2014)
28. Krahmer, E., Van Deemter, K.: Computational generation of referring expressions: A survey. Computational Linguistics 38 (1), 173-218 (2012)
29. Krishna, R., Zhu, Y., Groth, O., Johnson, J., Hata, K., Kravitz, J., Chen, S., Kalantidis, Y., Li, L.J., Shamma, D.A., Bernstein, M.S., Fei-Fei, L.: Visual genome: Connecting language and vision using crowdsourced dense image annotations. IJCV (2016)
30. Kuhn, H.W.: The hungarian method for the assignment problem. Naval research logistics quarterly 2 (1-2), 83-97 (1955)
31. Lei, J., Yu, L., Berg, T.L., Bansal, M.: TVQA+: Spatio-temporal grounding for video question answering. In: ACL (2020)
32. Lei, J., Yu, L., Berg, T.L., Bansal, M.: What is more likely to happen next? videoand-language future event prediction. In: EMNLP (2020)
33. Lin, T.Y., Maire, M., Belongie, S.J., Hays, J., Perona, P., Ramanan, D., Doll´ ar, P., Zitnick, C.L.: Microsoft COCO: Common objects in context. In: ECCV (2014)
34. Liu, J., Chen, W., Cheng, Y., Gan, Z., Yu, L., Yang, Y., Liu, J.: Violin: A largescale dataset for video-and-language inference. In: CVPR (2020)
35. Loshchilov, I., Hutter, F.: Decoupled weight decay regularization. In: ICLR (2019)
36. Marino, K., Rastegari, M., Farhadi, A., Mottaghi, R.: OK-VQA: A visual question answering benchmark requiring external knowledge. In: CVPR (2019)
37. Mishra, A., Shekhar, S., Singh, A.K., Chakraborty, A.: OCR-VQA: Visual question answering by reading text in images. In: ICDAR (2019)
38. Mitchell, M., Wu, S., Zaldivar, A., Barnes, P., Vasserman, L., Hutchinson, B., Spitzer, E., Raji, I.D., Gebru, T.: Model cards for model reporting. In: FAccT (2019)
39. Niiniluoto, I.: Defending abduction. Philosophy of science 66 , S436-S451 (1999)
40. Oord, A.v.d., Li, Y., Vinyals, O.: Representation learning with contrastive predictive coding. arXiv preprint arXiv:1807.03748 (2018)
41. Ordonez, V., Kulkarni, G., Berg, T.L.: Im2text: Describing images using 1 million captioned photographs. In: NeurIPS (2011)
42. Ovchinnikova, E., Montazeri, N., Alexandrov, T., Hobbs, J.R., McCord, M.C., Mulkar-Mehta, R.: Abductive reasoning with a large knowledge base for discourse processing. In: IWCS (2011)
43. Park, D.H., Darrell, T., Rohrbach, A.: Robust change captioning. In: ICCV (2019)
44. Park, J.S., Bhagavatula, C., Mottaghi, R., Farhadi, A., Choi, Y.: VisualCOMET: Reasoning about the dynamic context of a still image. In: ECCV (2020)
45. Paul, D., Frank, A.: Generating hypothetical events for abductive inference. In: *SEM (2021)
46. Peirce, C.S.: Philosophical writings of Peirce, vol. 217. Courier Corporation (1955)
47. Peirce, C.S.: Pragmatism and pragmaticism, vol. 5. Belknap Press of Harvard University Press (1965)
48. Pezzelle, S., Greco, C., Gandolfi, G., Gualdoni, E., Bernardi, R.: Be different to be better! a benchmark to leverage the complementarity of language and vision. In: Findings of EMNLP (2020)
49. Pirsiavash, H., Vondrick, C., Torralba, A.: Inferring the why in images. Tech. rep. (2014)
50. Qin, L., Shwartz, V., West, P., Bhagavatula, C., Hwang, J., Bras, R.L., Bosselut, A., Choi, Y.: Back to the future: Unsupervised backprop-based decoding for counterfactual and abductive commonsense reasoning. In: EMNLP (2020)
51. Radford, A., Kim, J.W., Hallacy, C., Ramesh, A., Goh, G., Agarwal, S., Sastry, G., Askell, A., Mishkin, P., Clark, J., et al.: Learning transferable visual models from natural language supervision. arXiv preprint arXiv:2103.00020 (2021)
52. Raffel, C., Shazeer, N., Roberts, A., Lee, K., Narang, S., Matena, M., Zhou, Y., Li, W., Liu, P.J.: Exploring the limits of transfer learning with a unified text-to-text transformer. JMLR (2020)
53. Reimers, N., Gurevych, I.: Sentence-bert: Sentence embeddings using siamese bertnetworks. In: EMNLP (2019)
54. Ren, S., He, K., Girshick, R., Sun, J.: Faster R-CNN: Towards real-time object detection with region proposal networks. NeurIPS (2015)
55. Sap, M., Card, D., Gabriel, S., Choi, Y., Smith, N.A.: The risk of racial bias in hate speech detection. In: ACL (2019)
56. Shank, G.: The extraordinary ordinary powers of abductive reasoning. Theory & Psychology 8 (6), 841-860 (1998)
57. Sharma, P., Ding, N., Goodman, S., Soricut, R.: Conceptual captions: A cleaned, hypernymed, image alt-text dataset for automatic image captioning. In: ACL (2018)
58. Shazeer, N., Stern, M.: Adafactor: Adaptive learning rates with sublinear memory cost. In: ICML (2018)
59. Sohn, K.: Improved deep metric learning with multi-class n-pair loss objective. In: NeurIPS (2016)
60. Tafjord, O., Mishra, B.D., Clark, P.: ProofWriter: Generating implications, proofs, and abductive statements over natural language. In: Findings of ACL (2021)
61. Tan, H., Bansal, M.: LXMERT: Learning cross-modality encoder representations from transformers. In: EMNLP (2019)
62. Tan, M., Le, Q.: Efficientnet: Rethinking model scaling for convolutional neural networks. In: ICML (2019)
63. Tapaswi, M., Zhu, Y., Stiefelhagen, R., Torralba, A., Urtasun, R., Fidler, S.: MovieQA: Understanding stories in movies through question-answering. In: CVPR (2016)
64. Vaswani, A., Shazeer, N., Parmar, N., Uszkoreit, J., Jones, L., Gomez, A.N., Kaiser, L., Polosukhin, I.: Attention is all you need. In: NeurIPS (2017)
65. Vedantam, R., Lin, X., Batra, T., Zitnick, C.L., Parikh, D.: Learning common sense through visual abstraction. In: ICCV (2015)
66. Wang, P., Wu, Q., Shen, C., Dick, A., Van Den Hengel, A.: FVQA: Fact-based visual question answering. TPAMI 40 (10), 2413-2427 (2017)
67. Wang, P., Wu, Q., Shen, C., Hengel, A.v.d., Dick, A.: Explicit knowledge-based reasoning for visual question answering. In: IJCAI (2017)
68. Wolf, T., Debut, L., Sanh, V., Chaumond, J., Delangue, C., Moi, A., Cistac, P., Rault, T., Louf, R., Funtowicz, M., Davison, J., Shleifer, S., von Platen, P.,
Ma, C., Jernite, Y., Plu, J., Xu, C., Scao, T.L., Gugger, S., Drame, M., Lhoest, Q., Rush, A.M.: Transformers: State-of-the-art natural language processing. In: EMNLP: System Demonstrations (2020)
69. Xie, S., Girshick, R., Doll´ ar, P., Tu, Z., He, K.: Aggregated residual transformations for deep neural networks. In: CVPR (2017)
70. Yao, Y., Zhang, A., Zhang, Z., Liu, Z., Chua, T.S., Sun, M.: CPT: Colorful prompt tuning for pre-trained vision-language models. arXiv preprint arXiv:2109.11797 (2021)
71. Yi, K., Gan, C., Li, Y., Kohli, P., Wu, J., Torralba, A., Tenenbaum, J.B.: CLEVRER: Collision events for video representation and reasoning. In: ICLR (2020)
72. Yu, L., Park, E., Berg, A.C., Berg, T.L.: Visual Madlibs: Fill in the blank image generation and question answering. In: ICCV (2015)
73. Yu, L., Poirson, P., Yang, S., Berg, A.C., Berg, T.L.: Modeling context in referring expressions. In: ECCV (2016)
74. Zadeh, A., Chan, M., Liang, P.P., Tong, E., Morency, L.P.: Social-iq: A question answering benchmark for artificial social intelligence. In: CVPR (2019)
75. Zellers, R., Bisk, Y., Farhadi, A., Choi, Y.: From recognition to cognition: Visual commonsense reasoning. In: CVPR (2019)
76. Zellers, R., Lu, X., Hessel, J., Yu, Y., Park, J.S., Cao, J., Farhadi, A., Choi, Y.: MERLOT: multimodal neural script knowledge models. In: NeurIPS (2021)
77. Zhang, C., Gao, F., Jia, B., Zhu, Y., Zhu, S.C.: Raven: A dataset for relational and analogical visual reasoning. In: CVPR (2019)
78. Zhang, H., Huo, Y., Zhao, X., Song, Y., Roth, D.: Learning contextual causality from time-consecutive images. In: CVPR Workshops (2021)
79. Zhu, Y., Groth, O., Bernstein, M., Fei-Fei, L.: Visual7W: Grounded question answering in images. In: CVPR (2016)
<details>
<summary>Image 12 Details</summary>

### Visual Description
Icon/Small Image (24x24)
</details>
## Supplementary Material
## A Sherlock Data Collection and Evaluation
The dataset was collected during the month of February of 2021. The data collected is in English and HITs were open to workers originating from US, Canada, Great Britain and Australia. We target for a worker payment rate of $15/hour for all our HITs. For data collection and qualifications, average pay for the workers came to $16-$20 with median workers being compensated $12/hour. We hash Worker IDs to preserve anonymity. A sample of data collection HIT is shown in Fig. 11 (with instructions shown in Fig. 10).
## A.1 Qualification of Workers
As a means for ensuring high quality annotations, 266 workers were manually selected through a qualification and training rounds. The workers were presented with three images and asked to provide three observation pairs per image. Each of the worker responses were manually evaluated. A total 297 workers submitting 8 reasonable observation pairs out of of 9 were qualified for training.
The process of creating bounding boxes and linking these boxes to the observation pairs was complex enough to necessitate a training stage. For the training round, qualified workers were given a standard data collection hit (Fig. 11) at a higher pay to account for the time expected for them to learn the process. An additional training round was encouraged for a small pool of workers to ensure all workers were on the page with regards to the instructions and the mechanism of the hit. 266 workers worked on and completed the training (remaining 31 did not return for the training round). In this paper, we use the term qualified workers to refer to the workers who have completed both the qualification and training round.
## A.2 Data Collection
As described in § 3, we collected a total of 363K observation pairs which consist of a clue and inference. Further examples of annotations are shown in Fig. 14.
Image sourcing. For VCR images, we use the subset also annotated by VisualCOMET [44]; we limit our selection to images that contain at least 3 unique entities (persons or objects). For Visual Genome, during early annotation rounds, crowdworkers shared that particular classes of images were common and less interesting (e.g., grazing zebras, sheep in pastures). In response, we performed a semantic de-duplication step by hierarchical clustering into 80K clusters of extracted CLIP ViT-B/32 features [51] and sample a single image from each resulting cluster. We annotate 103K images in total, and divide them into a training/validation/test set of 90K/6.6K/6.6K, aligned with the community standard splits for these corpora.
Bounding boxes. For each clue in an observation pair , the workers were asked to draw one or more bounding boxes around image regions relevant to the clue. For example, for the clue 'a lot of architectural decorations' given for the lower right image in Fig. 14, the worker chose box each of the architectural features separately in their own bounding box. While it was not strictly enforced, we encouraged the workers to keep to a maximum of 3 bounding boxes per clue, with allowance for more if necessitated by the image and the observation pair , based on worker's individual discretion.
## A.3 Corpus Validation
To verify the quality of annotation, we run a validation over 17K observation pairs . For each observation pair , we present three independent crowdworkers with its associated image and its annotation: the clue with its corresponding region bound-boxed in the image and the inference along with its confidence rating. The workers are then asked rate the observation pairs along three dimensions: (1) acceptability of the observation pair (is the observation pair reasonable given the image?), (2) appropriateness of bounding boxes (do the bounding boxes appropriately represent the clue?), and (3) interestingness of the observation pair (how interesting is the observation pair ?). The annotation template of the HIT is shown in Fig. 12.
## A.4 Details on exploration of social biases
The clues and inferences we collect from crowdsource workers are abductive, and thus are uncertain. Despite this type of reasoning being an important aspect of human cognition, heuristics and assumptions may reflect false and harmful social biases. As a concrete example: early on in our collection process during a qualifying round, we asked 70 workers to annotate an image of a bedroom, where action figures were placed on the bed. Many said that the bedroom was likely to belong to a male child, citing the action figures as evidence. We again emphasize that our goal is to study heuristic reasoning, without endorsing the particular inferences themselves.
Sample analysis. While curating the corpus, we (the authors) have examined several thousand annotations. To supplement our qualitative experience, in addition, we conducted a close reading of a random sample of 250 inferences. This close reading was focused on references to protected characteristics of people and potentially offensive/NSFW cases.
During both our informal inspection and close reading, we observed similar patterns. Like in other vision and language corpora depicting humans, the most common reference to a protected characteristic was perceived gender, e.g., annotators often assumed depicted people were 'a man' or 'a woman' (and sometimes, age is also assumed, e.g., 'an old man'). Aside from perception standing-in for identity, a majority of inferences are not specifically/directly about protected
characteristics and are SFW (243/250 in our sample). The small number of exceptions included: assumptions about the gender of owners of items similar to the action figure example above (1/250 cases); speculation about the race of an individual based on a sweater logo (1/250); and commenting on bathing suits with respect to gender (1/250).
Since still frames in VCR are taken from movies, some depict potentially offensive imagery, e.g., movie gore, dated tropes, etc. The images in VCR come with the following disclaimer, which we also endorse (via visualcommonsense.com): 'many of the images depict nudity, violence, or miscellaneous problematic things (such as Nazis, because in many movies Nazis are the villains). We left these in though, partially for the purpose of learning (probably negative but still important) commonsense implications about the scenes. Even then, the content covered by movies is still pretty biased and problematic, which definitely manifests in our data (men are more common than women, etc.).'
Statistical analysis. While the random sample analysis suggests that a vast majority of annotations in our corpus do not reference protected characteristics and are SFW, for an additional check, we passed a random set of 30K samples (10K each from training/val/test) clues/inferences through the Perspective API. 17 While the API itself is imperfect and itself has biases [18,38,55], it nonetheless can provide some additional information on potentially harmful content in our corpus. We examined the top 50 clue/inference pairs across each split marked as most likely to be toxic. Most of these annotations were false positives, e.g., 'a dirty spoon' was marked as potentially toxic likely because of the word 'dirty.' But, this analysis did highlight a very small amount of lewd/NSFW/offensive content. Out of the 30K cases filtered through the perspective API, we discovered 6 cases of weight stigmatization, 2 (arguably) lewd observation, 1 dark comment about a cigarette leading to an early death for a person, 1 (arguable) case of insensitivity to mental illness, 6 cases of sexualized content, and 1 (arguable) case where someone was highlighted for wearing non-traditionally-gendered clothing.
## B Additional Modeling Details
After some light hyperparameter tuning on the validation set, the best learning rate for fine-tuning our CLIP models was found to be .00001 with AdamW [35,27]. We use a linear learning rate warmup over 500 steps for RN50x16 and ViT-B/16 , and 1000 for RN50x64 . Our biggest model, RN50x64 , takes about 24 hours to converge when trained on 8 Nvidia RTX6000 cards. For data augmentation during training, we use pytorch 's RandomCrop , RandomHorizontalFlip , RandomGrayscale , and ColorJitter . For our widescreen CLIP variants, data augmentations are executed on each half of the image independently. We compute visual/textual embeddings via a forward pass of the respective branches of CLIP - for our widescreen model, we simply average the resultant embeddings for each side of the image. To compute similarity score, we use cosine similarity,
17 https://www.perspectiveapi.com/ ; November 2021 version.
| | Retrieval | Retrieval | Localization GT-Box/Auto-Box ( ↑ |
|--------------------|-------------|-------------------|------------------------------------|
| | im → txt ( | ↓ ) P @1 im → txt | ( ↑ ) ) |
| RN50x64 -inference | 12.8 | 43.4 | 92.5/41.4 |
| RN50x64 -clue | 6.2 | 54.3 | 94.7/53.3 |
| RN50x64 -multitask | 5.4 | 57.5 | 95.3 / 54.3 |
Table 3: Retrieval and localization results when clues are used at evaluation time instead of inferences. This task is more akin to referring expression retrieval/localization rather than abductive commonsense reasoning. While clue retrieval/localization setups are easier overall (i.e., referring expressions are easier both models to reason about) the model trained for abductive reasoning, RN50x64 -inference, performs worse than the model trained on referring expressions RN50x64 -clue.
and then scale the resulting similarities using a logit scaling factor, following [51]. Training is checkpointed every 300 gradient steps, and the checkpoint with best validation P @1 retrieval performance is selected.
Ablation details. For all ablations, we use the ViT-B/16 version of CLIP for training speed: this version is more than twice as fast as our smallest ResNet, and enabled us to try more ablation configurations.
A cleaner training corpus. Evaluations are reported over version 1.1 of the Sherlock validation/test sets. However, our models are trained on version 1.0, which contains 3% more data; early experiments indicate that the removed data doesn't significantly impact model performance. This data was removed because we discovered a small number of annotators were misusing the original collection interface, and thus, we removed their annotations. We encourage follow-up work to use version 1.1, but include version 1.0 for the sake of replicability.
T5 model details. We train T5-Large to map from clues to inferences using the Huggingface transformers library [68]; we parallelize using the Huggingface accelerate package. We use Adafactor [58] with learning rate .001 and batch size 32, train for 5 epochs, and select the checkpoint with the best validation loss.
## B.1 Results on Clues instead of Inferences
Whereas inferences capture abductive inferences, clues are more akin to referring expressions. While inferences are our main focus at evaluation time, Sherlock also contains an equal number of clues, which act as literal descriptions of image regions: Sherlock thus provides a new dataset of 363K localized referring expressions grounded in the image regions of VisualGenome and VCR. As a pointer towards future work, we additionally report results for the retrieval and
<details>
<summary>Image 13 Details</summary>

### Visual Description
Icon/Small Image (24x25)
</details>
localization setups, but instead of using a version testing on inference texts, we test on clues. We do not report over our human-judged comparison sets, because or raters only observed inferences in that case. Table 3 includes prediction results of two models in this setting: both are RN50x64 models trained with widescreen processing and with clues highlighted in pixel space, but one is trained on inferences, and one is trained on clues.
## C Batch Size Ablation
We hypothesize the nature of the hard negatives the models encounter during training is related to their performance. Because UNITER and LXMERT are bidirectional, they are quadratically more memory intensive vs. CLIP: as a result, for those models, we were only able to train with 18 negative examples per positive (c.f. CLIP ViT-B/16 , which uses 511 negatives). To check that batch size/number of negatives wasn't the only reason CLIP outperformed UNITER, we conducted an experiment varying ViT-B/16 's batch size from 4 to 512; the results are given in Fig. 8. Batch size doesn't explain all performance differences: with a batch size of only 4, our weakest CLIP-based model still localizes better than UNITER, and, at batch size 8, it surpasses UNITER's retrieval performance.
## D Clues and inferences vs. literal captions
Fig. 8: The effect of batch size on performance of ViT/B-16 . UNITER batch size is 256. Performance on all tasks increases with increasing batch size, but appears to saturate, particularly for comparison.
<details>
<summary>Image 14 Details</summary>
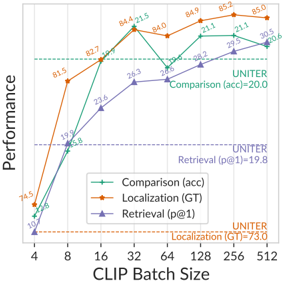
### Visual Description
## Line Chart: Performance vs. CLIP Batch Size
### Overview
This image presents a line chart illustrating the performance of three different metrics – Comparison (accuracy), Localization (Ground Truth), and Retrieval (p@1) – as a function of CLIP Batch Size. The chart displays how these metrics change as the CLIP Batch Size increases from 4 to 512. Horizontal dashed lines indicate the performance of the UNITER model for Comparison and Retrieval.
### Components/Axes
* **X-axis:** CLIP Batch Size, ranging from 4 to 512. The scale is logarithmic, with markers at 4, 8, 16, 32, 64, 128, 256, and 512.
* **Y-axis:** Performance, ranging from approximately 70 to 86. The axis is labeled "Performance".
* **Data Series:**
* Comparison (acc): Represented by a green line with triangular markers.
* Localization (GT): Represented by an orange line with circular markers.
* Retrieval (p@1): Represented by a purple line with square markers.
* **Legend:** Located in the top-left corner of the chart. It maps colors to the corresponding metrics.
* **Horizontal Dashed Lines:** Two horizontal dashed lines are present.
* A cyan dashed line labeled "UNITER Comparison (acc)=20.0".
* A magenta dashed line labeled "UNITER Retrieval (p@1)=19.8".
* **Text Annotations:**
* "UNITER Localization (GT)=73.0" is located in the bottom-right corner.
### Detailed Analysis
* **Comparison (acc):** The green line starts at approximately 74.5 at a CLIP Batch Size of 4. It increases sharply to 81.5 at a batch size of 8, then continues to rise to 82.7 at 16, peaking at 84.4 at 32. It then drops to 84.0 at 64, rises to 84.9 at 128, reaches a maximum of 85.2 at 256, and finally decreases slightly to 85.0 at 512.
* **Localization (GT):** The orange line begins at approximately 70 at a CLIP Batch Size of 4. It increases rapidly to 81.5 at 8, then to 82.7 at 16, and reaches a peak of 84.4 at 32. It then declines to 84.0 at 64, rises to 84.9 at 128, and continues to 85.2 at 256, before decreasing to 84.5 at 512.
* **Retrieval (p@1):** The purple line starts at approximately 74.5 at a CLIP Batch Size of 4. It increases to 79.8 at 8, then to 82.4 at 16, and to 86.3 at 32. It then drops significantly to 82.6 at 64, rises to 88.2 at 128, reaches 89.5 at 256, and finally decreases to 90.5 at 512.
### Key Observations
* All three metrics generally increase with increasing CLIP Batch Size, but exhibit varying degrees of fluctuation.
* The Retrieval (p@1) metric consistently demonstrates the highest performance across all batch sizes.
* The Localization (GT) and Comparison (acc) metrics show similar trends, with Localization slightly outperforming Comparison at lower batch sizes.
* The performance of all metrics appears to plateau or even decrease at higher batch sizes (256 and 512).
* The UNITER model's performance is significantly lower than the performance achieved by the other metrics at all batch sizes.
### Interpretation
The chart suggests that increasing the CLIP Batch Size generally improves the performance of the Comparison, Localization, and Retrieval metrics, up to a certain point. The plateauing or decrease in performance at higher batch sizes could indicate diminishing returns or potential overfitting. The Retrieval metric consistently outperforms the others, suggesting it is the most robust to changes in batch size. The significant gap between the UNITER model's performance and the performance of the other metrics suggests that UNITER may not be as effective as the other models under the tested conditions. The fluctuations in performance across different batch sizes may be due to the inherent variability in the data or the specific implementation of the models. The chart provides valuable insights into the relationship between CLIP Batch Size and model performance, which can be used to optimize model training and deployment.
</details>
Fig. 9: The SentenceBERT [53] cosine similarity between clues/inferences and MSCOCO captions; MSCOCO caption self-similarity included for reference. On average, clues are closer to MSCOCO captions than inferences.
<details>
<summary>Image 15 Details</summary>
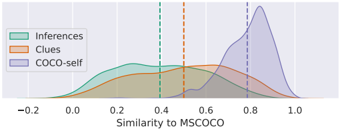
### Visual Description
\n
## Density Plot: Similarity to MSCOCO
### Overview
The image presents a density plot illustrating the similarity to MSCOCO for three different categories: Inferences, Clues, and COCO-self. The x-axis represents the similarity score, ranging from -0.2 to 1.0. The plot uses shaded areas to represent the density distribution of similarity scores for each category. Vertical dashed lines mark specific similarity values for each category.
### Components/Axes
* **X-axis Title:** "Similarity to MSCOCO"
* **Y-axis:** No explicit y-axis label is present, but it represents density or probability.
* **Legend:** Located in the top-left corner, with the following entries:
* "Inferences" (Light Green)
* "Clues" (Burnt Sienna)
* "COCO-self" (Lavender)
* **Vertical Dashed Lines:** Three vertical dashed lines are present, one for each category, indicating a specific similarity value.
### Detailed Analysis
The plot shows the distribution of similarity scores for each category.
* **Inferences (Light Green):** The density distribution for "Inferences" starts at approximately -0.2, rises to a peak around 0.3, and then declines towards 0. The vertical dashed line for "Inferences" is located at approximately 0.4.
* **Clues (Burnt Sienna):** The density distribution for "Clues" begins around 0.0, increases to a peak around 0.5, and then decreases. The vertical dashed line for "Clues" is located at approximately 0.6.
* **COCO-self (Lavender):** The density distribution for "COCO-self" starts around 0.6, rises sharply to a peak around 0.85, and then declines. The vertical dashed line for "COCO-self" is located at approximately 0.8.
The distributions overlap significantly, particularly between "Clues" and "COCO-self" in the range of 0.6 to 0.8. "Inferences" has a lower overall similarity score compared to the other two categories.
### Key Observations
* "COCO-self" consistently exhibits the highest similarity to MSCOCO, with the majority of its distribution concentrated above 0.7.
* "Clues" shows a broader distribution than "COCO-self", indicating more variability in similarity scores.
* "Inferences" has the lowest similarity scores, with a significant portion of the distribution below 0.4.
* The vertical dashed lines suggest a threshold or reference point for each category.
### Interpretation
The data suggests that "COCO-self" is most similar to the MSCOCO dataset, which is expected as it likely represents the dataset itself. "Clues" exhibit moderate similarity, while "Inferences" show the lowest similarity. This could indicate that the "Inferences" are derived from a different source or represent a more abstract concept compared to "Clues" and "COCO-self". The overlapping distributions between "Clues" and "COCO-self" suggest that some "Clues" may be directly related to the MSCOCO dataset, while others are more distinct. The vertical dashed lines could represent a cutoff point for considering a similarity score as significant or meaningful. The plot provides a visual comparison of the similarity between these three categories and the MSCOCO dataset, highlighting their relative relationships.
</details>
We ran additional analyses to explore the textual similarity between Sherlock 's clues and inferences vs. literal image descriptions. For 2K images, we computed text overlap using S-BERT cosine similarity [53] between MS COCO captions and Sherlock clues/inferences. The result is in Fig. 9. As a baseline we include COCO self-similarity with held-out captions. Clues are more similar to COCO captions than inferences, presumably because they make reference to the same types of literal objects/actions that are described in literal captions.
## E Comparison Human Evaluation Set Details
We aim to sample a diverse and plausible set of candidate inferences for images to form our comparison set. Our process is a heuristic effort designed to elicit 'interesting' annotations from human raters. Even if the process isn't perfect for generating interesting candidates, because we solicit human ratings we show inferences to annotators and ask them to rate their plausibility, the resulting set will still be a valid representation of human judgment. We start by assuming all inferences could be sampled for a given image+region, and proceed to filter according to several heuristics.
First, we use a performant RN50x16 checkpoint as a means of judging plausibility of inferences. This checkpoint achieves 18.5/20.6/31.5 im2txt/txt2im/P@1 respectively on retrieval on v1.0 of the Sherlock corpus; this is comparable to the RN50x16 checkpoint we report performance on in our main results section. We use this checkpoint to score all validation/test (image+region, inference) possibilities.
Global filters. We assume that if the model is already retrieving its ground truth inference which high accuracy, the instance is probably not as interesting: for each image, we disqualify all inferences that receive a lower plausibility estimate from our RN50x16 checkpoint vs. the ground truth inference (this also discards the ground-truth inference). This step ensures that the negative inferences we sample are more plausible than the ground truth inference according to the model. Next, we reduce repetitiveness of our inference texts using two methods. First, we perform the same semantic de-duplication via hierarchical clustering as described in § 3: clustering is computed on SentenceBERT [53] representations of inferences ( all-MiniLM-L6-v2 ). We compute roughly 18K clusters (corresponding to 80% of the dataset size) and sample a single inference from each cluster: this results in 20% of the corpus being removed from consideration, but maintains diversity, because each of the 18K clusters is represented. Second, we perform a hard-deduplication by only allowing three verbatim copies of each inference to be sampled.
Local filters. After these global filters, we begin the iterative sampling process for each image+region. If, after all filtering, a given image+region has fewer than 20 candidates to select from, we do not consider it further. Then, in a greedy fashion, we build-up the candidate set by selecting the remaining inference with i)
the highest model plausibility ii) that is maximally dissimilar to the already sampled inferences for this image according to the SentenceBERT representations. Both of these objectives are cosine similarities in vector spaces (one between image and text, and one between text and text). We assign weights so that the image-text similarity (corresponding to RN50x16 plausibility) is 5x more important than the text-text dissimilarity (corresponding to SentenceBERT diversity). After iteratively constructing a diverse and plausible set of 10 inferences for a given image under this process, we globally disqualify the sampled inferences such that no inference is sampled more than once for each image (unless it is a verbatim duplicate, in which case, it may be sampled up to 3 times).
Finally, for all of the images we are able to sample a set of 10 inferences for, we sort by how promising they are collectively according to a weighted sum of: the (globally ranked) average length of the sampled inferences, the (globally ranked) diversity of the set of 10 (measured by mean all-pairs SentenceBERT cosine sim: lower=more diverse), and 5x the (globally ranked) average plausibility according to RN50x16 . We collect 2 human judgments for each of the 10 inferences for the top 500 images from the val/test sets (1K total) according to this heuristic ranking. The total is 20K human judgments, which formed v1 of the Sherlock comparison corpus. v1.1 has 19K judgments.
Crowdowrking details. For the comparison task, we designed an additional HIT to collect human feedback on the retrieved inferences. In the HIT, workers were presented with the images with the appropriate clue region highlighted. Then they were provided with the inferences and were asked to rate them on a likert scale of 1-3, with 1 as 'irrelevant' or 'verifiably incorrect', 2 as 'statement is probably true but there is a better highlighted region to support it', and 3 as 'statement is probably true and the highlighted region supports it'. A sample of evaluation HIT is shown in Fig. 13. Human agreement on this setup is reported as accuracy § 5.1.
## F Datasheet for Sherlock
In this section, we present a Datasheet [14,4] for Sherlock .
1. Motivation For Datasheet Creation
- Why was the dataset created? Sherlock was created to support the study of visual abductive reasoning. Broadly speaking, in comparison to corpora which focus on concrete, objective facets depicted within visual scenes (e.g., the presence/absence of objects), we collected Sherlock with the goal of better understanding the types of abductive inferences that people make about images. All abductive inferences carry uncertainty. We aim to study the inferences we collect, but do not endorse their objectivity, and do not advocate for use cases that risk perpetuating them.
- Has the dataset been used already? The annotations we collect are novel, but the images are sourced from two widely-used, existing datasets: Visual Genome [29] and VCR [75].
- What (other) tasks could the dataset be used for? Aside from our retrieval/localization setups, Sherlock could be useful as a pretraining corpus for models that aim to capture information about what people might assume about an image, rather than what is literally depicted in that image. One potentially promising case: if a malicious actor were posting emotionally manipulative content online, it might be helpful to study the types of assumptions people might make about their posts, rather than the literal contents of the post itself.
- Who funded dataset creation? This work was funded by DARPA MCS program through NIWC Pacific (N66001-19-2-4031), the DARPA SemaFor program, and the Allen Institute for AI.
## 2. Data composition
- What are the instances? We refer to the instances as clues/inferences, which are authored by crowdworkers. As detailed in the main text of the paper, a clue is a bounding box coupled with a free-text description of the literal contents of that bounding box. An inference is an abductive conclusion that the crowdworker thinks could be true about the clue.
- How many instances are there? There are 363K commonsense inferences grounded in 81K Visual Genome images and 22K VCR images.
- What data does each instance consist of? Each instance contains 3 things: a clue, a short English literal description of a portion of the image, an inference, a short English description of an inference associated with the clue that aims to be not immediately obvious from the image content, and a bounding box specified with the region of interest.
- Is there a label or target associated with each instance? We discuss in the paper several tasks, which involve predicting inferences, bounding boxes, etc.
- Is any information missing from individual instances? Not systematically - in rare circumstances, we had to discard some instances because of malformed crowdworking inputs.
- Are relationships between individual instances made explicit? Yes - the annotations for a given image are all made by the same annotator and are aggregated based on that.
- Does the dataset contain all possible instances or is it a sample? This is a natural language sample of abductive inferences; it would probably be impossible to enumerate all of them.
- Are there recommended data splits? Yes, they are provided.
- Are there any errors, sources of noise, or redundancies in the dataset? If so, please provide a description. Yes: some annotations are repeated by crowdworkers. When we collected the corpus of Likert judgments for evaluation, we performed both soft and hard deduplication steps, ensuring that the text people were evaluating wasn't overly repetitive.
- Is the dataset self-contained, or does it link to or otherwise rely on external resources (e.g., websites, tweets, other datasets)? It
- links to the images provided by Visual Genome and VCR. If images were removed from those corpora, our annotations wouldn't be grounded.
## 3. Collection Process
- What mechanisms or procedures were used to collect the data? We collected data using Amazon Mechanical Turk.
- How was the data associated with each instance acquired? Was the data directly observable (e.g., raw text, movie ratings), reported by subjects (e.g., survey responses), or indirectly inferred or derived from other data? Paid crowdworkers provided the annotations.
- If the dataset is a sample from a larger set, what was the sampling strategy (e.g., deterministic, probabilistic with specific sampling probabilities)? We downsample common image types via a semantic deduplication step. Specifically, some of our crowdworkers were rightfully pointing out that it's difficult to say interesting things about endless pictures of zebra; these types of images are common in visual genome. So, we performed hierarchical clustering on the images from that corpus, and then sampled 1 image from each of 80K clusters. The result is a downsampling of images with similar feature representations. We stopped receiving comments about zebras after this deduplication step.
- Who was involved in the data collection process (e.g., students, crowdworkers, contractors) and how were they compensated (e.g., how much were crowdworkers paid)? Crowdworkers constructed the corpus via a mechanical turk HIT we designed. We our target was to pay $ 15/hour. A post-hoc analysis revealed that crowdworkers were paid a median $ 12/hr and a mean of $ 16-20/hour, depending on the round.
- Over what timeframe was the data collected? Does this timeframe match the creation timeframe of the data associated with the instances (e.g., recent crawl of old news articles)? If not, please describe the timeframe in which the data associated with the instances was created. The main data was collected in February 2021.
## 4. Data Preprocessing
- Was any preprocessing/cleaning/labeling of the data done (e.g., discretization or bucketing, tokenization, part-of-speech tagging, SIFT feature extraction, removal of instances, processing of missing values)? Yes, significant preprocessing was conducted. The details are in
- Was the 'raw' data saved in addition to the preprocessed, cleaned, labeled data (e.g., to support unanticipated future uses)? If so, please provide a link or other access point to the 'raw' data. The concept of 'raw' data is difficult to specify in our case. We detail the data we release in the main body of the paper.
- Is the software used to preprocess/clean/label the instances available? If so, please provide a link or other access point. We plan
to release some software related to modeling, and also have provided some appendices that detail the crowdworking labelling efforts.
- Does this dataset collection/processing procedure achieve the motivation for creating the dataset stated in the first section of this datasheet? If not, what are the limitations? We think so. It's difficult to fully specify the abductive reasoning process of humans. But we think our work goes a step beyond existing corpora.
5. Dataset Distribution
- How will the dataset be distributed?
The dataset is available at http://visualabduction.com/ .
- When will the dataset be released/first distributed? What license (if any) is it distributed under?
The dataset is released under CC-BY 4.0 and the code is released under Apache 2.0.
- Are there any copyrights on the data?
The copyright for the new annotations is held by AI2 with all rights reserved.
- Are there any fees or access restrictions?
No - our annotations are freely available.
6. Dataset Maintenance
- Who is supporting/hosting/maintaining the dataset?
The dataset is hosted and maintained by AI2.
- Will the dataset be updated? If so, how often and by whom?
We do not currently have plans to update the dataset regularly.
- Is there a repository to link to any/all papers/systems that use this dataset?
No, but if future work finds this work helpful, we hope they will consider citing this work.
- If others want to extend/augment/build on this dataset, is there a mechanism for them to do so?
People are free to remix, use, extend, build, critique, and filter the corpus: we would be excited to hear more about use cases either via our github repo, or via personal correspondence.
7. Legal and Ethical Considerations
- Were any ethical review processes conducted (e.g., by an institutional review board)?
Crowdworking studies involving no personal disclosures of standard computer vision corpora are not required by our IRB to be reviewed by them. While we are not lawyers, the opinion is based on United States federal regulation 45 CFR 46, under which this study qualifies and as exempt and does not require IRB review.
<details>
<summary>Image 16 Details</summary>

### Visual Description
Icon/Small Image (24x25)
</details>
- (a) Wedo not collect personal information. Information gathered is strictly limited to general surveys probing at general world knowledge.
- (b) We take precaution to anonymize Mechanical WorkerIDs in a manner that the identity of the human subjects cannot be readily ascertained (directly or indirectly).
- (c) We do not record or include any interpersonal communication or contact between investigation and subject.
## Specifically:
- We do not have access to the underlying personal records and will record information in such a manner that the identity of the human subject cannot readily be ascertained.
- Information generated by participants is non-identifying without turning over the personal records attached to these worker IDs.
- We do not record or include any interpersonal communication or contact between investigation and subject.
## - Does the dataset contain data that might be considered confidential?
Potentially, yes. Most of the content in the corpus that would be considered potentially private/confidential would likely be depicted in the images of Visual Genome (VCR are stills from movies where actors onscreen are presumably aware of their public actions). While we distribute no new images, if an image is removed from Visual Genome (or VCR), it will be removed from our corpus as well.
- Does the dataset contain data that, if viewed directly, might be offensive, insulting, threatening, or might otherwise cause anxiety? If so, please describe why
As detailed in the main body of the paper, we have searched for toxic content using a mix of close reading of instances and the Perspective API from Google. In doing this, we have identified a small fraction of instances that could be construed as offensive. For example, in a sample of 30K instances, we discovered 6 cases that arguably offensive (stigmatizes depicted people's weight based on visual cues). Additionally, some of the images from VCR, gathered from popular movies, can depict potentially offensive/disturbing content. The screens can be 'R Rated,' e.g., some images depict movie violence with zombies, some of the movies have Nazis as villains, and thus, some of the screenshots depict Nazi symbols. We reproduce VCR's content warning about such imagery in § A.2.
## - Does the dataset relate to people?
Yes: the corpus depicts people, and the annotations are frequently abductive inferences that relate to people. As detailed in the main body of the paper, 36% of inferences (or more) are grounded on people; and, many inferences that are not directly grounded on people may relate to them. Moreover, given that we aim to study abduction, which is an intrinsi-
cally subjective process, the annotations themselves are, at least in part, reflections of the annotators themselves.
- Does the dataset identify any subpopulations (e.g., by age, gender)?
We don't explicitly disallow identification by gender or age, e.g., in the clues/inferences, people often will use gendered pronouns or aged language in reference to people who are depicted (e.g., 'the old man'). Furthermore, while we undertook the sample/statistical toxicity analysis detailed in the main body of the paper, we have not manually verified that all 363K clue/inference pairings are free of any reference to a subpopulation. For example, we observed one case wherein an author speculated about the country-of-origin of an individual being Morroco, clued by the observation that they were wearing a fez. Like the other observations in our corpus, it's not necessarily the case that this is an objectively true inference, even if the fez is a hat that is worn in Morroco.
- Is it possible to identify individuals (i.e., one or more natural persons), either directly or indirectly (i.e., in combination with other data) from the dataset?
The data collection process specifically instructs workers to avoid identifying any individual in particular (e.g., actors in movie scenes). Instead, they are specifically instructed to use general identifiers to describe people (e.g. 'student', 'old man', 'engineer'). In our experience with working with the corpus, we haven't encountered any instances where our annotators specifically identified anyone, e.g., by name. The images contained in VCR and Visual Genome that we source from do contain uncensored images of faces. But, if images are removed from those corpora, they will be removed from Sherlock as well, as we do not plan to re-host the images ourselves.
<details>
<summary>Image 17 Details</summary>
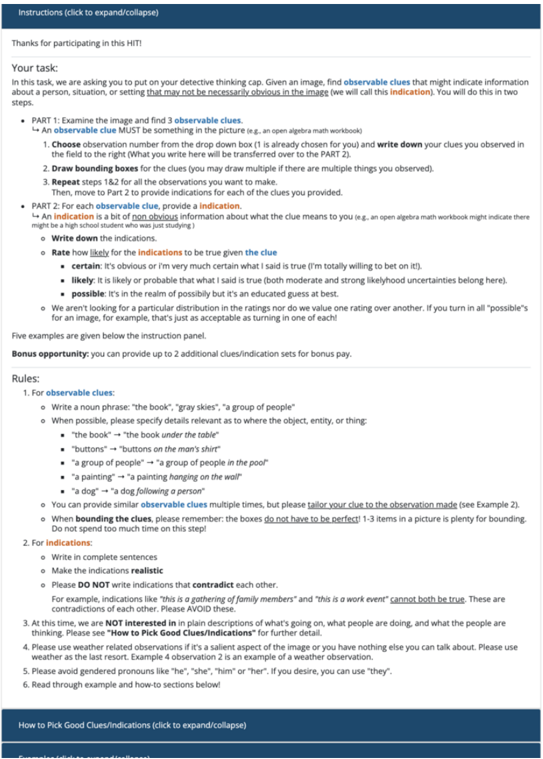
### Visual Description
## Document: Instructions for a HIT (Human Intelligence Task)
### Overview
The image presents a document outlining instructions for a crowdsourcing task, specifically a Human Intelligence Task (HIT) on a platform like Amazon Mechanical Turk. The task involves identifying observable clues within an image and making indications about what those clues might suggest. The document details the process in two parts, provides rules for identifying clues, and includes a rating scale for the certainty of indications.
### Components/Axes
The document is structured with clear headings and bullet points. Key components include:
* **Title:** "Instructions (click to expand/collapse)"
* **Introduction:** A thank you message and a brief description of the task.
* **Part 1:** Instructions for examining the image and identifying observable clues.
* **Part 2:** Instructions for providing indications based on the clues.
* **Rating Scale:** A scale for assessing the certainty of indications (certain, likely, possible).
* **Rules:** Guidelines for identifying and describing observable clues.
* **Bonus Opportunity:** Information about earning bonus points.
* **Footer:** Copyright information.
### Detailed Analysis or Content Details
Here's a transcription of the document's content, broken down by section:
**Introduction:**
"Thanks for participating in this HIT!"
**Part 1: Examine the image and find 3 observable clues.**
"An observable clue MUST be something in the picture (e.g., an open algebra math workbook)"
1. Choose observation number from the drop down box (it is already chosen for you) and write down your clues you observed in the field to the right (What you write here will be transferred over to the PART 2).
2. Draw bounding boxes for the clues (you may draw multiple if there are multiple things you observed).
3. Repeat steps 1 & 2 for all the observations you want to make.
Then, move to Part 2 to provide indications for each of the clues you provided.
**Part 2: For each observable clue, provide an indication.**
"An indication is a bit of non-obvious information about what the clue means to you (e.g., an open algebra math workbook might there might be a high school students who was just studying)."
* Write down the indications.
* Rate how likely the indications to be true given the clue.
* **certain:** it's obvious or I'm very much certain what I said is true (I'm totally willing to bet on it).
* **likely:** it is likely or probable that what I said is true (both moderate and strong likelihood uncertainties belong here).
* **possible:** it's in the realm of possibly but it's an educated guess at best.
* We aren't looking for a particular distribution in the ratings nor do we value one rating over another. You turn in all "possible" for an image, for example, that's just as acceptable as turning in one of each!
**Bonus opportunity:**
"You can provide up to 2 additional clues/indication sets for bonus pay."
**Rules:**
1. For observable clues:
* Write a noun phrase: "the book", "gray skies", "a group of people"
* When possible, please specify details relevant as to where the object, entity, or thing:
* "the book" -> "the book under the table"
* "buttons" -> "buttons on the man's shirt"
* "a group of people" -> "a group of people"
* "a painting" -> "a painting hanging on the wall"
* "a dog" -> "a dog following a person"
* You can provide any countable object on the multiple times, but please tailor your clue to the instance you seen (e.g. for example if you saw two dogs, you can say "a dog" or "dogs").
2. For indications:
* Write a complete thought/sentence.
* Do not simply restate the clue.
* Do not write too much detail.
**Example:**
* **Observable clue:** a wedding cake
* **Indication:** someone is getting married.
* **Rating:** certain
**Additional Notes:**
"If you have any questions, please contact us through the Mechanical Turk forums."
**Footer:**
"© 2014 Mechanical Turk, Inc. or its affiliates. All Rights Reserved."
### Key Observations
* The document is highly structured and provides clear, step-by-step instructions.
* The emphasis is on identifying *non-obvious* information (indications) based on observable clues.
* The rating scale allows for nuanced assessment of the certainty of indications.
* The rules are designed to ensure the quality and consistency of the responses.
* The document is geared towards a crowdsourcing platform, likely Amazon Mechanical Turk.
### Interpretation
This document outlines a task designed to leverage human pattern recognition and inference skills. The core idea is to move beyond simply identifying objects in an image (observable clues) to interpreting their potential meaning (indications). The rating scale is crucial because it acknowledges that interpretations are rarely certain and allows workers to express their confidence level. The rules are in place to prevent trivial responses (e.g., simply restating the clue) and to encourage detailed, yet concise, indications. The bonus opportunity incentivizes workers to provide additional insights.
The task is likely used for data annotation or to gather subjective assessments of images for machine learning purposes. For example, the data collected could be used to train a computer vision system to understand the context of images or to predict human reactions to visual stimuli. The document demonstrates a thoughtful approach to crowdsourcing, recognizing the importance of clear instructions, quality control, and worker motivation.
</details>
Fig. 10: Instructions for Sherlock data collection HIT.
<details>
<summary>Image 18 Details</summary>
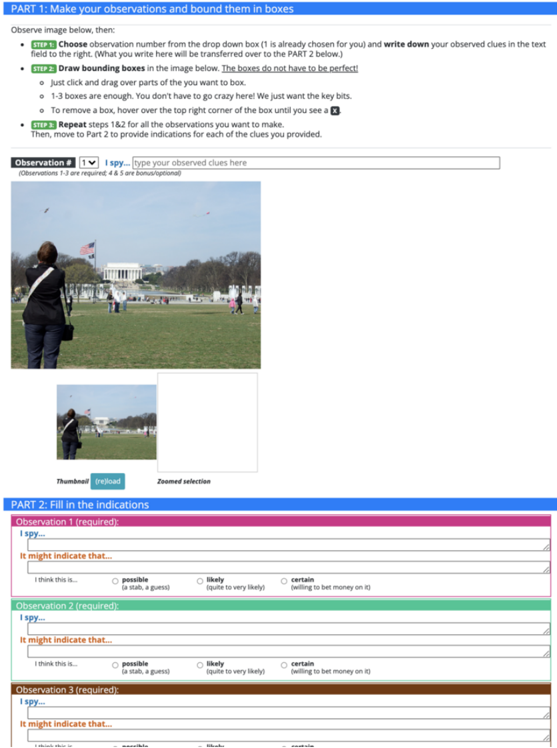
### Visual Description
\n
## Document: Observation & Indication Worksheet
### Overview
The image presents a worksheet designed for observational analysis and indication assessment. The worksheet is divided into two parts: Part 1 focuses on making observations and bounding them in boxes on an image, and Part 2 focuses on filling in indications based on those observations. The image features a photograph of a person walking with a dog in a park-like setting.
### Components/Axes
The worksheet is structured with the following components:
* **Part 1 Header:** "PART 1: Make your observations and bound them in boxes"
* **Part 1 Instructions:** A numbered list of instructions for making observations and drawing bounding boxes.
* **Part 1 Observation Selection:** A dropdown menu labeled "Observation #1" with a text field for typing observed clues. The text "(Observations # 3 & 4 & 5 are bonus/optional)" is present.
* **Part 1 Image:** A photograph of a person walking a dog. Buttons labeled "Thumbnail", "In-load", and "Zoomed selection" are present below the image.
* **Part 2 Header:** "PART 2: Fill in the indications"
* **Part 2 Observation Sections:** Three sections labeled "Observation 1 (required)", "Observation 2 (required)", and "Observation 3 (required)". Each section includes a text field labeled "I spy..." and a text field labeled "It might indicate that...".
* **Part 2 Indication Options:** Each observation section provides three radio button options: "possible (a stab, a guess)", "likely (quite to very likely)", and "certain (willing to bet money on it)".
### Detailed Analysis or Content Details
**Part 1 - Image Description:**
The photograph depicts a person, appearing to be female, walking a dog on a leash. The person is wearing a dark jacket, dark pants, and a hat. The dog is a medium-sized breed, possibly a terrier mix, and is also dark in color. The background shows trees with bare branches, suggesting it is late fall or winter. The ground is covered with leaves and some snow. The scene appears to be a park or a similar outdoor area.
**Part 1 - Instructions (Transcribed):**
1. Choose observation number from the drop down box (1 is already chosen for you) and write down your observed clues in the text field to the right. (What you write here will be transferred over to the PART 2 below.)
2. Draw bounding boxes in the image below. The boxes do not have to be perfect!
3. Just click and drag over parts of the you want to box.
4. 1-3 boxes are enough. You don't have to go crazy here! We just want the key bits.
5. To remove a box, hover over the top right corner of the box until you see a X.
6. Repeat steps 1 & 2 for all the observations you want to make. Then, move to Part 2 to provide indications for each of the clues you provided.
**Part 2 - Observation Sections:**
Each observation section has the following structure:
* **I spy...:** [Text field for observation]
* **It might indicate that...:** [Text field for indication]
* **Indication Options:**
* Possible (a stab, a guess)
* Likely (quite to very likely)
* Certain (willing to bet money on it)
The text fields are currently empty.
### Key Observations
The worksheet is designed to encourage detailed observation and reasoned inference. The inclusion of a "certain" option suggests a desire for high-confidence assessments. The bonus/optional nature of observations 4 and 5 indicates a focus on core observations.
### Interpretation
The worksheet is a tool for developing observational skills and analytical thinking. It prompts the user to move from simply noticing details (Part 1) to forming hypotheses about their meaning (Part 2). The graduated scale of confidence (possible, likely, certain) encourages careful consideration of the evidence supporting each interpretation. The image itself provides a relatively simple scene, likely chosen to allow the user to focus on the process of observation and indication rather than the complexity of the subject matter. The worksheet is likely used in an educational or training context, potentially in fields such as intelligence analysis, security, or scientific investigation. The instructions emphasize that the bounding boxes do not need to be perfect, suggesting that the focus is on identifying key elements rather than precise delineation.
</details>
Fig. 11: Template setup for Sherlock data collection HIT. Instructions are shown in Figure 10
<details>
<summary>Image 19 Details</summary>
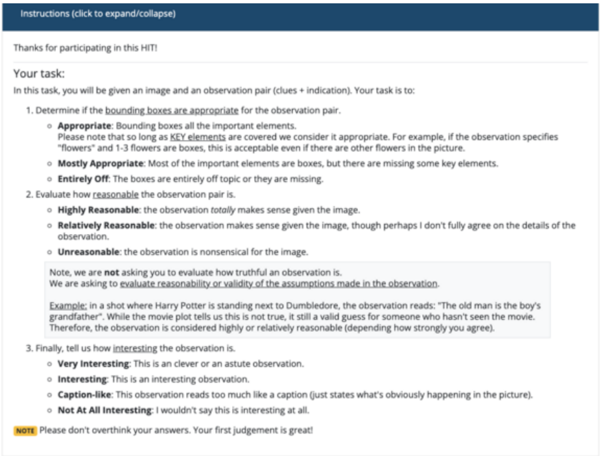
### Visual Description
\n
## Screenshot: HIT Instructions
### Overview
This is a screenshot of instructions for a Human Intelligence Task (HIT) on a platform like Amazon Mechanical Turk. The instructions detail the task of evaluating the appropriateness of bounding boxes around elements in an image and the reasonableness/interestingness of an observation related to that image. The document is primarily in English.
### Components/Axes
The screenshot is structured as a set of instructions with bullet points and nested sub-points. Key components include:
* **Title:** "Instructions (click to expand/collapse)"
* **Introductory Text:** "Thanks for participating in this HIT!"
* **Task Description:** "In this task, you will be given an image and an observation pair (clues + indication). Your task is to:"
* **Evaluation Criteria 1:** Appropriateness of bounding boxes (Appropriate, Mostly Appropriate, Entirely Off)
* **Evaluation Criteria 2:** Reasonableness of the observation (Highly Reasonable, Relatively Reasonable, Unreasonable)
* **Evaluation Criteria 3:** Interestingness of the observation (Very Interesting, Interesting, Caption-like, Not At All Interesting)
* **Note:** "Please don't overthink your answers. Your first judgement is great!"
### Detailed Analysis or Content Details
The text content is transcribed below:
"Instructions (click to expand/collapse)
Thanks for participating in this HIT!
Your task:
In this task, you will be given an image and an observation pair (clues + indication). Your task is to:
1. Determine if the bounding boxes are appropriate for the observation pair.
* Appropriate: Bounding boxes are the important elements.
Please note that so long as KEY elements are covered we consider it appropriate. For example, if the observation specifies “flowers” and 1-3 flowers are boxes, this is acceptable even if there are other flowers in the picture.
* Mostly Appropriate: Most of the important elements are boxes, but there are missing some key elements.
* Entirely Off: The boxes are entirely off topic or they are missing.
2. Evaluate how reasonable the observation pair is.
* Highly Reasonable: the observation totally makes sense given the image.
* Relatively Reasonable: the observation makes sense given the image, though perhaps I don’t fully agree on the details of the observation.
* Unreasonable: the observation is nonsensical for the image.
Note, we are not asking you to evaluate how truthful an observation is.
We are asking to evaluate reasonability or validity of the assumptions made in the observation
Example: in a short where Harry Potter is standing next to Dumbledore, the observation reads: “The old man is the boy’s grandfather.” While the movie plot tells us this is not true, it still a valid guess for someone who hasn’t seen the movie.
Therefore, the observation is considered highly or relatively reasonable (depending how strongly you agree).
3. Finally, tell us how interesting the observation is.
* Very Interesting: This is an clever or an astute observation.
* Interesting: This is an interesting observation.
* Caption-like: This observation reads too much like a caption (just states what’s obviously happening in the picture).
* Not At All Interesting: I wouldn’t say this is interesting at all.
NOTE Please don’t overthink your answers. Your first judgement is great!"
### Key Observations
The document is a procedural guide. It emphasizes that the task is not about determining the *truth* of an observation, but rather its *reasonableness* given the image. The instructions also caution against overthinking and encourage relying on initial judgment. The use of examples, like the Harry Potter scenario, clarifies the evaluation criteria.
### Interpretation
This document outlines the guidelines for a quality control task within a larger data annotation or image understanding project. The goal is to assess the quality of both bounding box annotations (identifying important elements in an image) and the logical connection between an image and a textual description (observation). The emphasis on "reasonableness" over "truth" suggests the project may be exploring subjective interpretations or dealing with ambiguous images where a single "correct" answer doesn't exist. The instructions are designed to standardize the evaluation process and minimize bias by encouraging quick, intuitive judgments. The HIT is likely part of a larger effort to train or evaluate computer vision or natural language processing models.
</details>
<details>
<summary>Image 20 Details</summary>
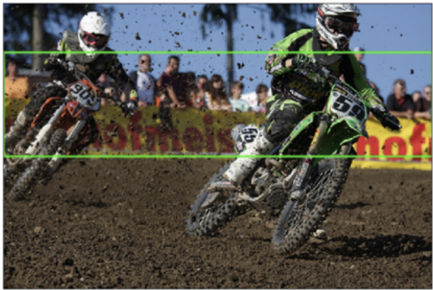
### Visual Description
\n
## Photograph: Motocross Race
### Overview
The image depicts a motocross race in progress. Two riders on dirt bikes are prominently featured, navigating a muddy track. Spectators are visible in the background. The image appears to be a snapshot taken during an active race, capturing a moment of dynamic movement.
### Components/Axes
There are no axes or legends present in this image. The primary components are the two motocross riders, their bikes, the dirt track, and the spectators in the background. A green horizontal line has been added to the image, likely for annotation or measurement purposes.
### Detailed Analysis or Content Details
The rider on the left is operating a dirt bike with the number "909" visible on its side. The rider is wearing a red and black racing suit, a white helmet with a dark visor, and gloves. The bike is kicking up a significant amount of dirt.
The rider on the right is operating a dirt bike with the number "579" visible on its side. The rider is wearing a green and black racing suit, a white helmet with a dark visor, and gloves. This bike is also kicking up dirt, and appears to be slightly ahead of the other rider.
The track is composed of dark, muddy soil. The background features a crowd of spectators and a banner with the text "hot". The green line is positioned approximately at the mid-height of the riders, and extends across the entire width of the image.
### Key Observations
The image captures a moment of intense competition. The riders are closely matched, and the conditions are challenging due to the muddy track. The presence of spectators suggests a well-attended event. The added green line does not appear to relate to any inherent feature of the scene and is likely an external annotation.
### Interpretation
The photograph showcases the excitement and physicality of motocross racing. The image conveys a sense of speed, skill, and risk. The muddy conditions highlight the demanding nature of the sport. The image likely serves to document the event or to promote motocross racing in general. The green line is an external addition and does not contribute to the inherent meaning of the photograph. It could be used for scale, comparison, or to highlight a specific aspect of the image during analysis. The banner "hot" is likely a sponsor or event name.
</details>
Fig. 12: Instructions and template setup for Sherlock data validation HIT.
<details>
<summary>Image 21 Details</summary>
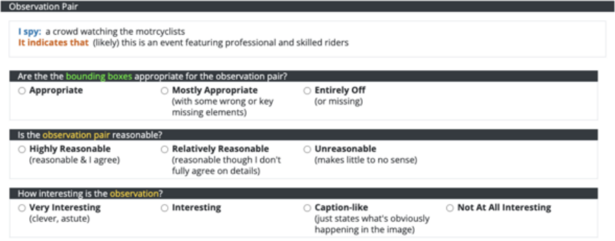
### Visual Description
\n
## Screenshot: Observation Pair Evaluation Form
### Overview
This is a screenshot of a form used to evaluate an "Observation Pair" likely related to image analysis or computer vision tasks. The form presents an observation made by a system ("I spy...") and a subsequent inference ("It indicates that..."), then asks a human evaluator to assess the quality of the observation and inference.
### Components/Axes
The form is divided into three sections, each with a question and multiple-choice answers:
1. **Bounding Box Appropriateness:**
* Question: "Are the bounding boxes appropriate for the observation pair?"
* Options:
* Appropriate
* Mostly Appropriate (with some wrong or key missing elements)
* Entirely Off (or missing)
2. **Observation Pair Reasonableness:**
* Question: "Is the observation pair reasonable?"
* Options:
* Highly Reasonable (reasonable & I agree)
* Relatively Reasonable (reasonable though I don't fully agree on details)
* Unreasonable (makes little to no sense)
3. **Observation Interest:**
* Question: "How interesting is the observation?"
* Options:
* Very Interesting (clever, astute)
* Interesting
* Caption-like (just states what's obviously happening in the image)
* Not At All Interesting
The form also includes the following text:
* **"Observation Pair"** - Title at the top.
* **"I spy: a crowd watching the motorcyclists"** - The system's observation.
* **"It indicates that (likely) this is an event featuring professional and skilled riders"** - The system's inference.
### Detailed Analysis or Content Details
The form presents a specific observation and inference pair:
* **Observation:** The system observed "a crowd watching the motorcyclists."
* **Inference:** The system inferred that "this is (likely) an event featuring professional and skilled riders."
The evaluator is asked to judge:
1. If the bounding boxes used to identify the crowd and motorcyclists are accurate.
2. If the inference logically follows from the observation.
3. How insightful or novel the inference is.
### Key Observations
The form is designed for subjective evaluation of AI-generated observations and inferences. The options provided for each question allow for nuanced feedback, ranging from complete agreement to outright disagreement. The inclusion of "likely" in the inference suggests the system is expressing a degree of uncertainty.
### Interpretation
This form is a crucial component of a human-in-the-loop system for training and evaluating computer vision models. By collecting human feedback on the quality of observations and inferences, developers can improve the model's ability to understand and interpret images. The questions target different aspects of the model's performance: accuracy (bounding box appropriateness), logical reasoning (reasonableness), and creativity/insightfulness (interest). The form's structure suggests a focus on moving beyond simple object recognition to more complex scene understanding and inference. The specific example provided (crowd watching motorcyclists) indicates the system is being tested on its ability to recognize events and infer the skills of the participants.
</details>
<details>
<summary>Image 22 Details</summary>
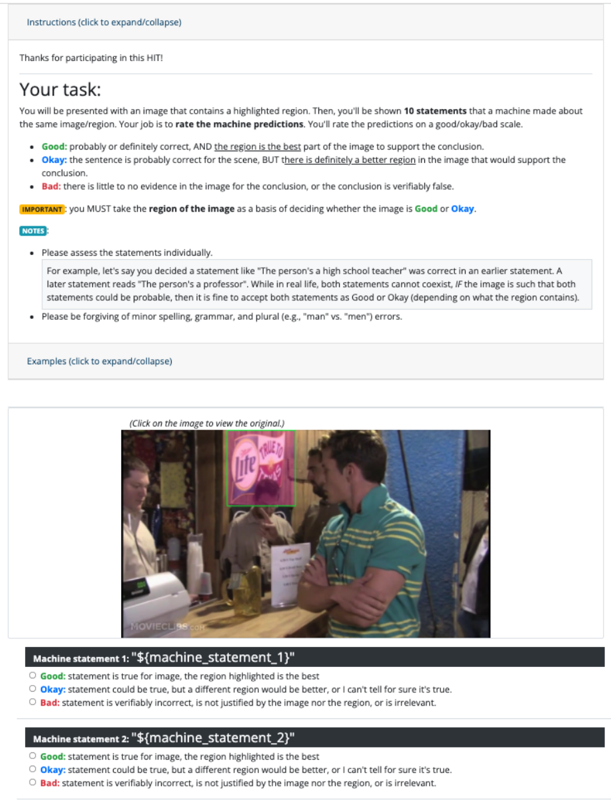
### Visual Description
\n
## Screenshot: Mechanical Turk HIT Instructions & Example
### Overview
This is a screenshot of a Mechanical Turk (MTurk) Human Intelligence Task (HIT) interface. The HIT instructs workers to evaluate statements made by a machine about a given image region, rating them as "Good," "Okay," or "Bad" based on how well the region supports the statement. The screenshot includes instructions, notes, examples, and a sample image with associated statements.
### Components/Axes
The screenshot is divided into several sections:
* **Header:** Contains the HIT instructions, thanking the participant and outlining the task.
* **Notes:** Provides additional guidance on assessing statements, including handling contradictory statements and minor errors.
* **Examples:** Shows a sample image and two machine-generated statements with radio button options for rating.
* **Image Region:** A highlighted rectangular region within a photograph of a grocery store shelf.
* **Statement Blocks:** Two blocks, each containing a machine-generated statement and three radio button options for evaluation.
### Detailed Analysis or Content Details
**Header Text (Transcription):**
"Instructions (click to expand/collapse)
Thanks for participating in this HIT!
Your task:
You will be presented with an image that contains a highlighted region. Then, you'll be shown 10 statements that a machine made about the same image/region. Your job is to rate the machine predictions on a good/okay/bad scale.
* **Good:** probably or definitely correct. AND the region is the best part of the image to support the conclusion.
* **Okay:** the sentence is probably correct for the scene, BUT there is definitely a better region in the image that would support the conclusion.
* **Bad:** there is little to no evidence in the image for the conclusion, or the conclusion is verifiably false.
**IMPORTANT:** you MUST take the region of the image as a basis of deciding whether the image is Good or Okay.
**NOTES:**
* Please assess the statements individually.
* For example, let's say you decided a statement like "The person is a high school teacher" was correct in an earlier statement. A later statement reads "The person's a professor." While in real life, both statements cannot coexist, if the image is such that both statements could be probable, then it is fine to accept both statements as Good or Okay (depending on what the region contains).
* Please be forgiving of minor spelling, grammar, and plural (e.g., "man" vs. "men") errors."
**Example Image Description:**
The image shows a section of a grocery store shelf. Visible products include:
* "lite" brand milk cartons (approximately 3 visible)
* "Hormel" brand products (approximately 2 visible)
* "HomeStyle" brand products (approximately 2 visible)
* Other various packaged goods.
The highlighted region is a rectangle encompassing a portion of the shelf with the "lite" milk cartons and some of the "Hormel" products.
**Statement 1 (Transcription):**
"Machine statement 1: ${machine_statement_1}"
* ○ Good: statement is true for image, the region highlighted is the best
* ○ Okay: statement could be true, but a different region would be better, or I can't tell for sure it's true.
* ○ Bad: statement is verifiably incorrect, is not justified by the image nor the region, or is irrelevant.
**Statement 2 (Transcription):**
"Machine statement 2: ${machine_statement_2}"
* ○ Good: statement is true for image, the region highlighted is the best
* ○ Okay: statement could be true, but a different region would be better, or I can't tell for sure it's true.
* ○ Bad: statement is verifiably incorrect, is not justified by the image nor the region, or is irrelevant.
### Key Observations
* The HIT emphasizes evaluating statements *based on the highlighted region* of the image, not the entire image.
* The instructions acknowledge potential ambiguity and the need for forgiveness regarding minor errors.
* The example image is a typical grocery store scene, likely chosen for its common objects and potential for varied statements.
* The statements are placeholders ("${machine\_statement\_1}", "${machine\_statement\_2}"), indicating that the actual statements will be dynamically generated for each HIT instance.
### Interpretation
This HIT is designed to assess the accuracy of a machine vision system's ability to generate statements about image regions. The task requires human workers to act as "ground truth" evaluators, determining whether the machine's statements are supported by the visual evidence within the specified region. The "Good," "Okay," and "Bad" rating scale allows for nuanced evaluation, acknowledging that a statement might be true but not optimally supported by the highlighted region. The instructions highlight the importance of focusing on the region, suggesting that the machine vision system may be generating statements based on specific areas of interest within a larger image. The use of placeholders for the statements indicates a system that can generate a variety of descriptions for different images. This is a common approach in evaluating and improving the performance of image captioning or visual reasoning models. The HIT is a form of weak supervision, where human labels are used to train or refine a machine learning model.
</details>
<details>
<summary>Image 23 Details</summary>
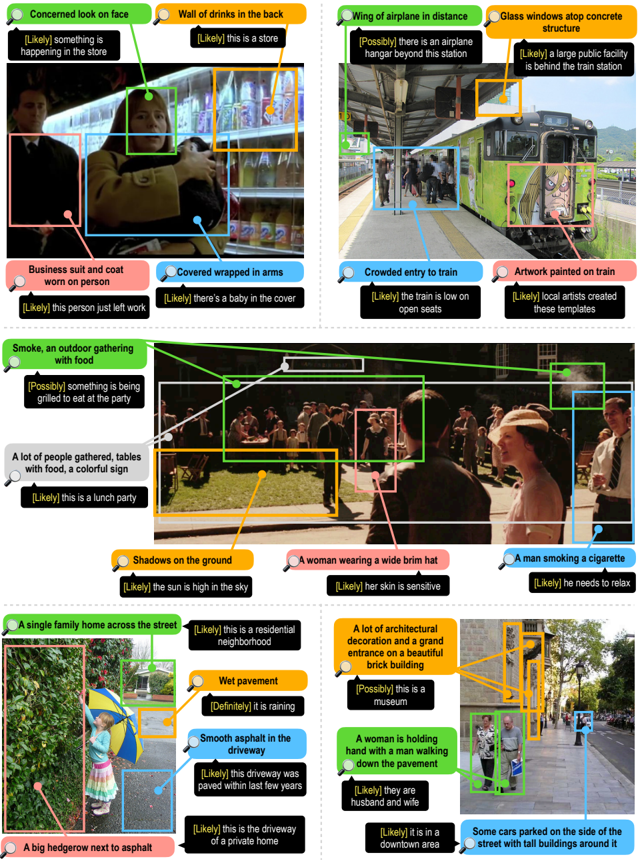
### Visual Description
\n
## Image Analysis: Scene Annotations
### Overview
The image presents a collection of annotated scenes, appearing to be stills from a video or a series of photographs. Each scene is enclosed in a yellow bounding box with a textual description above it, including a confidence level indicated by bracketed phrases like "[Likely]" or "[Definitely]". The annotations describe various elements within each scene, suggesting an attempt to interpret the context and activities occurring.
### Components/Axes
There are no axes or traditional chart components. The image is organized as a grid of scenes, each with its own annotation. The annotations themselves consist of a descriptive phrase and a confidence level.
### Detailed Analysis or Content Details
Here's a transcription of each annotation, along with its associated scene:
1. **Concerned look on face:** "[Likely] something is happening in the store."
2. **Wall of drinks in the back:** "[Likely] this is a store."
3. **Wing of airplane in distance:** "[Possibly] there is an airplane hangar beyond this station."
4. **Glass windows atop concrete structure:** "[Likely] a large public facility is behind the train station."
5. **Business suit and coat worn on person:** "[Likely] this person just left work."
6. **Covered wrapped in arms:** "[Likely] there's a baby in the cover."
7. **Crowded entry to train:** "[Likely] the train is low on open seats."
8. **Artwork painted on train:** "[Likely] local artists created these templates."
9. **Smoke, an outdoor gathering with food:** "[Possibly] something is being grilled to eat at the party."
10. **A lot of people gathered, tables with food, a colorful quilt:** "[Likely] this is a lunch party."
11. **Shadows on the ground:** "[Likely] the sun is high in the sky."
12. **A woman wearing a wide brim hat:** "[Likely] her skin is sensitive."
13. **A man smoking a cigarette:** "[Likely] he needs to relax."
14. **A single family home across the street:** "[Likely] this is a residential neighborhood."
15. **Wet pavement:** "[Definitely] it is raining."
16. **A lot of architectural decoration and a grand entrance on a beautiful brick building:** "[Possibly] this is a museum."
17. **Smooth asphalt in the driveway:** "[Likely] this driveway was paved within last few years."
18. **A woman is holding hand with a man walking down the pavement:** "[Likely] they are husband and wife."
19. **A big hedgerow next to asphalt:** "[Likely] this is the driveway of a private home."
20. **Some cars parked on the side of the street with tall buildings around it:** "[Likely] it is in a downtown area."
### Key Observations
* The annotations are subjective interpretations of the scenes, with varying degrees of confidence.
* The annotations frequently use the word "[Likely]", indicating a degree of uncertainty.
* The scenes depict a variety of everyday situations, including shopping, commuting, social gatherings, and residential areas.
* The annotations suggest an attempt to infer activities or characteristics based on visual cues.
* The annotations are not quantitative; they are purely descriptive.
### Interpretation
The image appears to be part of a dataset used for training a computer vision model to understand and interpret scenes. The annotations provide ground truth labels for the model, allowing it to learn to associate visual features with contextual information. The varying confidence levels suggest that some scenes are more easily interpreted than others. The annotations demonstrate the challenges of scene understanding, as even seemingly simple scenes can be open to multiple interpretations. The annotations are not based on facts or data, but rather on interpretations of the scenes. The image is a demonstration of the need for human-level reasoning in computer vision. The annotations are a form of qualitative data, providing insights into the subjective nature of scene understanding. The annotations are a form of "common sense" knowledge, which is difficult to encode into a computer program. The annotations are a form of "situated cognition," meaning that the interpretation of a scene depends on the context in which it is viewed. The annotations are a form of "grounded cognition," meaning that the interpretation of a scene is based on sensory experience.
</details>
Fig. 13: Instructions and template setup for Sherlock model evaluation HIT.
<!-- image -->
<!-- image -->
Fig. 14: Examples of clues and inference pair annotations in Sherlock over images from Visual Genome and VCR. For each observation pair , an inference (speech bubble) is grounded in a concrete clue (color bubble) present in an image. confidence score (in the order of decreasing confidence: 'Definitely' > 'Likely' > 'Possibly') for each inference is shown in yellow.
<!-- image -->