## Diffusion Causal Models for Counterfactual Estimation
Pedro Sanchez
Sotirios A. Tsaftaris The University of Edinburgh
Editors: Bernhard Sch¨ olkopf, Caroline Uhler and Kun Zhang
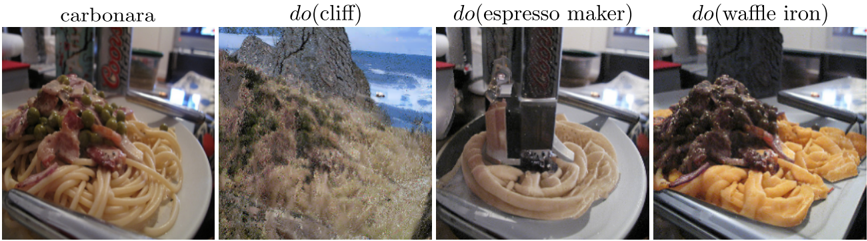
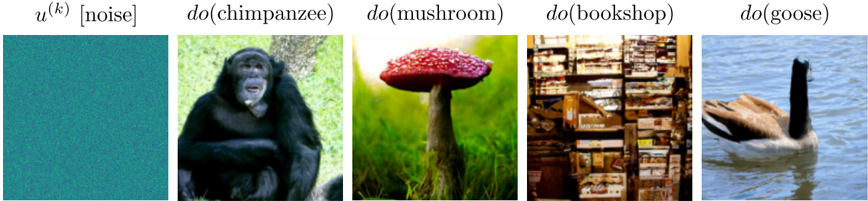
Figure 1: Counterfactuals on ImageNet 256x256 generated by Diff-SCM. From left to right : a random image sampled from the data distribution and its counterfactuals do ( class ) , corresponding to 'how the image should change in order to be classified as another class?'.
<details>
<summary>Image 1 Details</summary>
### Visual Description
## Image: Four Object Recognition Examples
### Overview
The image presents four separate photographs, each depicting a different object or scene. Each image has a label above it indicating the object or scene it represents. The objects/scenes are: carbonara, a cliff, an espresso maker, and a waffle iron.
### Components/Axes
* **Labels:**
* "carbonara" (top-left)
* "do(cliff)" (top-center-left)
* "do(espresso maker)" (top-center-right)
* "do(waffle iron)" (top-right)
### Detailed Analysis
* **Carbonara:** The image shows a plate of spaghetti carbonara with visible ingredients like pasta, bacon, peas, and sauce. There is a can of Coors beer in the background.
* **do(cliff):** The image shows a cliff overlooking the ocean. There is vegetation on the cliffside. A small boat is visible on the water.
* **do(espresso maker):** The image shows an espresso maker pressing down on what appears to be a waffle. The waffle is on a plate.
* **do(waffle iron):** The image shows a waffle iron with waffles on a plate. The waffles are topped with a dark topping, possibly meat or fruit.
### Key Observations
* The labels above each image are in a consistent font and style.
* The images appear to be taken in indoor settings, except for the cliff image.
* The "do()" prefix in the labels for cliff, espresso maker, and waffle iron is unusual and might indicate a specific naming convention or experimental setup.
### Interpretation
The image likely showcases the results of an object recognition system or experiment. The "do()" prefix might be part of a function call or a notation used in the experiment. The image demonstrates the system's ability to identify different objects and scenes, including food items, natural landscapes, and kitchen appliances. The quality of the object recognition cannot be determined from the image alone.
</details>
## Abstract
We consider the task of counterfactual estimation from observational imaging data given a known causal structure. In particular, quantifying the causal effect of interventions for highdimensional data with neural networks remains an open challenge. Herein we propose Diff-SCM, a deep structural causal model that builds on recent advances of generative energy-based models. In our setting, inference is performed by iteratively sampling gradients of the marginal and conditional distributions entailed by the causal model. Counterfactual estimation is achieved by firstly inferring latent variables with deterministic forward diffusion, then intervening on a reverse diffusion process using the gradients of an anti-causal predictor w.r.t the input. Furthermore, we propose a metric for evaluating the generated counterfactuals. We find that Diff-SCM produces more realistic and minimal counterfactuals than baselines on MNIST data and can also be applied to ImageNet data. Code is available https://github.com/vios-s/Diff-SCM .
## 1. Introduction
The notion of applying interventions in learned systems has been gaining significant attention in causal representation learning (Scholkopf et al., 2021). In causal inference, relationships between variables are directed. An intervention on the cause will change the effect, but not the other way around. This notion goes beyond learning conditional distributions p ( x ( k ) | x ( j ) ) based on the data alone, as in the classical statistical learning framework (Vapnik, 1999). Building causal models implies capturing the underlying physical mechanism that generated the data into a model (Pearl,
PEDRO.SANCHEZ@ED.AC.UK
## SANCHEZ TSAFTARIS
2009). As a result, one should be able to quantify the causal effect of a given action. In particular, when an intervention is applied for a given instance, the model should be able the generate hypothetical scenarios. These are the so-called counterfactuals .
Building causal models that quantify the effect of a given action for a given causal structure and available data is referred to as causal estimation . However, estimating the effect of interventions for high-dimensional data remains an open problem (Pawlowski et al., 2020; Yang et al., 2021). While machine learning is a powerful tool for learning relationships between high-dimensional variables, most causal estimation methods using neural networks (Johansson et al., 2016; Louizos et al., 2017; Shi et al., 2019; Du et al., 2021) are only applied in semi-synthetic low-dimensional datasets (Hill, 2012; Shimoni et al., 2018). Therefore, causal estimation through learning deep neural networks for high-dimensional variables remains a desired quest. We show that we can estimate the effect of interventions by generating counterfactuals on imaging datasets, as illustrated in Fig. 1.
Herein, we leverage recent advances in generative energy based models (EBMs) (Song et al., 2021b; Ho et al., 2020) to devise approaches for causal estimation. This formulation has two key advantages: (i) the stochasticity of the diffusion process relates to uncertainty-aware causal models; and (ii) the iterative sampling can be naturally extended for applying interventions. Additionally, we propose an algorithm for counterfactual inference and a metric for evaluating the results. In particular, we use neural networks that learn to reverse a diffusion process (Ho et al., 2020) via denoising. These models are trained to approximate the gradient of a log-likelihood of a distribution w.r.t. the input. We also employ neural networks that are learned in the anti-causal direction (Sch¨ olkopf et al., 2012; Kilbertus et al., 2018) to sample via the causal mechanisms. We use the gradients of these anti-causal predictors for applying interventions in specific variables during sampling. Counterfactual estimation is possible via a deterministic version of diffusion models (Song et al., 2021a) which recovers manipulable latent spaces from observations. Finally, the counterfactuals are generated iteratively using Markov Chain Monte Carlo (MCMC) algorithms.
In summary, we devise a framework for causal effect estimation with high-dimensional variables based on diffusion models entitled Diff-SCM. Diff-SCM behaves as a structured generative model where one can sample from the interventional distribution as well as estimate counterfactuals. Our contributions: (i) We propose a theoretical framework for causal modeling using generative diffusion models and anti-causal predictors (Sec. 3.2). (ii) We investigate how anti-causal predictors can be used for applying interventions in the causal direction (Sec. 3.3). (iii) We propose an algorithm for counterfactual estimation using Diff-SCM (Sec. 3.4). (iv) We propose a metric term counterfactual latent divergence for evaluating the minimality of the generated counterfactuals (Sec. 5.2). We use this metric to compared our method with the selected baselines and hyperparameter search (Sec. 5.3)
## 2. Background
## 2.1. Generative Energy-Based Models
A family of generative models based on diffusion processes (Sohl-Dickstein et al., 2015; Ho et al., 2020; Song et al., 2021b) has recently gained attention even achieving state-of-the-art image generation quality (Dhariwal and Nichol, 2021).
In particular, Denoising Diffusion Probabilistic Models (DDPMs) (Ho et al., 2020) consist in learning to denoise images that were corrupted with Gaussian noise at different scales. DDPMs are defined in terms of a forward Markovian diffusion process. This process gradually adds Gaussian
noise, with a time-dependent variance β t ∈ [0 , 1] , to a data point x 0 ∼ p data ( x ) . Thus, the latent variable x t , with t ∈ [0 , T ] , is learned to correspond to versions of x 0 perturbed by Gaussian noise following p ( x t | x 0 ) = N ( x t ; √ α t x 0 , (1 -α t ) I ) , where α t := ∏ t j =0 (1 -β j ) and I is the identity matrix.
As such, p ( x t ) = ∫ p data ( x ) p ( x t | x )d x should approximate the data distribution p ( x 0 ) ≈ p data at time t = 0 and a zero centered Gaussian distribution at time t = T . Generative modelling is achieved by learning to reverse this process using a neural network θ trained to denoise images at different scales β t . The denoising model effectively learns the gradient of a log-likelihood w.r.t. the observed variable ∇ x log p ( x ) (Hyv¨ arinen, 2005).
Training. With sufficient data and model capacity, the following training procedure ensures that the optimal solution to ∇ x log p t ( x ) can be found by training θ to approximate ∇ x log p t ( x t | x 0 ) . The training procedure can be formalised as
<!-- formula-not-decoded -->
Inference. Once the model θ is learned using Eq. 1, generating samples consists in starting from x T ∼ N ( 0 , I) and iteratively sampling from the reverse Markov chain following:
<!-- formula-not-decoded -->
We note that, in the DDPM setting, z is re-sampled at each iteration. Diffusion models are Markovian and stochastic by nature. As such, they can be defined as a stochastic differential equation (SDE) (Song et al., 2021b). We adopt the time-dependent notation from Song et al. (2021b) as it will be useful for the connection with causal models in Sec. 3.2.
## 2.2. Causal Models
Counterfactuals can be understood from a formal perspective using the causal inference formalism (Pearl, 2009; Peters et al., 2017; Scholkopf et al., 2021). Structural Causal Models (SCM) G := ( S , p U ) consist of a collection S = ( f (1) , f (2) , ...., f ( K ) ) of structural assignments (so-called mechanisms ), defined as
<!-- formula-not-decoded -->
where X = { x (1) , x (2) , ..., x ( K ) } are the known endogenous random variables, pa ( k ) is the set of parents of x ( k ) (its direct causes) and U = { u (1) , u (2) , ..., u ( K ) } are the exogenous variables. The distribution p ( U ) of the exogenous variables represents the uncertainty associated with variables that were not taken into account by the causal model. Moreover, variables in U are mutually independent following the joint distribution:
<!-- formula-not-decoded -->
These structural equations can be defined graphically as a directed acyclic graph. Vertices are the endogenous variables and edges represent (directional) causal relationships between them. In particular, there is a joint distribution p G ( X ) = ∏ K k =1 p ( x ( k ) | pa ( k ) ) which is Markov related to G . In other words, the SCM G represents a joint distributions over the endogenous variables. A graphical example of a SCM is depicted on the left part of Fig. 2. Finally, SCMs should comply to what is known as Pearl's Causal Hierarchy (see Appendix B for more details).
## 3. Causal Modeling with Diffusion Processes
## 3.1. Problem Statement
In this work, we build a causal model capable of estimating counterfactuals of high-dimensional variables. We will base our work on three assumptions: (i) The SCM is known and the intervention is identifiable. (ii) The variables over which the counterfactuals will be estimated need to contain enough information to recover their causes; i.e. an anti-causal predictor can be trained. (iii) All endogenous variables in the training set are annotated.
Notation. We use x ( k ) t is the k th endogenous random variable in a causal graph G at diffusion time t . x ( k ) t,i is a sample i ∈ [ CF , F ] (F and CF being factual and counterfactual respectively) from x ( k ) t . Whenever t is omitted, it should be considered zero, i.e. the sample is not corrupted with Gaussian noise. an ( k ) for the ancestors, with pa ( k ) ⊂ an ( k ) , and de ( k ) for the descendants of x ( k ) in G .
## 3.2. Diff-SCM: Unifying Diffusion Processes and Causal Models
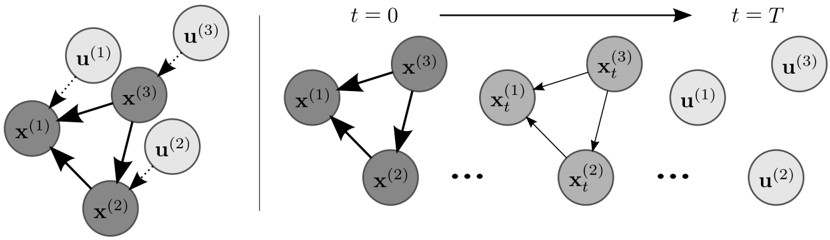
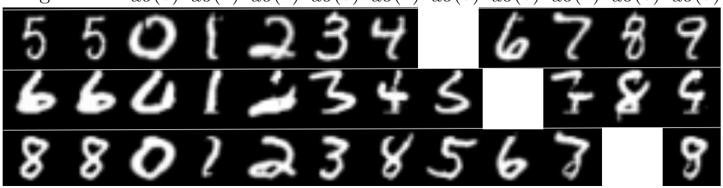
Figure 2: Illustration of a diffusion process as weakening of causal relationships. Left: Example of a SCM with endogenous variables x ( k ) and respective exogenous variables u ( k ) . Right: The diffusion process weakens the relationship between endogenous variables until they become completely independent at t = T . Arrows with solid lines indicate the causal relationship between variables and direction, while the thickness of the arrow indicates strength of the relation. Note that time t is a fiction used as reference for the diffusion process and is not a causal variable.
<details>
<summary>Image 2 Details</summary>
### Visual Description
## Diagram: System State Evolution
### Overview
The image depicts the evolution of a system's state over time, represented by interconnected nodes. The diagram is divided into three stages: an initial state, an intermediate state at time t=0, and a final state at time t=T. The nodes represent system states (x) and external inputs (u), with arrows indicating dependencies or influences between them.
### Components/Axes
* **Nodes:** Represented by circles, labeled as x<sup>(i)</sup> for system states and u<sup>(i)</sup> for external inputs, where i = 1, 2, or 3.
* **Arrows:** Indicate dependencies or influences between nodes. Solid arrows represent direct influence, while dotted arrows represent a weaker or less direct influence.
* **Time:** The diagram progresses from left to right, showing the system's evolution over time. The stages are labeled as initial state, t=0, and t=T.
* **Colors:** Dark gray nodes represent system states (x), while light gray nodes represent external inputs (u).
### Detailed Analysis
**Initial State (Leftmost Diagram):**
* Three state nodes: x<sup>(1)</sup>, x<sup>(2)</sup>, and x<sup>(3)</sup>, all in dark gray.
* Three input nodes: u<sup>(1)</sup>, u<sup>(2)</sup>, and u<sup>(3)</sup>, all in light gray.
* x<sup>(3)</sup> influences x<sup>(1)</sup> and x<sup>(2)</sup>.
* x<sup>(1)</sup> influences x<sup>(2)</sup>.
* u<sup>(1)</sup> influences x<sup>(1)</sup> (dotted arrow).
* u<sup>(2)</sup> influences x<sup>(2)</sup> (dotted arrow).
* u<sup>(3)</sup> influences x<sup>(3)</sup> (dotted arrow).
**State at t=0 (Middle Diagram):**
* Three state nodes: x<sup>(1)</sup>, x<sup>(2)</sup>, and x<sup>(3)</sup>, all in dark gray.
* x<sup>(3)</sup> influences x<sup>(1)</sup> and x<sup>(2)</sup>.
* x<sup>(1)</sup> influences x<sup>(2)</sup>.
* No input nodes are shown at this stage.
**State at t=T (Rightmost Diagram):**
* Three state nodes: x<sub>t</sub><sup>(1)</sup>, x<sub>t</sub><sup>(2)</sup>, and x<sub>t</sub><sup>(3)</sup>, all in dark gray.
* Three input nodes: u<sup>(1)</sup>, u<sup>(2)</sup>, and u<sup>(3)</sup>, all in light gray.
* x<sub>t</sub><sup>(3)</sup> influences x<sub>t</sub><sup>(2)</sup>.
* x<sub>t</sub><sup>(1)</sup> influences x<sub>t</sub><sup>(2)</sup>.
* The "..." notation indicates that there may be intermediate states or processes between t=0 and t=T.
### Key Observations
* The system's state evolves over time, with dependencies between state variables.
* External inputs influence the initial state, but their influence is not explicitly shown at t=0.
* The diagram suggests a dynamic system where the state at one time step influences the state at the next.
* The dotted arrows indicate a weaker or less direct influence of the inputs on the states.
### Interpretation
The diagram illustrates a system where the state variables (x) are interconnected and influenced by external inputs (u). The evolution of the system from the initial state to t=0 and finally to t=T shows how the dependencies between the state variables and the external inputs change over time. The "..." notation suggests that the system's evolution may involve complex dynamics or intermediate states that are not explicitly shown in the diagram. The diagram could represent a control system, a physical process, or any other system where the state variables are influenced by external factors and each other. The dotted arrows could represent feedback loops or indirect influences.
</details>
SCMs have been associated with ordinary (Mooij et al., 2013; Rubenstein et al., 2018) and stochastic (Sokol and Hansen, 2014; Bongers and Mooij, 2018) differential equations as well as other types of dynamical systems (Blom et al., 2020). In these cases, differential equations are useful for modeling time-dependent problems such as chemical kinetics or mass-spring systems. From the energy-based models perspective, Song et al. (2021b) unify denoising diffusion models (Sohl-Dickstein et al., 2015; Ho et al., 2020) and denoising score models (Song and Ermon, 2019) into a framework based on SDEs. In Song et al. (2021b), SDEs are used for formalising a diffusion process in a continuous manner where a model is learned to reverse the SDE in order to generate images.
Here, we unify the SDE framework with causal models. Diff-SCM models the dynamics of causal variables as an Ito process x ( k ) t , ∀ t ∈ [0 , T ] (Øksendal, 2003; S¨ arkk¨ a and Solin, 2019) going
from an observed endogenous variable x ( k ) 0 = x ( k ) to its respective exogenous noise x ( k ) T = u ( k ) and back. In other words, we formulate the forward diffusion as a gradual weakening of the causal relations between variables of a SCM , as illustrated in Fig. 2.
The diffusion forces the exogenous noise u ( j ) corresponding to a variable x ( j ) of interest to be independent of other u ( i ) , ∀ i = j , following the constraints from Eq. 4. The Brownian motion (diffusion) leads to a Gaussian distribution, which can be seen as a prior. Analogously, the original joint distribution entailed by the SCM p G ( X ) diffuses to independent Gaussian distributions equivalent to p ( U ) . As such, the time-dependent joint distribution p ( X t ) , ∀ t ∈ [0 , T ] have as bounds p ( X T ) = p ( U ) and p ( x 0 ) = p G ( X ) . Note that p ( X t ) refers to time-dependent distribution over all causal variables x ( k ) .
We follow Song et al. (2021b) in defining the diffusion process from Sec. 2.1 in terms of an SDE. Since SDEs are stochastic processes, their solution follows a certain probability distribution instead of a deterministic value. By constraining this distribution to be the same as the distribution p G ( X ) entailed by an SCM G , we can define a deep structural causal model (DSCM) as a set of SDEs (one for each node k ):
<!-- formula-not-decoded -->
Here, w denotes the Wiener process (or Brownian motion). The first part of the SDE ( -1 2 β t x ( k ) ) is known as drift function (S¨ arkk¨ a and Solin, 2019) 1 .
The generative process is the solution of the reverse-time SDE from Eq. 6 in time. This process is done by iteratively updating the exogenous noise x ( k ) T = u ( k ) with the gradient of the data distribution w.r.t. the input variable ∇ x ( k ) t log p ( x ( k ) t ) , until it becomes x ( k ) 0 = x ( k ) with:
<!-- formula-not-decoded -->
The reverse SDE can, therefore, be considered as the process of strengthening causal relations between variables. More importantly, the iterative fashion of the generative process (reverse SDE) is ideal in a causal framework due to the flexibility of applying interventions. We refer the reader to Song et al. (2021b) for a detailed description and proofs of SDE formulation for score-based diffusion models.
## 3.3. How to Apply Interventions with Anti-Causal Predictors?
An interesting result of Eq. 6 is that one only needs the gradients of the distribution entailed by the SCM p G for sampling. This allows learning of the anti-causal conditional distributions p G -and applying interventions with the causal mechanism. This can be useful when anti-causal learning is more straightforward (Sch¨ olkopf et al., 2012). In these cases, one would train classifiers in the anti-causal direction for each edge and diffusion models for each node (over which one wants to
1. The drift function can potentially be used to define temporal relations between variables as in Rubenstein et al. (2018) and Blom et al. (2020).
## SANCHEZ TSAFTARIS
measure the effect of interventions) in the graph. Then, one might use the gradients of the classifiers and diffusion models to propagate the intervention in the causal direction over the nodes. Following this idea, proposition 1 arises as a result of Eq. 6.
Proposition 1 (Interventions as anti-causal gradient updates) We consider the SCM G and a variable x ( j ) ∈ an ( k ) . The effect observed on x ( k ) caused by an intervention on x ( j ) , p G ( x ( k ) | do ( x ( j ) = x ( j ) )) , is equivalent to solving a reverse-diffusion process for x ( k ) t . Since the sampling process involves taking into account the distribution entailed by G , it is guided by the gradient of an anti-causal predictor w.r.t. the effect when the cause is assigned a specific value:
<!-- formula-not-decoded -->
Proposition 1 respects the principle of independent causal mechanisms (ICM) 2 (Peters et al., 2017; Sch¨ olkopf et al., 2012). It implies independence between the cause distribution and the mechanism producing the effect distribution. As shown in Eq. 7, sampling with the causal mechanism does not require the distribution of the cause p ( x ( j ) ) (Scholkopf et al., 2021).
## 3.4. Counterfactual Estimation with Diff-SCM
Apowerful consequence of building causal models, following Pearl's Causal Hierarchy , is the estimation of counterfactuals. Counterfactuals are hypothetical scenarios for a given factual observation under a local intervention. Estimation of counterfactuals differentiates of sampling from an interventional distribution because the changes are applied for a given observation. As detailed in Pearl (2016), sec. 4.2.4, counterfactual estimation requires three steps: (i) abduction of exogenous noise - forward diffusion with DDIM algorithm (Song et al., 2021a) following Alg. 3 in Appendix D; (ii) action - graph mutilation by erasing the edges between the intervened variable and its parents; (iii) prediction - reverse diffusion controlled by the gradients of an anti-causal classifier.
Here, we are interested in estimating x ( k ) CF based on the observed (factual) x ( k ) F for the random variable x ( k ) after assigning a value x ( j ) CF to x ( j ) ∈ an ( k ) , i.e. applying an intervention do ( x ( j ) = x ( j ) CF ) . It's equivalent to sample from counterfactual distribution p G ( x ( k ) | do ( x ( j ) = x ( j ) CF ); x ( k ) = x ( k ) F ) . We will consider a setting where only x ( j ) and x ( k ) are present in the graph as a simplifying assumption for Alg. 1. Considering only two variables removes the need for the graph mutilation explained above. It is also the setting used in our experiments. We will leave an extension to more complex SCMs for future work. We detail in Alg. 1 how abduction of exogenous noise and prediction is done.
Abduction of Exogenous Noise. The first step for estimating a counterfactual is the abduction of exogenous noise. Note from Eq. 3 that the value of a causal variable depends both on its parents and on its respective exogenous noise. From a deep learning perspective (Pawlowski et al., 2020), one might consider the exogenous u ( k ) an inferred latent variable. The prior p ( u ( k ) ) of u ( k ) in Diff-SCM is a Gaussian as detailed in Sec. 3.2.
With diffusion models, abduction can be done with a derivation done by Song et al. (2021a) and Song et al. (2021b). Both works make a connection between diffusion models and neural ODEs (Chen et al., 2018). They show that one can obtain a deterministic inference system while training
2. The principle states that 'The causal generative process of a system's variables is composed of autonomous modules that do not inform or influence each other.'
with a diffusion process, which is stochastic by nature. This formulation allows the process to be invertible by recovering a latent space u ( k ) by performing the forward diffusion with the learned model. The algorithm for recovering u ( k ) is highlighted as the first box in Alg. 1.
Prediction under Intervention. Once the abduction of exogenous noise u ( k ) is done for a given factual observation x ( k ) F , counterfactual estimation consists in applying an intervention in the reverse diffusion process with the gradients of an anti-causal predictor. In particular, we use the formulation of guided DDIM from Dhariwal and Nichol (2021) which forms the second part of Alg. 1.
Controlling the Intervention. There are three main factors contributing for the counterfactual estimation in Alg. 1: (i) The inferred u ( k ) keeps information about the factual observation; (ii) ∇ x ( k ) t log p φ ( x ( j ) CF | x ( k ) t ) guide the intervention towards the desired counterfactual class; and (iii) θ ( x ( k ) t , t ) forces the estimation to belong to the data distribution. We follow Dhariwal and Nichol (2021) in adding an hyperparameter s which controls the scale of ∇ x ( k ) t log p φ ( x ( j ) CF | x ( k ) t ) . High values of s might result in counterfactuals that are too different from the factual data. We show this empirically and discuss the effects of this hyperparameter in Sec. 5.3.
Algorithm 1 Inference of counterfactual for a variable x ( k ) from an intervention on x ( j ) ∈ an ( k )
Models: trained diffusion model θ and anti-causal predictor p φ ( x ( j ) | x ( k ) t )
Input : factual variable x ( k ) 0 , F , target intervention x ( j ) 0 , CF , scale s
Output: counterfactual x ( k ) 0 , CF
Abduction of Exogenous Noise - Recovering u ( k ) from x ( k ) 0 , F
<!-- formula-not-decoded -->
## Generation under Intervention
<!-- formula-not-decoded -->
## 4. Related Work
Generative EBMs. Our generative framework is inspired on the energy based models literature (Ho et al., 2020; Song et al., 2021b; Du and Mordatch, 2019; Grathwohl et al., 2020). In particular, we leverage the theory around denoising diffusion models (Sohl-Dickstein et al., 2015; Ho et al.,
## SANCHEZ TSAFTARIS
2020; Nichol and Dhariwal, 2021). We take advantage of a non-Markovian definition DDIM (Song et al., 2021a) which allows faster sampling and recovering latent spaces from observations. Our theory connecting diffusion models and SDEs follows Song et al. (2021b), but from a different perspective. Even though Du et al. (2020) are not constrained to causal modeling, they also use the idea of guiding the generation with gradient of conditional energy models. Recently, Sinha et al. (2021) proposed a version of diffusion models for manipulable generation based on contrastive learning. Finally, Dhariwal and Nichol (2021) derive a conditional sampling process for DDIM that is used in this paper as detailed in Sec. 3.3. Here, we re-interpret their generation algorithm from a causal perspective and add deterministic latent inference for counterfactual estimation. The main, but key difference, is that we add the abduction of exogenous noise . Without this abduction, we cannot ensure that the resulting image will match other aspects of the original image whilst altering only the intended aspect (ie. Where we want to intervene). We can sample from a counterfactual distribution instead of the interventional distribution.
Counterfactuals. Designing causal models with deep learning components has allowed causal inference with high-dimensional variables (Pawlowski et al., 2020; Shen et al., 2020; Dash et al., 2020; Xia et al., 2021; Zeˇ cevi et al., 2021). Given a factual observation, counterfactuals are obtained by measuring the effect of an intervention in one of the ancestral attributes. They have been used in a range of applications such as (i) explaining predictions (Verma et al., 2020; Goyal et al., 2019; Looveren and Klaise, 2021; Hvilshøj et al., 2021); (ii) defining fairness (Kusner et al., 2017); (iii) mitigating data biases (Denton et al., 2019); (iv) improving reinforcement learning (Lu et al., 2020); (v) predicting accuracy (Kaushik et al., 2020); (vi) increasing robustness against spurious correlations (Sauer and Geiger, 2021). Most similar to our work, Schut et al. (2021) estimate counterfactuals via iterative updates using the gradients of a classifier. However, their method is based on adversarial updates computed via epistemic uncertainty, not diffusion processes.
## 5. Experiments
Ground truth counterfactuals are, by definition, impossible to acquire. Counterfactuals are hypothetical predictions. In an ideal scenario, the SCM of problem is fully specified. In this case, one would be able to verify if unrelated causal variables kept their values 3 . However, a complete causal graph is rarely known in practice. In this section, we (i) present ideas on how to evaluate counterfactuals without access to the complete causal graph nor semi-synthetic data; (ii) show with quantitative and qualitative experiments that our method is appropriate for counterfactual estimation; (iii) propose CLD, a metric for quantitative evaluation of counterfactuals; and (iv) use CLD for fine tuning an important hyperparameter of our framework.
Causal Setup. Weconsider a causal model G image with two variables x (1) ← x (2) following the example in Sec. 3.3. Here, x (1) represents an image and x (2) a class. In practice, the gradient of the marginal distribution of x (1) is learned with a diffusion model, which we refer as θ , as in Sec. 2.1. The anti-causal conditional distribution is also learned with a neural network p φ ( x (2) | x (1) ) . Our experiments aim at sampling from the counterfactual distribution p G ( x (1) | do ( x (2) = x (2) CF ); x (1) F ) . Extra experiments on sampling from interventional distribution are in Appendix F.
Implementation. θ is implemented as an encoder-decoder architecture with skip-connections, i.e. a Unet-like network (Ronneberger et al., 2015). For anti-causal classification tasks, we use the
3. Remember that interventions only change descendants in a causal graph.
encoder of θ with a pooling layer followed by a linear classifier. Both θ and p φ ( x (2) | x (1) ) dependent on diffusion time. The diffusion model and anti-causal predictor are trained separately. Implementation details are in Appendix E.
Baselines. Weconsider Schut et al. (2021) and Looveren and Klaise (2021) because they (i) generate counterfactuals based on classifiers decisions; and (ii) evaluate results with metrics tailored to counterfactual estimation on images.
Datasets. Considering the causal model G image described above, we compare our method quantitatively and qualitatively with baselines on MNIST data (Lecun et al., 1998). Furthermore, we show empirically that our approach works with more complex, higher-resolution images from the ImageNet dataset (Deng et al., 2009). We only perform qualitative evaluations on ImageNet since the baseline methods cannot generate counterfactuals for this dataset.
## 5.1. Evaluating Counterfactuals: Realism and Closeness to Data Manifold
Taking into account the causal model G image , we now employ the strategies for counterfactual estimation in Sec. 3.4. In particular, given an image x (1) F ∼ x (1) and a target intervention x (2) CF in the class variable, we wish to estimate the counterfactual x (1) CF for the image x (1) F . We use two metrics proposed by Looveren and Klaise (2021), IM1 and IM2, to measure the realism, interpretability and closeness to the data manifold based on the reconstruction loss of autoencoders trained on specific classes. See details in Appendix G.
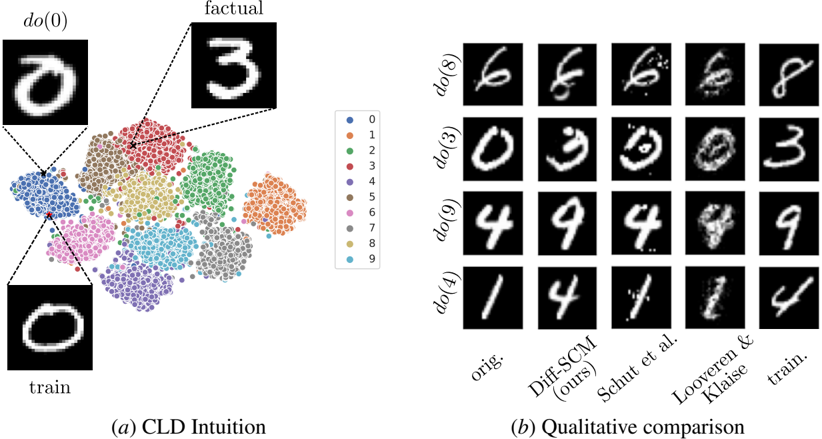
Experimental Setup. We run Alg. 1 over the test set with randomly sampled target counterfactual classes x (2) CF ∼ x (2) , ∀ x (2) = x (2) F . For example. we generate counterfactuals of all MNIST classes for a given factual image, as illustrated in Appendix H. We evaluate realism of Diff-SCM, Schut et al. and Looveren and Klaise using the IM1 and IM2 metrics. Diff-SCM achieves better results (lower is better) in both metrics 4 , as shown in Tab. 1. We show qualitative results on ImageNet in Fig. 1 and on MNIST in Appendix H. A qualitative comparison between methods is depicted in Fig. 3( b ).
Table 1: Quantitative comparison between Diff-SCM and baselines. Lower is better for all metrics. Results are presented with mean ( µ ) and standard deviation σ over the test set in the format µ σ .
| Method | IM1 ↓ | IM2 ↓ | CLD ↓ |
|---------------------|---------------|---------------|---------------|
| Diff-SCM (ours) | 0 . 94 0 . 02 | 0 . 04 0 . 00 | 1 . 08 0 . 03 |
| Looveren and Klaise | 1 . 10 0 . 03 | 0 . 05 0 . 00 | 1 . 25 0 . 03 |
| Schut et al. | 1 . 05 0 . 01 | 0 . 10 0 . 00 | 1 . 19 0 . 01 |
## 5.2. Counterfactual Latent Divergence (CLD)
Since one cannot measure changes in all variables of a real SCM, we leverage the sparse mechanism shift (SMS) hypothesis 5 (Scholkopf et al., 2021) for justifying a minimality property of counterfac-
4. We highlight that our setting is slightly different from baseline works where the target counterfactual classes were similar to the factual classes. e.g. Transforming MNIST digits from 2 → [3 , 7] or 4 → [1 , 9] . Since we are sampling target classes randomly, their metric values will look lower than in their respective papers.
5. SMS states that a 'small distribution changes tend to manifest themselves in a sparse or local way in the causal factorization, that is, they should usually not affect all factors simultaneously.'
## SANCHEZ TSAFTARIS
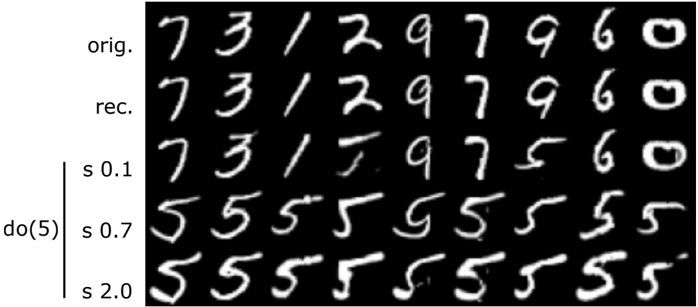
Figure 3: ( a ) A t-SNE visualization of the 20-dimensional latent vector of a variational autoencoder VAE over all MNIST samples. Each point represents an MNIST image and colors represent the ground-truth label of each sample. CLD's goal is to estimate a relative similarity between the factual data and the counterfactual. The distance between the generated counterfactual do (0) and factual observation is compared to the distances between the factual observation and all other data points from factual and counterfactual classes. ( b ) Qualitative comparison with baselines approaches for counterfactual estimation. Each column represents one method and each row a different intervention on digit class. The train. column shows training samples belonging to the target intervention class.
<details>
<summary>Image 3 Details</summary>
### Visual Description
## Diagram: CLD Intuition and Qualitative Comparison
### Overview
The image presents two diagrams. The left diagram, labeled "(a) CLD Intuition," shows a scatter plot where data points are colored according to digit labels (0-9). Example images of digits are placed near clusters in the scatter plot. The right diagram, labeled "(b) Qualitative comparison," displays a grid of images comparing different methods for generating or manipulating handwritten digits.
### Components/Axes
#### (a) CLD Intuition
* **Scatter Plot:** A 2D scatter plot where each point represents a data sample.
* **Color-Coded Labels:** The points are colored according to the digit they represent, as indicated by the legend:
* Blue: 0
* Orange: 1
* Green: 2
* Red: 3
* Purple: 4
* Brown: 5
* Pink: 6
* Gray: 7
* Yellow-Green: 8
* Teal: 9
* **Example Images:** Three example images of handwritten digits are shown:
* Top-left: Labeled "do(0)" and shows a handwritten "0".
* Top-right: Labeled "factual" and shows a handwritten "3".
* Bottom-left: Labeled "train" and shows a handwritten "0".
#### (b) Qualitative comparison
* **Grid of Images:** A 4x5 grid of images, each displaying a handwritten digit.
* **Rows:** Each row is labeled with a "do(x)" value, indicating a specific digit:
* Row 1: do(8)
* Row 2: do(3)
* Row 3: do(9)
* Row 4: do(4)
* **Columns:** Each column represents a different method or source:
* Column 1: "orig." (original)
* Column 2: "Diff-SCM (ours)"
* Column 3: "Schut et al."
* Column 4: "Looveren & Klaise"
* Column 5: "train."
### Detailed Analysis
#### (a) CLD Intuition
* The scatter plot shows clusters of points, with each cluster primarily composed of points with the same color (digit label).
* The "0" cluster (blue) is located in the bottom-left.
* The "3" cluster (red) is located in the top-right.
* The "train" image of "0" is connected to the "0" cluster.
* The "factual" image of "3" is connected to the "3" cluster.
* The "do(0)" image of "0" is connected to the "0" cluster.
#### (b) Qualitative comparison
* The "orig." column shows the original handwritten digits.
* The "Diff-SCM (ours)" column shows the digits generated or manipulated by the Diff-SCM method.
* The "Schut et al." column shows the digits generated or manipulated by the Schut et al. method.
* The "Looveren & Klaise" column shows the digits generated or manipulated by the Looveren & Klaise method.
* The "train." column shows the digits from the training set.
* The images in the "Diff-SCM (ours)" column appear to be more similar to the original digits compared to the "Schut et al." and "Looveren & Klaise" columns.
### Key Observations
* The CLD Intuition diagram shows that the data samples are clustered according to their digit labels.
* The Qualitative comparison diagram shows that the Diff-SCM method generates digits that are more similar to the original digits compared to the other methods.
### Interpretation
The CLD Intuition diagram visualizes how data points representing handwritten digits are grouped based on their labels. This suggests that the feature space used to represent these digits allows for effective clustering. The Qualitative comparison diagram demonstrates the performance of different methods for generating or manipulating handwritten digits. The Diff-SCM method appears to produce results that are visually closer to the original digits, indicating a potentially better performance in preserving the original characteristics of the digits. The image suggests that Diff-SCM is a more effective method for generating or manipulating handwritten digits compared to Schut et al. and Looveren & Klaise.
</details>
tuals. SMS translates, in our setting, to an intervention will not change many elements of the observed data . Therefore, an important property of counterfactuals is minimality or proximity to the factual observation. We suggest here a new metric entitled counterfactual latent divergence (CLD), illustrated in Fig. 3( a ), that estimates minimality.
Note that the metrics IM1 and IM2 from Sec. 5.1 do not take minimality into account. In addition, previous work (Wachter et al., 2018; Schut et al., 2021) only used the mean absolute error or 1 distance in the data space for measuring minimality. However, measuring similarity at pixellevel can be challenging as an intervention might change the structure of the image whilst keeping other factors unchanged. In this case, a pixel-level comparison might not be informative about the other factors of variation.
Latent Similarity. Therefore, we choose to measure similarity between latent representation. In addition, we want a representation that captures all factors of variation on the input data. In particular, we train a variational autoencoder (VAE) (Kingma and Welling, 2014) for recovering probabilistic latent representations that capture all factors of variation in the data. The latent spaces computed with the VAE's encoder E φ are denoted as µ i , σ i = E φ ( x (1) i ) , where subscript i means different samples from x (1) ( t = 0 ). We use the Kullback-Leibler divergence (KL) divergence for measuring the distances between latents. The divergence for a given counterfactual estimation and
factual observation pair ( x (1) CF , x (1) F ) can, therefore, be denoted as
<!-- formula-not-decoded -->
Relative Measure. However, absolute similarity measures give limited information. Therefore, we leverage class information for measuring minimality whilst making sure that the counterfactual is far enough from the factual class. A relative measure is obtained by estimating the probability of sets of divergence measures between the factual observation and other data points in the dataset (formalized in the Eq. 9) to less or greater than div . In particular, we compare div with the set S class of divergence measures between the factual observation x (1) F and all data points x (1) in a dataset D = { ( x (1) , x (2) ) | x (1) ∈ R 2 , x (2) ∈ N } for which the class x (2) is x (2) class is denoted in set-builder notation 6 with:
<!-- formula-not-decoded -->
The sets S CF and S F are obtained by replacing 'class' in S class with the appropriate target class of the counterfactual and factual observation class respectively.
The relative measures are: (i) P ( S CF ≤ div ) for comparing div with the distance between all data points of the counterfactual class and the factual image; and (ii) P ( S F ≥ div ) for comparing div with the distance between all other data points of the factual class and the factual image. We aim for counterfactuals with low P ( S CF ≤ div ) , enforcing minimality, and low P ( S F ≥ div ) , enforcing bigger distances from the factual class.
CLD. We highlight the competing nature of the two measures P ( S CF ≤ div ) and P ( S F ≥ div ) in the counterfactual setting. For example, if the intervention is too minimal i.e. low P ( S CF ≤ div ) - the counterfactual will still resemble observations from the factual class i.e. high P ( S F ≥ div ) . Therefore, the goal is to find the best balance between the two measures. Finally, we define the counterfactual latent divergence (CLD) metric as the LogSumExp of the two probability measures. The LogSumExp operation acts as a smooth approximation of the maximum function. It also penalizes relative peak values for any of the measures when compared to a simple summation. We denote CLD as:
<!-- formula-not-decoded -->
We show, using the same experimental setup as in Sec. 5.1, that CLD improves counterfactual estimation when quantitatively compared with the baseline methods, as illustrated in Tab. 1.
## 5.3. Tuning the Hyperparameter s with CLD
We now utilize CLD, the proposed metric, for fine-tuning s , the scale hyperparameter of our framework detailed in Sec. 3.4. Incidentally, the model with hyperparameters achieving best CLD outperforms previous methods in other metrics (see Tab. 1) and output the best qualitative results (see Fig. 3( b )). This result further validate that our metric is suited for counterfactual evaluation.
6. We use the following set-builder notation: MY SET = { function ( input ) | input domain } .
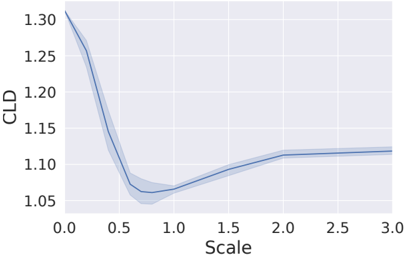
Figure 4: Scale hyperparameter search using CLD (lower is better). The line plot shows the mean and 95% confidence interval. We found that s = 0 . 7 is the best value.
<details>
<summary>Image 4 Details</summary>
### Visual Description
## Line Chart: CLD vs. Scale
### Overview
The image is a line chart showing the relationship between "CLD" (presumably some metric) and "Scale". The chart displays a single data series with a shaded region around the line, indicating uncertainty or variance. The line initially decreases sharply, reaches a minimum, and then gradually increases, plateauing towards the end of the scale.
### Components/Axes
* **X-axis:** "Scale", ranging from 0.0 to 3.0 in increments of 0.5.
* **Y-axis:** "CLD", ranging from 1.05 to 1.30 in increments of 0.05.
* **Data Series:** A single blue line with a shaded blue region around it, representing the CLD value at different scales.
### Detailed Analysis
* **Trend:** The blue line starts at a high CLD value at Scale 0.0, rapidly decreases until approximately Scale 0.8, then gradually increases and flattens out after Scale 2.0.
* **Data Points:**
* At Scale 0.0, CLD is approximately 1.30.
* At Scale 0.5, CLD is approximately 1.15.
* At Scale 0.8, CLD reaches a minimum of approximately 1.06.
* At Scale 1.0, CLD is approximately 1.07.
* At Scale 1.5, CLD is approximately 1.09.
* At Scale 2.0, CLD is approximately 1.11.
* At Scale 2.5, CLD is approximately 1.12.
* At Scale 3.0, CLD is approximately 1.12.
* **Uncertainty:** The shaded region around the blue line indicates the uncertainty or variability in the CLD values. The uncertainty appears to be larger in the region where the CLD value is decreasing rapidly (between Scale 0.0 and 0.8).
### Key Observations
* The CLD value is minimized around Scale 0.8.
* The CLD value plateaus after Scale 2.0.
* The uncertainty in the CLD value is higher when the CLD is changing rapidly.
### Interpretation
The chart suggests that there is an optimal "Scale" value (around 0.8) that minimizes the "CLD" metric. Increasing the scale beyond this point results in a gradual increase in CLD, eventually plateauing. The shaded region indicates the variability or uncertainty in the CLD values, which is higher when the CLD is changing rapidly. This could indicate that the relationship between Scale and CLD is more sensitive in this region. The plateauing of CLD after Scale 2.0 suggests that further increases in scale do not significantly affect the CLD value.
</details>
Experimental Setup. We run Alg. 1 while varying the scale hyperparameter s in the [0 . 0 , 3 . 0] interval for MNIST data, as depicted in Fig. 4. When s = 0 , the classifier does not influence the generation, therefore, the counterfactuals are reconstructions of the factual data; resulting in a high CLD.
When s = 3 (too high), the diffusion model contributes much less than the classifier, therefore, the counterfactuals are driven towards the desired class while ignoring the exogenous noise of a given observation. High values of s correspond to strong interventions which do not hold the minimality property, also resulting in a high CLD. Therefore, the optimum point for s is an intermediate value where CLD is minimum. All MNIST experiments were performed using s = 0 . 7 , following this hyperparameter search. See Appendix I for qualitative results.
## 6. Conclusions
We propose a theoretical framework for causal estimation using generative diffusion models entitled Diff-SCM. Diff-SCM unifies recent advances in generative energy-based models and structural causal models. Our key idea is to use gradients of the marginal and conditional distributions entailed by an SCM for causal estimation. The main benefit of only using the distribution's gradients is that one can learn an anti-causal mechanism and use its gradients as a causal mechanism for generation. We show empirically how it can be applied to a two variable causal model. We leave the extension to more complex causal models to future work.
Furthermore, we present an algorithm for performing interventions and estimating counterfactuals with Diff-SCM. We acknowledge the difficulty of evaluating counterfactuals and propose a metric entitled counterfactual latent divergence (CLD). CLD measures the distance, in a latent space, between the observation and the generated counterfactual by comparison with other distances between samples in the dataset. We use CLD for comparison with baseline methods and for hyperparameter search. Finally, we show that the proposed Diff-SCM achieves better quantitative and qualitative results compared to state-of-the-art methods for counterfactual generation on MNIST.
Limitations and future work. We only have specifications for two variables in our empirical setting, therefore, applying an intervention on x (2) means changing all the correlated variables within this dataset. Applying Diff-SCM to more complex causal models would require the use of additional techniques. For instance, consider the SCM depicted in Fig. 2, a classifier naively trained to predict x (2) (class) from x (1) (image) would be biased towards the confounder x (3) . Therefore, the gradient of the classifier w.r.t the image would also be biased. This would make the intervention do( x (2) ) not correct. In this case, the graph mutilation (removing edges from parents of node intervened on) would not happen because the gradients from the classifier would pass information about x (3) . We leave this extension for future work.
## 7. Acknowledgement
We thank Spyridon Thermos, Xiao Liu, Jeremy Voisey, Grzegorz Jacenkow and Alison O'Neil for their input on the manuscript and research support. This work was supported by the University of Edinburgh, the Royal Academy of Engineering and Canon Medical Research Europe via Pedro Sanchez's PhD studentship. This work was partially supported by the Alan Turing Institute under the EPSRC grant EP N510129 \ 1. We thank Nvidia for donating a TitanX GPU. S.A. Tsaftaris acknowledges the support of Canon Medical and the Royal Academy of Engineering and the Research Chairs and Senior Research Fellowships scheme (grant RCSRF1819 \ 825).
## References
- E Bareinboim, J Correa, D Ibeling, and T Icard. On Pearl's Hierarchy and the Foundations of Causal Inference, 2020.
- Tineke Blom, Stephan Bongers, and Joris M Mooij. Beyond Structural Causal Models: Causal Constraints Models. In Proc. 35th Uncertainty in Artificial Intelligence Conference , pages 585594, 2020.
- Stephan Bongers and Joris M Mooij. From Random Differential Equations to Structural Causal Models: the stochastic case. arxiv pre-print , 2018.
- Ricky T Q Chen, Yulia Rubanova, Jesse Bettencourt, and David Duvenaud. Neural Ordinary Differential Equations. In Advances in Neural Information Processing Systems , 2018.
- Saloni Dash, Vineeth N Balasubramanian, and Amit Sharma. Evaluating and Mitigating Bias in Image Classifiers: A Causal Perspective Using Counterfactuals. arxiv pre-print , 2020.
- Jia Deng, Wei Dong, Richard Socher, Li-Jia Li, Kai Li, and Li Fei-Fei. Imagenet: A large-scale hierarchical image database. In Proc. of Conference on Computer Vision and Pattern Recognition , pages 248-255. IEEE, 2009.
- Emily Denton, Ben Hutchinson, Margaret Mitchell, Timnit Gebru, and Andrew Zaldivar. Image Counterfactual Sensitivity Analysis for Detecting Unintended Bias. arxiv pre-print , 12 2019.
- Prafulla Dhariwal and Alex Nichol. Diffusion Models Beat GANs on Image Synthesis. In Advances in Neural Information Processing Systems , 2021.
- Xin Du, Lei Sun, Wouter Duivesteijn, Alexander Nikolaev, and Mykola Pechenizkiy. Adversarial balancing-based representation learning for causal effect inference with observational data. Data Mining and Knowledge Discovery , 35(4):1713-1738, 12 2021.
- Yilun Du and Igor Mordatch. Implicit Generation and Generalization in Energy-Based Models. In Advances in Neural Information Processing Systems , 12 2019.
- Yilun Du, Shuang Li, Igor Mordatch, and Google Brain. Compositional Visual Generation with Energy Based Models. In Advances in Neural Information Processing Systems , 2020.
## SANCHEZ TSAFTARIS
- Yash Goyal, Ziyan Wu, Jan Ernst, Dhruv Batra, Devi Parikh, and Stefan Lee. Counterfactual Visual Explanations. Proc. of 36th International Conference on Machine Learning , pages 4254-4262, 12 2019.
- Will Grathwohl, Kuan-Chieh Wang, J¨ orn-Henrik Jacobsen, David Duvenaud, Kevin Swersky, and Mohammad Norouzi. Your Classifier is Secretly an Energy Based Model and You Should Treat it Like One. In Proc. of International Conference on Learning Representations , 2020.
- Jennifer Hill. Bayesian Nonparametric Modeling for Causal Inference. Journal of Computational and Graphical Statistics , 20(1):217-240, 12 2012.
- Jonathan Ho, Ajay Jain, and Pieter Abbeel. Denoising Diffusion Probabilistic Models. In Advances on Neural Information Processing Systems , 2020.
- Frederik Hvilshøj, Alexandros Iosifidis, and Ira Assent. ECINN: Efficient Counterfactuals from Invertible Neural Networks. 12 2021.
- Aapo Hyv¨ arinen. Estimation of Non-Normalized Statistical Models by Score Matching. Journal of Machine Learning Research , 6:695-709, 2005.
- Fredrik D Johansson, Uri Shalit, and David Sontag. Learning Representations for Counterfactual Inference. In Proc. of International Conference on Machine Learning , 2016.
- Divyansh Kaushik, Amrith Setlur, Eduard Hovy, and Zachary C Lipton. EXPLAINING THE EFFICACY OF COUNTERFACTUALLY AUGMENTED DATA, 12 2020.
- N Kilbertus, G Parascandolo, and B Scholkopf. Generalization in anti-causal learning. In NeurIPS Workshop on Critiquing and Correcting Trends in Machine Learning , 2018.
- Diederik P Kingma and Max Welling. Auto-Encoding Variational Bayes. 2nd International Conference on Learning Representations , 2014.
- Matt Kusner, Joshua Loftus, Chris Russell, and Ricardo Silva. Counterfactual Fairness. In Advances on Neural Information Processing Systems , 2017.
- Y Lecun, L Bottou, Y Bengio, and P Haffner. Gradient-based learning applied to document recognition. Proceedings of the IEEE , 86(11):2278-2324, 1998.
- Arnaud Van Looveren and Janis Klaise. Interpretable Counterfactual Explanations Guided by Prototypes. In European Conference on Machine Learning and Principles and Practice of Knowledge Discovery in Databases , volume 1907.02584, 12 2021.
- Christos Louizos, Uri Shalit, Joris Mooij, David Sontag, Richard Zemel, and Max Welling. Causal Effect Inference with Deep Latent-Variable Models. In Advances on Neural Information Processing Systems , 2017.
- Chaochao Lu, Biwei Huang, Ke Wang, Jos´ e Miguel Hern´ andez-Lobato, Kun Zhang, and Bernhard Sch¨ olkopf. Sample-Efficient Reinforcement Learning via Counterfactual-Based Data Augmentation. arxiv pre-print , 12 2020.
- Joris M Mooij, Dominik Janzing, and Bernhard Sch¨ olkopf. From Ordinary Differential Equations to Structural Causal Models: The Deterministic Case. In Proceedings of the Twenty-Ninth Conference on Uncertainty in Artificial Intelligence , pages 440-448, 2013.
- Alex Nichol and Prafulla Dhariwal. Improved Denoising Diffusion Probabilistic Models. arxiv pre-print , 12 2021.
- Bernt Øksendal. Stochastic Differential Equations: An Introduction with Applications . Springer, fifth edition edition, 2003. ISBN 978-3-642-14394-6.
- Nick Pawlowski, Daniel C Castro, and Ben Glocker. Deep Structural Causal Models for Tractable Counterfactual Inference. In Advances in Neural Information Processing Systems , 2020.
- Judea Pearl. Causality . Cambridge University Press, 2009. doi: 10.1017/CBO9780511803161.
- Judea Pearl. Causal inference in statistics : a primer . John Wiley & Sons Ltd, Chichester, West Sussex, UK, 2016. ISBN 978-1-119-18684-7.
- Judea Pearl and Dana Mackenzie. The Book of Why: The New Science of Cause and Effect . Basic books, 2018.
- Jonas Peters, Dominik Janzing, and Bernhard Sch¨ olkopf. Elements of causal inference . MIT Press, 2017.
- ORonneberger, P.Fischer, and T Brox. U-Net: Convolutional Networks for Biomedical Image Segmentation. In Proc. of Medical Image Computing and Computer-Assisted Intervention , volume 9351, pages 234-241. Springer, 2015.
- Paul K Rubenstein, Stephan Bongers, uvanl Bernhard Sch¨ olkopf, and Joris M Mooij. From Deterministic ODEs to Dynamic Structural Causal Models. In Proceedings of the 34th Annual Conference on Uncertainty in Artificial Intelligence (UAI-18). , 2018.
- Simo S¨ arkk¨ a and Arno Solin. Applied Stochastic Differential Equations , volume 10. Cambridge University Press, 2019.
- Axel Sauer and Andreas Geiger. Counterfactual Generative Networks. In Proc. of International Conference on Learning Representations , 12 2021.
- Bernhard Sch¨ olkopf, Dominik Janzing, Jonas Peters, Eleni Sgouritsa, Kun Zhang, and Joris Mooij JMOOIJ. On Causal and Anticausal Learning. In Proc. of the International Conference on Machine Learning , 2012.
- Bernhard Scholkopf, Francesco Locatello, Stefan Bauer, Nan Rosemary Ke, Nal Kalchbrenner, Anirudh Goyal, and Yoshua Bengio. Toward Causal Representation Learning. Proceedings of the IEEE , 2021.
- Lisa Schut, Oscar Key, Rory McGrath, Luca Costabello, Bogdan Sacaleanu, Medb Corcoran, and Yarin Gal. Generating Interpretable Counterfactual Explanations By Implicit Minimisation of Epistemic and Aleatoric Uncertainties. In Proc. of The 24th International Conference on Artificial Intelligence and Statistics , pages 1756-1764, 2021.
## SANCHEZ TSAFTARIS
- Xinwei Shen, Furui Liu, Hanze Dong, Qing Lian, Zhitang Chen, and Tong Zhang. Disentangled Generative Causal Representation Learning. arxiv pre-print , 2020.
- Claudia Shi, David M Blei, and Victor Veitch. Adapting Neural Networks for the Estimation of Treatment Effects. In Proc. of Neural Information Processing Systems , 2019.
- Yishai Shimoni, Chen Yanover, Ehud Karavani, and Yaara Goldschmnidt. Benchmarking Framework for Performance-Evaluation of Causal Inference Analysis. arxiv pre-print , 12 2018.
- Abhishek Sinha, Jiaming Song, Chenlin Meng, and Stefano Ermon. D2C: Diffusion-Decoding Models for Few-Shot Conditional Generation. arXiv pre-print , 2021.
- Jascha Sohl-Dickstein, Eric A Weiss, Niru Maheswaranathan, and Surya Ganguli. Deep Unsupervised Learning using Nonequilibrium Thermodynamics. Proc. of 32nd International Conference on Machine Learning , 3:2246-2255, 12 2015.
- Alexander Sokol and Niels Richard Hansen. Causal interpretation of stochastic differential equations. Electronic Journal of Probability , 19:1-24, 2014.
- Jiaming Song, Chenlin Meng, and Stefano Ermon. Denoising Diffusion Implicit Models. In Proc. of International Conference on Learning Representations , 2021a.
- Yang Song and Stefano Ermon. Generative Modeling by Estimating Gradients of the Data Distribution. Advances in Neural Information Processing Systems , 32, 2019.
- Yang Song Song, Jascha Sohl-Dickstein, Diederik P Kingma, Abhishek Kumar, Stefano Ermon, and Ben Poole. Score-Based Generative Modeling Through Stochastic Differential Equations. In ICLR , 2021b.
- Vladimir N Vapnik. An overview of statistical learning theory. IEEE Transactions on Neural Networks , 10(5):988-999, 1999.
- Ashish Vaswani, Noam Shazeer, Niki Parmar, Jakob Uszkoreit, Llion Jones, Aidan N Gomez, Łukasz Kaiser, and Illia Polosukhin. Attention Is All You Need. In Advances in neural information processing systems , pages 5998-6008, 2017.
- Sahil Verma, John Dickerson, and Keegan Hines. Counterfactual Explanations for Machine Learning: A Review. arxiv pre-print , 12 2020.
- Sandra Wachter, Brent Mittelstadt, and Chris Russell. Counterfactual Explanations without Opening the Black Box: Automated Decisions and the GDPR. Harvard Journal of Law & Technology , 31 (2), 2018.
- Kevin Xia, Kai-Zhan Lee, Yoshua Bengio, and Elias Bareinboim. The Causal-Neural Connection: Expressiveness, Learnability, and Inference. 12 2021.
- Mengyue Yang, Furui Liu, Zhitang Chen, Xinwei Shen, Jianye Hao, and Jun Wang. CausalVAE: Disentangled Representation Learning via Neural Structural Causal Models. In Proceedings of the IEEE/CVF Conference on Computer Vision and Pattern Recognition , pages 9593-9602, 2021.
- Matej Zeˇ cevi, Devendra Singh Dhami, Petar Veliˇ ckovi, and Kristian Kersting. Relating Graph Neural Networks to Structural Causal Models. arxiv pre-print , 2021.
## Appendix A. Theory for Training Diffusion Models
We now review with more detailed the formulation of Denoising Diffusion Probabilistic Models (DDPMs) (Ho et al., 2020). In DDPM, samples are generated by reversing a diffusion process with a neural network from a Gaussian prior distribution. We begin by defining our data distribution x 0 ∼ p ( x 0 ) and a Markovian noising process which gradually adds noise to the data to produce noised samples x t up to x T . In particular, each step of the noising process adds Gaussian noise according to some variance schedule given by β t :
<!-- formula-not-decoded -->
In addition, it's possible to sample x t directly from x 0 without repeatedly sample from x t ∼ p ( x t | x t -1 ) . Instead, p ( x t | x 0 ) can be expressed as a Gaussian distribution by defining a variance of the noise for an arbitrary timestep α t := ∏ t j =0 (1 -β j ) . We, therefore, proceed to define
<!-- formula-not-decoded -->
<!-- formula-not-decoded -->
However, we are interested in a generative process which consists in performing a reverse diffusion, going from noise x T to data x 0 . As such, the model trained with parameters θ should correspond to conditional distribution p θ ( x t -1 | x t ) .
Using Bayes theorem, one finds that the posterior p ( x t -1 | x t , x 0 ) is also a Gaussian with mean ˜ µ t ( x t , x 0 ) and variance ˜ β t defined as follows:
<!-- formula-not-decoded -->
<!-- formula-not-decoded -->
Training p θ ( x t -1 | x t ) such that p ( x 0 ) learns the true data distribution, the following variational lower-bound L vlb for p θ ( x 0 ) can be optimized:
<!-- formula-not-decoded -->
Ho et al. (2020) considered a variational approximation of the Eq. 15 for training p θ ( x t -1 | x t ) efficiently. Instead of directly parameterize µ θ ( x t , t ) as a neural network, a model θ ( x t , t ) is trained to predict from Equation 13. This simplified objective is defined as follows:
<!-- formula-not-decoded -->
## Appendix B. Pearl's Causal Hierarchy
Bareinboim et al. (2020) use Pearl's Causal Hierarchy (PCH) nonmenclature after Pearl's seminal work on causality which is well illustrated in Pearl and Mackenzie (2018) as the Ladder of Causation . PCH states that structural causal models should be able to sample from a collection of three distributions (Peters et al. (2017), Ch. 6) which are related to cognitive capabilities:
1. The observational ('seeing') distribution p G ( x ( k ) ) .
2. The do-calculus (Pearl, 2009) formalizes sampling from the interventional ('doing') distribution p G ( x ( k ) | do ( x ( j ) = x ( j ) )) . The do () operator means an intervention on a specific variable is propagated only through it's descendants in the SCM G . The causal structure forces that only the descendants of the variable intervened upon will be modified by a given action.
3. Sampling from a counterfactual ('imagining') distribution p G ( x ( k ) | do ( x ( j ) = x ( j ) ); x ( k ) ) involves applying an intervention do ( x ( j ) = x ( j ) ) on an given instance x ( k ) . Contrary to the factual observation, a counterfactual corresponds to a hypothetical scenario.
## Appendix C. Example of Anti-causal Intervention
We illustrate Prop. 1 in a case with two variables, which is also used in the experiments. Consider a variable x (1) caused by x (2) , i.e. x (1) ← x (2) . Following the causal direction, the joint distribution can be factorised as p ( x (1) , x (2) ) = p ( x (1) | x (2) ) p ( x (2) ) . Applying an intervention with the SDE framework, however, one would only need ∇ x (1) log p t ( x (1) | x (2) = x (2) ) , as in Eq. 6. By applying Bayes' rule, one can derive p ( x (1) | x (2) ) = p ( x (2) | x (1) ) p ( x (1) ) /p ( x (2) ) . Therefore, the sampling process would be done with
<!-- formula-not-decoded -->
## Appendix D. DDIM sampling procedure
A variation of the DDPM (Ho et al., 2020) sampling procedure is done with Denoising Diffusion Implicit Models (DDIM, Song et al. (2021a)). DDIM formulates an alternative non-Markovian noising process that allows a deterministic mapping between latents to images. The deterministic mapping means that the noisy term in Eq. 2 is no longer necessary for sampling. This sampling approach has the same forward marginals as DDPM, therefore, it can be trained in the same manner. This approach was used for sampling throughout the paper as explained in Sec. 3.4.
Alg. 2 describes DDIM's sampling procedure from x T ∼ N (0 , I ) (exogenous noise distribution) to x 0 (data distribution) deterministic procedure. This formulation has two main advantages: (i) it allows a near-invertible mapping between x T and x 0 as shown in Alg. 3; and (ii) it allows efficient sampling with fewer iterations even when trained with the same diffusion discretization. This is done by choosing different undersampling t in the [0 , T ] interval.
## Algorithm 2 Sampling with DDIM - Image Generation
Models:
trained diffusion model θ .
Input :
x T ∼ N (0 , I)
Output:
x 0 - Image
for t ← T to 0 do
<!-- formula-not-decoded -->
end
| Algorithm 3 Reverse-Sampling with DDIM - Inferring the Noisy Latent | |
|-----------------------------------------------------------------------------------------------------------------|-----------------------------------------------------------------------------------------------------------------|
| Models: trained diffusion model θ . | Models: trained diffusion model θ . |
| Input : x 0 - Image | Input : x 0 - Image |
| Output: x T - Latent Space | Output: x T - Latent Space |
| for t ← T to 0 do √ | for t ← T to 0 do √ |
| x t +1 ← √ α t +1 ( x t - 1 - α t θ ( x t ,t ) √ α t ) + √ α t +1 θ ( x t , t ) | x t +1 ← √ α t +1 ( x t - 1 - α t θ ( x t ,t ) √ α t ) + √ α t +1 θ ( x t , t ) |
## Appendix E. Implementation Details
For each dataset, we train two models that are trained separately: (i) θ is implemented as an encoder-decoder architecture with skip-connections, i.e. a Unet-like network (Ronneberger et al., 2015). (ii) A (Anti-causal) classifier that uses the encoder of θ with a pooling layer followed by a linear classifier. All models are time conditioned. Time, which is a scalar, is embedded using the transformer's sinusoidal position embedding (Vaswani et al., 2017). The embedding is incorporated into the convolutional models with an Adaptive Group Normalization layer into each residual block (Nichol and Dhariwal, 2021). Our architectures and training procedure follow Dhariwal and Nichol (2021). They performed an extensive ablation study of important components from DDPM (Ho et al., 2020) and improved overall image quality and log-likelihoods on many image benchmarks. We use the same hyperparameters as Dhariwal and Nichol (2021) for the ImageNet and define ours for MNIST. The specific hyperparameters for diffusion and classification models follow Tab. 2. We train all of our models using Adam with β 1 = 0 . 9 and β 2 = 0 . 999 . We train in 16-bit precision using loss-scaling, but maintain 32-bit weights, EMA, and optimizer state. We use an EMA rate of 0.9999 for all experiments.
We use DDIM sampling for all experiments with 1000 timesteps. The same noise schedule is used for training. Even though DDIM allows faster sampling, we found that it does not work well for counterfactuals.
Table 2: Hyperparameters for models.
| dataset | ImageNet 256 | ImageNet 256 | MNIST | MNIST |
|----------------------|----------------|----------------|-----------|------------|
| model | diffusion | classifier | diffusion | classifier |
| Diffusion steps | 1000 | 1000 | 1000 | 1000 |
| Model size | 554M | 54M | 2M | 500K |
| Channels | 256 | 128 | 64 | 32 |
| Depth | 2 | 2 | 1 | 1 |
| Channels multiple | 1,1,2,2,4,4 | 1,1,2,2,4,4 | 1,2,4 | 1,2,4,4 |
| Attention resolution | 32,16,8 | 32,16,8 | - | - |
| Batch size | 256 | 256 | 256 | 256 |
| Iterations | ≈ 2 M | ≈ 500 K | 30K | 3K |
| Learning Rate | 1e-4 | 3e-4 | 1e-4 | 1e-4 |
## Appendix F. Sampling from The Interventional Distribution
In this section, we make sure that our method complies with the second level of Pearl's Causal Hierarchy (details in Appendix B). Diff-SCM can be used for efficiently sampling from the interventional distributions p G image ( x (1) | do ( x (2) = x (2) )) . Sampling from the interventional distribution can be done by using the second part ('Generation with Intervention') of Alg. 1 but sampling u ( k ) from a Gaussian prior, instead of inferring the latent space (using 'Abduction of Exogenous Noise'). This formulation is identical to Dhariwal and Nichol (2021) with guided DDIM (Song et al., 2021a) (details in appendix D). Dhariwal and Nichol (2021) achieves state-of-the-art image quality results in generation while providing faster sampling than DDPM. Since its capabilities in image synthesis compared to other generative models are shown in Dhariwal and Nichol (2021), we restrict ourselves to present qualitative results on ImageNet 256x256.
Experimental Setup. Our experiment, depicted in Fig. 5, consists in sampling a single latent space u (1) from a Gaussian distribution and generating samples for different classes. Since all images are generated from the same latent, this allows visualization of the effect of the classifier guidance for different classes. This setup differs from experiments in Dhariwal and Nichol (2021), where each image presented was a different sample u (1) ∼ u (1) . Here, by sampling u (1) only once, we isolate the contribution of the causal mechanism from the sampling of the exogenous noise u (1) . We use the scale hyperparameter s = 5 for these experiments.
Figure 5: Sampling ImageNet images from the interventional distribution. All images originate from the same initial noise u ( k ) but different interventions are applied at inference time.
<details>
<summary>Image 5 Details</summary>
### Visual Description
## Image Analysis: Image Examples
### Overview
The image presents five distinct image examples, each labeled with a title. The first image is a visual representation of noise. The subsequent images depict a chimpanzee, a mushroom, a bookshop, and a goose, respectively.
### Components/Axes
* **Titles:**
* `u^(k)` [noise]
* `do(chimpanzee)`
* `do(mushroom)`
* `do(bookshop)`
* `do(goose)`
### Detailed Analysis or ### Content Details
* **Image 1:** `u^(k)` [noise]: This image displays a uniform, teal-colored noise pattern.
* **Image 2:** `do(chimpanzee)`: This image features a chimpanzee sitting in a grassy area.
* **Image 3:** `do(mushroom)`: This image shows a red-capped mushroom growing in a grassy environment.
* **Image 4:** `do(bookshop)`: This image depicts the interior of a bookshop, with shelves filled with books.
* **Image 5:** `do(goose)`: This image portrays a goose swimming in water.
### Key Observations
The image provides a set of diverse examples, ranging from abstract noise to real-world objects and scenes.
### Interpretation
The image appears to be a collection of examples used for illustrative or comparative purposes. The "do()" notation suggests that these images might be used in a context related to causal inference or intervention, where "do" represents an action or manipulation performed on a variable. The noise image could represent a baseline or control condition.
</details>
## Appendix G. IM1 and IM2
Looveren and Klaise (2021) propose IM1 and IM2 for measuring the realism and closeness to the data manifold. These metrics are based on the reconstruction losses of auto-encoders trained on specific classes:
<!-- formula-not-decoded -->
<!-- formula-not-decoded -->
where AE x (2) denotes an autoencoder trained only on instances from class x (2) , and AE is an autoencoder trained on data from all classes. IM1 is the ratio of the reconstruction loss of an autoencoder trained on the counterfactual class divided by the loss of an autoencoder trained on all classes. IM2 is the normalized difference between the reconstruction of the CF under an autoencoder trained on the counterfactual class, and one trained on all classes.
## Appendix H. More MNIST Counterfactuals
Here, we show in Fig. 6 that we can generate counterfactuals of all MNIST classes, given factual image. We use the scale hyperparameter s = 0 . 7 for these experiments.
orig. rec. do(0) do(1) do(2) do(3) do(4) do(5) do(6) do(7) do(8) do(9)
<details>
<summary>Image 6 Details</summary>
### Visual Description
## Handwritten Digits Sample
### Overview
The image displays a collection of handwritten digits, arranged in a 3x10 grid. The digits range from 0 to 9, with multiple instances of each digit. The digits are white against a black background. The handwriting style varies, resulting in different representations of the same digit.
### Components/Axes
* **Rows:** Three rows of handwritten digits.
* **Columns:** Ten columns of handwritten digits, although the third row is incomplete.
* **Digits:** The digits displayed are 0, 1, 2, 3, 4, 5, 6, 7, 8, and 9.
### Detailed Analysis
The image contains the following digits in a grid format:
* **Row 1:** 5, 5, 0, 1, 2, 3, 4, 6, 7, 8, 9
* **Row 2:** 6, 6, 0, 1, 2, 3, 4, 5, 7, 8, 9
* **Row 3:** 8, 8, 0, 1, 2, 3, 8, 5, 6, 8
### Key Observations
* The handwriting style varies significantly between digits and even within the same digit.
* Some digits are more clearly written than others.
* The third row is incomplete, missing some digits.
### Interpretation
The image likely represents a sample of handwritten digits used for training or testing a machine learning model for digit recognition. The variability in handwriting styles highlights the challenges involved in accurately recognizing handwritten digits. The incomplete third row might indicate a partial dataset or a work in progress.
</details>
Figure 6: MNIST counterfactuals. From the left to right, one can observe the original image ( orig. ), the reconstruction ( rec. , which entails in running the algorithm 1 without the anti-causal predictor) and the resulting counterfactuals for each of the digit classes in the dataset.
## Appendix I. Qualitative influence of classifier scale
Here, we show in Fig. 7 the influence of changing the classifier's scale s quantitatively. If s is too low, the intervention will have a mild effect. On the other had, if s is too high, the intervention will neglect the information present in the exogenous noise, therefore, the counterfactual is maintain less factors from the original image.
Figure 7: MNIST counterfactuals. From top to bottom, one can observe the original image ( orig. ), the reconstruction ( rec. , and the resulting counterfactuals for the intervention do (5) over three scales. As shown in Fig. 4, s = 0 . 7 is the optimal scale for MNIST data.
<details>
<summary>Image 7 Details</summary>
### Visual Description
## Image: Handwritten Digit Reconstruction with Varying Noise Levels
### Overview
The image shows a grid of handwritten digits, comparing original digits, reconstructed digits, and digits generated with different levels of noise applied during the reconstruction process. The digits are displayed in a 5x8 grid, with each row representing a different condition: original, reconstructed, and three levels of noise (s 0.1, s 0.7, s 2.0).
### Components/Axes
* **Rows (from top to bottom):**
* orig. (Original digits)
* rec. (Reconstructed digits)
* s 0.1 (Digits generated with noise level 0.1)
* s 0.7 (Digits generated with noise level 0.7)
* s 2.0 (Digits generated with noise level 2.0)
* **Columns (from left to right):** Each column represents a different digit. The digits appear to be 7, 3, 1, 2, 9, 7, 9, 6, and 0.
* **Label on the left:** "do(5)" vertically aligned, indicating the digit being manipulated or the parameter being controlled.
### Detailed Analysis
The image displays a comparison of handwritten digit reconstruction under varying noise conditions.
* **Original Digits (orig.):** The first row shows the original handwritten digits. The digits are clear and easily recognizable. The sequence of digits is approximately: 7, 3, 1, 2, 9, 7, 9, 6, and 0.
* **Reconstructed Digits (rec.):** The second row shows the reconstructed digits. These digits are similar to the original digits, but with some slight variations and blurring, indicating the reconstruction process is not perfect. The sequence of digits is approximately: 7, 3, 1, 2, 9, 7, 9, 6, and 0.
* **Noise Level s 0.1:** The third row shows digits generated with a noise level of 0.1. These digits are still recognizable, but show more distortion compared to the reconstructed digits. The sequence of digits is approximately: 7, 3, 1, 2, 9, 7, 5, 6, and 0.
* **Noise Level s 0.7:** The fourth row shows digits generated with a noise level of 0.7. These digits are significantly distorted and some are difficult to recognize. The sequence of digits is approximately: 5, 5, 5, 5, 5, 5, 5, 5, and 5.
* **Noise Level s 2.0:** The fifth row shows digits generated with a noise level of 2.0. These digits are heavily distorted and barely resemble the original digits. The sequence of digits is approximately: 5, 5, 5, 5, 5, 5, 5, 5, and 5.
### Key Observations
* As the noise level increases, the reconstructed digits become increasingly distorted and less recognizable.
* At high noise levels (s 0.7 and s 2.0), the digits tend to converge towards a similar shape, which appears to be the digit "5".
* The reconstruction process introduces some level of distortion even without added noise (rec. row).
### Interpretation
The image demonstrates the impact of noise on the reconstruction of handwritten digits. As the noise level increases, the quality of the reconstructed digits deteriorates. The convergence towards the digit "5" at high noise levels suggests that the model might be biased towards this digit or that the noise is pushing the reconstructions towards a common, stable state. The "do(5)" label on the left suggests that the digit "5" might be the target digit for some manipulation or analysis related to the noise injection. The image highlights the challenges of robust reconstruction in the presence of noise and the importance of noise management in generative models.
</details>