# Deep Meta Programming
**Authors**: HikaruShindo, Devendra SinghDhami, KristianKersting
[1,3] Zihan Ye
1] AI and Machine Learning Group, Dept. of Computer Science, TU Darmstadt, Germany
2] Centre for Cognitive Science, TU Darmstadt, Germany
3] Hessian Center for AI (hessian.AI), Germany 4] German Center for Artificial Intelligence (DFKI), Germany 5] Eindhoven University of Technology, Netherlands
Neural Meta-Symbolic Reasoning and Learning
## Abstract
Deep neural learning uses an increasing amount of computation and data to solve very specific problems. By stark contrast, human minds solve a wide range of problems using a fixed amount of computation and limited experience. One ability that seems crucial to this kind of general intelligence is meta-reasoning, i.e., our ability to reason about reasoning. To make deep learning do more from less, we propose the first neural meta -symbolic system (NEMESYS) for reasoning and learning: meta programming using differentiable forward-chaining reasoning in first-order logic. Differentiable meta programming naturally allows NEMESYS to reason and learn several tasks efficiently. This is different from performing object-level deep reasoning and learning, which refers in some way to entities external to the system. In contrast, NEMESYS enables self-introspection, lifting from object- to meta-level reasoning and vice versa. In our extensive experiments, we demonstrate that NEMESYS can solve different kinds of tasks by adapting the meta-level programs without modifying the internal reasoning system. Moreover, we show that NEMESYS can learn meta-level programs given examples. This is difficult, if not impossible, for standard differentiable logic programming.
keywords: differentiable meta programming, differentiable forward reasoning, meta reasoning
<details>
<summary>x1.png Details</summary>
### Visual Description
## Flowchart: NEMESYS System Architecture
### Overview
The image depicts a conceptual architecture of a system called NEMESYS, integrating multiple reasoning modalities. The central "NEMESYS" box connects to eight peripheral components through bidirectional arrows, representing information flow. The system combines symbolic, visual, and causal reasoning with game-playing capabilities.
### Components/Axes
1. **Central Node**:
- Label: "NEMESYS" (stylized with a brain icon)
- Position: Center of the diagram
2. **Peripheral Components** (clockwise from top-left):
- **Symbolic Reasoning**:
- Contains code snippets about shape relationships
- Example: `same_shape_pair(A,B): shape(A,C), shape(B,C), shape(obj0, triangle)`
- **Visual Reasoning**:
- Color coding legend:
- Blue (□), Red (■), Gray (■)
- Contains image examples with colored objects
- **Classification**:
- Shape examples with checkmarks (✓) and crosses (✗)
- Includes geometric shapes (triangle, circle, square)
- **Planning**:
- Shows grid-based planning examples
- **Relevance Propagation**:
- Network diagram with interconnected nodes
- **Game Playing**:
- Maze-like game environment with pink/purple elements
- **Proof Tree**:
- Hierarchical tree structure with green/red nodes
- **Causal Reasoning**:
- Graph with nodes A-D and causal relationships (→, do(c))
### Detailed Analysis
- **Symbolic Reasoning**:
- Text-based logic rules for object relationships
- Uses predicate logic notation (e.g., `shape(obj1, triangle)`)
- **Visual Reasoning**:
- Color-coded object recognition system
- Three distinct color categories with specific shapes
- **Classification**:
- Binary classification system (correct/incorrect)
- Uses geometric shape recognition
- **Planning**:
- Grid-based navigation examples
- Shows pathfinding scenarios
- **Relevance Propagation**:
- Network topology visualization
- Represents information flow efficiency
- **Game Playing**:
- Maze environment with colored obstacles
- Suggests reinforcement learning application
- **Proof Tree**:
- Binary decision tree structure
- Nodes labeled A-D with hierarchical relationships
- **Causal Reasoning**:
- Causal graph with intervention notation (do(c))
- Shows cause-effect relationships between nodes
### Key Observations
1. Bidirectional arrows between NEMESYS and all components indicate integrated processing
2. Color-coded elements appear in both Visual Reasoning and Classification components
3. Game Playing component uses similar color scheme (pink/purple) to Visual Reasoning's red
4. Proof Tree and Causal Reasoning components share node labeling convention (A-D)
5. System combines deductive (Proof Tree) and inductive (Classification) reasoning
### Interpretation
The NEMESYS architecture demonstrates a multi-modal AI system that:
1. Processes symbolic logic (Symbolic Reasoning)
2. Interprets visual information (Visual Reasoning)
3. Makes classifications (Classification)
4. Plans actions (Planning)
5. Maintains relevance in information processing (Relevance Propagation)
6. Engages in game-like environments (Game Playing)
7. Constructs logical proofs (Proof Tree)
8. Understands causal relationships (Causal Reasoning)
The bidirectional connections suggest an integrated system where different reasoning modalities inform each other. The presence of both proof trees and causal graphs indicates the system can handle both deductive and probabilistic reasoning. The game-playing component implies potential applications in reinforcement learning scenarios, while the planning module suggests capability in strategic decision-making.
The color coding consistency between Visual Reasoning and Game Playing components might indicate shared visual processing capabilities. The system's complexity suggests it could be used for advanced AI applications requiring multiple reasoning modalities, such as robotics or complex decision support systems.
</details>
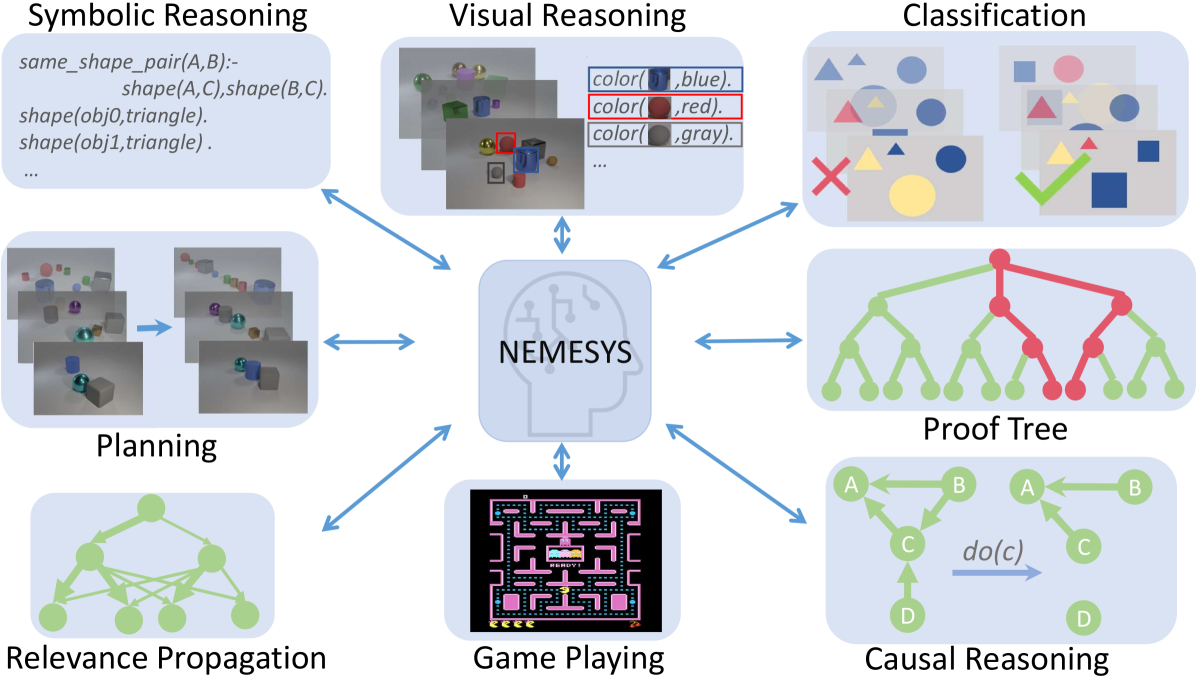
Figure 1: NEMESYS solves different kinds of tasks by using meta-level reasoning and learning. NEMESYS addresses, for instance, visual reasoning, planning, and causal reasoning without modifying its internal reasoning architecture. (Best viewed in color)
## 1 Introduction
One of the distant goals of Artificial Intelligence (AI) is to build a fully autonomous or ‘human-like’ system. The current successes of deep learning systems such as DALLE-2 [1], ChatGPT [2, 3], and Gato [4] have been promoted as bringing the field closer to this goal. However, current systems still require a large number of computations and often solve rather specific tasks. For example, DALLE-2 can generate very high-quality images but cannot play chess or Atari games. In stark contrast, human minds solve a wide range of problems using a small amount of computation and limited experience.
Most importantly, to be considered a major step towards achieving Artificial General Intelligence (AGI), a system must not only be able to perform a variety of tasks, such as Gato [4] playing Atari games, captioning images, chatting, and controlling a real robot arm, but also be self-reflective and able to learn and reason about its own capabilities. This means that it must be able to improve itself and adapt to new situations through self-reflection [5, 6, 7, 8]. Consequently, the study of meta-level architectures such as meta learning [9] and meta-reasoning [7] becomes progressively important. Meta learning [10] is a way to improve the learning algorithm itself [11, 12], i.e., it performs learning at a higher level, or meta-level. Meta-reasoning is a related concept that involves a system being able to think about its own abilities and how it processes information [5, 6]. It involves reflecting on, or introspecting about, the system’s own reasoning processes.
Indeed, meta-reasoning is different from object-centric reasoning, which refers to the system thinking about entities external to itself [13, 14, 15]. Here, the models perform low-level visual perception and reasoning on high-level concepts. Accordingly, there has been a push to make these reasoning systems differentiable [16, 17] along with addressing benchmarks in a visual domain such as CLEVR [18] and Kandinsky patterns [19, 20]. They use object-centric neural networks to perceive objects and perform reasoning using their output. Although this can solve the proposed benchmarks to some extent, the critical question remains unanswered: Is the reasoner able to justify its own operations? Can the same model solve different tasks such as (causal) reasoning, planning, game playing, and much more?
To overcome these limitations, we propose NEMESYS, the first neural meta -symbolic reasoning system. NEMESYS extensively performs meta-level programming on neuro-symbolic systems, and thus it can reason and learn several tasks. This is different from performing object-level deep reasoning and learning, which refers in some way to entities external to the system. NEMESYS is able to reflect or introspect, i.e., to shift from object- to meta-level reasoning and vice versa.
| | Meta Reasoning | Multitask Adaptation | Differentiable Meta Structure Learning |
| --- | --- | --- | --- |
| DeepProbLog [21] | ✗ | ✗ | ✗ |
| NTPs [22] | ✗ | ✗ | ✗ |
| FFSNL [23] | ✗ | ✗ | ✗ |
| $\alpha$ ILP [24] | ✗ | ✗ | ✗ |
| Scallop [25] | ✗ | ✗ | ✗ |
| NeurASP [26] | ✗ | ✗ | ✗ |
| NEMESYS (ours) | ✓ | ✓ | ✓ |
Table 1: Comparisons between NEMESYS and other state-of-the-art Neuro-Symbolic systems. We compare these systems with NEMESYS in three aspects, whether the system performs meta reasoning, can the same system adapt to solve different tasks and is the system capable of differentiable meta level structure learning.
Overall, we make the following contributions:
1. We propose NEMESYS, the first neural meta -symbolic reasoning and learning system that performs differentiable forward reasoning using meta-level programs.
1. To evaluate the ability of NEMESYS, we propose a challenging task, visual concept repairing, where the task is to rearrange objects in visual scenes based on relational logical concepts.
1. We empirically show that NEMESYS can efficiently solve different visual reasoning tasks with meta-level programs, achieving comparable performances with object-level forward reasoners [16, 24] that use specific programs for each task.
1. Moreover, we empirically show that using powerful differentiable meta-level programming, NEMESYS can solve different kinds of tasks that are difficult, if not impossible, for the previous neuro-symbolic systems. In our experiments, NEMESYS provides the function of (i) reasoning with integrated proof generation, i.e., performing differentiable reasoning producing proof trees, (ii) explainable artificial intelligence (XAI), i.e., highlighting the importance of logical atoms given conclusions, (iii) reasoning avoiding infinite loops, i.e., performing differentiable reasoning on programs which cause infinite loops that the previous logic reasoning systems unable to solve, and (iv) differentiable causal reasoning, i.e., performing causal reasoning [27, 28] on a causal Bayesian network using differentiable meta reasoners. To the best of the authors’ knowledge, we propose the first differentiable $\mathtt{do}$ operator. Achieving these functions with object-level reasoners necessitates significant efforts, and in some cases, it may be unattainable. In stark contrast, NEMESYS successfully realized the different useful functions by having different meta-level programs without any modifications of the reasoning function itself.
1. We demonstrate that NEMESYS can perform structure learning on the meta-level, i.e., learning meta programs from examples and adapting itself to solve different tasks automatically by learning efficiently with gradients.
To this end, we will proceed as follows. We first review (differentiable) first-order logic and reasoning. We then derive NEMESYS by introducing differentiable logical meta programming. Before concluding, we illustrate several capabilities of NEMESYS.
## 2 Background
NEMESYS relies on several research areas: first-order logic, logic programming, differentiable reasoning, meta-reasoning and -learning.
First-Order Logic (FOL)/Logic Programming. A term is a constant, a variable, or a term which consists of a function symbol. We denote $n$ -ary predicate ${\tt p}$ by ${\tt p}/(n,[{\tt dt_{1}},\ldots,{\tt dt_{n}}])$ , where ${\tt dt_{i}}$ is the datatype of $i$ -th argument. An atom is a formula ${\tt p(t_{1},\ldots,t_{n})}$ , where ${\tt p}$ is an $n$ -ary predicate symbol and ${\tt t_{1},\ldots,t_{n}}$ are terms. A ground atom or simply a fact is an atom with no variables. A literal is an atom or its negation. A positive literal is an atom. A negative literal is the negation of an atom. A clause is a finite disjunction ( $\lor$ ) of literals. A ground clause is a clause with no variables. A definite clause is a clause with exactly one positive literal. If $A,B_{1},\ldots,B_{n}$ are atoms, then $A\lor\lnot B_{1}\lor\ldots\lor\lnot B_{n}$ is a definite clause. We write definite clauses in the form of $A~{}\mbox{:-}~{}B_{1},\ldots,B_{n}$ . Atom $A$ is called the head, and a set of negative atoms $\{B_{1},\ldots,B_{n}\}$ is called the body. We call definite clauses as clauses for simplicity in this paper.
Differentiable Forward-Chaining Reasoning. The forward-chaining inference is a type of inference in first-order logic to compute logical entailment [29]. The differentiable forward-chaining inference [16, 17] computes the logical entailment in a differentiable manner using tensor-based operations. Many extensions of differentiable forward reasoners have been developed, e.g., reinforcement learning agents using logic to compute the policy function [30, 31] and differentiable rule learners in complex visual scenes [24]. NEMESYS performs differentiable meta-level logic programming based on differentiable forward reasoners.
<details>
<summary>x2.png Details</summary>
### Visual Description
## Flowchart: Differentiable Meta-Level Reasoning System
### Overview
The diagram illustrates a computational framework for differentiable meta-level reasoning, combining object-level perception with probabilistic logical reasoning. It shows two interconnected pipelines: one for object-level reasoning (bottom-left) and one for meta-level reasoning (top), with a shared "meta probabilistic atoms" component.
### Components/Axes
**Top Section (Differentiable Meta-Level Reasoning):**
1. **Input:** Clauses (e.g., `same_shape_pair(X,Y)` with 0.95 probability)
2. **Meta Converter:** Transforms clauses into meta probabilistic atoms
3. **Differentiable Forward Reasoner:** Processes meta probabilistic atoms iteratively
4. **Output:** Refined meta probabilistic atoms (e.g., `solve(shape(obj1,cube))` with 0.98 probability)
**Bottom-Left Section (Object-Level Reasoning):**
1. **Input:** Image of three objects (cyan cube, red cube, yellow cylinder)
2. **Object-Centric Representation:**
- obj1: cyan cube
- obj2: red cube
- obj3: yellow cylinder
3. **Probabilistic Atoms:**
- `color(obj1,cyan)`: 0.98
- `shape(obj1,cube)`: 0.98
- `color(obj2,red)`: 0.98
- `shape(obj2,cube)`: 0.98
- `color(obj3,yellow)`: 0.98
- `shape(obj3,cylinder)`: 0.98
**Bottom-Right Section (Meta Program):**
1. **Naive Interpreter Rules:**
- `solve(A,B) :- solve(A), solve(B)`
- `solve(A) :- clause(A,B), solve(B)`
2. **Interpreter with Proof Trees:**
- `solve(A,B,proofA,proofB) :- solve(A,proofA), solve(B,proofB)`
- `solve(A,proofA) :- clause(A,B), solve(B,proofB)`
### Detailed Analysis
**Top Section Flow:**
- Clauses (0.95 confidence) → Meta Converter → Meta Probabilistic Atoms (0.98 confidence) → Differentiable Forward Reasoner → Refined Meta Probabilistic Atoms
**Object-Level Reasoning:**
- Image input → Object-Centric Representation (3 objects with color/shape attributes) → Probabilistic Atoms (0.98 confidence for each attribute)
**Meta Program Logic:**
- Naive Interpreter: Basic logical deduction rules
- Proof Tree Interpreter: Enhanced with proof tracking for logical consistency
### Key Observations
1. **Probabilistic Confidence:** All extracted features (colors, shapes, logical clauses) maintain >95% confidence
2. **Differentiable Reasoning:** The forward reasoner operates on probabilistic atoms while maintaining differentiability
3. **Hierarchical Structure:** Object-level data feeds into meta-level reasoning through probabilistic representations
4. **Logical Inference:** The meta program combines naive deduction with proof-aware reasoning
### Interpretation
This system implements a neuro-symbolic architecture where:
1. **Perception Layer:** Converts visual input into probabilistic object representations
2. **Reasoning Layer:** Uses differentiable probabilistic logic to refine object relationships
3. **Meta-Programming:** Implements logical inference rules that can operate on both raw data and intermediate representations
The 0.95-0.98 confidence range suggests the system maintains high certainty while allowing for uncertainty propagation through differentiable operations. The proof tree extension indicates support for explainable AI through traceable logical deductions.
The architecture enables end-to-end differentiable training of both perception and reasoning components, potentially allowing learning of both visual features and logical rules simultaneously.
</details>
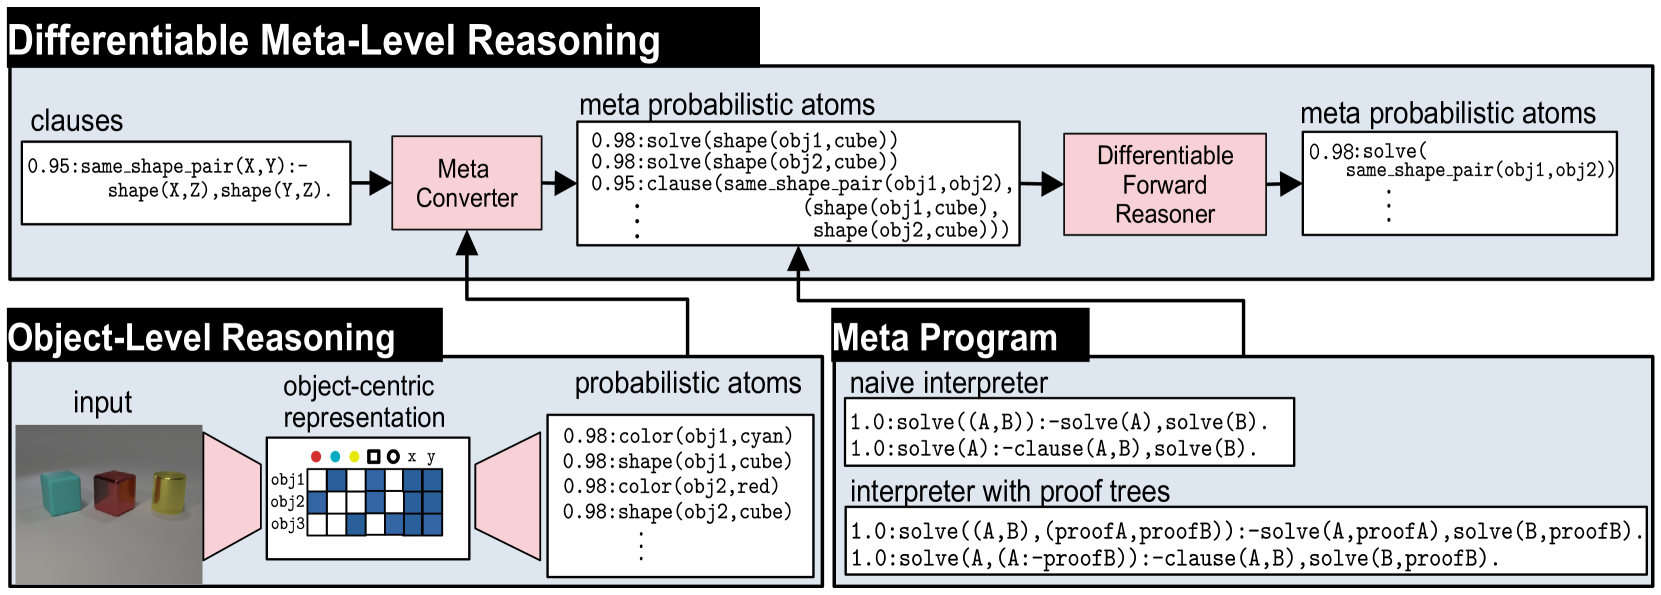
Figure 2: Overview of NEMESYS together with an object-level reasoning layer (bottom left). The meta-level reasoner (top) takes a logic program as input, here clauses on the left-hand side in the meta-level reasoning pipeline. Using the meta program (bottom right) it can realize the standard Prolog engine (naive interpreter) or an interpreter that provides e.g., also the proof trees (interpreter with proof trees) without requiring any alterations to the original logic program and internal reasoning function. This means that NEMESYS can integrate many useful functionalities by simply changing devised meta programs without intervening the internal reasoning function. (Best viewed in color)
Meta Reasoning and Learning. Meta-reasoning is the study about systems which are able to reason about its operation, i.e., a system capable of meta-reasoning may be able to reflect, or introspect [32], shifting from meta-reasoning to object-level reasoning and vice versa [6, 7]. Compared with imperative programming, it is relatively easier to construct a meta-interpreter using declarative programming. First-order Logic [33] has been the major tool to realize the meta-reasoning systems [34, 35, 36]. For example, Prolog [37] provides very efficient implementations of meta-interpreters realizing different additional features to the language.
Despite early interest in meta-reasoning within classical Inductive Logic Programming (ILP) systems [38, 39, 40], meta-interpreters have remained unexplored within neuro-symbolic AI. Meta-interpreters within classical logic are difficult to be combined with gradient-based machine learning paradigms, e.g., deep neural networks. NEMESYS realizes meta-level reasoning using differentiable forward reasoners in first-order logic, which are able to perform differentiable rule learning on complex visual scenes with deep neural networks [24]. Moreover, NEMESYS paves the way to integrate meta-level reasoning into other neuro-symbolic frameworks, including DeepProbLog [21], Scallop [25] and NeurASP [26], which are rather developed for training neural networks given logic programs using differentiable backward reasoning or answer set semantics. We compare NEMESYS with several popular neuro-symbolic systems in three aspects: whether the system performs meta reasoning, can the same system adapt to solve different tasks and is the system capable of differentiable meta level structure learning. The comparison results are summarized in Table 1.
## 3 Neural Meta-Symbolic Reasoning & Learning
We now introduce NEMESYS, the first neural meta-symbolic reasoning and learning framework. Fig. 2 shows an overview of NEMESYS.
### 3.1 Meta Logic Programming
We describe how meta-level programs are used in the NEMESYS workflow. In Fig. 2, the following object-level clause is given as its input:
| | $\displaystyle\mathtt{\color[rgb]{0,0.6,0}same\_shape\_pair(X,Y)\color[rgb]{ 0,0,0}\texttt{:-}\color[rgb]{0.68,0.36,1}shape(X,Z),shape(Y,Z)\color[rgb]{ 0,0,0}.}$ | |
| --- | --- | --- |
which identifies pairs of objects that have the same shape. The clause is subsequently fed to Meta Converter, which generates meta-level atoms.Using meta predicate $\mathtt{clause}/2$ , the following atom is generated:
| | $\displaystyle\mathtt{clause(\color[rgb]{0,0.6,0}same\_shape\_pair(X,Y),}\color [rgb]{0.68,0.36,1}\mathtt{(shape(X,Z),shape(Y,Z))\color[rgb]{0,0,0}).}$ | |
| --- | --- | --- |
where the meta atom $\mathtt{clause(H,B)}$ represents the object-level clause: $\mathtt{H\texttt{:-}B}$ .
To perform meta-level reasoning, NEMESYS uses meta-level programs, which often refer to meta interpreters, i.e., interpreters written in the language itself, as illustrated in Fig. 2. For example, a naive interpreter, NaiveInterpreter, is defined as:
| | $\displaystyle\mathtt{solve(true)}.$ | |
| --- | --- | --- |
To solve a compound goal $\mathtt{(A,B)}$ , we need first solve $\mathtt{A}$ and then $\mathtt{B}$ . A single goal $\mathtt{A}$ is solved if there is a clause that rewrites the goal to the new goal $\mathtt{B}$ , the body of the clause: $\mathtt{\color[rgb]{0,0.6,0}{A}\texttt{:-}\color[rgb]{0.68,0.36,1}{B}}$ . This process stops for facts, encoded as $\mathtt{clause(fact,true)}$ , since then, $\mathtt{solve(true)}$ will be true.
NEMESYS can employ more enriched meta programs with useful functions by simply changing the meta programs, without modifying the internal reasoning function, as illustrated in the bottom right of Fig. 2. ProofTreeInterpreter, an interpreter that produces proof trees along with reasoning, is defined as:
| | $\displaystyle\mathtt{solve(A,(A\texttt{:-}true)).}$ | |
| --- | --- | --- |
where $\mathtt{solve(A,Proof)}$ checks if atom $\mathtt{A}$ is true with proof tree $\mathtt{Proof}$ . Using this meta-program, NEMESYS can perform reasoning with integrated proof tree generation.
Now, let us devise the differentiable meta-level reasoning pipeline, which enables NEMESYS to reason and learn flexibly.
### 3.2 Differentiable Meta Programming
NEMESYS employs differentiable forward reasoning [24], which computes logical entailment using tensor operations in a differentiable manner, by adapting it to the meta-level atoms and clauses.
We define a meta-level reasoning function $f^{\mathit{reason}}_{(\mathcal{C},\mathbf{W})}:[0,1]^{G}\rightarrow[0,1]^{G}$ parameterized by meta-rules $\mathcal{C}$ and their weights $\mathbf{W}$ . We denote the set of meta-rules by $\mathcal{C}$ , and the set of all of the meta-ground atoms by $\mathcal{G}$ . $\mathcal{G}$ contains all of the meta-ground atoms produced by a given FOL language. We consider ordered sets here, i.e., each element has its index. We denote the size of the sets as: $G=|\mathcal{G}|$ and $C=|\mathcal{C}|$ . We denote the $i$ -th element of vector $\mathbf{x}$ by $\mathbf{x}[i]$ , and the $(i,j)$ -th element of matrix $\mathbf{X}$ by $\mathbf{X}[i,j]$ .
First, NEMESYS converts visual input to a valuation vector $\mathbf{v}\in[0,1]^{G}$ , which maps each meta atom to a probabilistic value (Fig. 2 Meta Converter). For example,
$$
\mathbf{v}=\blockarray{cl}\block{[c]l}0.98&\mathtt{solve(color(obj1,\ cyan))}
\\
0.01\mathtt{solve(color(obj1,\ red))}\\
0.95\mathtt{clause(same\_shape\_pair(\ldots),\ (shape(\ldots),\ \ldots))}\\
$$
represents a valuation vector that maps each meta-ground atom to a probabilistic value. For readability, only selected atoms are shown. NEMESYS computes logical entailment by updating the initial valuation vector $\mathbf{v}^{(0)}$ for $T$ times to $\mathbf{v}^{(T)}$ .
Subsequently, we compose the reasoning function that computes logical entailment. We now describe each step in detail.
(Step 1) Encode Logic Programs to Tensors.
To achieve differentiable forward reasoning, each meta-rule is encoded to a tensor representation. Let $S$ be the maximum number of substitutions for existentially quantified variables in $\mathcal{C}$ , and $L$ be the maximum length of the body of rules in $\mathcal{C}$ . Each meta-rule $C_{i}\in\mathcal{C}$ is encoded to a tensor ${\bf I}_{i}\in\mathbb{N}^{G\times S\times L}$ , which contains the indices of body atoms. Intuitively, $\mathbf{I}_{i}[j,k,l]$ is the index of the $l$ -th fact (subgoal) in the body of the $i$ -th rule to derive the $j$ -th fact with the $k$ -th substitution for existentially quantified variables. We obtain $\mathbf{I}_{i}$ by firstly grounding the meta rule $C_{i}$ , then computing the indices of the ground body atoms, and transforming them into a tensor.
(Step 2) Assign Meta-Rule Weights.
We assign weights to compose the reasoning function with several meta-rules as follows: (i) We fix the target programs’ size as $M$ , i.e., we try to select a meta-program with $M$ meta-rules out of $C$ candidate meta rules. (ii) We introduce $C$ -dimensional weights $\mathbf{W}=[{\bf w}_{1},\ldots,{\bf w}_{M}]$ where $\mathbf{w}_{i}\in\mathbb{R}^{C}$ . (iii) We take the softmax of each weight vector ${\bf w}_{j}\in\mathbf{W}$ and softly choose $M$ meta rules out of $C$ meta rules to compose the differentiable meta program.
(Step 3) Perform Differentiable Inference.
We compute $1$ -step forward reasoning using weighted meta-rules, then we recursively perform reasoning to compute $T$ -step reasoning.
(i) Reasoning using one rule. First, for each meta-rule $C_{i}\in\mathcal{C}$ , we evaluate body atoms for different grounding of $C_{i}$ by computing:
$$
\displaystyle b_{i,j,k}^{(t)}=\prod_{1\leq l\leq L}{\bf gather}({\bf v}^{(t)},
{\bf I}_{i})[j,k,l], \tag{1}
$$
where $\mathbf{gather}:[0,1]^{G}\times\mathbb{N}^{G\times S\times L}\rightarrow[0,1]^ {G\times S\times L}$ is:
$$
\displaystyle\mathbf{gather}({\bf x},{\bf Y})[j,k,l]={\bf x}[{\bf Y}[j,k,l]], \tag{2}
$$
and $b^{(t)}_{i,j,k}\in[0,1]$ . The $\mathbf{gather}$ function replaces the indices of the body atoms by the current valuation values in $\mathbf{v}^{(t)}$ . To take logical and across the subgoals in the body, we take the product across valuations. $b_{i,j,k}^{(t)}$ represents the valuation of body atoms for $i$ -th meta-rule using $k$ -th substitution for the existentially quantified variables to deduce $j$ -th meta-ground atom at time $t$ .
Now we take logical or softly to combine all of the different grounding for $C_{i}$ by computing $c^{(t)}_{i,j}\in[0,1]$ :
$$
\displaystyle c^{(t)}_{i,j}=\mathit{softor}^{\gamma}(b_{i,j,1}^{(t)},\ldots,b_
{i,j,S}^{(t)}), \tag{3}
$$
where $\mathit{softor}^{\gamma}$ is a smooth logical or function:
$$
\displaystyle\mathit{softor}^{\gamma}(x_{1},\ldots,x_{n})=\gamma\log\sum_{1
\leq i\leq n}\exp(x_{i}/\gamma), \tag{4}
$$
where $\gamma>0$ is a smooth parameter. Eq. 4 is an approximation of the max function over probabilistic values based on the log-sum-exp approach [41].
(ii) Combine results from different rules. Now we apply different meta-rules using the assigned weights by computing:
$$
\displaystyle h_{j,m}^{(t)}=\sum_{1\leq i\leq C}w^{*}_{m,i}\cdot c_{i,j}^{(t)}, \tag{5}
$$
where $h_{j,m}^{(t)}\in[0,1]$ , $w^{*}_{m,i}=\exp(w_{m,i})/{\sum_{i^{\prime}}\exp(w_{m,i^{\prime}})}$ , and $w_{m,i}=\mathbf{w}_{m}[i]$ . Note that $w^{*}_{m,i}$ is interpreted as a probability that meta-rule $C_{i}\in\mathcal{C}$ is the $m$ -th component. We complete the $1$ -step forward reasoning by combining the results from different weights:
$$
\displaystyle r_{j}^{(t)}=\mathit{softor}^{\gamma}(h_{j,1}^{(t)},\ldots,h_{j,M
}^{(t)}). \tag{6}
$$
Taking $\mathit{softor}^{\gamma}$ means that we compose $M$ softly chosen rules out of $C$ candidate meta-rules.
(iii) Multi-step reasoning. We perform $T$ -step forward reasoning by computing $r_{j}^{(t)}$ recursively for $T$ times: $v^{(t+1)}_{j}=\mathit{softor}^{\gamma}(r^{(t)}_{j},v^{(t)}_{j})$ . Updating the valuation vector for $T$ -times corresponds to computing logical entailment softly by $T$ -step forward reasoning. The whole reasoning computation Eq. 1 - 6 can be implemented using efficient tensor operations.
## 4 Experiments
With the methodology of NEMESYS established, we subsequently provide empirical evidence of its benefits over neural baselines and object-level neuro-symbolic approaches: (1) NEMESYS can emulate a differentiable forward reasoner, i.e., it is a sufficient implementation of object-centric reasoners with a naive meta program. (2) NEMESYS is capable of differentiable meta-level reasoning, i.e., it can integrate additional useful functions using devised meta-rules. We demonstrate this advantage by solving tasks of proof-tree generation, relevance propagation, automated planning, and causal reasoning. (3) NEMESYS can perform parameter and structure learning efficiently using gradient descent, i.e., it can perform learning on meta-level programs.
In our experiments, we implemented NEMESYS in Python using PyTorch, with CPU: intel i7-10750H and RAM: 16 GB.
| | NEMESYS | ResNet50 | YOLO+MLP |
| --- | --- | --- | --- |
| Twopairs | 100.0 $\bullet$ | 50.81 | 98.07 $\circ$ |
| Threepairs | 100.0 $\bullet$ | 51.65 | 91.27 $\circ$ |
| Closeby | 100.0 $\bullet$ | 54.53 | 91.40 $\circ$ |
| Red-Triangle | 95.6 $\bullet$ | 57.19 | 78.37 $\circ$ |
| Online/Pair | 100.0 $\bullet$ | 51.86 | 66.19 $\circ$ |
| 9-Circles | 95.2 $\bullet$ | 50.76 $\circ$ | 50.76 $\circ$ |
Table 2: Performance (accuracy; the higher, the better) on the test split of Kandinsky patterns. The best-performing models are denoted using $\bullet$ , and the runner-up using $\circ$ . In Kandinsky patterns, NEMESYS produced almost perfect accuracies outperforming neural baselines, where YOLO+MLP is a neural baseline using pre-trained YOLO [42] combined with a simple MLP, showing the capability of solving complex visual reasoning tasks. The performances of baselines are shown in [15].
### 4.1 Visual Reasoning on Complex Pattenrs
Let us start off by showing that our NEMESYS is able to obtain the equivalent high-quality results as a standard object-level reasoner but on the meta-level. We considered tasks of Kandinsky patterns [19, 43] and CLEVR-Hans [14] We refer to [14] and [15] for detailed explanations of the used patterns for CLEVR-Hans and Kandinsky patterns.. CLEVR-Hans is a classification task of complex 3D visual scenes. We compared NEMESYS with the naive interpreter against neural baselines and a neuro-symbolic baseline, $\alpha$ ILP [24], which achieves state-of-the-art performance on these tasks. For all tasks, NEMESYS achieved exactly the same performances with $\alpha$ ILP since the naive interpreter realizes a conventional object-centric reasoner. Moreover, as shown in Table 2 and Table 3, NEMESYS outperformed neural baselines on each task. This shows that NEMESYS is able to solve complex visual reasoning tasks using meta-level reasoning without sacrificing performance.
In contrast to the object-centric reasoners, e.g., $\alpha$ ILP. NEMESYS can easily integrate additional useful functions by simply switching or adding meta programs without modifying the internal reasoning function, as shown in the next experiments.
### 4.2 Explainable Logical Reasoning
One of the major limitations of differentiable forward chaining [16, 17, 24] is that they lack the ability to explain the reasoning steps and their evidence. We show that NEMESYS achieves explainable reasoning by incorporating devised meta-level programs.
Reasoning with Integrated Proof Tree Generation
First, we demonstrate that NEMESYS can generate proof trees while performing reasoning, which the previous differentiable forward reasoners cannot produce since they encode the reasoning function to computational graphs using tensor operations and observe only their input and output. Since NEMESYS performs reasoning using meta-level programs, it can add the function to produce proof trees into its underlying reasoning mechanism simply by devising them, as illustrated in Fig 2.
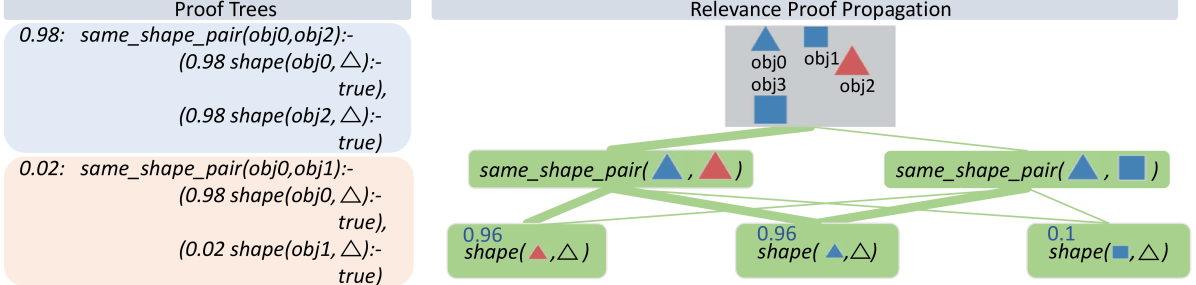
We use Kandinsky patterns [20], a benchmark of visual reasoning whose classification rule is defined on high-level concepts of relations and attributes of objects. We illustrate the input on the top right of Fig. 3 that belongs to a pattern: ”There are two pairs of objects that share the same shape.” Given the visual input, proof trees generated using the ProofTreeInterpreter in Sec. 3.1 are shown on the left two boxes of Fig. 3. In this experiment, NEMESYS identified the relations between objects, and the generated proof trees explain the intermediate reasoning steps.
<details>
<summary>x3.png Details</summary>
### Visual Description
## Diagram: Proof Trees and Relevance Proof Propagation
### Overview
The image presents two distinct sections: **Proof Trees** (left) and **Relevance Proof Propagation** (right). The left section contains hierarchical proof trees with probabilistic values and function calls, while the right section illustrates how relevance is propagated between objects based on shape similarity.
### Components/Axes
#### Proof Trees (Left)
- **Structure**: Two proof trees, one in **blue** (high confidence) and one in **orange** (low confidence).
- **Root Nodes**:
- **Blue Tree**:
- Label: `same_shape_pair(obj0, obj2)`
- Probability: `0.98`
- Child Nodes:
- `shape(obj0, △)` with probability `0.98` (returns `true`)
- `shape(obj2, △)` with probability `0.98` (returns `true`)
- **Orange Tree**:
- Label: `same_shape_pair(obj0, obj1)`
- Probability: `0.02`
- Child Nodes:
- `shape(obj0, △)` with probability `0.98` (returns `true`)
- `shape(obj1, △)` with probability `0.02` (returns `true`)
#### Relevance Proof Propagation (Right)
- **Objects**:
- `obj0` (blue triangle), `obj1` (red triangle), `obj2` (blue square), `obj3` (blue square).
- **Nodes**:
- `same_shape_pair(△, △)` with probability `0.96`
- `same_shape_pair(△, □)` with probability `0.1`
- `same_shape_pair(△, △)` with probability `0.96`
- **Connections**:
- Lines link nodes via the `shape()` function, indicating relationships between objects.
- **Legend**:
- Blue triangle: `obj0`
- Red triangle: `obj1`
- Blue square: `obj2` and `obj3`
### Detailed Analysis
#### Proof Trees
- **Blue Tree**:
- High confidence (`0.98`) in `same_shape_pair(obj0, obj2)`.
- Both child nodes (`shape(obj0, △)` and `shape(obj2, △)`) confirm the shape is triangular with high probability.
- **Orange Tree**:
- Low confidence (`0.02`) in `same_shape_pair(obj0, obj1)`.
- Child node `shape(obj1, △)` has a low probability (`0.02`), suggesting uncertainty about `obj1`'s shape.
#### Relevance Proof Propagation
- **Nodes**:
- `same_shape_pair(△, △)` (probability `0.96`): High confidence in similarity between triangles (e.g., `obj0` and `obj1`).
- `same_shape_pair(△, □)` (probability `0.1`): Low confidence in similarity between triangle and square (e.g., `obj0` and `obj2`).
- `same_shape_pair(△, △)` (probability `0.96`): Repeats the high-confidence triangle-triangle pairing.
- **Flow**:
- The `shape()` function propagates relevance between objects. For example, `obj0` (triangle) is linked to `obj1` (triangle) with high confidence, but to `obj2` (square) with low confidence.
### Key Observations
1. **High Confidence in Triangle-Triangle Similarity**:
- `same_shape_pair(△, △)` nodes consistently show `0.96` probability, indicating strong agreement on triangular shapes.
2. **Low Confidence in Triangle-Square Similarity**:
- `same_shape_pair(△, □)` has only `0.1` probability, suggesting minimal relevance between triangles and squares.
3. **Object Relationships**:
- `obj0` (triangle) is strongly linked to `obj1` (triangle) but weakly to `obj2` (square).
- `obj2` and `obj3` (both squares) are not directly compared in the diagram.
### Interpretation
- **Proof Trees**:
- The blue tree confirms `obj0` and `obj2` share the same triangular shape with high confidence. The orange tree, however, shows near-zero confidence in `obj0` and `obj1` sharing the same shape, despite both being triangles. This discrepancy might indicate an error in the orange tree’s logic or a contextual factor (e.g., `obj1` being a different type of triangle).
- **Relevance Propagation**:
- The system prioritizes shape similarity for relevance. Triangles (`obj0`, `obj1`) are highly relevant to each other, while squares (`obj2`, `obj3`) are less relevant to triangles. The low probability for `△-□` pairs suggests the system distinguishes between shapes strictly.
- **Anomalies**:
- The orange tree’s `shape(obj1, △)` node has a low probability (`0.02`) despite `obj1` being a triangle. This could imply a misclassification or a contextual constraint (e.g., `obj1` being a "non-standard" triangle).
- `obj3` (blue square) is included in the legend but not explicitly used in the propagation diagram, raising questions about its role.
### Conclusion
The diagram illustrates a probabilistic framework for determining shape similarity and relevance between objects. High-confidence matches (e.g., triangles) drive relevance, while low-confidence pairs (e.g., triangle-square) are deprioritized. The orange tree’s low confidence in `obj0-obj1` similarity contradicts the high confidence in `obj0-obj2`, highlighting potential inconsistencies or contextual dependencies in the system’s logic.
</details>
Figure 3: NEMESYS explains its reasoning with proof trees and relevance proof propagation. Given the image involving four objects (top, right), NEMESYS provides two proofs (two boxes on the left, true atom’s proof (blue box) and false atom’s proof (cream box)). They can be leveraged to decompose the prediction of NEMESYS into relevance scores per (ground) atom (right). First, a standard forward reasoning is performed to compute the prediction. Then, the model’s prediction is backward propagated through the proof trees by applying specific decomposition rules, see main text. The numbers next to each (ground) atom are the relevance scores computed. The larger the score is, the more impact an (ground) atom has on the final prediction, and the line width is wider. For brevity, the complete proof tree is not depicted here. As our baseline comparison, we extend DeepProbLog [21] to DeepMetaProbLog. However, DeepMetaProbLog only provides proof tree for true atoms (top left blue box). (Best viewed in color)
| | CLEVR-Hans3 | CLEVR-Hans7 | | |
| --- | --- | --- | --- | --- |
| Validation | Test | Validation | Test | |
| CNN | 99.55 $\circ$ | 70.34 | 96.09 | 84.50 |
| NeSy (Default) | 98.55 | 81.71 | 96.88 $\circ$ | 90.97 |
| NeSy-XIL | 100.00 $\bullet$ | 91.31 $\circ$ | 98.76 $\bullet$ | 94.96 $\bullet$ |
| NEMESYS | 98.18 | 98.40 $\bullet$ | 93.60 | 92.19 $\circ$ |
Table 3: Performance (accuracy; the higher, the better) on the validation/test splits of 3D CLEVR-Hans data sets. The best-performing models are denoted using $\bullet$ , and the runner-up using $\circ$ . In CLEVR-Hans, NEMESYS outperformed neural baselines including: (CNN) A ResNet [44], (NeSy) A model combining object-centric model (Slot Attention [45] and Set Transformer [46], and (NeSy-XIL) Slot Attention and Set Transformer using human feedback. NEMESYS tends to show less overfitting and performs similarly to a neuro-symbolic approach using human feedback (NeSy-XIL). The performances of baselines are shown in [14] and [15].
Let’s first consider the top left blue box depicted in Fig. 3 (for readability, we only show the proof part of meta atoms in the image). The weighted ground atom $\mathtt{0.98:}\mathtt{same\_shape\_pair(obj0,obj2)}$ proves $\mathtt{obj0}$ and $\mathtt{obj2}$ are of the same shape with the probability $0.98$ . The proof part shows that NEMESYS comes to this conclusion since both objects are triangle with probabilities of $\mathtt{0.98}$ and in turn it can apply the rule for $\mathtt{same\_shape\_pair}$ . We use this example to show how to compute the weight of the meta atoms inside NEMESYS. With the proof-tree meta rules and corresponding meta ground atoms:
| | $\displaystyle\mathtt{0.98:}\ \color[rgb]{0.5,0,1}\mathtt{solve(shape(obj0,} \text{\includegraphics[height=6.45831pt]{plots/triangle.png}}\mathtt{),(shape( obj0,}\text{\includegraphics[height=6.45831pt]{plots/triangle.png}}\mathtt{), true).}$ | |
| --- | --- | --- |
The weight of the meta ground atoms are computed by Meta Converter when mapping the probability of meta ground atoms to a continuous value. The meta ground atom says that $\mathtt{shape(obj0,\includegraphics[height=6.45831pt]{plots/triangle.png})}$ is true with a high probability of $0.98$ because $\mathtt{shape(obj0,\includegraphics[height=6.45831pt]{plots/triangle.png})}$ can be proven.
With the two meta ground atoms at hand, we infer the weight of the meta atom with compound goals $\color[rgb]{0,0.6,0}\mathtt{solve((shape(obj0,\includegraphics[height=6.45831 pt]{plots/triangle.png}),shape(obj2,\includegraphics[height=6.45831pt]{plots/ triangle.png})),(ProofA,ProofB))}$ , based on the first meta rule (for readability, we omit writing out the proof part). Then, we use the second meta rule to compute the weight of the meta atom $\color[rgb]{0.68,0.36,1}\mathtt{solve}\mathtt{(same\_shape\_pair(obj0,obj2)}, \mathtt{(Proof))}$ , using the compound goal meta atom $\color[rgb]{0,0.6,0}\mathtt{solve((shape(obj0,\includegraphics[height=6.45831 pt]{plots/triangle.png}),shape(obj2,\includegraphics[height=6.45831pt]{plots/ triangle.png})),(ProofA,ProofB))}$ and the meta atom $\mathtt{clause}\mathtt{(same\_shape\_pair(obj0,obj2)},\mathtt{(shape(obj0, \includegraphics[height=6.45831pt]{plots/triangle.png})},\mathtt{shape(obj2, \includegraphics[height=6.45831pt]{plots/triangle.png})))}$ .
In contrast, NEMESYS can explicitly show that $\mathtt{obj0}$ and $\mathtt{obj1}$ have a low probability of being of the same shape (Fig. 3 left bottom cream box). This proof tree shows that the goal $\mathtt{shape(obj1,\includegraphics[height=6.45831pt]{plots/triangle.png})}$ has a low probability of being true. Thus, as one can read off, $\mathtt{obj0}$ is most likely a triangle, while $\mathtt{obj1}$ is most likely not a triangle. In turn, NEMESYS concludes with a low probability that $\mathtt{same\_shape\_pair(obj0,obj1)}$ is true, only a probability of $0.02$ . NEMESYS can produce all the information required to explain its decisions by simply changing the meta-program, not the underlying reasoning system.
Using meta programming to extend DeepProbLog to produce proof trees as a baseline comparison. Since DeepProbLog [21] doesn’t support generating proof trees in parallel with reasoning, we extend DeepProbLog [21] to DeepMetaProblog to generate proof trees as our baseline comparison using ProbLog [47]. However, the proof tree generated by DeepMetaProbLog is limited to the ‘true’ atoms (Fig. 3 top left blue box), i.e., DeepMetaProbLog is unable to generate proof tree for false atoms such as $\mathtt{same\_shape\_pair(obj0,obj1)}$ (Fig. 3 bottom left cream box) due to backward reasoning.
Logical Relevance Proof Propagation (LRP ${}^{2}$ )
Inspired by layer-wise relevance propagation (LRP) [48], which produces explanations for feed-forward neural networks, we now show that, LRP can be adapted to logical reasoning systems using declarative languages in NEMESYS, thereby enabling the reasoning system to articulate the rationale behind its decisions, i.e., it can compute the importance of ground atoms for a query by having access to proof trees. We call this process: logical relevance proof propagation (LRP ${}^{2}$ ).
The original LRP technique decomposes the prediction of the network, $f(\mathbf{x})$ , onto the input variables, $\mathbf{x}=\left(x_{1},\ldots,x_{d}\right)$ , through a decomposition $\mathbf{R}=\left(R_{1},\ldots,R_{d}\right)$ such that $\sum\nolimits_{p=1}^{d}R_{p}=f(\mathbf{x})\;$ . Given the activation $a_{j}=\rho\left(\sum_{i}a_{i}w_{ij}+b_{j}\right)$ of neuron, where $i$ and $j$ denote the neuron indices at consecutive layers, and $\sum_{i}$ and $\sum_{j}$ represent the summation over all neurons in the respective layers, the propagation of LRP is defined as: $R_{i}=\sum\nolimits_{j}z_{ij}({\sum\nolimits_{i}z_{ij}})^{-1}R_{j},$ where $z_{ij}$ is the contribution of neuron $i$ to the activation $a_{j}$ , typically some function of activation $a_{i}$ and the weight $w_{ij}$ . Starting from the output $f(\mathbf{x})$ , the relevance is computed layer by layer until the input variables are reached.
To adapt this in NEMESYS to ground atoms and proof trees, we have to be a bit careful, since we cannot deal with the uncountable, infinite real numbers within our logic. Fortunately, we can make use of the weight associated with ground atoms. That is, our LRP ${}^{2}$ composes meta-level atoms that represent the relevance of an atom given proof trees and associates the relevance scores to the weights of the meta-level atoms.
To this end, we introduce three meta predicates: $\mathtt{rp/3/[goal,proofs,atom]}$ that represents the relevance score an $\mathtt{atom}$ has on the $\mathtt{goal}$ in given $\mathtt{proofs}$ , $\mathtt{assert\_probs/1/[atom]}$ that looks up the valuations of the ground atoms and maps the probability of the $\mathtt{atom}$ to its weight. $\mathtt{rpf/2/[proof,atom]}$ represents how much an $\mathtt{atom}$ contributes to the $\mathtt{proof}$ . The atom $\mathtt{assert\_probs((Goal\texttt{:-}Body))}$ asserts the probability of the atom $\mathtt{(Goal\texttt{:-}Body)}$ . With them, the meta-level program of LRP ${}^{2}$ is:
| | $\displaystyle\mathtt{rp(Goal,Body,Atom)}\texttt{:-}\mathtt{assert\_probs((Goal \texttt{:-}Body))},$ | |
| --- | --- | --- |
where $\mathtt{rp(Goal,Proof,Atom)}$ represents the relevance score an $\mathtt{Atom}$ has on the $\mathtt{Goal}$ in a $\mathtt{Proof}$ , i.e., we interpret the associated weight with atom $\mathtt{rp(Goal,Proof,Atom)}$ as the actual relevance score of $\mathtt{Atom}$ has on $\mathtt{Goal}$ given $\mathtt{Proof}$ . The higher the weight of $\mathtt{rp(Goal,Proof,Atom)}$ is, the larger the impact of $\mathtt{Atom}$ has on the $\mathtt{Goal}$ .
Let us go through the meta rules of LRP ${}^{2}$ . The first rule defines how to compute the relevance score of an $\mathtt{Atom}$ given the $\mathtt{Goal}$ under the condition of a $\mathtt{Body}$ (a single $\mathtt{Proof}$ ). The relevance score is computed by multiplying the weight of the $\mathtt{Body}$ , the weight of a clause $\mathtt{(Goal\texttt{:-}Body)}$ and the importance score of the $\mathtt{Atom}$ given the $\mathtt{Body}$ . The second to the seventh rule defines how to calculate the importance score of an $\mathtt{Atom}$ given a $\mathtt{Proof}$ . These six rules loop over each atom of the given $\mathtt{Proof}$ , once it detects the $\mathtt{Atom}$ inside the given $\mathtt{Proof}$ , the importance score will be set to the weight of the $\mathtt{Atom}$ , another case is that the $\mathtt{Atom}$ is not in $\mathtt{Proof}$ , in that case, in the seventh rule, $\mathtt{norelate}$ will set the importance score to a small value. The eighth and ninth rules amalgamate the results from different proofs, i.e., the score from each proof tree is computed recursively during forward reasoning. The scores for the same target (the pair of $\mathtt{Atom}$ and $\mathtt{Goal}$ ) are combined by the $\mathit{softor}$ operation. The score of an atom given several proofs is computed by taking logical or softly over scores from each proof.
With these nine meta rules at hand, together with the proof tree, NEMESYS is able to perform the relevance proof propagation for different atoms. We consider using the proof tree generated in Sec. 4.2 and set the goal as: $\mathtt{same\_shape\_pair(obj0,obj2)}$ . Fig. 3 (right) shows LRP ${}^{2}$ -based explanations generated by NEMESYS. The relevance scores of different ground atoms are listed next to each (ground) atom. As we can see, the atoms $\mathtt{shape(obj0,\includegraphics[height=6.45831pt]{plots/triangle.png})}$ and $\mathtt{shape(obj2,\includegraphics[height=6.45831pt]{plots/triangle.png})}$ have the largest impact on the goal $\mathtt{same\_shape\_pair(obj0,obj2)}$ , while $\mathtt{shape(obj1,\includegraphics[height=6.45831pt]{plots/triangle.png})}$ have much smaller impact.
By providing proof tree and LRP ${}^{2}$ , NEMESYS computes the precise effect of a ground atom on the goal and produces an accurate proof to support its conclusion. This approach is distinct from the Most Probable Explanation (MPE) [49], which generates the most probable proof rather than the exact proof.
<details>
<summary>extracted/5298395/images/plan/0v.png Details</summary>
### Visual Description
## Photograph: Three Objects on Neutral Surface
### Overview
The image depicts three distinct 3D objects arranged on a neutral gray surface with soft, diffused lighting. No textual elements, labels, or annotations are present. The composition emphasizes contrast in size, color, and material properties.
### Components/Axes
- **Objects**:
1. **Large Purple Sphere**: Matte finish, centrally positioned.
2. **Small Shiny Purple Sphere**: Glossy surface, reflective highlights, located to the left of the large sphere.
3. **Red Cylinder**: Metallic sheen, positioned to the right of the large sphere.
- **Background**: Uniform gray with subtle gradient shading to suggest depth.
- **Lighting**: Soft shadows beneath objects, indicating a single light source above.
### Detailed Analysis
- **Large Purple Sphere**:
- Size: Dominates the composition, occupying ~40% of the frame.
- Material: Non-reflective, uniform matte texture.
- Position: Centered, serving as the focal point.
- **Small Shiny Purple Sphere**:
- Size: ~1/5th the diameter of the large sphere.
- Material: Highly reflective, with visible specular highlights.
- Position: Left of the large sphere, slightly offset.
- **Red Cylinder**:
- Size: Similar height to the large sphere but narrower in diameter.
- Material: Metallic, with subtle reflections of the environment.
- Position: Right of the large sphere, aligned horizontally with the small sphere.
### Key Observations
1. **Contrast in Materiality**: The matte vs. glossy finishes create visual tension between the purple spheres.
2. **Color Harmony**: Both purple objects share a hue but differ in saturation and reflectivity.
3. **Spatial Balance**: The red cylinder breaks the symmetry, anchoring the composition on the right.
4. **Lighting Effects**: Shadows and highlights emphasize three-dimensionality and material properties.
### Interpretation
The arrangement suggests a study in material contrast and spatial relationships. The absence of text implies the focus is on visual storytelling through form and texture. The large matte sphere may symbolize stability or simplicity, while the shiny sphere and red cylinder introduce dynamism and modernity. The neutral background ensures no distractions, directing attention to the objects’ intrinsic properties.
**Note**: No factual or numerical data is present in the image. Analysis is limited to visual and material characteristics.
</details>
<details>
<summary>extracted/5298395/images/plan/1v0.png Details</summary>
### Visual Description
## Photograph: Three Objects on a Neutral Surface
### Overview
The image depicts three distinct 3D objects arranged on a flat, neutral gray surface. The composition includes two spheres and one cylinder, varying in size, color, and material properties. Lighting is soft and diffused, casting subtle shadows to emphasize depth and texture. No textual elements, labels, or annotations are present.
### Components/Axes
- **Objects**:
1. **Large Purple Sphere**: Positioned at the top-left relative to the other objects. Matte finish, uniform color.
2. **Small Shiny Purple Sphere**: Located near the center, slightly below and to the right of the large sphere. Reflective surface with specular highlights.
3. **Red Cylinder**: Positioned at the bottom-right, aligned horizontally. Glossy finish with visible reflections.
- **Background**: Uniform gray with no patterns or textures.
- **Lighting**: Soft, even illumination from above, creating faint shadows beneath each object.
### Detailed Analysis
- **Large Purple Sphere**:
- Size: Approximately 2.5x the diameter of the small sphere.
- Material: Non-reflective, matte surface.
- Position: Top-left quadrant of the image.
- **Small Shiny Purple Sphere**:
- Size: Approximately 1/3 the diameter of the large sphere.
- Material: Highly reflective, metallic-like surface.
- Position: Centered horizontally, slightly lower than the large sphere.
- **Red Cylinder**:
- Size: Height and diameter roughly equal to the small sphere’s diameter.
- Material: Glossy, with visible light reflections on its curved surface.
- Position: Bottom-right quadrant, aligned parallel to the image’s horizontal axis.
### Key Observations
1. **Material Contrast**: The matte purple sphere contrasts with the reflective purple and red objects, suggesting a study in surface properties.
2. **Color Harmony**: Two purple objects (matte and shiny) paired with a red cylinder create a balanced yet dynamic color palette.
3. **Spatial Arrangement**: Objects are evenly spaced, avoiding visual clutter. The red cylinder anchors the composition in the lower-right.
4. **Absence of Data**: No numerical values, labels, or contextual text are present, indicating the image may serve as a visual study rather than a data-driven chart.
### Interpretation
This image likely serves as a reference for 3D rendering, material studies, or lighting experiments. The deliberate placement of objects with varying reflectivity and color highlights how light interacts with different surfaces. The lack of textual elements suggests the focus is purely on visual composition and material properties. The soft lighting and neutral background minimize distractions, emphasizing the objects’ forms and textures.
**Note**: No factual or numerical data is extractable from this image. It functions as a static visual study rather than a data visualization.
</details>
<details>
<summary>extracted/5298395/images/plan/1v1.png Details</summary>
### Visual Description
## Photograph: 3D Rendered Objects on Neutral Surface
### Overview
The image depicts a minimalist 3D render of three geometric objects arranged linearly on a flat, neutral gray surface. The composition includes two spheres and one cylinder, with no textual annotations, legends, or axis markers present. Soft ambient lighting creates subtle shadows, suggesting a light source from the upper left.
### Components/Axes
- **Objects**:
1. **Large Purple Sphere**: Positioned on the left, occupying ~30% of the image width.
2. **Small Purple Sphere**: Centered between the large sphere and the cylinder, ~1/3 the diameter of the large sphere.
3. **Red Cylinder**: Rightmost object, matching the height of the small sphere but narrower in diameter.
- **Surface**: Uniform gray plane with no texture or markings.
- **Lighting**: Soft shadows indicate a single light source (upper left), casting faint shadows toward the lower right.
### Detailed Analysis
- **Spatial Arrangement**: Objects are aligned horizontally with equal spacing (~20% of image width between each).
- **Color Contrast**: Purple (matte finish) vs. red (glossy finish) creates visual distinction.
- **Scale**: No reference objects for absolute size measurement; relative proportions are consistent.
### Key Observations
- No textual or numerical data embedded in the image.
- Objects are static with no implied motion or interaction.
- Shadows confirm a light source but lack complexity (e.g., no multiple light sources or dynamic lighting effects).
### Interpretation
This image appears to be a conceptual or illustrative render, likely used to demonstrate 3D modeling, lighting techniques, or spatial composition principles. The absence of labels or data suggests it is not intended to convey quantitative information but rather qualitative visual relationships (e.g., size hierarchy, color contrast, alignment). The simplicity implies a focus on foundational design elements rather than complex data visualization.
## No factual or numerical data present in the image.
</details>
<details>
<summary>extracted/5298395/images/plan/final.png Details</summary>
### Visual Description
## Photograph: Three Objects on a Neutral Surface
### Overview
The image depicts a minimalist still-life composition featuring three distinct objects arranged on a flat, neutral gray surface. The lighting is soft and diffused, casting subtle shadows beneath the objects. No textual elements, labels, or annotations are visible.
### Components/Axes
- **Objects**:
1. **Large Purple Sphere**: Positioned on the left side of the frame.
2. **Small Purple Sphere**: Centered between the large sphere and the red cylinder.
3. **Red Cylinder**: Located on the right side of the frame.
- **Background**: Uniform gray with no discernible texture or patterns.
- **Lighting**: Soft, even illumination from above, creating faint shadows beneath the objects.
### Detailed Analysis
- **Large Purple Sphere**:
- Dominates the left third of the image.
- Matte finish with no reflective highlights.
- Shadow extends slightly to the right, indicating a light source from the upper left.
- **Small Purple Sphere**:
- Approximately 1/3 the diameter of the large sphere.
- Positioned equidistant from the large sphere and the red cylinder.
- Slightly reflective surface, suggesting a glossy material.
- **Red Cylinder**:
- Vertical orientation, standing upright.
- Matte finish with uniform coloration.
- Shadow aligns with the light source direction.
### Key Observations
- The objects are evenly spaced along the horizontal axis, creating a balanced composition.
- The purple spheres share a color but differ in size and reflectivity, suggesting intentional contrast.
- The red cylinder introduces a warm color contrast against the cool purple tones.
- No discernible motion or interaction between objects; all appear static.
### Interpretation
This image likely serves as a study in composition, color theory, or material contrast. The absence of text or contextual elements implies it is not data-driven but rather an artistic or illustrative representation. The deliberate spacing and color choices may symbolize balance, hierarchy, or relational dynamics between objects. The lack of textual information or numerical data confirms this is a static visual study rather than a technical diagram or chart.
</details>
Figure 4: Visual Concept Repairing: NEMESYS achieves planning by performing differentiable meta-level reasoning. The left most image shows the start state, and the right most image shows the goal state. Taking these states as inputs, NEMESYS performs differentiable forward reasoning using meta-level clauses that simulate the planning steps and generate intermediate states (two images in the middle) and actions from start state to reach the goal state. (Best viewed in color)
### 4.3 Avoiding Infinite Loops
Differentiable forward chaining [17], unfortunately, can generate infinite computations. A pathological example:
| | $\displaystyle\mathtt{edge(a,b).\ edge(b,a).}\ \mathtt{edge(b,c).}\quad\mathtt{ path(A,A,[\ ]).}\quad$ | |
| --- | --- | --- |
<details>
<summary>x4.png Details</summary>
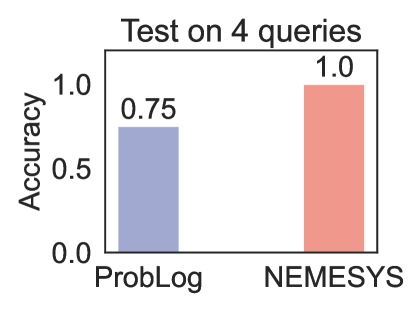
### Visual Description
## Bar Chart: Test on 4 queries
### Overview
The image is a bar chart comparing the accuracy of two systems, "ProbLog" and "NEMESYS," on a test involving 4 queries. The chart uses two vertical bars to represent accuracy values, with "ProbLog" achieving 0.75 accuracy and "NEMESYS" achieving 1.0 accuracy.
### Components/Axes
- **Title**: "Test on 4 queries" (centered at the top of the chart).
- **X-axis**: Labeled with two categories: "ProbLog" (left) and "NEMESYS" (right).
- **Y-axis**: Labeled "Accuracy," scaled from 0.0 to 1.0 in increments of 0.25.
- **Bars**:
- **ProbLog**: Blue bar reaching 0.75 on the y-axis.
- **NEMESYS**: Red bar reaching 1.0 on the y-axis.
- **Legend**: Implied by bar colors (blue for ProbLog, red for NEMESYS), though no explicit legend box is present.
### Detailed Analysis
- **ProbLog**: Accuracy = 0.75 (75%).
- **NEMESYS**: Accuracy = 1.0 (100%).
- **Y-axis Range**: 0.0 to 1.0, with gridlines at 0.25 intervals.
- **Bar Placement**:
- ProbLog bar is centered under the "ProbLog" label on the left.
- NEMESYS bar is centered under the "NEMESYS" label on the right.
### Key Observations
1. **NEMESYS outperforms ProbLog**: NEMESYS achieves perfect accuracy (1.0), while ProbLog scores 0.75.
2. **Query Performance**: The test involved 4 queries, suggesting the accuracy values represent success rates across these queries.
3. **Visual Contrast**: The red bar (NEMESYS) is taller than the blue bar (ProbLog), emphasizing the disparity in performance.
### Interpretation
The data suggests that NEMESYS is significantly more effective than ProbLog for the tested queries, achieving 100% accuracy compared to 75%. This could indicate superior algorithmic design, better handling of edge cases, or more robust query resolution in NEMESYS. The stark difference (25% gap) highlights potential areas for improvement in ProbLog or advantages in NEMESYS's methodology. The use of 4 queries as a test set implies the results are based on a small but controlled evaluation, which may or may not generalize to larger datasets.
</details>
Figure 5: Performance (accuracy; the higher, the better)on four queries. (Best viewed in color)
It defines a simple graph over three nodes $(a,b,c)$ with three edges, $(a-b,b-a,b-c)$ as well as paths in graphs in general. Specifically, $\mathtt{path}/3$ defines how to find a path between two nodes in a recursive way. The base case is $\mathtt{path(A,A,[])}$ , meaning that any node $\mathtt{A}$ is reachable from itself. The recursion then says, if there is an edge from node $\mathtt{A}$ to node $\mathtt{B}$ , and there is a path from node $\mathtt{B}$ to node $\mathtt{C}$ , then there is a path from node $\mathtt{A}$ to node $\mathtt{C}$ . Unfortunately, this generates an infinite loop $\mathtt{[edge(a,b),edge(b,a),edge(a,b),\ldots]}$ when computing the path from $a$ to $c$ , since this path can always be extended potentially also leading to the node $c$ .
Fortunately, NEMESYS allows one to avoid infinite loops by memorizing the proof-depth, i.e., we simply implement a limited proof-depth strategy on the meta-level:
| | $\displaystyle\mathtt{li((A,B),DPT)}\texttt{:-}\mathtt{li(A,DPT)},\mathtt{li(B, DPT).}$ | |
| --- | --- | --- |
With this proof strategy, NEMESYS gets the path $\mathtt{path(a,c,[edge(a,b),edge(b,c)])=true}$ in three steps. For simplicity, we omit the proof part in the atom. Using the second rule and the first rule recursively, the meta interpreter finds $\mathtt{clause(path(a,c),(edge(a,b),path(b,c)))}$ and $\mathtt{clause(path(b,c),(edge(b,c),path(c,c)))}$ . Finally, the meta interpreter finds a clause, whose head is $\mathtt{li(path(c,c),1)}$ and the body is true.
Since forward chaining gets stuck in the infinite loop, we choose ProbLog [47] as our baseline comparison. We test NEMESYS and ProbLog using four queries, including one query which calls the recursive rule. ProbLog fails to return the correct answer on the query which calls the recursive rule. The comparison is summarized in Fig. 5. We provide the four test queries in Appendix A.
### 4.4 Differentiable First-Order Logical Planning
As the fourth meta interpreter, we demonstrate NEMESYS as a differentiable planner. Consider Fig. 4 where NEMESYS was asked to put all objects of a start image onto a line. Each start and goal state is represented as a visual scene, which is generated in the CLEVR [18] environment. By adopting a perception model, e.g., YOLO [42] or slot attention [45], NEMESYS obtains logical representations of the start and end states:
| | $\displaystyle\mathtt{start}$ | $\displaystyle=\{\mathtt{pos(obj0,(1,3)),\ldots,pos(obj4,(2,1))}\},$ | |
| --- | --- | --- | --- |
where $\mathtt{pos/2}$ describes the $2$ -dim positions of objects. NEMESYS solves this planning task by performing differentiable reasoning using the meta-level program:
| | $\displaystyle\mathtt{plan(Start\_state,}\mathtt{New\_state,Goal\_state,[Action ,Old\_stack])}\textbf{:-}$ | |
| --- | --- | --- |
The first meta rule presents the recursive rule for plan generation, and the second rule gives the successful termination condition for the plan when the $\mathtt{Goal\_state}$ is reached, where $\mathtt{equal/2}$ checks whether the $\mathtt{Current\_state}$ is the $\mathtt{Goal\_state}$ and the $\mathtt{planf/3}$ contains $\mathtt{Start\_state}$ , $\mathtt{Goal\_state}$ and the needed action sequences $\mathtt{Move\_stack}$ from $\mathtt{Start\_state}$ to reach the $\mathtt{Goal\_state}$ .
The predicate $\mathtt{plan/4}$ takes four entries as inputs: $\mathtt{Start\_state}$ , $\mathtt{State}$ , $\mathtt{Goal\_state}$ and $\mathtt{Move\_stack}$ . The $\mathtt{move/3}$ predicate uses $\mathtt{Action}$ to push $\mathtt{Old\_state}$ to $\mathtt{New\_state}$ . $\mathtt{condition\_met/2}$ checks if the state’s preconditions are met. When the preconditions are met, $\mathtt{change\_state/2}$ changes the state, and $\mathtt{plan/4}$ continues the recursive search.
To reduce memory usage, we split the move action in horizontal and vertical in the experiment. For example, NEMESYS represents an action to move an object in the horizontal direction right by $\mathtt{1}$ step using meta-level atom:
| | $\displaystyle\mathtt{move(}$ | $\displaystyle\mathtt{move\_right},\mathtt{pos\_hori(Object,X),}\mathtt{pos\_ hori(Object,X}\texttt{+}\mathtt{1)).}$ | |
| --- | --- | --- | --- |
where $\mathtt{move\_right}$ represents the action, $\mathtt{X+1}$ represents arithmetic sums over (positive) integers, encoded as $\mathtt{0,succ(0),succ(succ(0))}$ and so on as terms. Performing reasoning on the meta-level clause with $\mathtt{plan}$ simulates a step as a planner, i.e., it computes preconditions, and applies actions to compute states after taking the actions. Fig. 4 summarizes one of the experiments performed using NEMESYS on the Visual Concept Repairing task. We provided the start and goal states as visual scenes containing varying numbers of objects with different attributes. The left most image of Fig. 4 shows the start state, and the right most image shows the goal state, respectively. NEMESYS successfully moved objects to form a line. For example, to move $\mathtt{obj0}$ from $\mathtt{(1,1)}$ to $\mathtt{(3,1)}$ , NEMESYS deduces:
| | $\displaystyle\mathtt{planf(}$ | $\displaystyle\mathtt{pos\_hori(obj0,1)},\mathtt{pos\_hori(obj0,3),}\mathtt{[ move\_right,move\_right]).}$ | |
| --- | --- | --- | --- |
This shows that NEMESYS is able to perceive objects from an image, reason about the image, and edit the image through planning. To the best of our knowledge, this is the first differentiable neuro-symbolic system equipped with all of these abilities. We provide more Visual Concept Repairing tasks in Appendix B.
### 4.5 Differentiable Causal Reasoning
As the last meta interpreter, we show that NEMESYS exhibits superior performance compared to the existing forward reasoning system by having the causal reasoning ability. Notably, given a causal Bayesian network, NEMESYS can perform the $\mathtt{do}$ operation (deleting the incoming edges of a node) [28] on arbitrary nodes and perform causal reasoning without the necessity of re-executing the entire system, which is made possible through meta-level programming.
<details>
<summary>x5.png Details</summary>
### Visual Description
## Diagram: Conditional Probabilities of Night, Sleep, and Light
### Overview
The diagram illustrates a probabilistic model with three interconnected nodes: **Night**, **Sleep**, and **Light**. Arrows indicate causal or conditional relationships, with probabilities assigned to binary states (true/false) for each node. A red dashed box highlights a deterministic relationship between **Night** and **Light**.
### Components/Axes
- **Nodes**:
- **Night**: Represented by a crescent moon icon.
- **Sleep**: Represented by a bed icon.
- **Light**: Represented by a lantern icon.
- **Probabilities**:
- **Night**:
- P(N=t) = 0.5
- P(N=f) = 0.5
- **Sleep**:
- P(S=t) = 0.9
- P(S=f) = 0.1
- **Light**:
- P(L=t) = 0.8
- P(L=f) = 0.2
- **Conditional**:
- When **Night** is true (N=t), **Light** is deterministic:
- P(L=t | N=t) = 1.0
- P(L=f | N=t) = 0.0
### Detailed Analysis
1. **Night Node**:
- Equal probability (0.5) of being true or false.
- Branches to both **Sleep** and **Light** nodes.
2. **Sleep Node**:
- High probability (0.9) of being true when **Night** is true.
- Low probability (0.1) of being false.
3. **Light Node**:
- Default probabilities: 0.8 (true) and 0.2 (false).
- Overridden by the red dashed box: When **Night** is true, **Light** is certain (P(L=t) = 1.0).
4. **Relationships**:
- **Night → Sleep**: Strong association (0.9 probability).
- **Night → Light**: Deterministic when **Night** is true (1.0 probability).
### Key Observations
- **Deterministic Override**: The red dashed box explicitly enforces P(L=t) = 1.0 when **Night** is true, overriding the default 0.8 probability.
- **High Correlation**: **Sleep** is highly likely (0.9) when **Night** is true, suggesting a strong but non-deterministic link.
- **Symmetry in Night**: Equal prior probabilities (0.5) for **Night** being true or false.
### Interpretation
The diagram models a scenario where **Night** acts as a conditional trigger:
- When **Night** is true, **Light** is guaranteed (e.g., a nightlight activating automatically).
- **Sleep** is strongly associated with **Night** but not absolute (0.9 probability), allowing for exceptions (e.g., insomnia).
- The default probabilities for **Light** (0.8 true) suggest it is generally active but not tied to **Night** in all cases.
The red dashed box emphasizes a rule-based exception: **Light**’s state is fully determined by **Night**’s truth value, highlighting a critical dependency in the system. This could represent a safety mechanism (e.g., ensuring light is on during nighttime) or a logical constraint in a probabilistic model.
</details>
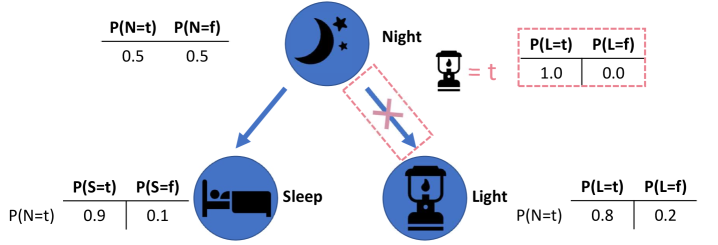
Figure 6: Performing differentiable causal reasoning and learning using NEMESYS. Given a causal Bayesian network, NEMESYS can easily perform the do operation (delete incoming edges) on arbitrary nodes and capture the causal effects on different nodes (for example, the probability of the node $\mathtt{Light}$ after intervening) without rerunning the entire system. Furthermore, NEMESYS is able to learn the unobserved $\mathtt{do}$ operation with its corresponding value using gradient descent based on the given causal graph and observed data. (Best viewed in color)
The $\mathtt{do}$ operator, denoted as $\mathtt{do(X)}$ , is used to represent an intervention on a particular variable $\mathtt{X}$ in a causal learning system, regardless of the actual value of the variable. For example, Fig. 6 shows a causal Bayesian network with three nodes and the probability distribution of the nodes before and after the $\mathtt{do}$ operation. To investigate how the node $\mathtt{Light}$ affects the rest of the system, we firstly cut the causal relationship between the node $\mathtt{Light}$ and all its parent nodes, then we assign a new value to the node and we investigate the probability of other nodes. To enable NEMESYS to perform a $\mathtt{do}$ operation on the node $\mathtt{Light}$ , we begin by representing the provided causal Bayesian network in Fig. 6 using:
| | $\displaystyle\mathtt{0.5}\texttt{:}\ \mathtt{Night}.\quad\mathtt{0.9}\texttt{: }\ \mathtt{Sleep}\texttt{:-}\mathtt{Night}.\quad\mathtt{0.8}\texttt{:}\ \mathtt{Light}\texttt{:-}\mathtt{Night}.$ | |
| --- | --- | --- |
where the number of an atom indicates the probability of the atom being true, and the number of a clause indicates the conditional probability of the head being true given the body being true.
We reuse the meta predicate $\mathtt{assert\_probs/1/[atom]}$ and introduce three new meta predicates: $\mathtt{prob/1/[atom]}$ , $\mathtt{probs/1/[atoms]}$ and $\mathtt{probs\_do/1/[atoms,atom]}$ . Since we cannot deal with the uncountable, infinite real numbers within our logic, we make use of the weight associated with ground meta atoms to represent the probability of the atom. For example, we use the weight of the meta atom $\mathtt{prob(Atom)}$ to represent the probability of the atom $\mathtt{Atom}$ . We use the weight of the meta atom $\mathtt{probs(Atoms)}$ to represent the joint probability of a list of atoms $\mathtt{Atoms}$ , and the weight of $\mathtt{probs\_do(AtomA,AtomB)}$ to represent the probability of the atom $\mathtt{AtomA}$ after performing the do operation $\mathtt{do(AtomB)}$ . We modify the meta interpreter as:
| | $\displaystyle\mathtt{prob(Head)}\texttt{:-}\mathtt{assert\_probs((Head\texttt{ :-}Body))},\mathtt{probs(Body).}$ | |
| --- | --- | --- |
where the first three rules calculate the probability of a node before the intervention, the joint probability is approximated using the first and second rule by iteratively multiplying each atom. The fourth rule assigns the probability of the atom $\mathtt{Atom}$ using the $\mathtt{do}$ operation. The fifth to the eighth calculate the probability after the $\mathtt{do}$ intervention by looping over each atom and multiplying them.
For example, after performing $\mathtt{do(Light)}$ and setting the probability of $\mathtt{Light}$ as $1.0$ . NEMESYS returns the weight of $\mathtt{probs\_do(Light,Light)}$ as the probability of the node $\mathtt{Light}$ (Fig. 6 red box) after the intervention $\mathtt{do(Light)}$ .
### 4.6 Gradient-based Learning in NEMESYS
NEMESYS alleviates the limitations of frameworks such as DeepProbLog [21] by having the ability of not only performing differentiable parameter learning but also supporting differentiable structure learning (in our experiment, NEMESYS learns the weights of the meta rules while adapting to solve different tasks). We now introduce the learning ability of NEMESYS.
#### 4.6.1 Parameter Learning
Consider a scenario in which a patient can only experience effective treatment when two types of medicine synergize, with the effectiveness contingent on the dosage of each drug. Suppose we have known the dosages of two medicines and the causal impact of the medicines on the patient, however, the observed effectiveness does not align with expectations. It is certain that some interventions have occurred in the medicine-patient causal structure (such as an incorrect dosage of one medicine, which will be treated as an intervention using the $\mathtt{do}$ operation). However, the specific node (patient or the medicines) on which the $\mathtt{do}$ operation is executed, and the values assigned to the $\mathtt{do}$ operator remain unknown. Conducting additional experiments on patients by altering medicine dosages to uncover the $\mathtt{do}$ operation is both unethical and dangerous.
With NEMESYS at hand, we can easily learn the unobserved $\mathtt{do}$ operation with its assigned value. We abstract the problem using a three-node causal Bayesian network:
$$
\mathtt{1.0:medicine\_a.}\quad\mathtt{1.0:medicine\_b.}\quad\mathtt{0.9:
patient}\texttt{:-}\mathtt{medicine\_a,medicine\_b.}
$$
where the number of the atoms indicates the dosage of each medicine, and the number of the clause indicates the conditional probability of the effectiveness of the patient given these two medicines. Suppose there is only one unobserved $\mathtt{do}$ operation.
To learn the unknown $\mathtt{do}$ operation, we define the loss as the Binary Cross Entropy (BCE) loss between the observed probability $\mathbf{p}_{target}$ and the predicted probability of the target atom $\mathbf{p}_{predicted}$ . The predicted probability $\mathbf{p}_{predicted}$ is computed as: $\mathbf{p}_{predicted}=\mathbf{v}^{(T)}\left[I_{\mathcal{G}}(\operatorname{ target\_atom})\right]$ , where $I_{\mathcal{G}}(x)$ is a function that returns the index of target atom in $\mathcal{G}$ , $\mathbf{v}[i]$ is the $i$ -th element of $\mathbf{v}$ . $\mathbf{v}^{(T)}$ is the valuation tensor computed by $T$ -step forward reasoning based on the initial valuation tensor $\mathbf{v}^{(0)}$ , which is composed of the initial valuation of $\mathtt{do}$ and other meta ground atoms. Since the valuation of $\mathtt{do}$ atom is the only changing parameter, we set the gradient of other parameters as $0 0$ . We minimize the loss w.r.t. $\mathtt{do(X)}$ : $\underset{\mathtt{do(X)}}{\mathtt{minimize}}\quad\mathtt{L_{loss}}=\mathtt{BCE }(\mathbf{p}_{target},\mathbf{p}_{predicted}\mathtt{(do(X)))}.$ Fig. 7 summarizes the loss curve of the three $\mathtt{do}$ operators during learning using one target (Fig. 7 left) and three targets (Fig. 7 right). For the three targets experiment, $\mathbf{p}_{target}$ consists of three observed probabilities (the effectiveness of the patient and the dosages of two medicines), for the experiment with one target, $\mathbf{p}_{target}$ only consists of the observed the effectiveness of the patient.
We randomly initialize the probability of the three $\mathtt{do}$ operators and choose the one, which achieves the lowest loss as the right $\mathtt{do}$ operator. In the three targets experiment, the blue curve achieves the lowest loss, with its corresponding value converges to the ground truth value, while in the one target experiment, three $\mathtt{do}$ operators achieve equivalent performance. We provide the value curves of three $\mathtt{do}$ operators and the ground truth $\mathtt{do}$ operator with its value in Appendix C.
<details>
<summary>x6.png Details</summary>
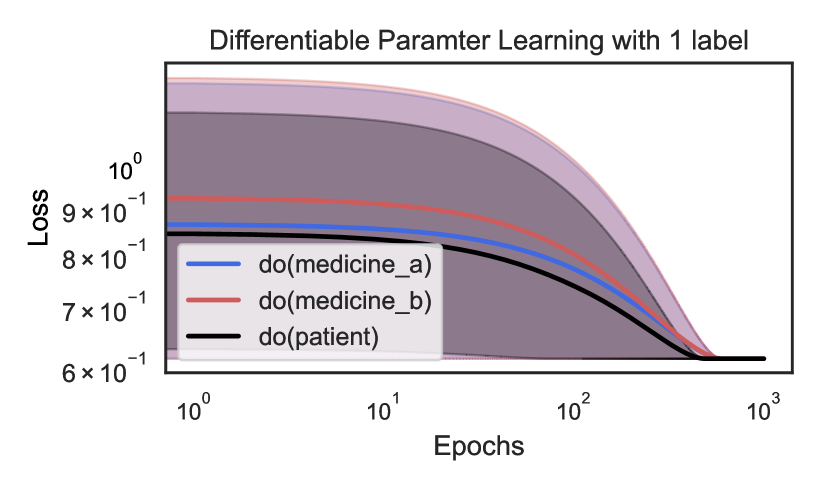
### Visual Description
## Line Graph: Differentiable Parameter Learning with 1 label
### Overview
The image is a line graph depicting the loss reduction over epochs for three distinct parameter learning scenarios: `do(medicine_a)`, `do(medicine_b)`, and `do(patient)`. The graph uses logarithmic scales for both axes, with the x-axis (Epochs) ranging from 10⁰ to 10³ and the y-axis (Loss) ranging from 6×10⁻¹ to 10⁰. Shaded regions around each line indicate variability or confidence intervals.
---
### Components/Axes
- **Title**: "Differentiable Parameter Learning with 1 label" (note: "Parameter" is misspelled as "Paramter").
- **X-axis (Epochs)**: Logarithmic scale from 10⁰ to 10³, with ticks at 10⁰, 10¹, 10², and 10³.
- **Y-axis (Loss)**: Logarithmic scale from 6×10⁻¹ to 10⁰, with ticks at 6×10⁻¹, 7×10⁻¹, 8×10⁻¹, 9×10⁻¹, and 10⁰.
- **Legend**: Located in the bottom-left corner, with three entries:
- **Blue line**: `do(medicine_a)`
- **Red line**: `do(medicine_b)`
- **Black line**: `do(patient)`
- **Shaded Regions**: Gray areas surrounding each line, likely representing confidence intervals or error margins.
---
### Detailed Analysis
#### Line Trends
1. **Blue Line (`do(medicine_a)`)**:
- Starts at ~9×10⁻¹ loss at 10⁰ epochs.
- Decreases to ~7×10⁻¹ at 10¹ epochs.
- Further reduces to ~6×10⁻¹ at 10² epochs.
- Approaches ~6×10⁻¹ at 10³ epochs.
- **Trend**: Steep initial decline, then plateaus.
2. **Red Line (`do(medicine_b)`)**:
- Starts at ~8×10⁻¹ loss at 10⁰ epochs.
- Decreases to ~7×10⁻¹ at 10¹ epochs.
- Further reduces to ~6×10⁻¹ at 10² epochs.
- Approaches ~6×10⁻¹ at 10³ epochs.
- **Trend**: Gradual decline, similar to `do(medicine_a)` but with a slightly higher initial loss.
3. **Black Line (`do(patient)`)**:
- Starts at ~8×10⁻¹ loss at 10⁰ epochs.
- Decreases to ~7×10⁻¹ at 10¹ epochs.
- Further reduces to ~6×10⁻¹ at 10² epochs.
- Approaches ~6×10⁻¹ at 10³ epochs.
- **Trend**: Similar to `do(medicine_b)` but with a slightly lower initial loss.
#### Shaded Regions
- All three lines have gray shaded areas around them, indicating variability. The width of the shaded regions decreases as epochs increase, suggesting improved consistency in loss reduction over time.
---
### Key Observations
1. **Convergence**: All three lines converge to the same loss value (~6×10⁻¹) as epochs increase, indicating that the learning process stabilizes regardless of the intervention.
2. **Initial Disparity**: `do(medicine_a)` starts with the highest loss (~9×10⁻¹), while `do(medicine_b)` and `do(patient)` begin at ~8×10⁻¹.
3. **Rate of Decline**: `do(medicine_a)` shows the steepest initial decline, while `do(medicine_b)` and `do(patient)` have more gradual reductions.
4. **Shaded Areas**: The narrowing shaded regions suggest reduced uncertainty in loss estimates as training progresses.
---
### Interpretation
The graph demonstrates that all three parameter learning scenarios (`do(medicine_a)`, `do(medicine_b)`, and `do(patient)`) improve over time, with `do(medicine_a)` initially underperforming but catching up to the others. The convergence of loss values implies that the learning process becomes stable and consistent across interventions as epochs increase. The shaded regions highlight that variability in loss decreases with more training, suggesting that the model's performance becomes more predictable. The misspelling of "Parameter" in the title may indicate a typographical error in the original data source.
</details>
<details>
<summary>x7.png Details</summary>
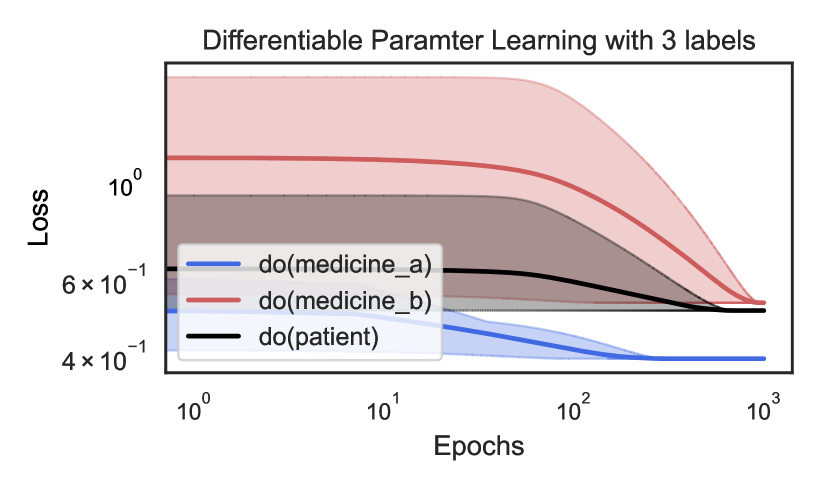
### Visual Description
## Line Graph: Differentiable Parameter Learning with 3 labels
### Overview
The image is a logarithmic-scale line graph comparing the loss reduction of three interventions ("do(medicine_a)", "do(medicine_b)", and "do(patient)") over training epochs. The y-axis represents loss (log scale: 4×10⁻¹ to 10⁰), and the x-axis represents epochs (log scale: 10⁰ to 10³). Each line includes a shaded confidence interval region.
### Components/Axes
- **Title**: "Differentiable Parameter Learning with 3 labels"
- **X-axis**:
- Label: "Epochs"
- Scale: Logarithmic (10⁰, 10¹, 10², 10³)
- **Y-axis**:
- Label: "Loss"
- Scale: Logarithmic (4×10⁻¹, 6×10⁻¹, 10⁰)
- **Legend**:
- Position: Bottom-left corner
- Entries:
- Blue line: "do(medicine_a)"
- Red line: "do(medicine_b)"
- Black line: "do(patient)"
- **Shaded Regions**: Confidence intervals around each line (darker for lower bounds, lighter for upper bounds).
### Detailed Analysis
1. **do(medicine_a) (Blue Line)**:
- Initial loss: ~1.0 (10⁰) at 10⁰ epochs.
- Final loss: ~6×10⁻¹ at 10³ epochs.
- Trend: Steepest decline, with loss dropping ~40% over 10³ epochs.
- Confidence interval: Widest at early epochs (~0.2 range), narrowing to ~0.1 by 10³ epochs.
2. **do(medicine_b) (Red Line)**:
- Initial loss: ~8×10⁻¹ at 10⁰ epochs.
- Final loss: ~5×10⁻¹ at 10³ epochs.
- Trend: Moderate decline (~37.5% reduction), slower than "do(medicine_a)".
- Confidence interval: Narrower than blue but wider than black, stabilizing at ~0.05 range by 10³ epochs.
3. **do(patient) (Black Line)**:
- Initial loss: ~7×10⁻¹ at 10⁰ epochs.
- Final loss: ~6×10⁻¹ at 10³ epochs.
- Trend: Minimal reduction (~14% decrease), flattest slope.
- Confidence interval: Narrowest throughout, with ~0.02 range at all epochs.
### Key Observations
- All interventions show decreasing loss with increasing epochs, but rates differ significantly.
- "do(medicine_a)" achieves the largest loss reduction but has the highest initial variability.
- "do(patient)" shows the least improvement, suggesting lower efficacy or different optimization dynamics.
- Confidence intervals indicate that "do(medicine_a)"'s estimates are less certain early in training but stabilize over time.
### Interpretation
The graph demonstrates that "do(medicine_a)" is the most effective intervention for reducing loss, with a steep learning curve. Its wide early confidence intervals suggest high variability in initial parameter estimates, which becomes more stable as training progresses. "do(medicine_b)" offers moderate improvements with consistent performance, while "do(patient)" shows minimal impact, possibly indicating suboptimal parameter adjustments or resistance to optimization. The logarithmic scales emphasize exponential decay in loss, highlighting the efficiency of "do(medicine_a)" in large-scale training scenarios. The shaded regions underscore the importance of considering uncertainty in parameter learning, particularly for interventions with high initial variability.
</details>
Figure 7: NEMESYS performs differentiable parameter learning using gradient descent. Based on the given data (one or three targets), NEMESYS is asked to learn the correct $\mathtt{do}$ operator and its corresponding value (which we didn’t show in the images). The loss curve is averaged on three runs. The shadow area indicates the min and max number of the three runs. (Best viewed in color)
<details>
<summary>x8.png Details</summary>
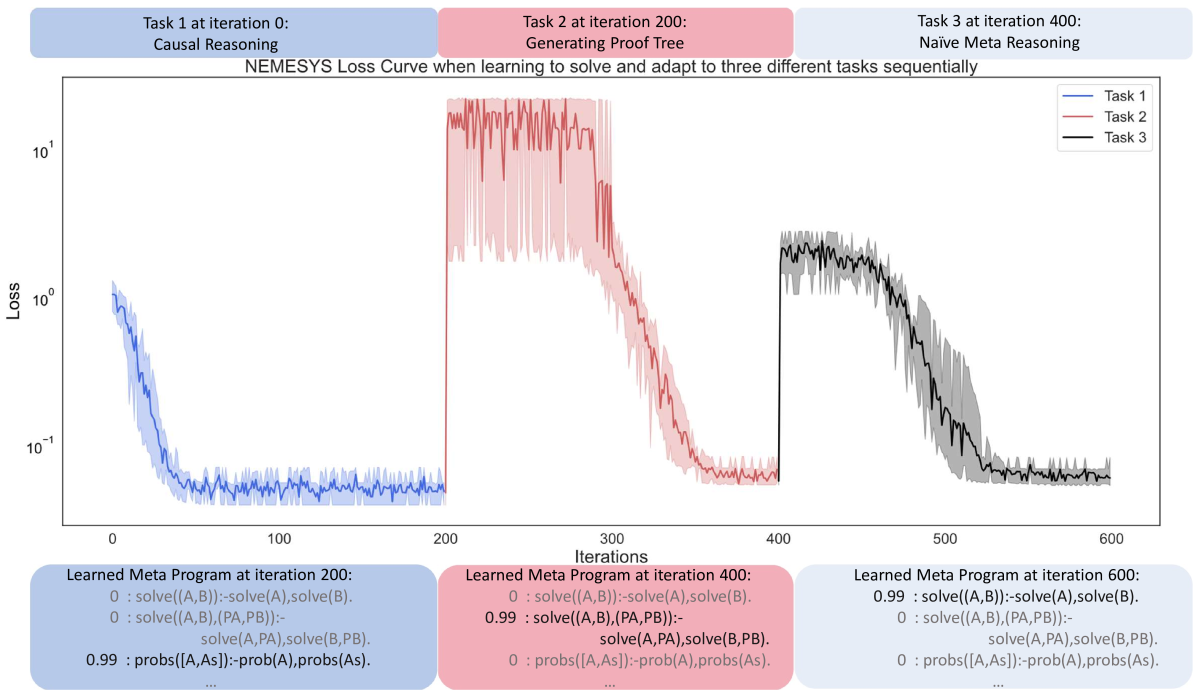
### Visual Description
## Line Graph: NEMESYS Loss Curve when learning to solve and adapt to three different tasks sequentially
### Overview
The graph depicts the loss curves for three sequential tasks (Task 1, Task 2, Task 3) across 600 training iterations. Loss is plotted on a logarithmic scale (10^-1 to 10^1), showing rapid initial improvement followed by stabilization. Each task is represented by a distinct color-coded line with corresponding shaded confidence intervals.
### Components/Axes
- **X-axis**: Iterations (0 to 600)
- **Y-axis**: Loss (log scale: 10^-1 to 10^1)
- **Legend**:
- Blue: Task 1 (Causal Reasoning)
- Red: Task 2 (Generating Proof Tree)
- Black: Task 3 (Naïve Meta Reasoning)
- **Text Boxes**:
- Bottom-left: Learned meta-program at iteration 200
- Bottom-center: Learned meta-program at iteration 400
- Bottom-right: Learned meta-program at iteration 600
### Detailed Analysis
1. **Task 1 (Blue Line)**:
- **Trend**: Sharp decline from ~10^0 to 10^-1 within first 100 iterations, then stabilizes with minor fluctuations.
- **Key Data Points**:
- Iteration 0: ~10^0
- Iteration 100: ~10^-1
- Iteration 200: ~10^-1 (confidence interval: ±10^-2)
2. **Task 2 (Red Line)**:
- **Trend**: Begins at iteration 200 with loss ~10^1, drops to ~10^-1 by iteration 400 with significant noise (confidence interval: ±10^-1).
- **Key Data Points**:
- Iteration 200: ~10^1
- Iteration 300: ~10^0
- Iteration 400: ~10^-1
3. **Task 3 (Black Line)**:
- **Trend**: Starts at iteration 400 with loss ~10^1, declines to ~10^-1 by iteration 600 with high volatility (confidence interval: ±10^-1).
- **Key Data Points**:
- Iteration 400: ~10^1
- Iteration 500: ~10^0
- Iteration 600: ~10^-1
### Key Observations
- **Sequential Learning**: Tasks are introduced at iterations 0, 200, and 400, with each new task starting with higher initial loss.
- **Noise Patterns**: Later tasks (Task 2/3) exhibit greater loss volatility, especially during early adaptation phases.
- **Meta-Program Evolution**:
- Iteration 200: Focus on solving (A,B) with probabilistic components
- Iteration 400: Increased emphasis on probabilistic reasoning (0.99 weight)
- Iteration 600: Balanced approach between solving and probabilistic operations
### Interpretation
The data demonstrates a multi-stage learning process where:
1. **Task 1** (Causal Reasoning) is rapidly mastered, achieving low loss quickly.
2. **Task 2** (Proof Tree Generation) requires more iterations to stabilize, suggesting greater complexity or novelty.
3. **Task 3** (Meta Reasoning) shows the most challenging adaptation, with persistent noise even after 200 iterations of dedicated training.
The meta-program evolution reveals a shift from deterministic solving operations to probabilistic reasoning as the model integrates new tasks. The increasing confidence interval width for later tasks indicates growing uncertainty during adaptation phases, consistent with the "catastrophic forgetting" phenomenon in sequential learning.
Notable anomalies include the abrupt loss spikes in Task 2/3 around iteration 300/500, potentially indicating model reconfiguration points where prior knowledge is temporarily disrupted during meta-learning updates.
</details>
Figure 8: NEMESYS can learn to solve and adapt itself to different tasks during learning using gradient descent. In this experiment, we train NEMESYS to solve three different tasks: causal reasoning, generating proof trees and naive meta reasoning sequentially (each task is represented by a unique color encoding). The loss curve is averaged on five runs, with the shadow area indicating the minimum and maximum number of the five runs. For readability, the learned complete meta program is not shown in the image. (Best viewed in color)
#### 4.6.2 Structure Learning
Besides parameter learning, NEMESYS can also perform differentiable structure learning (we provide the candidate meta rules and learn the weights of these meta rules using gradient descent). In this experiment, different tasks are presented at distinct time steps throughout the learning process. NEMESYS is tasked with acquiring the ability to solve and adapt to these diverse tasks.
Following Sec. 3.2, we make use of the meta rule weight matrix $\mathbf{W}=[{\bf w}_{1},\ldots,{\bf w}_{M}]$ to select the rules. We take the softmax of each weight vector ${\bf w}_{j}\in\mathbf{W}$ to choose $M$ meta rules out of $C$ meta rules. To adapt to different tasks, the weight matrix $\mathbf{W}$ is learned based on the loss, which is defined as the BCE loss between the probability of the target $\mathbf{p}_{target}$ and the predicted probability $\mathbf{p}_{predicted}$ , where $\mathbf{p}_{predicted}$ is the probability of the target atoms calculated using the learned program. $\mathbf{p}_{predicted}$ is computed as: $\mathbf{p}_{predicted}=\mathbf{v}^{(T)}\left[I_{\mathcal{G}}(\operatorname{ target\_atoms})\right]$ , where $I_{\mathcal{G}}(x)$ is a function that returns the indexes of target atoms in $\mathcal{G}$ , $\mathbf{v}[i]$ is the $i$ -th element of $\mathbf{v}$ and $\mathbf{v}^{(T)}$ is the valuation tensor computed by $T$ -step forward reasoning. We minimize the loss w.r.t. the weight matrix $\mathbf{W}$ : $\underset{\mathbf{W}}{\mathtt{minimize}}\quad\mathtt{L_{loss}}=\mathtt{BCE}( \mathbf{p}_{target},\mathbf{p}_{predicted}(\mathbf{W})).$
We randomly initialize the weight matrix $\mathbf{W}$ , and update the weights using gradient descent. We set the target $\mathbf{p}_{target}$ using positive target atoms and negative target atoms. For example, suppose we have the naive meta reasoning and generating proof tree as two tasks. To learn a program to generate the proof tree, we use the proof tree meta rules to generate positive examples, and use the naive meta rules to generate the negative examples.
We ask NEMESYS to solve three different tasks sequentially, which is initially, calculating probabilities using the first three rules of causal reasoning, then executing naive meta-reasoning. Finally, generating a proof tree. We set the program size to three and randomly initialize the weight matrix. Fig. 8 shows the learning process of NEMESYS which can automatically adapt to solve these three different tasks. We provide the accuracy curve and the candidate rules with the learned weights in Appendix D. We also compare NEMESYS with the baseline method DeepProbLog [21] (cf. Table. 4). Due to the limitations of DeepProbLog in adapting (meta) rule weights during learning, we initialize DeepProbLog with three variants as our baseline comparisons. The first variant involves fixed task 1 meta rule weights ( $\mathtt{1.0}$ ), with task 2 and task 3 meta rule weights being randomly initialized. In the second variant, task 2 meta rule weights are fixed ( $\mathtt{1.0}$ ), while task 1 and task 3 meta rule weights are randomly initialized, and this pattern continues for the subsequent variant. We provide NEMESYS with the same candidate meta rules, however, with randomly initialize weights. We compute the accuracy at iteration $\mathtt{200}$ , $\mathtt{400}$ and $\mathtt{600}$ .
### 4.7 Discussion
While NEMESYS achieves impressive results, it is worth considering some of the limitations of this work. In our current experiments for structure learning, candidates of meta-rules are provided. It is promising to integrate rule-learning techniques, e.g., mode declarations, meta-interpretive learning, and a more sophisticated rule search, to learn from less prior. Another limitation lies in the calculation, since our system is not able to handle real number calculation, we make use of the weight associated with the atom to approximate the value and do the calculation.
| | Test Task1 | Test Task2 | Test Task3 |
| --- | --- | --- | --- |
| DeepProbLog (T1) | 100 $\bullet$ | 14.29 | 0 |
| DeepProbLog (T2) | 0 | 100 $\bullet$ | 11.43 |
| DeepProbLog (T3) | 68.57 | 5.71 | 100 $\bullet$ |
| NEMESYS (ours) | 100 $\bullet$ | 100 $\bullet$ | 100 $\bullet$ |
Table 4: Performance (Accuracy; the higher, the better) on test split of three tasks. We compare NEMESYS with baseline method DeepProbLog [21] (with three variants). The accuracy is averaged on five runs. The best-performing models are denoted using $\bullet$ .
## 5 Conclusions
We proposed the framework of neuro-metasymbolic reasoning and learning. We realized a differentiable meta interpreter using the differentiable implementation of first-order logic with meta predicates. This meta-interpreter, called NEMESYS, achieves various important functions on differentiable logic programming languages using meta-level programming. We illustrated this on different tasks of visual reasoning, reasoning with explanations, reasoning with infinite loops, planning on visual scenes, performing the $\mathtt{do}$ operation within a causal Bayesian network and showed NEMESYS’s gradient-based capability of parameter learning and structure learning.
NEMESYS provides several interesting avenues for future work. One major limitation of NEMESYS is its scalability for large-scale meta programs. So far, we have mainly focused on specifying the syntax and semantics of new (domain-specific) differentiable logic programming languages, helping to ensure that the languages have some desired properties. In the future, one should also explore providing properties about programs written in a particular differentiable logic programming language and injecting the properties into deep neural networks via algorithmic supervision [50], as well as program synthesis. Most importantly, since meta programs in NEMESYS are parameterized, and the reasoning mechanism is differentiable, one can realize differentiable meta-learning easily, i.e., the reasoning system that learns how to perform reasoning better from experiences.
Acknowledgements. This work was supported by the Hessian Ministry of Higher Education, Research, Science and the Arts (HMWK) cluster project “The Third Wave of AI”. The work has also benefited from the Hessian Ministry of Higher Education, Research, Science and the Arts (HMWK) cluster project “The Adaptive Mind” and the Federal Ministry for Economic Affairs and Climate Action (BMWK) AI lighthouse project “SPAICER” (01MK20015E), the EU ICT-48 Network of AI Research Excellence Center “TAILOR” (EU Horizon 2020, GA No 952215), and the Collaboration Lab “AI in Construction” (AICO) with Nexplore/HochTief.
## References
Ramesh et al. [2022] Ramesh, A., Dhariwal, P., Nichol, A., Chu, C., Chen, M.: Hierarchical text-conditional image generation with clip latents. arXiv Preprint:2204.0612 (2022)
Stiennon et al. [2020] Stiennon, N., Ouyang, L., Wu, J., Ziegler, D., Lowe, R., Voss, C., Radford, A., Amodei, D., Christiano, P.F.: Learning to summarize with human feedback. Advances in Neural Information Processing Systems (NeurIPS) (2020)
Floridi and Chiriatti [2020] Floridi, L., Chiriatti, M.: Gpt-3: Its nature, scope, limits, and consequences. Minds and Machines 30, 681–694 (2020)
Reed et al. [2022] Reed, S., Zolna, K., Parisotto, E., Colmenarejo, S.G., Novikov, A., Barth-maron, G., Giménez, M., Sulsky, Y., Kay, J., Springenberg, J.T., et al.: A generalist agent. Transactions on Machine Learning Research (TMLR) (2022)
Ackerman and Thompson [2017] Ackerman, R., Thompson, V.A.: Meta-reasoning: Monitoring and control of thinking and reasoning. Trends in cognitive sciences 21 (8), 607–617 (2017)
Costantini [2002] Costantini, S.: Meta-reasoning: A survey. In: Computational Logic: Logic Programming and Beyond (2002)
Griffiths et al. [2019] Griffiths, T.L., Callaway, F., Chang, M.B., Grant, E., Krueger, P.M., Lieder, F.: Doing more with less: Meta-reasoning and meta-learning in humans and machines. Current Opinion in Behavioral Sciences 29, 24–30 (2019)
Russell and Wefald [1991] Russell, S., Wefald, E.: Principles of metareasoning. Artificial intelligence 49 (1-3), 361–395 (1991)
Schmidhuber [1987] Schmidhuber, J.: Evolutionary principles in self-referential learning, or on learning how to learn: the meta-meta-… hook. PhD thesis, Technische Universität München (1987)
Thrun and Pratt [1998] Thrun, S., Pratt, L.: Learning to Learn: Introduction and Overview, pp. 3–17. Springer, Boston, MA (1998)
Finn et al. [2017] Finn, C., Abbeel, P., Levine, S.: Model-agnostic meta-learning for fast adaptation of deep networks. In: Proceedings of the 34th International Conference on Machine Learning (ICML) (2017)
Hospedales et al. [2022] Hospedales, T.M., Antoniou, A., Micaelli, P., Storkey, A.J.: Meta-learning in neural networks: A survey. IEEE Trans. Pattern Anal. Mach. Intell. 44 (9), 5149–5169 (2022)
Kim et al. [2018] K im, J., Ricci, M., Serre, T.: Not-so-clevr: learning same–different relations strains feedforward neural networks. Interface focus (2018)
Stammer et al. [2021] Stammer, W., Schramowski, P., Kersting, K.: Right for the right concept: Revising neuro-symbolic concepts by interacting with their explanations. In: Proceedings of the IEEE Conference on Computer Vision and Pattern Recognition (CVPR) (2021)
Shindo et al. [2021] Shindo, H., Dhami, D.S., Kersting, K.: Neuro-symbolic forward reasoning. arXiv Preprint:2110.09383 (2021)
Evans and Grefenstette [2018] Evans, R., Grefenstette, E.: Learning explanatory rules from noisy data. J. Artif. Intell. Res. 61, 1–64 (2018)
Shindo et al. [2021] Shindo, H., Nishino, M., Yamamoto, A.: Differentiable inductive logic programming for structured examples. In: Proceedings of the 35th AAAI Conference on Artificial Intelligence (AAAI) (2021)
Johnson et al. [2017] Johnson, J., Hariharan, B., Maaten, L., Fei-Fei, L., Zitnick, C.L., Girshick, R.B.: Clevr: A diagnostic dataset for compositional language and elementary visual reasoning. Proceedings of the IEEE Conference on Computer Vision and Pattern Recognition (CVPR) (2017)
Holzinger et al. [2019] Holzinger, A., Kickmeier-Rust, M., Müller, H.: Kandinsky patterns as iq-test for machine learning. In: Proceedings of the 3rd International Cross-Domain Conference for Machine Learning and Knowledge Extraction (CD-MAKE) (2019)
Müller and Holzinger [2021] Müller, H., Holzinger, A.: Kandinsky patterns. Artificial Intelligence 300, 103546 (2021)
Manhaeve et al. [2018] Manhaeve, R., Dumancic, S., Kimmig, A., Demeester, T., De Raedt, L.: Deepproblog: Neural probabilistic logic programming. Advances in Neural Information Processing Systems (NeurIPS) (2018)
Rocktäschel and Riedel [2017] Rocktäschel, T., Riedel, S.: End-to-end differentiable proving. Advances in neural information processing systems 30 (2017)
Cunnington et al. [2023] Cunnington, D., Law, M., Lobo, J., Russo, A.: Ffnsl: feed-forward neural-symbolic learner. Machine Learning 112 (2), 515–569 (2023)
Shindo et al. [2023] Shindo, H., Pfanschilling, V., Dhami, D.S., Kersting, K.: $\alpha$ ilp: thinking visual scenes as differentiable logic programs. Machine Learning 112, 1465–1497 (2023)
Huang et al. [2021] Huang, J., Li, Z., Chen, B., Samel, K., Naik, M., Song, L., Si, X.: Scallop: From probabilistic deductive databases to scalable differentiable reasoning. Advances in Neural Information Processing Systems (NeurIPS) (2021)
Yang et al. [2020] Yang, Z., Ishay, A., Lee, J.: Neurasp: Embracing neural networks into answer set programming. In: Proceedings of the 29th International Joint Conference on Artificial Intelligence, (IJCAI) (2020)
Pearl [2009] Pearl, J.: Causality. Cambridge university press, Cambridge (2009)
Pearl [2012] Pearl, J.: The do-calculus revisited. In: Proceedings of the 28th Conference on Uncertainty in Artificial Intelligence (UAI) (2012)
Russell and Norvig [2009] Russell, S., Norvig, P.: Artificial Intelligence: A Modern Approach, 3rd edn. Prentice Hall Press, Hoboken, New Jersey (2009)
Jiang and Luo [2019] Jiang, Z., Luo, S.: Neural logic reinforcement learning. In: Proceedings of the 36th International Conference on Machine Learning (ICML) (2019)
Delfosse et al. [2023] Delfosse, Q., Shindo, H., Dhami, D., Kersting, K.: Interpretable and explainable logical policies via neurally guided symbolic abstraction. arXiv preprint arXiv:2306.01439 (2023)
Maes and Nardi [1988] Maes, P., Nardi, D.: Meta-Level Architectures and Reflection. Elsevier Science Inc., USA (1988)
Lloyd [1984] Lloyd, J.W.: Foundations of Logic Programming, 1st Edition. Springer, Heidelberg (1984)
Hill and Gallagher [1998] Hill, P.M., Gallagher, J.: Meta-Programming in Logic Programming. Oxford University Press, Oxford (1998)
Pettorossi [1992] Pettorossi, A. (ed.): Proceedings of the 3rd International Workshop of Meta-Programming in Logic, (META). Lecture Notes in Computer Science, vol. 649 (1992)
Apt and Turini [1995] Apt, K.R., Turini, F.: Meta-Logics and Logic Programming. MIT Press (MA), Massachusett (1995)
Sterling and Shapiro [1994] Sterling, L., Shapiro, E.Y.: The Art of Prolog: Advanced Programming Techniques. MIT press, Massachusett (1994)
Muggleton et al. [2014a] Muggleton, S.H., Lin, D., Pahlavi, N., Tamaddoni-Nezhad, A.: Meta-interpretive learning: application to grammatical inference. Machine learning 94, 25–49 (2014)
Muggleton et al. [2014b] Muggleton, S.H., Lin, D., Chen, J., Tamaddoni-Nezhad, A.: Metabayes: Bayesian meta-interpretative learning using higher-order stochastic refinement. Proceedings of the 24th International Conference on Inductive Logic Programming (ILP) (2014)
Muggleton et al. [2015] Muggleton, S.H., Lin, D., Tamaddoni-Nezhad, A.: Meta-interpretive learning of higher-order dyadic datalog: Predicate invention revisited. Machine Learning 100, 49–73 (2015)
Cuturi and Blondel [2017] Cuturi, M., Blondel, M.: Soft-dtw: a differentiable loss function for time-series. In: Proceedings of the 34th International Conference on Machine Learning (ICML) (2017)
Redmon et al. [2016] Redmon, J., Divvala, S., Girshick, R., Farhadi, A.: You only look once: Unified, real-time object detection. In: Proceedings of the IEEE Conference on Computer Vision and Pattern Recognition (CVPR) (2016)
Holzinger et al. [2021] Holzinger, A., Saranti, A., Müller, H.: Kandinsky patterns - an experimental exploration environment for pattern analysis and machine intelligence. arXiv Preprint:2103.00519 (2021)
He et al. [2016] He, K., Zhang, X., Ren, S., Sun, J.: Deep residual learning for image recognition. In: Proceedings of the IEEE Conference on Computer Vision and Pattern Recognition (CVPR) (2016)
Locatello et al. [2020] Locatello, F., Weissenborn, D., Unterthiner, T., Mahendran, A., Heigold, G., Uszkoreit, J., Dosovitskiy, A., Kipf, T.: Object-centric learning with slot attention. Advances in Neural Information Processing Systems (NeurIPS) (2020)
Lee et al. [2019] Lee, J., Lee, Y., Kim, J., Kosiorek, A., Choi, S., Teh, Y.W.: Set transformer: A framework for attention-based permutation-invariant neural networks. In: Proceedings of the 36th International Conference on Machine Learning (ICML) (2019)
De Raedt et al. [2007] De Raedt, L., Kimmig, A., Toivonen, H.: Problog: A probabilistic prolog and its application in link discovery. In: IJCAI, vol. 7, pp. 2462–2467 (2007). Hyderabad
Lapuschkin et al. [2019] Lapuschkin, S., Wäldchen, S., Binder, A., Montavon, G., Samek, W., Müller, K.-R.: Unmasking clever hans predictors and assessing what machines really learn. Nature communications 10 (2019)
Kwisthout [2011] Kwisthout, J.: Most probable explanations in bayesian networks: Complexity and tractability. International Journal of Approximate Reasoning 52 (9), 1452–1469 (2011)
Petersen et al. [2021] Petersen, F., Borgelt, C., Kuehne, H., Deussen, O.: Learning with algorithmic supervision via continuous relaxations. In: Advances in Neural Information Processing Systems (NeurIPS) (2021)
## Appendix A Queries for Avoiding Infinite Loop
We use four queries to test the performance of NEMESYS and ProbLog [47].The four queries include one query which calls the recursive rule. The queries are:
| | $\displaystyle\mathtt{query(path(a,a,[]))}.\quad\mathtt{query(path(b,b,[]))}.$ | |
| --- | --- | --- |
## Appendix B Differentiable Planning
We provide more planning tasks in Figure. 9 with varying numbers of objects and attributes. Given the initial states and goal states, NEMESYS is asked to provide the intermediate steps to move different objects from start states to the end states.
<details>
<summary>extracted/5298395/images/clever-beforemove1.png Details</summary>
### Visual Description
## 3D Render: Geometric Objects on Neutral Surface
### Overview
The image depicts a minimalist 3D render featuring three distinct geometric objects arranged on a flat, neutral gray surface. The composition includes a blue cylinder, a teal reflective sphere, and a gray cube. Lighting is soft and diffused, casting subtle shadows to emphasize depth and material properties. No textual elements, labels, or annotations are visible.
### Components/Axes
- **Objects**:
1. **Blue Cylinder**: Positioned in the upper-left quadrant of the frame.
- Shape: Vertical cylinder with uniform diameter.
- Color: Matte blue.
- Spatial Relationship: Furthest from the viewer, slightly angled toward the center.
2. **Teal Sphere**: Central focus of the composition.
- Shape: Perfectly symmetrical sphere with a glossy, reflective surface.
- Color: Iridescent teal with specular highlights.
- Spatial Relationship: Mid-ground, slightly overlapping the cube’s shadow.
3. **Gray Cube**: Foreground object, occupying the lower-right quadrant.
- Shape: Matte gray cube with sharp edges and flat faces.
- Color: Uniform gray, matching the surface.
- Spatial Relationship: Closest to the viewer, casting a faint shadow toward the sphere.
- **Surface**:
- Neutral gray, non-reflective, with a matte finish.
- Extends uniformly across the entire frame.
### Detailed Analysis
- **Lighting and Shadows**:
- Light source originates from the top-left, casting soft shadows diagonally toward the bottom-right.
- The sphere’s reflective surface creates a faint highlight on its upper-left quadrant, consistent with the light direction.
- **Material Properties**:
- Cylinder and cube exhibit matte textures, absorbing light without reflection.
- Sphere’s glossy finish contrasts with the other objects, emphasizing its material uniqueness.
- **Spatial Composition**:
- Objects are evenly spaced but staggered in depth: cylinder (background), sphere (mid-ground), cube (foreground).
- No overlapping occurs between objects, maintaining clear visual hierarchy.
### Key Observations
1. **Absence of Text**: No labels, legends, or annotations are present, suggesting the image focuses purely on geometric and material representation.
2. **Color Contrast**: The teal sphere stands out against the blue cylinder and gray cube/surface, drawing immediate attention.
3. **Shadow Consistency**: Shadows align with the light source’s direction, reinforcing the image’s realism.
### Interpretation
This image likely serves as a study in 3D rendering techniques, demonstrating:
- **Material Simulation**: How different surface properties (matte vs. glossy) interact with light.
- **Spatial Arrangement**: Use of depth and perspective to create a sense of three-dimensionality.
- **Color Theory**: Contrast between cool tones (blue, teal) and neutral grays to guide visual focus.
The lack of textual elements implies the image is not data-driven but rather an artistic or technical demonstration of rendering capabilities. The precise positioning of objects and lighting suggests intentional composition to highlight form, texture, and spatial relationships.
</details>
<details>
<summary>extracted/5298395/images/clever-beforemove2.png Details</summary>
### Visual Description
## 3D Render: Abstract Geometric Composition
### Overview
The image depicts a minimalist 3D render featuring five distinct geometric objects arranged on a neutral gray surface. The composition includes two spheres (purple and teal), two cubes (gold and gray), and one cylinder (gray). No textual labels, legends, or axis markers are visible.
### Components/Axes
- **Objects**:
- **Gray Cylinder**: Positioned on the left side of the frame, standing vertically.
- **Purple Sphere**: Located centrally in the upper half of the image, slightly elevated above the surface.
- **Teal Sphere**: Positioned in the foreground, closer to the viewer than other objects.
- **Gold Cube**: Small, metallic cube placed near the teal sphere, slightly offset to the right.
- **Gray Cube**: Larger cube situated on the right side of the image, aligned with the cylinder.
- **Spatial Relationships**:
- The cylinder and gray cube form a vertical axis on the left and right edges.
- The purple sphere acts as a focal point in the upper central region.
- The teal sphere and gold cube cluster in the lower central area, creating a sense of depth.
### Detailed Analysis
- **Color and Material**:
- The purple and teal spheres exhibit reflective, glossy surfaces, suggesting metallic or polished materials.
- The gold cube has a highly reflective, mirror-like finish.
- The gray cylinder and cube have matte textures, contrasting with the sheen of the spheres and cube.
- **Lighting and Shadows**:
- Soft, diffused lighting creates subtle shadows beneath the objects, emphasizing their three-dimensionality.
- The teal sphere casts a faint shadow toward the gold cube, indicating a light source from the upper left.
### Key Observations
1. **Symmetry and Balance**: The arrangement lacks strict symmetry but achieves visual balance through the distribution of objects.
2. **Depth Perception**: The teal sphere’s placement in the foreground and the purple sphere’s elevation create a layered effect.
3. **Material Contrast**: The interplay between reflective (purple, teal, gold) and matte (gray) surfaces adds visual interest.
### Interpretation
This image appears to be a conceptual or artistic representation rather than a data-driven visualization. The absence of labels or contextual text suggests it may serve as a placeholder, a design mockup, or an abstract study of form and material. The objects’ colors and materials could symbolize different properties (e.g., the gold cube representing value, the purple sphere as a focal point), but without explicit context, their purpose remains ambiguous.
**Note**: No textual data, numerical values, or structured datasets are present in the image. The analysis is limited to spatial, material, and compositional observations.
</details>
<details>
<summary>extracted/5298395/images/clever-aftermove1.png Details</summary>

### Visual Description
## Photograph: Three 3D Geometric Objects on Neutral Surface
### Overview
The image depicts three distinct 3D objects arranged horizontally on a flat, neutral gray surface. From left to right:
1. A **teal-colored sphere** with a highly reflective, metallic surface.
2. A **blue cylinder** with a matte finish.
3. A **gray cube** with a matte finish.
Soft shadows are cast beneath each object, suggesting a light source positioned above and slightly to the left. The background is a uniform, slightly darker gray, providing contrast to the objects.
### Components/Axes
- **Objects**:
- **Sphere**: Teal, reflective, spherical geometry.
- **Cylinder**: Blue, matte, cylindrical geometry.
- **Cube**: Gray, matte, cubic geometry.
- **Surface**: Neutral gray, flat, with subtle texture.
- **Lighting**: Soft shadows indicate directional lighting from the upper left.
### Detailed Analysis
- **Sphere**: Positioned at the leftmost edge. Its reflective surface creates faint highlights, suggesting a polished material.
- **Cylinder**: Centered horizontally. The blue color is uniform, with no gradients or patterns.
- **Cube**: Rightmost object. The gray tone matches the background but is slightly darker, creating a subtle depth effect.
- **Shadows**: All objects cast soft, diffused shadows, indicating a light source with moderate intensity.
### Key Observations
1. **No Textual Elements**: The image contains no labels, legends, or embedded text.
2. **Material Contrast**: The sphere’s reflective surface contrasts with the matte finishes of the cylinder and cube.
3. **Spatial Arrangement**: Objects are evenly spaced, with the cylinder acting as a central focal point.
4. **Lighting Consistency**: Shadows align with the presumed light source direction, confirming a single light source.
### Interpretation
This image likely serves as a demonstration of 3D rendering techniques, material properties, or lighting effects. The absence of text or data suggests it is not intended to convey numerical information but rather visual or spatial relationships. The reflective sphere may emphasize material realism, while the matte objects highlight form and color. The neutral background ensures focus on the objects themselves, typical of product photography or physics simulations.
**Note**: No factual or numerical data is present in the image. The description is based solely on visible geometric, color, and spatial properties.
</details>
<details>
<summary>extracted/5298395/images/clever-aftermove2.png Details</summary>
### Visual Description
## Photograph: 3D Rendered Objects
### Overview
The image depicts a neutral gray background with five distinct 3D objects arranged in a horizontal line from left to right. The objects vary in shape, color, and material properties. No textual labels, legends, or axis markers are present.
### Components/Axes
- **Objects**:
1. **Purple Sphere**: Leftmost object, highly reflective (glossy) surface.
2. **Gray Cylinder**: Positioned to the right of the purple sphere, matte finish.
3. **Teal Sphere**: Centered, highly reflective (glossy) surface.
4. **Gold Cube**: Small, reflective (glossy) surface, placed to the right of the teal sphere.
5. **Gray Cube**: Largest object, matte finish, positioned farthest to the right.
- **Spatial Relationships**:
- Objects are evenly spaced along a horizontal axis.
- No overlapping or hierarchical grouping; all objects are isolated.
### Detailed Analysis
- **Material Properties**:
- Reflective surfaces (purple sphere, teal sphere, gold cube) exhibit specular highlights, suggesting metallic or polished materials.
- Matte surfaces (gray cylinder, gray cube) lack reflectivity, indicating non-metallic materials.
- **Color Distribution**:
- Dominant colors: Purple, gray, teal, gold.
- No repeated colors except for the two gray objects (cylinder and cube).
### Key Observations
1. **Material Contrast**: The image emphasizes the visual difference between reflective (glossy) and non-reflective (matte) surfaces.
2. **Size Variation**: The gray cube is significantly larger than the gold cube, while the spheres are intermediate in size.
3. **Positioning**: Objects are aligned linearly, creating a sense of progression from left to right.
### Interpretation
This image appears to be a demonstration of 3D rendering techniques, showcasing how different shapes and materials interact with light. The absence of textual elements suggests the focus is on visual composition rather than data representation. The reflective surfaces may symbolize technological or futuristic themes, while the matte objects could represent simplicity or functionality. The arrangement implies a deliberate design choice to highlight contrast in form and texture.
**Note**: No textual information, numerical data, or explicit labels are present in the image. The analysis is based solely on visual properties and spatial relationships.
</details>
Figure 9: Visual Concept Repairing: NEMESYS achieves planning by performing differentiable meta-level reasoning. The left two images show the start state, and the right two images show the goal state. Taking these states as inputs, NEMESYS performs differentiable forward reasoning using meta-level clauses that simulate the planning steps and generate actions from start state to reach the goal state. (Best viewed in color)
## Appendix C Differentiable Parameter Learning Value Curve
We also provide the corresponding value curve of these different $\mathtt{do}$ operators during learning in Fig. 10. In the experiment, we choose the $\mathtt{do}$ operator which achieves the lowest value as the correct value, thus in the experiment with three targets, we choose $\mathtt{do(medicine\_a)}$ with value $0.8$ , which is exactly the ground-truth $\mathtt{do}$ operator with the correct number.
<details>
<summary>x9.png Details</summary>
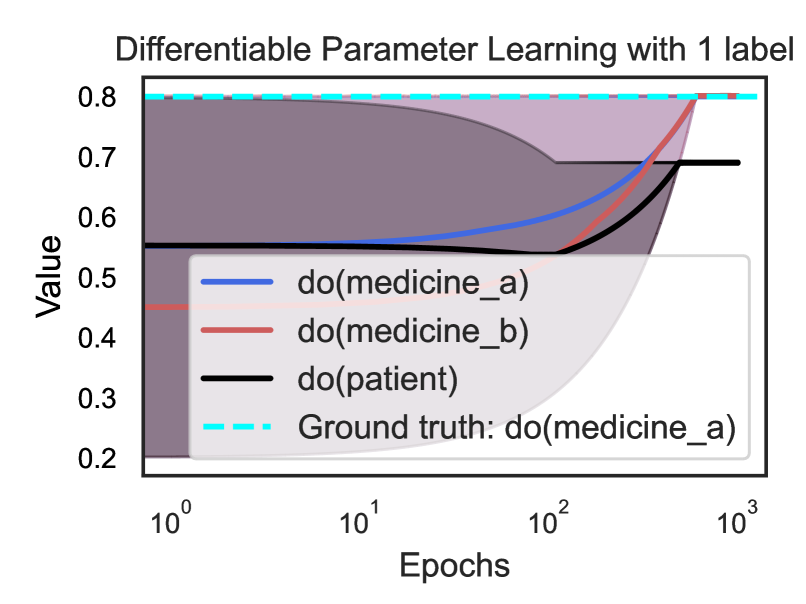
### Visual Description
## Line Graph: Differentiable Parameter Learning with 1 label
### Overview
The graph illustrates the convergence of parameter values for three interventions (`do(medicine_a)`, `do(medicine_b)`, `do(patient)`) over logarithmic epochs (1 to 1000). A dashed cyan line represents the ground truth (`do(medicine_a)`). The y-axis (Value) ranges from 0.2 to 0.8, with shaded regions indicating uncertainty or confidence intervals.
### Components/Axes
- **X-axis (Epochs)**: Logarithmic scale from 10⁰ to 10³.
- **Y-axis (Value)**: Linear scale from 0.2 to 0.8.
- **Legend**: Located in the bottom-right corner, mapping colors to interventions:
- Blue: `do(medicine_a)`
- Red: `do(medicine_b)`
- Black: `do(patient)`
- Dashed Cyan: Ground truth (`do(medicine_a)`).
### Detailed Analysis
1. **`do(medicine_a)` (Blue Line)**:
- Starts at ~0.5 (epoch 10⁰) and increases steadily.
- Reaches ~0.8 by epoch 10³, closely aligning with the ground truth.
- Shaded gray region beneath the line suggests confidence intervals narrowing as epochs increase.
2. **`do(medicine_b)` (Red Line)**:
- Begins at ~0.4 (epoch 10⁰) and rises gradually.
- Crosses the black line (`do(patient)`) around epoch 10¹ but remains below the ground truth.
- Ends at ~0.75 (epoch 10³), still below the target.
3. **`do(patient)` (Black Line)**:
- Starts at ~0.6 (epoch 10⁰) but dips to ~0.5 by epoch 10¹.
- Recovers to ~0.7 by epoch 10³, showing volatility.
4. **Ground Truth (Dashed Cyan Line)**:
- Horizontal line at ~0.8, serving as the target value for `do(medicine_a)`.
### Key Observations
- **Convergence**: `do(medicine_a)` converges most effectively toward the ground truth, while `do(medicine_b)` and `do(patient)` show suboptimal performance.
- **Volatility**: `do(patient)` exhibits a sharp dip early in training, suggesting instability.
- **Uncertainty**: The shaded region under `do(medicine_a)` indicates decreasing uncertainty over time.
### Interpretation
The graph demonstrates that parameter learning for `do(medicine_a)` aligns closely with the ground truth, implying effective model calibration. In contrast, `do(medicine_b)` and `do(patient)` fail to match the target, highlighting potential issues in their learning dynamics. The early dip in `do(patient)` may reflect overfitting or insufficient regularization. The logarithmic epoch scale emphasizes early-stage learning dynamics, where `do(medicine_a)` shows rapid improvement compared to others. The shaded area for `do(medicine_a)` suggests confidence in its predictions, whereas the absence of shading for other lines implies higher uncertainty.
</details>
<details>
<summary>x10.png Details</summary>
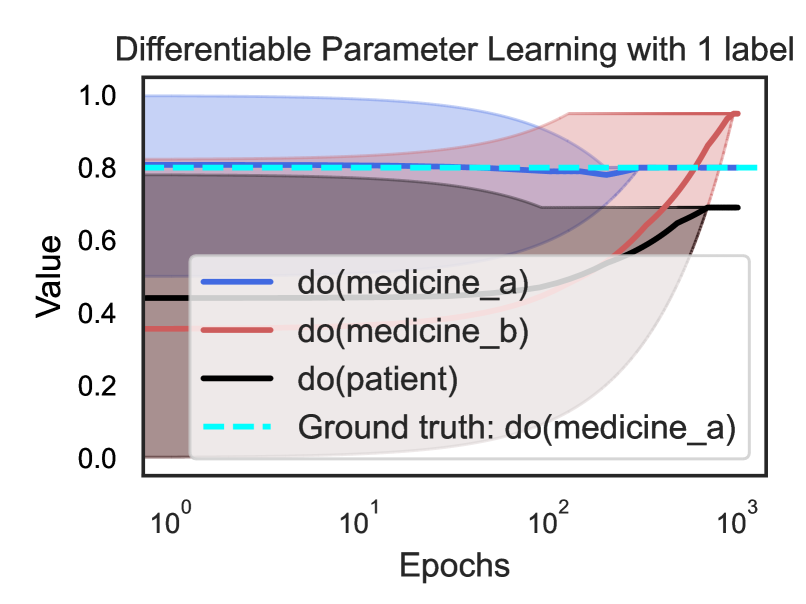
### Visual Description
## Line Chart: Differentiable Parameter Learning with 1 label
### Overview
The chart visualizes the convergence of differentiable parameter learning for three interventions (`do(medicine_a)`, `do(medicine_b)`, `do(patient)`) over logarithmic epochs (1 to 1000). A dashed cyan line represents the ground truth (`do(medicine_a)`). All lines are plotted against a logarithmic x-axis (epochs) and linear y-axis (value from 0.0 to 1.0).
---
### Components/Axes
- **X-axis**: "Epochs" (logarithmic scale: 10⁰ to 10³)
- **Y-axis**: "Value" (linear scale: 0.0 to 1.0)
- **Legend**:
- Blue solid line: `do(medicine_a)`
- Red solid line: `do(medicine_b)`
- Black solid line: `do(patient)`
- Dashed cyan line: Ground truth (`do(medicine_a)`)
---
### Detailed Analysis
1. **`do(medicine_a)` (Blue)**:
- Starts at **~0.8** (epoch 10⁰).
- Dips slightly to **~0.75** at 10¹ epochs.
- Stabilizes near **~0.8** by 10² epochs.
- Remains flat at **~0.8** through 10³ epochs.
2. **`do(medicine_b)` (Red)**:
- Begins at **~0.4** (epoch 10⁰).
- Rises steadily to **~0.8** by 10² epochs.
- Continues increasing to **~0.9** at 10³ epochs.
3. **`do(patient)` (Black)**:
- Starts at **~0.2** (epoch 10⁰).
- Gradually increases to **~0.6** by 10² epochs.
- Reaches **~0.7** at 10³ epochs.
4. **Ground Truth** (Dashed Cyan):
- Horizontal line at **0.8** across all epochs.
---
### Key Observations
- **`do(medicine_a)`** closely tracks the ground truth initially but exhibits a minor dip at 10¹ epochs.
- **`do(medicine_b)`** outperforms `do(patient)` and approaches the ground truth by 10² epochs, surpassing it slightly by 10³.
- **`do(patient)`** shows the slowest convergence, never reaching the ground truth value.
- The ground truth remains constant, serving as a benchmark for comparison.
---
### Interpretation
The chart demonstrates how parameter learning trajectories differ across interventions. `do(medicine_a)` (blue) aligns with the ground truth but shows instability at intermediate epochs, suggesting potential overfitting or sensitivity to hyperparameters. `do(medicine_b)` (red) exhibits robust convergence, closing the gap with the ground truth by 10² epochs and exceeding it by 10³, indicating superior adaptability. `do(patient)` (black) lags significantly, highlighting its inefficiency in this learning paradigm. The logarithmic epoch scale emphasizes early-stage performance differences, while the linear value axis underscores the magnitude of parameter adjustments. The ground truth’s constancy implies a fixed target, with `do(medicine_b)` ultimately achieving the closest approximation.
</details>
Figure 10: Value curve of three $\mathtt{do}$ operators during learning. With three targets (right) and with one target (left). The curves are averaged on 5 runs, with shaded area indicating the maximum and minimum value. (Best viewed in color)
## Appendix D Multi-Task Adaptation
<details>
<summary>x11.png Details</summary>
### Visual Description
## Line Chart: DeepProbLog Loss Curve
### Overview
The chart displays three distinct loss curves for different tasks (Task 1, Task 2, Task 3) plotted against iterations (0–600). Each task is represented by a colored line with a shaded confidence interval. The y-axis measures loss values (0.2–1.4), while the x-axis tracks training iterations. The legend in the top-right corner maps colors to tasks.
### Components/Axes
- **X-axis (Iterations)**: Labeled "Iterations," spanning 0 to 600 in increments of 100.
- **Y-axis (Loss)**: Labeled "LOSS," ranging from 0.2 to 1.4.
- **Legend**: Positioned in the top-right corner, with:
- **Blue line**: Task 1
- **Red line**: Task 2
- **Black line**: Task 3
- **Shaded Areas**: Light-colored bands around each line, likely representing confidence intervals or error margins.
### Detailed Analysis
1. **Task 1 (Blue)**:
- **Placement**: Leftmost segment (0–200 iterations).
- **Trend**: Starts at ~1.3 loss, fluctuates between 1.0–1.4, with sharp peaks and troughs.
- **Shaded Area**: Light blue band shows variability, peaking at ~1.4 and dipping to ~0.8.
2. **Task 2 (Red)**:
- **Placement**: Middle segment (200–400 iterations).
- **Trend**: Starts at ~0.6 loss, stabilizes between 0.4–0.6 with smaller oscillations.
- **Shaded Area**: Light red band indicates tighter confidence intervals compared to Task 1.
3. **Task 3 (Black)**:
- **Placement**: Rightmost segment (400–600 iterations).
- **Trend**: Starts at ~0.8 loss, fluctuates between 0.6–0.8 with moderate variability.
- **Shaded Area**: Light gray band shows wider variability than Task 2 but less than Task 1.
### Key Observations
- **Task 1** exhibits the highest initial loss and greatest variability, suggesting it is the most challenging task.
- **Task 2** stabilizes quickly, with the lowest loss range (0.4–0.6) and narrowest confidence intervals.
- **Task 3** has intermediate loss values (0.6–0.8) and moderate variability, indicating it is less stable than Task 2 but more so than Task 1.
- All tasks show diminishing oscillations over time, implying convergence toward stable loss values.
### Interpretation
The data suggests a hierarchical difficulty in tasks: Task 1 is the most complex, requiring the most iterations to stabilize, while Task 2 converges fastest. The shaded areas highlight uncertainty in Task 1’s predictions, possibly due to higher model sensitivity or data complexity. Task 3’s intermediate performance may reflect a balance between complexity and model adaptability. The separation of tasks into distinct time windows (0–200, 200–400, 400–600) could indicate phased training or task-specific optimization strategies.
</details>
Figure 11: DeepProbLog [21] is initialized using the same candidate meta rules (also with randomized meta rule weights as NEMESYS). The loss curve is averaged on five runs, with the shadow area indicating the minimum and maximum number of the five runs. (Best viewed in color)
<details>
<summary>x12.png Details</summary>
### Visual Description
## Line Chart: Loss and Test Accuracy Across Three Tasks
### Overview
The chart visualizes the training progress of a meta-learning system across three sequential tasks (Causal Reasoning, Proof Tree Generation, Naïve Meta Reasoning) over 600 epochs. It shows loss curves (log scale) and test accuracy curves (linear scale) for each task, alongside learned meta-programs at key epochs.
---
### Components/Axes
- **X-axis**: Iterations (0 to 600), with vertical markers at epochs 0, 200, and 400.
- **Y-axis (Left)**: Loss (log scale, 10⁻¹ to 10¹).
- **Y-axis (Right)**: Test Accuracy (linear scale, 0.0 to 1.0).
- **Legend**:
- **Task 1** (blue): Causal Reasoning (solid line for loss, dotted line for accuracy).
- **Task 2** (red): Generating Proof Tree (solid line for loss, dotted line for accuracy).
- **Task 3** (black): Naïve Meta Reasoning (solid line for loss, dotted line for accuracy).
---
### Detailed Analysis
#### Task 1 (Causal Reasoning, Blue)
- **Loss**: Starts at ~10¹, drops sharply to ~10⁻¹ by epoch 50, then stabilizes with minor fluctuations.
- **Accuracy**: Rises from ~0.0 to ~0.8 by epoch 50, then plateaus.
- **Learned Meta-Program (Epoch 200)**:
```python
0 : solve((A,B)):-solve(A),solve(B).
0 : solve((A,B),(PA,PB)):-solve(A,PA),solve(B,PB).
0.99 : probs([A,As]):-prob(A),probs(As).
```
#### Task 2 (Proof Tree Generation, Red)
- **Loss**: Starts at ~10¹, drops sharply to ~10⁻¹ by epoch 250, then stabilizes.
- **Accuracy**: Rises from ~0.0 to ~0.8 by epoch 250, then plateaus.
- **Learned Meta-Program (Epoch 400)**:
```python
0 : solve((A,B)):-solve(A),solve(B).
0.99 : solve((A,B),(PA,PB)):-solve(A,PA),solve(B,PB).
0 : probs([A,As]):-prob(A),probs(As).
```
#### Task 3 (Naïve Meta Reasoning, Black)
- **Loss**: Starts at ~10¹, drops sharply to ~10⁻¹ by epoch 450, then stabilizes.
- **Accuracy**: Rises from ~0.0 to ~0.8 by epoch 450, then plateaus.
- **Learned Meta-Program (Epoch 600)**:
```python
0.99 : solve((A,B)):-solve(A),solve(B).
0 : solve((A,B),(PA,PB)):-solve(A,PA),solve(B,PB).
0 : probs([A,As]):-prob(A),probs(As).
```
---
### Key Observations
1. **Loss Reduction**: All tasks show rapid loss reduction (~10¹ → 10⁻¹) within the first 50–250 epochs, followed by stabilization.
2. **Accuracy Growth**: Test accuracy plateaus at ~0.8 for all tasks, indicating a performance ceiling.
3. **Task 3 Delay**: Task 3 begins training at epoch 400 but achieves similar performance to earlier tasks, suggesting efficient adaptation.
4. **Meta-Program Evolution**:
- Early epochs focus on `solve` operations.
- Later epochs introduce probabilistic reasoning (`probs`).
- Probability thresholds (e.g., `0.99`) increase over time.
---
### Interpretation
The chart demonstrates a meta-learning system that sequentially adapts to diverse reasoning tasks. The sharp initial drops in loss and rapid accuracy gains suggest effective parameter initialization or task-specific adaptation. The learned meta-programs evolve from deterministic logic (`solve`) to probabilistic reasoning (`probs`), reflecting a progression from basic to complex reasoning. Task 3’s delayed start but comparable performance highlights the system’s ability to generalize across tasks. The consistent accuracy plateau (~0.8) implies inherent task difficulty or data limitations. The meta-programs’ structure (e.g., nested `solve` calls) indicates hierarchical reasoning capabilities.
</details>
Figure 12: Loss curve and accuracy curve of NEMESYS when learning to adapt to solve three tasks. NEMESYS solves three different tasks (causal reasoning, generating proof trees and naive meta reasoning) sequentially (each task is represented by a unique color encoding). The loss curve (solid line) and accuracy curve (dashed line) are averaged on five runs, with the shadow area indicating the minimum and maximum number of the five runs. For readability, the learned complete meta program is shown in the text. (Best viewed in color)
We also compute the accuracy on the test splits of three tasks during the learning process (Fig. 12 dashed line, color encoded). We choose DeepProbLog [21] as our baseline comparison method in this experiment, however, learning the weights of (meta) rules is not supported in DeepProbLog framework, thus we randomly initialized the weights of the meta rules and compute the loss (Fig 11).
In this paragraph, we provide the meta program learned by NEMESYS in the experiment. The weights of meta rules are color coded to visually represent how their values evolve during the learning process (the weights are provided at iteration $\mathtt{200}$ , $\mathtt{400}$ and $\mathtt{600}$ ), as illustrated in the accompanying Fig. 12.
| | $\displaystyle\hskip 6.45831pt\color[rgb]{0,0,1}0\ \hskip 4.30554pt\ \color[rgb ]{0.9,0.3608,0.3608}0.99\ \hskip 4.30554pt\ \color[rgb]{0,0,0}0\ :\mathtt{ solve(A,B)}\texttt{:-}\mathtt{solve(A),solve(B).}$ | |
| --- | --- | --- |