# Improved Panning on Non-Equidistant Loudspeakers with Direct Sound Level Compensation
**Authors**: Jan-Hendrik Hanschke, Daniel Arteaga, Giulio Cengarle, Joshua Lando, Mark R. P. Thomas, Alan Seefeldt
## Improved Panning on Non-Equidistant Loudspeakers with Direct Sound Level Compensation
Jan-Hendrik Hanschke, Daniel Arteaga, Giulio Cengarle, Joshua Lando, Mark R.P. Thomas, and Alan Seefeldt 1
1 Dolby Laboratories
Correspondence should be addressed to Jan-Hendrik Hanschke ( janhendrikhanschke@ieee.org )
## ABSTRACT
Loudspeaker rendering techniques that create phantom sound sources often assume an equidistant loudspeaker layout. Typical home setups might not fulfill this condition as loudspeakers deviate from canonical positions, thus requiring a corresponding calibration. The standard approach is to compensate for delays and to match the loudness of each loudspeaker at the listener's location. It was found that a shift of the phantom image occurs when this calibration procedure is applied and one of a pair of loudspeakers is significantly closer to the listener than the other. In this paper, a novel approach to panning on non-equidistant loudspeaker layouts is presented whereby the panning position is governed by the direct sound and the perceived loudness is governed by the full impulse response. Subjective listening tests are presented that validate the approach and quantify the perceived effect of the compensation. In a setup where the standard calibration leads to an average error of 10 ◦ , the proposed direct sound compensation largely returns the phantom source to its intended position.
## 1 Introduction
In stereo or multichannel loudspeaker setups, a virtual or phantom source is a sound that appears to emanate from a position other than the physical loudspeaker locations [1]. The most common rendering techniques for creating such phantom sources are based on stereo amplitude panning and their multichannel extensions (e.g., vector-base amplitude panning [2], dual/triple balance amplitude panning [3], distance-based amplitude panning [4]). These panning methods distribute the source signal among several loudspeakers, assigning a gain to each loudspeaker so that the resulting sound mixture creates the illusion of a phantom sound source coming from the intended direction. Amplitude panning techniques are commonly used in professional content creation tools for cinema, music and multimedia.
With traditional channel-based formats, panning to channels takes place at the content creation side, addressing a small discrete set of canonical playback configurations (e.g., stereo, 5.1, etc.). These channel-based renderings are then played back on consumer systems where the loudspeaker positions may deviate from the canonical locations, causing a mismatch in angle and perceived level. These inaccuracies result in a shift of the perceived position of a phantom source with respect to the intended position. Object-based audio [5], which utilizes a renderer in the playback device and knowledge of the loudspeaker layout, opens the door to modifying relative gains of individual sources based on the knowledge of actual loudspeaker location and acoustic characteristics of the playback system. So far, most rendering techniques, including those that allow for flexible positioning of loudspeakers and process object-based audio, depend only on the angular position of the loudspeakers relative to the listener. The distance between each loudspeaker and the listening position is assumed to be equal, even if in common home setups that might not hold true.
In case of unequal distances, the state of the art approach is to time align and loudness match the different loudspeakers [2], with the loudness estimated from the full room response of each loudspeaker, which we will refer to as full response compensation (FRC). In the authors' experience, this calibration approach fails when rendering content to layouts with non-equidistant loudspeakers, causing the phantom source to be systematically pulled towards the closest loudspeaker(s). Upon a more thorough reflection with regards to the position of a phantom source, the procedure of loudness matching seems to be at least partially at odds with the well established psychoacoustic principle of the Haas or precedence effect [6, 7]. When a sound is followed by a delayed version of itself with a time delay of approximately 1 ms or more (but less than the echo threshold), a single auditory event is perceived from the direction
of the first arriving wavefront. As a consequence, the perceived direction of a single physical sound source in a room is dominated by sound on the direct path from the source to the listener, not by later arriving room reflections [8]. For time delays smaller than approximately 1 ms, the related summing localization principle [9] states that multiple wavefronts of sound fuse into a phantom source whose perceived direction is a combination of those for each wavefront. When considering panning across multiple time-aligned loudspeakers, this gives strong indication that the quantity determining the virtual source location is the direct sound from each loudspeaker, possibly including early reflections arriving before 1 ms, and not the total sound loudness contained in the entire reverberation tail. Although some literature in the context of equalization hints at the possibility that the direct sound plays a dominant role in the localization and timbre perception of sound [10, 11], and another study uses the anechoic decay as a simplified room model in a panning function [12], we are not aware of systematic studies of this phenomenon in the context of loudspeaker rendering, nor of any practical implementations.
We study and propose a modified panning approach for non-equidistant loudspeakers based on the combined contributions of the direct sound from multiple loudspeakers, and show empirically that it leads to improved phantom source localization accuracy. In order to achieve loudness consistency across multiple phantom source locations, the total response of the loudspeakers is simultaneously considered.
The paper is organized as follows: In Sec. 2 we introduce relevant quantities based on the sound decay model and explain the full response compensation method for level and delay compensation. Sec. 3 then covers the proposed approach to restore the intended phantom source position based on the direct sound contribution while maintaining loudness consistency. In Sec. 4 we describe a subjective listening test to validate the proposed approach and in Sec. 5 we present its results. These results and the main outcomes of the paper are discussed in Sec. 6.
## 2 Fundamentals
## 2.1 Distance-based level decay of loudspeakers in reverberant rooms
As a loudspeaker plays a signal in a room, the direct sound-the sound traveling on the shortest path from the loudspeaker to the listener-is quickly followed by multiple, spatially diverse, indirect reflections with increasing temporal density, often referred to as the diffuse sound field.
The direct sound intensity decays as the squared distance from the loudspeakers. The corresponding direct sound level for each loudspeaker, L DS i in decibel scale is
<!-- formula-not-decoded -->
where Pi is the acoustic power of a source i , Qi its directivity factor in the direction of the listener, and di is the distance to the source.
The diffuse sound intensity is almost constant, depends upon the room characteristics and varies little with source and receiver position, orientation, or distance. The distance at which direct and diffuse intensities are equal is commonly referred to as the critical distance Dc . The overall loudness at the listening position for a given loudspeaker can be inferred by assuming the total sound as the sum of direct sound and diffuse sound field. On axis, the loudness can be estimated from the total sound intensity in decibel scale as
<!-- formula-not-decoded -->
In practice Li can also be obtained from the measurement with a sound level meter, e.g. when capturing pink noise. An equivalent calibration can be achieved through the acquisition and analysis of impulse responses (IRs). The loudness can be estimated from the RMS value of the IR hi ( t ) , with optional weighting filters applied wA ( t ) , for example A-weighting:
<!-- formula-not-decoded -->
The direct sound level L DS i for each loudspeaker cannot be measured with a sound level meter. One option to obtain it is to use the room-independent model per (1). It can also be estimated by multiplying measured impulse responses with a time window that vanishes beyond a certain truncation time t after the arrival of the first peak. Using a small, fixed truncation time has the drawback that frequencies approximately lower than the inverse truncation time cannot be adequately represented. A frequency-dependent truncation (FDT)
kernel k ( n ) [13] may be used to estimate the direct sound portion of the impulse response:
<!-- formula-not-decoded -->
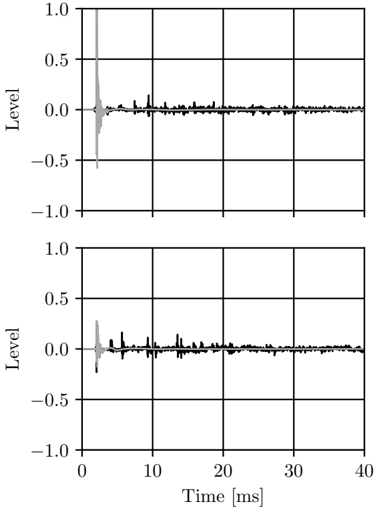
The frequency-dependent truncation filter truncates all frequency components of the impulse response to a time t or smaller. Most commonly, it truncates the lowest frequency under consideration to a time t and higher frequencies to a time smaller than t . This approach has the advantage of providing a better representation of the lower frequencies without compromising the truncation of the impulse response at higher frequencies. Fig. 1 shows examples of FDT applied to impulse responses of non-equidistant loudspeakers in a reverberant room. The corresponding direct sound level L DS i can be estimated by substituting hi for h DS i in (3).
## 2.2 Full response compensation (FRC) of non-equidistant loudspeakers
The state of the art calibration approach involves loudness matching and loudspeaker time alignment.
Loudness matching ensures that each loudspeaker produces the same loudness at the listening position when fed with a reference signal. Given a set of loudspeakers producing a loudness Li at the listening position, the loudness compensation D Li for each loudspeaker is
<!-- formula-not-decoded -->
where L ref is a pre-established reference level. The loudness compensation gains are given by 10 D Li / 20 .
To maintain loudness consistency, the gains gi produced by a panner are usually normalized so that the loudness of the phantom sound source is equal to the loudness of the corresponding sound source when emanating only from a single loudspeaker. For loudness-matched setups, this requires the following relationship be satisfied:
<!-- formula-not-decoded -->
with p usually between 1 and 2. The common sine/cosine pairwise panning law is an example which satisfies the above condition for p = 2. However, any panning law can meet this requirement through normalization.
Fig. 1: Measured IR (black line) for a loudspeaker at 1 . 5 m (top) vs. 3 m (bottom) distance, leading to a theoretical direct sound decay of 6 dB. Analysis of IRs with Frequency Dependent Truncation (grey line) shows a 6 . 3 dB level difference (pink- and A-weighted) in direct sound vs. 3 . 0 dB in overall sound (black line) between near and far loudspeaker.
<details>
<summary>Image 1 Details</summary>
### Visual Description
## Line Graphs: Signal Level Over Time
### Overview
The image contains two vertically stacked line graphs depicting signal level variations over time. Both graphs share identical axes but represent distinct data series. The top graph shows a pronounced initial spike followed by stabilization, while the bottom graph exhibits a smaller initial spike with persistent low-amplitude fluctuations.
### Components/Axes
- **Y-Axis (Level):**
- Range: -1.0 to 1.0
- Markers: -1.0, -0.5, 0.0, 0.5, 1.0
- Units: Dimensionless (unitless "Level" metric)
- **X-Axis (Time):**
- Range: 0 to 40 ms
- Markers: 0, 10, 20, 30, 40 ms
- Units: Milliseconds
- **Graph Structure:**
- Two independent line plots (no shared legend or color coding)
- Top graph: Sharp vertical spike at 0 ms
- Bottom graph: Smaller initial spike with sustained oscillations
### Detailed Analysis
1. **Top Graph (Upper Plot):**
- **Initial Spike:**
- Occurs at 0 ms
- Peaks at approximately 1.0 level
- Duration: <1 ms (exact width indeterminate due to resolution)
- **Post-Spike Behavior:**
- Rapid decay to -0.5 level
- Stabilizes near 0.0 level with minor noise (<0.1 level fluctuations)
- **Key Data Points:**
- (0 ms, 1.0)
- (1 ms, -0.5)
- (40 ms, ~0.0)
2. **Bottom Graph (Lower Plot):**
- **Initial Spike:**
- Occurs at 0 ms
- Peaks at approximately 0.2 level
- Duration: ~2 ms
- **Post-Spike Behavior:**
- Sustained oscillations between -0.5 and 0.5
- Amplitude: ~0.1-0.2 level
- Frequency: ~5-10 Hz (estimated from 40 ms span)
- **Key Data Points:**
- (0 ms, 0.2)
- (2 ms, -0.3)
- (40 ms, ~0.1)
### Key Observations
1. Both graphs exhibit transient spikes at t=0 ms, suggesting a shared triggering event.
2. The top graph's spike is 5× more intense than the bottom graph's.
3. Post-spike behavior differs significantly:
- Top graph stabilizes
- Bottom graph maintains persistent oscillations
4. No correlation between the two data series after t=2 ms.
### Interpretation
The data suggests two distinct signal responses to an initial stimulus:
1. **Top Graph:** Represents a high-amplitude, short-duration impulse response with rapid damping. This could indicate a system with strong initial reactivity but fast stabilization (e.g., mechanical shock absorption).
2. **Bottom Graph:** Shows a lower-amplitude, longer-duration oscillatory response. This might represent a resonant system or ongoing feedback mechanism (e.g., electrical circuit with LC oscillations).
3. The absence of shared color coding or legend prevents direct correlation between the two signals, though their temporal alignment at t=0 ms implies a common cause.
4. The persistent noise in both graphs after the initial spike suggests measurement artifacts or environmental interference.
No textual content, legends, or additional context is present in the image beyond the axis labels. The graphs appear to be standalone technical measurements without explanatory annotations.
</details>
Loudspeaker time alignment consists of adding time delays to the closer loudspeakers so that all loudspeaker signals arrive at the listening position at the same time. The delays D t i applied to each loudspeaker are
<!-- formula-not-decoded -->
where c is the speed of sound and d ref is a reference distance, usually the distance to the most distant loudspeaker.
## 3 Improved panning on non-equidistant loudspeakers
As mentioned in the introduction, we observed that the phantom source is systematically pulled towards
the closest loudspeakers when using the full response compensation approach outlined in Sect. 2.2. Here we propose an alternate procedure that restores the phantom source to its intended position by matching the direct sound from each loudspeaker and preserving the correct loudness by matching levels derived from the full response.
## 3.1 Improved phantom source location: direct sound compensation (DSC)
Given a set of loudspeakers whose direct sound is characterized by a level L DS i as measured in decibels from the listener position, the direct sound compensation for each loudspeaker D Li is
<!-- formula-not-decoded -->
where L DS ref is a reference direct sound level. The directsound compensation gains are 10 D L DS i / 20 .
We assume that the loudspeaker calibration according to the full response compensation procedure outlined in Sec. 2.2 is already in place. To preserve the correct phantom source locations, the direct sound compensation needs to be applied to the gains and the effect of loudness compensation needs to be undone. Therefore, the panning gains gi coming from the amplitude panning algorithm are modified as follows:
<!-- formula-not-decoded -->
## 3.2 Loudness correction
The application of (9) will lead to phantom source images in their correct location, but the loudness of each one of the phantom sources will generally not be correct as the perception of loudness is governed by the level of the entire room response, and not only by the direct sound. To recover the correct loudness of the phantom sound sources, gains g ′ i coming from the process of direct sound compensation are normalized to meet the condition in (6):
<!-- formula-not-decoded -->
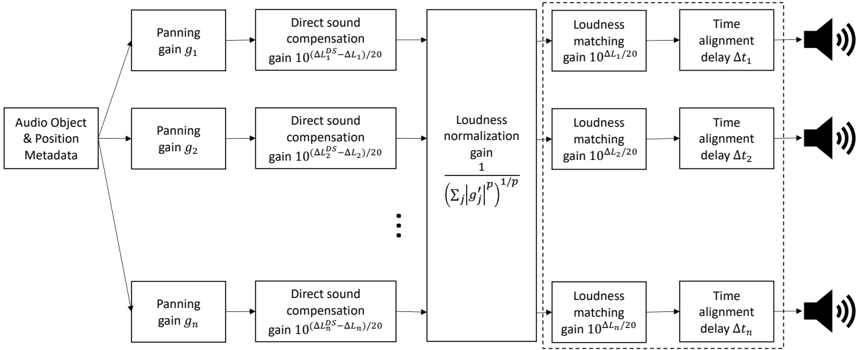
The complete system, a combination of the full response compensation approach with the additional direct sound compensation gain per source object is depicted in Fig. 2.
Combining the gains stages from (9) and (10) along with the full response loudness compensation gains 10 D Li / 20 , the combined gains Gi for a source fed to each loudspeaker are
<!-- formula-not-decoded -->
Should the method outlined here be applied to a loudspeaker setup calibrated in a different way than the state of the art FRC procedure, the specific details in Fig. 2, as well as (9) and (10), would change, but (11) above would still be valid.
## 3.3 Practical implementation
From (11) the final panning gains are clearly dependent on the specifics of the loudspeaker layout, but more critically they are dependent in a manner that varies with phantom source location. This may be appreciated by noting that the denominator of (11) is a function of all the unmodified amplitude panning gains gi across all loudspeakers and will therefore in general be different for different phantom source locations.
As such, a practical implementation requires a renderat-playback-time approach, where the panning gains of each source are applied independently based on the actual loudspeaker layout before mixing together into loudspeaker feeds. This allows for the accounting of direct sound and overall level differences on a per-source basis. This approach works naturally with object-based audio formats but can also be applied to pre-rendered channel-based formats by treating each channel as a "static object" with an assumed canonical playback position.
This paper presents a broadband analysis and compensation of direct sound and overall loudness. All considerations can be extended to frequency dependent, narrowband calibration based on measurements in the listening room.
## 4 Experimental methods
To formally confirm the theoretical and practical findings, a two-part listening test was conducted, isolating the audio attributes of interest respectively: one part focused on the spatial location of phantom sound sources described in Sec. 4.1; the second part targeted
Fig. 2: System diagram of a panning algorithm enhanced by direct sound compensation, followed by full response loudness compensation and time alignment (dotted box).
<details>
<summary>Image 2 Details</summary>
### Visual Description
## Flowchart: Audio Signal Processing Pipeline
### Overview
The diagram illustrates a multi-stage audio signal processing pipeline that transforms audio object metadata into spatially adjusted sound outputs. The process involves panning, direct sound compensation, loudness normalization, loudness matching, and time alignment operations. Two parallel processing paths are highlighted with dashed boxes, suggesting optional or specialized processing branches.
### Components/Axes
1. **Input**:
- "Audio Object & Position Metadata" (leftmost starting point)
2. **Processing Stages**:
- **Panning Gain**:
- Multiple instances labeled `g₁, g₂, ..., gₙ` (subscript notation indicates variable quantity)
- **Direct Sound Compensation**:
- Formula: `gain 10^((ΔL_DS - ΔL)/20)` (applied to each panning gain)
- **Loudness Normalization**:
- Formula: `1 / (Σ|g'_j|^p)^(1/p)` (central processing block)
- **Loudness Matching**:
- Multiple instances with gains `10^(ΔL₁/20), 10^(ΔL₂/20), ..., 10^(ΔLₙ/20)`
- **Time Alignment**:
- Delays labeled `Δt₁, Δt₂, ..., Δtₙ` (subscript notation matches loudness matching gains)
3. **Output**:
- Multiple speaker icons with sound waves (rightmost endpoints)
### Detailed Analysis
1. **Panning Gains**:
- Sequential processing of `g₁` to `gₙ` suggests variable spatial positioning for multiple audio objects
- Each gain feeds into direct sound compensation with identical formula
2. **Direct Sound Compensation**:
- Formula adjusts gain based on loudness difference (ΔL_DS - ΔL)
- Exponential scaling (base 10) indicates decibel-based compensation
3. **Loudness Normalization**:
- Central normalization block uses power-law summation (exponent p)
- Normalization factor ensures consistent loudness across processed signals
4. **Loudness Matching**:
- Parallel processing of multiple loudness adjustments
- Each match uses specific ΔL values (ΔL₁ to ΔLₙ)
5. **Time Alignment**:
- Corresponding delays (Δt₁ to Δtₙ) match loudness matching gains
- Suggests temporal synchronization for spatial audio rendering
### Key Observations
- **Dashed Boxes**: Highlight two distinct processing branches:
1. First branch: `g₁ → ΔL₁ → Δt₁`
2. Last branch: `gₙ → ΔLₙ → Δtₙ`
- **Subscript Notation**: Indicates variable quantity of processing elements (n ≥ 2)
- **Formula Consistency**: All compensation/matching gains use decibel-based scaling (10^(ΔL/20))
- **Bidirectional Flow**: Metadata flows left-to-right through processing stages
### Interpretation
This pipeline demonstrates a sophisticated spatial audio processing system that:
1. **Spatially Positions Audio Objects** through panning gains
2. **Equalizes Loudness** via compensation and normalization
3. **Synchronizes Timing** for coherent spatial rendering
The use of identical formulas across multiple elements suggests a scalable architecture capable of handling multiple audio objects simultaneously. The power-law normalization (exponent p) implies adjustable loudness perception characteristics, while the decibel-based compensation maintains psychoacoustic accuracy. The parallel processing branches indicate potential for real-time adaptive processing or specialized audio object handling.
</details>
the validation of applied loudness correction described in Sec. 4.2.
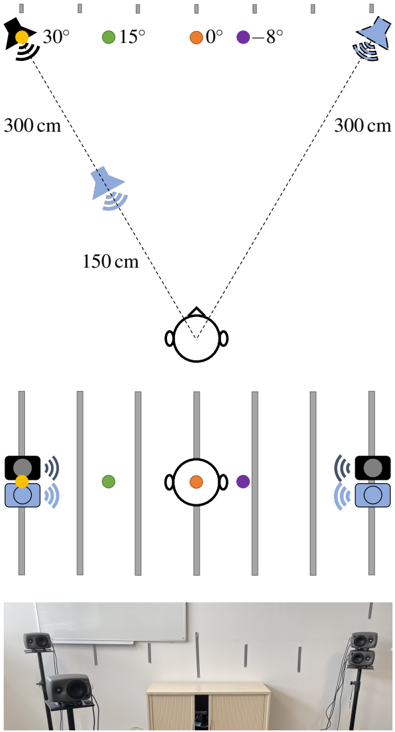
The physical audio system was shared between the two experiments and was set up in an acoustically untreated room, matching typical living room conditions. It consisted of two stereo setups each with loudspeakers at 30 ◦ and -30 ◦ . One setup had the two loudspeakers placed equidistant at 300 cm with a height of 120 cm. The other one had the left loudspeaker at half the distance (150 cm) of the right one (300 cm). Both loudspeakers for this non-equidistant setup were at a height of 104 cm. A small loudspeaker model (Genelec 8020) was chosen to minimize acoustic impact in the form of occlusion and scattering from the lower, closer loudspeaker on the one behind it. The average ear height of the seated participants was 112 cm, in the middle between the two systems, ensuring an undisturbed acoustic path of both loudspeaker setups to the listener.
Fig. 3 shows a schematic view of the listening test setup along with a picture of the actual setup. Loudspeakers are delay and level aligned according to the FRC calibration procedure based on measured impulse responses. The corresponding IRs, which were also analyzed by FDT to ascertain the direct sound levels, can be seen in Fig. 1. These direct sound levels matched the inverse square law (1). The listening test was realized using the webMUSHRA software [14].
There were 16 participants (13 male, 3 female) with an average age of 39.4 years. In a questionnaire 56% stated that they are audio professionals, 43% had past listening test experience and 19% claimed to be expert spatial audio listeners.
## 4.1 Localization test
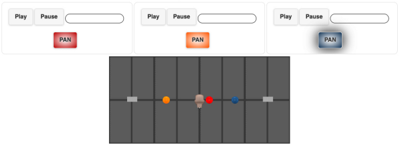
In the first listening test, participants were asked to evaluate the perceived angle of phantom sound sources. As shown in Fig. 4 three conditions were presented on each page of the listening test software. Each of these conditions used the same mono source content panned to an intended angle using three different panning approaches. For all three the underlying panning law was sin/cos panning. Intended source angles were 30 ◦ , 15 ◦ , 0 ◦ and -8 ◦ . The REF condition utilized the equidistant loudspeakers. The FRC condition refers to the non-equidistant loudspeakers which are delay and level aligned (see Sec. 2.2). DSC refers to the panning on the same system according to the methodology described in Sec. 3. The mono source content was a selection of a pop song, pink noise bursts, female speech, drums, and harpsichord samples. The UI position of each stimulus was initialized to a random position; similarly the order of all stimuli was randomized. The participants were instructed to switch between the three conditions on each page and drag and drop little spheres to the desired positions indicating the perceived azimuth location of the phantom sound sources. 10 ◦ step markers on the
Fig. 3: A schematic top and front view of the listening test setup along with a picture of the actual setup. Four dots indicate the intended phantom sources angle at 30 ◦ , 15 ◦ , 0 ◦ and -8 ◦ . 10 degree markers help the participants connect reality to the listening test interface.
<details>
<summary>Image 3 Details</summary>
### Visual Description
## Diagram: Experimental Setup with Angular and Spatial Measurements
### Overview
The image depicts a technical experimental setup involving angular positioning, spatial measurements, and device placement. It includes a schematic diagram, a legend, and a real-world photograph of the setup. The diagram uses color-coded markers to represent angular positions relative to a central observer, while the schematic and photograph illustrate device placement and spatial relationships.
---
### Components/Axes
#### Diagram Elements:
1. **Central Observer**: A stylized human head-and-shoulders icon at the bottom center.
2. **Angular Markers**:
- **30° (Yellow)**: Leftmost marker, 300 cm from the observer.
- **15° (Green)**: Midway marker, 150 cm from the observer.
- **0° (Orange)**: Central marker, aligned with the observer.
- **-8° (Purple)**: Rightmost marker, 300 cm from the observer.
3. **Distance Labels**:
- "300 cm" on both outer lines (left and right).
- "150 cm" on the left inner line.
4. **Legend**: Located at the top-left, associating colors with angles:
- Yellow = 30°, Green = 15°, Orange = 0°, Purple = -8°.
#### Schematic Elements:
1. **Vertical Partitions**: Five gray vertical lines representing spatial divisions.
2. **Devices**:
- **Left Device**: Speaker (blue) and camera (black) on a stand, emitting sound waves.
- **Right Device**: Speaker (blue) and camera (black) on a stand, emitting sound waves.
3. **Colored Dots**:
- Green dot near the left device (15°).
- Orange dot at the center (0°).
- Purple dot near the right device (-8°).
#### Photograph Elements:
1. **Real-World Setup**:
- Two speaker-camera setups on black stands (left and right).
- A light-colored cabinet centered between the devices.
- A whiteboard mounted on the wall behind the cabinet.
---
### Detailed Analysis
#### Diagram:
- **Angular Distribution**:
- The observer’s field of view spans from -8° to 30°, with markers at 15° and 0°.
- Distances decrease from 300 cm (outer markers) to 150 cm (inner left marker).
- **Color-Space Correlation**:
- Yellow (30°) and Purple (-8°) are at the farthest distances (300 cm).
- Green (15°) and Orange (0°) are closer (150 cm and 0 cm, respectively).
#### Schematic:
- **Device Placement**:
- Left device aligns with the 15° (green) marker.
- Right device aligns with the -8° (purple) marker.
- Central observer (orange) is positioned between devices.
#### Photograph:
- **Spatial Relationships**:
- Speaker-camera setups mirror the schematic’s left/right devices.
- Cabinet acts as a central reference point (0° marker).
- Whiteboard provides a neutral background for calibration.
---
### Key Observations
1. **Symmetry**: The setup is symmetrical along the central axis (0°), with devices equidistant from the observer.
2. **Angular Precision**: The -8° marker suggests sub-degree angular resolution.
3. **Distance Gradient**: Distances decrease from 300 cm (outer) to 150 cm (inner), possibly to test proximity effects.
4. **Device Functionality**: Speakers emit sound, while cameras likely record positional data or subject responses.
---
### Interpretation
This setup appears to study **spatial perception** or **auditory localization** from a central observer’s perspective. The angular markers (30°, 15°, 0°, -8°) and distances (300 cm, 150 cm) suggest controlled experiments to measure how stimuli at specific angles and ranges are perceived. The real-world photograph confirms the schematic’s layout, with the cabinet serving as a neutral reference. The use of color-coded markers ensures precise tracking of positional data. The -8° marker indicates a focus on subtle angular variations, possibly to test edge-case perception. The devices’ placement implies a bidirectional stimulus-response model, where sound emission and visual tracking are synchronized.
</details>
Fig. 4: Listening test interface used the localization experiment. The intended angle is shared among the three conditions per page. REF, FRC and DSC systems are rated simultaneously.
<details>
<summary>Image 4 Details</summary>
### Visual Description
## Screenshot: Control Interface with Grid Simulation
### Overview
The image depicts a user interface with three control panels at the top and a grid-based simulation area below. The panels contain interactive buttons and sliders, while the grid features colored dots and a central object, suggesting a dynamic system for tracking or manipulating elements.
### Components/Axes
1. **Top Panels (Left to Right):**
- **Left Panel:**
- **Buttons:** "Play" (gray), "Pause" (gray), "PAN" (red).
- **Slider:** Empty, no numerical markings.
- **Middle Panel:**
- **Buttons:** "Play" (gray), "Pause" (gray), "PAN" (orange).
- **Slider:** Empty, no numerical markings.
- **Right Panel:**
- **Buttons:** "Play" (gray), "Pause" (gray), "PAN" (blue).
- **Slider:** Empty, no numerical markings.
- **Legend:** No explicit legend, but "PAN" button colors (red, orange, blue) likely correspond to colored dots in the grid.
2. **Grid Area:**
- **Structure:** Dark gray grid with 6 vertical lanes (separated by thin black lines) and horizontal lines dividing the space into segments.
- **Elements:**
- **Colored Dots:**
- Yellow dot in lane 2.
- Red dot in lane 3.
- Blue dot in lane 4.
- **Central Object:** A gray, irregularly shaped object centered between lanes 3 and 4.
- **Markers:** Two gray rectangular markers at the edges of lanes 1 and 5.
### Detailed Analysis
- **Control Panels:**
- Each panel has identical "Play" and "Pause" buttons, suggesting they control playback of the simulation. The "PAN" buttons differ in color (red, orange, blue), likely mapping to the colored dots in the grid (yellow, red, blue). The absence of numerical sliders implies manual control rather than quantitative adjustment.
- **Grid Simulation:**
- The grid’s vertical lanes (6 total) and horizontal dividers suggest a track or pathway system. The colored dots (yellow, red, blue) may represent entities or data points, while the central object could be a movable agent or cursor. The gray markers at lanes 1 and 5 might indicate boundaries or reference points.
### Key Observations
1. **Color Mapping:** The "PAN" button colors (red, orange, blue) do not directly match the grid’s colored dots (yellow, red, blue). This discrepancy suggests either a design inconsistency or a potential misalignment in the interface’s logic.
2. **Central Object:** The irregularly shaped central object is positioned between lanes 3 and 4, overlapping the red and blue dots. Its purpose is unclear but may relate to interaction with the colored dots.
3. **Empty Sliders:** The lack of numerical markings on sliders indicates they may function as toggle switches or qualitative controls rather than quantitative adjustments.
### Interpretation
The interface appears to simulate a dynamic system where users can control playback ("Play"/"Pause") and manipulate the position or perspective ("PAN") of entities represented by colored dots. The central object’s placement and interaction with the grid suggest it may act as a focal point or cursor for selecting or moving elements. The mismatch between "PAN" button colors and grid dots raises questions about the interface’s design logic, potentially indicating a bug or incomplete implementation. The absence of numerical data implies the system prioritizes qualitative interaction over quantitative analysis.
</details>
wall of the room matched identical indicators in the listening test software user interface and helped the listeners to connect it to reality.
Five participants were excluded from the localization test. Four of them were excluded because in more than 15% of the cases they reported a hard panning to the left loudspeaker (30 ◦ ) anchor as being located at less than 15 ◦ . Another participant was excluded due to inconsistent reporting.
## 4.2 Loudness test
To validate accurate loudness correction for phantom sound sources, listeners were asked to participate in a second part of the listening test. The utilized methodology was adapted from the loudness validation test proposed in [15]. The standardized ITU BS.1534 MUSHRA [16] interface was used, where the explicit and hidden reference was a panned source on the symmetric loudspeaker layout (REF). The participants were asked to evaluate the loudness of the same phantom source panned on the non-equidistant loudspeaker setup with respect to their similarity to the reference purely with respect to loudness. Two variants of DSC panned sources were presented, depending on whether direct sound compensation included the loudness correction in (10), or not: DSC LC, with loudness correction, and DSC NO LC, without it. Furthermore, an anchor in the form of a scaled reference at -10 dB was added (ANCH). Listeners provided a rating according to the MUSHRA scale with verbal anchors of bad, poor, fair, good and excellent . Phantom sound sources were panned to 30 ◦ , 15 ◦ , 0 ◦ with the same mono content selection from the previous part of the test. To shorten the length of the test -8 ◦ was left out since the smallest differences were expected for it.
One participant was excluded from the second test on the basis of evaluating more than 15% of the hidden reference cases with less than 90 points.
## 5 Experimental results
The statistical analysis follows the general guidelines in ITU-R BS.1534 [16], and was done using the rstatix package in R [17, 18].
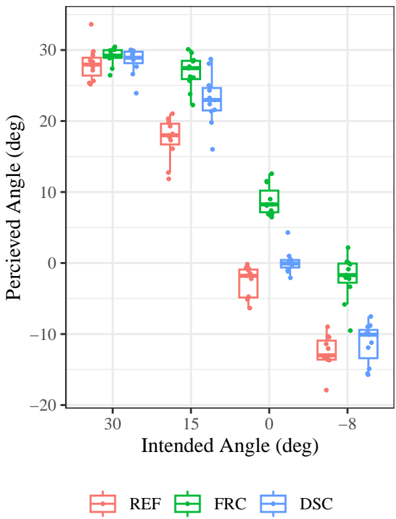
Fig. 5: Localization test: perceived angular locations, as a function of the four intended angles [30 ◦ (i), 15 ◦ (ii), 0 ◦ (iii), -8 ◦ (iv)] and the test condition (REF, FRC, DSC). Dots represent the result of each one of the participants, averaged over all 5 contents items, and the box plots show the corresponding median values and interquartile range.
<details>
<summary>Image 5 Details</summary>
### Visual Description
## Scatter Plot with Box Plots: Perceived vs. Intended Angles
### Overview
The image is a scatter plot with box plots comparing perceived angles (y-axis) to intended angles (x-axis) across three experimental conditions: REF (red), FRC (green), and DSC (blue). The plot includes grid lines, a legend, and outliers marked as individual points.
---
### Components/Axes
- **X-axis (Intended Angle)**: Labeled "Intended Angle (deg)" with values ranging from -8 to 30 in 15-degree increments.
- **Y-axis (Perceived Angle)**: Labeled "Perceived Angle (deg)" with values from -20 to 30 in 10-degree increments.
- **Legend**: Located at the bottom center, associating colors with conditions:
- Red: REF
- Green: FRC
- Blue: DSC
- **Grid**: Light gray horizontal and vertical lines for reference.
---
### Detailed Analysis
#### REF (Red)
- **Box Plots**: Located at intended angles 30°, 15°, 0°, and -8°.
- **30°**: Median ~25°, IQR ~20–30°.
- **15°**: Median ~15°, IQR ~10–20°.
- **0°**: Median ~-5°, IQR ~-10–0°.
- **-8°**: Median ~-10°, IQR ~-15–-5°.
- **Outliers**: One point at (30°, 35°).
#### FRC (Green)
- **Box Plots**: Located at intended angles 30°, 15°, 0°, and -8°.
- **30°**: Median ~30°, IQR ~25–35°.
- **15°**: Median ~25°, IQR ~20–30°.
- **0°**: Median ~10°, IQR ~5–15°.
- **-8°**: Median ~-5°, IQR ~-10–0°.
- **Outliers**: One point at (-8°, -15°).
#### DSC (Blue)
- **Box Plots**: Located at intended angles 30°, 15°, 0°, and -8°.
- **30°**: Median ~25°, IQR ~20–30°.
- **15°**: Median ~20°, IQR ~15–25°.
- **0°**: Median ~5°, IQR ~0–10°.
- **-8°**: Median ~-10°, IQR ~-15–-5°.
- **Outliers**: One point at (0°, 5°).
---
### Key Observations
1. **Downward Trend**: All three conditions show a consistent decrease in perceived angle as intended angle decreases.
2. **REF vs. FRC vs. DSC**:
- REF has the highest medians across all intended angles.
- FRC has the second-highest medians, with a slight divergence at -8°.
- DSC has the lowest medians, particularly at -8°.
3. **Outliers**:
- REF’s outlier at (30°, 35°) exceeds the upper whisker.
- FRC’s outlier at (-8°, -15°) falls below the lower whisker.
- DSC’s outlier at (0°, 5°) is within the IQR but slightly above the median.
---
### Interpretation
The data suggests that perceived angles systematically decrease as intended angles decrease across all conditions. However, the magnitude of this effect varies:
- **REF** consistently overestimates perceived angles compared to FRC and DSC, possibly indicating a calibration bias or perceptual distortion in this condition.
- **FRC** shows the most variability, with a notable outlier at -8°, suggesting potential measurement noise or anomalous responses.
- **DSC** demonstrates the smallest perceived angles, which may reflect a more accurate or constrained perceptual mechanism.
The trends align with the hypothesis that perception is influenced by the intended angle, but the differences between conditions highlight how experimental variables (e.g., REF, FRC, DSC) modulate this relationship. Outliers warrant further investigation to determine if they represent errors or meaningful deviations.
</details>
## 5.1 Localization test
Initially, the normality of the data was examined by means of a QQ plot, which revealed no apparent deviations from normality. A 3-way repeated measures ANOVA was conducted to examine whether the perceived angular positions were dependent on the test content. No significant interaction was revealed [ F ( 8 , 80 ) = 0 . 8, p = . 6].
Subsequently, results were averaged over the different source content items. The resulting data distribution is shown in Fig. 5, as a function of the three test conditions (REF, FRC, DSC) and the four panning angles [30 ◦ (i), 15 ◦ (ii), 0 ◦ (iii), -8 ◦ (iv)]. The median perceived positions for the symmetric reference system
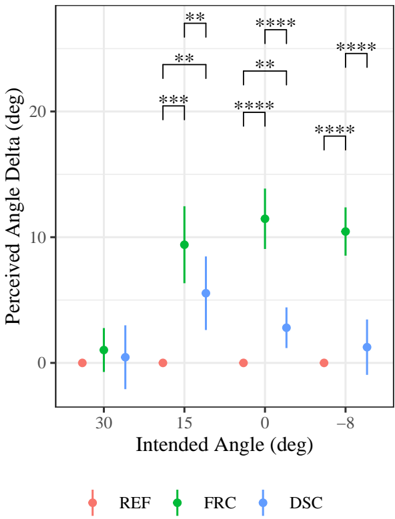
Fig. 6: Localization test: Mean delta perceived angular positions relative to the reference. Dots represent the mean values and bars the confidence intervals of the mean (95% CL). The stars in the plot indicate statistically significant t -tests (adjusted for multiple comparisons). One star (*) denotes p <. 05, two stars (**) denote p <. 01, three stars (***) denote p <. 001, and four stars (****) denote p < 10 -4 .
<details>
<summary>Image 6 Details</summary>
### Visual Description
## Scatter Plot: Perceived vs. Intended Angle Delta
### Overview
The image is a scatter plot comparing perceived angle delta (y-axis) to intended angle (x-axis) across three experimental conditions: REF (red), FRC (green), and DSC (blue). Error bars represent variability, and asterisks denote statistical significance levels.
### Components/Axes
- **X-axis (Intended Angle, deg)**: Ranges from -8° to 30°, with labeled ticks at -8, 0, 15, and 30.
- **Y-axis (Perceived Angle Delta, deg)**: Ranges from 0° to 25°, with increments of 5°.
- **Legend**: Located at the bottom, mapping colors to conditions:
- Red: REF
- Green: FRC
- Blue: DSC
- **Error Bars**: Vertical lines with caps, indicating standard deviation or confidence intervals.
- **Asterisks**: Placed above data points to denote statistical significance (e.g., **, ***, *).
### Detailed Analysis
#### REF (Red)
- **Trend**: Stable, near-zero perceived angle delta across all intended angles.
- **Data Points**:
- -8°: ~0° (±1°)
- 0°: ~0° (±1°)
- 15°: ~0° (±1°)
- 30°: ~0° (±1°)
- **Significance**: No asterisks; no significant deviation from intended angle.
#### FRC (Green)
- **Trend**: Perceived angle delta increases with intended angle magnitude.
- **Data Points**:
- -8°: ~10° (±3°)
- 0°: ~12° (±4°)
- 15°: ~9° (±3°)
- 30°: ~15° (±5°)
- **Significance**:
- 30°: *** (p < 0.001)
- 15°: ** (p < 0.01)
- 0°: * (p < 0.05)
- -8°: No asterisk.
#### DSC (Blue)
- **Trend**: Moderate perceived angle delta, less variable than FRC.
- **Data Points**:
- -8°: ~2° (±2°)
- 0°: ~4° (±3°)
- 15°: ~6° (±4°)
- 30°: ~3° (±2°)
- **Significance**:
- 15°: ** (p < 0.01)
- 0°: * (p < 0.05)
- -8° and 30°: No asterisks.
### Key Observations
1. **REF** consistently perceives angles accurately (near-zero delta).
2. **FRC** shows the largest perceptual errors, especially at extreme angles (30° and -8°).
3. **DSC** exhibits moderate errors, with significant deviations at 15° and 0°.
4. Asterisks cluster at 30°, 15°, and 0°, suggesting systematic differences between conditions at these angles.
### Interpretation
The data demonstrates that perceptual accuracy varies by experimental condition. **FRC** participants overestimate angles more severely at extremes (30° and -8°), while **DSC** shows smaller but statistically significant errors at mid-angles (15° and 0°). **REF** serves as a baseline with minimal deviation, indicating controlled conditions or higher precision. The asterisks imply that differences between groups are statistically significant at key angles, highlighting potential biases in perceptual processing under different experimental setups. This could inform studies on sensory adaptation, cognitive load, or measurement error in angular perception tasks.
</details>
were 28 ◦ (i), 18 ◦ (ii), -2 ◦ (iii), and -13 ◦ (iv), showing a slight displacement from their nominal positions.
A 2-way repeated measures ANOVA was performed to examine the effects of the test condition and intended angle on the results. The ANOVA confirmed significant main effects for the test condition [ F ( 2 , 20 ) = 138 . 7, p = 2 × 10 -12 ], as well as a significant interaction between the test condition and intended angle [ F ( 3 . 0 , 29 . 5 ) = 17 . 0, p = 1 × 10 -6 ].
To further investigate the differences between angles and the three test conditions, multiple paired t -tests were conducted. We utilized the Benjamini-Hochberg method to account for multiple comparisons [16]; all stated p -values are already adjusted for this correction.
<details>
<summary>Image 7 Details</summary>
### Visual Description
## Box Plot: MUSHRA Score Distribution by Intended Angle
### Overview
The image displays a box plot comparing MUSHRA scores across three intended angles (30°, 15°, 0°). Four distinct color-coded data series (red, blue, green, purple) are plotted, with outliers marked as individual points. The y-axis ranges from 25 to 100, while the x-axis categorizes data by angle.
### Components/Axes
- **X-axis (Intended Angle)**: Labeled "Intended Angle (deg)" with categories at 30°, 15°, and 0°.
- **Y-axis (MUSHRA Score)**: Labeled "MUSHRA Score" with a scale from 25 to 100.
- **Legend**: Located on the right, associating colors with data series:
- Red: Highest median scores (30°)
- Blue: Mid-range scores (15°)
- Green: Lower scores (0°)
- Purple: Lowest scores (0°)
- **Outliers**: Red dots above 100 (exceeding y-axis range).
### Detailed Analysis
1. **30° (Red)**:
- Median ~85 (IQR: ~75–90).
- Outliers: 3 points above 100 (potential data anomalies).
- High variability (long whiskers).
2. **15° (Blue)**:
- Median ~75 (IQR: ~65–85).
- Moderate variability (shorter whiskers than 30°).
3. **0° (Green/Purple)**:
- Green: Median ~65 (IQR: ~50–75).
- Purple: Median ~30 (IQR: ~25–40).
- Significant drop in scores compared to higher angles.
### Key Observations
- **Trend**: MUSHRA scores decrease as intended angle decreases (30° > 15° > 0°).
- **Outliers**: Red points above 100 suggest potential measurement errors or exceptional cases.
- **Color Coding**: Purple series (0°) shows the lowest performance, while red (30°) dominates higher scores.
### Interpretation
The data suggests that higher intended angles correlate with better MUSHRA scores, likely reflecting user preference or system performance. The purple series (0°) indicates a critical drop in perceived quality, possibly due to alignment issues or technical limitations. Outliers above 100 warrant investigation—could they represent miscalibrations or biased evaluations? The color-coded groups may represent different experimental conditions (e.g., user groups, systems), but the legend lacks explicit labels, limiting interpretability. Further analysis is needed to confirm causal relationships between angle and score.
</details>
REF
DSC NO LC
DSC LC
ANCH
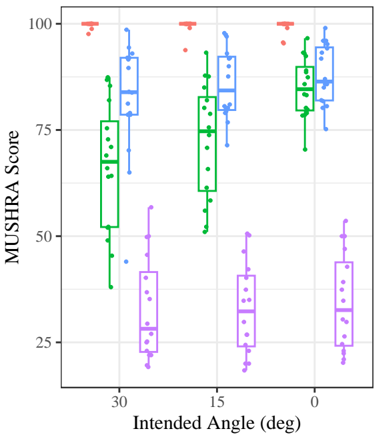
Fig. 7: Loudness test: MUSHRA score as a function of the four intended angles [30 ◦ (i), 15 ◦ (ii), 0 ◦ (iii)] and the test condition (REF, DSC NO LC, DSC LC, ANCH). Dots represent the result of each one of the participants, averaged over all 5 content items, and box plots show the corresponding median values and interquartile range.
Refer to Fig. 6 for a depiction of the perceived angle deltas with respect to the reference and the results of the paired t -tests. At 30 ◦ (hard panning to the left loudspeaker), all panning methods were statistically indistinguishable from one another ( p ≥ . 4). For the remaining phantom source positions, the average FRC results exhibited a consistent displacement of 9 to 11 degrees towards the closest loudspeaker, with these differences being significant in all cases ( p ≤ 1 × 10 -4 ). The average DSC results were much closer to the reference, but still displayed a slight displacement towards the closest loudspeaker: 6 ◦ (ii), 3 ◦ (iii), and 1 ◦ (iv). The differences were significant in cases (ii) and (iii) ( p ≤ . 002), but not in case (iv) ( p = . 2).
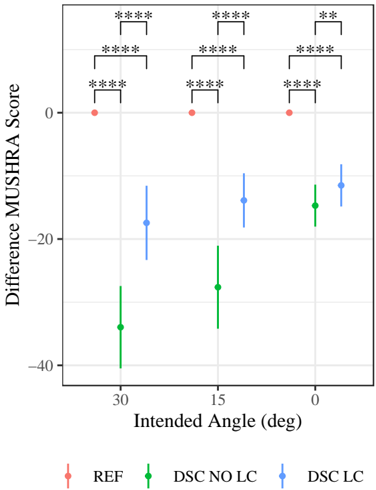
Fig. 8: Loudness test: Differential mean MUSHRA scores relative to the reference as a function of the three intended angles and the test condition. Dots represent the mean values and bars the confidence intervals of the mean (95% CL). Results shown have undergone a standarization process betweeen the different participants (see main text). See caption of Fig. 6 for the meaning of the significance stars.
<details>
<summary>Image 8 Details</summary>
### Visual Description
## Line Chart: Difference MUSHRA Score vs. Intended Angle
### Overview
The chart compares the **Difference MUSHRA Score** across three conditions (REF, DSC NO LC, DSC LC) at three **Intended Angles** (30°, 15°, 0°). The y-axis represents the difference in scores, while the x-axis shows the intended angles. Error bars with asterisks indicate statistical significance.
### Components/Axes
- **X-axis (Intended Angle)**: Labeled "Intended Angle (deg)" with values at 30°, 15°, and 0°.
- **Y-axis (Difference MUSHRA Score)**: Labeled "Difference MUSHRA Score" with a range from -40 to 0.
- **Legend**: Located at the bottom, with three categories:
- **Red (REF)**: Reference condition.
- **Green (DSC NO LC)**: DSC without LC.
- **Blue (DSC LC)**: DSC with LC.
- **Error Bars**: Vertical lines with asterisks (*) denoting statistical significance (e.g., *** for p < 0.001).
### Detailed Analysis
- **REF (Red)**:
- All data points are at **0** (no difference).
- Error bars are the longest, with **three asterisks** (*** ) at all angles, indicating high statistical significance.
- **DSC NO LC (Green)**:
- At **30°**: Approximately **-35** (error bar: -40 to -30).
- At **15°**: Approximately **-25** (error bar: -30 to -20).
- At **0°**: Approximately **-20** (error bar: -25 to -15).
- Error bars decrease in length as the angle decreases.
- **DSC LC (Blue)**:
- At **30°**: Approximately **-15** (error bar: -20 to -10).
- At **15°**: Approximately **-10** (error bar: -15 to -5).
- At **0°**: Approximately **-5** (error bar: -10 to 0).
- Error bars are the shortest, with **two asterisks** (** ) at all angles.
### Key Observations
1. **REF** consistently shows **no difference** (0) across all angles, with the largest error bars and highest statistical significance (*** ).
2. **DSC NO LC** exhibits the **largest negative differences**, decreasing in magnitude as the angle decreases (e.g., -35 at 30° to -20 at 0°).
3. **DSC LC** has the **smallest negative differences**, with values approaching 0 as the angle decreases (e.g., -15 at 30° to -5 at 0°).
4. **Statistical significance** decreases from REF (*** ) to DSC LC (** ) as the angle decreases.
### Interpretation
The data suggests that **DSC LC** (with LC) performs better than **DSC NO LC** (without LC), which in turn performs better than the **REF** condition. The **MUSHRA scores** (a measure of perceptual quality) improve as the **intended angle decreases**, with **DSC LC** showing the most consistent improvement. The **error bars** and **asterisks** indicate that the differences are statistically significant, with **REF** having the highest confidence in its results. The trend implies that **LC (likely a technical feature)** reduces perceptual discrepancies, particularly at smaller angles.
</details>
## 5.2 Loudness test
Initially we examined whether the test results of the loudness validation test were dependent on the test content. A 3-way repeated measures ANOVA revealed no significant interaction between the test condition and the content item [ F ( 4 . 4 , 38 ) = 2 . 3, p = . 07].
Subsequently, results were averaged over the different source content items. The resulting data distribution is shown in Fig. 7, as a function of the four test conditions (REF, DSC NO LC, DSC LC, ANCH) and the three panning angles [30 ◦ (i), 15 ◦ (ii), 0 ◦ (iii)]. The DSC LC condition always scores in the excellent range (above 80 MUSHRA points). The DSC NO LC condition scores systematically below DSC LC, the difference
being greater for panning angles closer to the left loudspeaker.
The QQ plot initially indicated moderate deviations from normality, which were determined to be a result of participants rating content on differing scales. To address this, a data normalization procedure was implemented. Specifically, each participant's result was standardized to have zero mean and unit variance. The MUSHRA scale was then restored by multiplying the standarized results by the global variance and adding the global mean. Following this procedure, the QQ plot no longer indicated evident deviations from normality of the data. The anchor was discarded from the subsequent analysis.
We conducted a 2-way repeated measures ANOVA to examine the effects of test condition and the intended angle on the results. The ANOVA analysis confirmed a significant main effect for the test condition [ F ( 1 . 4 , 20 . 8 ) = 90 . 3, p = 6 × 10 -10 ] and significant interaction between test condition and intended angle [ F ( 2 . 7 , 40 . 0 ) = 28 . 1, p = 2 × 10 -9 ].
A subsequent post-hoc analysis was conducted, in the form of multiple paired t -tests between the different test conditions (see Fig. 8). Again, Benjamini-Hochberg correction for multiple comparisons [16] was applied. Analysis showed that without loudness correction, scores are on average 33 (i), 27 (ii), and 14 (iii) MUSHRA points lower than the reference on average. With loudness correction, this difference is reduced to 16 (i), 13 (ii), and 12 (iii) MUSHRA points. All mutual comparisons are significant ( p ≤ . 005).
## 6 Discussion
The results of the experimental tests show that the common practice to time and level align loudspeakers is insufficient when dealing with non-equidistant loudspeakers, as the phantom source for the FRC system is consistently skewed towards a closer loudspeaker. The average perceived angle delta of about 10 ◦ across all angles under test is high and would result in a significantly impaired playback performance. In all tested cases, using the proposed DSC approach significantly improves the delta angle towards the intended panning position. It is noteworthy that, according to the experiment, DSC performs particularly well in the area in front of the listener, where the human hearing is most sensitive to angular changes.
It is worth mentioning that at the largest examined panning angle (15 ◦ ) the experiment still showed a relatively high bias towards the closer loudspeaker (6 ◦ ). While it is possible that the calculated compensation gain was not totally accurate, it could be conceivable that visual cues of the close loudspeaker pull the rating towards it as the intended panning position comes close to it. After all, phantom source localization is a complicated task affected by multi-sensory factors.
The results of the loudness validation test are in agreement with our hypothesis that the loudness of phantom sources is not defined by the direct sound, but by the full loudspeaker and room response. Across all tested angles, the DSC panning that was loudness compensated according to the full response, got a mean rating in the excellent range of the MUSHRA scale, in all cases significantly better than the non-loudness compensated version of DSC. The dependence on angle of the ratings for the non-loudness compensated condition nicely match the calculated diminishing dB value as the phantom source is panned further and further away from the closer loudspeaker. It is unsurprising that listeners rated differences between the loudness compensated DSC and the reference system. Those can mainly be attributed to other differences in the systems' characteristics such as direct-to-reverberant ratio or spatial characteristics of close loudspeakers which might not have been fully ignored by the listeners, though instructed to do so.
While the formal listening test considered a single phantom source on a stereo layout, typical multimedia content contains many panned objects and the restoring effect to the intended positions using DSC accumulates. Listeners participating in informal listening using a DSC enabled object renderer and multiple loudspeakers reported not only on the restoration of the overall balance, which is otherwise heavily skewed towards close loudspeakers, but also commented on the vastly improved clarity of the mix. These effects were reported to positively affect the rendering, even when the difference in loudspeaker distance was not as substantial as in the presented listening test. Especially in the context of object-based audio and flexible rendering engines at playback time, this approach is a notable step forward towards a faithful representation of the artistic intent in the consumer environment. As object based content makes its way into more and more playback systems like living rooms or cars, the typical loudspeaker setup will be increasingly in-homogeneous
and non-equidistant. Instead of forcing consumers to place loudspeakers in canonical positions, the system should be able to adapt. In this paper we have layed out that, as a consequence of the precedence effect, any panning algorithm and renderer will benefit from taking into account the importance of the relative direct sound.
## References
- [1] Rumsey, F., Spatial audio , Taylor & Francis, 2012.
- [2] Pulkki, V., 'Virtual Sound Source Positioning Using Vector Base Amplitude Panning,' Journal of Audio Engineering Society , 45(6), pp. 456-466, 1997.
- [3] Thomas, M. R. and Robinson, C. Q., 'Amplitude panning and the interior pan,' in Audio Engineering Society Convention 143 , 2017.
- [4] Lossius, T., Baltazar, P., and de la Hogue, T., 'DBAP - Distance-Based Amplitude Panning,' in International Conference on Mathematics and Computing , 2009.
- [5] Tsingos, N., 'Object-Based Audio,' in A. Roginska and P. Geluso, editors, Immersive Sound , pp. 244-275, Routledge, 2017.
- [6] Gardner, M. B., 'Historical Background of the Haas and/or Precedence Effect,' The Journal of the Acoustical Society of America , 43(6), pp. 1243-1248, 2005, ISSN 0001-4966.
- [7] Haas, H., 'Über den Einflu b eines Einfachechos auf die Hörsamkeit von Sprache,' Acta Acustica united with Acustica , 1(2), pp. 49-58, 1951.
- [8] Blauert, J. and Braasch, J., 'Acoustic Communication: The Precedence Effect,' Forum Acusticum Budapest 2005: 4th European Congress on Acustics , 2005.
- [9] Blauert, J., Spatial Hearing: The Psychophysics of Human Sound Localization , The MIT Press, 1996.
- [10] Bank, B., 'Combined quasi-anechoic and in-room equalization of loudspeaker responses,' in Audio Engineering Society Convention 134 , 2013.
- [11] Cecchi, S., Romoli, L., Piazza, F., Bank, B., and Carini, A., 'A novel approach for prototype extraction in a multipoint equalization procedure,' in Audio Engineering Society Convention 136 , 2014.
- [12] Matthews, E. A., Simulation and testing of a multichannel system for 3D sound localization , Master's thesis, Graduate School of Western Carolina University, 2015.
- [13] Karjalainen, M. and Paatero, T., 'Frequencydependent signal windowing,' in Proceedings of the 2001 IEEE Workshop on the Applications of Signal Processing to Audio and Acoustics , pp. 35-38, 2001.
- [14] Schoeffler, M., Bartoschek, S., Stöter, F.-R., Roess, M., Westphal, S., Edler, B., and Herre, J., 'webMUSHRA - A Comprehensive Framework for Web-based Listening Tests,' Journal of Open Research Software , 6, 2018.
- [15] Berendes, H.-U., Travaglini, A., and Uhle, C., 'Validating Loudness Alignment Via Subjective Preference: Towards Improving ITU-R BS.17704,' Journal of the Audio Engineering Society , 2022.
- [16] ITU-R BS.1534-3, 'Method for the subjective assessment of intermediate quality level of audio systems,' ITU recommendation, 2015.
- [17] Kassambara, A., rstatix: Pipe-Friendly Framework for Basic Statistical Tests , 2023, R package version 0.7.2.
- [18] R Core Team, R: A Language and Environment for Statistical Computing , Vienna, Austria, 2023.