# Chain of Code: Reasoning with a Language Model-Augmented Code Emulator
**Authors**: Chengshu Li, Jacky Liang, Andy Zeng, Xinyun Chen, Karol Hausman, Dorsa Sadigh, Sergey Levine, Li Fei-Fei, Fei Xia, Brian Ichter
## Abstract
Code provides a general syntactic structure to build complex programs and perform precise computations when paired with a code interpreter - we hypothesize that language models (LMs) can leverage code-writing to improve Chain of Thought reasoning not only for logic and arithmetic tasks (Chen et al., 2022; Nye et al., 2021; Austin et al., 2021), but also for semantic ones (and in particular, those that are a mix of both). For example, consider prompting an LM to write code that counts the number of times it detects sarcasm in an essay: the LM may struggle to write an implementation for “ detect_sarcasm(string) ” that can be executed by the interpreter (handling the edge cases would be insurmountable). However, LMs may still produce a valid solution if they not only write code, but also selectively “emulate” the interpreter by generating the expected output of “ detect_sarcasm(string) ”. In this work, we propose Chain of Code (CoC), a simple yet surprisingly effective extension that improves LM code-driven reasoning. The key idea is to encourage LMs to format semantic sub-tasks in a program as flexible pseudocode that the interpreter can explicitly catch undefined behaviors and hand off to simulate with an LM (as an “LMulator"). Experiments demonstrate that Chain of Code outperforms Chain of Thought and other baselines across a variety of benchmarks; on BIG-Bench Hard, Chain of Code achieves 84%, a gain of 12% over Chain of Thought. In a nutshell, CoC broadens the scope of reasoning questions that LMs can answer by “thinking in code".
Machine Learning, ICML
UTF8gbsn
https://chain-of-code.github.io/
Direct answer only
Q: How many countries have I been to? I’ve been to Mumbai, London, Washington, Grand Canyon, ... A: 32 (20%, ✗), 29 (10%, ✗), 52 (10%, ✓), ...
Chain of Thought
Q: Let’s think step by step. How many countries have I been to? I’ve been to Mumbai, London, ... We’ll group by countries and count: 1. India: Mumbai, Delhi, Agra 2. UK: London, Dover, Edinburgh, Skye 3. USA: Washington, Grand Canyon, ... A: 61 (20%, ✗), 60 (20%, ✗), 52 (10%, ✓), ...
Chain of Code (Ours)
Q: How many countries have I been to? I’ve been to Mumbai, London, Washington, Grand Canyon, Baltimore, ... 1 places, countries = ["Mumbai", ...], set() delta state: {places = [‘Mumbai’, ...], countries = set()} 2 for place in places: delta state: {place = ‘Mumbai’} 3 country = get_country(place) delta state: {country = ‘India’)} 4 countries.add(country) delta state: {countries = {‘India’}} 5 answer = len(countries) delta state: {answer = 52} A: 52 (100%, ✓)
Figure 1: Chain of Code generates code and reasons through an LM-augmented code emulator. Lines evaluated with Python are in red and with an LM are in purple. The full query is in Fig. LABEL:fig:intro_query.
<details>
<summary>extracted/5762267/fig/all_tasks_direct.png Details</summary>
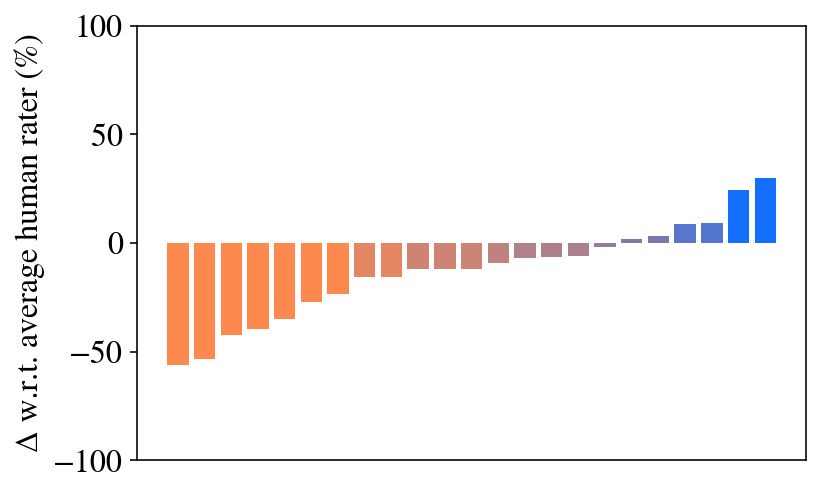
### Visual Description
## Bar Chart: Percentage Difference from Average Human Rater
### Overview
The image displays a horizontal bar chart (with vertical bars arranged along a horizontal axis) that visualizes the percentage difference (Δ) of various items relative to an average human rater's score. The chart shows a clear progression from negative to positive differences, with a corresponding color gradient from orange to blue.
### Components/Axes
* **Y-Axis (Vertical):**
* **Label:** `Δ w.r.t. average human rater (%)`
* **Scale:** Linear scale ranging from -100 to 100.
* **Major Tick Marks:** At -100, -50, 0, 50, and 100.
* **X-Axis (Horizontal):**
* **Label:** Not explicitly labeled. The axis contains a series of discrete, unlabeled categories represented by individual bars.
* **Number of Bars:** Approximately 20 distinct bars.
* **Data Series:**
* A single series of vertical bars.
* **Color Encoding:** The bars follow a color gradient. Bars on the far left are orange, transitioning through shades of brown and muted purple in the middle, to blue on the far right. This color progression is directly correlated with the bar's value (negative to positive).
* **Legend:** No separate legend is present. The color gradient itself serves as an implicit key, mapping color to the magnitude and sign of the percentage difference.
### Detailed Analysis
The chart presents a sorted sequence of values. Each bar represents a distinct, unnamed item (e.g., a model, a method, a condition).
* **Trend Verification:** The data series exhibits a clear, monotonic upward trend from left to right. The leftmost bar has the most negative value, and each subsequent bar to the right is taller (less negative or more positive) than the previous one, culminating in the rightmost bar with the highest positive value.
* **Value Extraction (Approximate):**
* **Leftmost (Orange) Bar:** ~ -55%
* **Progression:** The values increase steadily. Bars in the first third are all negative (orange). Bars in the middle third hover near the zero line (brown/purple). Bars in the final third are positive (blue).
* **Rightmost (Blue) Bar:** ~ +30%
* **Zero Crossing:** The transition from negative to positive values occurs roughly in the middle of the chart, around the 10th or 11th bar from the left.
### Key Observations
1. **Strong Correlation Between Color and Value:** The color gradient is perfectly synchronized with the numerical value. Orange consistently indicates negative performance relative to the human rater, while blue indicates positive performance.
2. **Wide Performance Spread:** The items show a substantial range of performance, spanning approximately 85 percentage points from the worst (~ -55%) to the best (~ +30%).
3. **Cluster Near Baseline:** A significant number of items (roughly the middle 8-10 bars) have performance very close to the human rater baseline (between -10% and +10%).
4. **No Explicit Labels:** The chart lacks labels for individual bars or a categorical x-axis, making it impossible to identify which specific item corresponds to which performance value without external context.
### Interpretation
This chart is a comparative performance visualization. It ranks multiple entities against a human benchmark.
* **What it demonstrates:** The data suggests a hierarchy of performance. The entities on the left (orange) underperform the average human rater significantly. The entities in the middle perform comparably to humans. The entities on the right (blue) outperform the average human rater.
* **Relationship between elements:** The color gradient is not merely aesthetic; it is a direct visual encoding of the quantitative `Δ` value, reinforcing the ranking. The sorted order of the bars makes the performance distribution immediately apparent.
* **Notable patterns:** The smooth, almost linear progression suggests the items may be ordered by a continuous underlying variable (e.g., model size, training data amount, or a version number) that correlates with performance. The cluster near zero indicates that achieving parity with the human rater is a common outcome, while significant deviation in either direction is less frequent.
* **Implied Context:** This type of chart is common in machine learning and AI research to compare model outputs against human judgments (e.g., in text generation, image quality assessment, or translation). The "Δ w.r.t. average human rater" metric implies a normalized score where 0 represents human-level performance.
</details>
(a) Direct answer only
<details>
<summary>extracted/5762267/fig/all_tasks_cot.png Details</summary>
### Visual Description
## Bar Chart: Delta w.r.t. Average Human Rater
### Overview
The image displays a vertical bar chart showing the percentage change (delta) relative to an average human rater. The chart contains 20 bars arranged in ascending order from left to right, transitioning from negative to positive values. The bars are colored with a gradient, starting with orange on the left, moving through brownish and purple hues in the middle, and ending with blue on the right. There is no chart title, legend, or x-axis label present.
### Components/Axes
* **Y-Axis (Vertical):**
* **Label:** "Δ w.r.t. average human rater (%)"
* **Scale:** Linear scale ranging from -100 to 100.
* **Major Tick Marks:** At -100, -50, 0, 50, and 100.
* **X-Axis (Horizontal):**
* **Label:** None present.
* **Content:** 20 discrete, unlabeled categories represented by individual bars.
* **Legend:** None present. Color is used as a visual cue for the value's position in the sorted sequence.
* **Data Series:** A single series of 20 data points, each represented by a bar.
### Detailed Analysis
The data represents a sorted distribution of percentage deltas. The trend is a consistent, monotonic increase from the leftmost to the rightmost bar.
**Estimated Data Points (from left to right):**
The following values are approximate visual estimates based on the bar heights relative to the y-axis grid.
1. Bar 1 (Orange): ~ -35%
2. Bar 2 (Orange): ~ -30%
3. Bar 3 (Brown): ~ -15%
4. Bar 4 (Brown): ~ -12%
5. Bar 5 (Brown): ~ -8%
6. Bar 6 (Brown): ~ -7%
7. Bar 7 (Purple): ~ -5%
8. Bar 8 (Purple): ~ -3%
9. Bar 9 (Purple): ~ -1%
10. Bar 10 (Purple): ~ 0% (appears to be at the baseline)
11. Bar 11 (Blue-Purple): ~ +2%
12. Bar 12 (Blue-Purple): ~ +5%
13. Bar 13 (Blue): ~ +7%
14. Bar 14 (Blue): ~ +10%
15. Bar 15 (Blue): ~ +12%
16. Bar 16 (Blue): ~ +12%
17. Bar 17 (Blue): ~ +18%
18. Bar 18 (Blue): ~ +20%
19. Bar 19 (Blue): ~ +25%
20. Bar 20 (Blue): ~ +38%
**Trend Verification:** The visual trend is a clear, steady upward slope from the first bar (most negative) to the last bar (most positive). The rate of increase appears relatively constant, with a slight acceleration in the final few bars.
### Key Observations
1. **Sorted Distribution:** The data is presented in strictly ascending order, which is a deliberate choice to show the full range and distribution of performance relative to the human baseline.
2. **Crossover Point:** The 10th bar sits at or very near the 0% line, indicating that half of the items perform at or below the average human rater, and half perform at or above it.
3. **Range:** The total spread of the data is substantial, from approximately -35% to +38%, a range of about 73 percentage points.
4. **Color Gradient:** The color shift from orange (negative) to blue (positive) provides an immediate visual cue for performance, with the middle (near-zero) values represented by neutral, desaturated tones.
5. **Missing Context:** The chart lacks a title, legend, and x-axis labels. This omits crucial information about what the 20 bars represent (e.g., different models, tasks, or conditions).
### Interpretation
This chart visualizes the performance of 20 distinct entities (likely AI models, algorithms, or experimental conditions) compared to a human performance benchmark. The "delta" metric suggests a direct comparison where 0% represents parity with the average human rater.
The data demonstrates a wide spectrum of capability. The leftmost entities significantly underperform the human baseline, while the rightmost entities outperform it by a notable margin. The smooth, sorted progression suggests a continuum of performance rather than distinct clusters.
The most significant insight is the existence of entities that surpass human performance (the blue bars on the right). The top performer exceeds the human average by nearly 40%, which is a substantial margin in many evaluation contexts. Conversely, the worst performer lags by about 35%.
**Without additional context, the specific meaning of the 20 categories is unknown.** However, the chart's structure is classic for benchmarking results, often seen in machine learning research to compare multiple models on a standardized task. The color gradient is an effective design choice to reinforce the quantitative ranking with a qualitative visual signal.
</details>
(b) Chain of Thought
<details>
<summary>extracted/5762267/fig/all_tasks_coc_interweave_no_title.png Details</summary>
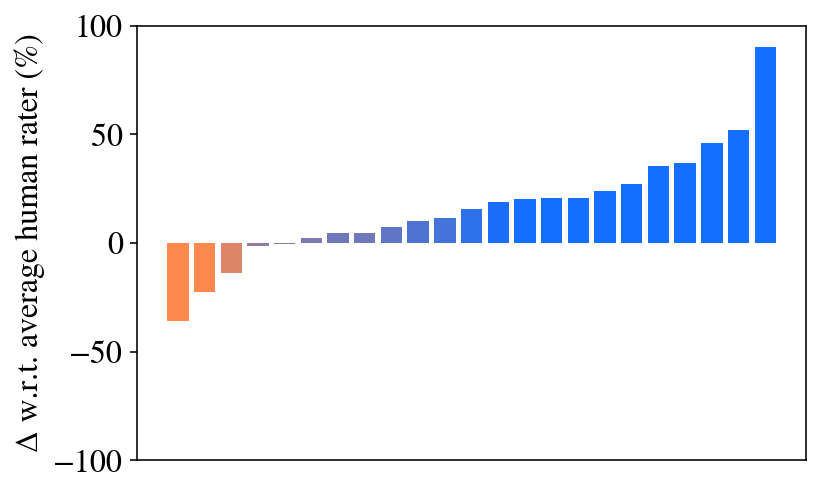
### Visual Description
## Bar Chart: Performance Relative to Average Human Rater
### Overview
The image displays a vertical bar chart showing the percentage change (Δ) of various items relative to an average human rater. The chart contains 20 bars, ordered from the most negative value on the left to the most positive value on the right. The bars are color-coded: three bars on the left are orange (negative values), and the remaining 17 bars are blue (positive values), with the blue color becoming progressively darker as the values increase.
### Components/Axes
* **Y-Axis (Vertical):**
* **Label:** "Δ w.r.t. average human rater (%)"
* **Scale:** Linear scale ranging from -100 to 100.
* **Major Tick Marks:** At -100, -50, 0, 50, and 100.
* **X-Axis (Horizontal):**
* **Label:** None present. The axis contains 20 discrete, unlabeled positions for the bars.
* **Legend:** No explicit legend is present. Color is used to distinguish negative (orange) from positive (blue) values.
* **Data Series:** A single series of 20 bars representing individual items or categories. The specific identities of these items are not labeled in the chart.
### Detailed Analysis
The chart presents a sorted distribution of performance deltas. The values are approximate, derived from visual estimation against the y-axis scale.
* **Negative Values (Orange Bars, Left Side):**
* Bar 1 (far left): Approximately -40%.
* Bar 2: Approximately -25%.
* Bar 3: Approximately -15%.
* **Trend:** These three bars show a clear negative performance relative to the human average, with the magnitude of underperformance decreasing from left to right.
* **Transition Zone (Near Zero):**
* Bars 4 and 5 are very close to the 0% line, with values near 0% and +2% respectively. They appear as thin lines, indicating minimal deviation from the average.
* **Positive Values (Blue Bars, Right Side):**
* The positive bars show a consistent, monotonic increase in value from left to right.
* **Approximate Values (from left to right):** +5%, +8%, +10%, +15%, +18%, +20%, +20%, +25%, +30%, +35%, +45%, +50%, +90% (far right).
* **Trend:** The blue bars exhibit a clear upward slope, indicating progressively better performance relative to the human average. The final bar on the far right is a significant outlier, showing a performance nearly 90% above the average.
### Key Observations
1. **Bimodal Distribution:** The data is split into a small group of underperformers (orange) and a larger group of overperformers (blue).
2. **Monotonic Increase:** Within the positive group, performance improves steadily from one item to the next.
3. **Significant Outlier:** The rightmost bar shows a performance delta (+90%) that is dramatically higher than the second-highest bar (+50%), suggesting a standout item.
4. **Clustering Near Zero:** Two items perform almost exactly at the average human rater level.
5. **Missing Context:** The chart lacks a title, x-axis labels, and a legend explaining what the individual bars represent (e.g., different AI models, algorithms, or test conditions).
### Interpretation
This chart visualizes a comparative performance analysis. The metric "Δ w.r.t. average human rater (%)" suggests that each bar represents the percentage by which an item's score deviates from a baseline established by averaging human ratings.
* **What it demonstrates:** The data suggests that the majority of items (17 out of 20) outperform the average human rater, with one item showing exceptional superiority. Only a small subset (3 items) performs worse than the human average.
* **Relationship between elements:** The ordering from worst to best performance creates a clear visual narrative of progression. The color shift from orange to blue reinforces the transition from negative to positive performance.
* **Notable patterns/anomalies:** The most striking pattern is the steep, accelerating increase in performance among the top-performing items, culminating in the outlier. This could indicate a "winner-takes-all" scenario or a breakthrough method among the tested items. The absence of labels is a critical limitation, preventing identification of the specific entities being compared. The chart effectively communicates relative ranking and the magnitude of performance differences but requires external context to be fully actionable.
</details>
(c) Chain of Code (Ours)
Figure 2: Overall results on BIG-Bench Hard compared to human performance (Srivastava et al., 2022).
## 1 Introduction
Language models (LMs) at certain scale exhibit the profound ability to solve complex reasoning questions (Brown et al., 2020; Wei et al., 2022a) – from writing math programs (Drori et al., 2022) to solving science problems (Lewkowycz et al., 2022). Notably, these capabilities have shown to improve with Chain of Thought (CoT) prompting (Wei et al., 2022b), whereby complex problems are decomposed into a sequence of intermediate reasoning steps. CoT excels at semantic reasoning tasks, but tends to struggle with questions that involve numeric or symbolic reasoning (Suzgun et al., 2022; Mirchandani et al., 2023). Subsequent work addresses this by prompting LMs (e.g., trained on Github (Chen et al., 2021)) to write and execute code (Chen et al., 2022; Nye et al., 2021; Austin et al., 2021). Code in particular is advantageous because it provides both (i) a general syntactic structure to build and encode complex programs (Liang et al., 2023) (e.g., logic structures, functional vocabularies – in ways that are Turing complete), and (ii) an interface by which existing APIs paired together with an interpreter can be used to perform precise algorithmic computations (e.g., from multiplication of large numbers to sorting an array of size 10,000) that a language model trained only to mimic the statistically most likely next token would otherwise struggle to produce.
While writing and executing code may improve LM reasoning performance across a wide range of arithmetic tasks, this particular approach contends with the fact that many semantic tasks are rather difficult (and at times, nearly impossible) to express in code. For example, it remains unclear how to write a function that returns a boolean when it detects sarcasm in a string (Suzgun et al., 2022) (handling the edge cases would be insurmountable). Perhaps fundamentally, using LMs to write programs in lieu of multi-step textual reasoning inherently assumes that the intermediate reasoning traces (expressed in lines of code) all need to be executable by an interpreter. Is it possible to lift these restrictions to get the best of both reasoning in code and reasoning in language?
In this work, we propose Chain of Code (CoC), a simple yet surprisingly effective extension to improve LM code-driven reasoning – where the LM not only writes a program, but also selectively “simulates” the interpreter by generating the expected output of certain lines of code (that the interpreter could not execute). The key idea is to encourage LMs to format semantic sub-tasks in a program as flexible pseudocode that at runtime can be explicitly caught and handed off to emulate with an LM – we term this an LMulator (a portmanteau of LM and emulator). For example, given the task “ in the above paragraph, count how many times the person was sarcastic,” we can in-context prompt the LM to write a program that may call helper functions such as is_sarcastic(sentence), to which the LM makes a linguistic prediction and returns the result as a boolean output, that then gets processed with the rest of the program. Specifically, we formulate LM reasoning as the following process (illustrated in Figure 1): the LM writes code, the interpreter steps through to execute each line of code (in red), or if it fails, simulates the result with the LM (in purple) and updates the program state (in green). CoC inherits the benefits of both (i) writing executable code (where precise algorithmic compututations are left to an interpreter), and (ii) writing pseudocode for semantic problems, and generating their outputs (which can be thought of as a simple formatting change, to which LMs are robust (Min et al., 2022)) – enabling the LM to “think in code”.
Extensive experiments demonstrate that CoC is applicable to a wide variety of challenging numerical and semantic reasoning questions, and outperforms a number of popular baselines. In particular, we find that it achieves high performance on BIG-Bench Hard tasks (Suzgun et al., 2022), outperforming average human raters overall and outperforming even the best human raters on an algorithmic subset of tasks, and to the best of our knowledge setting a new state of the art. We further show that both code interpreter execution and language model execution simulation are necessary for this performance, and that the approach scales well with large and small models alike – contrary to prompting techniques like Chain of Thought that only emerge at scale. We then demonstrate how Chain of Code can serve as a general purpose reasoner via cross-task prompting benchmark, which in contrast to prior work, uses prompts from different families of problems as context – providing only the structure of the response (as opposed to the solution itself). Finally, we show CoC is complementary to more advanced instruction tuned chat models, robust against prompt variation, and applicable beyond language reasoning domain like robotics. This work underscores how one may leverage the structure and computational power of code and the reasoning abilities of language models to enable a “best of both worlds” reasoner.
## 2 Chain of Code: Reasoning with an LMulator
In this section, we describe Chain of Code (CoC), an approach that leverages the ability of language models to code, to reason, and to leverage an LM-augmented code emulator (an LMulator) to simulate running code. We start with background in Section 2.1, then overview the method in Section 2.2, its implementation in Section 2.3, and finally its capabilities in Section 2.4.
### 2.1 Preliminaries
Briefly, we overview some background on LM reasoning. Many of these reasoning techniques have been enabled by in-context learning (Brown et al., 2020), which provides the model with a few demonstrative examples at inference time, rather than updating any weights with gradients. These examples serve to provide context and format for the setting, enabling the model to emulate these examples while adapting to a new query. This property has been instrumental in easily applying LMs to new tasks as it can be rapidly adapted and requires minimal data.
Through in-context learning, approaches have been developed to leverage human thought processes and use tools to improve performance of language models. We outline three such approaches that provide the foundations for Chain of Code. Chain of Thought (CoT) (Wei et al., 2022b), ScratchPad (Nye et al., 2021), and Program of Thoughts (Chen et al., 2022) demonstrated the efficacy of breaking problems down into substeps. For CoT these substeps are in natural language, mirroring one’s thought process when stepping through a complicated problem. ScratchPad, on the other hand, maintains a program state of intermediate steps when simulating the output of code – resulting in an LM acting as a code interpreter. Program of Thoughts (Chen et al., 2022) focused on generating the code itself, which is then executed by a code interpreter to solve reasoning problems. Each of these is visualized in Figure 3(c).
(a) Chain of Thought
(b) Program of Thoughts
(c) ScratchPad
Figure 3: Previous reasoning methods: To solve advanced problems, (LABEL:fig:prelim-cot) Chain of Thought prompting breaks the problem down into intermediate steps, (LABEL:fig:prelim-pot) Program of Thoughts prompting writes and executes code, and (LABEL:fig:prelim-scratchpad) ScratchPad prompting simulates running already written code by tracking intermediate steps through a program state. Our reasoning method: Chain of Code first (LABEL:fig:method_generation) generates code or psuedocode to solve the question and then (LABEL:fig:method_execution) executes the code with a code interpreter if possible, and with an LMulator (language model emulating code) otherwise. Blue highlight indicates LM generation, red highlight indicates LM generated code being executed, and purple highlight indicates LMulator simulating the code via a program state in green.
(d) Chain of Code Generation (Ours)
(e) Chain of Code Execution (Ours)
### 2.2 Chain of Code
Inspired by how a human may reason through a particularly complex problem with a mix of natural language, pseudocode, and runnable code or how a researcher may develop a new general algorithm through a code-based formalism then apply it to a problem, Chain of Code proceeds in two steps: (1) Generation, which, given the question to solve, an LM generates code to reason through the problem, and (2) Execution, which executes the code via a code interpreter when possible and via an LM when not. See Section 2.3 for more details on the specific implementation.
Chain of Code Generation Given a problem to solve, CoC generates reasoning substeps in the structure of code. This code provides the framework of reasoning through the problem, and may be in the form of explicit code, pseudocode, or natural language. Figure LABEL:fig:method_generation walks through a potential generation to solve an object counting problem from BIG-Bench.
Chain of Code Execution A core contribution of CoC is not just the generation of reasoning code, but the manner in which it is executed. Once the code is written, the code is attempted to be run by a code interpreter – in this work we consider Python, but the approach is general to any interpreter. If the code is successfully executed, the program state is updated and the execution continues. If the code is not executable or raises any exception, the language model instead is used to simulate the execution. The program state is subsequently updated by the language model’s outputs and the execution continues. Herein, we refer to this as an LMulator, a portmanteau of LM and code emulator. This relatively simple change enables a variety of new applications for code which mix semantics and numerics. Figure LABEL:fig:method_execution shows how the generated code is run, maintaining the program state and switching between the Python executor and the LMulator.
### 2.3 Chain of Code Implementation
While the generation implementation is straightforward prompting and language model generation, the execution implementation is slightly more complex. Our implementation is based on using Python’s try and except and maintaining a program state. Line by line CoC steps through the code. If the line is executable by a code interpreter, it is executed, the program state is updated, and the program continues. If it is not executable by a code interpreter, a language model is given the context of the program (the question, the prior lines, and the history of the program state) and generates the next program state. This emulation can also leverage chain of thought to determine how to respond. That generated program state is then updated for the code interpreter as well. This sharing of program state interweaves the code interpreter and the language model simulator in a manner applicable to arbitrary interweaving, even control flow like for -loops and if -statements. This continues until the entire code is run, and the answer is retrieved as the value of the variable named answer, or in case of irrecoverable errors, with the language model outputting A: answer.
To illustrate with a brief example, the code answer = 0; answer += is_sarcastic(‘you don’t say’); answer += 1; would be executed as follows: (1) Python would execute the first line answer = 0; and update the program state to {answer = 0}, (2) Python would attempt to execute the second line and fail, and thus the LMulator would simulate the code answer += is_sarcastic(‘you don’t say’); by generating the program state {answer = 1}, which would be updated in the program, (3) Python would execute the last line answer += 1; and update the program state to {answer = 2}, (4) the answer would be retrieved as 2.
### 2.4 Chain of Code Abilities
Chain of Code has several attractive properties:
1. It enables code use in entirely new regimes, by combining the advantages of code with the powerful semantic and commonsense knowledge of language models, which can easily express rules that are challenging to express in code (e.g., which foods are fruits?). Such an ability may have benefits beyond reasoning problems and its flexibility enables executing expressive language, such as pseudocode.
1. It leverages the ability of language models to code, a particular strength of recent language models due to the high quality data available.
1. It inherits many of the benefits of reasoning code, both the formal yet expressive structure of code (e.g., Turing completeness) and powerful computational tools available to code (whether simply multiplying two numbers, calculating $√[5]{12121}$ , or simulating physics).
1. It inherits many of the benefits of techniques that reason via intermediate steps, such as Chain of Thought. These techniques enable the language model to use more computation when necessary to solve a problem as well as provide more interpretability.
Empirically, we observe in Section 3 that these benefits results in significant improvements in reasoning performance over a variety of challenging tasks.
## 3 Experimental Evaluation
We select challenging problems requiring varied types of reasoning, whether arithmetic, commonsense, or symbolic reasoning tasks, to answer the following questions:
1. How well does CoC perform across a variety of tasks?
1. Which types of problems does CoC perform best?
1. How does each aspect of CoC affect performance?
1. How does CoC scale with model size?
1. How does CoC perform as a general-purpose reasoner, with prompt examples from different problems rather than the same problem (which we term cross-task prompting)?
1. How can CoC be used with instruction tuned chat models?
1. How robust CoC is against prompt variation?
1. Can CoC be applied beyond language reasoning tasks?
We first discuss the approaches, ablations, and baselines considered in Section 3.1, then the tasks considered in Section 3.2, and finally the results in Section 3.3.
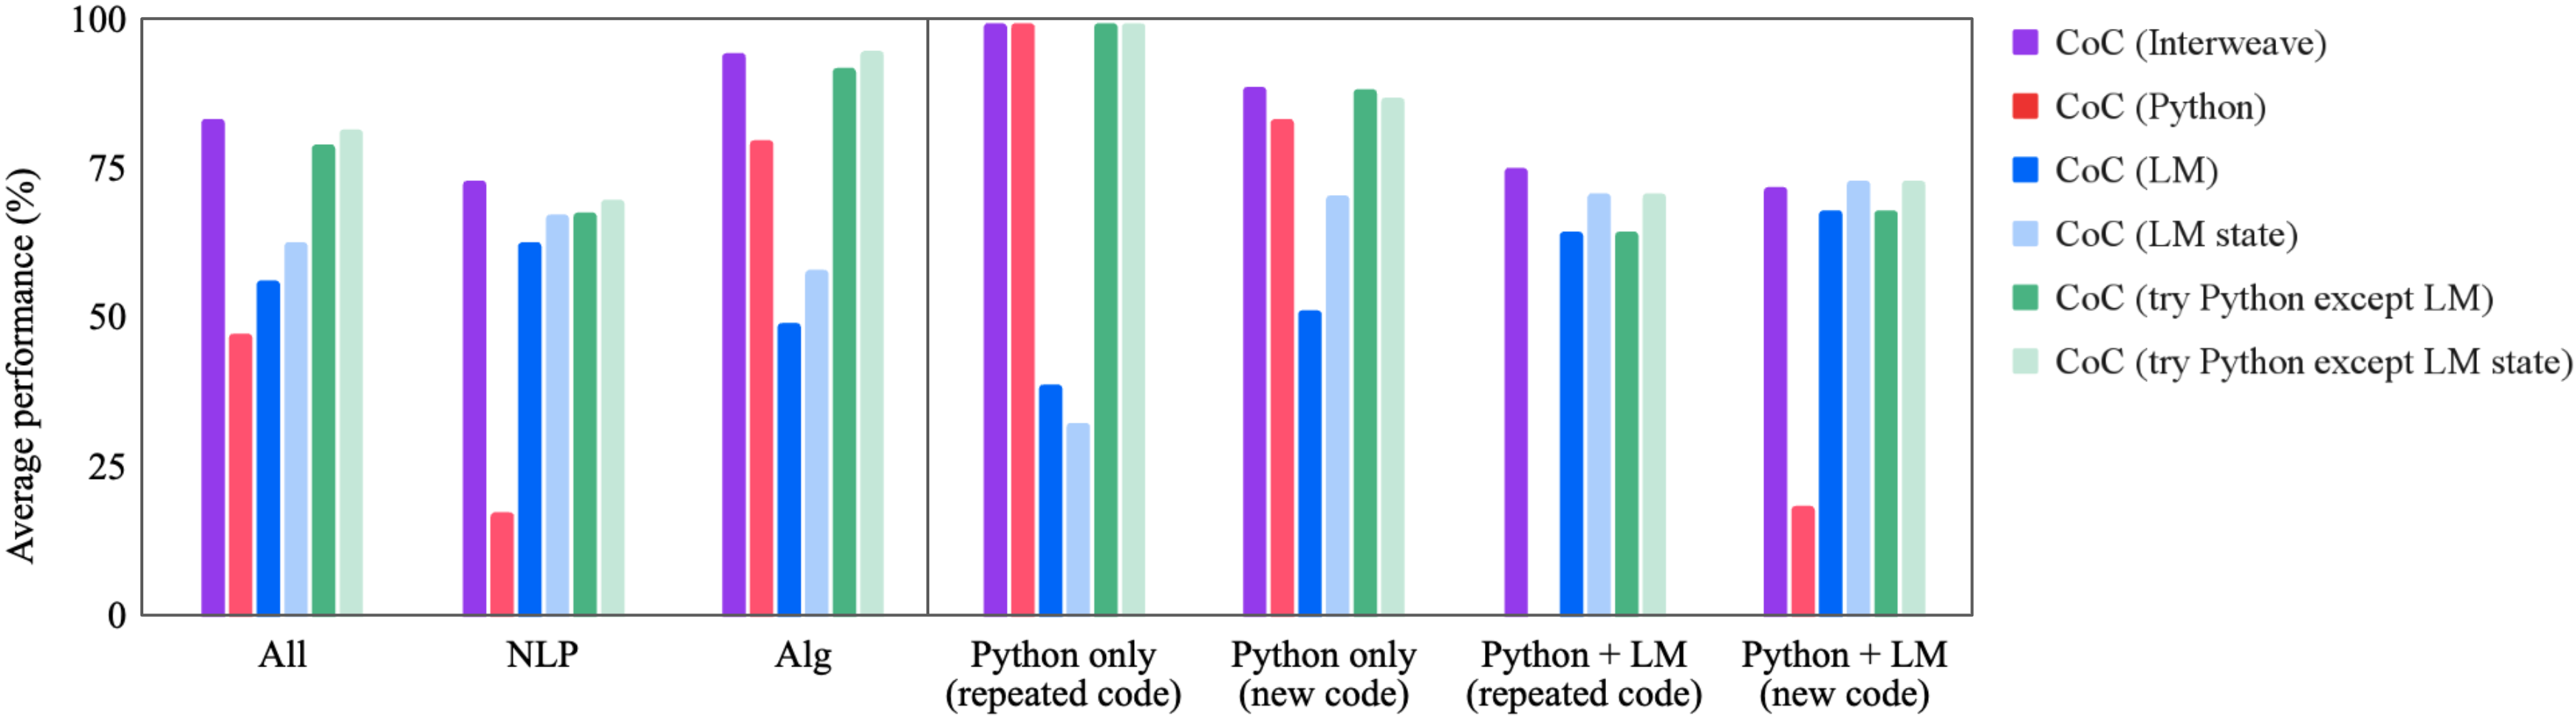
### 3.1 Baselines and Ablations
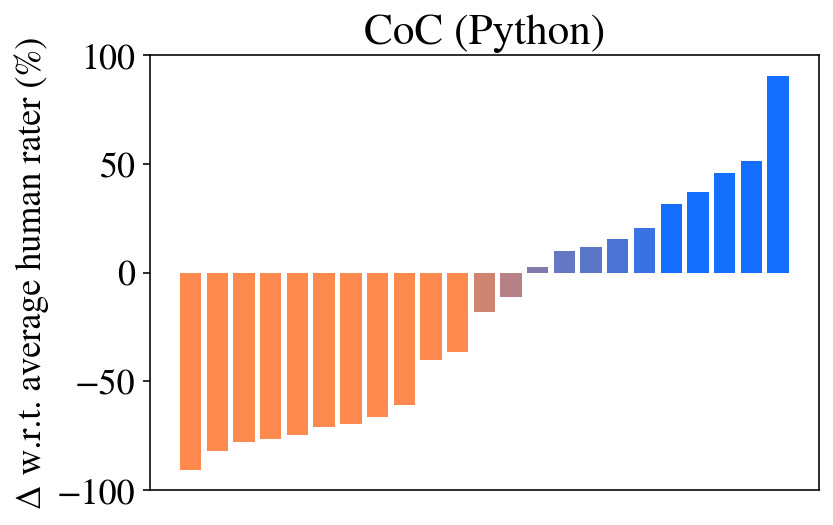
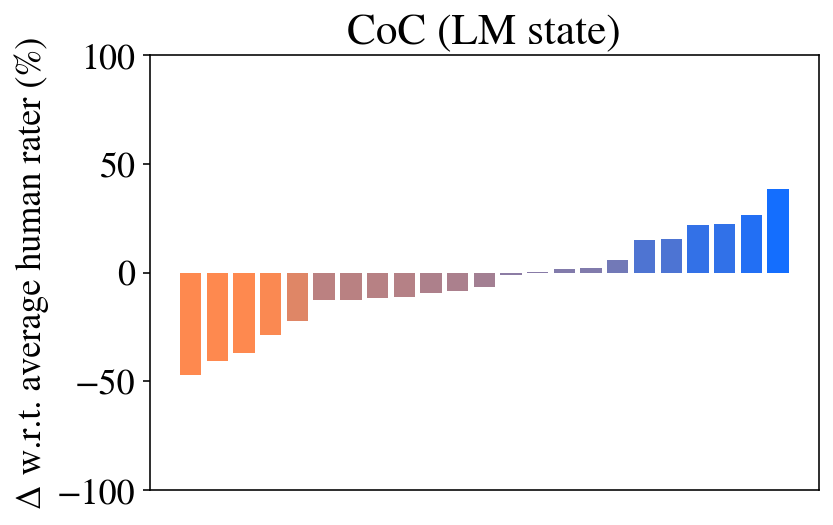
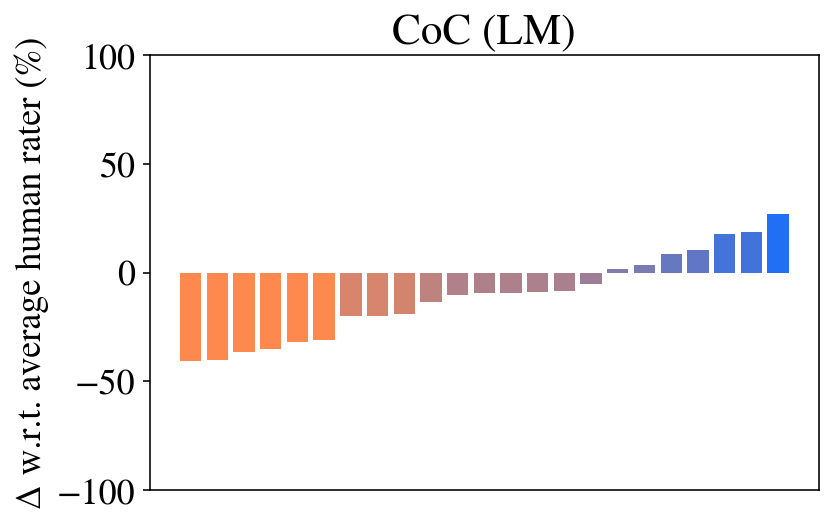
We consider our main method to be CoC (Interweave), also referred to as CoC (Ours), though we also propose two variants with simpler implementation and modestly lower performance: CoC (try Python except LM) and CoC (try Python except LM state). These two variants attempt to run the entire generated code with Python (rather than line by line) and if it fails, simulate the code execution with the LMulator, outputting a final answer or an intermediate state trace, respectively. We also perform the following ablations, some of which are comparable to previous work as noted. In CoC (Python) Python is used to run the entire generated code and if the code is not executable, it is marked as failure – this can be thought of as a comparison to Program of Thoughts (Chen et al., 2022) or Program-aided language models (Gao et al., 2023). We note that in many cases this baseline is particularly challenged, as writing executable code for some of the reasoning problems becomes nearly impossible (e.g., writing code to judge if a phrase is sarcastic), but one may focus on the results for Algorithmic only tasks for a more fair comparison. In CoC (LM) the code is interpreted by an LMulator outputting the final answer, and in CoC (LM state) the code is interpreted by an LMulator outputting a state trace of intermediate steps – this can be thought of as ScratchPad prompting for reasoning (Nye et al., 2021). Note, the last two ablations do not leverage the Python interpreter.
We also compare against the following baselines. In Direct question answering the LM simply responds to the question with a final answer. In Chain of Thought prompting (CoT) the LM uses intermediate steps to solve the task; we use CoT as our standard prompt technique for the field of substep prompting (Kojima et al., 2022; Zhou et al., 2022a) as prompts are readily available.
### 3.2 Tasks
We consider a subset of challenging tasks from BIG-Bench (Srivastava et al., 2022) called BIG-Bench Hard (BBH) (Suzgun et al., 2022) to ensure we are solving the most challenging tasks. These tasks were specifically selected for their difficulty for language models and the datasets provides human-rater baselines and a set of Chain of Thought prompts. The 23 tasks require semantic reasoning (e.g., “Movie Recommendation”), numerical reasoning (e.g., “Multi-Step Arithmetic”), and a combination of both (e.g., “Object Counting”). As such they enable us to study the efficacy of CoC across varied problems, not just those that coding is a natural fit for. Several prompts are shown in Figure A1. We also show results for the grade-school math (GSM8K) benchmark (Cobbe et al., 2021) in Section A.2, although we find that these problems are primarily solved algorithmically alone through code.
These tasks are evaluated with few-shot prompting, whereby three examples from the same problem family are provided as context. We also introduce a new evaluation setting, cross-task prompting, whereby three examples of different problems are provided as context. As such, the language model has in-context examples of the format of reasoning, but isn’t provided explicit instructions on how to reason. We see this as an indicative signal for a general-purpose reasoner, which in many real-world applications (e.g., chatbots) would be asked to reason across a wide variety of tasks.
The models used herein include the OpenAI family of models: text-ada-001, text-baggage-001, text-curie-001, and text-davinci-003 (in plots we denote these as a-1, b-1, c-1, and d-3). We also consider PaLM-2’s code finetuned variant (Chowdhery et al., 2022; Google et al., 2023). For instruction tuned models, we compare to recent variants of GPT (gpt-3.5-turbo and gpt-4) with the chat completion mode run in October 2023 and January 2024. The results below are using the text-davinci-003 model unless otherwise stated.
### 3.3 Results
Question 1: Overall Performance. The overall performance of CoC is shown in Figure 2 and Table 1 (with full results in Table A1). We see that CoC outperforms other approaches, both in the number of tasks it exceeds the human baseline and in the overall amount that it exceeds the baseline. Indeed, CoC’s 84% is SoTA to the best of our knowledge (Gemini Team, 2023). In fact, when combined with gpt-4, CoC achieves 91% (see Table A4). In several tasks CoC vastly outperforms the human baseline and other methods, achieving nearly 100% – generally for these tasks the result is complicated in language but trivial in code (e.g., a task from multi-step arithmetic Q: $((-3+5× 8×-4)-(9-8×-7))=$ ). We also observe that CoT outperforms the human baseline on a number of tasks, while the Direct answer fares poorly.
Table 1: Overall performance (%) on BIG-Bench Hard with both few-shot prompting with a single task and cross-task. The delta compared to direct prompting is shown in parenthesis.
| Prompt | Human | text-davinci-003 Direct | PaLM 2-S* (code variant (Google et al., 2023)) CoT | CoC (Ours) | Direct | CoT | CoC (Ours) |
| --- | --- | --- | --- | --- | --- | --- | --- |
| Single task | 68 | 55 | 72 (+17) | 84 (+29) | 49 | 61 (+12) | 78 (+29) |
| Cross task | - | 50 | 55 (+5) | 61 (+11) | 45 | 47 (+2) | 47 (+2) |
Question 2: Problem Type. Figure 4 breaks the results down by problem type; the task labels are shown in Table A1. First, we isolate problems that are primarily algorithmic or primarily natural language (these categories were identified in (Suzgun et al., 2022)). We see that on algorithmic tasks, CoC performs particularly well, while on natural language tasks CoC performs on par with CoT. This is particularly encouraging, because one may expect these language oriented tasks to be a worse fit for code. The key is that our method offers the flexibility of using a LMulator to simulate the output of code execution, retaining the semantic reasoning capabilities of LMs for natural language problems.
Figure 4 additionally breaks the tasks down into categories that capture how different each question’s response is and whether the code can be fully executed by Python (denoted Python only vs. Python + LM). For some tasks within the benchmark, each question has the same code or Chain of Thought, with the only variation being the inputs – in this case we say the code is (repeated code), and if not then it is denoted (new code). As expected, we see that when the code is repeated and run by Python, CoC gets nearly 100%, though these tasks (e.g., multi-step arithmetic) seem to be among the most challenging for the other baselines, including human raters. The other categories are more challenging for CoC; however in each, we still see a benefit over baselines.
<details>
<summary>extracted/5762267/fig/by_task_type.png Details</summary>
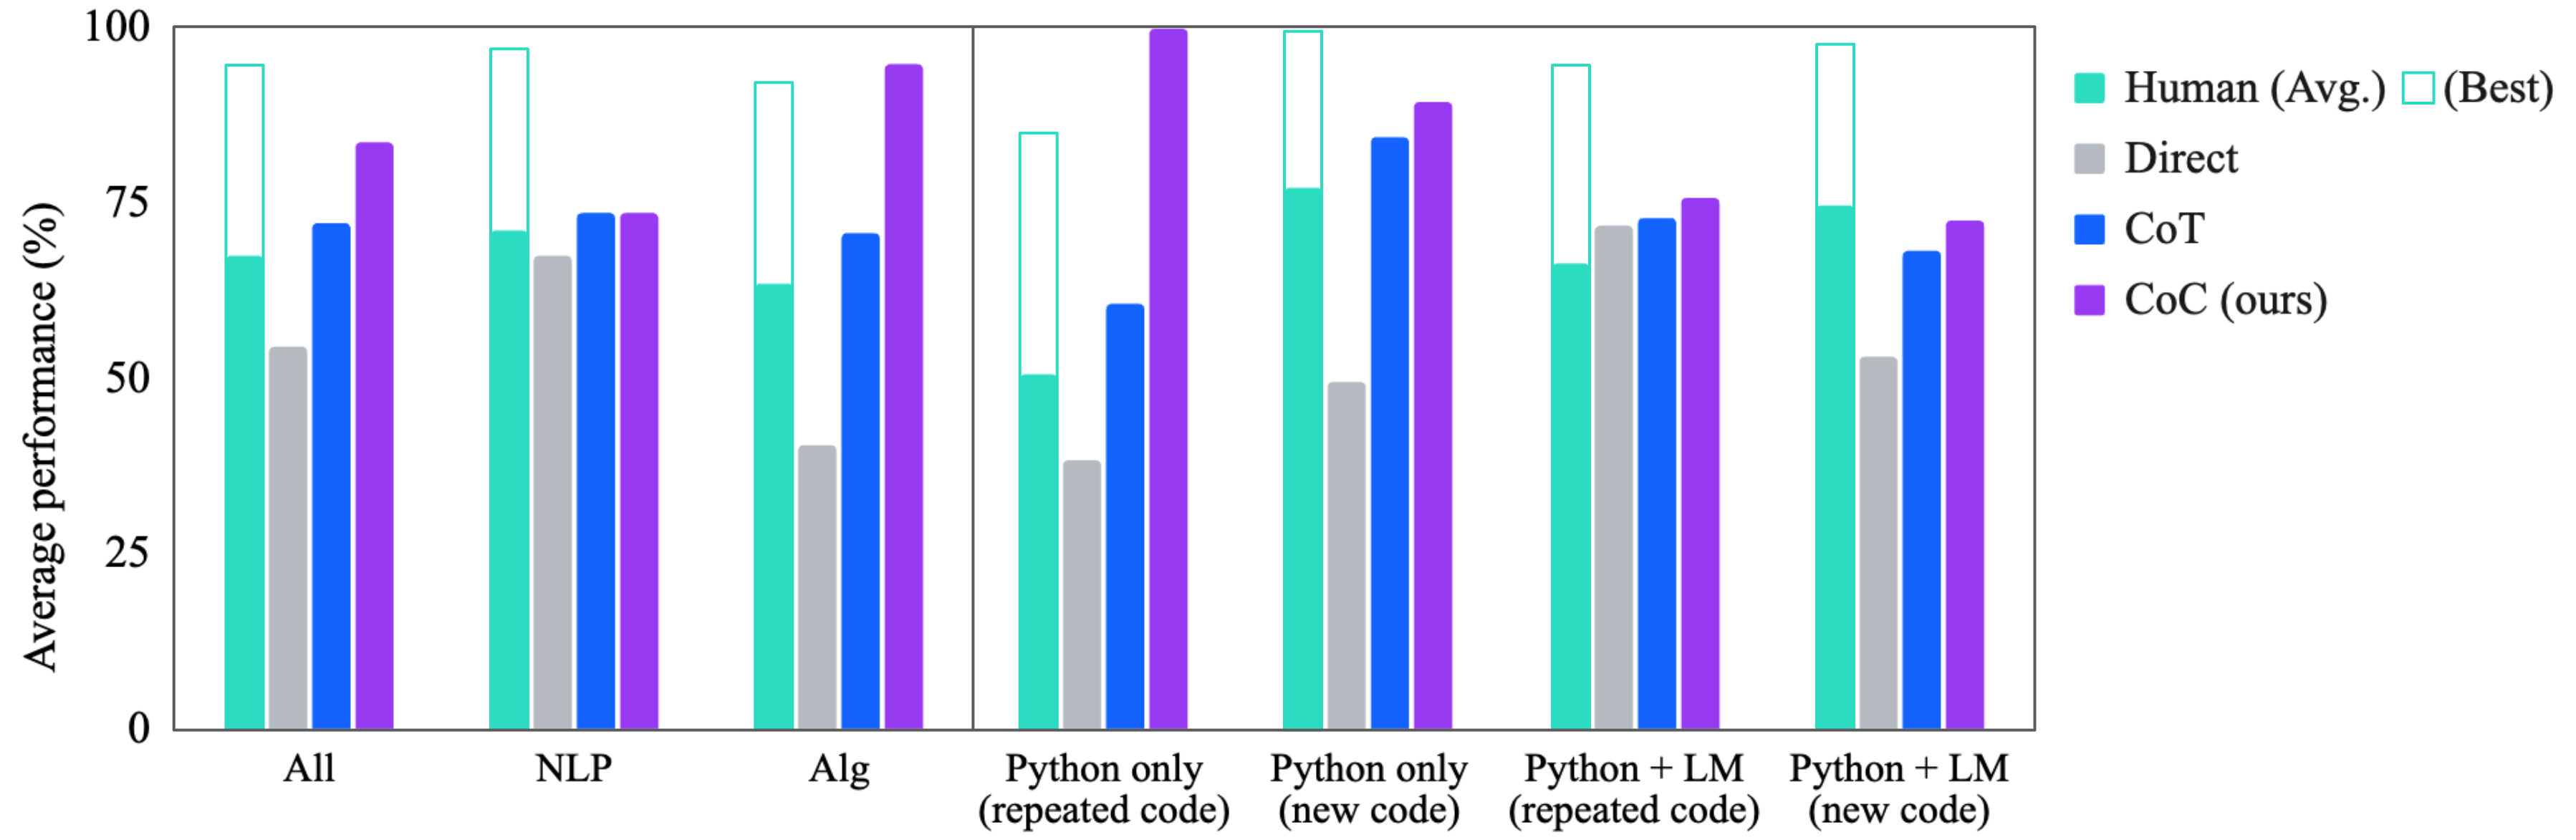
### Visual Description
## Grouped Bar Chart: Performance Comparison Across Task Categories
### Overview
The image displays a grouped bar chart comparing the average performance (in percentage) of five different methods or agents across seven distinct task categories. The chart is divided into two sections by a vertical line, suggesting a grouping of the first three categories versus the latter four. The performance metric is on a scale from 0% to 100%.
### Components/Axes
* **Y-Axis:** Labeled "Average performance (%)". The axis has major tick marks at 0, 25, 50, 75, and 100.
* **X-Axis:** Contains seven categorical labels representing different task domains or conditions:
1. All
2. NLP
3. Alg
4. Python only (repeated code)
5. Python only (new code)
6. Python + LM (repeated code)
7. Python + LM (new code)
* **Legend (Top-Right):** Identifies the five data series by color and label:
* **Teal (Solid):** Human (Avg.)
* **Teal (Outline):** (Best) - This appears to represent the best human performance, shown as an outline bar stacked on top of the solid "Human (Avg.)" bar.
* **Gray:** Direct
* **Blue:** CoT
* **Purple:** CoC (ours)
* **Visual Grouping:** A thin vertical line separates the first three categories ("All", "NLP", "Alg") from the last four ("Python only..." and "Python + LM...").
### Detailed Analysis
Below are the approximate performance values for each method in each category, estimated from the bar heights. Values are approximate (±2-3%).
| Category | Human (Avg.) | Human (Best) | Direct | CoT | CoC (ours) |
| :--- | :--- | :--- | :--- | :--- | :--- |
| **All** | ~68% | ~95% | ~54% | ~72% | ~83% |
| **NLP** | ~72% | ~97% | ~68% | ~74% | ~74% |
| **Alg** | ~63% | ~92% | ~40% | ~71% | ~94% |
| **Python only (repeated code)** | ~50% | ~84% | ~38% | ~60% | ~100% |
| **Python only (new code)** | ~77% | ~100% | ~49% | ~83% | ~88% |
| **Python + LM (repeated code)** | ~66% | ~94% | ~72% | ~73% | ~75% |
| **Python + LM (new code)** | ~74% | ~98% | ~53% | ~67% | ~73% |
**Trend Verification per Series:**
* **Human (Avg.):** Performance varies, dipping lowest in "Python only (repeated code)" (~50%) and peaking in "Python only (new code)" (~77%).
* **Direct:** Generally the lowest-performing method across most categories, with a notable exception in "Python + LM (repeated code)" where it is competitive (~72%).
* **CoT:** Shows moderate to strong performance, often between Direct and CoC. It peaks in "Python only (new code)" (~83%).
* **CoC (ours):** Consistently a top performer. It achieves the highest score in the chart (~100% in "Python only (repeated code)") and is the best or tied for best in 5 of the 7 categories.
### Key Observations
1. **CoC Dominance:** The "CoC (ours)" method demonstrates superior or highly competitive performance across nearly all task categories, particularly excelling in algorithmic ("Alg") and Python-related tasks.
2. **Human Performance Gap:** There is a significant gap between average human performance and the best human performance in most categories, especially in "Alg" and "Python only (repeated code)".
3. **Direct Method Weakness:** The "Direct" method is frequently the weakest performer, except in the "Python + LM (repeated code)" category where it matches or slightly exceeds other AI methods.
4. **Task Sensitivity:** Performance for all methods is highly sensitive to the task category. For example, "Python only (repeated code)" shows the widest performance spread (from ~38% to ~100%), while "NLP" shows a much tighter cluster of results.
5. **Code Novelty Impact:** For "Python only" tasks, performance for most methods is notably higher on "new code" compared to "repeated code," with the exception of CoC, which achieves a perfect score on the repeated code task.
### Interpretation
This chart presents a performance benchmark likely from a research paper introducing the "CoC" method. The data suggests that CoC is a robust and generalizable approach, outperforming both a "Direct" prompting baseline and a "CoT" (Chain-of-Thought) method across a diverse set of challenges encompassing natural language processing, algorithms, and programming (both with and without language model assistance).
The inclusion of human performance (average and best) provides crucial context. While the best human performance sets a high ceiling (often near 100%), the average human performance is frequently surpassed by CoC and sometimes by CoT. This indicates that these AI methods are not just matching but can exceed typical human-level performance on these specific benchmark tasks.
The stark difference in results between "repeated code" and "new code" tasks highlights a key evaluation dimension: the ability to generalize versus memorize. CoC's perfect score on "Python only (repeated code)" might suggest strong pattern recognition or memorization, but its continued strong performance on "new code" tasks demonstrates genuine generalization capability. The chart effectively argues for the efficacy of the proposed CoC method relative to common baselines and human performance.
</details>
Figure 4: Average performance across different baselines grouped by task type, indicating the problem type and how CoC is generated & executed.
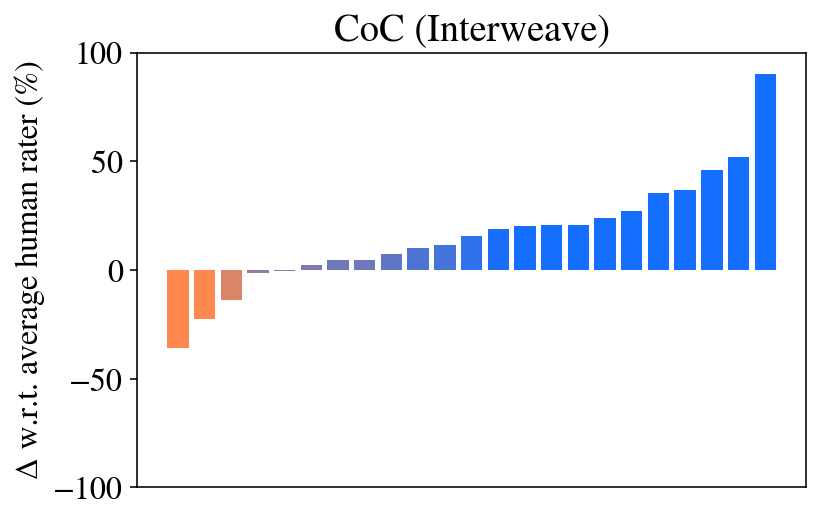
Question 3: Ablations. Figures 5 and 6, and Table 2 show the ablations performed to motivate each aspect of Chain of Code prompting. As one may expect, the approaches that execute Python (CoC (Interweave, Python, try Python except LM, try Python except LM state)) achieve 100% performance on several tasks – if the code is correct, then the model will be correct every time. However, the approach that relies on Python alone (CoC (Python)) performs poorly when applied to non-algorithmic tasks, failing almost all. The CoC (Python) ablation is similar to recent works (Gao et al., 2023; Chen et al., 2022), which show that if applied to numerical problems then code reasoning performs well. CoC without the Python interpreter (CoC (LM, LM state)) too fares poorly, though we see that the step-by-step approach proposed in ScratchPad prompting (Nye et al., 2021) improves in each task.
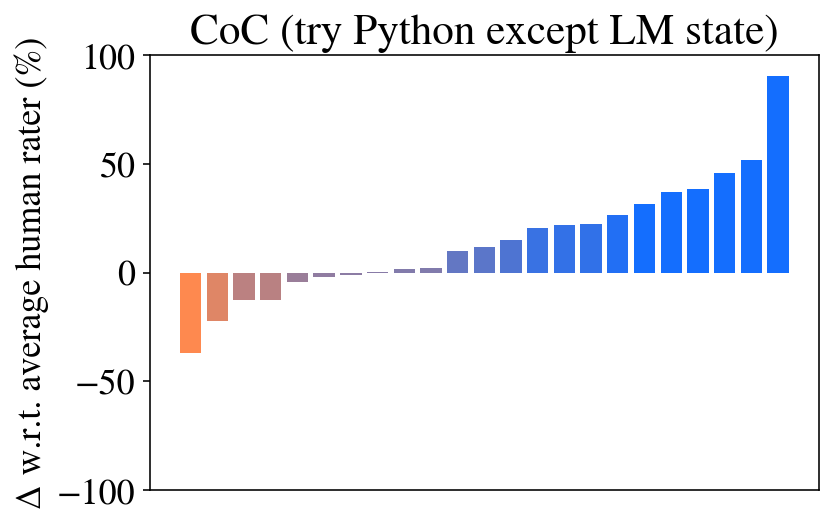
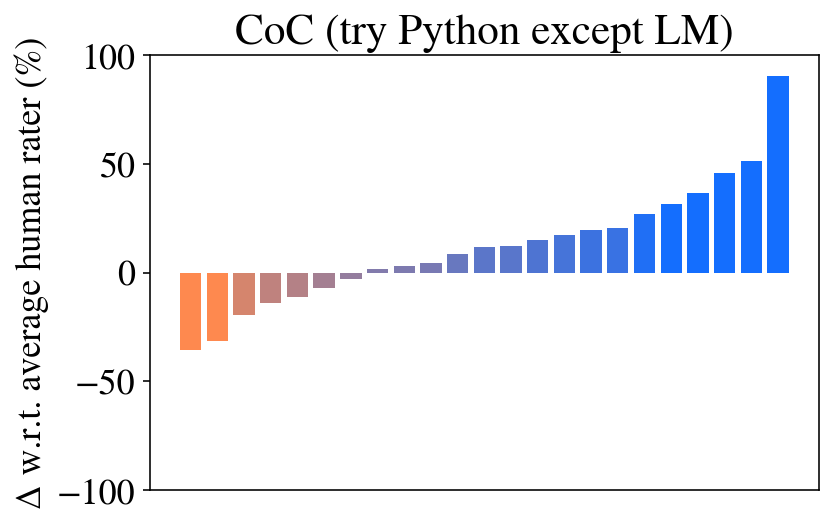
We also show that ablations CoC (try Python except LM, try Python except LM state), in which CoC first tries to run the entire code with Python and if it fails simulates the code with an LM, perform quite well. Again we see that maintaining a program state provides an improvement in performance. With only minor degradations in performance observed, they are reasonable alternatives to the fully interweaved CoC for their simplicity. Though we note, these ablations’ performance would be much worse in cases where interweaving code and semantics is truly necessary – for example, if we imagine a case where code is necessary to parse image inputs or to access an external database, but language is necessary to parse the results (see the robotics applications in Section A.6).
<details>
<summary>extracted/5762267/fig/by_task_type_ablation.png Details</summary>
### Visual Description
## Grouped Bar Chart: Average Performance (%) by Method and Task Category
### Overview
The image displays a grouped bar chart comparing the average performance (in percentage) of six different "CoC" (Chain-of-Code) methods across seven distinct task categories. The chart is divided into two main panels by a vertical line, separating broader task categories (left) from more specific Python-related task categories (right).
### Components/Axes
* **Y-Axis:** Labeled "Average performance (%)". The scale runs from 0 to 100, with major tick marks at 0, 25, 50, 75, and 100.
* **X-Axis:** Contains seven categorical groups. From left to right:
1. All
2. NLP
3. Alg
4. Python only (repeated code)
5. Python only (new code)
6. Python + LM (repeated code)
7. Python + LM (new code)
* **Legend:** Positioned on the right side of the chart. It defines six data series by color:
* Purple square: CoC (Interweave)
* Red square: CoC (Python)
* Blue square: CoC (LM)
* Light Blue square: CoC (LM state)
* Green square: CoC (try Python except LM)
* Light Green square: CoC (try Python except LM state)
### Detailed Analysis
Performance values are approximate, estimated from bar heights relative to the y-axis.
**Left Panel (General Categories):**
* **All:**
* CoC (Interweave) [Purple]: ~85%
* CoC (Python) [Red]: ~48%
* CoC (LM) [Blue]: ~55%
* CoC (LM state) [Light Blue]: ~63%
* CoC (try Python except LM) [Green]: ~79%
* CoC (try Python except LM state) [Light Green]: ~82%
* **NLP:**
* CoC (Interweave) [Purple]: ~74%
* CoC (Python) [Red]: ~18% (notably low)
* CoC (LM) [Blue]: ~63%
* CoC (LM state) [Light Blue]: ~68%
* CoC (try Python except LM) [Green]: ~69%
* CoC (try Python except LM state) [Light Green]: ~71%
* **Alg:**
* CoC (Interweave) [Purple]: ~95%
* CoC (Python) [Red]: ~80%
* CoC (LM) [Blue]: ~49%
* CoC (LM state) [Light Blue]: ~58%
* CoC (try Python except LM) [Green]: ~92%
* CoC (try Python except LM state) [Light Green]: ~96%
**Right Panel (Python-Specific Categories):**
* **Python only (repeated code):**
* CoC (Interweave) [Purple]: ~100%
* CoC (Python) [Red]: ~100%
* CoC (LM) [Blue]: ~39%
* CoC (LM state) [Light Blue]: ~32%
* CoC (try Python except LM) [Green]: ~100%
* CoC (try Python except LM state) [Light Green]: ~100%
* **Python only (new code):**
* CoC (Interweave) [Purple]: ~89%
* CoC (Python) [Red]: ~83%
* CoC (LM) [Blue]: ~51%
* CoC (LM state) [Light Blue]: ~71%
* CoC (try Python except LM) [Green]: ~89%
* CoC (try Python except LM state) [Light Green]: ~88%
* **Python + LM (repeated code):**
* CoC (Interweave) [Purple]: ~75%
* CoC (Python) [Red]: Bar is absent or at 0%.
* CoC (LM) [Blue]: ~64%
* CoC (LM state) [Light Blue]: ~72%
* CoC (try Python except LM) [Green]: ~65%
* CoC (try Python except LM state) [Light Green]: ~72%
* **Python + LM (new code):**
* CoC (Interweave) [Purple]: ~73%
* CoC (Python) [Red]: ~19%
* CoC (LM) [Blue]: ~68%
* CoC (LM state) [Light Blue]: ~74%
* CoC (try Python except LM) [Green]: ~68%
* CoC (try Python except LM state) [Light Green]: ~74%
### Key Observations
1. **Method Dominance:** CoC (Interweave) [Purple] is consistently a top performer across all categories, never dropping below ~73%.
2. **Task-Specific Performance:** CoC (Python) [Red] shows extreme variance. It achieves near-perfect scores (~100%) in "Python only (repeated code)" but performs very poorly in NLP (~18%) and "Python + LM (new code)" (~19%).
3. **Hybrid Method Strength:** The "try Python except LM" methods (Green and Light Green) are strong and consistent performers, often matching or nearly matching the top-performing Interweave method, especially in the "Alg" and "Python only" categories.
4. **LM-Only Weakness:** The pure language model methods, CoC (LM) [Blue] and CoC (LM state) [Light Blue], generally underperform compared to the hybrid and Interweave methods, particularly in the "Python only (repeated code)" category where they score below 40%.
5. **Impact of Code Novelty:** For most methods, performance on "new code" tasks is slightly lower than on "repeated code" tasks within the same category (e.g., Python only). The exception is the pure LM methods, which sometimes show improvement on new code.
6. **Missing Data:** The CoC (Python) [Red] bar is absent for "Python + LM (repeated code)", indicating a score of 0% or that the method was not applicable.
### Interpretation
This chart evaluates different strategies for a "Chain-of-Code" (CoC) prompting or reasoning framework. The data suggests that:
* **Interweaving is Robust:** The "Interweave" strategy appears to be the most robust and generalizable approach, maintaining high performance regardless of the task domain (NLP, Algorithms, Python).
* **Specialization vs. Generalization:** The "CoC (Python)" method is highly specialized. It excels when the task is purely Python code repetition but fails catastrophically when the task involves natural language or requires combining Python with a language model. This indicates it lacks generalization capability.
* **Hybrid Approaches are Effective:** The "try Python except LM" strategies demonstrate the value of a hybrid, fallback approach. They leverage Python execution when possible but can fall back to the language model, achieving performance that rivals the top method in many cases. This suggests a practical and reliable implementation strategy.
* **Pure LM Limitations:** Relying solely on a language model (LM or LM state) yields suboptimal performance compared to methods that incorporate code execution or sophisticated interleaving. This underscores the benefit of augmenting LMs with external tools or structured reasoning steps for these task types.
* **Task Nature Matters:** The dramatic performance swings for some methods highlight that the underlying nature of the task (e.g., algorithmic vs. linguistic, code repetition vs. generation) is a critical factor in selecting the appropriate CoC strategy. There is no single best method for all scenarios, though Interweave comes closest.
</details>
Figure 5: Chain of Code ablations on average performance grouped by task type.
<details>
<summary>extracted/5762267/fig/all_tasks_coc_interweave.png Details</summary>
### Visual Description
## Bar Chart: CoC (Interweave)
### Overview
This is a vertical bar chart titled "CoC (Interweave)". It displays the performance of multiple items (likely models, methods, or test cases) relative to an average human rater. The chart shows a clear progression from negative to positive values, with bars colored in a gradient from orange to blue.
### Components/Axes
* **Title:** "CoC (Interweave)" (located at the top center).
* **Y-Axis:**
* **Label:** "Δ w.r.t. average human rater (%)". This indicates the metric is the percentage change or difference relative to the average human rater's score.
* **Scale:** Linear scale ranging from -100 to 100.
* **Major Ticks:** -100, -50, 0, 50, 100.
* **X-Axis:** No explicit labels or categories are provided for the individual bars. The bars are arranged in a sequence from left to right.
* **Data Series:** A single series of approximately 20 vertical bars.
* **Color Legend:** No separate legend is present. The bar colors themselves form a gradient:
* **Orange:** Used for bars with negative values (below the human rater average).
* **Blue:** Used for bars with positive values (above the human rater average).
* The color transitions smoothly from orange through neutral tones to blue as the values increase.
### Detailed Analysis
The chart presents a sorted sequence of values. Reading from left to right:
1. **Bar 1 (Far Left):** Orange. Value ≈ -35%.
2. **Bar 2:** Orange. Value ≈ -20%.
3. **Bar 3:** Light Orange/Brown. Value ≈ -10%.
4. **Bar 4:** Very light gray/blue. Value ≈ -1% (slightly below zero).
5. **Bar 5:** Light blue. Value ≈ +1% (slightly above zero).
6. **Bar 6:** Light blue. Value ≈ +3%.
7. **Bar 7:** Light blue. Value ≈ +5%.
8. **Bar 8:** Blue. Value ≈ +8%.
9. **Bar 9:** Blue. Value ≈ +10%.
10. **Bar 10:** Blue. Value ≈ +12%.
11. **Bar 11:** Blue. Value ≈ +15%.
12. **Bar 12:** Blue. Value ≈ +18%.
13. **Bar 13:** Blue. Value ≈ +20%.
14. **Bar 14:** Blue. Value ≈ +20% (appears equal to Bar 13).
15. **Bar 15:** Blue. Value ≈ +22%.
16. **Bar 16:** Blue. Value ≈ +25%.
17. **Bar 17:** Blue. Value ≈ +30%.
18. **Bar 18:** Blue. Value ≈ +35%.
19. **Bar 19:** Blue. Value ≈ +45%.
20. **Bar 20:** Blue. Value ≈ +50%.
21. **Bar 21 (Far Right):** Blue. Value ≈ +90%.
**Trend Verification:** The data series shows a consistent, monotonic upward trend from left to right. The slope is gentle in the middle section and becomes very steep for the final few bars on the right.
### Key Observations
1. **Clear Performance Gradient:** The items are sorted by performance, showing a continuous spectrum from significantly below average (-35%) to dramatically above average (+90%).
2. **Color-Value Correlation:** The color gradient is perfectly synchronized with the value, providing an immediate visual cue for performance relative to the benchmark (human rater).
3. **Asymmetric Distribution:** The majority of items (approximately 18 out of 21) perform at or above the human rater average (value ≥ 0). Only the first three to four items are below average.
4. **High-End Outlier:** The rightmost bar is a significant outlier, showing a performance gain (+90%) nearly double that of the next highest bar (+50%).
5. **Missing Context:** The lack of labels on the x-axis means the specific identities of the items being compared are unknown from the chart alone.
### Interpretation
This chart, likely from a research paper or technical report on AI/ML evaluation ("CoC" may stand for "Chain-of-Caption" or a similar metric), demonstrates the results of an "Interweave" method or dataset. The data suggests that the "Interweave" approach enables most tested systems to meet or exceed human-level performance on the measured task.
The **Peircean investigative reading** reveals:
* **Index:** The sorted bars are an index of relative performance.
* **Symbol:** The "Δ w.r.t. average human rater (%)" symbolizes a standardized evaluation framework.
* **Icon:** The color gradient iconically represents the transition from "worse than human" (warm, warning colors) to "better than human" (cool, positive colors).
The most critical insight is the **effectiveness ceiling being broken**. The final bar's extreme value indicates that at least one configuration under the "Interweave" paradigm achieves a transformative improvement, suggesting a potential breakthrough or a highly optimized case. The chart's primary purpose is to visually argue that the presented method generally elevates performance above the human baseline and can, in best-case scenarios, vastly surpass it.
</details>
<details>
<summary>extracted/5762267/fig/all_tasks_coc_try_except_llm_state.png Details</summary>
### Visual Description
## Bar Chart: CoC (try Python except LM state)
### Overview
The image is a vertical bar chart titled "CoC (try Python except LM state)". It displays the percentage change (Δ) in performance relative to an average human rater for a series of unnamed items or conditions. The chart shows a clear progression from negative to positive values, with the final bar showing a substantial positive change.
### Components/Axes
* **Title:** "CoC (try Python except LM state)" - Located at the top center of the chart.
* **Y-Axis:**
* **Label:** "Δ w.r.t. average human rater (%)". This indicates the metric is the percentage change compared to a baseline of an average human rater.
* **Scale:** Linear scale ranging from -100 to 100.
* **Major Tick Marks:** Located at -100, -50, 0, 50, and 100.
* **X-Axis:** No explicit label or category names are provided. It contains a sequence of 20 bars.
* **Data Series:** A single series of 20 vertical bars, colored in a gradient from orange/brown on the left to blue on the right. There is no explicit legend provided within the image frame.
### Detailed Analysis
The chart consists of 20 bars arranged from left to right. Their approximate values, based on visual alignment with the y-axis, are as follows:
1. **Bar 1 (Leftmost, Orange):** Approximately -40%.
2. **Bar 2 (Orange-Brown):** Approximately -25%.
3. **Bar 3 (Brown):** Approximately -15%.
4. **Bar 4 (Brown-Purple):** Approximately -12%.
5. **Bar 5 (Purple):** Approximately -5%.
6. **Bar 6 (Purple):** Approximately -2%.
7. **Bar 7 (Purple):** Approximately -1%.
8. **Bar 8 (Purple):** Approximately 0% (appears as a very thin line at the baseline).
9. **Bar 9 (Purple-Blue):** Approximately +1%.
10. **Bar 10 (Blue-Purple):** Approximately +8%.
11. **Bar 11 (Blue):** Approximately +12%.
12. **Bar 12 (Blue):** Approximately +18%.
13. **Bar 13 (Blue):** Approximately +22%.
14. **Bar 14 (Blue):** Approximately +23%.
15. **Bar 15 (Blue):** Approximately +28%.
16. **Bar 16 (Blue):** Approximately +32%.
17. **Bar 17 (Blue):** Approximately +38%.
18. **Bar 18 (Blue):** Approximately +40%.
19. **Bar 19 (Blue):** Approximately +48%.
20. **Bar 20 (Rightmost, Blue):** Approximately +52%.
21. **Bar 21 (Final, Bright Blue):** Approximately +90%. (Note: There appear to be 21 distinct bars upon closer inspection, with the final one being significantly taller).
**Trend:** The data series exhibits a strong, consistent upward trend from left to right. It begins with negative values (underperformance relative to the human baseline), crosses the zero point around the 8th/9th bar, and then shows increasingly positive values (outperformance), culminating in a final bar that is a clear outlier in magnitude.
### Key Observations
1. **Clear Progression:** There is a monotonic increase in the Δ value across the sequence of bars.
2. **Performance Crossover:** The transition from negative to positive Δ occurs near the center of the chart, indicating a shift from underperforming to outperforming the human rater baseline.
3. **Significant Outlier:** The final bar on the far right shows a Δ of approximately +90%, which is nearly double the value of the second-highest bar (~+52%). This represents a dramatic performance leap.
4. **Color Gradient:** The bar colors transition smoothly from warm tones (orange/brown) for negative values to cool tones (blue) for positive values, visually reinforcing the performance shift.
### Interpretation
This chart likely visualizes the results of an experiment or benchmark comparing different versions, configurations, or methods of an AI system (possibly related to "CoC" - Chain of Code - and Python exception handling) against a human performance baseline.
* **What the data suggests:** The sequence of bars probably represents an ordered list of models, prompts, or techniques. The leftmost items perform worse than the average human rater, while the rightmost items significantly surpass it. The dramatic spike at the end suggests a particular method or model variant that is exceptionally effective for the task measured.
* **How elements relate:** The x-axis order is critical, as it shows a deliberate ranking or progression. The color gradient is not merely aesthetic but encodes the performance direction (negative=warm, positive=cool). The title implies the task involves a programming concept ("try...except" in Python) within a "CoC" framework, and the metric evaluates how well the system's output aligns with or exceeds human judgment.
* **Notable anomalies:** The final bar's height is the most notable anomaly, suggesting a breakthrough or a different class of solution compared to the incremental improvements seen in the preceding bars. The lack of x-axis labels is a significant limitation, preventing identification of which specific methods correspond to which performance level.
</details>
<details>
<summary>extracted/5762267/fig/all_tasks_coc_try_except_llm.png Details</summary>
### Visual Description
## Bar Chart: CoC (try Python except LM)
### Overview
The image is a vertical bar chart titled "CoC (try Python except LM)". It displays the performance difference (delta) of various models or methods relative to an average human rater, expressed as a percentage. The chart shows a clear progression from negative to positive performance values, with bars ordered from left (lowest) to right (highest).
### Components/Axes
* **Title:** "CoC (try Python except LM)" (located at the top center).
* **Y-Axis:**
* **Label:** "Δ w.r.t. average human rater (%)". This indicates the metric is the percentage change or difference compared to a baseline human rater average.
* **Scale:** Linear scale ranging from -100 to 100.
* **Major Tick Marks:** At -100, -50, 0, 50, and 100.
* **X-Axis:** No explicit label or category names are provided. The axis contains 20 discrete bars, each representing a distinct item (likely a model, method, or experimental condition).
* **Legend:** No legend is present in the image. Categories are distinguished solely by bar color and position.
* **Bar Colors:** The bars follow a color gradient:
* **Leftmost bars (positions 1-4):** Orange to light orange.
* **Middle bars (positions 5-10):** Transitioning through brownish/mauve to grayish-purple.
* **Rightmost bars (positions 11-20):** Progressing from light blue to dark blue.
### Detailed Analysis
The chart contains 20 bars. Their approximate values, read from left to right, are as follows. Values are estimated based on the y-axis scale.
| Bar Position (Left to Right) | Approximate Value (Δ %) | Color Description | Visual Trend |
| :--- | :--- | :--- | :--- |
| 1 | -35% | Orange | Starts the series at the lowest point. |
| 2 | -30% | Light Orange | Slightly higher than bar 1. |
| 3 | -20% | Light Orange | Continues upward trend. |
| 4 | -15% | Light Orange | |
| 5 | -10% | Brownish/Mauve | |
| 6 | -8% | Brownish/Mauve | |
| 7 | -5% | Brownish/Mauve | |
| 8 | -2% | Grayish-Purple | Very close to zero. |
| 9 | 0% | Grayish-Purple | Appears to be at the zero line. |
| 10 | +2% | Grayish-Purple | First positive value. |
| 11 | +8% | Light Blue | |
| 12 | +12% | Light Blue | |
| 13 | +15% | Light Blue | |
| 14 | +18% | Light Blue | |
| 15 | +20% | Light Blue | |
| 16 | +25% | Medium Blue | |
| 17 | +30% | Medium Blue | |
| 18 | +38% | Medium Blue | |
| 19 | +48% | Blue | |
| 20 | +90% | Dark Blue | The highest value, showing a dramatic increase. |
**Trend Verification:** The data series exhibits a consistent, monotonic upward trend from left to right. The slope is relatively gentle for the first 18 bars, followed by a sharp, non-linear increase for the final two bars, especially the last one.
### Key Observations
1. **Performance Spectrum:** The chart captures a wide performance spectrum, from significantly below (-35%) to substantially above (+90%) the human rater baseline.
2. **Clustering:** There are three apparent clusters based on color and value:
* A **negative cluster** (bars 1-8, orange to mauve) performing below the human baseline.
* A **near-zero cluster** (bars 8-10, grayish-purple) performing approximately at the human level.
* A **positive cluster** (bars 11-20, blue shades) outperforming the human baseline.
3. **Outlier:** The rightmost bar (position 20, dark blue) is a significant positive outlier, with a value (~+90%) nearly double that of the second-highest bar (~+48%).
4. **Ordering:** The strict left-to-right ordering by value suggests the items on the x-axis have been sorted by this performance metric.
### Interpretation
This chart likely visualizes the results of a benchmarking study ("CoC" possibly standing for "Chain of Code" or a similar evaluation framework) where various AI models or prompting strategies ("try Python except LM" may refer to a specific experimental condition) are tested on a task. Their performance is measured as a percentage difference from the average score of human raters.
The data suggests a clear hierarchy of effectiveness. The majority of methods (the blue bars) outperform humans, with a few achieving dramatic superiority. The presence of methods that perform worse than humans (orange bars) indicates that not all approaches are successful for this task. The sharp spike at the end implies that one particular method or model is exceptionally well-suited to the challenge, representing a potential breakthrough or state-of-the-art result within this evaluation context. The color gradient, while not labeled, visually reinforces this performance continuum from poor (warm colors) to excellent (cool colors).
</details>
<details>
<summary>extracted/5762267/fig/all_tasks_coc_python.png Details</summary>
### Visual Description
## Bar Chart: CoC (Python) - Deviation from Average Human Rater
### Overview
The image is a bar chart titled "CoC (Python)". It displays the percentage deviation (Δ) of various items (likely models, methods, or code samples) from an "average human rater" baseline. The chart shows a sorted distribution, with items performing worse than the human average on the left and those performing better on the right.
### Components/Axes
* **Title:** "CoC (Python)" (Centered at the top).
* **Y-Axis Label:** "Δ w.r.t. average human rater (%)". This indicates the metric is a percentage difference relative to a human benchmark.
* **Y-Axis Scale:** Linear scale ranging from -100 to 100, with major tick marks at -100, -50, 0, 50, and 100.
* **X-Axis:** No explicit label. Represents discrete, unnamed items (e.g., different AI models or code variants). There are 22 bars in total.
* **Legend:** No explicit legend is present. Color is used to encode the sign of the deviation:
* **Orange Bars:** Represent negative deviations (performance worse than the human average).
* **Blue Bars:** Represent positive deviations (performance better than the human average).
* **Brownish/Taupe Bars:** Two bars near the zero line appear in a muted, brownish color, likely indicating values very close to zero.
### Detailed Analysis
The bars are sorted in ascending order from left to right. Below are approximate values for each bar, estimated from the y-axis. The sequence starts with the most negative deviation.
**Left Section (Orange Bars - Negative Deviation):**
1. Bar 1 (Far left): ~ -90%
2. Bar 2: ~ -80%
3. Bar 3: ~ -75%
4. Bar 4: ~ -73%
5. Bar 5: ~ -70%
6. Bar 6: ~ -68%
7. Bar 7: ~ -65%
8. Bar 8: ~ -60%
9. Bar 9: ~ -40%
10. Bar 10: ~ -35%
**Center Section (Brownish Bars - Near Zero):**
11. Bar 11: ~ -15%
12. Bar 12: ~ -10%
**Right Section (Blue Bars - Positive Deviation):**
13. Bar 13: ~ -5% (Very short blue bar, just below zero)
14. Bar 14: ~ +8%
15. Bar 15: ~ +12%
16. Bar 16: ~ +18%
17. Bar 17: ~ +22%
18. Bar 18: ~ +32%
19. Bar 19: ~ +38%
20. Bar 20: ~ +45%
21. Bar 21: ~ +52%
22. Bar 22 (Far right): ~ +90%
**Trend Verification:** The visual trend is a clear, monotonic increase from the most negative value on the far left to the most positive value on the far right. The slope is steepest at the extremes and flattens near the center (zero line).
### Key Observations
1. **Wide Performance Spread:** The performance range is enormous, spanning approximately 180 percentage points (from ~-90% to ~+90%).
2. **Bimodal Distribution:** The data appears roughly bimodal. There is a cluster of items performing significantly worse than humans (left side, ~-90% to -35%) and another cluster performing significantly better (right side, ~+30% to +90%), with fewer items near the human-average baseline.
3. **Extreme Outliers:** The two bars at the far ends (Bar 1 at ~-90% and Bar 22 at ~+90%) are clear outliers, representing the worst and best performers relative to the human benchmark.
4. **Color Coding:** The color shift from orange to brown to blue provides an immediate visual cue for performance relative to the human baseline.
### Interpretation
This chart likely compares the performance of various automated systems (e.g., code completion models, static analysis tools, or AI agents) on a "Code of Conduct" (CoC) or similar evaluation task for Python code, against the consensus score of human raters.
* **What it demonstrates:** The data shows that the evaluated systems exhibit extreme variability. Most systems perform either substantially worse or substantially better than the average human rater, with very few achieving parity. This suggests the task is highly challenging for current automated methods, and performance is not uniformly distributed around the human level.
* **Relationship between elements:** The sorted bar format effectively ranks the systems. The color coding reinforces the performance dichotomy. The absence of item labels on the x-axis suggests the focus is on the overall distribution and range of performance rather than the identity of specific systems in this particular view.
* **Notable implications:** The large number of systems outperforming the human average (10 out of 22 bars are blue and positive) is significant. It indicates that for this specific task and metric, AI systems have surpassed the average human capability. However, the equally large number of systems performing far below human level highlights a lack of robustness or consistency across different approaches. The two near-zero bars represent the rare cases where automated performance closely matches the human average.
</details>
<details>
<summary>extracted/5762267/fig/all_tasks_coc_llm_state.png Details</summary>
### Visual Description
## Bar Chart: CoC (LM state) - Deviation from Average Human Rater
### Overview
The image is a bar chart titled "CoC (LM state)". It displays the percentage deviation (Δ) of various items or conditions relative to an average human rater's score. The chart shows a clear progression from negative deviations on the left to positive deviations on the right, visualized with a color gradient from orange to blue.
### Components/Axes
* **Title:** "CoC (LM state)" - Located at the top center of the chart.
* **Y-Axis:**
* **Label:** "Δ w.r.t. average human rater (%)" - This is a vertical label on the left side. "Δ" (Delta) signifies change or difference, and "w.r.t." means "with respect to".
* **Scale:** The axis ranges from -100 to 100, with major tick marks and numerical labels at -100, -50, 0, 50, and 100.
* **X-Axis:** There are no visible labels, titles, or tick marks on the horizontal axis. Each bar represents a distinct, unlabeled data point or category.
* **Data Series:** A single series of 17 vertical bars. The bars are colored with a gradient:
* The leftmost bars are a solid **orange**.
* The color transitions through muted brownish-purple tones in the middle.
* The rightmost bars are a solid **blue**.
* **Legend:** There is no explicit legend present in the image. The color gradient itself is the primary visual cue for the data's progression.
### Detailed Analysis
The chart contains 17 bars. Their approximate values, reading from left to right, are as follows. (Note: Values are visual estimates with inherent uncertainty).
1. **Bar 1 (Orange):** ~ -48%
2. **Bar 2 (Orange):** ~ -42%
3. **Bar 3 (Orange):** ~ -38%
4. **Bar 4 (Orange):** ~ -28%
5. **Bar 5 (Orange-Brown):** ~ -22%
6. **Bar 6 (Brown):** ~ -12%
7. **Bar 7 (Brown):** ~ -10%
8. **Bar 8 (Brown):** ~ -8%
9. **Bar 9 (Brown):** ~ -6%
10. **Bar 10 (Brown-Purple):** ~ -4%
11. **Bar 11 (Purple):** ~ -1% (Very close to zero, slightly negative)
12. **Bar 12 (Purple):** ~ 0% (Appears to be exactly on the zero line)
13. **Bar 13 (Purple-Blue):** ~ +5%
14. **Bar 14 (Blue):** ~ +15%
15. **Bar 15 (Blue):** ~ +22%
16. **Bar 16 (Blue):** ~ +28%
17. **Bar 17 (Blue):** ~ +40% (The rightmost and tallest positive bar)
**Trend Verification:** The data series exhibits a strong, consistent upward trend. The visual slope of the bar tops moves steadily from the bottom-left quadrant (negative values) to the top-right quadrant (positive values). The color gradient from orange to blue reinforces this directional progression.
### Key Observations
1. **Clear Progression:** The most notable pattern is the monotonic increase in value from the first to the last bar.
2. **Symmetry Around Zero:** The data spans both sides of the zero line, with roughly equal visual weight given to negative and positive deviations. The transition point (zero) occurs near the center of the chart (between bars 11 and 12).
3. **Magnitude of Deviation:** The largest negative deviation is approximately -48%, and the largest positive deviation is approximately +40%. The spread is substantial, indicating significant variance from the human rater baseline.
4. **Missing Context:** The lack of x-axis labels is a critical omission. It is impossible to determine what each bar represents (e.g., different model versions, prompts, tasks, or evaluation criteria).
### Interpretation
This chart likely visualizes the performance of a system or multiple system variants (denoted by "CoC" in an "LM state" – possibly "Chain of Code" for a Language Model) compared to a human benchmark.
* **What the data suggests:** The system's performance is highly variable. Some configurations (left, orange bars) perform significantly worse than the average human rater, while others (right, blue bars) perform significantly better. The smooth gradient suggests an ordered relationship between the items on the x-axis—perhaps a parameter was tuned progressively, or the items are sorted by performance.
* **How elements relate:** The color is directly tied to the value, serving as a redundant but effective visual encoding of the performance spectrum from poor (orange) to good (blue). The title "CoC (LM state)" implies this is a specific snapshot or condition of a broader evaluation.
* **Notable anomalies:** The bar at position 12 sits exactly at 0%, indicating a configuration that matches the average human rater's performance precisely. This could be a key reference point.
* **Underlying meaning:** The chart demonstrates that the "CoC" approach, under the tested "LM state," does not have a uniform effect. Its impact is context-dependent, leading to both substantial regressions and improvements relative to human judgment. The goal of the associated technical work would likely be to understand the factors causing this variance and to consistently achieve the performance seen on the right side of the chart.
</details>
<details>
<summary>extracted/5762267/fig/all_tasks_coc_llm.png Details</summary>
### Visual Description
## Bar Chart: CoC (LM) Performance Relative to Human Raters
### Overview
The image displays a bar chart titled "CoC (LM)". It visualizes the percentage difference (Δ) in performance of various items (likely different models, methods, or conditions) with respect to an average human rater's score. The data is presented as a series of 16 vertical bars arranged from left to right, showing a clear progression from negative to positive values. The bars are colored in a gradient from orange (leftmost, most negative) through brownish-purple (middle) to blue (rightmost, most positive).
### Components/Axes
* **Title:** "CoC (LM)" - Positioned at the top center of the chart area.
* **Y-Axis:**
* **Label:** "Δ w.r.t. average human rater (%)". This is written vertically along the left side of the chart.
* **Scale:** Linear scale ranging from -100 to 100.
* **Major Tick Marks:** Located at -100, -50, 0, 50, and 100.
* **X-Axis:** No explicit label or category names are provided for the individual bars. The bars are evenly spaced along the horizontal axis.
* **Data Series:** A single series of 16 bars. There is no separate legend; the color gradient itself serves as a visual indicator of the value's sign and magnitude.
### Detailed Analysis
The chart shows a monotonic increase in the Δ value from the leftmost bar to the rightmost bar. The bars can be grouped into three color categories based on visual inspection:
1. **Orange Group (Bars 1-8, Leftmost):** All bars in this group have negative values, indicating performance below the human rater average.
* Bar 1 (far left): Approximately -40%.
* Bars 2-8: Values gradually increase (become less negative), ranging from approximately -38% to -20%. The trend is a steady upward slope.
2. **Brownish-Purple Group (Bars 9-12):** These bars represent values near zero, transitioning from slightly negative to slightly positive.
* Bar 9: Approximately -15%.
* Bar 10: Approximately -10%.
* Bar 11: Approximately -5%.
* Bar 12: Approximately -2%.
3. **Blue Group (Bars 13-16, Rightmost):** All bars in this group have positive values, indicating performance above the human rater average.
* Bar 13: Approximately +5%.
* Bar 14: Approximately +10%.
* Bar 15: Approximately +18%.
* Bar 16 (far right): Approximately +25%.
**Trend Verification:** The visual trend for the entire data series is a consistent, near-linear upward slope from left to right. The color transition from orange (negative) to blue (positive) perfectly correlates with this numerical trend.
### Key Observations
1. **Clear Performance Gradient:** There is a smooth and continuous improvement in the measured metric across the 16 items, spanning a total range of approximately 65 percentage points (from ~-40% to ~+25%).
2. **Symmetry Around Zero:** The data is not symmetrically distributed around the zero line (human average). More items (12 out of 16) fall below the human average than above it (4 out of 16). The most negative value (~-40%) is larger in magnitude than the most positive value (~+25%).
3. **Color as Value Encoding:** The color gradient is not merely aesthetic; it is a direct visual encoding of the quantitative value, with warm colors (orange) representing underperformance and cool colors (blue) representing overperformance relative to the human baseline.
### Interpretation
This chart, likely from an AI or machine learning evaluation context ("CoC (LM)" may stand for "Chain of Code (Language Model)"), demonstrates a comparative analysis. The "Δ w.r.t. average human rater (%)" metric suggests the data points represent how much better or worse different system configurations are compared to a human performance benchmark.
The key takeaway is that while the majority of the tested configurations (the orange and brownish-purple bars) perform worse than the average human, a select few (the blue bars) achieve superior performance. The smooth gradient implies that the variable being changed across the x-axis (e.g., model size, training data, inference method) has a predictable and continuous effect on the outcome. The fact that the best-performing item exceeds the human baseline by ~25% is a significant result, indicating a potential breakthrough or highly effective method within the tested set. The absence of x-axis labels prevents identifying the specific factors driving this improvement, but the trend itself is the critical finding.
</details>
Figure 6: Results across all BIG-Bench Hard tasks compared to human baseline (Srivastava et al., 2022). The tasks (x-axis) in each plot are sorted individually by performance. See Table A1 and Figure 5 for a breakdown by task type.
Table 2: Ablation overall performance (%) with both few-shot prompting with a single task and cross-task. The delta compared to the full model (Interweave) is shown in parenthesis.
| Prompt | Chain of Code Interweave | try Python-except LM state | try Python-except LM | Python | LM state | LM |
| --- | --- | --- | --- | --- | --- | --- |
| Single task | 84 | 82 (-2) | 80 (-4) | 48 (-36) | 63 (-21) | 57 (-27) |
| Cross task | 61 | 57 (-4) | 60 (-1) | 35 (-26) | 49 (-12) | 50 (-11) |
Question 4: Scaling. Figure 7 shows the performance of CoC across various model sizes. We observe that, similar to Chain of Thought prompting, the improvements of CoC increases as model size increases. In fact, for some of the algorithmic tasks, Chain of Code even outperforms the best human raters (whom admittedly did not have access to code). Unlike Chain of Thought prompting, however, which only brings performance benefits for the largest model (d-3), CoC outperforms the direct question answering baseline also for smaller models (a-1, b-1, c-1), suggesting that it’s easier for smaller models to output structured code as intermediate steps rather than natural languages.
Question 5: Cross-task Prompting. For cross-task prompting, we prompt the language models with a few examples from different problems. We see the performance drops for all methods in Figure 7 and Table 1. Despite this drop, CoC outperforms CoT and direct prompting at scale, nearly achieving human average performance. This is a promising indication towards general purpose reasoning, in which a model does not expect to receive examples of similar problems in its prompt.
<details>
<summary>extracted/5762267/fig/by_size_all.png Details</summary>
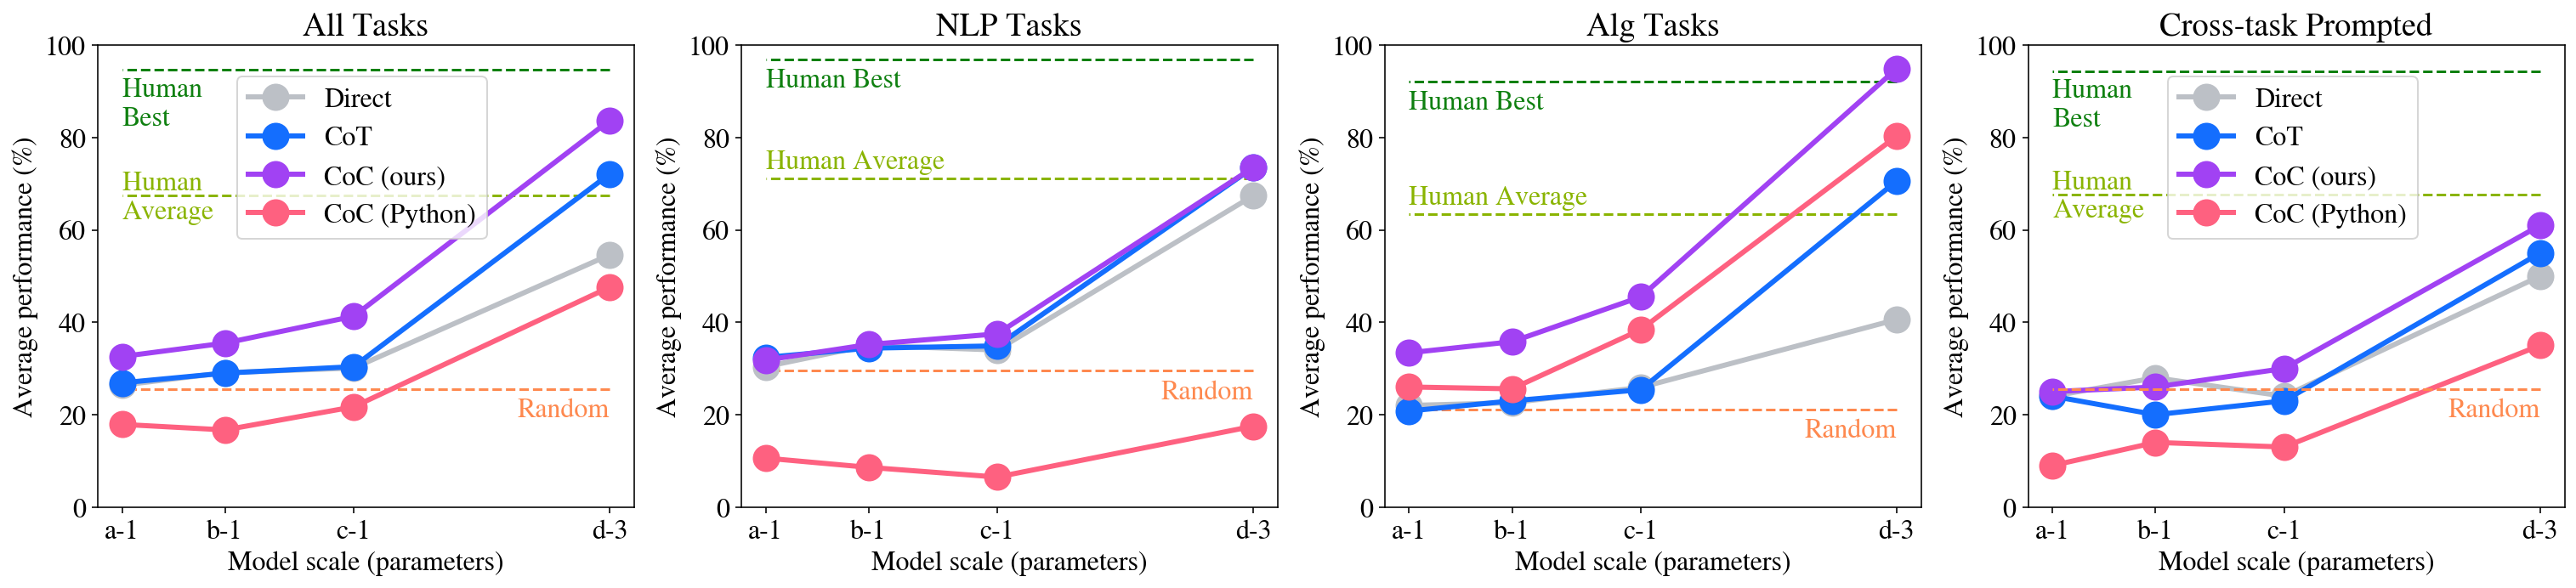
### Visual Description
## Line Charts: Performance vs. Model Scale Across Task Categories
### Overview
The image contains four separate line charts arranged horizontally. Each chart plots the "Average performance (%)" of different AI prompting methods against increasing "Model scale (parameters)". The charts are categorized by task type: "All Tasks", "NLP Tasks", "Alg Tasks", and "Cross-task Prompted". Each chart includes four data series representing different prompting strategies and three horizontal reference lines for human and random performance benchmarks.
### Components/Axes
* **Chart Titles (Top Center):** "All Tasks", "NLP Tasks", "Alg Tasks", "Cross-task Prompted".
* **Y-Axis (Left Side):** Labeled "Average performance (%)". Scale runs from 0 to 100 in increments of 20.
* **X-Axis (Bottom):** Labeled "Model scale (parameters)". Four categorical points are marked: `a-1`, `b-1`, `c-1`, `d-3` (presumably representing increasing model sizes).
* **Legend (Top-Left of each chart):**
* **Direct:** Gray line with circle markers.
* **CoT:** Blue line with circle markers.
* **CoC (ours):** Purple line with circle markers.
* **CoC (Python):** Red line with circle markers.
* **Horizontal Reference Lines (Dashed):**
* **Human Best:** Green dashed line, positioned near the top of the y-axis (~95%).
* **Human Average:** Yellow-green dashed line, positioned around 70%.
* **Random:** Orange dashed line, positioned around 25%.
### Detailed Analysis
#### Chart 1: All Tasks
* **Trend Verification:** All four methods show an upward trend as model scale increases. The slope is gentle from `a-1` to `c-1` and becomes significantly steeper from `c-1` to `d-3`.
* **Data Points (Approximate %):**
* **Direct (Gray):** `a-1`: ~30, `b-1`: ~30, `c-1`: ~30, `d-3`: ~55.
* **CoT (Blue):** `a-1`: ~28, `b-1`: ~30, `c-1`: ~31, `d-3`: ~72.
* **CoC (ours) (Purple):** `a-1`: ~33, `b-1`: ~36, `c-1`: ~41, `d-3`: ~84.
* **CoC (Python) (Red):** `a-1`: ~18, `b-1`: ~17, `c-1`: ~22, `d-3`: ~48.
* **Reference Lines:** Human Best ~95%, Human Average ~70%, Random ~25%.
#### Chart 2: NLP Tasks
* **Trend Verification:** Direct, CoT, and CoC (ours) show a moderate upward trend from `a-1` to `c-1`, followed by a very sharp increase to `d-3`. CoC (Python) shows a slight downward trend initially, then a modest increase.
* **Data Points (Approximate %):**
* **Direct (Gray):** `a-1`: ~32, `b-1`: ~35, `c-1`: ~38, `d-3`: ~68.
* **CoT (Blue):** `a-1`: ~32, `b-1`: ~35, `c-1`: ~35, `d-3`: ~74.
* **CoC (ours) (Purple):** `a-1`: ~32, `b-1`: ~36, `c-1`: ~38, `d-3`: ~74.
* **CoC (Python) (Red):** `a-1`: ~11, `b-1`: ~9, `c-1`: ~7, `d-3`: ~18.
* **Reference Lines:** Human Best ~97%, Human Average ~72%, Random ~30%.
#### Chart 3: Alg Tasks
* **Trend Verification:** All methods show an upward trend. CoC (ours) and CoC (Python) have the steepest slopes, especially from `c-1` to `d-3`. Direct has the shallowest slope.
* **Data Points (Approximate %):**
* **Direct (Gray):** `a-1`: ~21, `b-1`: ~23, `c-1`: ~26, `d-3`: ~41.
* **CoT (Blue):** `a-1`: ~21, `b-1`: ~23, `c-1`: ~26, `d-3`: ~71.
* **CoC (ours) (Purple):** `a-1`: ~34, `b-1`: ~36, `c-1`: ~46, `d-3`: ~95.
* **CoC (Python) (Red):** `a-1`: ~26, `b-1`: ~26, `c-1`: ~39, `d-3`: ~81.
* **Reference Lines:** Human Best ~92%, Human Average ~63%, Random ~21%.
#### Chart 4: Cross-task Prompted
* **Trend Verification:** Direct, CoT, and CoC (ours) show a relatively flat or slightly increasing trend from `a-1` to `c-1`, followed by a sharp increase to `d-3`. CoC (Python) shows a slight dip at `b-1` and `c-1` before rising.
* **Data Points (Approximate %):**
* **Direct (Gray):** `a-1`: ~24, `b-1`: ~28, `c-1`: ~25, `d-3`: ~50.
* **CoT (Blue):** `a-1`: ~24, `b-1`: ~20, `c-1`: ~23, `d-3`: ~55.
* **CoC (ours) (Purple):** `a-1`: ~25, `b-1`: ~27, `c-1`: ~30, `d-3`: ~61.
* **CoC (Python) (Red):** `a-1`: ~9, `b-1`: ~14, `c-1`: ~13, `d-3`: ~35.
* **Reference Lines:** Human Best ~95%, Human Average ~68%, Random ~25%.
### Key Observations
1. **Scale is Critical:** Performance for most methods, especially CoC (ours) and CoT, improves dramatically at the largest model scale (`d-3`), often surpassing Human Average.
2. **Method Hierarchy:** CoC (ours) consistently outperforms or matches CoT and Direct across all task categories and scales. CoC (Python) generally underperforms the other methods, except in "Alg Tasks" at the largest scale.
3. **Task-Specific Performance:** The "Alg Tasks" chart shows the highest peak performance, with CoC (ours) nearly reaching Human Best at `d-3`. "NLP Tasks" shows the closest clustering of Direct, CoT, and CoC (ours) at the largest scale.
4. **Human Benchmarks:** The "Human Best" line is a high bar (~92-97%) that is only approached by one method (CoC (ours)) in one category (Alg Tasks). "Human Average" (~63-72%) is a more commonly exceeded benchmark at the largest scale.
5. **Random Baseline:** The "Random" line (~21-30%) serves as a low-performance floor. All methods at scale `a-1` perform near or slightly above this baseline, with CoC (Python) often at or below it in smaller scales for NLP and Cross-task.
### Interpretation
The data demonstrates a clear scaling law for the evaluated prompting methods: larger models yield significantly better performance. The proposed method, "CoC (ours)", shows a superior scaling trajectory compared to standard Chain-of-Thought (CoT) and Direct prompting, suggesting it is more effective at leveraging increased model capacity.
The stark difference between "CoC (ours)" and "CoC (Python)" indicates that the specific implementation or formulation of the Chain-of-Code method is crucial; the "ours" variant is far more effective. The exceptional performance in "Alg Tasks" suggests the CoC approach is particularly well-suited for algorithmic or logical reasoning problems, where it nearly matches human expert performance at the largest scale.
The charts collectively argue that to achieve human-competitive performance on these diverse tasks, both a large-scale model and an advanced prompting strategy like CoC (ours) are necessary. The "Cross-task Prompted" results, which are generally lower, may indicate that generalizing across different task types with a single prompt is more challenging than performing well within a specific domain like NLP or Algorithms.
</details>
Figure 7: Average performance with model scaling, from text-ada-001 (smallest) to text-davinci-003 (largest).
Question 6: Instruction Tuned Models. The reason why we chose text-davinci-003, a completion model, as our primary evaluation model, over more advanced instruction tuned models (gpt-3.5-turbo and gpt-4) is that the former is more amenable to few-shot prompting with examples, which is the main evaluation paradigm for BIG-Bench Hard. However, we still made our best attempt to evaluate our method with the instruction tuned models using two different setups. The first is zero-shot prompting, where we directly prompt the models via the system message to output direct answers, chain of thoughts, or pseudocode/code (which we optionally execute with the python interpreter and feed back the results). The second is few-shot prompting, where we coerce the models to behave like completion models via the system message, and feed the few-shot examples as usual. In both cases, we demonstrated that CoC brings noticeable benefits with little modification needed. See Sec. A.4 for more details.
Question 7: Robustness of Chain of Code We showed that CoC is generally robust against prompt variation by evaluating with different prompts independently written by three annotators on the same set of problems. Specifically, we select four representative tasks from BIG-Bench Hard that require generation of new code (as opposed to repeated code). While the performance of individual tasks has some variance, the average performance across the four tasks only vary within a few percentage points. See Sec. A.5 for more details.
Question 8: Beyond Language Reasoning We showed that CoC is well-suited for tasks that require both semantic and algorithmic reasoning beyond language reasoning, such as robotics. The unique advantage of CoC in robotics is that it interact seamlessly with the robot perception and control APIs via python code such as running object detectors or invoking parameterized robot skills, while performing semantic subtasks in an “inline” fashion (e.g. classifying what trash is compostable before picking them). When equipped with the necessary robot APIs, and a single example in the prompt to teach LMs the format, CoC can solve seven different robot manipulation tasks in the real world, showcasing generalization to new objects, languages and task domains. See Sec. A.6 for more details.
## 4 Related Work
Language Model Reasoning The abilities and applications of language models have seen significant progress, due to their overall performance (Chowdhery et al., 2022; Touvron et al., 2023; Radford et al., 2019; Gemini Team, 2023) and emergent capabilities (Wei et al., 2022a), such as few-shot prompting (Brown et al., 2020) and abstract reasoning (Wei et al., 2022b). Perhaps most related to this work, a number of works have leveraged prompting to improve reasoning (Dohan et al., 2022): Chain of Thought (Wei et al., 2022b) proposes to break a task down into intermediate reasoning steps, least-to-most (Zhou et al., 2022a) proposes a series of increasingly simpler problems, and ScratchPad (Nye et al., 2021) proposes to maintain a trace of intermediate results for interpreting code (this first demonstrated the code simulation ability of LMs required for our LMulator). Along these lines “let’s think step by step” (Kojima et al., 2022) uses a few key words to elicit such break downs (words that were later refined to “Take a deep breath and work on this problem step-by-step” in (Yang et al., 2023)). Beyond these, other approaches structure such step-by-step solutions into graphical structures (Yao et al., 2023; Besta et al., 2023), plans (Wang et al., 2023b; Ning et al., 2023), or mixture of expert-based sampling (Wang et al., 2022; Zhou et al., 2022b). CoC builds upon the intuition of these works, with the observation that code is a formal, structured approach to breaking a problem down into sub-steps with many advantages beyond natural language alone.
Language Model Tool Use Many recent works have proposed techniques for language models to use tools to respond to queries (Mialon et al., 2023). These tools have often been provided to the language model through prompting (Cobbe et al., 2021; Khot et al., 2022; Chowdhery et al., 2022; Drori et al., 2022; Yao et al., 2022), enabling tools like calculators for math problems, code interpreters, databases, or more. These tools too can provide feedback on novel modalities (Surís et al., 2023; Zeng et al., 2022). To expand the range of tools available, others have used external tool databases or finetuned language models (Schick et al., 2023; Qin et al., 2023; Parisi et al., 2022; Paranjape et al., 2023). As tool interfaces vary, feedback from the tool too can improve performance (Gou et al., 2023; Zhou et al., 2023). In this work we leverage the expressibility and generality of full code as well as its structure, by treating it both as a tool and as a framework.
Language Model Program Synthesis The ability of language models to code is well known and they have been applied as programming assistants (Chen et al., 2021) and shown to be capable programmers on their own (Austin et al., 2021; Li et al., 2022; Nijkamp et al., 2022). This ability has been applied to a variety of tasks outside of language alone, leveraging their ability to reason through code in new settings, such as robotics (Liang et al., 2023; Singh et al., 2023), embodied agents (Wang et al., 2023a), or vision (Surís et al., 2023). Others have specifically done so for reasoning, such as Program of Thoughts (Chen et al., 2022) and Program-aided Language Models (Gao et al., 2023), which generate code to solve numerical reasoning problems. Herein, we focus on the interplay between writing code, running code, and language models simulating code, thus enabling new regimes of language model code applications, such as semantic reasoning.
## 5 Conclusions, Limitations, and Future Work
We have proposed Chain of Code, an approach towards reasoning with language models through writing code, and executing code either with an interpreter or with a language model that simulates the execution (termed herein an LMulator) if the code is not executable. As such, CoC can leverage both the expressive structure of code and the powerful tools available to it. Beyond this, by simulating the execution of non-executable code, CoC can apply to problems nominally outside the scope of code (e.g., semantic reasoning problems). We have demonstrated that this approach outperforms baselines, and for some tasks even the best human raters, in a range of challenging language and numeric reasoning problems.
This work is not without its limitations. First, generating and executing in two steps as well as interweaving code and language execution requires additional context length and computation time. Second, though we have not seen any loss of performance for semantic tasks in aggregate, there are few tasks in which code doesn’t help, e.g., the task Ruin Names, which asks whether an edit for a name is humorous. Finally, our implementation to interweave LM and code is quite simple, tracking the program state in strings and parsing the strings into Python’s built-in data types (e.g., dict, tuple). As our method stands now, the LM cannot modify custom Python objects while simulating code execution. In theory, however, it is doable as long as each of these Python objects have a serialization and deserialization method, e.g., using techniques like Protocol Buffers.
There are many avenues for future work with CoC. First, we believe that a unified code and language interpreter well combines the commonsense of language models with the analytical abilities, structure, and interpretability of code. Such a technology can thus enable applications of code and code-like reasoning to novel problem regimes, beyond simple reasoning. Second, we are interested in investigating the degree to which finetuning a language model to be an LMulator can benefit semantic code reasoning. Third, we see evidence that reasoning through many pathways yields improvements, which is a promising step forward. Finally, we believe this integration with code enables access to external modalities, such as vision or databases, and represents a interesting path for new applications (e.g., robotics, augmented reality).
## Impact Statement
This paper presents work whose goal is to advance the field of Machine Learning. There are many potential societal consequences of our work, most of which are related to the usage of large language models (LLMs). One aspect of Chain of Code that warrants further discussion is that CoC executes the output of LLMs using the Python interpreter as if they are always benign code. If deployed in the wild, however, Chain of Code will need to install additional safeguards against potentially harmful code from LLMs that might be maliciously prompted, before running the code.
## References
- Austin et al. (2021) Austin, J., Odena, A., Nye, M., Bosma, M., Michalewski, H., Dohan, D., Jiang, E., Cai, C., Terry, M., Le, Q., et al. Program synthesis with large language models. arXiv preprint arXiv:2108.07732, 2021.
- Besta et al. (2023) Besta, M., Blach, N., Kubicek, A., Gerstenberger, R., Gianinazzi, L., Gajda, J., Lehmann, T., Podstawski, M., Niewiadomski, H., Nyczyk, P., et al. Graph of thoughts: Solving elaborate problems with large language models. arXiv preprint arXiv:2308.09687, 2023.
- Brown et al. (2020) Brown, T., Mann, B., Ryder, N., Subbiah, M., Kaplan, J. D., Dhariwal, P., Neelakantan, A., Shyam, P., Sastry, G., Askell, A., et al. Language models are few-shot learners. Advances in neural information processing systems, 33:1877–1901, 2020.
- Chen et al. (2021) Chen, M., Tworek, J., Jun, H., Yuan, Q., Pinto, H. P. d. O., Kaplan, J., Edwards, H., Burda, Y., Joseph, N., Brockman, G., et al. Evaluating large language models trained on code. arXiv preprint arXiv:2107.03374, 2021.
- Chen et al. (2022) Chen, W., Ma, X., Wang, X., and Cohen, W. W. Program of thoughts prompting: Disentangling computation from reasoning for numerical reasoning tasks. arXiv preprint arXiv:2211.12588, 2022.
- Chowdhery et al. (2022) Chowdhery, A., Narang, S., Devlin, J., Bosma, M., Mishra, G., Roberts, A., Barham, P., Chung, H. W., Sutton, C., Gehrmann, S., et al. Palm: Scaling language modeling with pathways. arXiv preprint arXiv:2204.02311, 2022.
- Cobbe et al. (2021) Cobbe, K., Kosaraju, V., Bavarian, M., Chen, M., Jun, H., Kaiser, L., Plappert, M., Tworek, J., Hilton, J., Nakano, R., et al. Training verifiers to solve math word problems. arXiv preprint arXiv:2110.14168, 2021.
- Dohan et al. (2022) Dohan, D., Xu, W., Lewkowycz, A., Austin, J., Bieber, D., Lopes, R. G., Wu, Y., Michalewski, H., Saurous, R. A., Sohl-Dickstein, J., et al. Language model cascades. arXiv preprint arXiv:2207.10342, 2022.
- Drori et al. (2022) Drori, I., Zhang, S., Shuttleworth, R., Tang, L., Lu, A., Ke, E., Liu, K., Chen, L., Tran, S., Cheng, N., et al. A neural network solves, explains, and generates university math problems by program synthesis and few-shot learning at human level. Proceedings of the National Academy of Sciences, 119(32):e2123433119, 2022.
- Gao et al. (2023) Gao, L., Madaan, A., Zhou, S., Alon, U., Liu, P., Yang, Y., Callan, J., and Neubig, G. Pal: Program-aided language models. In International Conference on Machine Learning, pp. 10764–10799. PMLR, 2023.
- Gemini Team (2023) Gemini Team, G. Gemini: A family of highly capable multimodal models. Technical report, Google, 2023. URL https://storage.googleapis.com/deepmind-media/gemini/gemini_1_report.pdf.
- Google et al. (2023) Google, Anil, R., Dai, A. M., Firat, O., Johnson, M., Lepikhin, D., Passos, A., Shakeri, S., Taropa, E., Bailey, P., Chen, Z., et al. Palm 2 technical report. arXiv preprint arXiv:2305.10403, 2023.
- Gou et al. (2023) Gou, Z., Shao, Z., Gong, Y., Shen, Y., Yang, Y., Duan, N., and Chen, W. Critic: Large language models can self-correct with tool-interactive critiquing. arXiv preprint arXiv:2305.11738, 2023.
- Khot et al. (2022) Khot, T., Trivedi, H., Finlayson, M., Fu, Y., Richardson, K., Clark, P., and Sabharwal, A. Decomposed prompting: A modular approach for solving complex tasks. arXiv preprint arXiv:2210.02406, 2022.
- Kirillov et al. (2023) Kirillov, A., Mintun, E., Ravi, N., Mao, H., Rolland, C., Gustafson, L., Xiao, T., Whitehead, S., Berg, A. C., Lo, W.-Y., Dollár, P., and Girshick, R. Segment anything. arXiv:2304.02643, 2023.
- Kojima et al. (2022) Kojima, T., Gu, S. S., Reid, M., Matsuo, Y., and Iwasawa, Y. Large language models are zero-shot reasoners. Advances in neural information processing systems, 35:22199–22213, 2022.
- Lewkowycz et al. (2022) Lewkowycz, A., Andreassen, A., Dohan, D., Dyer, E., Michalewski, H., Ramasesh, V., Slone, A., Anil, C., Schlag, I., Gutman-Solo, T., et al. Solving quantitative reasoning problems with language models, 2022. arXiv preprint arXiv:2206.14858, 2022. URL https://arxiv.org/abs/2206.14858.
- Li et al. (2022) Li, Y., Choi, D., Chung, J., Kushman, N., Schrittwieser, J., Leblond, R., Eccles, T., Keeling, J., Gimeno, F., Dal Lago, A., et al. Competition-level code generation with alphacode. Science, 378(6624):1092–1097, 2022.
- Liang et al. (2023) Liang, J., Huang, W., Xia, F., Xu, P., Hausman, K., Ichter, B., Florence, P., and Zeng, A. Code as policies: Language model programs for embodied control. In 2023 IEEE International Conference on Robotics and Automation (ICRA), pp. 9493–9500. IEEE, 2023.
- Liu et al. (2023) Liu, S., Zeng, Z., Ren, T., Li, F., Zhang, H., Yang, J., Li, C., Yang, J., Su, H., Zhu, J., et al. Grounding dino: Marrying dino with grounded pre-training for open-set object detection. arXiv preprint arXiv:2303.05499, 2023.
- Mialon et al. (2023) Mialon, G., Dessì, R., Lomeli, M., Nalmpantis, C., Pasunuru, R., Raileanu, R., Rozière, B., Schick, T., Dwivedi-Yu, J., Celikyilmaz, A., et al. Augmented language models: a survey. arXiv preprint arXiv:2302.07842, 2023.
- Min et al. (2022) Min, S., Lyu, X., Holtzman, A., Artetxe, M., Lewis, M., Hajishirzi, H., and Zettlemoyer, L. Rethinking the role of demonstrations: What makes in-context learning work? arXiv preprint arXiv:2202.12837, 2022.
- Mirchandani et al. (2023) Mirchandani, S., Xia, F., Florence, P., Ichter, B., Driess, D., Arenas, M. G., Rao, K., Sadigh, D., and Zeng, A. Large language models as general pattern machines. arXiv preprint arXiv:2307.04721, 2023.
- Nijkamp et al. (2022) Nijkamp, E., Pang, B., Hayashi, H., Tu, L., Wang, H., Zhou, Y., Savarese, S., and Xiong, C. Codegen: An open large language model for code with multi-turn program synthesis. arXiv preprint arXiv:2203.13474, 2022.
- Ning et al. (2023) Ning, X., Lin, Z., Zhou, Z., Yang, H., and Wang, Y. Skeleton-of-thought: Large language models can do parallel decoding. arXiv preprint arXiv:2307.15337, 2023.
- Nye et al. (2021) Nye, M., Andreassen, A. J., Gur-Ari, G., Michalewski, H., Austin, J., Bieber, D., Dohan, D., Lewkowycz, A., Bosma, M., Luan, D., et al. Show your work: Scratchpads for intermediate computation with language models. arXiv preprint arXiv:2112.00114, 2021.
- OpenAI (2023) OpenAI. Gpt-4 technical report, 2023.
- Paranjape et al. (2023) Paranjape, B., Lundberg, S., Singh, S., Hajishirzi, H., Zettlemoyer, L., and Ribeiro, M. T. Art: Automatic multi-step reasoning and tool-use for large language models. arXiv preprint arXiv:2303.09014, 2023.
- Parisi et al. (2022) Parisi, A., Zhao, Y., and Fiedel, N. Talm: Tool augmented language models. arXiv preprint arXiv:2205.12255, 2022.
- Qin et al. (2023) Qin, Y., Liang, S., Ye, Y., Zhu, K., Yan, L., Lu, Y., Lin, Y., Cong, X., Tang, X., Qian, B., et al. Toolllm: Facilitating large language models to master 16000+ real-world apis. arXiv preprint arXiv:2307.16789, 2023.
- Radford et al. (2019) Radford, A., Wu, J., Child, R., Luan, D., Amodei, D., Sutskever, I., et al. Language models are unsupervised multitask learners. OpenAI blog, 1(8):9, 2019.
- Schick et al. (2023) Schick, T., Dwivedi-Yu, J., Dessì, R., Raileanu, R., Lomeli, M., Zettlemoyer, L., Cancedda, N., and Scialom, T. Toolformer: Language models can teach themselves to use tools. arXiv preprint arXiv:2302.04761, 2023.
- Singh et al. (2023) Singh, I., Blukis, V., Mousavian, A., Goyal, A., Xu, D., Tremblay, J., Fox, D., Thomason, J., and Garg, A. Progprompt: Generating situated robot task plans using large language models. In 2023 IEEE International Conference on Robotics and Automation (ICRA), pp. 11523–11530. IEEE, 2023.
- Srivastava et al. (2022) Srivastava, A., Rastogi, A., Rao, A., Shoeb, A. A. M., Abid, A., Fisch, A., Brown, A. R., Santoro, A., Gupta, A., Garriga-Alonso, A., et al. Beyond the imitation game: Quantifying and extrapolating the capabilities of language models. arXiv preprint arXiv:2206.04615, 2022.
- Surís et al. (2023) Surís, D., Menon, S., and Vondrick, C. Vipergpt: Visual inference via python execution for reasoning. arXiv preprint arXiv:2303.08128, 2023.
- Suzgun et al. (2022) Suzgun, M., Scales, N., Schärli, N., Gehrmann, S., Tay, Y., Chung, H. W., Chowdhery, A., Le, Q. V., Chi, E. H., Zhou, D., et al. Challenging big-bench tasks and whether chain-of-thought can solve them. arXiv preprint arXiv:2210.09261, 2022.
- Touvron et al. (2023) Touvron, H., Lavril, T., Izacard, G., Martinet, X., Lachaux, M.-A., Lacroix, T., Rozière, B., Goyal, N., Hambro, E., Azhar, F., et al. Llama: Open and efficient foundation language models. arXiv preprint arXiv:2302.13971, 2023.
- Wang et al. (2023a) Wang, G., Xie, Y., Jiang, Y., Mandlekar, A., Xiao, C., Zhu, Y., Fan, L., and Anandkumar, A. Voyager: An open-ended embodied agent with large language models. arXiv preprint arXiv:2305.16291, 2023a.
- Wang et al. (2023b) Wang, L., Xu, W., Lan, Y., Hu, Z., Lan, Y., Lee, R. K.-W., and Lim, E.-P. Plan-and-solve prompting: Improving zero-shot chain-of-thought reasoning by large language models. arXiv preprint arXiv:2305.04091, 2023b.
- Wang et al. (2022) Wang, X., Wei, J., Schuurmans, D., Le, Q., Chi, E., Narang, S., Chowdhery, A., and Zhou, D. Self-consistency improves chain of thought reasoning in language models. arXiv preprint arXiv:2203.11171, 2022.
- Wei et al. (2022a) Wei, J., Tay, Y., Bommasani, R., Raffel, C., Zoph, B., Borgeaud, S., Yogatama, D., Bosma, M., Zhou, D., Metzler, D., et al. Emergent abilities of large language models. arXiv preprint arXiv:2206.07682, 2022a.
- Wei et al. (2022b) Wei, J., Wang, X., Schuurmans, D., Bosma, M., Xia, F., Chi, E., Le, Q. V., Zhou, D., et al. Chain-of-thought prompting elicits reasoning in large language models. Advances in Neural Information Processing Systems, 35:24824–24837, 2022b.
- Yang et al. (2023) Yang, C., Wang, X., Lu, Y., Liu, H., Le, Q. V., Zhou, D., and Chen, X. Large language models as optimizers. arXiv preprint arXiv:2309.03409, 2023.
- Yao et al. (2022) Yao, S., Zhao, J., Yu, D., Du, N., Shafran, I., Narasimhan, K., and Cao, Y. React: Synergizing reasoning and acting in language models. arXiv preprint arXiv:2210.03629, 2022.
- Yao et al. (2023) Yao, S., Yu, D., Zhao, J., Shafran, I., Griffiths, T. L., Cao, Y., and Narasimhan, K. Tree of thoughts: Deliberate problem solving with large language models. arXiv preprint arXiv:2305.10601, 2023.
- Zeng et al. (2022) Zeng, A., Attarian, M., Ichter, B., Choromanski, K., Wong, A., Welker, S., Tombari, F., Purohit, A., Ryoo, M., Sindhwani, V., et al. Socratic models: Composing zero-shot multimodal reasoning with language. arXiv preprint arXiv:2204.00598, 2022.
- Zhou et al. (2023) Zhou, A., Wang, K., Lu, Z., Shi, W., Luo, S., Qin, Z., Lu, S., Jia, A., Song, L., Zhan, M., et al. Solving challenging math word problems using gpt-4 code interpreter with code-based self-verification. arXiv preprint arXiv:2308.07921, 2023.
- Zhou et al. (2022a) Zhou, D., Schärli, N., Hou, L., Wei, J., Scales, N., Wang, X., Schuurmans, D., Cui, C., Bousquet, O., Le, Q., et al. Least-to-most prompting enables complex reasoning in large language models. arXiv preprint arXiv:2205.10625, 2022a.
- Zhou et al. (2022b) Zhou, Y., Lei, T., Liu, H., Du, N., Huang, Y., Zhao, V., Dai, A. M., Le, Q. V., Laudon, J., et al. Mixture-of-experts with expert choice routing. Advances in Neural Information Processing Systems, 35:7103–7114, 2022b.
## Appendix A Appendix
### A.1 Quantitative results on language reasoning tasks
Table A1 shows the full per-task results across ablations on BIG-Bench Hard (BBH) tasks, as well as broken down by task type and execution type.
.2in.2in Srivastava et al. (2022) Suzgun et al. (2022) Chain of Code BIG-Bench Hard Task Rand. Human (Avg.) Human (Max) Direct CoT Inter-weave try Python except LM state try Python except LM Python LM state LM Boolean Expressions λ+ 50 79 100 88 89 100 100 100 100 95 90 Causal Judgement κ∗ 50 70 100 64 64 56 57 63 0 57 60 Date Understanding κ- 17 77 100 61 84 75 72 74 59 66 57 Disambiguation QA κ/ 33 67 93 70 68 71 67 68 0 67 68 Dyck Languages λ+ 1 48 100 6 50 100 100 99 99 1 7 Formal Fallacies κ∗ 25 91 100 56 56 55 54 55 0 54 56 Geometric Shapes λ+ 12 54 100 48 66 100 100 100 100 13 44 Hyperbaton κ/ 50 75 100 63 64 98 62 55 0 62 55 Logical Deduction λ∗ 23 40 89 49 66 68 79 57 0 79 58 Movie Recommendation κ/ 25 61 90 85 81 80 83 80 0 83 79 Multi-Step Arithmetic λ+ 0 10 25 0 48 100 100 100 100 0 1 Navigate λ∗ 50 82 100 58 94 86 84 68 0 84 68 Object Counting λ- 0 86 100 30 82 96 98 98 98 57 50 Penguins in a Table κ- 0 78 100 62 82 90 88 90 88 71 59 Reasoning about Colored Objects κ- 12 75 100 64 87 78 74 78 64 64 70 Ruin Names κ/ 25 78 100 76 70 55 56 46 0 56 47 Salient Translation Error Detection κ/ 17 37 80 66 61 58 63 64 0 63 64 Snarks κ/ 50 77 100 70 71 76 76 66 0 76 66 Sports Understanding κ/ 50 71 100 72 96 91 93 75 0 93 74 Temporal Sequences λ∗ 25 91 100 38 60 98 93 99 93 93 99 Tracking Shuffled Objects λ- 23 65 100 25 72 100 96 96 96 71 24 Web of Lies λ- 50 81 100 54 100 97 96 96 97 96 50 Word Sorting λ+ 0 63 100 51 50 99 100 99 100 54 54 Task Averages NLP Task (avg) κ 30 71 97 67 74 74 70 68 18 68 63 Algorithmic Task (avg) λ 21 64 92 41 71 95 95 92 80 58 50 All Tasks (avg) 26 68 95 55 72 84 82 80 48 63 57 Execution Type Python exec (same program) + 13 51 85 38 61 100 100 100 100 33 39 Python exec (different program) - 17 77 100 49 84 89 87 89 84 71 52 LM exec (same program) / 36 66 95 72 73 76 71 65 0 71 65 LM exec (different program) ∗ 35 75 98 53 68 72 73 68 19 73 68 $λ$ denotes an algorithmic task and $κ$ denotes an NLP task (with categories outlined in Suzgun et al. (2022)). $+$ denotes a task where the code between prompts is repeated and can be executed by Python, $-$ denotes a task where the code between prompts must change and can be executed by Python, $/$ denotes a task where the code between prompts is repeated and must be executed by the LM, and $*$ denotes a task where the code between prompts must change and must be executed by the LM.
Table A1: Full results across ablations on BIG-Bench Hard (BBH) tasks.
### A.2 Quantitative results on the GSM8K Benchmark
Table A2 shows results on the the grade-school math benchmark (GSM8K) (Cobbe et al., 2021) with direct prompting, Chain of Thought, and Chain of Code. We find that CoC generally outperforms CoT and Direct prompting. Since these tasks are primarily algorithmic and are solved by Python alone, all Chain of Code variants that use Python achieve the same performance – also the same performance shown in Program of Thoughts (Chen et al., 2022).
Table A2: GSM8K (Cobbe et al., 2021) performance (%) with both few-shot prompting with a single task and cross-task. The delta compared to direct prompting is shown in parenthesis.
### A.3 Qualitative results on language reasoning tasks
Figure A1 shows the model outputs for a few reasoning tasks from BIG-Bench Hard (BBH) and Figure A2 shows a demonstrative example of date reasoning. These examples are selected to highlight the interweaving execution of the Python interpreter and the LMulator.
(a) Movie Recommendation
(b) Hyperbaton
(c) Logical Deduction
(d) Disambiguation QA
Figure A1: Model outputs for a few reasoning tasks from BIG-Bench Hard (BBH). We observe that CoC can apply to a wide variety of complex reasoning tasks that involve both semantic and numeric reasoning. Red highlight indicates LM generated code being executed by the Python interpreter, and purple highlight indicates LM simulating the code execution.
Direct answer only
Chain of Code
Figure A2: A demonstrative example of how Chain of Code generates code and reasons through an LM-augmented code emulator. Lines evaluated with Python are in red and with an LM are in purple. The chain of thought and direct answers were evaluated with gpt-4 in October 2023, and we note the current model (as of December 2023) writes code to solve this problem and gets the same solution as Chain of Code.
### A.4 Instruction Tuned Models
Since most of the results presented in our main paper are using text-davinci-003, a completion model that is particularly amenable to few-shot prompting, one may wonder how CoC can be used with instruction tuned models, like gpt-4 (OpenAI, 2023). Figuring out ways to elicit the desired behavior of CoC from these instruction tuned models (i.e. writing code/pseudocode to solve problems) is non-trivial. We conduct two additional experiments below as our best effort to shed some light on this subject.
Zero-shot prompting. We directly prompt the models with instructions to elicit the desired reasoning approaches. Note that we do not provide few-shot examples in the prompt (hence “zero-shot”). For the baselines, we ask the model to “directly answer” (Direct) or “think step by step” (CoT). For CoC variants, we ask the model to “write python code to help solve the problem, if it’s helpful”. If a program is written, we either run the code with a Python interpreter and then feed the result (or the error message if execution fails) back to the model to determine a final answer (CoC (Python)), or ask the model to simulate the output of code execution as a LMulator (CoC (LM)). The CoC (Python) baseline can be thought of as a comparison to an LM with Python tool use.
Table A3 shows the performance of each. With gpt-3.5-turbo, both CoT and CoC (Python) show benefits over direct prompting, although both are strongly outperformed by CoC (Interweave). With gpt-4, despite the considerable model strength advantage over text-davinci-003, CoC (Interweave) still outperforms, though the gap is narrower. Admittedly, CoC (Interweave) is prompted with three examples whereas the other two are not.
Table A3: Comparisons with instruction tuned models in the chat interface, with and without tool use, denoted as CoC (Python) and CoC (LLM) respectively. The delta compared to CoC with text-davinci-003 is shown in parenthesis. In this experiment, the prompts for gpt-3.5-turbo and gpt-4 only contain a generic, shared system message and do not contain few-shot examples.
| CoC (Interweave) 84 | Direct 51 (-33) | CoT 56 (-28) | CoC (Python) 56 (-28) | CoC (LM) 45 (-39) | Direct 70 (-14) | CoT 78 (-6) | CoC (Python) 82 (-2) | CoC (LM) 75 (-9) |
| --- | --- | --- | --- | --- | --- | --- | --- | --- |
Few-shot prompting. We attempt to coerce the instruction tuned models to behave like completion models by using the following system message: “Pretend you are a completion model that is prompted with three examples. You should follow the pattern of these examples strictly. At the end of your reply, you should always output an answer”. In the user message, we include three examples from the same (single task) or different (cross task) task domains, as well as the query question, exactly the same as how we evaluated the completion models.
Table A4 shows that CoC still brings a sizable performance gain over the Direct and CoT baselines. With gpt-4, the gap is again narrower mainly because the base model already performs quite well and leaves little room for improvement. This experiment suggests a viable way to combine the strength of CoC with that of more advanced instruction tuned models like gpt-4.
Table A4: Applying CoC to instruction tuned models in the chat interface, while coercing them to behave like completion models. The delta compared to direct prompting is shown in parenthesis. In this experiment, the prompts contains a generic, shared system message that asks LMs to behave like completion models, and also three examples from the same or different task domains at the beginning of the user message. as before.
| Prompt | gpt-3.5-turbo Direct | gpt-4 CoT | CoC | Direct | CoT | CoC |
| --- | --- | --- | --- | --- | --- | --- |
| Single task | 47 | 73 (+26) | 79 (+32) | 69 | 88 (+19) | 91 (+22) |
| Cross task | 47 | 60 (+13) | 61 (+14) | 67 | 81 (+14) | 84 (+17) |
### A.5 Robustness of Chain of Code
Similar to Chain of Thought prompts, Chain of Code prompts can also come with various forms: e.g. different ways of function decomposition, coding styles, variable names, reasoning pathways, and so on. In this section, we want to analyze whether CoC is robust against variation across prompts.
We invite three annotators that are familiar with Python to write CoC prompts for four representative tasks in BIG-Bench Hard. We select these four tasks because they all require generation of new code (as opposed to repeated code) during test time. As before, for single task evaluation, we prompt LMs with three examples from the same task domain, whereas for cross task evaluation, we prompt LMs with three examples from different task domains (one from each of the other three tasks).
Results in Table A5 show that our method is robust against prompt variation and doesn’t require extensive prompt engineering.
Table A5: Performance variation across prompts written independently by different authors for four representative tasks in BIG-Bench Hard. Our results that CoC is generally robust against prompt variation, allowing for different coding styles and reasoning logic in the few-shot prompts.
| Prompt Single task | Prompt Annotator A B | Date Understanding 73 68 | Logical Deduction 64 54 | Object Counting 92 95 | Penguins in a Table 78 88 | Average 77 76 |
| --- | --- | --- | --- | --- | --- | --- |
| C | 69 | 43 | 90 | 89 | 73 | |
| Cross task | A | 41 | 33 | 67 | 76 | 54 |
| B | 48 | 29 | 78 | 88 | 61 | |
| C | 60 | 30 | 76 | 64 | 57 | |
### A.6 Robotics Applications
Downstream applications such as robotics are well fit for CoC as robotics tasks require semantic reasoning and algorithmic reasoning, as well as interfacing with other APIs through code (such as control or perception APIs (Liang et al., 2023)) and with users through natural language. For example, given a task like “sort the fruits by size”, the robot must reason over which items are fruits, sort them by size, and then connect those decisions to actions executable on the robot. CoC (Interweave) is able to solve these challenges with the Python interpreter and the LMulator at runtime, while allowing for more interpretability and fine-grained control of the robot policies.
Environment and Robot Setup. Our environment is a tabletop with small objects (containers, toys, etc) and a UR5 robot arm equipped with a vacuum gripper and a wrist-mounted RGB-D camera. For the purpose of our experiments, the available perception API is detect_objects(), which returns a list of detected objects (probabilities, labels, bounding boxes and segmentation masks) from the wrist camera. This API is implemented with first querying GPT-4V (OpenAI, 2023) for a list of objects, and then using Grounding-SAM (Kirillov et al., 2023; Liu et al., 2023) to localize them. The available control API is pick_place(obj1, obj2), which is a scripted primitive skill that picks up obj1 and places it on top of obj2. There is also a text-to-speech API say(sentence) that allows the robot to communicate with the user.
Experimental Setup. We evaluate with a number of tabletop pick-and-place robotics tasks that involve semantic reasoning. For few-shot prompting, we include a single example: “Serve a meal that follows the user’s dietary restrictions”, so that the language model understands the expected structure as well as the available robot APIs. During test time, we query the model with each of the following instructions.
1. “Pack a lunch box for someone who is on a vegan diet.”
1. “Assemble a sandwich for someone who is vegetarian.”
1. “Gather ingredients for a peanut butter sandwich in a plate.”
1. “Prepare 西红柿炒蛋 in the pot.” (interleaving English and Chinese on purpose)
1. “Place all paper-made objects in the grass-colored container.”
1. “Sort the objects on the table into the compost bin and the recycle bin.”
1. “My steak is too bland. Can you help?”
Results. With a single example in our prompt, we see that our model is able to generalize to new objects, languages, and task domains (see Figure A3 and an example trajectory in Figure A4). Note that for these robotics tasks, unlike the previous language reasoning tasks, our main method CoC (Interweave) is the only capable approach, as the code requires line-by-line interplay between the Python interpreter execution (robot APIs) and the LMulator (commonsense QA like is_compostable).
Figure A3 shows the one-shot prompt as well as the model outputs and how they are executed for a few test instructions.
(a) Given Prompt
(b) Novel Objects
(c) Novel Languages
(d) Novel Tasks
Figure A3: The one-shot prompt as well as the model outputs for a few test instructions for the robotics tasks. When given a single example in the prompt (a), our method can generalize (b-d) to new objects, languages, and task domains. Red highlight indicates LM generated code being executed by the Python interpreter, and purple highlight indicates LM simulating the code execution. Gray text is for illustration purpose only, and not provided to our model. Note that code in the form of robot.<func_name> invokes robot APIs.
<details>
<summary>extracted/5762267/fig/robot_traj_1.jpg Details</summary>
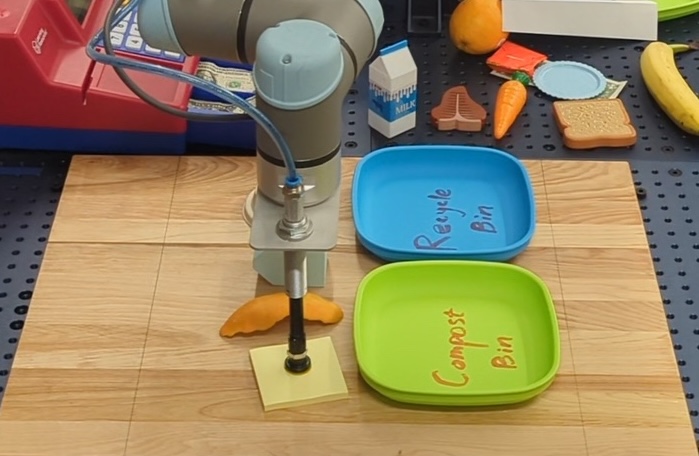
### Visual Description
## Photograph: Robotic Arm Waste Sorting Setup
### Overview
The image displays a close-up, high-angle photograph of a robotic arm workstation designed for a waste sorting demonstration or experiment. The scene is set on a light wood-grain surface, with a robotic arm positioned centrally, interacting with objects. Two labeled sorting bins and various waste item replicas are arranged around the arm.
### Components/Axes
* **Primary Subject:** A multi-jointed robotic arm, primarily grey and light blue, with a black suction cup end-effector. It is currently holding a small, yellow, square object (likely a sticky note or piece of paper).
* **Sorting Bins:** Two rectangular plastic bins are placed to the right of the robotic arm.
* **Top Bin:** Blue. Contains the handwritten label "Recycle Bin" in dark blue cursive script.
* **Bottom Bin:** Green. Contains the handwritten label "Compost Bin" in yellow cursive script.
* **Work Surface:** A light-colored wooden table or platform with a visible wood grain pattern.
* **Background/Perimeter:** A dark grey, perforated surface (likely a pegboard or lab bench) surrounds the wooden work area. Various objects are placed on this perimeter.
* **Objects (Potential Waste Items):** These appear to be realistic replicas or actual items for sorting.
* **Top Left:** A red plastic bin (partially visible).
* **Top Center/Right:** A white and blue milk carton (text: "MILK"), a brown cardboard coffee cup sleeve, an orange plastic carrot, a red cardboard box (text: "KETCHUP"), a light blue plastic plate, a slice of bread (replica), and a yellow banana.
* **Top Far Right:** A whole orange fruit.
### Detailed Analysis
* **Robotic Arm State:** The arm is in a static, posed position. Its suction cup is engaged with the yellow square object, lifting it slightly above the wooden surface. The arm's posture suggests it is in the middle of a pick-and-place operation.
* **Spatial Layout:**
* The robotic arm is the central focal point.
* The two sorting bins are positioned to the arm's right, with the "Recycle Bin" (blue) farther back and the "Compost Bin" (green) closer to the foreground.
* The waste item replicas are scattered in the background, primarily in the top-right quadrant of the image, suggesting they are the input items for the sorting task.
* **Text Transcription:**
* On Blue Bin: "Recycle Bin"
* On Green Bin: "Compost Bin"
* On Milk Carton: "MILK"
* On Red Box: "KETCHUP" (partially obscured, but identifiable).
* **Color Coding:** The bins use color association common in waste management: blue for recycling, green for compost/organic waste.
### Key Observations
1. **Task Context:** The setup is clearly designed for a robotic sorting task, differentiating between recyclable and compostable materials.
2. **Object Variety:** The items represent common household waste streams: paper/cardboard (coffee sleeve, ketchup box), plastic (milk carton, plate), organic/food waste (carrot, bread, banana, orange).
3. **Ambiguity:** The yellow object being held by the robot is not clearly identifiable. It could be a piece of paper (recyclable) or a sticky note (potentially compostable if paper-based, but often has adhesive).
4. **Staging:** The scene appears staged for demonstration or data collection, given the clean, organized layout and the use of replicas.
### Interpretation
This image depicts a controlled experimental or demonstration environment for training or showcasing a robotic system in automated waste sorting. The core challenge illustrated is the perception and classification of diverse object types (materials, shapes, brands) and their correct routing to designated bins (recycling vs. compost).
The presence of branded items like the "MILK" carton and "KETCHUP" box suggests the system may need to handle real-world, non-uniform objects. The handwritten labels on the bins imply a prototype or lab setting rather than a commercial product. The robotic arm's action—holding an ambiguous yellow item—highlights a critical decision point in the sorting process: the system must correctly classify this item based on its visual and material properties to place it in the appropriate bin. The overall setup serves as a microcosm of the larger challenge in robotics and AI for environmental sustainability and circular economy initiatives.
</details>
<details>
<summary>extracted/5762267/fig/robot_traj_2.jpg Details</summary>
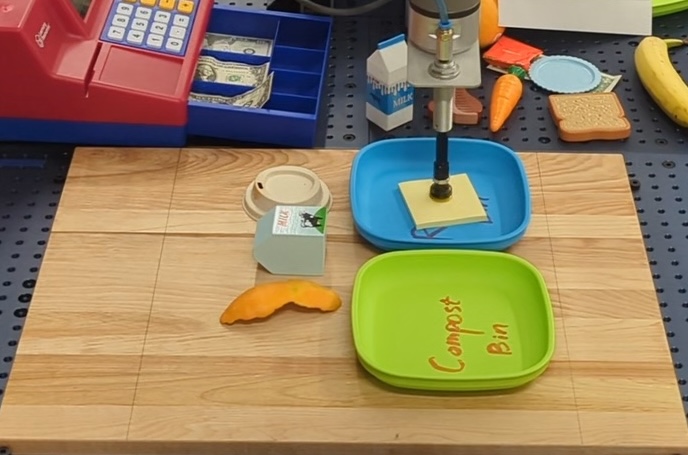
### Visual Description
## Photograph: Educational Play Setup
### Overview
The image displays a tabletop arrangement of various toy and household objects, likely set up for a child's educational play scenario or a demonstration. The scene is captured from a slightly elevated, angled perspective looking down onto a light-colored wooden surface placed on a dark, perforated workbench or table.
### Components & Spatial Layout
The scene can be segmented into distinct regions:
**1. Background/Perimeter (Top & Sides):**
* **Top-Left:** A red and blue toy cash register. It features a numeric keypad with white buttons, a small display screen, and a blue drawer containing several folded pieces of play money (green, resembling dollar bills).
* **Top-Center:** A small, white cardboard carton labeled "MILK" in blue text, with a blue cow illustration. Next to it is a small, brown, rectangular object (possibly a toy brick or block).
* **Top-Right:** A collection of play food items on the dark surface: an orange carrot with a green top, a slice of brown bread, a yellow banana, and a light blue plate. A red rectangular object (possibly a toy wallet or case) is also present.
* **Top-Center (Elevated):** A metallic stand or tool (possibly a small drill press or clamp) is positioned above the main wooden board, holding a yellow sticky note pad in a blue tray.
**2. Main Wooden Board (Center & Foreground):**
* **Center-Right:** A shallow, square, blue plastic tray. Inside it rests a pad of yellow sticky notes and a black pen or stylus held by the metallic stand above.
* **Bottom-Right:** A bright green, square plastic container with rounded corners. The words **"Compost Bin"** are written on its side in a casual, orange, handwritten-style font.
* **Center-Left:** A gray, rectangular object with a small, circular, beige component on top (resembling a toy coffee grinder or a small appliance). It has a green and white label, but the text is not fully legible.
* **Bottom-Left:** An orange, crescent-shaped object, likely a toy slice of cheese or a similar play food item.
**3. Surface:**
* The primary surface is a light wood-grain board, possibly a cutting board or a section of a table.
* This board sits on a dark gray or black workbench surface with a grid of small, regular holes.
### Detailed Analysis
* **Text Extraction:**
* **"Compost Bin"**: Clearly visible on the side of the green container in the foreground.
* **"MILK"**: Printed on the white carton in the background.
* **Cash Register Buttons**: The keypad shows numbers and symbols, but specific values are indistinct due to resolution and angle.
* **Gray Object Label**: Contains a green graphic and text, but the words cannot be transcribed with certainty.
* **Object Identification:** The items are predominantly toys or props: play food (carrot, bread, banana, cheese), a toy cash register with play money, a toy appliance, and labeled containers ("MILK", "Compost Bin").
* **Spatial Relationships:** The setup suggests a flow or process. The cash register and money imply a "store" or "market." The "MILK" carton and play food are "products." The "Compost Bin" is positioned as a receptacle, possibly for waste from the food items. The blue tray with notepad and pen could represent a station for lists or notes.
### Key Observations
1. **Thematic Grouping:** Objects are loosely grouped by function: financial (cash register, money), consumables (milk, food), and waste management (compost bin).
2. **Color Coding:** Containers are color-coded: blue for the note-taking tray, green for the compost bin, red for the cash register.
3. **Staged Arrangement:** The items are neatly placed, not randomly scattered, indicating intentional setup for a specific purpose, such as a learning activity.
4. **Mixed Realism:** The setup combines realistic elements (the wooden board, the metallic stand) with clearly toy-like objects (the plastic food, the bright cash register).
### Interpretation
This image depicts a **pretend play or educational model** designed to teach concepts related to a **market, grocery store, or food cycle**. The presence of a "Compost Bin" alongside food items and a cash register suggests a lesson that integrates **commerce with environmental awareness**, possibly illustrating where food waste goes after a purchase or meal.
The setup is **investigative in a Peircean sense**:
* **Iconic:** The toys directly represent their real-world counterparts (a carrot looks like a carrot).
* **Indexical:** The arrangement points to a process—food is acquired (cash register), consumed (implied), and its waste is disposed of in a specific bin (compost).
* **Symbolic:** The labeled "Compost Bin" introduces the abstract concept of organic waste recycling into the concrete play scenario.
The **notable anomaly** is the metallic stand holding the notepad, which seems more like a piece of lab or workshop equipment than a typical play item. This might indicate the setup is part of a structured experiment, observation, or a more technical educational demonstration about systems or workflows, rather than purely imaginative play. The entire scene serves as a **tangible metaphor for a sustainable food system**, simplified for understanding.
</details>
<details>
<summary>extracted/5762267/fig/robot_traj_3.jpg Details</summary>
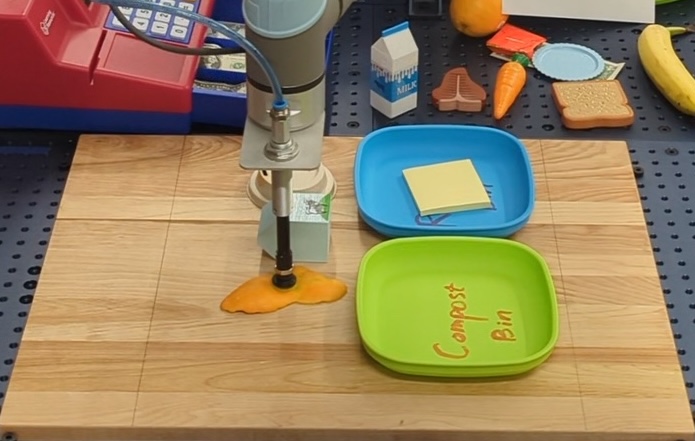
### Visual Description
## Photograph: Robotic Arm Sorting Setup
### Overview
The image displays a tabletop experimental setup featuring a robotic arm performing a pick-and-place task, likely for waste sorting or object manipulation research. The scene is captured from a high-angle, slightly oblique perspective. The primary focus is a wooden surface where a robotic arm interacts with objects, flanked by two collection trays. The background contains various household and food items, suggesting a testing environment for object recognition and handling.
### Components & Spatial Layout
**1. Central Work Area (Foreground/Center):**
* **Surface:** A light-colored wooden board with a visible grain pattern, divided into four square panels by thin seams.
* **Robotic Arm:** A grey and silver articulated arm descends from the top-center of the frame. Its end-effector is a black suction cup, which is currently engaged with and lifting a flat, irregularly shaped orange object (resembling a piece of fabric or a soft toy).
* **Object in Gripper:** An orange, amorphous object is held by the suction cup, positioned slightly left of center on the wooden surface.
**2. Collection Trays (Right Side):**
* **Blue Tray:** A rectangular, bright blue plastic tray is positioned in the upper-right quadrant of the wooden surface. Inside it rests a single, square, yellow sticky note.
* **Green Tray:** A rectangular, bright green plastic tray is positioned directly below the blue tray, in the lower-right quadrant. On its interior bottom surface, the words **"Compost Bin"** are written in a casual, handwritten style using a yellow-orange marker. The text is oriented to be read from the front of the setup.
**3. Background Items (Top of Frame, behind the wooden surface):**
These items are placed on a dark, perforated workbench surface.
* **Left:** A red and blue machine with a keypad and display screen (partially visible). Text on the red casing includes **"VWR"**.
* **Center-Left:** A small, white carton with blue text and graphics. The word **"MILK"** is clearly visible on its side.
* **Center:** A brown, molded object resembling a chocolate bar or a piece of toast.
* **Center-Right:** An orange, carrot-shaped object.
* **Right:** A slice of bread (likely plastic/toy food), a blue circular lid, and a yellow banana.
### Detailed Analysis
* **Text Transcription:**
* On the green tray: **"Compost Bin"** (Handwritten, English).
* On the milk carton: **"MILK"** (Printed, English).
* On the red machine: **"VWR"** (Printed, English - likely a brand or model identifier).
* **Object Identification:** The objects appear to be a mix of real items (banana, bread slice) and likely plastic or toy replicas (carrot, milk carton, chocolate/toast object). This is common in robotics research to simulate real-world items without spoilage.
* **Action State:** The robotic arm is in an active state, mid-task, having successfully grasped the orange object. The suction cup appears to be creating a seal on the object's surface.
### Key Observations
1. **Task Context:** The setup strongly implies a **waste sorting or recycling demonstration**. The presence of a labeled "Compost Bin" and a variety of food-related items (milk, bread, fruit, vegetable) supports this.
2. **Object Differentiation:** The system is being tested on objects with different material properties: soft/flexible (orange object, banana), rigid (carton, trays), and textured (bread).
3. **Sticky Note:** The yellow sticky note in the blue tray is blank. Its purpose is ambiguous—it could be a placeholder, a target for a different task, or an item to be sorted itself.
4. **Workspace Organization:** The area is neatly organized for a controlled experiment. The background items are staged but not currently part of the active sorting area on the wooden board.
### Interpretation
This image documents a **robotic perception and manipulation experiment** focused on **automated waste sorting**. The core investigative reading is that researchers are training or testing a system to identify and physically categorize different types of refuse.
* **The "Compost Bin"** is the critical clue. It indicates the system's goal is not just to pick objects, but to classify them based on material type (organic/compostable vs. recyclable/other) and place them in designated locations.
* The **variety of food items** in the background serves as the test dataset. The robotic arm's current action—picking up an ambiguous orange object—may represent a challenging case for the vision system (e.g., classifying a soft, non-standard item).
* The **staged, clean environment** suggests this is a controlled validation phase, not a real-world deployment. The use of toy food items allows for repeatable testing without mess.
* The **blank sticky note** could be an intentional "unknown" or "non-recyclable" item to test the system's handling of outliers or its ability to leave certain items unsorted.
In essence, the image captures a moment in the development of automation technology aimed at improving recycling efficiency and reducing contamination in waste streams. The setup is designed to answer: "Can a robot reliably see, grasp, and correctly sort everyday trash?"
</details>
<details>
<summary>extracted/5762267/fig/robot_traj_4.jpg Details</summary>
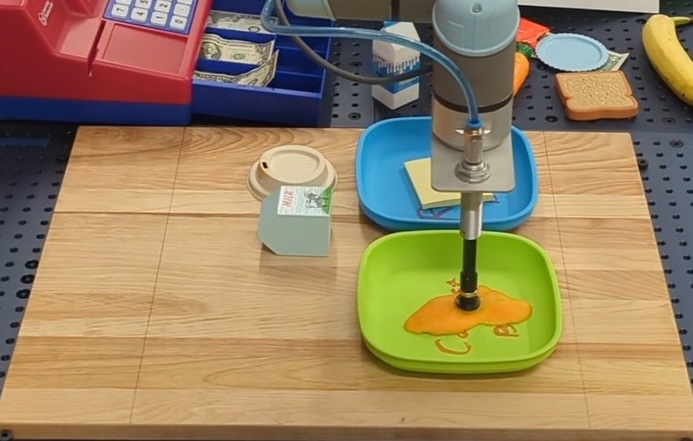
### Visual Description
## Photographic Scene: Robotic Arm Workspace Setup
### Overview
The image displays a close-up, high-angle view of a workspace or demonstration area featuring a robotic arm interacting with various objects on a light-colored wooden surface. The scene appears to be a controlled setup, possibly for testing robotic manipulation, object recognition, or a simulated task like food preparation or sorting. The background includes a dark pegboard, suggesting a workshop or lab environment.
### Components & Spatial Layout
The scene is composed of several distinct objects arranged on a wooden board with visible grid lines.
**1. Primary Workspace (Wooden Board):**
* **Material:** Light-colored wood with a visible grain pattern.
* **Layout:** Divided into a grid by faint, dark lines, creating rectangular sections.
* **Position:** Occupies the central and lower portion of the frame.
**2. Robotic Arm Assembly:**
* **Location:** Center-right of the wooden board.
* **Components:**
* **Base:** A cylindrical, light blue/grey unit mounted on a square, silver metal plate.
* **Arm:** A segmented, metallic arm extending downward.
* **End Effector:** A black, pen-like tool or gripper attached to the arm's end.
* **Cabling:** A thick, grey cable runs from the base towards the top of the frame.
* **Action:** The end effector is positioned directly above, and appears to be interacting with, an orange substance on a green plate.
**3. Objects on the Wooden Board:**
* **Green Plate (Bottom-Right):**
* **Shape:** Square with rounded corners.
* **Content:** Contains a viscous, orange-colored substance (resembling sauce, jam, or a gel) in an irregular, puddle-like shape. The robotic tool is centered on this substance.
* **Blue Plate (Center-Right, behind green plate):**
* **Shape:** Square with rounded corners.
* **Content:** Holds a small, rectangular, yellow object (possibly a sponge or a piece of cheese).
* **Milk Carton (Center-Left):**
* **Shape:** A small, rectangular carton with a gabled top.
* **Label Text (Visible):** "MILK" in bold, black letters. Below it, smaller text reads "VITAMIN D" and "LOW FAT". There is also a green logo or symbol.
* **Language:** English.
* **Small White Cup (Behind Milk Carton):**
* A small, white, cylindrical cup or container, partially obscured.
**4. Background Objects (Beyond the Wooden Board):**
* **Toy Cash Register (Top-Left):**
* **Color:** Red and blue.
* **Features:** A numeric keypad with white buttons (numbers 0-9 visible), a blue drawer containing play money (dollar bills), and a red scanning area.
* **Blue Tray (Top-Center):**
* Contains additional play money and a small, white box with blue text (partially legible, possibly "SUGAR").
* **Food Items (Top-Right):**
* A plastic or toy banana (yellow).
* A plastic or toy sandwich (brown bread, green lettuce, red tomato).
* A small, blue plate.
* **Pegboard (Background):**
* A dark grey or black board with a regular pattern of holes, typical of a workshop tool organizer.
### Detailed Analysis
* **Text Extraction:**
* **Milk Carton:** "MILK", "VITAMIN D", "LOW FAT". (Language: English)
* **Cash Register Buttons:** Numerals "0" through "9" are visible on the white keys.
* **Blue Box in Tray:** Partial text, likely "SUGAR".
* **Object Relationships:** The setup suggests a sequential or task-oriented process. The robotic arm is the active agent, focused on the green plate. The milk carton, blue plate with yellow object, and background food items could be part of a simulated kitchen or grocery scenario. The cash register and play money introduce a transactional or role-play element.
* **Materials:** The objects appear to be a mix of real items (wooden board, robotic arm components), toys (cash register, food), and possibly lab or prototyping materials (the plates, the substance on the green plate).
### Key Observations
1. **Focal Point:** The robotic arm's interaction with the orange substance is the clear focal point, indicating a manipulation task.
2. **Staged Environment:** The combination of a precise robotic tool with toy objects and a gridded board strongly indicates a controlled experiment, demonstration, or educational setup rather than a natural scene.
3. **Color Coding:** Objects are brightly colored (red, blue, green, yellow), which may be intentional for computer vision testing or to make components distinct.
4. **Spatial Organization:** Items are placed with clear separation on the gridded board, likely to define work zones or prevent interference.
### Interpretation
This image documents a **robotic manipulation testbed or demonstration scenario**. The Peircean investigative reading suggests the following:
* **Sign (The Image):** A snapshot of an active process.
* **Object (The Reality):** A research or educational activity focused on teaching a robot to interact with everyday objects, possibly in a kitchen or retail context. The gridded board provides a known coordinate system for the robot.
* **Interpretant (The Meaning):** The setup is designed to generate data on precision, object recognition, or sequential task execution. The orange substance could be a stand-in for a food item requiring careful handling (e.g., spreading, scooping). The presence of the toy cash register and food items might indicate a broader goal of simulating a complete activity chain, such as "prepare a meal and ring up the sale." The use of toys reduces cost and safety concerns during early-stage testing. The image itself likely serves as documentation for a technical report, presentation, or research log, capturing the experimental configuration at a specific moment.
</details>
Figure A4: Robot trajectory visualization for task “sort the objects on the table into the compost bin and the recycle bin”. CoC first generates code to solve the problem, and then executes the code with Python if possible (e.g., robot APIs like detect_objects and pick_place), and with LMulator if not (e.g., commonsense QA like is_compostable). The robot successfully picks and places the Post-it note to the recycle bin and the orange peel to the compost bin. See the full code in Fig. A3.