# Survey of Privacy Threats and Countermeasures in Federated Learning
**Authors**: Masahiro Hayashitani, Junki Mori, and Isamu Teranishi
> M. Hayashitani, J. Mori, and I. Teranishi are with NEC Secure System Platform Research Laboratories. E-mail:
## Abstract
Federated learning is widely considered to be as a privacy-aware learning method because no training data is exchanged directly between clients. Nevertheless, there are threats to privacy in federated learning, and privacy countermeasures have been studied. However, we note that common and unique privacy threats among typical types of federated learning have not been categorized and described in a comprehensive and specific way. In this paper, we describe privacy threats and countermeasures for the typical types of federated learning; horizontal federated learning, vertical federated learning, and transfer federated learning.
Index Terms: horizontal federated learning, vertical federated learning, transfer federated learning, threat to privacy, countermeasure against privacy threat.
## I Introduction
As computing devices become more ubiquitous, people generate vast amounts of data in their daily lives. Collecting this data in centralized storage facilities is costly and time-consuming [1]. Another important concern is user privacy and confidentiality, as usage data typically contains sensitive information. Sensitive data such as biometrics and healthcare can be used for targeted social advertising and recommendations, posing immediate or potential privacy risks. Therefore, private data should not be shared directly without any privacy considerations. As societies become more privacy-conscious, legal restrictions such as the General Data Protection Regulation (GDPR) and the EU AI ACT are emerging, making data aggregation practices less feasible. In this case, federated learning has emerged as a promising machine learning technique where each client learns and sends the information to a server.
Federated learning has attracted attention as a privacy-preserving machine learning technique because it can learn a global model without exchanging private raw data between clients. However, federated learning still poses a threat to privacy. Recent works have shown that federated learning may not always provide sufficient privacy guarantees, since the communication of model updates throughout the training process may still reveal sensitive information, even to a third party or to the central server [1]. Typical examples of federated learning include horizontal federated learning where features are common, vertical federated learning where IDs are common, and federated transfer learning where some features or IDs are common. However, we note that common and unique privacy threats among each type of federated learning have not been categorized and described in a comprehensive and specific way.
For example, in the case of horizontal federated learning, semi-honest server can infer client’s data by inference attacks on a model sent by the client. If the client is an attacker, the attacker can infer the data of other clients by inference attacks on a global model received from the server. Such an attack is possible because the global model is design to reflect the data of all clients. If the attacker is a third party that is neither a server nor a client, it can eavesdrop on models passing through the communication channel and infer client data through inference attacks. In vertical federated learning, the main threat to privacy is the identify leakage through identity matching between clients. In addition, since the intermediate outputs of a model are sent to the server, there is a possibility that client data can be inferred through an inference attack. Also, as in horizontal federated learning, client data can be inferred by an inference attack on the server. Finally, in federated transfer learning, member and attribute guessing attacks are possible by exploiting a prediction network. If IDs are common, gradient information is exchanged when features are made similar. Therefore member and attribute guessing attacks are possible by using gradient information. When there are common features among clients, attribute guessing attacks are possible by exploiting networks that complement the missing features from the common features.
In this paper, we discuss the above threats to privacy in detail and countermeasures against privacy threats in three types of federated learning; horizontal federated learning, vertical federated learning, and federated transfer learning. The paper is organized as follows: Section 2 presents learning methods for horizontal federated learning, vertical federated learning, and federated transfer learning; Section 3 discusses threats to privacy in each federated learning; Section 4 discusses countermeasures against privacy threats in each federated learning; and Section 5 concludes.
## II Categorization of Federated Learning
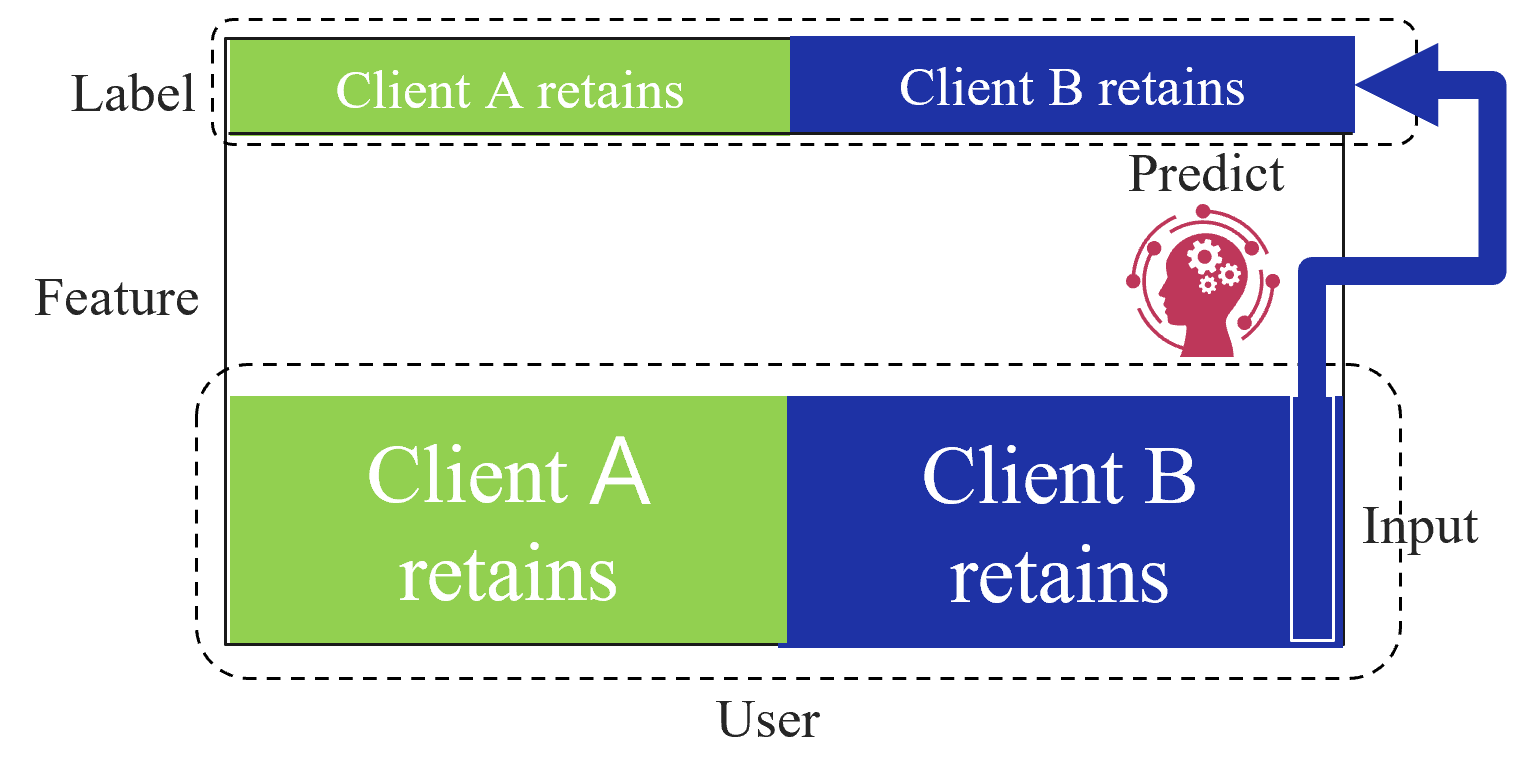
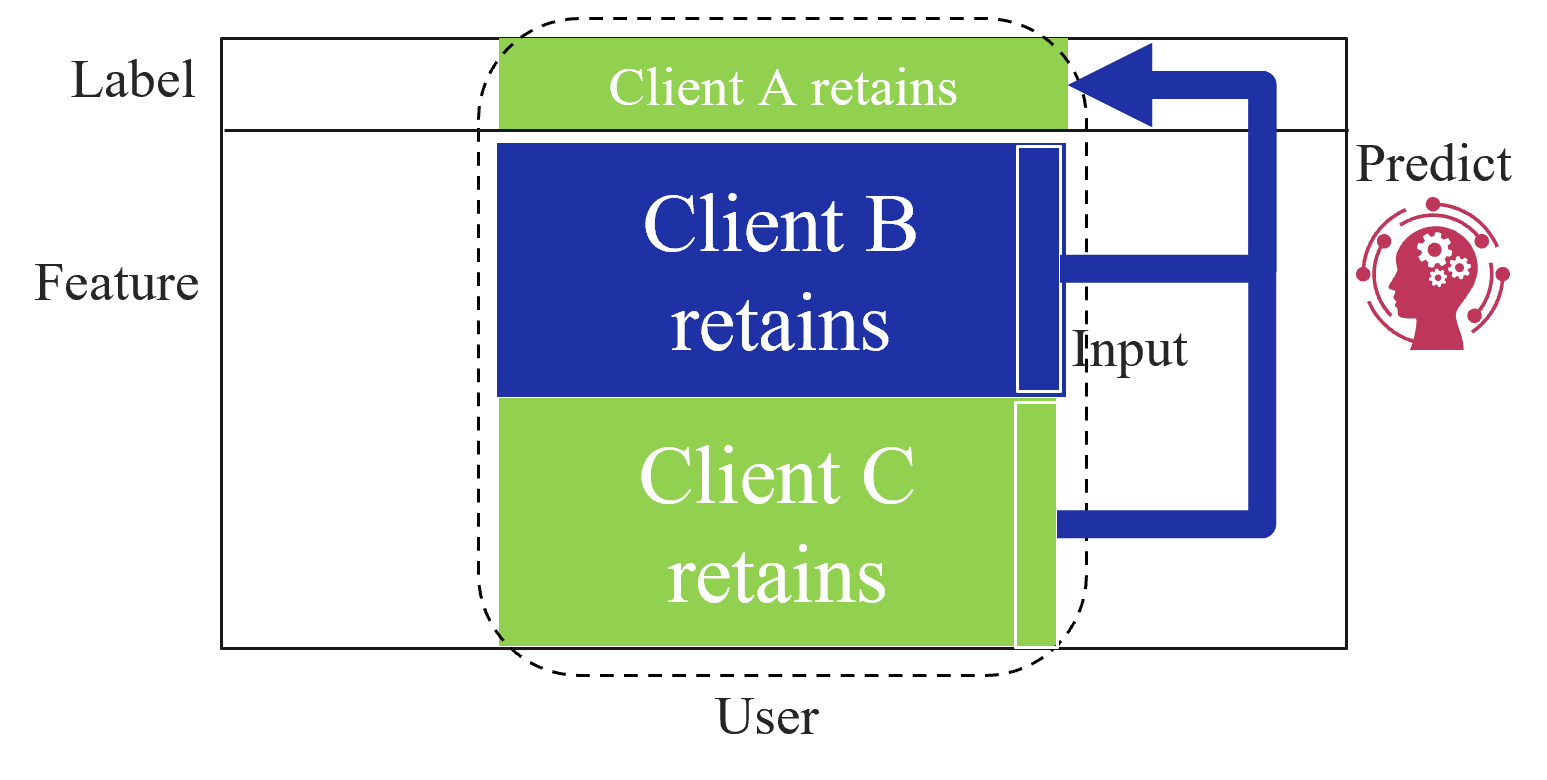
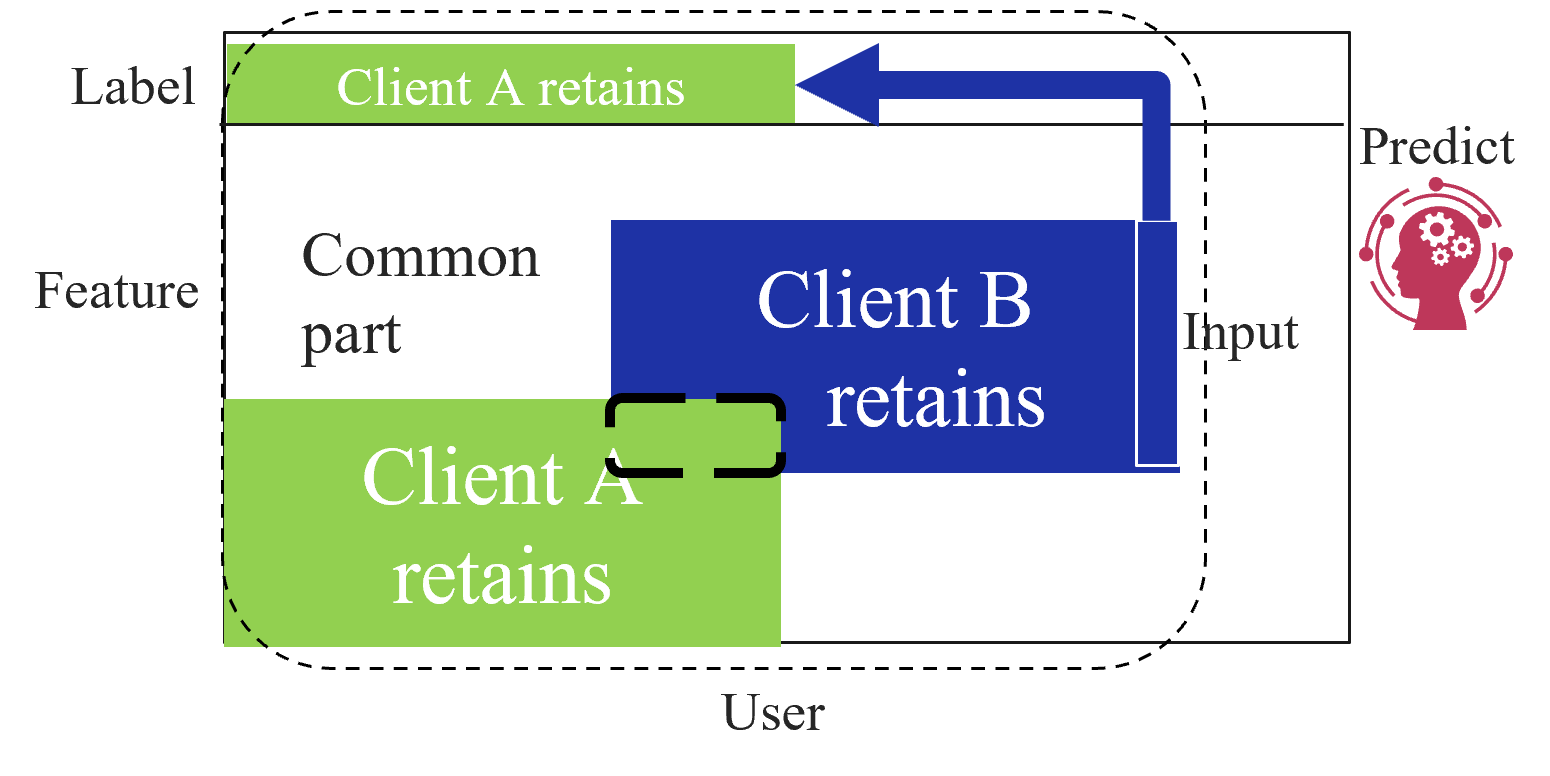
Based on the data structures among clients, federated learning is categorized into three types as first introduced by Yang et al. [2]: horizontal federated learning (HFL), vertical federated learning (VFL), and federated transfer learning (FTL). Figure 1 shows the data structure among clients for each type of federated learning. HFL assumes that each client has the same features and labels but different samples (Figure 1(a)). On the other hand, VFL assumes that each client has the same samples but disjoint features (Figure 1(a)). Finally, FTL applies to the scenario where each of the two clients has data that differ in not only samples but also features (Figure 1(c)).
In the following subsections, we describe the learning and prediction methods for each type of federated learning.
<details>
<summary>extracted/5379099/fig/HFL_structure.png Details</summary>
### Visual Description
\n
## Diagram: Client Retention Prediction Flow
### Overview
The image depicts a diagram illustrating a client retention prediction process. It shows an input stage, a prediction stage represented by a brain icon, and an output stage with labels indicating which client retains. The diagram is framed by dashed boxes and labeled axes.
### Components/Axes
The diagram has two primary axes:
* **Vertical Axis:** Labeled "Feature" at the left and "User" at the bottom.
* **Horizontal Axis:** Labeled "Label" at the top, with two categories: "Client A retains" and "Client B retains".
* **Input:** Indicated by text "Input" on the right side of the lower dashed box.
* **Predict:** Indicated by text "Predict" above the brain icon.
* **Arrow:** A large blue arrow points from the "Label" section towards the "Predict" stage.
* **Brain Icon:** A stylized brain icon with gears inside, representing the prediction process.
* **Text Blocks:** Two text blocks within the lower dashed box: "Client A retains" (green background) and "Client B retains" (blue background).
### Detailed Analysis
The diagram shows a flow of information. The "User" provides a "Feature" as input. This input is then processed by the "Predict" stage (the brain icon). The output of the prediction is a "Label" indicating whether "Client A retains" or "Client B retains".
The lower dashed box contains the input data, visually separated into two categories:
* **Client A retains:** Displayed on a green background.
* **Client B retains:** Displayed on a blue background.
The upper section, labeled "Label", represents the predicted outcome. The arrow indicates the direction of the prediction process.
### Key Observations
The diagram is a simplified representation of a machine learning or predictive modeling process. It highlights the input features, the prediction stage, and the resulting label. The color coding (green for Client A, blue for Client B) suggests a binary classification problem. The diagram does not contain any numerical data or specific values. It is a conceptual illustration of a process.
### Interpretation
This diagram illustrates a supervised learning scenario where the goal is to predict client retention. The "Feature" represents the data used to make the prediction (e.g., customer demographics, purchase history, engagement metrics). The "Predict" stage represents the model that learns from this data. The "Label" represents the actual outcome (which client retained). The diagram suggests a process where the model takes the "Feature" as input and outputs a prediction about which client will retain. The arrow indicates the flow of information from the input to the prediction. The diagram is a high-level overview and does not provide details about the specific model or features used. It is a conceptual illustration of a client retention prediction process.
</details>
(a) Horizontal federated learning.
<details>
<summary>extracted/5379099/fig/VFL_structure.png Details</summary>
### Visual Description
\n
## Diagram: Client Retention Prediction Flow
### Overview
The image depicts a diagram illustrating a client retention prediction process. It shows how client data (labeled as "Label" and "Feature") is used as input to predict which clients will be retained. The diagram uses colored blocks to represent different client groups (A, B, and C) and arrows to indicate the flow of information.
### Components/Axes
The diagram consists of the following labeled components:
* **Label:** Located on the left vertical axis.
* **Feature:** Located on the left vertical axis, below "Label".
* **User:** Located on the bottom horizontal axis.
* **Input:** A label within the diagram, indicating the data being fed into the prediction model.
* **Predict:** A label on the right side, indicating the output of the prediction model.
* **Client A retains:** A light green block.
* **Client B retains:** A dark blue block.
* **Client C retains:** A light green block.
There are no explicit axes scales or numerical values present in the diagram.
### Detailed Analysis or Content Details
The diagram shows three client groups: A, B, and C. The retention status of each client is indicated by the text within the colored blocks.
* **Client A retains:** Represented by a light green block at the top.
* **Client B retains:** Represented by a dark blue block in the center.
* **Client C retains:** Represented by a light green block at the bottom.
An arrow points from the right side of the diagram towards the "Input" label, and then towards the "Client B retains" block. This suggests that the input data is used to predict the retention status of Client B. The "Predict" component, located on the right side, contains an icon of a brain with gears, symbolizing the prediction process.
The entire set of blocks (Client A, B, and C) is enclosed within a dashed black border, suggesting they represent the core data used for prediction.
### Key Observations
* Clients A and C are both labeled as "retains" and are represented by the same color (light green).
* Client B is labeled as "retains" but is represented by a different color (dark blue).
* The arrow indicates a flow of information *to* Client B, suggesting it is the focus of the prediction.
* The diagram does not provide any quantitative data or probabilities related to client retention.
### Interpretation
The diagram illustrates a simplified model for predicting client retention. It suggests that client data, represented by "Label" and "Feature", is used as input to a prediction model ("Predict"). The model then outputs a prediction regarding whether a specific client (in this case, Client B) will be retained. The use of different colors for Client B compared to Clients A and C might indicate that Client B has unique characteristics or a different retention risk profile.
The diagram is conceptual and does not provide details about the prediction algorithm or the specific features used for prediction. It serves as a high-level overview of the client retention prediction process. The diagram implies a supervised learning approach, where the model learns from labeled data (clients who have already been retained or not) to predict the retention status of new clients. The absence of numerical data suggests that the diagram is intended to convey the overall process rather than specific results.
</details>
(b) Vertical federated learning.
<details>
<summary>extracted/5379099/fig/FTL_structure.png Details</summary>
### Visual Description
\n
## Diagram: Federated Learning Data Partitioning
### Overview
This diagram illustrates a data partitioning scheme used in Federated Learning, specifically showing how data is retained by different clients (Client A and Client B) and the concept of a "common part" of the data. The diagram depicts the flow of data from the clients to a prediction model.
### Components/Axes
The diagram is structured around three main labels: "Label" (vertical axis on the left), "Feature" (vertical axis in the center), and "User" (horizontal axis at the bottom). There is also an "Input" label on the right side, leading to a "Predict" component. The diagram contains three rectangular blocks representing data retained by "Client A", "Client B", and the "Common part". Arrows indicate the flow of data.
### Detailed Analysis or Content Details
The diagram shows three overlapping rectangular areas:
* **Client A retains:** A large, light green rectangle positioned at the bottom-left of the diagram. The text "Client A retains" is written inside. A curved arrow originates from the bottom of this rectangle and points towards the "Client B retains" rectangle.
* **Client B retains:** A large, dark blue rectangle positioned in the center of the diagram. The text "Client B retains" is written inside. An arrow originates from this rectangle and points towards the "Predict" component on the right.
* **Common part:** A smaller, light green rectangle positioned above "Client A retains". The text "Common part" is written inside. An arrow originates from this rectangle and points towards the "Client B retains" rectangle.
The "Predict" component is represented by a stylized human head with gears inside, indicating a machine learning model. The "Input" label is positioned to the right of the "Client B retains" rectangle, with a dashed vertical line separating the data partitioning area from the prediction component.
### Key Observations
The diagram highlights that Client A and Client B each retain a portion of the data, and there is a "Common part" that is shared between them. The curved arrow suggests a potential data transfer or relationship between the data retained by Client A and Client B. The flow of data from both clients ultimately leads to the "Predict" component, indicating that both clients contribute to the prediction model.
### Interpretation
This diagram illustrates a core concept in Federated Learning: decentralized data. Instead of centralizing all data in one location, the data is distributed across multiple clients (A and B). Each client retains its own data, but there's also a common subset. The model is trained on these distributed datasets without directly exchanging the data itself. The "Predict" component represents the global model that benefits from the combined knowledge of all clients. The curved arrow between Client A and Client B could represent a process of model aggregation or parameter sharing, a key step in Federated Learning. The diagram emphasizes the privacy-preserving nature of Federated Learning, as the raw data remains on the clients' devices. The diagram does not provide any quantitative data, but rather a conceptual overview of the data partitioning process.
</details>
(c) Federated transfer learning.
Figure 1: Categorization of federated learning based on data structure owned by clients.
### II-A Horizontal Federated Learning
HFL is the most common federated learning category which was first introduced by Google [3]. The goal of HFL is for each client holding different samples to collaboratively improve the accuracy of a model with a common structure.
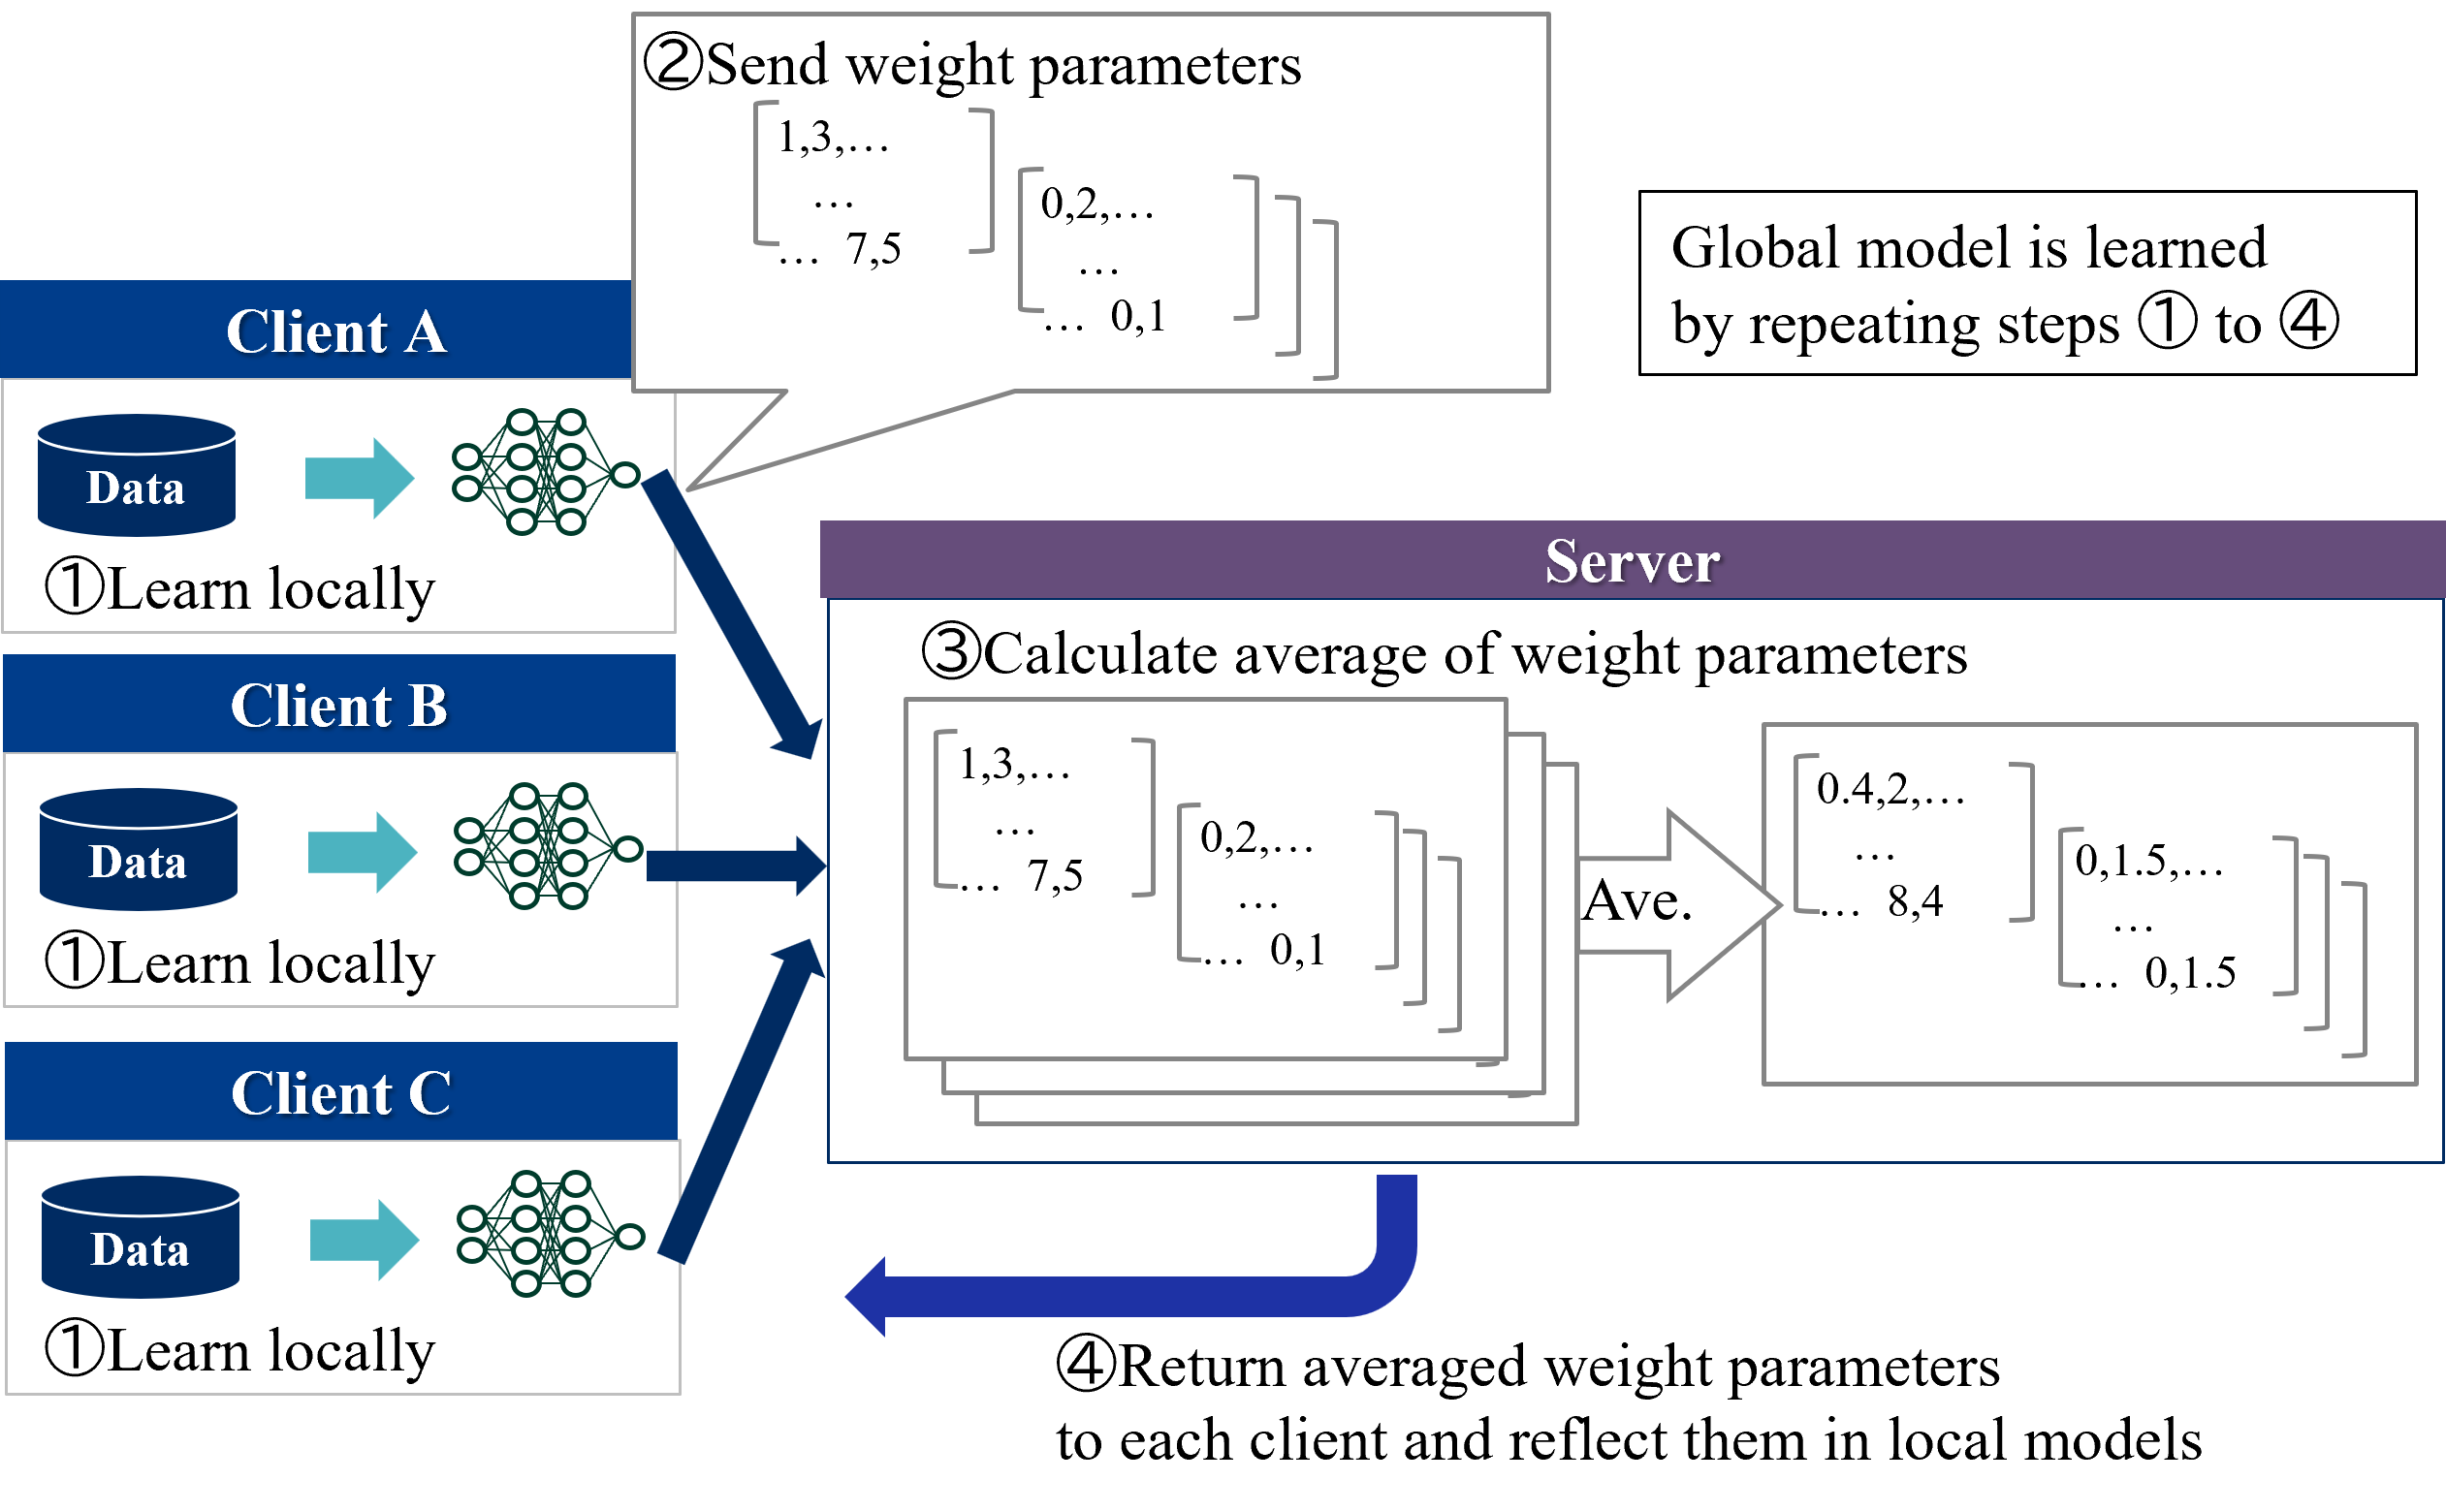
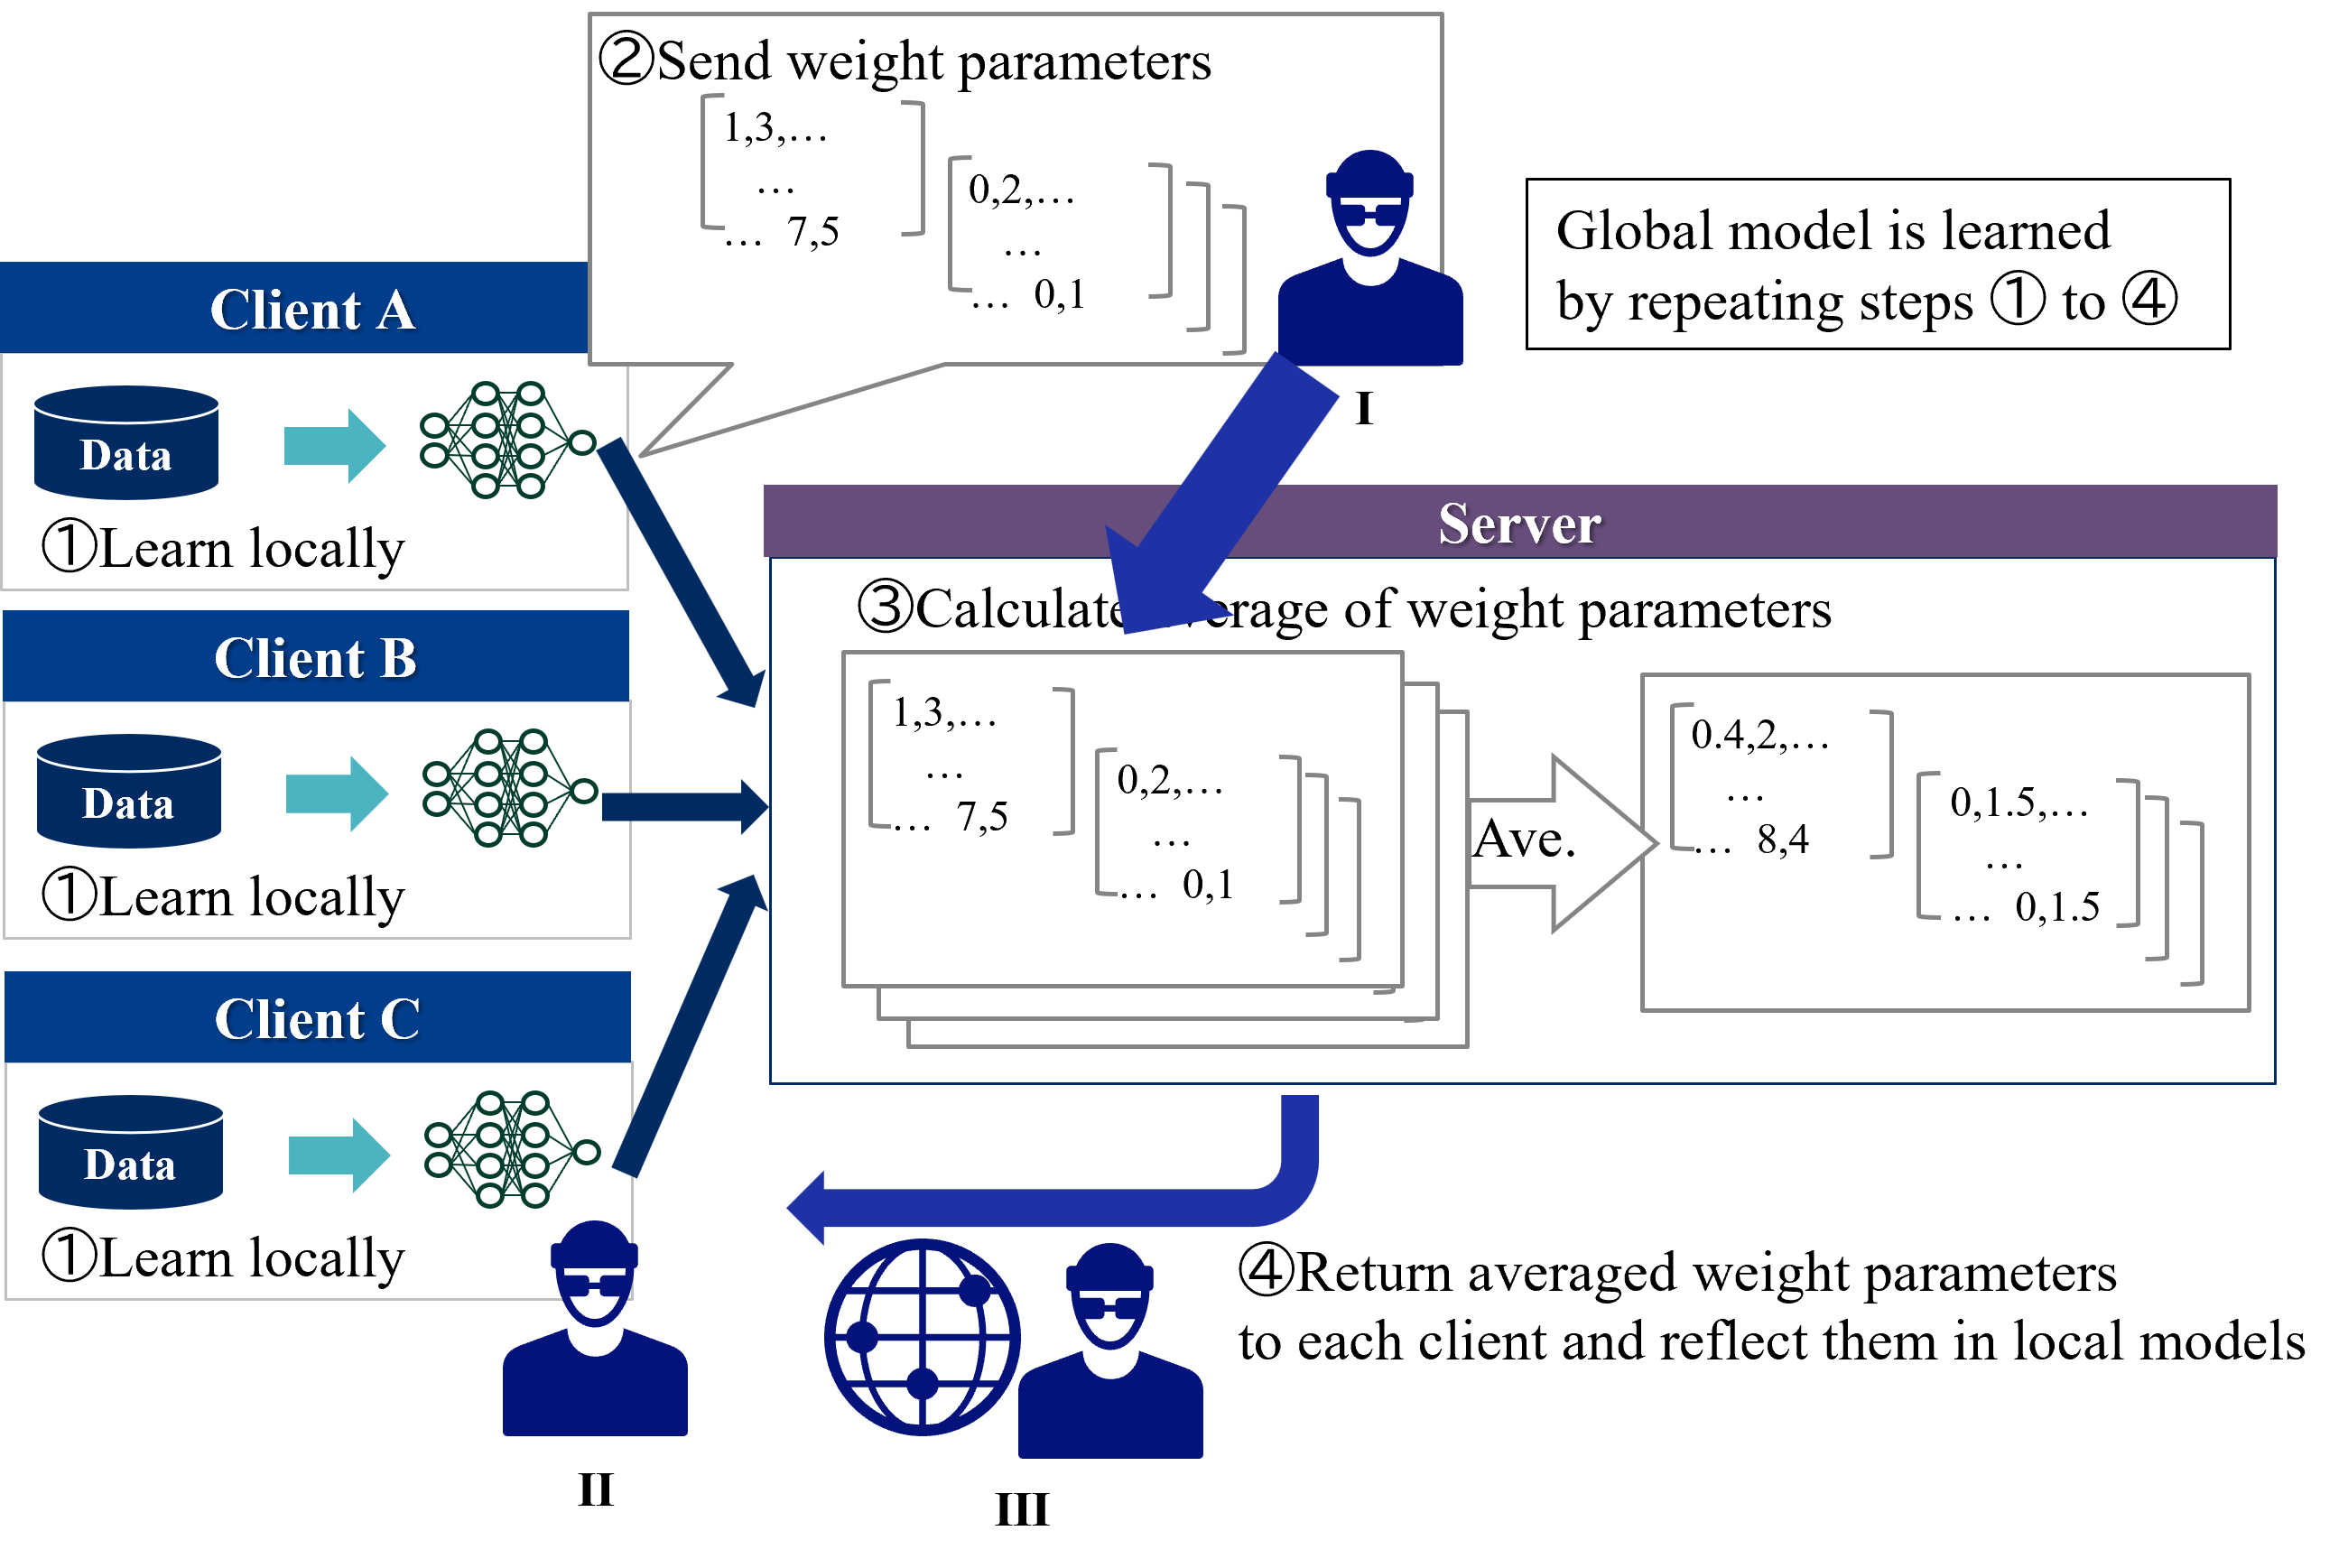
Figure 2 shows an overview of the HFL learning protocol. Two types of entities participate in learning of HFL:
1. Server - Coordinator. Server exchanges model parameters with the clients and aggregates model parameters received from the clients.
1. Clients - Data owners. Each client locally trains a model using their own private data and exchanges model parameters with the server.
Each clients first trains a local model for a few steps and sends the model parameters to the server. Next, the server updates a global model by aggregating (in standard methods such as FedAvg, simply averaging) the local models and sends it to all clients. This process is repeated until the convergence. During inference time, each client separately predicts the label using a global model and its own features.
The protocol described above is called centralized HFL because it requires a trusted third party, a central server. On the other hand, decentralized HFL, which eliminates the need for a central server, has emerged in recent years [4]. In decentralized HFL, clients directly communicates with each other, resulting in communication resource savings. There are various possible methods of communication between clients [4]. For example, the most common method for HFL of gradient boosting decision trees is for each client to add trees to the global model by sequence [5, 6, 7].
<details>
<summary>extracted/5379099/fig/LM_HFL.png Details</summary>
### Visual Description
\n
## Diagram: Federated Learning Process
### Overview
This diagram illustrates the process of Federated Learning, where a global model is trained across multiple clients without directly exchanging data. The diagram depicts three clients (A, B, and C) learning locally from their respective data and then communicating weight parameters to a central server for aggregation. The server then returns the averaged weight parameters to the clients, updating their local models. This process is repeated iteratively to improve the global model.
### Components/Axes
The diagram consists of three client nodes (A, B, C) and a central server node. Each client node contains a "Data" block and a "Learn locally" process represented by a neural network icon. Arrows indicate the flow of data and weight parameters. The diagram is numbered 1-4 to indicate the sequence of steps.
### Detailed Analysis or Content Details
**Step 1: Learn Locally**
- Each client (A, B, C) has a "Data" block, which is the input for local learning.
- Each client uses a neural network to "Learn locally" from its data. The neural network is represented by interconnected nodes.
**Step 2: Send Weight Parameters**
- Client A sends weight parameters represented as a matrix: `[1,3,... ... 7,5]`, `[0,2,... ... 0,1]`.
- Client B sends weight parameters represented as a matrix: `[1,3,... ... 7,5]`, `[0,2,... ... 0,1]`.
- Client C sends weight parameters represented as a matrix: `[1,3,... ... 7,5]`, `[0,2,... ... 0,1]`.
- These weight parameters are sent to the server.
**Step 3: Calculate Average of Weight Parameters**
- The server receives weight parameters from all clients.
- The server calculates the average of these parameters.
- The server displays the averaged weight parameters as matrices: `[0,4,2,... ... 8,4]`, `[0,1,5,... ... 0,1,5]`.
- The "Ave." label is placed within the averaging process.
**Step 4: Return Averaged Weight Parameters**
- The server returns the averaged weight parameters to each client.
- The clients update their local models based on the received parameters.
- The curved arrow indicates the return flow of averaged parameters.
**Global Model Learning:**
- A text box on the top-right states: "Global model is learned by repeating steps ① to ④".
### Key Observations
- All clients initially send the same weight parameter matrices.
- The server averages these identical matrices, resulting in an averaged matrix with similar structure.
- The diagram emphasizes the iterative nature of the Federated Learning process.
- The diagram does not provide specific numerical values for the weight parameters beyond the examples given.
### Interpretation
The diagram demonstrates the core principle of Federated Learning: decentralized model training. Each client maintains control over its data, and only model updates (weight parameters) are shared with the server. This approach addresses privacy concerns and enables learning from distributed datasets. The iterative process of local learning and global aggregation allows the model to converge towards a shared understanding without compromising data confidentiality. The repetition of steps 1-4 suggests a continuous improvement cycle, where the global model gradually refines its performance based on the collective knowledge of all clients. The identical initial weight parameters sent by each client may indicate a starting point for the learning process, or a pre-trained model being fine-tuned. The diagram is a conceptual illustration and does not detail the specific algorithms or techniques used for local learning or parameter averaging.
</details>
Figure 2: Overview of the HFL learning protocol.
### II-B Vertical Federated Learning
VFL enables clients holding the different features of the same samples to collaboratively train a model which takes all of the various features each client has as input. There are VFL studies to deal with various models including linear/logistic regression [8, 9, 10, 11, 12], decision trees [13, 14, 15, 16, 17], neural networks [18, 19, 20, 21], and other non-linear models [22, 23].
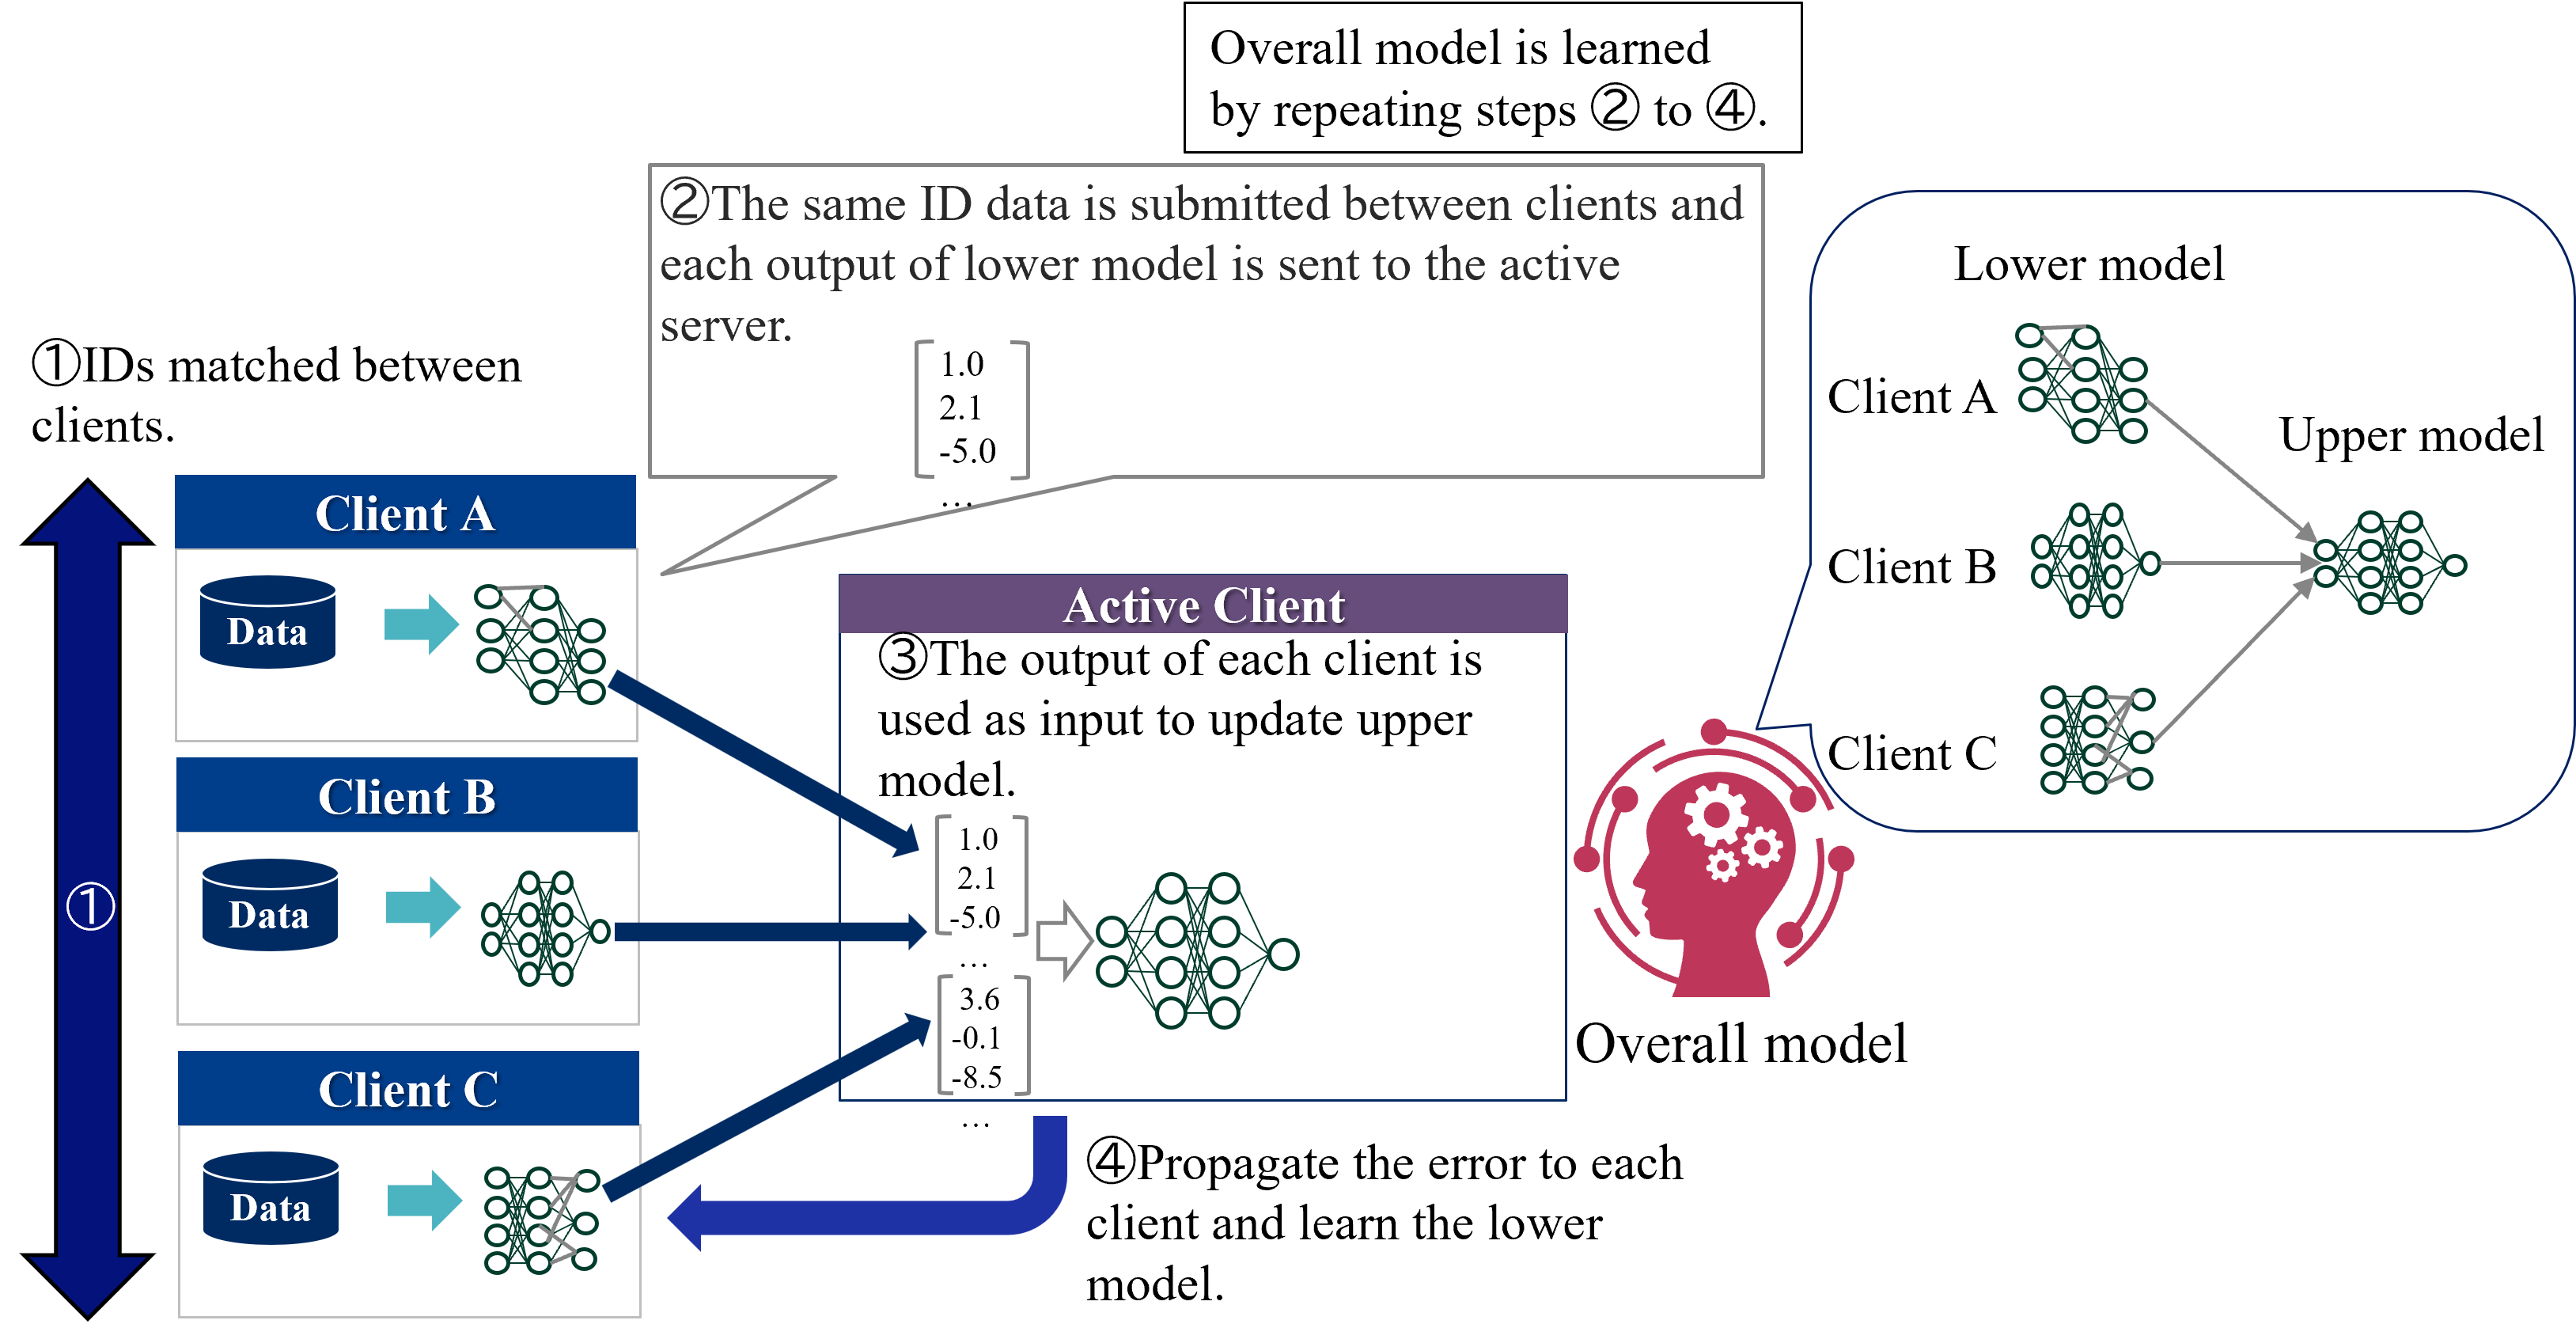
Figure 3 shows an overview of the standard VFL learning protocol. In VFL, only one client holds labels and it plays the role of a server. Therefore, two types of entities participate in learning of VFL:
1. Active client - Features and labels owner. Active client coordinates the learning procedure. It calculates the loss and exchanges intermediate results with the passive clients.
1. Passive clients - Features owners. Each passive client keeps both its features and model local but exchanges intermediate results with the active client.
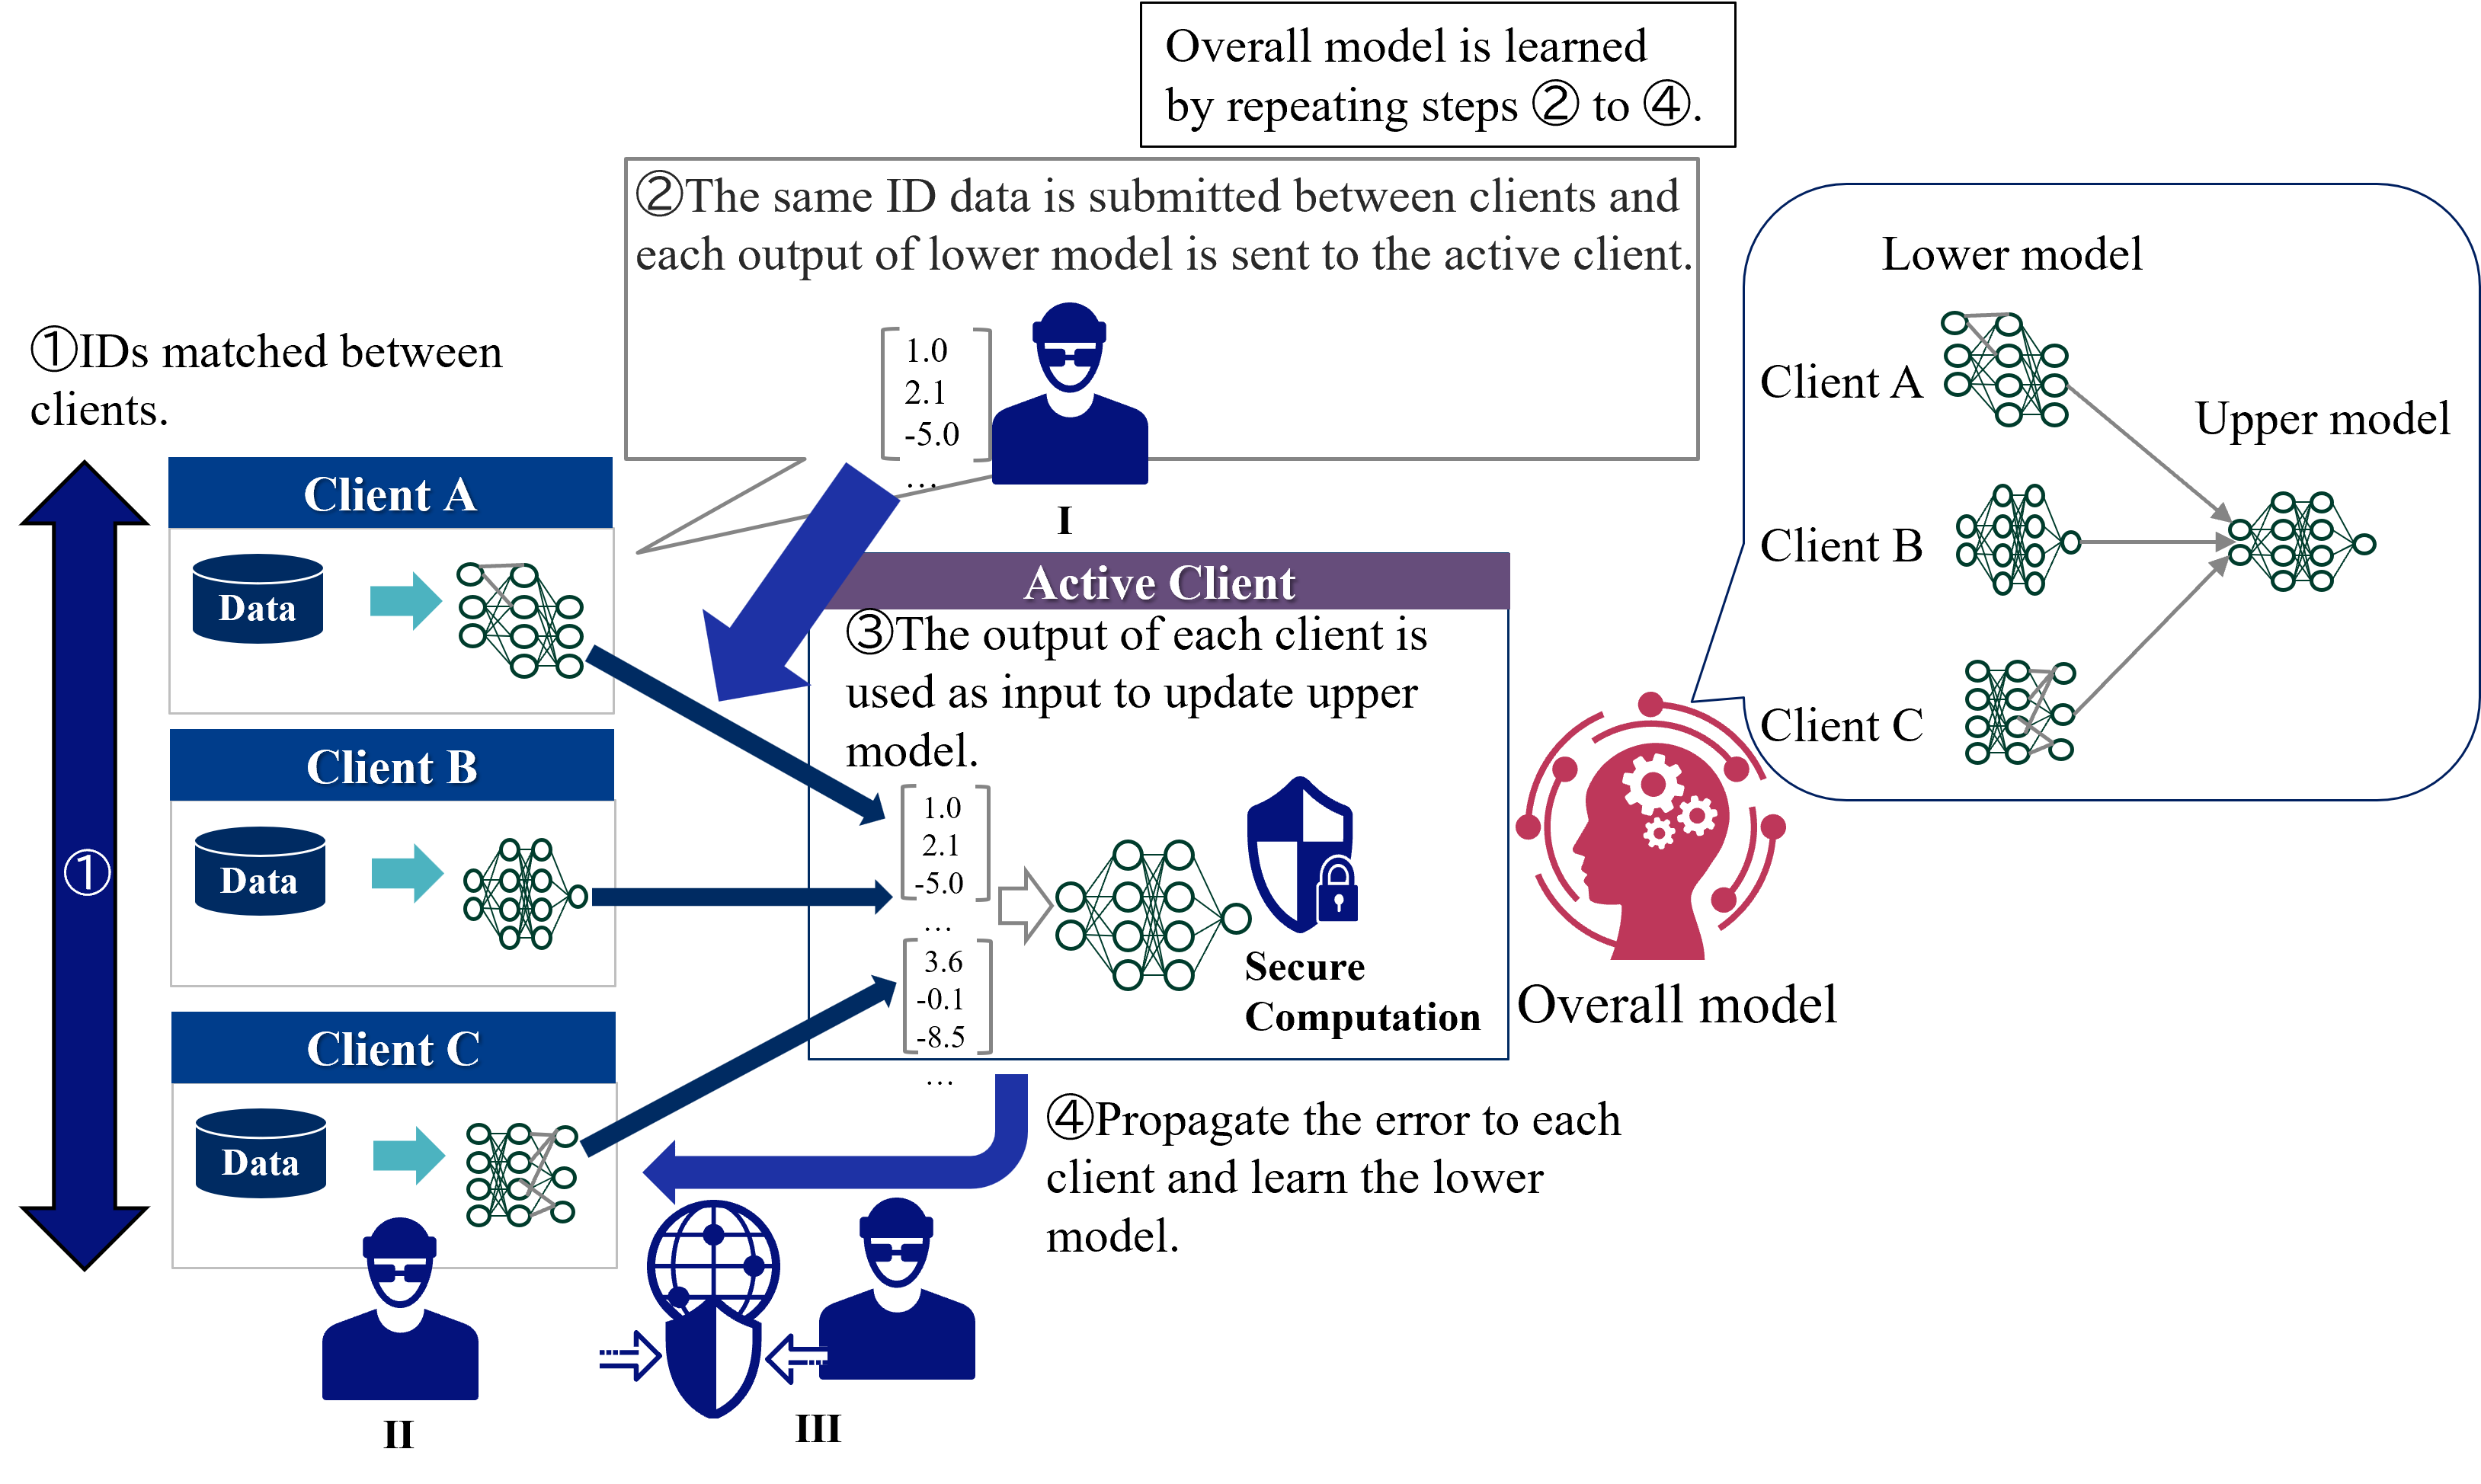
VFL consists of two phases: IDs matching and learning phases. In IDs matching phases, all clients shares the common sample IDs. In learning phase, each client has a separate model with its own features as input, and the passive clients send the computed intermediate outputs to the active client. The active client calculates the loss based on the aggregated intermediate outputs and sends the gradients to all passive clients. Then, the passive clients updates its own model parameters. This process is repeated until the convergence. During inference time, all clients need to cooperate to predict the label of a sample.
<details>
<summary>extracted/5379099/fig/LM_VFL.png Details</summary>
### Visual Description
\n
## Diagram: Federated Learning Process
### Overview
This diagram illustrates a federated learning process involving multiple clients (A, B, and C) and a central server. The process involves iterative steps of data submission, model updating, and error propagation to learn an overall model without directly sharing the raw data. The diagram depicts the flow of information and model updates between clients and the server.
### Components/Axes
The diagram consists of the following key components:
* **Clients (A, B, C):** Represent individual devices or entities holding local data. Each client has a "Data" input and a local model represented by interconnected nodes.
* **Active Client:** A designated client responsible for receiving and processing model updates.
* **Server:** A central entity coordinating the learning process.
* **Lower Model:** A client-specific model.
* **Upper Model:** A global model aggregated from client models.
* **Overall Model:** The final learned model.
* **Arrows:** Indicate the flow of data and model updates.
* **Numbered Steps (①, ②, ③, ④):** Describe the sequence of operations in the federated learning process.
### Detailed Analysis or Content Details
The diagram outlines a four-step process:
**① IDs matched between clients.**
This step is represented by bidirectional purple arrows connecting Clients A, B, and C. It indicates that the clients are synchronized based on their IDs.
**② The same ID data is submitted between clients and each output of lower model is sent to the active server.**
This step shows data flowing from Clients A, B, and C to the "Active Client". The Active Client displays a data block labeled "Data" and a local model. The output of the lower model is represented by a bracketed list of numerical values:
* 1.0
* 2.1
* -5.0
* ... (indicating more values are present but not shown)
**③ The output of each client is used as input to update upper model.**
This step shows the output from the Active Client being used to update the "Upper Model". The Upper Model is connected to Clients A, B, and C. The Active Client displays a data block labeled "Data" and a local model. The output of the lower model is represented by a bracketed list of numerical values:
* 1.0
* 2.1
* -5.0
* 3.6
* -0.1
* -8.5
* ... (indicating more values are present but not shown)
**④ Propagate the error to each client and learn the lower model.**
This step shows the error being propagated back to each client (A, B, and C) to update their respective "Lower Models". A gear icon is placed between the "Overall Model" and the clients, suggesting a mechanism for error propagation and model learning.
The right side of the diagram shows the relationship between the "Lower Model" and the "Upper Model" for each client (A, B, and C). The "Lower Model" is represented by interconnected nodes, and the "Upper Model" is a larger network of interconnected nodes that aggregates the information from the lower models.
### Key Observations
* The process is iterative, as indicated by the statement "Overall model is learned by repeating steps ② to ④."
* The diagram emphasizes the decentralized nature of federated learning, where clients contribute to the learning process without sharing their raw data.
* The numerical values provided in steps ② and ③ suggest that the models are producing numerical outputs, potentially representing predictions or feature representations.
* The gear icon in step ④ suggests a gradient descent or similar optimization algorithm is used to update the lower models.
### Interpretation
The diagram illustrates the core principles of federated learning. The process aims to build a robust "Overall Model" by leveraging data from multiple clients while preserving data privacy. The iterative steps of data submission, model updating, and error propagation allow the model to learn from distributed data sources without requiring centralized data storage. The use of "Lower Models" and "Upper Models" suggests a hierarchical approach to model aggregation, where client-specific models are combined to form a global model. The numerical values in steps ② and ③ likely represent the outputs of the models, which are used to calculate the error and update the models in subsequent iterations. The diagram highlights the importance of synchronization between clients (step ①) to ensure that the learning process is consistent and effective. The overall process is designed to improve model performance while addressing privacy concerns associated with traditional centralized machine learning approaches.
</details>
Figure 3: Overview of the standard VFL learning protocol.
### II-C Federated Transfer Learning
FTL assumes two clients that shares only a small portion of samples or features. The goal of FTL is to create a model that can predict labels on the client that does not possess labels (target client), by transferring the knowledge of the other client that does possess labels (source client) to the target client.
Figure 4 shows an overall of the FTL learning protocol. As noted above, two types of entities participate in FTL:
1. Source client - Features and labels owner. Source client exchanges intermediate results such as outputs and gradients with the target client and calculates the loss.
1. Target client - Features owners. Target client exchanges intermediate results with the source client.
In FTL, two clients exchange intermediate outputs to learn a common representation. The source client uses the labeled data to compute the loss and sends the gradient to the target client, which updates the target client’s representation. This process is repeated until the convergence. During inference time, the target client predicts the label of a sample using its own model and features.
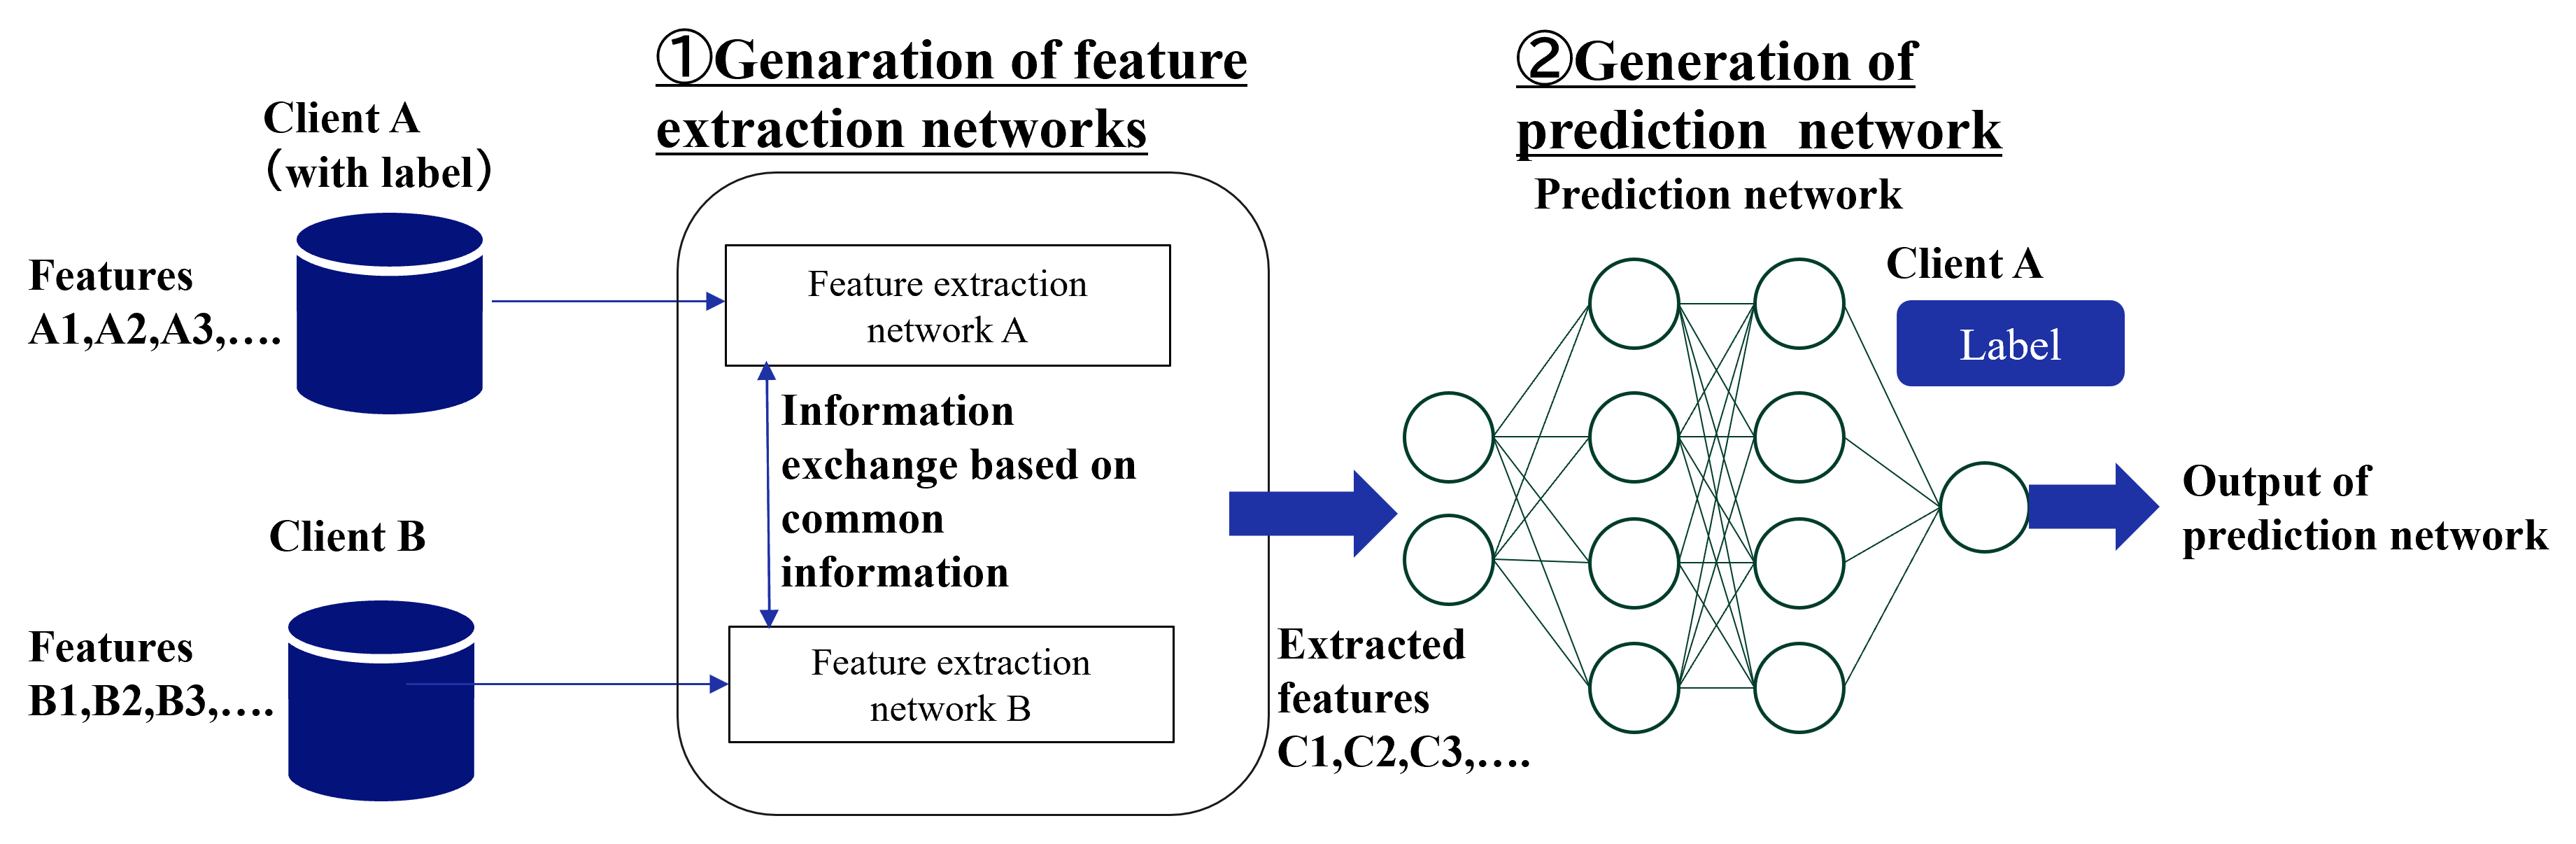
The detail of the learning protocol varies depending on the specific method. Although only a limited number of FTL methods have been proposed, we introduce three major types of methods. FTL requires some supplementary information to bridge two clients, such as common IDs [24, 25, 26, 27], common features [28, 29], and labels of target client [30, 31].
#### II-C 1 Common IDs
Most FTL methods assumes the existence of the common ID’s samples between two clients. This type of FTL requires ID matching before the learning phase as with VFL. Liu et al. [24] proposed the first FTL protocol, which learns feature transformation functions so that the different features of the common samples are mapped into the same features. The following work by Sharma et al. [25] improved communication overhead of the first FTL using multi-party computation and enhanced the security by incorporating malicious clients. Gao et al. [27] proposed a dual learning framework in which two clients impute each other’s missing features by exchanging the outputs of the imputation models for the common samples.
#### II-C 2 Common features
In real-world applications, it is difficult to share samples with the same IDs. Therefore, Gao et al. [28] proposed a method to realize FTL by assuming common features instead of common samples. In that method, two clients mutually reconstruct the missing features by using exchanged feature mapping models. Then,using all features, the clients conduct HFL to obtain a label prediction model. In the original paper, the authors assumes that all clients posses labels, but this method is applicable to the target client that does not posses labels because the source client can learn the label prediction model only by itself. Mori et al. [29] proposed a method for neural networks in which each client incorporates its own unique features in addition to common features into HFL training. However, their method is based on HFL and cannot be applied to the target clients that does not possess labels.
#### II-C 3 Labels of target client
This type of methods assumes neither common IDs nor features, but instead assumes that all clients possess labels, allowing a common representation to be learned across clients. Since it is based on HFL, the participating entities are the same as in HFL. Gao et al. [30] learns a common representation by exchanging the intermediate outputs with the server and reducing maximum mean discrepancy loss. Rakotomamonjy et al. [31] proposed a method to learn a common representation by using Wasserstein distance for intermediate outputs, which enables that the clients only need to exchange statistical information such as mean and variance with the server.
<details>
<summary>extracted/5379099/fig/LM_FTL.png Details</summary>
### Visual Description
\n
## Diagram: Federated Learning System Architecture
### Overview
The image depicts a diagram illustrating a federated learning system architecture, specifically focusing on the generation of feature extraction networks and a prediction network. It shows two clients (A and B) contributing data and how information is exchanged to build these networks. The diagram is divided into two main sections, labeled "①Generation of feature extraction networks" and "②Generation of prediction network".
### Components/Axes
The diagram consists of the following components:
* **Clients:** Client A (with label) and Client B.
* **Data Storage:** Cylinders representing data storage for each client, labeled with "Features" and specific feature identifiers (A1, A2, A3,... for Client A and B1, B2, B3,... for Client B).
* **Feature Extraction Networks:** "Feature extraction network A" and "Feature extraction network B".
* **Information Exchange:** An arrow indicating "Information exchange based on common information" between the feature extraction networks.
* **Prediction Network:** A multi-layered neural network.
* **Extracted Features:** Labeled as "Extracted features C1, C2, C3,...".
* **Labels:** "Label" associated with Client A, and "Output of prediction network".
### Detailed Analysis or Content Details
**Section ①: Generation of feature extraction networks**
* Client A possesses data with features labeled A1, A2, A3, and continuing (indicated by "...").
* Client B possesses data with features labeled B1, B2, B3, and continuing (indicated by "...").
* Each client has a corresponding feature extraction network (Network A for Client A, Network B for Client B).
* There is a bidirectional arrow between the two feature extraction networks, labeled "Information exchange based on common information". This suggests a collaborative process where the networks share information to improve feature extraction.
**Section ②: Generation of prediction network**
* A prediction network is depicted as a multi-layered neural network with approximately 6 layers.
* The input to the prediction network is "Extracted features C1, C2, C3,...".
* Client A's "Label" is shown as an input to the prediction network.
* The output of the prediction network is labeled "Output of prediction network".
* The prediction network has connections between layers, indicating data flow.
### Key Observations
* The diagram highlights a federated learning approach where models are trained on decentralized data.
* The information exchange between feature extraction networks suggests a form of knowledge distillation or model aggregation.
* The prediction network utilizes extracted features and client labels to generate an output.
* The diagram does not provide specific numerical data or performance metrics. It is a conceptual illustration of the system architecture.
### Interpretation
The diagram illustrates a federated learning system where multiple clients contribute to the training of a global model without directly sharing their raw data. Clients A and B each have their own data and feature extraction networks. These networks exchange information to improve feature representation. The extracted features are then used by a central prediction network, along with client labels, to generate predictions. This approach preserves data privacy while leveraging the collective knowledge of multiple clients. The diagram emphasizes the collaborative nature of federated learning and the importance of feature extraction in achieving accurate predictions. The lack of specific data points suggests this is a high-level architectural overview rather than a performance analysis.
</details>
Figure 4: Overall of the FTL learning protocol.
## III Threats to Privacy in Each Federated Learning
In this section, we describe threats to privacy in each federated learning. Table I shows threads to privacy addressed in each federated learning. An inference attack uses data analysis to gather unauthorized information about a subject or database. If an attacker can confidently estimate the true value of a subject’s confidential information, it can be said to have been leaked. The most frequent variants of this approach are membership inference and feature [32]. In addition, we address privacy threats of label inference and ID leakage.
TABLE I: Threads to privacy addressed in each federated learning
| HFL VFL FTL (common features) | Low or above Already known Low | Already known Low or above Low or above | None Low or above Low or above | None High None |
| --- | --- | --- | --- | --- |
| FTL (common IDs) | Low | Low or above | Low or above | High |
### III-A Horizontal Federated Learning
In HFL, client data is a major threat to privacy. Figure 5 shows threats to privacy in HFL. Possible attackers are as follows:
1. Server: Inference attack against the model to infer client data.
1. Clients: Inference attack against the global model received from the server to infer other clients’ data.
1. Third party: Eavesdrop on models that pass through the communication channel and infer client data through inference attacks.
<details>
<summary>extracted/5379099/fig/TP_HFL.png Details</summary>
### Visual Description
\n
## Diagram: Federated Learning Process
### Overview
This diagram illustrates the process of Federated Learning, where a global model is trained across multiple clients without directly exchanging data. The diagram depicts three clients (A, B, and C) learning locally from their respective data and then communicating weight parameters to a central server for aggregation. The server then returns the averaged weight parameters to the clients, updating their local models. This process is repeated iteratively to improve the global model.
### Components/Axes
The diagram consists of three client nodes (Client A, Client B, Client C), a central server node, and directional arrows indicating the flow of information. Each client has a "Data" input and a "Learn locally" process represented by a brain icon. The server has a "Calculate average of weight parameters" process and a "Return averaged weight parameters" process. Numbered steps (①, ②, ③, ④) guide the process flow. There are also three user icons labeled I, II, and III.
### Detailed Analysis or Content Details
The diagram shows the following steps:
**① Learn locally:** Each client (A, B, and C) independently learns from its local data. This is represented by the "Data" input and the brain icon.
**② Send weight parameters:** Each client sends its learned weight parameters to the server. The weight parameters are represented as matrices:
* Client A: `[1,3,... 7,5 ... 0,2,... 0,1]`
* Client B: `[1,3,... 7,5 ... 0,2,... 0,1]`
* Client C: `[1,3,... 7,5 ... 0,2,... 0,1]`
**③ Calculate average of weight parameters:** The server calculates the average of the received weight parameters. The averaged weight parameters are represented as matrices:
* Averaged: `[0.4,2,... 8,4 ... 0,1,5,... 0,1,5]`
**④ Return averaged weight parameters:** The server returns the averaged weight parameters to each client, which updates their local models.
The diagram also shows a global model being learned by repeating steps ① to ④.
The user icons represent:
* I: Located on the server, near the "Global model is learned" text.
* II: Located near the bottom-left, connected to Client C.
* III: Located near the bottom-right, connected to the server.
### Key Observations
The weight parameter matrices for Clients A, B, and C are identical before averaging. This suggests that the initial models or data distributions might be similar. The averaged weight parameters show changes in values (e.g., from 7.5 to 8.4, and 0.1 to 0.15), indicating the impact of aggregation. The diagram emphasizes the decentralized nature of the learning process, with data remaining on the client devices.
### Interpretation
This diagram illustrates the core concept of Federated Learning, a privacy-preserving machine learning technique. By keeping the data localized on each client and only sharing model updates (weight parameters), the risk of data breaches and privacy violations is reduced. The server acts as a central coordinator, aggregating the knowledge learned by each client to build a more robust global model. The iterative process of local learning and global aggregation allows the model to improve over time without compromising data privacy. The identical initial weight parameters suggest a potential starting point for the learning process, and the changes observed in the averaged parameters demonstrate the effect of combining knowledge from multiple sources. The user icons likely represent the individuals or entities involved in the process – the clients and the server administrator. The diagram is a simplified representation, and real-world Federated Learning systems often involve more complex mechanisms for handling data heterogeneity, communication constraints, and security considerations.
</details>
Figure 5: Threats to privacy in HFL.
### III-B Vertical Federated Learning
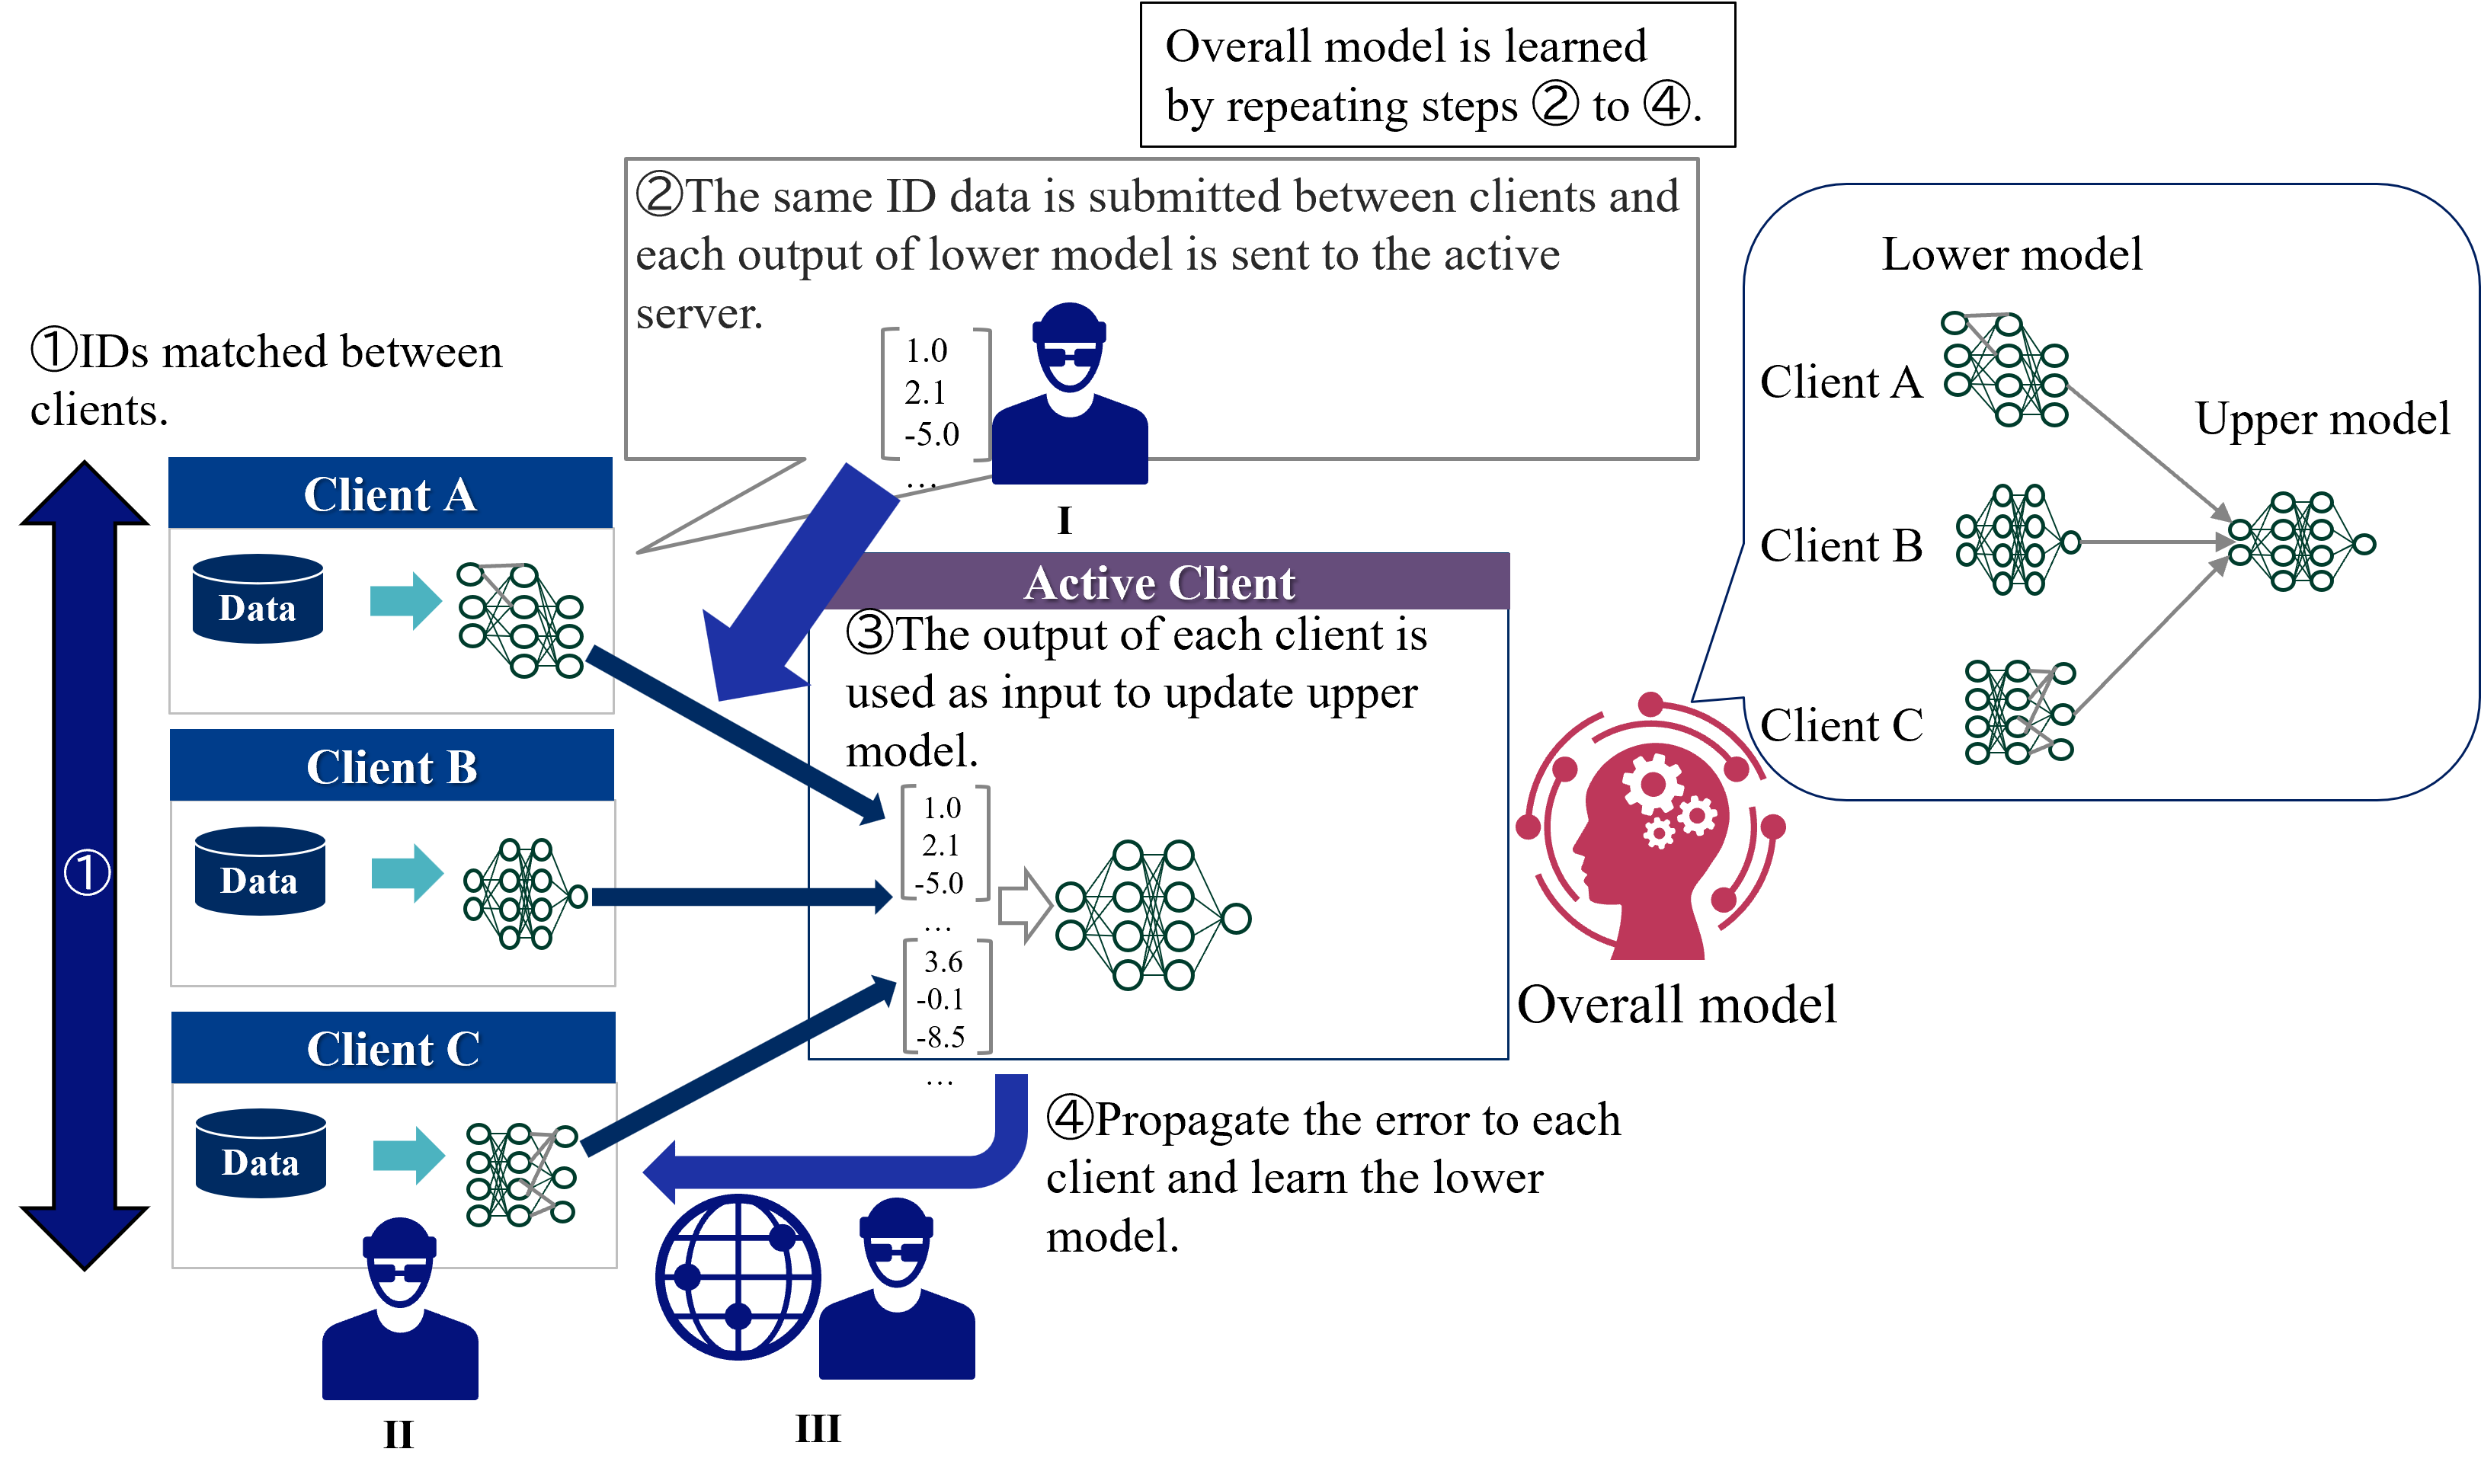
In VFL, a major threat to privacy is the leakage of identities due to identity matching between clients [33]. In addition to the leakage of identities, partial output from clients is also a threat. In case of ID matching, in order to create a single model for the overall system, it is necessary to match IDs that are common to each client’s data. This will reveal the presence of the same user to other clients. Figure 6 shows threats to privacy in VFL in case of partial output from clients, and possible attackers are as follows:
1. Active client: Inference attack against the output of lower model to infer client data.
1. Passive Clients: Inference attack against the output of upper model received from the active client to infer other clients’ data.
1. Third party: Eavesdrop on outputs that pass through the communication channel and infer client data through inference attacks.
<details>
<summary>extracted/5379099/fig/TP_VFL.png Details</summary>
### Visual Description
\n
## Diagram: Federated Learning Process
### Overview
This diagram illustrates a federated learning process involving multiple clients (A, B, and C) and an active server. The process involves data sharing, model updates, and error propagation to learn an overall model without directly sharing the raw data. The diagram is segmented into three main sections: Client Side (left), Server/Aggregation (center), and Model Architecture (right).
### Components/Axes
The diagram features the following components:
* **Clients:** Client A, Client B, Client C (represented as dark blue rectangles)
* **Active Client:** Represented by a figure with a globe (III)
* **Active Server:** Represented by a rectangle labeled "I"
* **Overall Model:** A larger interconnected network of nodes.
* **Lower Model:** Smaller interconnected networks of nodes, one for each client.
* **Upper Model:** A network of nodes that aggregates the lower models.
* **Data:** Represented as a rectangle within each client.
* **Arrows:** Indicate the flow of information and data.
* **Numbered Steps:** 1, 2, 3, 4, describing the process.
### Detailed Analysis or Content Details
The diagram outlines a four-step process:
**Step 1: IDs Matched Between Clients.**
* A large purple arrow indicates IDs are matched between clients.
**Step 2: Data Submission and Lower Model Output.**
* The same ID data is submitted between clients and each output of the lower model is sent to the active server (I).
* The active server (I) displays a data block with the following values:
* 1.0
* 2.1
* -5.0
**Step 3: Input to Update Upper Model.**
* The output of each client is used as input to update the upper model.
* The active client (III) displays a data block with the following values:
* 3.6
* -0.1
* -8.5
**Step 4: Error Propagation and Lower Model Learning.**
* The error is propagated to each client and used to learn the lower model.
**Model Architecture (Right Side):**
* **Client A, B, C:** Each client has a "Lower Model" (a network of nodes) and is connected to the "Upper Model".
* **Upper Model:** The upper model appears to aggregate the outputs from the lower models of each client.
* **Overall Model:** The overall model is learned by repeating steps 2 to 4.
### Key Observations
* The diagram emphasizes the decentralized nature of the learning process, with clients retaining their data locally.
* The active server acts as a central aggregator of model updates.
* The process is iterative, with repeated steps 2-4 refining the overall model.
* The data blocks within the active server and active client contain numerical values, suggesting some form of model parameters or gradients.
### Interpretation
This diagram depicts a federated learning system. Federated learning is a machine learning technique that trains an algorithm across multiple decentralized edge devices or servers holding local data samples, without exchanging them. This approach contrasts with traditional centralized machine learning where all the data is uploaded to one server.
The diagram highlights the key steps involved:
1. **Initialization:** Clients have local data and initial models.
2. **Local Training:** Each client trains its local model using its data.
3. **Aggregation:** The active server aggregates the model updates from the clients.
4. **Global Update:** The aggregated updates are used to improve the global model.
The numerical values within the server and active client blocks likely represent model weights, gradients, or other parameters used in the training process. The iterative nature of the process (repeating steps 2-4) suggests that the model is refined over time through multiple rounds of local training and global aggregation.
The use of an "active client" (III) suggests a potential mechanism for selecting a subset of clients to participate in each round of training, which can improve efficiency and scalability. The globe icon associated with the active client might indicate that clients are geographically distributed.
The diagram effectively communicates the core principles of federated learning, emphasizing data privacy, decentralized training, and iterative model refinement.
</details>
Figure 6: Threads to privacy in VFL.
### III-C Federated Transfer Learning
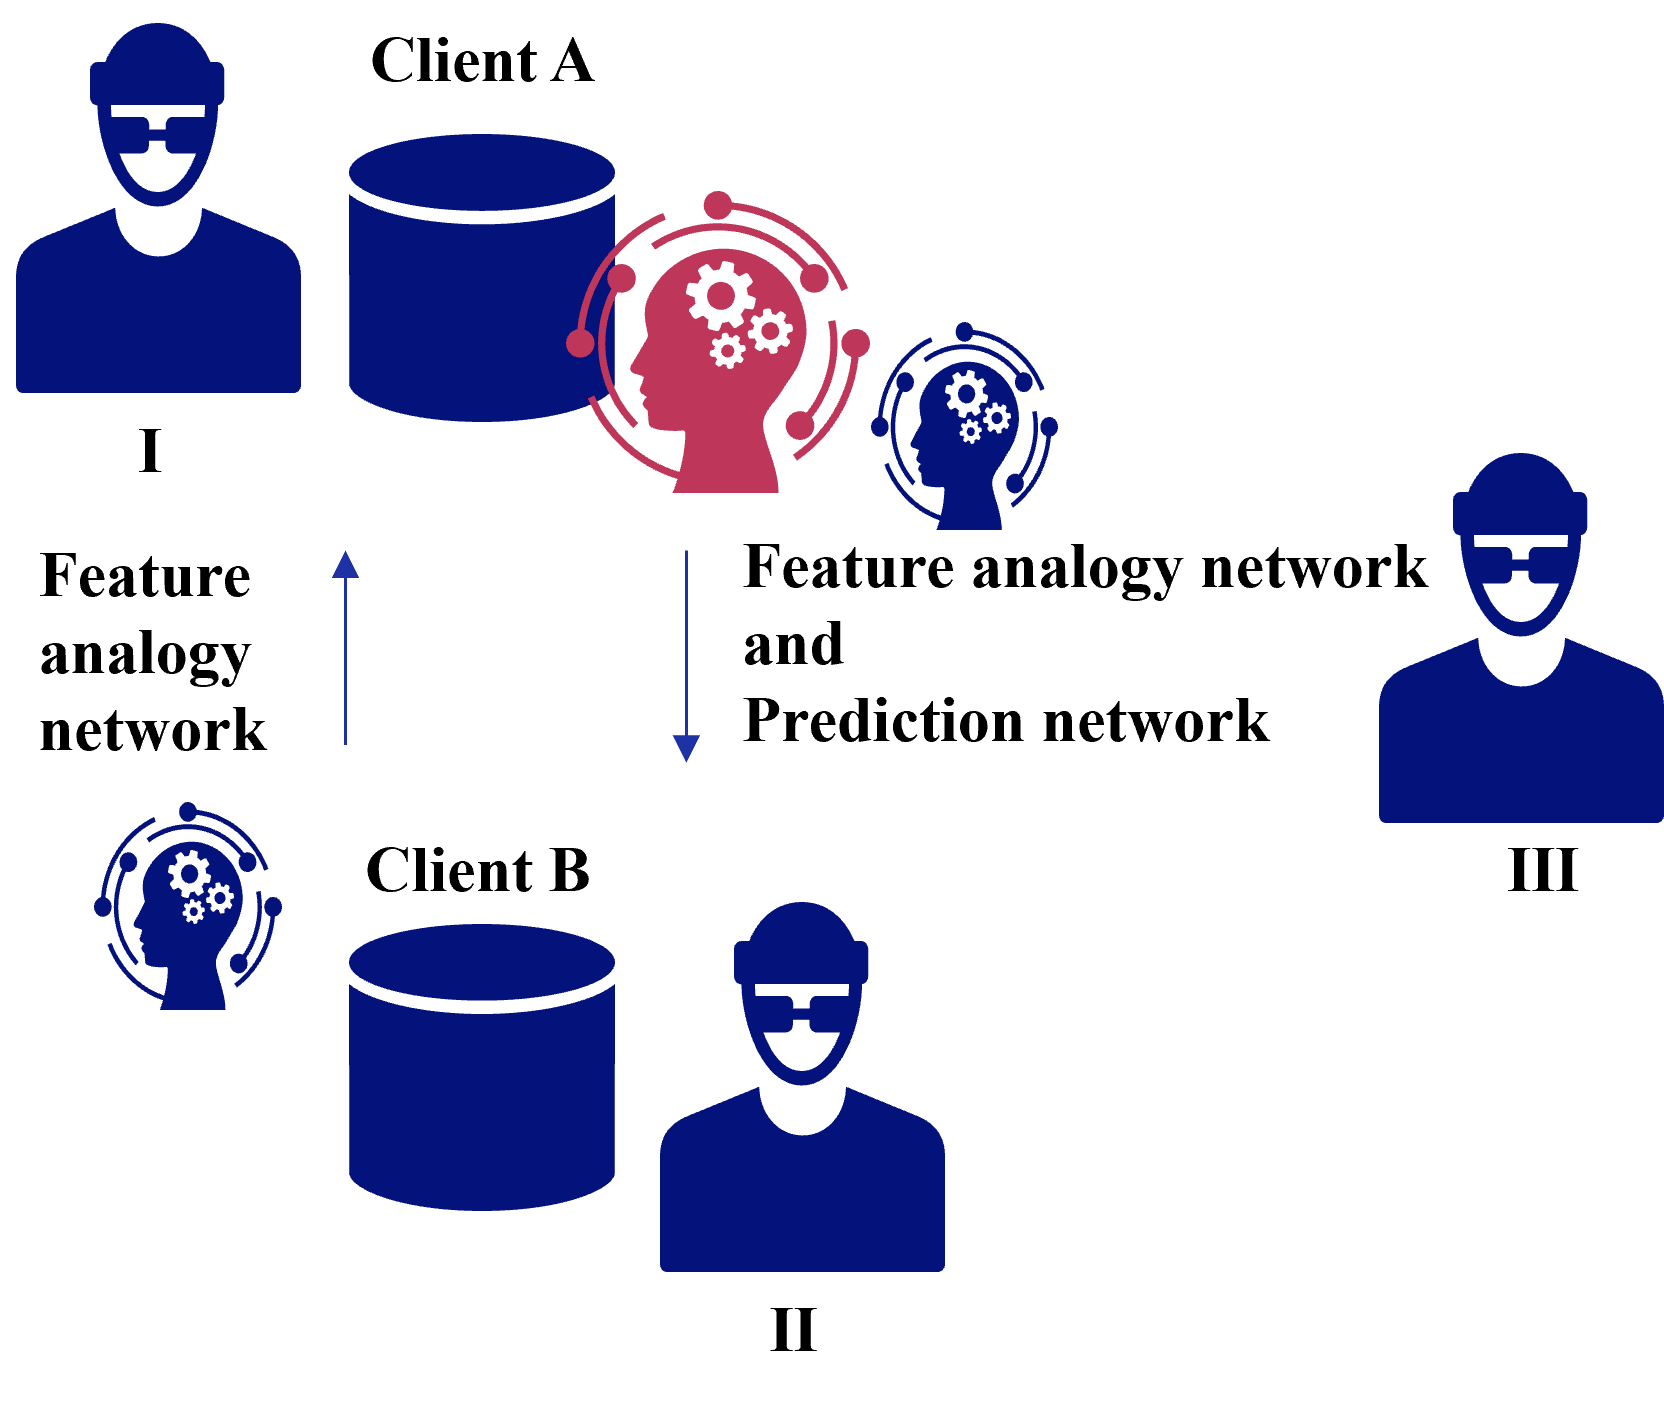
In federated transfer learning, threats to privacy vary depending on the information in common [24]. We explain the case when features are common and when IDs are common, respectively.
#### III-C 1 Common Features
Figure 7 shows threats to privacy in case of common features in FTL, and possible attackers are as follows:
1. Client receiving a feature analogy network: Inference attack against feature analogy network to infer client data.
1. Client receiving a feature analogy network and prediction network: Inference attack against feature analogy network and prediction network to infer client data.
1. Third party: Eavesdrop on feature analogy network and prediction network pass through the communication channel and infer client data through inference attacks.
<details>
<summary>extracted/5379099/fig/CFTP_FTL.png Details</summary>
### Visual Description
\n
## Diagram: Federated Learning System
### Overview
The image depicts a federated learning system involving two clients (Client A and Client B) and a central "Feature analogy network and Prediction network". The diagram illustrates the flow of data and model updates between the clients and the central network. It's a conceptual diagram, not a data-rich chart.
### Components/Axes
The diagram consists of the following components:
* **Client A:** Represented by a head-and-shoulders silhouette and a dark blue cylinder labeled "Client A".
* **Client B:** Represented by a head-and-shoulders silhouette and a dark blue cylinder labeled "Client B".
* **Feature analogy network and Prediction network:** Represented by a red, circular arrangement of gear and brain icons, labeled "Feature analogy network and Prediction network".
* **Feature analogy network:** Represented by a blue, circular arrangement of gear and flower icons, labeled "Feature analogy network".
* **Arrows:** Curved arrows indicate the direction of data flow and model updates.
* **Labels I, II, III:** Roman numerals are used to label the clients and the central network.
### Detailed Analysis or Content Details
The diagram shows a bidirectional flow between the clients and the central network.
* **Client A to Central Network:** An arrow originates from "Client A" and points towards the "Feature analogy network and Prediction network".
* **Central Network to Client A:** An arrow originates from the "Feature analogy network and Prediction network" and points towards "Client A".
* **Client B to Central Network:** An arrow originates from "Client B" and points towards the "Feature analogy network".
* **Feature analogy network to Client B:** An arrow originates from the "Feature analogy network" and points towards "Client B".
The central network appears to be composed of two sub-networks: a "Feature analogy network" and a "Prediction network", which are visually represented by different icon arrangements. The "Feature analogy network" is connected to Client B, while the "Feature analogy network and Prediction network" is connected to Client A.
### Key Observations
The diagram highlights a federated learning setup where model training occurs locally on each client (A and B) and then updates are aggregated or used by a central network. The use of separate networks for feature analogy and prediction suggests a potentially modular architecture. The diagram does not provide any quantitative data or specific details about the algorithms or data used.
### Interpretation
This diagram illustrates a federated learning paradigm. Federated learning is a machine learning technique that trains an algorithm across multiple decentralized edge devices or servers holding local data samples, without exchanging them. This approach contrasts with traditional centralized machine learning, where all the data is uploaded to one server.
The diagram suggests that Client A interacts with both the feature analogy and prediction components of the central network, while Client B primarily interacts with the feature analogy component. This could indicate that Client A provides data relevant to both feature extraction and prediction, while Client B's data is primarily used for feature learning.
The use of silhouettes for the clients suggests a focus on privacy and anonymity. The gear and brain icons within the networks likely represent the computational processes involved in feature extraction, analogy, and prediction. The arrows indicate a continuous cycle of learning and improvement, where clients contribute to the central network, and the central network provides updated models or insights back to the clients.
The diagram is a high-level conceptual representation and lacks specific details about the data, algorithms, or communication protocols used in the federated learning system. It serves as a visual aid for understanding the overall architecture and data flow.
</details>
Figure 7: Threats to privacy in case of common features in FTL.
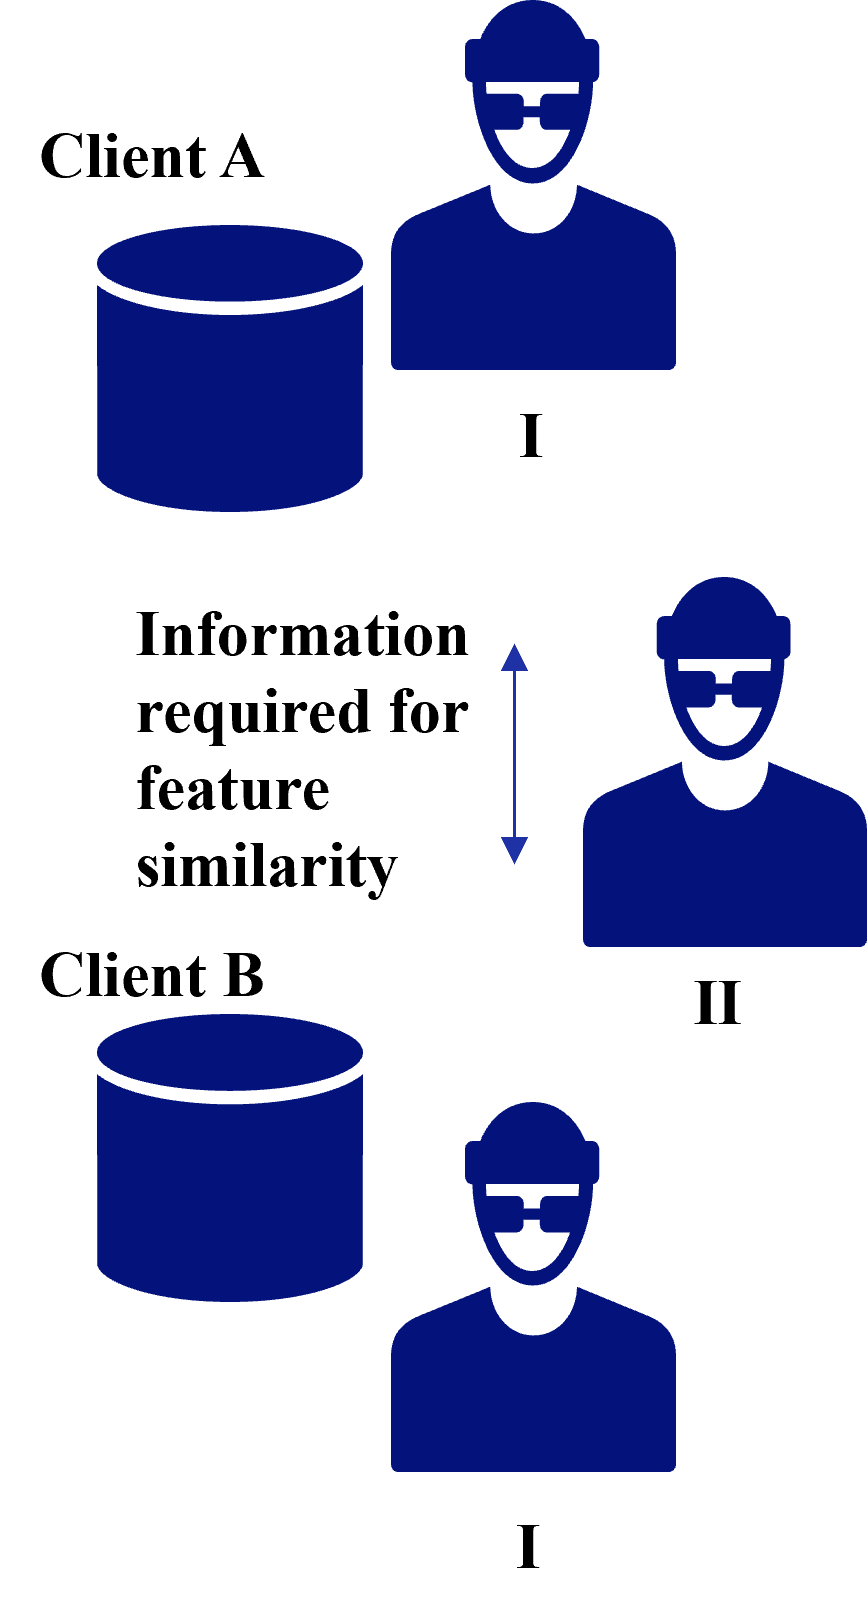
#### III-C 2 Common IDs
In case of Common IDs, a threat to privacy is the leakage of identities due to identity matching between clients as shown in VFL [33]. In addition to the leakage of identities, information required for feature similarity from clients is also a threat. Figure 8 shows threats to privacy in case of common IDs in FTL in case of information required for feature similarity, and possible attackers are as follows:
1. Client receiving information for feature similarity: Inference attack against information required for feature similarity to infer client data.
1. Third party: Eavesdrop on information required for feature similarity pass through the communication channel and infer client data through inference attacks.
<details>
<summary>extracted/5379099/fig/CITP_FTL.png Details</summary>
### Visual Description
\n
## Diagram: Client Data Flow for Feature Similarity
### Overview
The image is a diagram illustrating a data flow between two clients (Client A and Client B) for the purpose of determining feature similarity. It depicts data being requested from Client A by an entity (II) and then potentially being used in conjunction with data from Client B (I). The diagram uses simple icons to represent clients, data stores, and individuals.
### Components/Axes
The diagram consists of the following components:
* **Client A:** Labeled "Client A" and represented by a cylinder (data store) and a silhouette of a person.
* **Client B:** Labeled "Client B" and represented by a cylinder (data store) and a silhouette of a person.
* **Entities I & II:** Represented by silhouettes of people wearing sunglasses.
* **Arrow:** A vertical arrow labeled "Information required for feature similarity" indicating the direction of data flow.
### Detailed Analysis or Content Details
The diagram shows the following relationships:
* Entity II requests information from Client A. The arrow points from Client A towards Entity II.
* Entity I is associated with Client B.
* The diagram suggests a process where information from Client A is needed to assess feature similarity, potentially in relation to data held by Client B.
* There are no numerical values or specific data points present in the diagram. It is a conceptual representation of a process.
### Key Observations
The diagram highlights a client-server or request-response relationship. The use of sunglasses on Entities I and II could imply anonymity or a third-party role. The diagram does not specify the nature of the "feature similarity" being assessed.
### Interpretation
The diagram illustrates a scenario where a third party (Entity II) requires data from Client A to perform a feature similarity analysis. This analysis likely involves comparing features from Client A's data with features from Client B's data, as indicated by the proximity of Entity I to Client B. The diagram suggests a data sharing or access request process. The sunglasses on the entities could indicate that the process is being conducted by an intermediary or that the identities of the entities are being obscured for privacy or security reasons. The diagram is a high-level conceptual overview and lacks specific details about the data being exchanged, the similarity metric used, or the purpose of the analysis. It is a visual representation of a data flow, not a quantitative analysis.
</details>
Figure 8: Threads to privacy in case of common IDs in FTL.
## IV Countermeasures against Threats to Privacy in Each Federated Learning
In this section, we describe countermeasures against threats to privacy in each federated learning. Table II shows countermeasures against privacy threats addressed in each federated learning. Despite the wide variety of previous efforts to secure privacy in federated learning, the proposed methods typically fall into one of these categories: differential privacy, secure computation, encryption of communication, and ID dummying [32].
TABLE II: Countermeasures against privacy threats addressed in each federated learning.
| HFL VFL FTL (common features) | Client Side - Feature Analogy Network Exchange | Server Side Active Client Side - | Communication Line Communication Line Communication Line | - Client Table - |
| --- | --- | --- | --- | --- |
| FTL (common IDs) | - | Gradient Exchange | Communication Line | Client Table |
### IV-A Horizontal Federated Learning
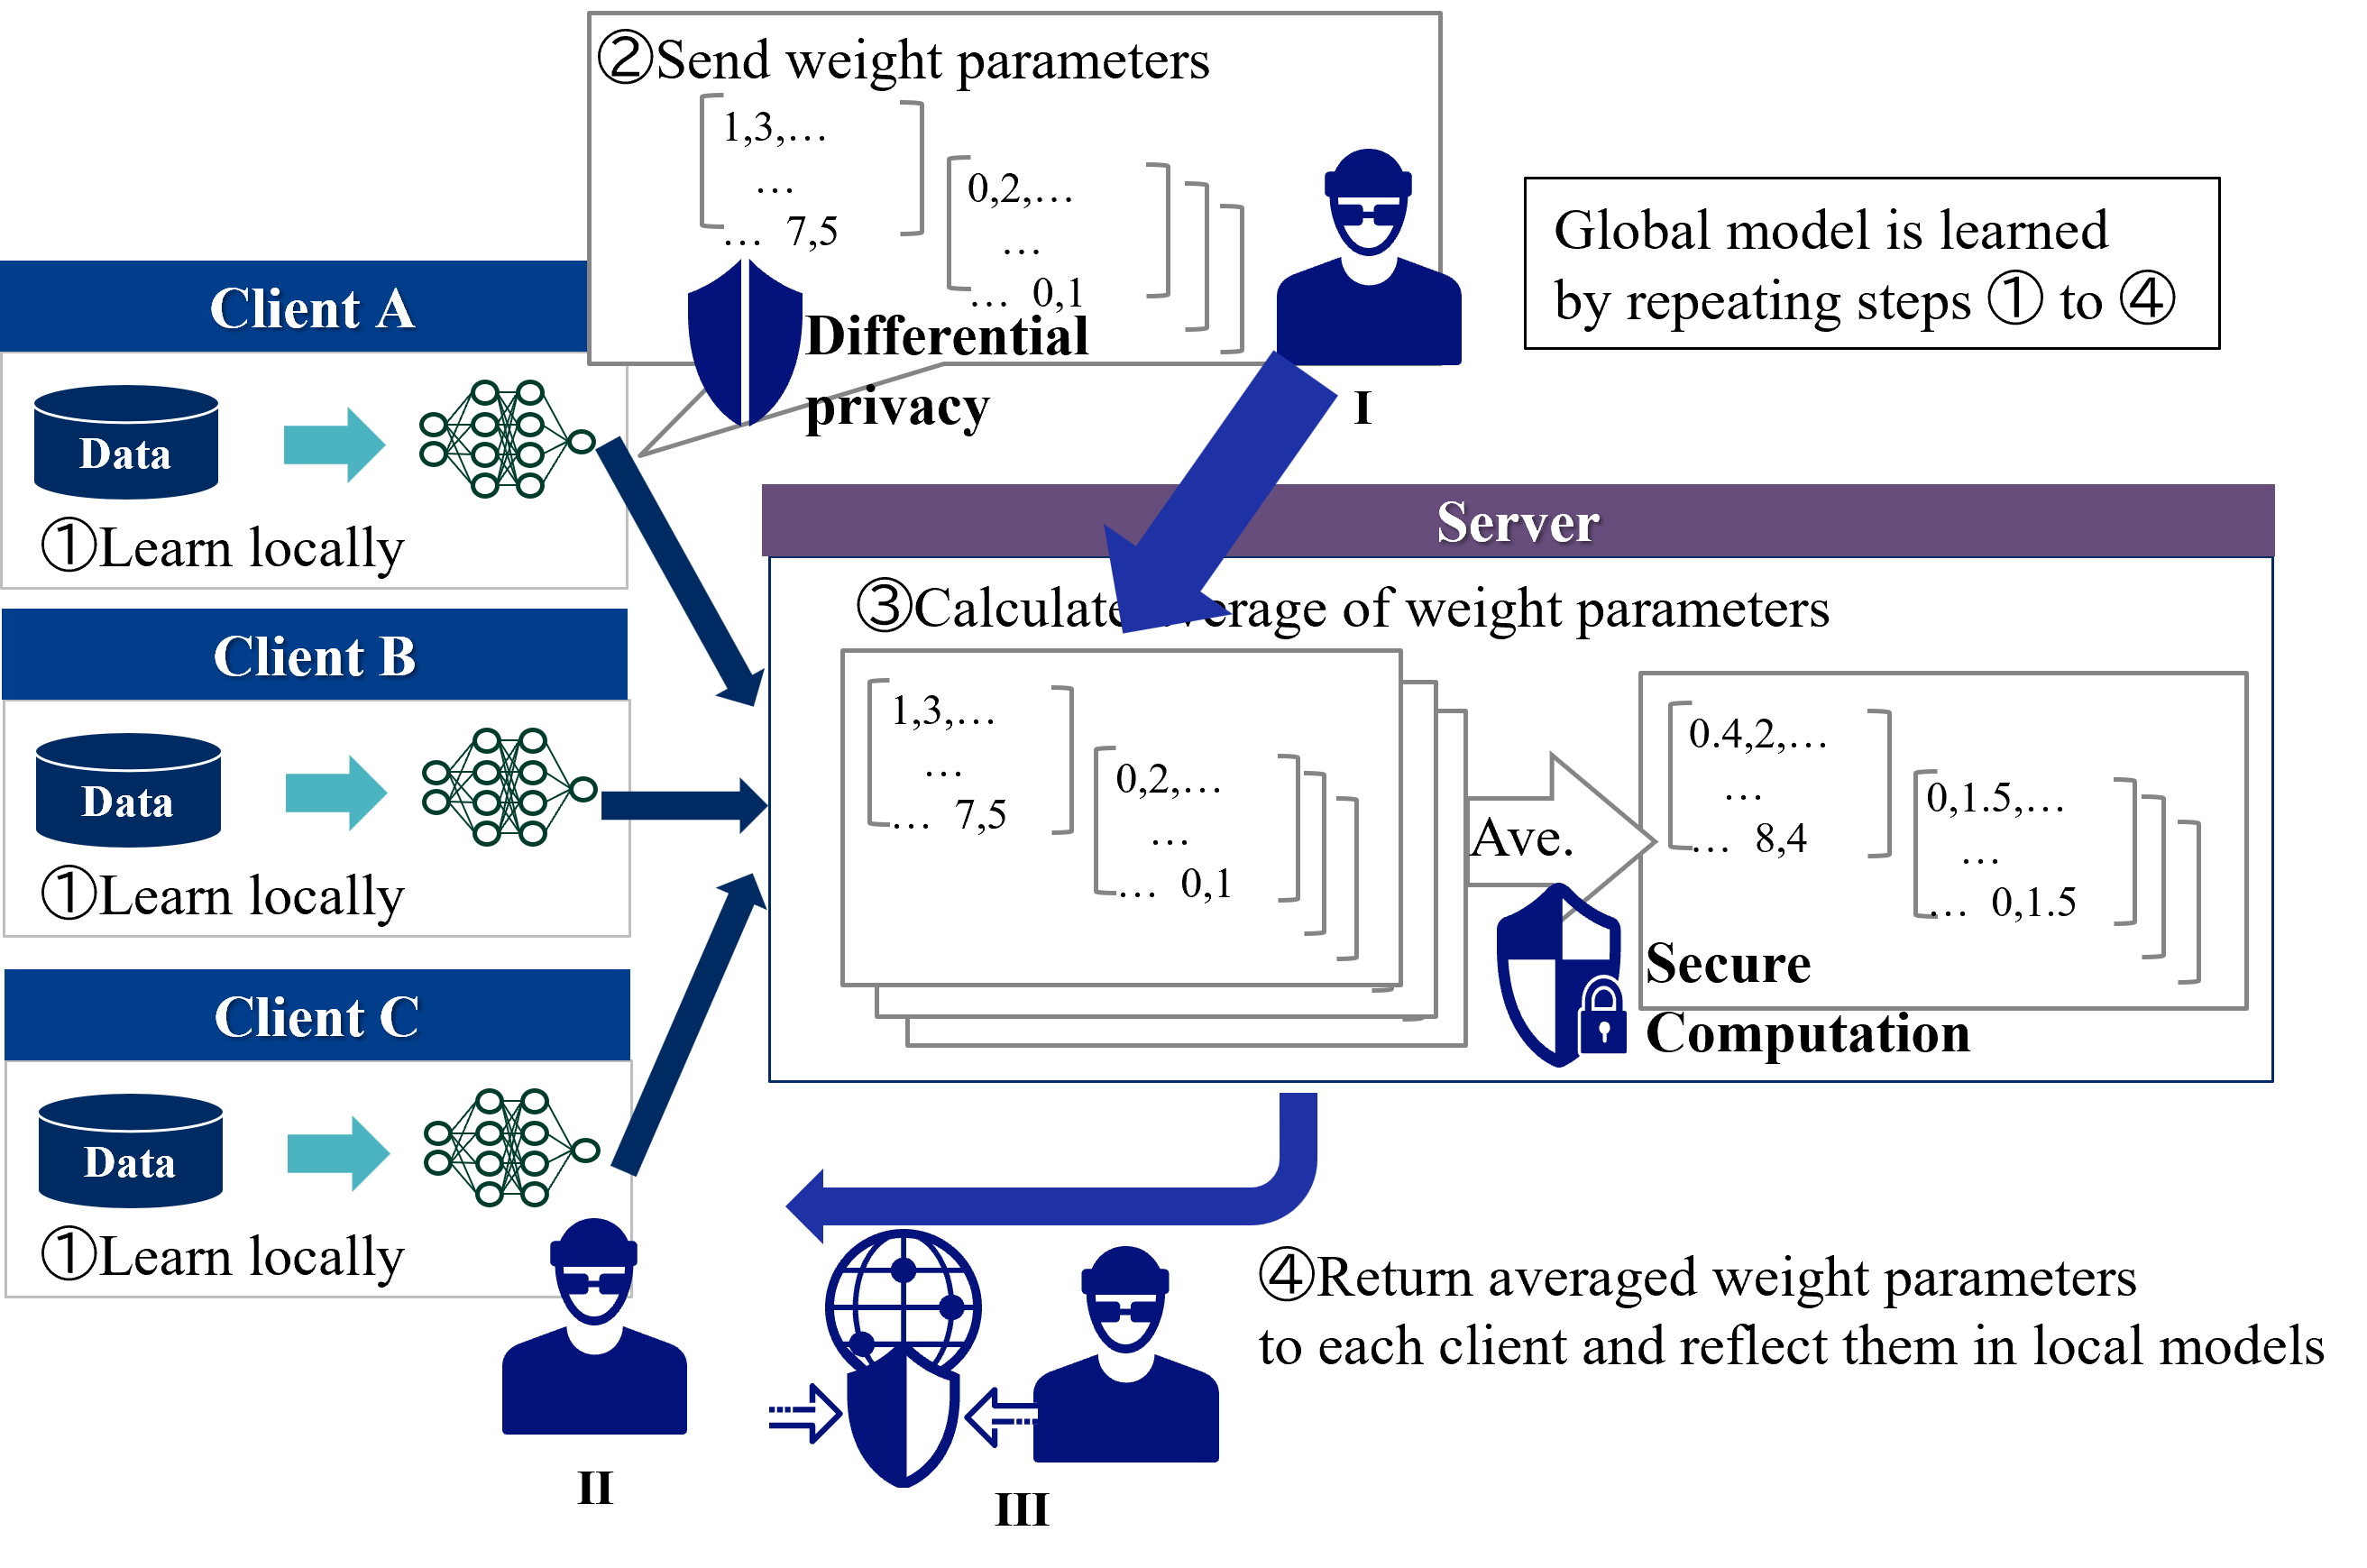
In HFL, a typical privacy measure for client data is to protect attacks by the server side with secure computation and attacks by the client side with differential privacy [34]. Figure 9 shows countermeasures against threads to privacy in HFL. The position of the attacker by these privacy measures is described as follows.
1. Server: Secure computation realizes global model integration calculations without seeing the model by the server [35, 36]
1. Client: Client A creates a model by adding noise through differential privacy [37, 38]. Client B receives the parameters of the global model via the server, but Client A’s model is protected by differential privacy.
1. Third party: Achieved by encryption of communication.
<details>
<summary>extracted/5379099/fig/CM_HFL.png Details</summary>
### Visual Description
\n
## Diagram: Federated Learning with Differential Privacy
### Overview
This diagram illustrates a federated learning process with differential privacy applied. It depicts three clients (A, B, and C) training local models on their respective data, sending weight parameters to a central server, the server aggregating these parameters, and returning the averaged weights back to the clients. Differential privacy is applied during the parameter transmission phase. The process is iterative, aiming to learn a global model through repeated local training and global aggregation.
### Components/Axes
The diagram consists of three client blocks (A, B, C), a central server block, and arrows indicating data flow. Numbered steps (①, ②, ③, ④) guide the process. Key text labels include: "Data", "Learn locally", "Send weight parameters", "Differential privacy", "Calculate average of weight parameters", "Secure Computation", "Return averaged weight parameters", "Global model is learned by repeating steps ① to ④". There are also three icons representing clients with masks (I, II, III). Weight parameter matrices are shown with example values.
### Detailed Analysis or Content Details
The process unfolds as follows:
1. **Client Local Training (①):** Each client (A, B, C) possesses "Data" and performs "Learn locally" using a neural network represented by a cluster of interconnected nodes.
2. **Parameter Transmission with Differential Privacy (②):** Clients send their "weight parameters" to the server. The weight parameters are represented as matrices with the following approximate values:
* Matrix 1: [1.3, ..., 7.5, ..., 0.1]
* Matrix 2: [0.2, ..., 0.1]
Differential privacy is applied during this transmission, indicated by the label "Differential privacy". Client I is shown sending data to the server.
3. **Server Aggregation (③):** The server "Calculate[s] average of weight parameters" using "Secure Computation". The averaged weight parameters are represented as matrices with the following approximate values:
* Matrix 1: [0.4, 2, ..., 8.4]
* Matrix 2: [0.1, 5, ..., 0.15]
Client II is shown sending data to the server.
4. **Parameter Return (④):** The server "Return[s] averaged weight parameters to each client and reflect them in local models". Client III is shown receiving data from the server.
The diagram also shows three masked client icons (I, II, III) representing the privacy aspect of the process.
### Key Observations
The diagram highlights the iterative nature of federated learning. The use of differential privacy suggests a focus on protecting the privacy of individual client data during the model training process. The "Secure Computation" label indicates that the server performs aggregation in a privacy-preserving manner. The matrices representing weight parameters are illustrative and do not represent a complete dataset.
### Interpretation
This diagram demonstrates a federated learning approach designed to train a global model without directly accessing or centralizing client data. The process leverages local computation on each client's data, followed by secure aggregation of model updates on a central server. The inclusion of differential privacy suggests a commitment to protecting the privacy of individual client contributions. The iterative nature of the process (steps ① to ④) implies that the global model is refined over multiple rounds of local training and global aggregation. The masked client icons emphasize the privacy-preserving nature of the system. The use of "Secure Computation" suggests techniques like secure multi-party computation are employed to prevent the server from inferring individual client data from the aggregated updates. This approach is particularly relevant in scenarios where data privacy is paramount, such as healthcare or finance.
</details>
Figure 9: Countermeasures against threads to privacy in HFL.
### IV-B Vertical Federated Learning
In VFL, the threads to privacy are the leakage of identities and partial output from clients. We show how to respond in the case of each threat.
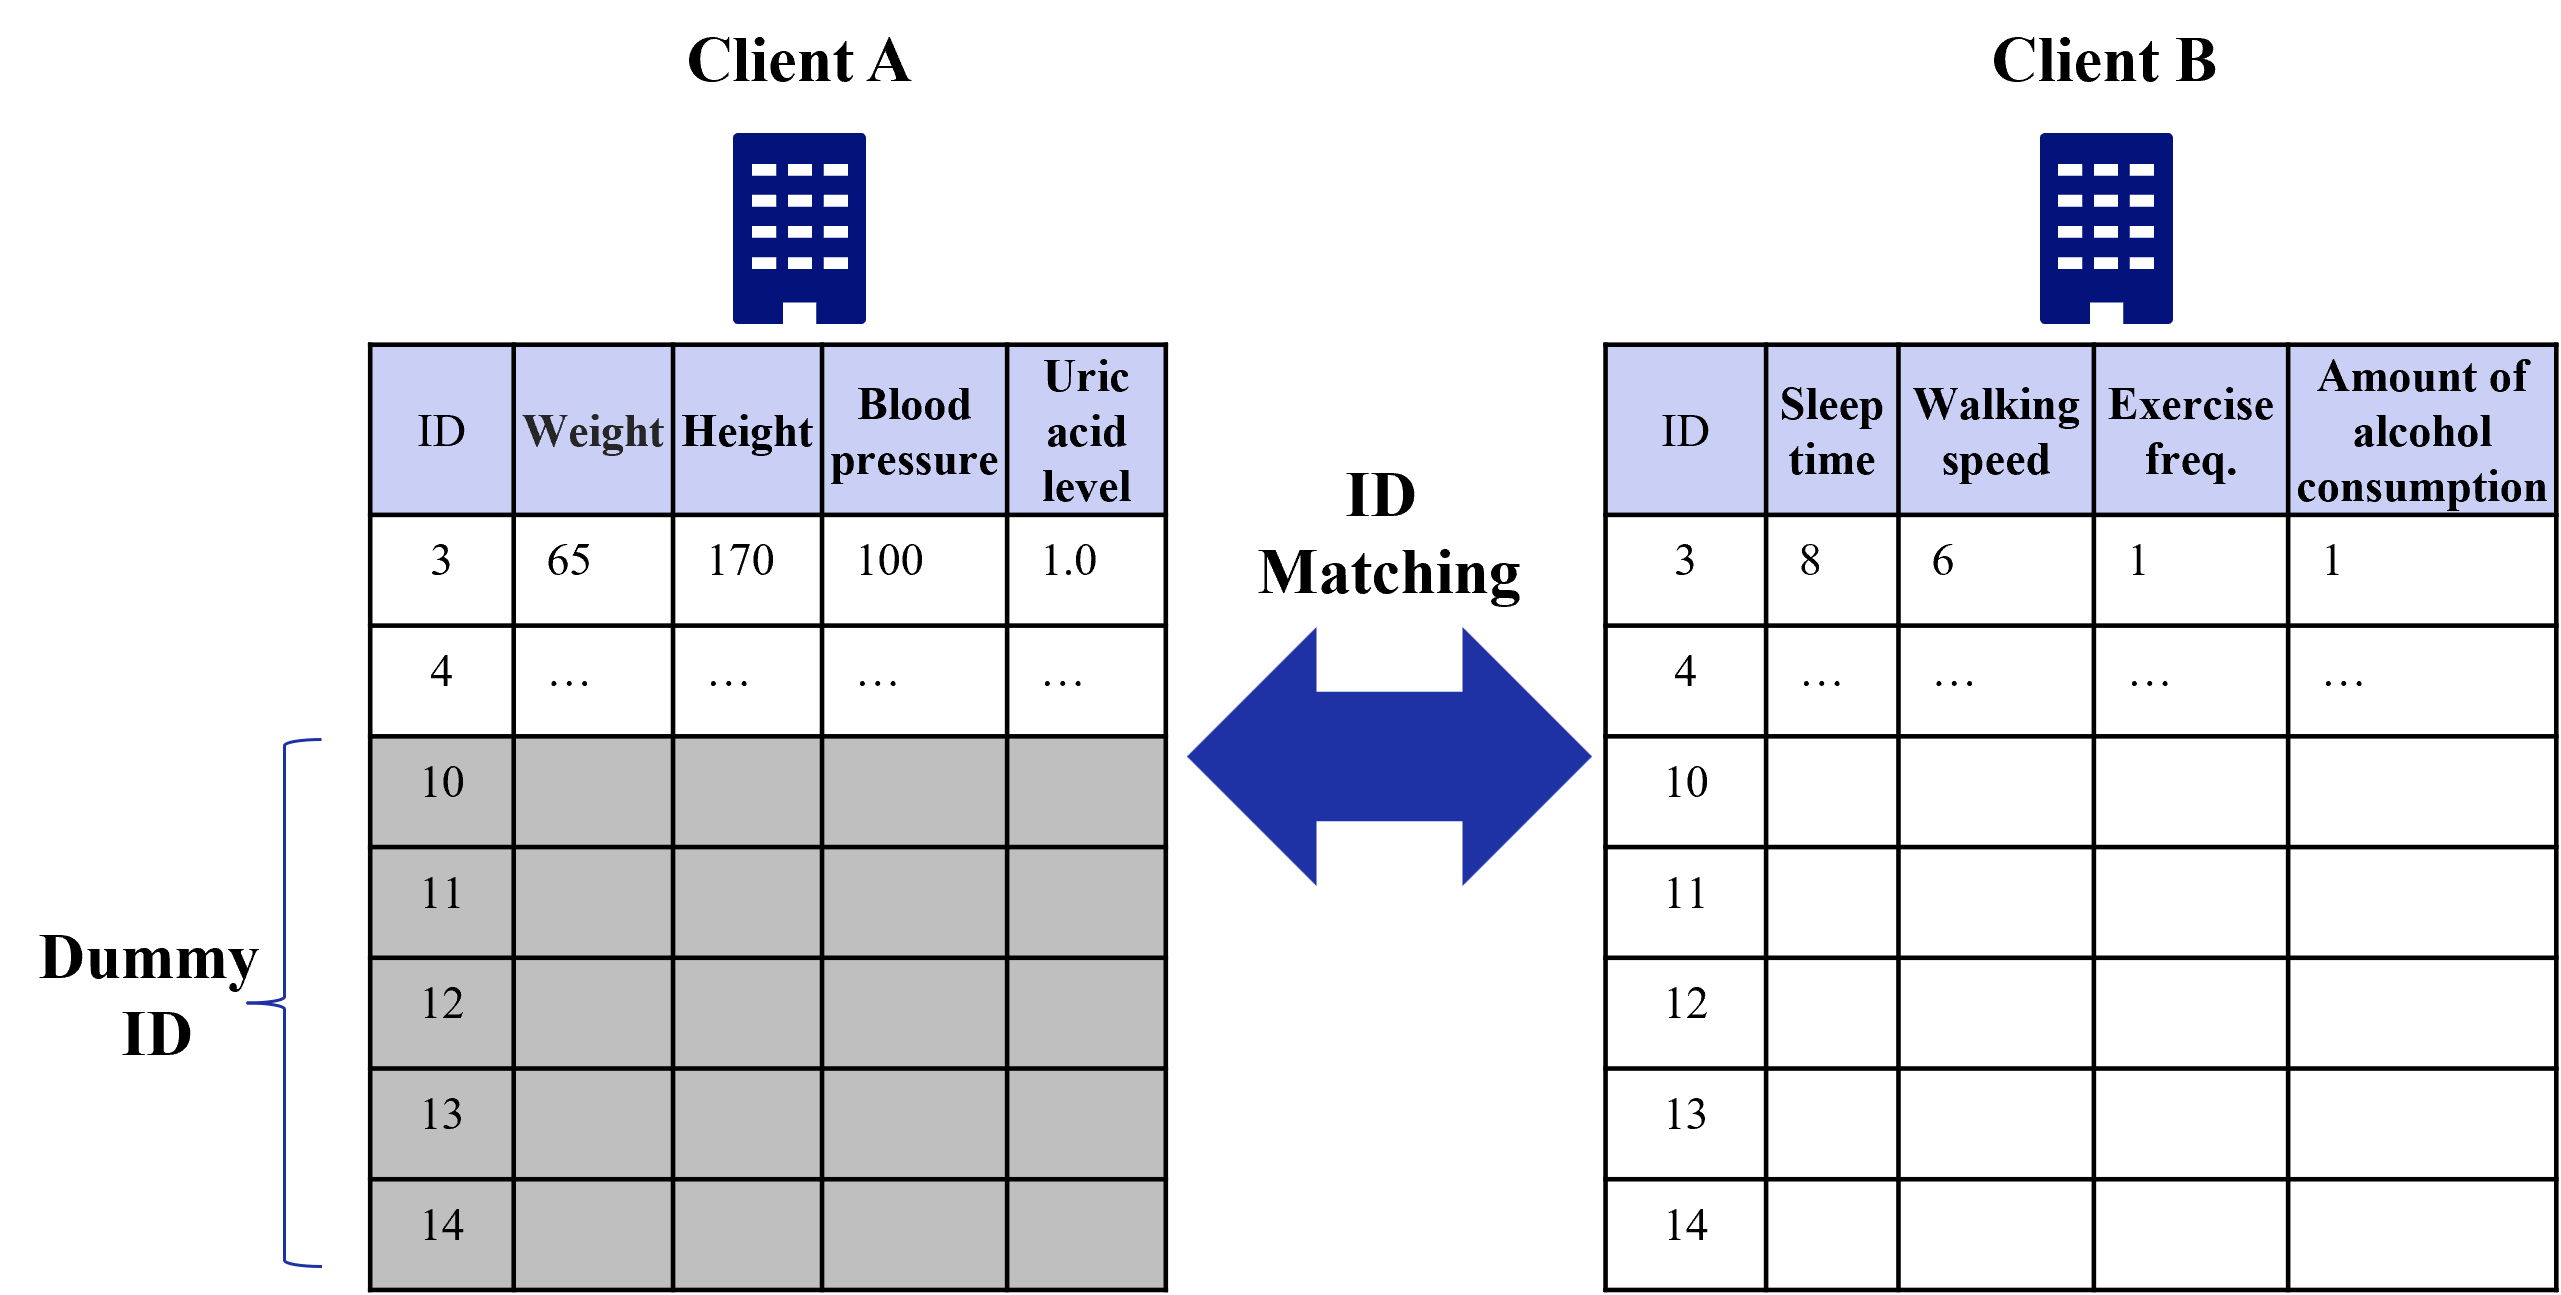
#### IV-B 1 IDs Matching
In case of IDs matching, Dummy IDs are prepared in addition to the original IDs [39]. For the dummy part of the ID, dummy variables that have no effect on learning are sent. Figure 10 shows an example of dummy IDs. Before dummy IDs are used, all IDs that match Client A are known to Client B (cf. ID 3,4). After dummy IDs are used, Client B does not know which of the IDs that match Client A is the real ID of Client A.
<details>
<summary>extracted/5379099/fig/CMID_VFL.png Details</summary>
### Visual Description
\n
## Diagram: Client Data Matching
### Overview
This diagram illustrates a data matching process between two clients, Client A and Client B, based on a shared ID. The diagram depicts two tables representing data for each client, with an arrow indicating the matching process. The tables contain various health and lifestyle metrics.
### Components/Axes
The diagram consists of:
* **Client A Table:** Contains columns for "ID", "Weight", "Height", "Blood pressure", and "Uric acid level".
* **Client B Table:** Contains columns for "ID", "Sleep time", "Walking speed", "Exercise freq.", and "Amount of alcohol consumption".
* **Matching Arrow:** A blue, double-headed arrow pointing between the two tables, labeled "ID Matching".
* **Client A Icon:** A building icon above the Client A table.
* **Client B Icon:** A building icon above the Client B table.
* **Dummy ID Label:** A label on the left side of the diagram indicating "Dummy ID" with an associated arrow pointing to the ID column in both tables.
### Detailed Analysis or Content Details
**Client A Data:**
* **ID 3:** Weight = 65, Height = 170, Blood pressure = 100, Uric acid level = 1.0
* **ID 4:** All values are represented by "...".
* **ID 10-14:** All values are represented by "...".
**Client B Data:**
* **ID 3:** Sleep time = 8, Walking speed = 6, Exercise freq. = 1, Amount of alcohol consumption = 1
* **ID 4:** All values are represented by "...".
* **ID 10-14:** All values are represented by "...".
The "ID Matching" arrow indicates that the tables are linked based on the "ID" column. The diagram shows that only ID 3 has complete data for both clients. The remaining IDs (4, 10, 11, 12, 13, 14) have incomplete data represented by "...".
### Key Observations
* The diagram highlights the importance of a common identifier ("ID") for matching data between different sources (Client A and Client B).
* The use of "..." indicates missing or unavailable data for most IDs.
* Only one ID (ID 3) has complete data across both clients.
* The data types are mixed (numerical and potentially categorical).
### Interpretation
The diagram demonstrates a scenario where data from two different clients is being integrated or compared. The "ID" serves as the key for linking the records. The presence of "..." suggests data gaps or privacy concerns, where certain information is not shared or available. The diagram likely represents a simplified view of a data integration process, potentially in a healthcare or research context. The matching process is focused on identifying corresponding records based on the ID, which is crucial for accurate analysis and decision-making. The limited data available for most IDs suggests that data collection or sharing may be incomplete or restricted. The diagram implies a need for data cleaning and validation to ensure the quality and reliability of the integrated dataset.
</details>
Figure 10: Example of dummy IDs.
#### IV-B 2 Output from Clients
In case of output from clients, the typical privacy measure is the use of secure calculations [33]. Figure 11 shows countermeasures against threads in case of output from clients. The position of the attacker by these privacy measures is described as follows.
1. Active Client: Secure computation realizes global model integration calculations without seeing the model by the active client. [35].
1. Passive Clients: Client B receives the information used for updating from the upper model via the active client, but it is protected by secure computation.
1. Third party: Achieved by encryption of communication.
<details>
<summary>extracted/5379099/fig/CMOC_VFL.png Details</summary>
### Visual Description
\n
## Diagram: Federated Learning Process
### Overview
This diagram illustrates a federated learning process involving multiple clients (A, B, and C) and a central server. The process involves iterative steps of data sharing, model updating, and error propagation to learn an overall model without directly exchanging data. The diagram is segmented into three main areas: Client Side (left), Active Client & Secure Computation (center), and Model Architecture (right).
### Components/Axes
The diagram features the following components:
* **Clients (A, B, C):** Represent individual devices or entities holding local data.
* **Data:** Input data residing on each client.
* **Lower Model:** A model trained locally on each client's data.
* **Upper Model:** A global model aggregated from the lower models.
* **Active Client:** The client selected for model aggregation in a given iteration.
* **Secure Computation:** A secure environment for aggregating model updates.
* **Overall Model:** The final, globally learned model.
* **IDs Matched Between Clients:** Indicates the synchronization of client identifiers.
* **Arrows:** Represent the flow of data and model updates.
* **Numbered Steps:** Describe the sequence of operations.
### Detailed Analysis or Content Details
The diagram outlines a four-step process:
**Step 1: IDs Matched Between Clients**
* A large purple arrow indicates the synchronization of client identifiers between Clients A, B, and C.
**Step 2: The same ID data is submitted between clients and each output of lower model is sent to the active client.**
* Grey arrows connect Clients A, B, and C to a box labeled "I".
* Box "I" contains the following values:
* 1.0
* 2.1
* -5.0
* The text "The same ID data is submitted between clients and each output of lower model is sent to the active client." accompanies this step.
**Step 3: The output of each client is used as input to update upper model.**
* Grey arrows connect Clients A, B, and C to a central component labeled "Active Client".
* The "Active Client" contains a box labeled with the following values:
* 3.6
* -0.1
* -8.5
* 1.0
* 2.1
* -5.0
* The "Active Client" is connected to a "Secure Computation" component (represented by a building with a lock).
* The text "The output of each client is used as input to update upper model." accompanies this step.
**Step 4: Propagate the error to each client and learn the lower model.**
* An arrow connects the "Secure Computation" component to Clients A, B, and C.
* The text "Propagate the error to each client and learn the lower model." accompanies this step.
**Model Architecture (Right Side)**
* Clients A, B, and C each have a "Lower Model" (represented by a network of nodes).
* Each client also has an "Upper Model" (also represented by a network of nodes) connected to its "Lower Model".
* A gear icon connects the "Secure Computation" component to the "Overall Model".
* The text "Overall model is learned by repeating steps ② to ④." is positioned at the top-right of the diagram.
**Additional Elements:**
* "II" represents a person/user.
* "III" represents a globe/network.
* Arrows between "II" and "III" indicate data transfer.
### Key Observations
* The process is iterative, as indicated by the statement "Overall model is learned by repeating steps ② to ④."
* Secure computation is used to aggregate model updates, suggesting a focus on privacy.
* The values within boxes "I" and the "Active Client" box appear to be model parameters or gradients.
* The diagram highlights the decentralized nature of federated learning, where data remains on the clients.
### Interpretation
This diagram depicts a federated learning system designed to train a global model collaboratively without directly sharing sensitive data. The process begins with synchronizing client IDs. Each client trains a local model ("Lower Model") on its own data. The outputs of these local models are then sent to an "Active Client," which aggregates them using "Secure Computation" to update a global model ("Upper Model"). The error from the global model is then propagated back to the clients, allowing them to refine their local models. This iterative process continues until the overall model converges.
The use of "Secure Computation" suggests a commitment to preserving data privacy during the aggregation process. The diagram emphasizes the decentralized nature of the learning process, where data remains on the clients, and only model updates are exchanged. The values within the boxes likely represent model parameters or gradients used in the training process. The inclusion of "II" and "III" suggests that the clients are connected through a network and that users are involved in the process. The diagram effectively illustrates the core principles of federated learning and its potential for privacy-preserving machine learning.
</details>
Figure 11: Countermeasures against threads in case of output from clients.
### IV-C Federated Transfer Learning
In FTL, the threads to privacy depend on common information between clients [24]. We show how to respond in the case of each thread.
#### IV-C 1 Common Features
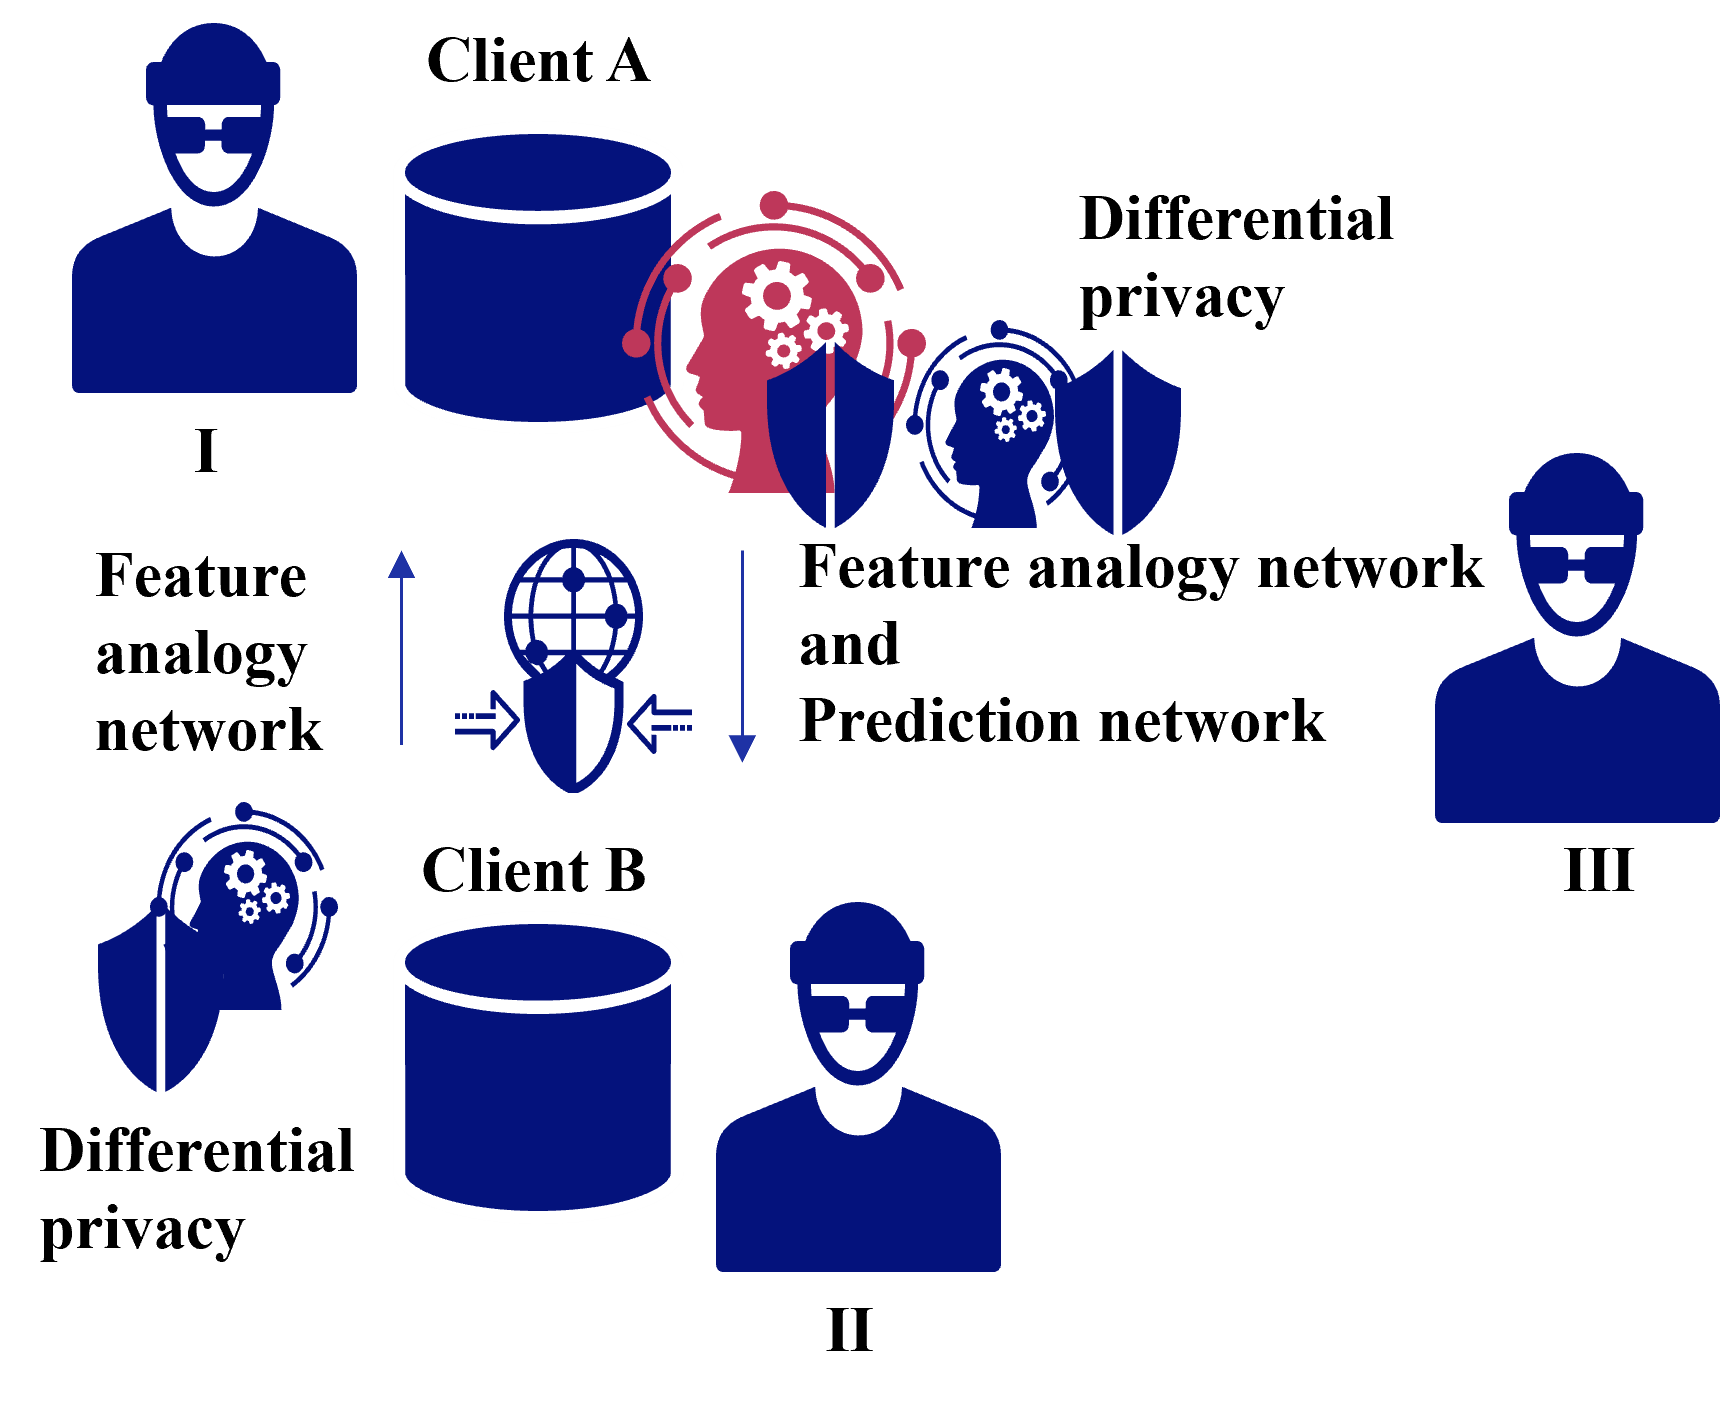
In case of common features, the threads to privacy are exchanges of feature analogy network and prediction network. Figure 12 shows countermeasures against threads in case of common features.
1. Client receiving a feature analogy network: Differential privacy makes it difficult to infer the model [37].
1. Client receiving a feature analogy network and prediction network: Differential privacy makes it difficult to infer the model.
1. Third party: Achieved by encryption of communication.
<details>
<summary>extracted/5379099/fig/CMCF_FTL.png Details</summary>
### Visual Description
\n
## Diagram: Federated Learning with Differential Privacy
### Overview
The image depicts a diagram illustrating a federated learning system incorporating differential privacy. It shows two clients (A and B) contributing to a central "Feature analogy network and Prediction network" while maintaining differential privacy. The diagram highlights the flow of information and the application of privacy mechanisms.
### Components/Axes
The diagram consists of the following components:
* **Client A:** Represented by a dark blue silhouette wearing a hard hat, a cylindrical database, and a "Differential privacy" shield. Labeled "I".
* **Client B:** Similar to Client A, represented by a dark blue silhouette wearing a hard hat, a cylindrical database, and a "Differential privacy" shield. Labeled "II".
* **Feature analogy network and Prediction network:** A central component depicted as a globe with gears overlaid, and a "Differential privacy" shield.
* **Differential privacy shields:** Blue shields with white gears, indicating the application of differential privacy.
* **Arrows:** Red arrows indicate the flow of information between clients and the central network. Double-sided arrows indicate bidirectional flow.
* **Text Labels:** "Client A", "Client B", "Feature analogy network", "Differential privacy", "Feature analogy network and Prediction network".
* **Roman Numerals:** I, II, and III are used to label the clients and the central network.
* **Client III:** A dark blue silhouette wearing a hard hat, labeled "III".
### Detailed Analysis or Content Details
The diagram illustrates the following process:
1. **Client A (I)** sends data to the "Feature analogy network and Prediction network". This is indicated by a red arrow originating from the database associated with Client A.
2. **Client B (II)** sends data to the "Feature analogy network and Prediction network". This is indicated by a red arrow originating from the database associated with Client B.
3. The "Feature analogy network and Prediction network" processes the data from both clients. The globe with gears suggests a complex processing mechanism.
4. The "Feature analogy network and Prediction network" sends information back to both Client A and Client B. This is indicated by double-sided red arrows.
5. Both Client A and Client B utilize "Differential privacy" shields, suggesting that privacy-preserving mechanisms are applied to the data before or after transmission.
6. Client III is present but does not appear to be directly involved in the data flow.
There are no numerical values or specific data points presented in the diagram. It is a conceptual illustration of a system architecture.
### Key Observations
* The diagram emphasizes the decentralized nature of federated learning, with data residing on the clients.
* Differential privacy is a key component of the system, indicated by the shields on both clients and the central network.
* The bidirectional arrows suggest an iterative process of model training and refinement.
* The presence of Client III without direct connection suggests a potential role as an observer or a future participant.
### Interpretation
The diagram illustrates a federated learning system designed to protect user privacy. Federated learning allows a model to be trained on decentralized data sources (Client A and Client B) without directly exchanging the data itself. Instead, the clients send model updates or gradients to a central server (Feature analogy network and Prediction network), which aggregates them to improve the global model.
The inclusion of "Differential privacy" shields indicates that noise or other privacy-preserving techniques are applied to the data or model updates to prevent the identification of individual users. This is crucial for protecting sensitive information while still enabling collaborative learning.
The diagram suggests a closed-loop system where the central network learns from the clients and provides feedback, iteratively improving the model's performance. The role of Client III is unclear, but it could represent a separate entity that benefits from the trained model or a potential future participant in the federated learning process.
The diagram is a high-level conceptual representation and does not provide details about the specific algorithms or techniques used for federated learning or differential privacy. It serves as a visual aid for understanding the overall architecture and key principles of the system.
</details>
Figure 12: Countermeasures against threads in case of common features.
#### IV-C 2 Common IDs
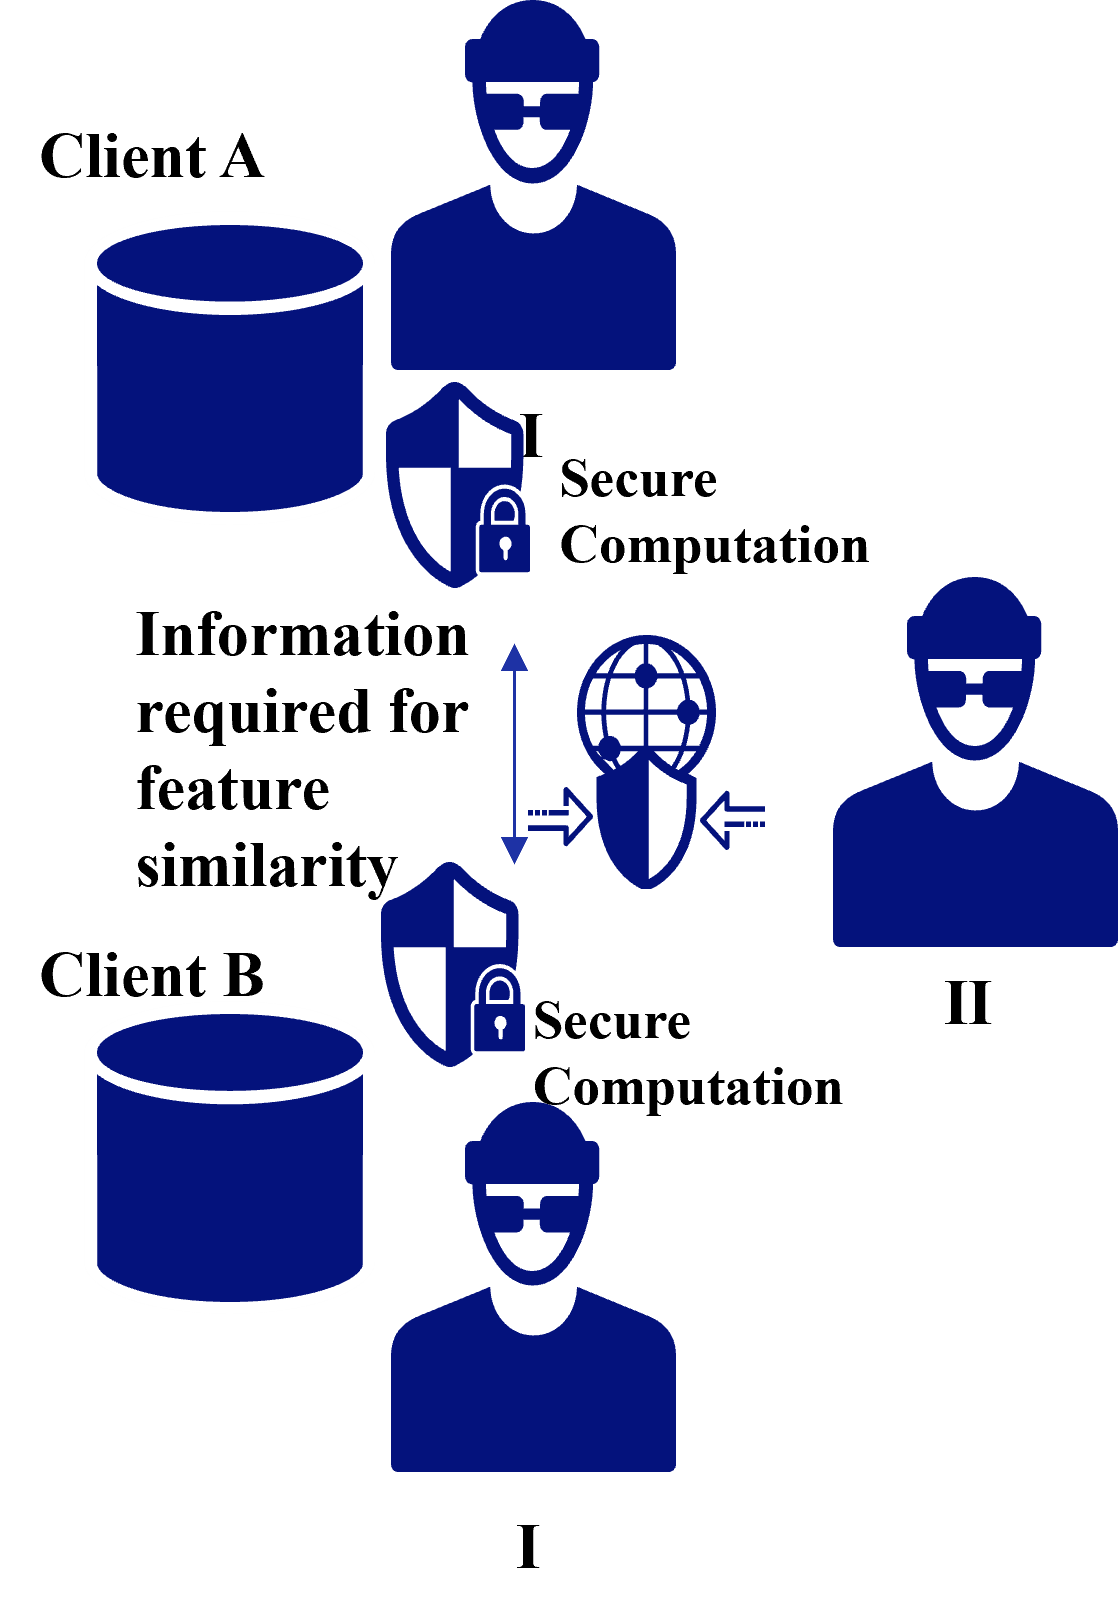
In case of common IDs, the threads to privacy are the leakage of identities and information required for feature similarity [24]. For the leakage of identities, Dummy IDs are prepared in addition to the original IDs as shown in Section IV-B 1 [39]. For information required for feature similarity, figure 13 shows countermeasures against threads in case of common IDs.
1. Client receiving information for feature similarity: Difficult to guess information due to secure computation [35].
1. Third party: Achieved by encryption of communication.
<details>
<summary>extracted/5379099/fig/CMCI_FTL.png Details</summary>
### Visual Description
\n
## Diagram: Secure Feature Similarity Computation
### Overview
The image is a diagram illustrating a secure computation process for determining feature similarity between data held by two clients (Client A and Client B). It depicts a flow of information through secure computation modules, with an emphasis on privacy.
### Components/Axes
The diagram consists of the following components:
* **Client A:** Represented by a dark blue cylinder (database), a masked face, and the label "Client A" positioned at the top-left.
* **Client B:** Represented by a dark blue cylinder (database), a masked face, and the label "Client B" positioned at the bottom-left.
* **Secure Computation (I):** A padlock symbol with the text "Secure Computation" positioned between Client A and the central globe.
* **Secure Computation (II):** A padlock symbol with the text "Secure Computation" positioned between Client B and the central globe.
* **Globe:** A stylized globe with dotted arrows indicating information flow, positioned in the center of the diagram.
* **Text Label:** "Information required for feature similarity" positioned between the two secure computation modules and the globe.
* **Labels I & II:** Labels "I" and "II" are positioned near the masked faces of Client A and Client B respectively.
### Detailed Analysis / Content Details
The diagram illustrates a process where:
1. Client A and Client B each possess a data store (represented by the cylinders).
2. Information from both clients is sent to respective "Secure Computation" modules.
3. The Secure Computation modules process the information and send it to a central point represented by the globe.
4. The globe appears to facilitate the comparison of features, as indicated by the dotted arrows showing information exchange.
5. The masked faces suggest that the identities of the clients are protected during the process.
There are no numerical values or specific data points present in the diagram. It is a conceptual illustration of a process.
### Key Observations
* The use of masked faces and "Secure Computation" modules emphasizes the privacy-preserving nature of the process.
* The globe suggests a centralized computation or comparison point.
* The dotted arrows indicate a two-way flow of information, implying that both clients contribute to the feature similarity calculation.
* The labels "I" and "II" do not appear to have a clear functional purpose within the diagram, potentially serving as identifiers for different stages or components.
### Interpretation
The diagram depicts a secure multi-party computation scenario. Clients A and B wish to determine the similarity of features within their respective datasets without revealing the underlying data to each other or to a central authority. The "Secure Computation" modules likely employ techniques like differential privacy, homomorphic encryption, or secure multi-party computation protocols to enable this. The globe represents a trusted environment where the computation takes place, ensuring that only the similarity score (or related information) is revealed, not the raw data.
The diagram highlights the importance of privacy in data analysis and the use of cryptographic techniques to enable collaborative data processing without compromising confidentiality. The absence of specific details suggests that the diagram is intended to convey a general concept rather than a specific implementation. The dotted arrows suggest a communication protocol, but the nature of that protocol is not specified.
</details>
Figure 13: Countermeasures against threads in case of common IDs.
## V Conclusion
In this paper, we have described privacy threats and countermeasures for federated learning in terms of HFL, VFL, and FTL. Privacy measures for federated learning include differential privacy to reduce the leakage of training data from the model, secure computation to keep the model computation process secret between clients and servers, encryption of communications to prevent information leakage to third parties, and ID dummying to prevent ID leakage.
## Acknowledgment
This R&D includes the results of ” Research and development of optimized AI technology by secure data coordination (JPMI00316)” by the Ministry of Internal Affairs and Communications (MIC), Japan.
## References
- [1] L. Lyu, H. Yu, and Q. Yang, “Threats to federated learning: A survey,” arXiv preprint arXiv:2003.02133, 2020.
- [2] Q. Yang, Y. Liu, T. Chen, and Y. Tong, “Federated machine learning: Concept and applications,” ACM Trans. Intell. Syst. Technol., vol. 10, no. 2, 2019.
- [3] B. McMahan, E. Moore, D. Ramage, S. Hampson, and B. A. y. Arcas, “Communication-Efficient Learning of Deep Networks from Decentralized Data,” in Proceedings of the 20th International Conference on Artificial Intelligence and Statistics, ser. Proceedings of Machine Learning Research, vol. 54. PMLR, 2017, pp. 1273–1282.
- [4] E. T. Martínez Beltrán, M. Q. Pérez, P. M. S. Sánchez, S. L. Bernal, G. Bovet, M. G. Pérez, G. M. Pérez, and A. H. Celdrán, “Decentralized federated learning: Fundamentals, state of the art, frameworks, trends, and challenges,” IEEE Communications Surveys & Tutorials, vol. 25, no. 4, pp. 2983–3013, 2023.
- [5] L. Zhao, L. Ni, S. Hu, Y. Chen, P. Zhou, F. Xiao, and L. Wu, “Inprivate digging: Enabling tree-based distributed data mining with differential privacy,” in IEEE INFOCOM 2018 - IEEE Conference on Computer Communications, 2018, pp. 2087–2095.
- [6] Q. Li, Z. Wen, and B. He, “Practical federated gradient boosting decision trees,” Proceedings of the AAAI Conference on Artificial Intelligence, vol. 34, no. 04, pp. 4642–4649, 2020.
- [7] F. Wang, J. Ou, and H. Lv, “Gradient boosting forest: a two-stage ensemble method enabling federated learning of gbdts,” in Neural Information Processing, T. Mantoro, M. Lee, M. A. Ayu, K. W. Wong, and A. N. Hidayanto, Eds. Cham: Springer International Publishing, 2021, pp. 75–86.
- [8] A. Gascón, P. Schoppmann, B. Balle, M. Raykova, J. Doerner, S. Zahur, and D. Evans, “Secure linear regression on vertically partitioned datasets,” IACR Cryptol. ePrint Arch., vol. 2016, p. 892, 2016.
- [9] S. Hardy, W. Henecka, H. Ivey-Law, R. Nock, G. Patrini, G. Smith, and B. Thorne, “Private federated learning on vertically partitioned data via entity resolution and additively homomorphic encryption,” CoRR, vol. abs/1711.10677, 2017.
- [10] R. Nock, S. Hardy, W. Henecka, H. Ivey-Law, G. Patrini, G. Smith, and B. Thorne, “Entity resolution and federated learning get a federated resolution,” CoRR, vol. abs/1803.04035, 2018.
- [11] S. Yang, B. Ren, X. Zhou, and L. Liu, “Parallel distributed logistic regression for vertical federated learning without third-party coordinator,” CoRR, vol. abs/1911.09824, 2019.
- [12] Q. Zhang, B. Gu, C. Deng, and H. Huang, “Secure bilevel asynchronous vertical federated learning with backward updating,” Proceedings of the AAAI Conference on Artificial Intelligence, vol. 35, no. 12, pp. 10 896–10 904, May 2021.
- [13] K. Cheng, T. Fan, Y. Jin, Y. Liu, T. Chen, D. Papadopoulos, and Q. Yang, “Secureboost: A lossless federated learning framework,” IEEE Intelligent Systems, vol. 36, no. 6, pp. 87–98, 2021.
- [14] J. Vaidya, C. Clifton, M. Kantarcioglu, and A. S. Patterson, “Privacy-preserving decision trees over vertically partitioned data,” ACM Trans. Knowl. Discov. Data, vol. 2, no. 3, oct 2008.
- [15] Y. Wu, S. Cai, X. Xiao, G. Chen, and B. C. Ooi, “Privacy preserving vertical federated learning for tree-based models,” Proc. VLDB Endow., vol. 13, no. 12, p. 2090–2103, jul 2020.
- [16] Y. Liu, Y. Liu, Z. Liu, Y. Liang, C. Meng, J. Zhang, and Y. Zheng, “Federated forest,” IEEE Transactions on Big Data, pp. 1–1, 2020.
- [17] Z. Tian, R. Zhang, X. Hou, J. Liu, and K. Ren, “Federboost: Private federated learning for GBDT,” CoRR, vol. abs/2011.02796, 2020.
- [18] Y. Hu, D. Niu, J. Yang, and S. Zhou, “Fdml: A collaborative machine learning framework for distributed features,” in Proceedings of the 25th ACM SIGKDD International Conference on Knowledge Discovery & Data Mining, ser. KDD ’19. New York, NY, USA: Association for Computing Machinery, 2019, p. 2232–2240.
- [19] Y. Liu, Y. Kang, X. Zhang, L. Li, Y. Cheng, T. Chen, M. Hong, and Q. Yang, “A communication efficient collaborative learning framework for distributed features,” CoRR, vol. abs/1912.11187, 2019.
- [20] D. Romanini, A. J. Hall, P. Papadopoulos, T. Titcombe, A. Ismail, T. Cebere, R. Sandmann, R. Roehm, and M. A. Hoeh, “Pyvertical: A vertical federated learning framework for multi-headed splitnn,” CoRR, vol. abs/2104.00489, 2021.
- [21] Q. He, W. Yang, B. Chen, Y. Geng, and L. Huang, “Transnet: Training privacy-preserving neural network over transformed layer,” Proc. VLDB Endow., vol. 13, no. 12, p. 1849–1862, jul 2020.
- [22] B. Gu, Z. Dang, X. Li, and H. Huang, “Federated doubly stochastic kernel learning for vertically partitioned data,” in Proceedings of the 26th ACM SIGKDD International Conference on Knowledge Discovery & Data Mining. New York, NY, USA: Association for Computing Machinery, 2020, p. 2483–2493.
- [23] R. Xu, N. Baracaldo, Y. Zhou, A. Anwar, J. Joshi, and H. Ludwig, “Fedv: Privacy-preserving federated learning over vertically partitioned data,” CoRR, vol. abs/2103.03918, 2021.
- [24] Y. Liu, Y. Kang, C. Xing, T. Chen, and Q. Yang, “A secure federated transfer learning framework,” IEEE Intelligent Systems, vol. 35, no. 4, pp. 70–82, 2020.
- [25] S. Sharma, C. Xing, Y. Liu, and Y. Kang, “Secure and efficient federated transfer learning,” in 2019 IEEE International Conference on Big Data (Big Data), 2019, pp. 2569–2576.
- [26] B. Zhang, C. Chen, and L. Wang, “Privacy-preserving transfer learning via secure maximum mean discrepancy,” arXiv preprint arXiv:2009.11680, 2020.
- [27] Y. Gao, M. Gong, Y. Xie, A. K. Qin, K. Pan, and Y.-S. Ong, “Multiparty dual learning,” IEEE Transactions on Cybernetics, vol. 53, no. 5, pp. 2955–2968, 2023.
- [28] D. Gao, Y. Liu, A. Huang, C. Ju, H. Yu, and Q. Yang, “Privacy-preserving heterogeneous federated transfer learning,” in 2019 IEEE International Conference on Big Data (Big Data), 2019, pp. 2552–2559.
- [29] J. Mori, I. Teranishi, and R. Furukawa, “Continual horizontal federated learning for heterogeneous data,” in 2022 International Joint Conference on Neural Networks (IJCNN), 2022, pp. 1–8.
- [30] D. Gao, C. Ju, X. Wei, Y. Liu, T. Chen, and Q. Yang, “Hhhfl: Hierarchical heterogeneous horizontal federated learning for electroencephalography,” arXiv preprint arXiv:1909.05784, 2019.
- [31] A. Rakotomamonjy, M. Vono, H. J. M. Ruiz, and L. Ralaivola, “Personalised federated learning on heterogeneous feature spaces,” arXiv preprint arXiv:2301.11447, 2023.
- [32] E. Hallaji, R. Razavi-Far, and M. Saif, Federated and Transfer Learning: A Survey on Adversaries and Defense Mechanisms. Cham: Springer International Publishing, 2023, pp. 29–55.
- [33] S. Hardy, W. Henecka, H. Ivey-Law, R. Nock, G. Patrini, G. Smith, and B. Thorne, “Private federated learning on vertically partitioned data via entity resolution and additively homomorphic encryption,” arXiv preprint arXiv:1711.10677, 2017.
- [34] K. Bonawitz, V. Ivanov, B. Kreuter, A. Marcedone, H. B. McMahan, S. Patel, D. Ramage, A. Segal, and K. Seth, “Practical secure aggregation for privacy-preserving machine learning,” in Proceedings of the 2017 ACM SIGSAC Conference on Computer and Communications Security, ser. CCS ’17. New York, NY, USA: Association for Computing Machinery, 2017, p. 1175–1191.
- [35] P. Mohassel and Y. Zhang, “Secureml: A system for scalable privacy-preserving machine learning,” in 2017 IEEE Symposium on Security and Privacy (SP), 2017, pp. 19–38.
- [36] T. Araki, J. Furukawa, Y. Lindell, A. Nof, and K. Ohara, “High-throughput semi-honest secure three-party computation with an honest majority,” in Proceedings of the 2016 ACM SIGSAC Conference on Computer and Communications Security, ser. CCS ’16. New York, NY, USA: Association for Computing Machinery, 2016, p. 805–817.
- [37] M. Abadi, A. Chu, I. Goodfellow, H. B. McMahan, I. Mironov, K. Talwar, and L. Zhang, “Deep learning with differential privacy,” in Proceedings of the 2016 ACM SIGSAC Conference on Computer and Communications Security, ser. CCS ’16. New York, NY, USA: Association for Computing Machinery, 2016, p. 308–318.
- [38] R. C. Geyer, T. Klein, and M. Nabi, “Differentially private federated learning: A client level perspective,” arXiv preprint arXiv:1712.07557, 2017.
- [39] Y. Liu, X. Zhang, and L. Wang, “Asymmetrical vertical federated learning,” arXiv preprint arXiv:2004.07427, 2020.