# Survey of Privacy Threats and Countermeasures in Federated Learning
**Authors**: Masahiro Hayashitani, Junki Mori, and Isamu Teranishi
> M. Hayashitani, J. Mori, and I. Teranishi are with NEC Secure System Platform Research Laboratories. E-mail:
## Abstract
Federated learning is widely considered to be as a privacy-aware learning method because no training data is exchanged directly between clients. Nevertheless, there are threats to privacy in federated learning, and privacy countermeasures have been studied. However, we note that common and unique privacy threats among typical types of federated learning have not been categorized and described in a comprehensive and specific way. In this paper, we describe privacy threats and countermeasures for the typical types of federated learning; horizontal federated learning, vertical federated learning, and transfer federated learning.
Index Terms: horizontal federated learning, vertical federated learning, transfer federated learning, threat to privacy, countermeasure against privacy threat.
## I Introduction
As computing devices become more ubiquitous, people generate vast amounts of data in their daily lives. Collecting this data in centralized storage facilities is costly and time-consuming [1]. Another important concern is user privacy and confidentiality, as usage data typically contains sensitive information. Sensitive data such as biometrics and healthcare can be used for targeted social advertising and recommendations, posing immediate or potential privacy risks. Therefore, private data should not be shared directly without any privacy considerations. As societies become more privacy-conscious, legal restrictions such as the General Data Protection Regulation (GDPR) and the EU AI ACT are emerging, making data aggregation practices less feasible. In this case, federated learning has emerged as a promising machine learning technique where each client learns and sends the information to a server.
Federated learning has attracted attention as a privacy-preserving machine learning technique because it can learn a global model without exchanging private raw data between clients. However, federated learning still poses a threat to privacy. Recent works have shown that federated learning may not always provide sufficient privacy guarantees, since the communication of model updates throughout the training process may still reveal sensitive information, even to a third party or to the central server [1]. Typical examples of federated learning include horizontal federated learning where features are common, vertical federated learning where IDs are common, and federated transfer learning where some features or IDs are common. However, we note that common and unique privacy threats among each type of federated learning have not been categorized and described in a comprehensive and specific way.
For example, in the case of horizontal federated learning, semi-honest server can infer client’s data by inference attacks on a model sent by the client. If the client is an attacker, the attacker can infer the data of other clients by inference attacks on a global model received from the server. Such an attack is possible because the global model is design to reflect the data of all clients. If the attacker is a third party that is neither a server nor a client, it can eavesdrop on models passing through the communication channel and infer client data through inference attacks. In vertical federated learning, the main threat to privacy is the identify leakage through identity matching between clients. In addition, since the intermediate outputs of a model are sent to the server, there is a possibility that client data can be inferred through an inference attack. Also, as in horizontal federated learning, client data can be inferred by an inference attack on the server. Finally, in federated transfer learning, member and attribute guessing attacks are possible by exploiting a prediction network. If IDs are common, gradient information is exchanged when features are made similar. Therefore member and attribute guessing attacks are possible by using gradient information. When there are common features among clients, attribute guessing attacks are possible by exploiting networks that complement the missing features from the common features.
In this paper, we discuss the above threats to privacy in detail and countermeasures against privacy threats in three types of federated learning; horizontal federated learning, vertical federated learning, and federated transfer learning. The paper is organized as follows: Section 2 presents learning methods for horizontal federated learning, vertical federated learning, and federated transfer learning; Section 3 discusses threats to privacy in each federated learning; Section 4 discusses countermeasures against privacy threats in each federated learning; and Section 5 concludes.
## II Categorization of Federated Learning
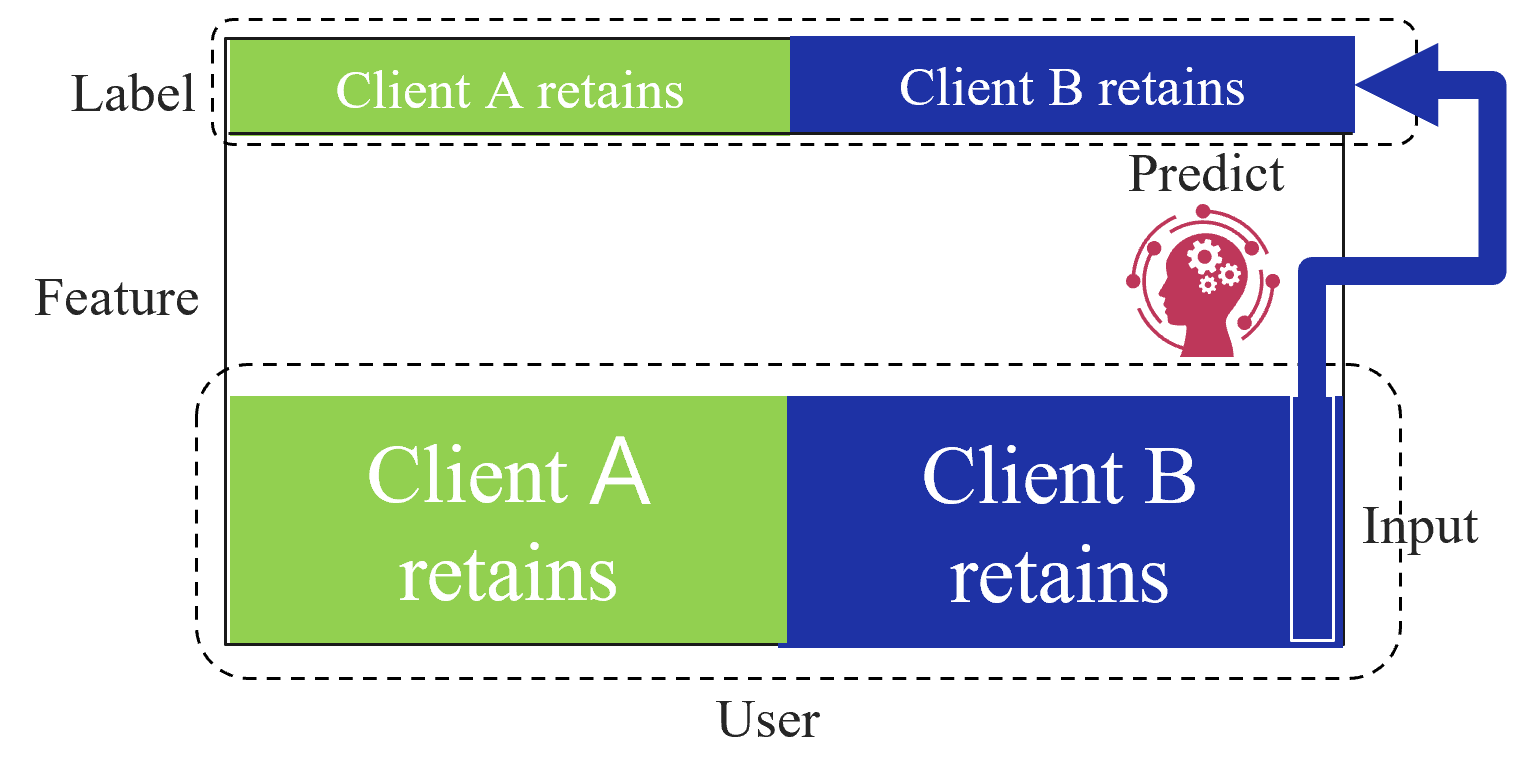
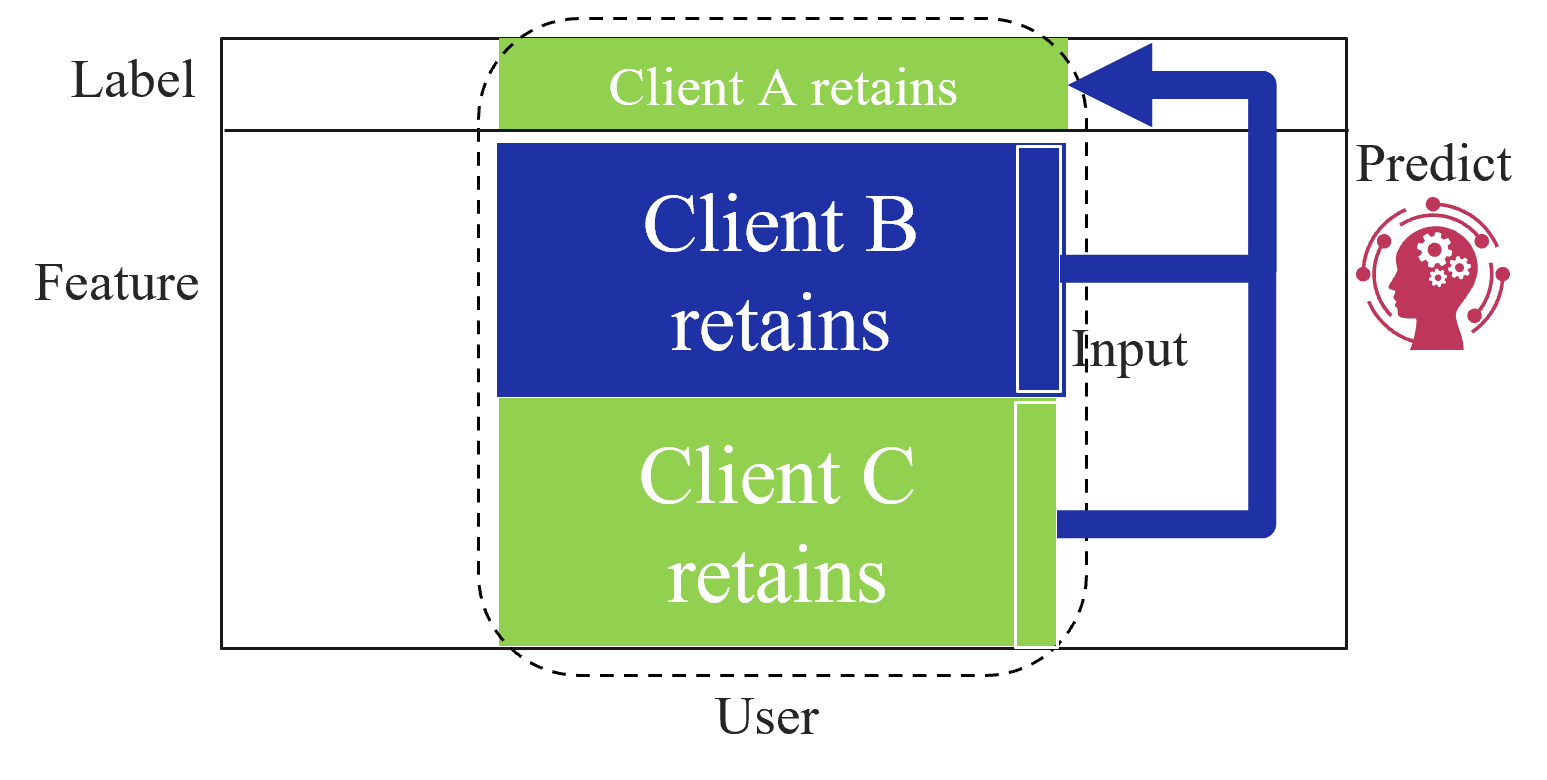
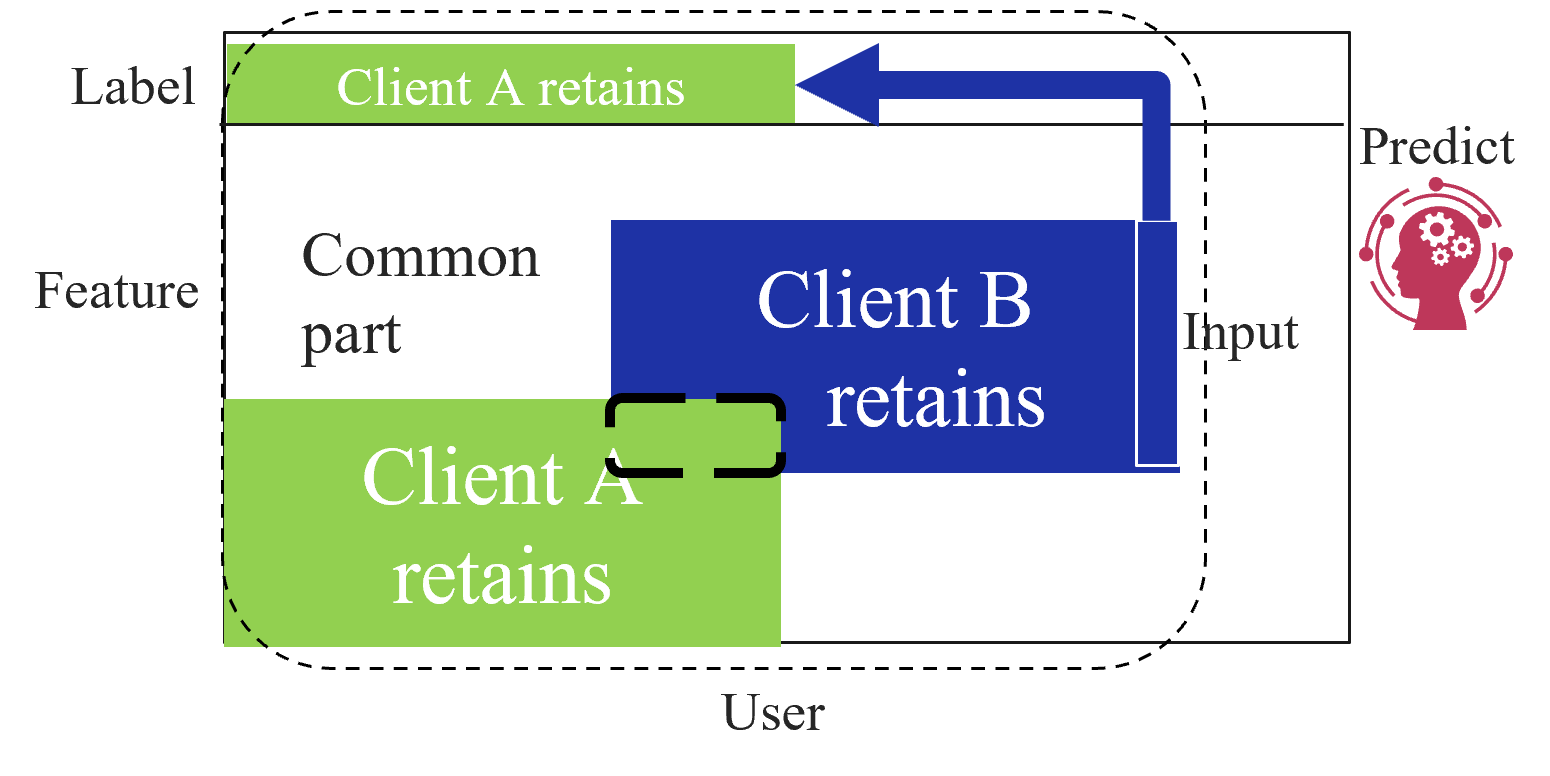
Based on the data structures among clients, federated learning is categorized into three types as first introduced by Yang et al. [2]: horizontal federated learning (HFL), vertical federated learning (VFL), and federated transfer learning (FTL). Figure 1 shows the data structure among clients for each type of federated learning. HFL assumes that each client has the same features and labels but different samples (Figure 1(a)). On the other hand, VFL assumes that each client has the same samples but disjoint features (Figure 1(a)). Finally, FTL applies to the scenario where each of the two clients has data that differ in not only samples but also features (Figure 1(c)).
In the following subsections, we describe the learning and prediction methods for each type of federated learning.
<details>
<summary>extracted/5379099/fig/HFL_structure.png Details</summary>
### Visual Description
## Diagram: Data Flow and Prediction Logic
### Overview
This diagram illustrates a data processing or machine learning workflow involving two primary data containers: "Label" and "User." It depicts a process where "Input" data, likely derived from the "User" section, is processed through a "Predict" mechanism to influence or align with the "Label" section. The diagram uses color-coded segments to distinguish between two categories: "Client A" and "Client B."
### Components/Axes
* **Top Box ("Label"):** A rectangular container with a dashed border. It contains a horizontal bar divided into two segments:
* **Left Segment (Green):** Labeled "Client A retains."
* **Right Segment (Dark Blue):** Labeled "Client B retains."
* **Bottom Box ("User"):** A larger rectangular container with a dashed border. It contains a horizontal bar divided into two segments:
* **Left Segment (Green):** Labeled "Client A retains."
* **Right Segment (Dark Blue):** Labeled "Client B retains."
* **Flow Path ("Input"):** A thick blue arrow originating from the right side of the "User" box, extending upward, and turning left to point directly into the "Client B retains" segment of the "Label" box.
* **Icon ("Predict"):** A red icon depicting a human head silhouette containing gears, positioned between the "Label" and "User" boxes, slightly to the right of center.
* **Labels:**
* "Label": Positioned to the left of the top box.
* "Feature": Positioned to the left of the empty space between the two boxes.
* "User": Positioned below the bottom box.
* "Predict": Positioned above the icon.
* "Input": Positioned to the right of the bottom box, near the start of the arrow.
### Detailed Analysis
* **Spatial Grounding:**
* The "Label" box is positioned at the top of the diagram.
* The "User" box is positioned at the bottom of the diagram.
* The "Feature" label is vertically centered between the two boxes on the far left.
* The "Input" arrow creates a vertical connection on the right side, linking the "User" domain to the "Label" domain.
* **Color Coding:**
* **Green:** Represents "Client A retains" in both the "Label" and "User" sections.
* **Dark Blue:** Represents "Client B retains" in both the "Label" and "User" sections.
* **Flow Logic:** The "Input" arrow specifically targets the "Client B retains" section of the "Label" box. This implies that the "Input" is a feature vector or data stream derived from the "User" that is being fed into the "Predict" function to generate or validate the "Client B" label.
### Key Observations
* **Symmetry:** Both the "Label" and "User" boxes share the same internal structure (Client A/Client B split), suggesting a mapping or comparison between these two datasets.
* **Targeted Flow:** The "Input" arrow does not interact with the "Client A" segments; it is exclusively routed to the "Client B" segment of the "Label" box.
* **Icon Placement:** The "Predict" icon acts as a bridge or transformation layer between the "User" data and the "Label" data.
### Interpretation
This diagram represents a supervised learning or data classification pipeline.
* **"User"** likely represents the raw input data or features available for a specific user.
* **"Label"** represents the ground truth or the target classification that the system aims to predict.
* **"Predict"** represents the model or inference engine.
* **The Logic:** The diagram demonstrates that the system is specifically processing "Client B" data. The "Input" (likely a feature set) is being passed through the "Predict" engine to determine or verify the "Client B" retention status. The exclusion of "Client A" from the "Input" flow suggests that the current process is either specific to "Client B" or that "Client A" is handled by a separate, unshown process. The "Feature" label on the left suggests that the entire diagram is a visualization of a "Feature" engineering or prediction step within a larger system architecture.
</details>
(a) Horizontal federated learning.
<details>
<summary>extracted/5379099/fig/VFL_structure.png Details</summary>
### Visual Description
## Diagram: Data Retention and Prediction Workflow Architecture
### Overview
The image is a schematic diagram illustrating a data processing or machine learning workflow. It depicts a system where data from three distinct entities ("Client A", "Client B", and "Client C") is retained and processed as an "Input" to a "Predict" function. The diagram uses color-coded blocks and directional arrows to suggest a flow of information.
### Components/Axes
* **Main Container:** A large, thin-lined rectangular frame containing a dashed-line rounded rectangle.
* **Data Blocks (Stacked Vertically):**
* **Top:** Light green block labeled "Client A retains".
* **Middle:** Dark blue block labeled "Client B retains".
* **Bottom:** Light green block labeled "Client C retains".
* **External Labels:**
* **"Label"**: Positioned at the top-left, outside the main container.
* **"Feature"**: Positioned at the middle-left, outside the main container.
* **"User"**: Positioned at the bottom-center, outside the main container.
* **"Predict"**: Positioned at the top-right, accompanied by an icon depicting a human head silhouette containing gears (symbolizing AI/Machine Learning).
* **Flow/Process Elements:**
* **"Input"**: A vertical text label positioned on the right side of the stacked blocks, adjacent to a vertical white bar that spans the height of the blocks.
* **Blue Arrow**: A thick, right-angled blue arrow originating from the "Input" region on the right, pointing upwards to the "Predict" section.
### Detailed Analysis
* **Spatial Layout:**
* The diagram is organized into a left-to-right and bottom-to-top flow. The "Label", "Feature", and "User" labels on the left act as descriptors or dimensions for the data contained within the central blocks.
* The "Client" blocks are centrally located within the dashed-line boundary.
* The "Predict" function is positioned at the top-right, serving as the destination for the data flow.
* **Color Coding:**
* **Light Green:** Used for "Client A retains" and "Client C retains".
* **Dark Blue:** Used for "Client B retains" and the feedback/flow arrow.
* **Data Flow:**
* The "Input" label and the associated vertical white bar suggest that data is being extracted or read from the "Client" blocks.
* The blue arrow indicates a directional movement of data from the "Input" area into the "Predict" module.
### Key Observations
* **Asymmetry in Retention:** While the blocks are uniform in size, the color coding (Green vs. Blue) implies a distinction between Client B and the others (Clients A and C), perhaps indicating different data types, priority levels, or retention policies.
* **System Integration:** The "Predict" icon (head with gears) strongly suggests that the "Input" is being fed into a machine learning model or an automated inference engine.
* **Contextual Labels:** The labels "Label", "Feature", and "User" on the left suggest that the data retained by the clients is categorized by these three dimensions.
### Interpretation
This diagram represents a high-level architectural view of a multi-tenant data pipeline.
1. **Data Categorization:** The labels "Label", "Feature", and "User" likely represent the schema or metadata associated with the data being processed.
2. **Multi-Tenancy:** The "Client A/B/C retains" blocks suggest that the system handles data for multiple clients, potentially with specific retention logic for each.
3. **Inference Loop:** The "Input" mechanism and the arrow pointing to "Predict" demonstrate that the system is designed to take the retained data, process it as an input, and generate a prediction.
4. **Investigative Note:** The visual distinction of "Client B" in dark blue, matching the color of the arrow, suggests that Client B's data might be the primary driver or the specific focus of the "Predict" function, or perhaps it represents a specific class of data currently being highlighted in the workflow. The "User" label at the bottom, centered, implies that the entire system is user-centric or that the "User" is the entity interacting with or generating the data for these clients.
</details>
(b) Vertical federated learning.
<details>
<summary>extracted/5379099/fig/FTL_structure.png Details</summary>
### Visual Description
## Diagram: Client Data Retention and Prediction Flow
### Overview
The image is a conceptual block diagram illustrating a multi-tenant data architecture. It delineates how two entities, "Client A" and "Client B," retain data or features, and how these components interact with a prediction mechanism. The diagram uses color-coded blocks (green for Client A, blue for Client B) and directional arrows to represent data flow and ownership.
### Components/Axes
* **Main Container:** A large rectangle with a dashed border enclosing the primary logic.
* **Labels (External):**
* **Label:** Positioned to the left of the top row.
* **Feature:** Positioned to the left of the middle/bottom section.
* **Input:** Positioned to the right of the middle section.
* **User:** Positioned at the bottom center, outside the main container.
* **Predict:** Positioned to the right, accompanied by a circular icon featuring a silhouette of a head with gears inside.
* **Internal Blocks:**
* **Client A retains (Top):** A light green rectangle located in the top-left quadrant.
* **Client A retains (Bottom):** A light green rectangle located in the bottom-left quadrant.
* **Client B retains:** A large, dark blue rectangle located on the right side of the container.
* **Common part:** A white, empty space located in the center-left, between the two "Client A" blocks.
* **Dashed Box:** A small, empty rectangle with a dashed border located in the center, overlapping the boundary between the "Common part" and the "Client B retains" block.
* **Flow Indicator:** A thick, dark blue arrow originating from the "Client B retains" block, pointing left, and then turning upward to point toward the top "Client A retains" block.
### Detailed Analysis
* **Spatial Grounding:**
* The diagram is organized into a grid-like structure.
* The top row is associated with the "Label" category.
* The middle/bottom rows are associated with the "Feature" category.
* The right side is associated with "Input."
* **Data Series/Ownership:**
* **Client A:** Occupies two distinct green zones. The top zone is aligned with the "Label" category, while the bottom zone is aligned with the "Feature" category.
* **Client B:** Occupies a single, large blue zone on the right, which appears to encompass both the "Label" and "Feature" vertical space.
* **Common Part:** A neutral white space exists between the Client A and Client B zones, suggesting shared or non-proprietary data.
* **Flow Logic:**
* The blue arrow indicates a directional dependency or data transfer. It suggests that information or a processed result from "Client B retains" is fed back into the top "Client A retains" section.
### Key Observations
* **Asymmetry:** Client B has a single, large, contiguous block, whereas Client A has two separated blocks.
* **The "Predict" Icon:** The "Predict" label and associated icon are placed outside the main container, suggesting that the prediction service is an external process or an overarching system that interacts with the internal data blocks.
* **The Dashed Box:** The small dashed box in the center is a focal point, likely representing a specific intersection, a "hot" zone, or a point of conflict/integration between the "Common part" and "Client B."
### Interpretation
This diagram likely represents a machine learning or data processing pipeline in a multi-tenant environment:
1. **Multi-Tenancy:** The system separates data retention by client ("Client A" vs. "Client B").
2. **Feature/Label Separation:** The vertical alignment suggests that "Label" data and "Feature" data are handled differently or stored in different segments.
3. **Prediction Pipeline:** The "Predict" icon suggests that the system takes "Input" (likely from Client B) and performs a prediction.
4. **Feedback Loop:** The blue arrow is the most critical element; it implies that the output of the prediction (or the data retained by Client B) is utilized to update or inform the "Label" data for Client A. This could represent a transfer learning scenario, where a model trained on Client B's data is used to generate labels or features for Client A.
5. **Commonality:** The "Common part" suggests that there is a shared infrastructure or dataset that both clients utilize, which is distinct from their private, retained data.
</details>
(c) Federated transfer learning.
Figure 1: Categorization of federated learning based on data structure owned by clients.
### II-A Horizontal Federated Learning
HFL is the most common federated learning category which was first introduced by Google [3]. The goal of HFL is for each client holding different samples to collaboratively improve the accuracy of a model with a common structure.
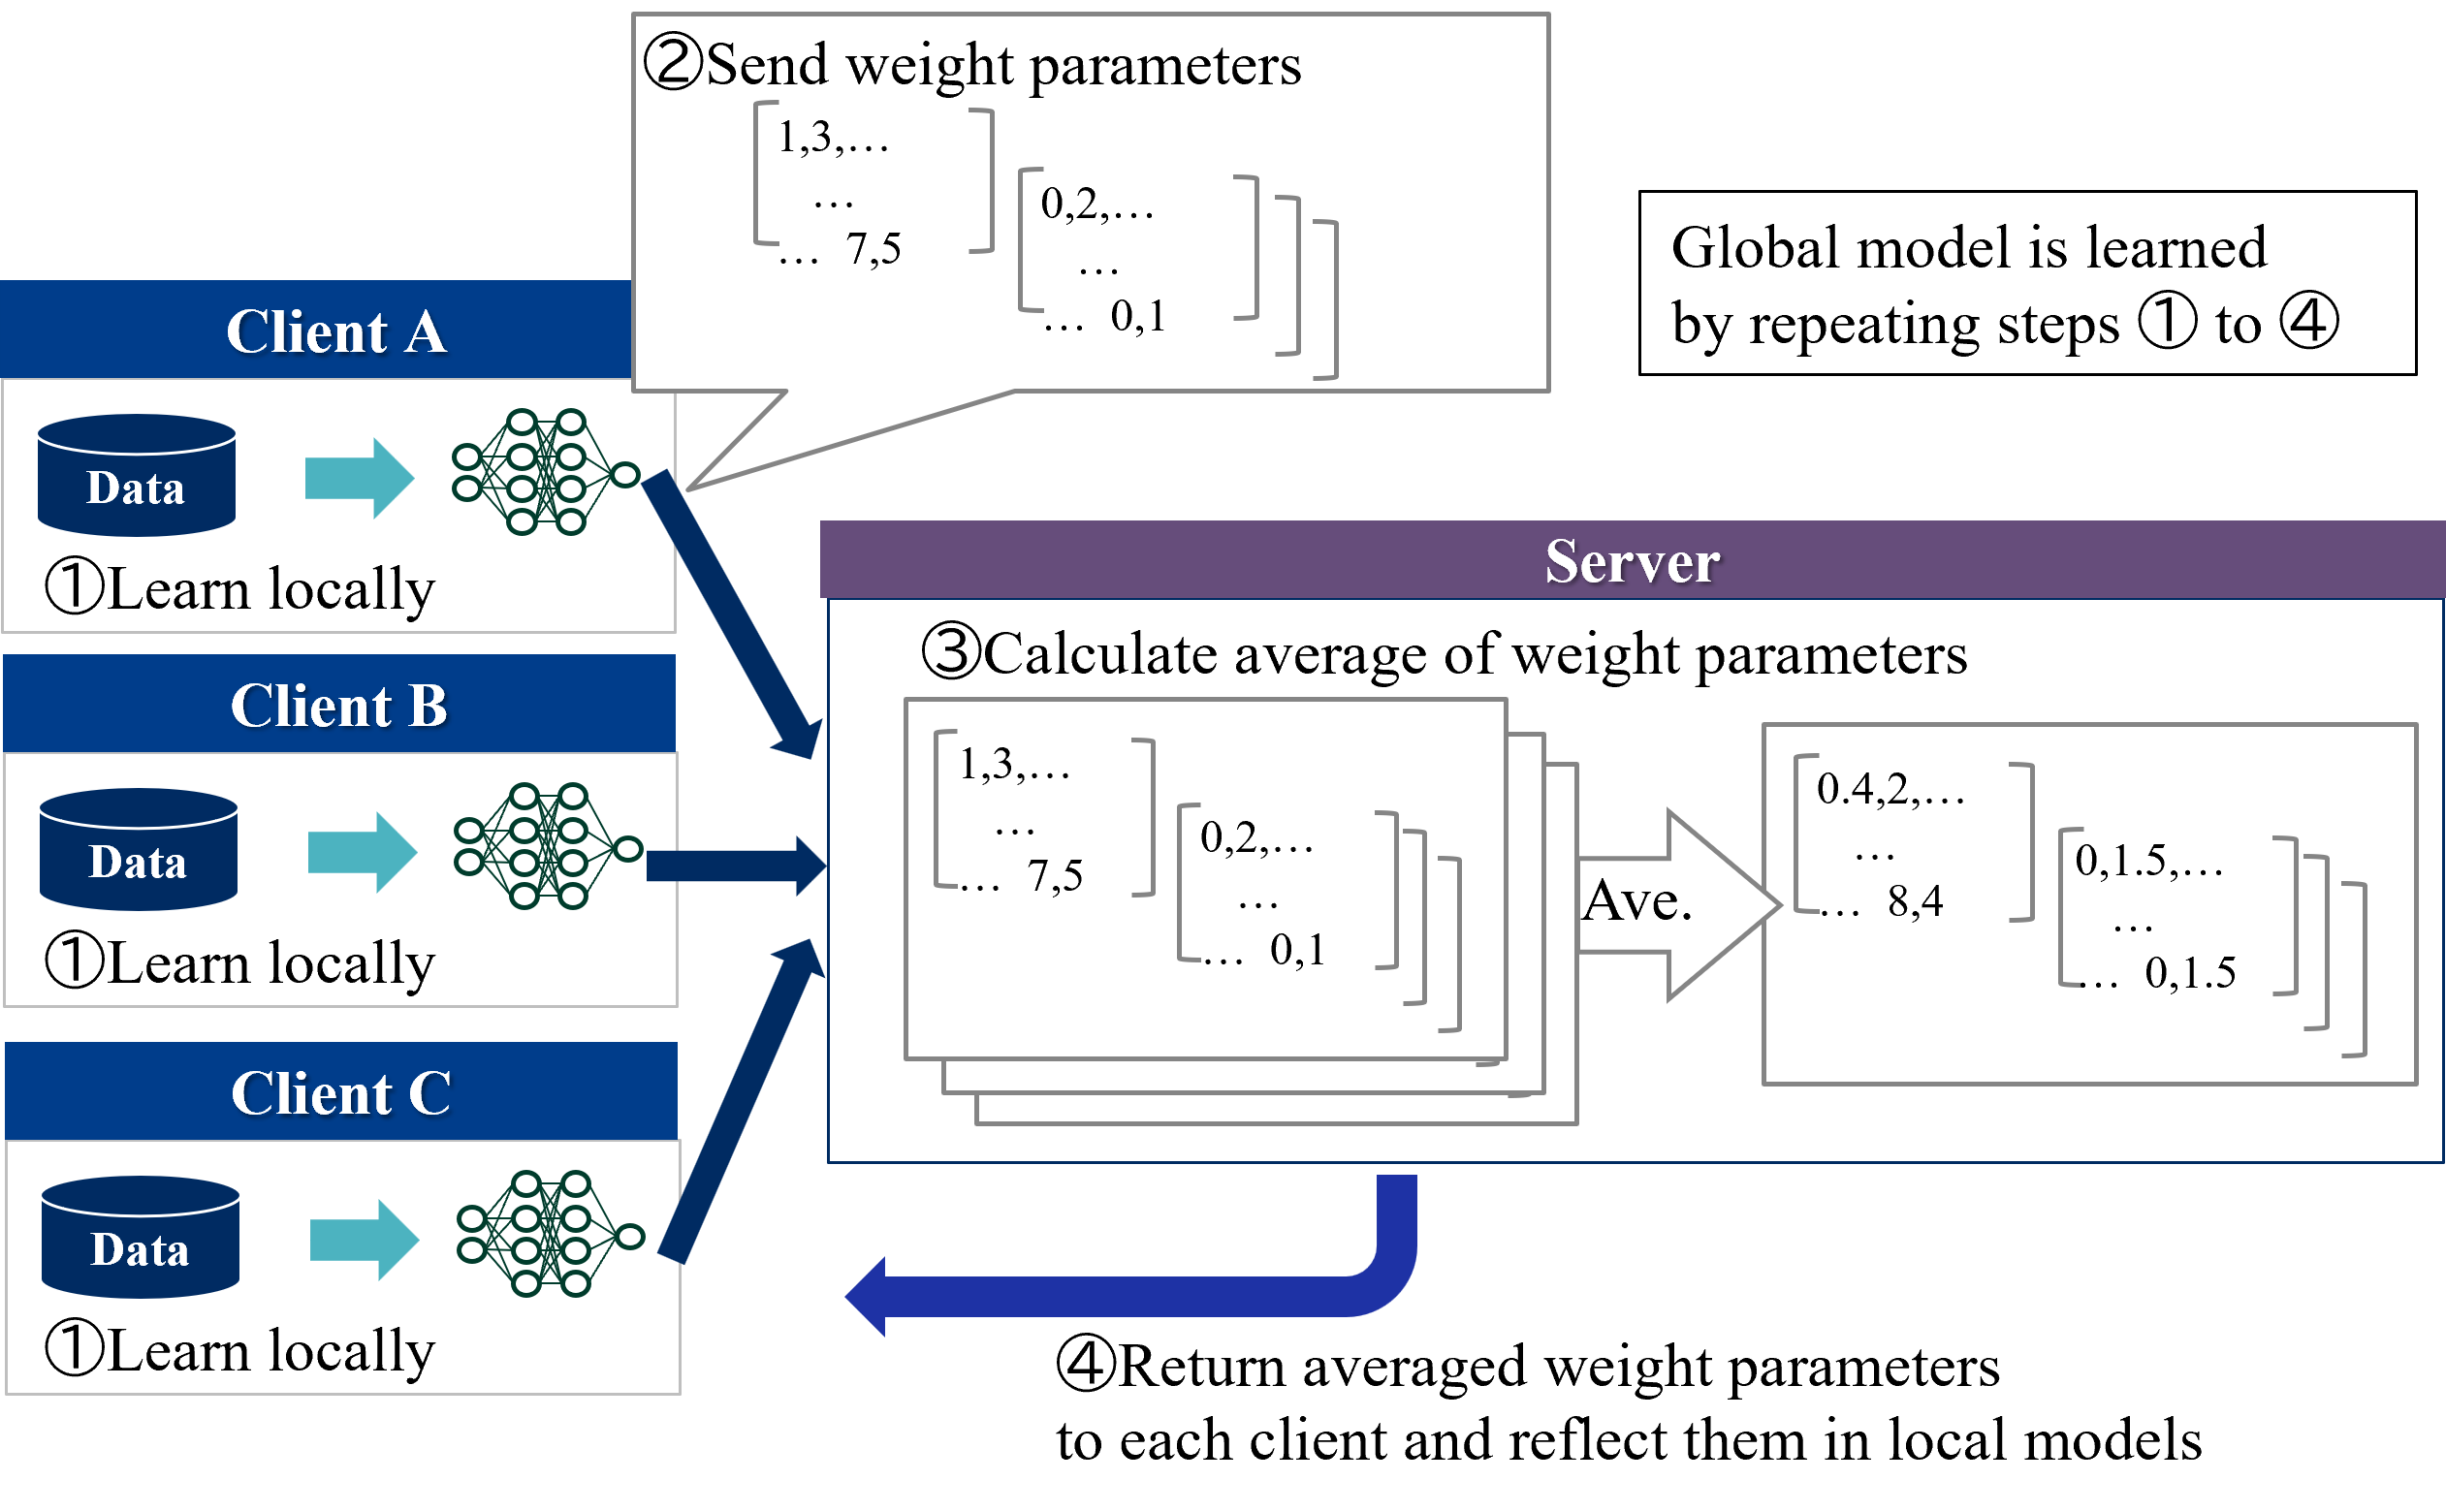
Figure 2 shows an overview of the HFL learning protocol. Two types of entities participate in learning of HFL:
1. Server - Coordinator. Server exchanges model parameters with the clients and aggregates model parameters received from the clients.
1. Clients - Data owners. Each client locally trains a model using their own private data and exchanges model parameters with the server.
Each clients first trains a local model for a few steps and sends the model parameters to the server. Next, the server updates a global model by aggregating (in standard methods such as FedAvg, simply averaging) the local models and sends it to all clients. This process is repeated until the convergence. During inference time, each client separately predicts the label using a global model and its own features.
The protocol described above is called centralized HFL because it requires a trusted third party, a central server. On the other hand, decentralized HFL, which eliminates the need for a central server, has emerged in recent years [4]. In decentralized HFL, clients directly communicates with each other, resulting in communication resource savings. There are various possible methods of communication between clients [4]. For example, the most common method for HFL of gradient boosting decision trees is for each client to add trees to the global model by sequence [5, 6, 7].
<details>
<summary>extracted/5379099/fig/LM_HFL.png Details</summary>
### Visual Description
## Diagram: Federated Learning Process Flow
### Overview
This image illustrates the iterative process of Federated Learning, a machine learning technique where a global model is trained across multiple decentralized edge devices (clients) holding local data samples, without exchanging the data itself. The diagram depicts the cycle of local training, parameter transmission, server-side aggregation, and the return of updated parameters to the clients.
### Components
The diagram is organized into three primary regions:
* **Left Region (Clients):** Three distinct blocks labeled "Client A", "Client B", and "Client C". Each block contains:
* A database icon labeled "Data".
* A neural network icon.
* The text label "1 Learn locally".
* **Center/Right Region (Server):** A large rectangular container with a purple header labeled "Server".
* Inside the server, there is a process block labeled "3 Calculate average of weight parameters".
* An "Ave." (Average) operation block.
* Input and output matrix representations.
* **Top-Right Region:** A text box stating: "Global model is learned by repeating steps 1 to 4".
* **Bottom Region:** A large blue arrow indicating the feedback loop, labeled "4 Return averaged weight parameters to each client and reflect them in local models".
### Detailed Analysis
#### Step 1: Local Learning
* **Location:** Left side, within each Client block.
* **Action:** Each client uses its local "Data" to train a local neural network.
* **Label:** "1 Learn locally".
#### Step 2: Sending Parameters
* **Location:** Top-center, originating from the Client A neural network icon.
* **Action:** A callout bubble points toward the Server.
* **Label:** "2 Send weight parameters".
* **Data Representation:** The bubble displays two matrix examples:
* Matrix 1: `[1,3,... / ... / ... 7,5]`
* Matrix 2: `[0,2,... / ... / ... 0,1]`
#### Step 3: Server Aggregation
* **Location:** Inside the Server box.
* **Action:** The server receives parameters from clients.
* **Label:** "3 Calculate average of weight parameters".
* **Process:** Multiple overlapping matrix stacks are fed into an "Ave." (Average) block.
* **Output:** The resulting averaged matrices are shown as:
* Matrix 1: `[0.4,2,... / ... / ... 8,4]`
* Matrix 2: `[0.1,5,... / ... / ... 0,1.5]`
#### Step 4: Feedback Loop
* **Location:** Bottom, spanning from the Server back to the Clients.
* **Action:** A large blue arrow indicates the return of the averaged weights.
* **Label:** "4 Return averaged weight parameters to each client and reflect them in local models".
### Key Observations
* **Cyclical Nature:** The diagram explicitly notes that the global model is learned by repeating steps 1 through 4, creating a continuous loop.
* **Data Privacy:** The diagram visually separates the "Data" (which stays inside the Client blocks) from the "weight parameters" (which are sent to the server). This highlights the privacy-preserving nature of Federated Learning, where raw data is never shared.
* **Aggregation Logic:** The "Ave." block is the central mathematical component, suggesting the use of a Federated Averaging (FedAvg) algorithm.
* **Numerical Placeholders:** The matrices shown (e.g., `[1,3,...]`) are illustrative placeholders representing the weight tensors of a neural network, rather than specific, real-world data values.
### Interpretation
This diagram provides a high-level architectural overview of Federated Learning.
* **Process Flow:** The logic follows a synchronous pattern: Clients compute gradients/weights locally, the server aggregates these weights to form a new global model, and the clients update their local models with this new global knowledge.
* **System Dynamics:** The "Ave." operation is the critical bottleneck and the point of intelligence for the server. By averaging the weights, the server effectively distills the knowledge learned from the disparate datasets of Clients A, B, and C into a single, more robust model.
* **Strategic Implication:** The diagram demonstrates that the "Global model" is an emergent property of the collective training process. The separation of the "Data" icon from the "weight parameters" flow is the most significant detail, as it visually confirms that the system is designed to protect user data privacy while still enabling collaborative machine learning.
</details>
Figure 2: Overview of the HFL learning protocol.
### II-B Vertical Federated Learning
VFL enables clients holding the different features of the same samples to collaboratively train a model which takes all of the various features each client has as input. There are VFL studies to deal with various models including linear/logistic regression [8, 9, 10, 11, 12], decision trees [13, 14, 15, 16, 17], neural networks [18, 19, 20, 21], and other non-linear models [22, 23].
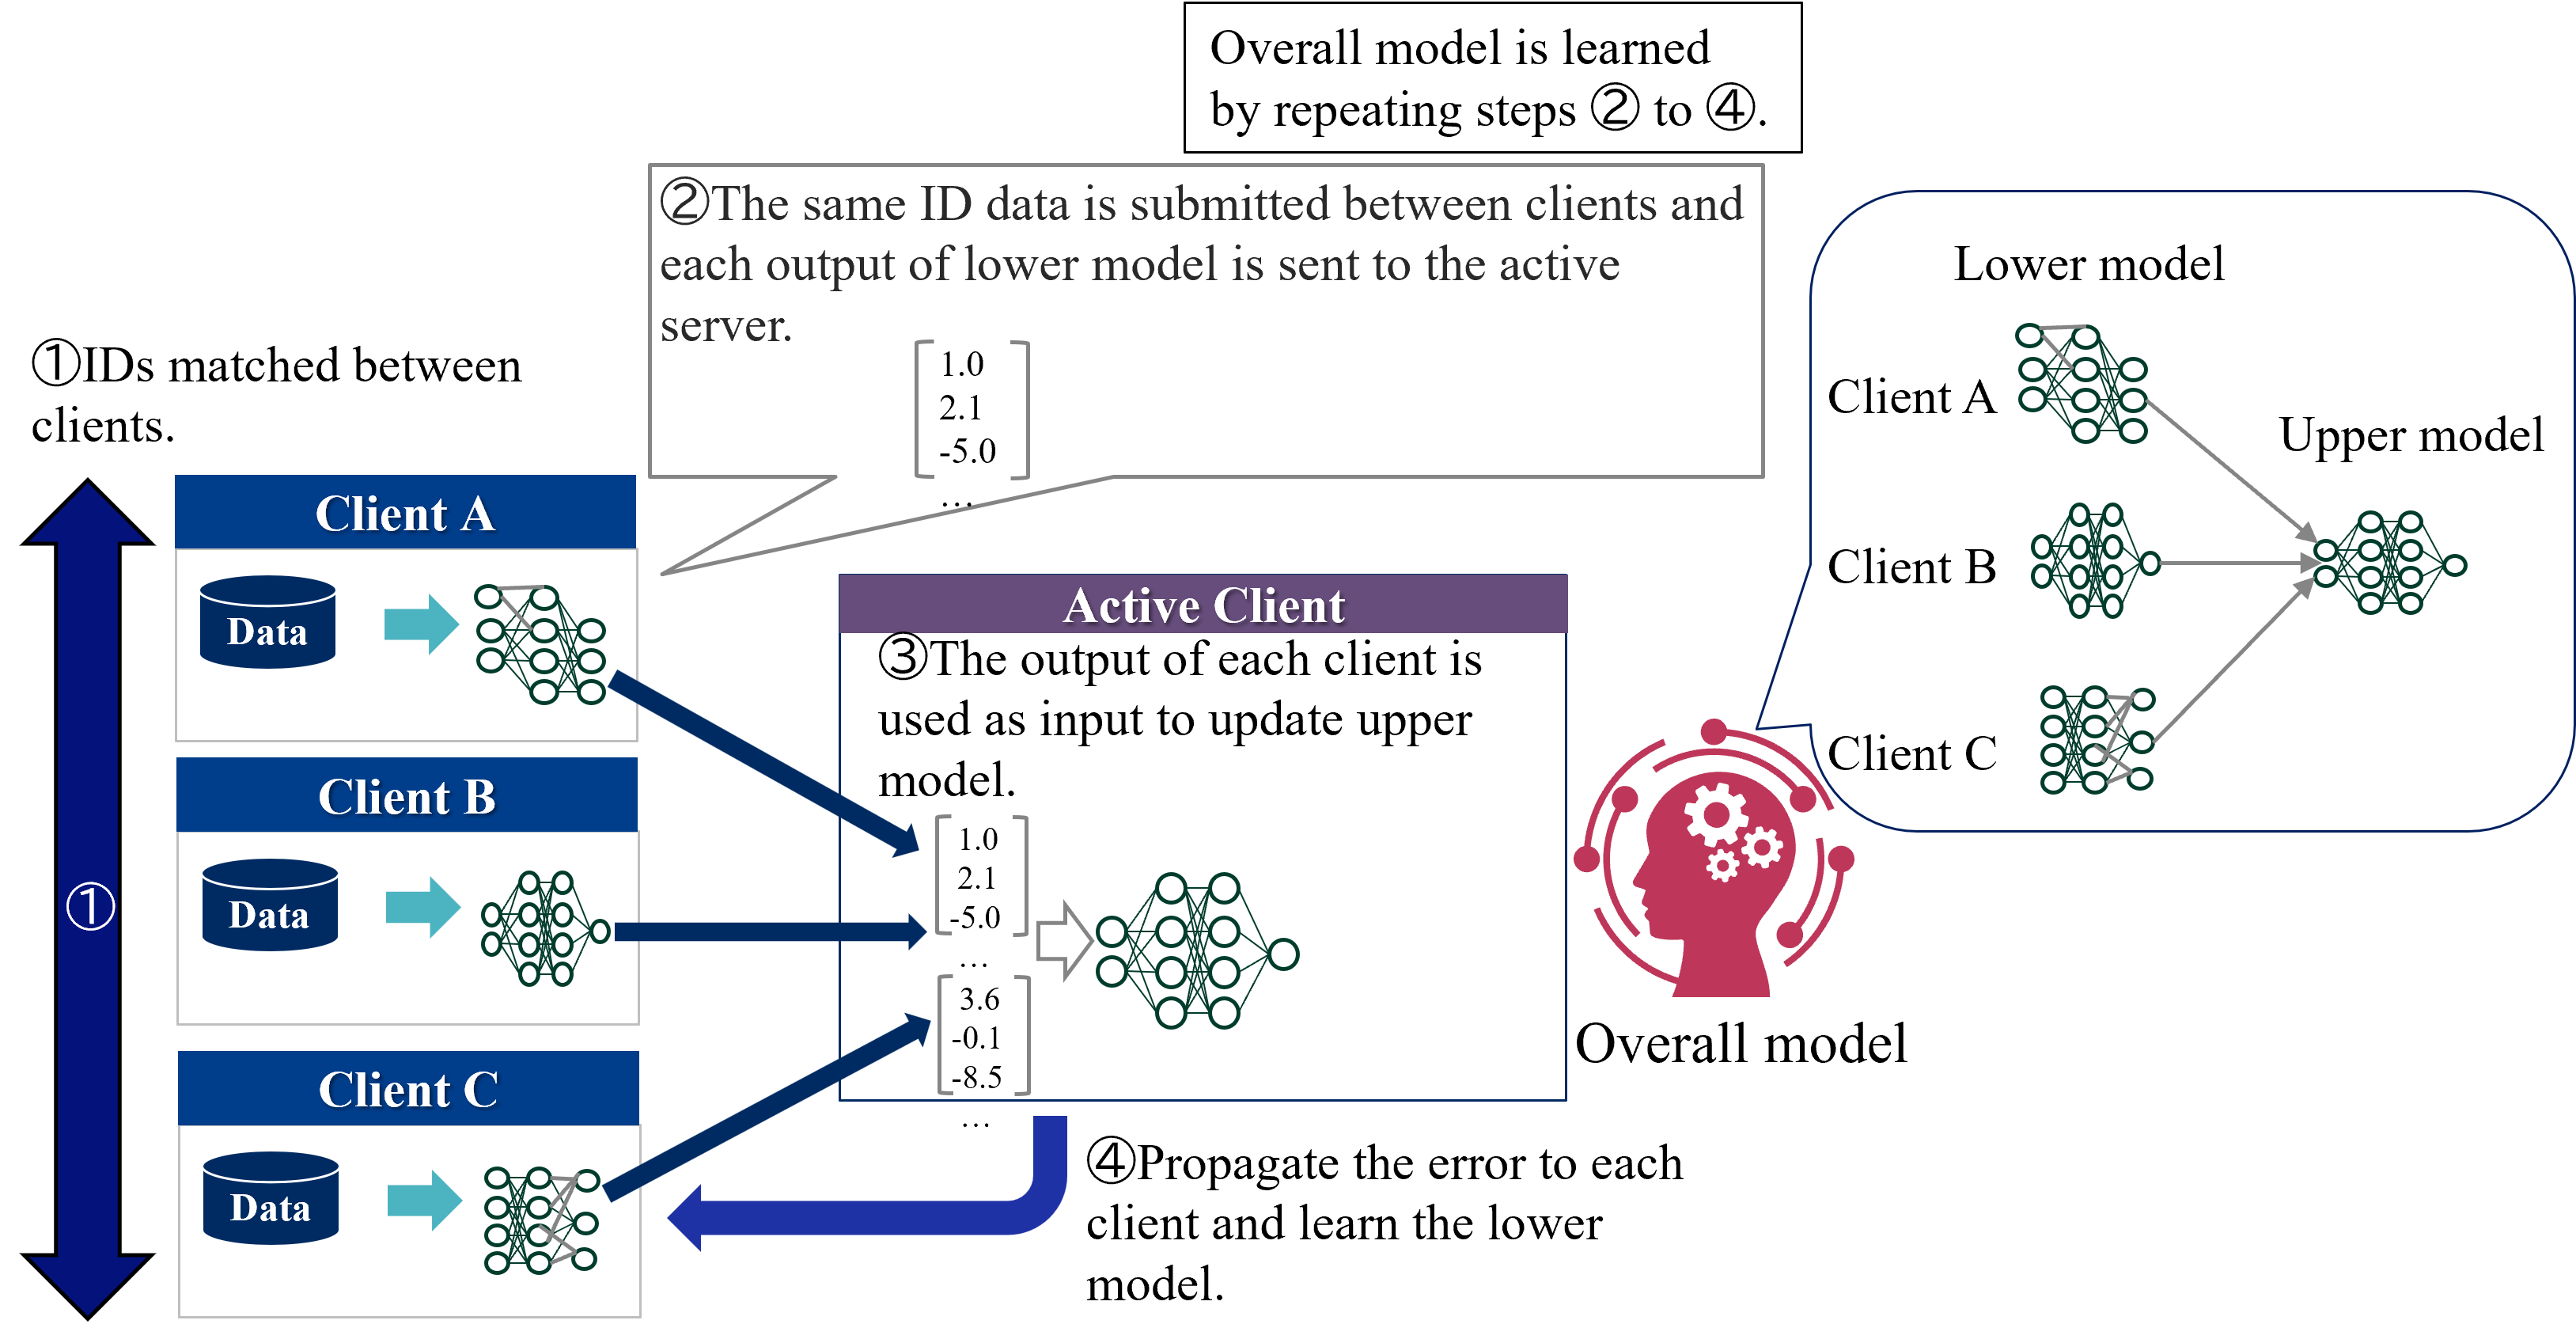
Figure 3 shows an overview of the standard VFL learning protocol. In VFL, only one client holds labels and it plays the role of a server. Therefore, two types of entities participate in learning of VFL:
1. Active client - Features and labels owner. Active client coordinates the learning procedure. It calculates the loss and exchanges intermediate results with the passive clients.
1. Passive clients - Features owners. Each passive client keeps both its features and model local but exchanges intermediate results with the active client.
VFL consists of two phases: IDs matching and learning phases. In IDs matching phases, all clients shares the common sample IDs. In learning phase, each client has a separate model with its own features as input, and the passive clients send the computed intermediate outputs to the active client. The active client calculates the loss based on the aggregated intermediate outputs and sends the gradients to all passive clients. Then, the passive clients updates its own model parameters. This process is repeated until the convergence. During inference time, all clients need to cooperate to predict the label of a sample.
<details>
<summary>extracted/5379099/fig/LM_VFL.png Details</summary>
### Visual Description
## Diagram: Split Learning / Vertical Federated Learning Architecture
### Overview
This diagram illustrates a distributed machine learning workflow, specifically a "Split Learning" or "Vertical Federated Learning" architecture. The process involves multiple clients (A, B, and C) collaborating to train an "Overall model" without sharing raw data. The model is partitioned into a "Lower model" (residing on clients) and an "Upper model" (residing on an "Active Client" or server). The system operates through an iterative process of forward propagation of intermediate data and backward propagation of error.
### Components/Axes
* **Left Column (Clients):** Three distinct blocks labeled "Client A", "Client B", and "Client C". Each contains a database icon labeled "Data" and a neural network icon representing the "Lower model".
* **Center Box (Active Client):** A central processing unit labeled "Active Client". It contains two vector representations and a neural network icon representing the "Upper model".
* **Right Side (Overall Model):** A large bubble labeled "Overall model" containing a schematic of the architecture: three "Lower model" networks feeding into a single "Upper model" network.
* **Workflow Steps:** Four numbered steps (1-4) define the operational sequence.
* **Vertical Axis (Left):** A large blue double-headed arrow labeled "(1)" indicating the alignment of data IDs across clients.
### Detailed Analysis
#### 1. Workflow Steps
* **(1) IDs matched between clients:** Located on the far left, this indicates that the data across Client A, B, and C is vertically aligned (i.e., they share the same sample IDs).
* **(2) The same ID data is submitted between clients and each output of lower model is sent to the active server:** Located at the top center. This step describes the forward pass where intermediate activations (represented by the vector $[1.0, 2.1, -5.0]^T$) are sent from the clients to the Active Client.
* **(3) The output of each client is used as input to update upper model:** Located in the center box. The Active Client receives the vectors (e.g., $[1.0, 2.1, -5.0]^T$ and $[3.6, -0.1, -8.5]^T$) and processes them through the "Upper model" neural network.
* **(4) Propagate the error to each client and learn the lower model:** Located at the bottom center. A large blue arrow points from the Active Client back to the clients, indicating the backpropagation of gradients to update the local "Lower models".
* **Iterative Loop:** A text box at the top center states: "Overall model is learned by repeating steps (2) to (4)."
#### 2. Data Representations
* **Intermediate Vectors:** The diagram explicitly shows two column vectors being processed:
* Vector 1: $\begin{bmatrix} 1.0 \\ 2.1 \\ -5.0 \end{bmatrix}$
* Vector 2: $\begin{bmatrix} 3.6 \\ -0.1 \\ -8.5 \end{bmatrix}$
* These represent the "smashed data" or intermediate activations sent from the lower models to the upper model.
### Key Observations
* **Architecture Split:** The "Overall model" is clearly bifurcated. The "Lower model" is distributed across clients (feature extraction), while the "Upper model" is centralized (decision/classification).
* **Communication Flow:** The communication is bidirectional. Forward pass sends activations (vectors) to the Active Client; backward pass sends error gradients back to the clients.
* **Active Client Role:** The Active Client acts as the central orchestrator, holding the "Upper model" and managing the training loop.
* **Visual Logic:** The diagram uses a color-coded system where blue arrows indicate the flow of data and error signals, and the red icon (a head with gears) symbolizes the "Overall model" intelligence.
### Interpretation
This diagram depicts a privacy-preserving machine learning technique. By splitting the model, the raw data never leaves the client's local environment. Instead, only the intermediate representations (the vectors shown) are transmitted.
* **Why it matters:** This architecture is critical for scenarios where data is siloed across different organizations (e.g., hospitals or banks) that cannot share raw data due to privacy regulations (like GDPR or HIPAA) but wish to collaborate on a shared predictive model.
* **Peircean Investigative Insight:** The "Active Client" is the point of vulnerability and control. It is the only component that sees the intermediate representations from all clients. If the "Upper model" is compromised, the intermediate representations could potentially be inverted to reconstruct the raw data. The "Overall model" bubble on the right serves as a conceptual abstraction, while the center box represents the operational reality of the training process. The inclusion of specific vector values suggests that the system is sensitive to the dimensionality of the intermediate layers.
</details>
Figure 3: Overview of the standard VFL learning protocol.
### II-C Federated Transfer Learning
FTL assumes two clients that shares only a small portion of samples or features. The goal of FTL is to create a model that can predict labels on the client that does not possess labels (target client), by transferring the knowledge of the other client that does possess labels (source client) to the target client.
Figure 4 shows an overall of the FTL learning protocol. As noted above, two types of entities participate in FTL:
1. Source client - Features and labels owner. Source client exchanges intermediate results such as outputs and gradients with the target client and calculates the loss.
1. Target client - Features owners. Target client exchanges intermediate results with the source client.
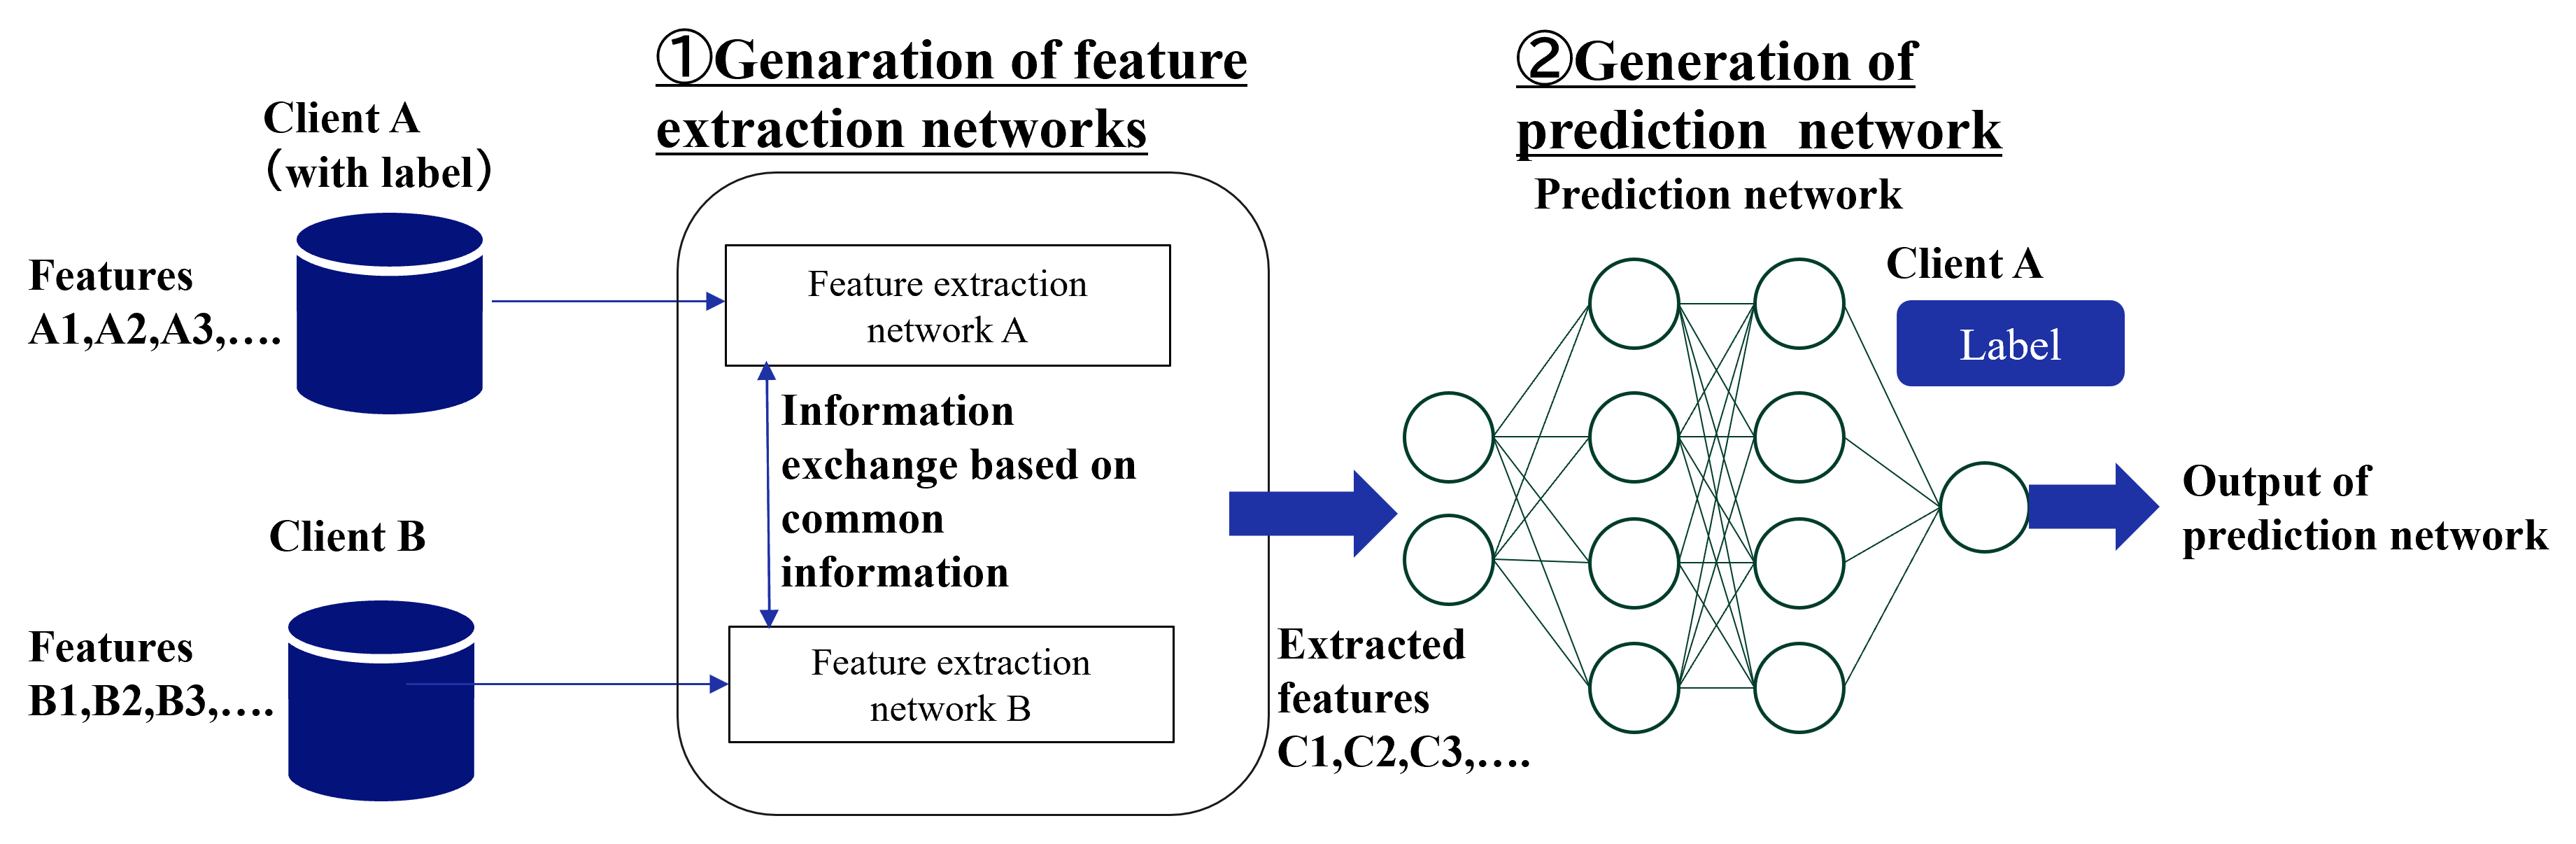
In FTL, two clients exchange intermediate outputs to learn a common representation. The source client uses the labeled data to compute the loss and sends the gradient to the target client, which updates the target client’s representation. This process is repeated until the convergence. During inference time, the target client predicts the label of a sample using its own model and features.
The detail of the learning protocol varies depending on the specific method. Although only a limited number of FTL methods have been proposed, we introduce three major types of methods. FTL requires some supplementary information to bridge two clients, such as common IDs [24, 25, 26, 27], common features [28, 29], and labels of target client [30, 31].
#### II-C 1 Common IDs
Most FTL methods assumes the existence of the common ID’s samples between two clients. This type of FTL requires ID matching before the learning phase as with VFL. Liu et al. [24] proposed the first FTL protocol, which learns feature transformation functions so that the different features of the common samples are mapped into the same features. The following work by Sharma et al. [25] improved communication overhead of the first FTL using multi-party computation and enhanced the security by incorporating malicious clients. Gao et al. [27] proposed a dual learning framework in which two clients impute each other’s missing features by exchanging the outputs of the imputation models for the common samples.
#### II-C 2 Common features
In real-world applications, it is difficult to share samples with the same IDs. Therefore, Gao et al. [28] proposed a method to realize FTL by assuming common features instead of common samples. In that method, two clients mutually reconstruct the missing features by using exchanged feature mapping models. Then,using all features, the clients conduct HFL to obtain a label prediction model. In the original paper, the authors assumes that all clients posses labels, but this method is applicable to the target client that does not posses labels because the source client can learn the label prediction model only by itself. Mori et al. [29] proposed a method for neural networks in which each client incorporates its own unique features in addition to common features into HFL training. However, their method is based on HFL and cannot be applied to the target clients that does not possess labels.
#### II-C 3 Labels of target client
This type of methods assumes neither common IDs nor features, but instead assumes that all clients possess labels, allowing a common representation to be learned across clients. Since it is based on HFL, the participating entities are the same as in HFL. Gao et al. [30] learns a common representation by exchanging the intermediate outputs with the server and reducing maximum mean discrepancy loss. Rakotomamonjy et al. [31] proposed a method to learn a common representation by using Wasserstein distance for intermediate outputs, which enables that the clients only need to exchange statistical information such as mean and variance with the server.
<details>
<summary>extracted/5379099/fig/LM_FTL.png Details</summary>
### Visual Description
## Diagram: System Architecture for Feature Extraction and Prediction
### Overview
This diagram illustrates a two-stage machine learning architecture. The process begins with the extraction of features from two distinct data sources (Client A and Client B) using a collaborative network structure. These extracted features are then fed into a secondary prediction network to produce a final output.
### Components/Flow
The diagram is organized into two primary stages, flowing from left to right:
**1. Left Region: Data Input**
* **Client A (with label):** Represented by a dark blue cylinder icon.
* Associated text: "Features A1, A2, A3, ..."
* **Client B:** Represented by a dark blue cylinder icon.
* Associated text: "Features B1, B2, B3, ..."
**2. Center Region: Feature Extraction (Stage 1)**
* **Header:** "①Generation of feature extraction networks"
* **Internal Components:**
* "Feature extraction network A" (Top box)
* "Feature extraction network B" (Bottom box)
* **Interaction:** A vertical bidirectional arrow connects the two networks, labeled: "Information exchange based on common information."
**3. Right Region: Prediction (Stage 2)**
* **Header:** "②Generation of prediction network"
* **Sub-header:** "Prediction network"
* **Input:** A large blue arrow points from the Feature Extraction stage to the Prediction Network, labeled "Extracted features C1, C2, C3, ...".
* **Neural Network Visualization:** A graph consisting of nodes (circles) and connecting lines, arranged in four layers (input layer, two hidden layers, output layer).
* **Additional Input:** A blue box labeled "Client A" with a sub-label "Label" feeds into the prediction network.
* **Final Output:** A blue arrow pointing to the right, labeled "Output of prediction network."
### Detailed Analysis
* **Stage 1 (Feature Extraction):** The system takes raw features from two clients (A and B). These inputs are processed by separate networks. The critical design element here is the "Information exchange" mechanism, which suggests that the networks are not trained in isolation but are designed to share knowledge or align representations based on shared/common information.
* **Stage 2 (Prediction):** The output of the first stage (the "Extracted features C1, C2, C3...") serves as the input for the prediction network. This network appears to be a standard feed-forward neural network.
* **Integration:** The prediction network integrates the extracted features with specific "Label" data associated with "Client A." This implies that the prediction task is likely supervised, using Client A's labels as the ground truth or target variable.
### Key Observations
* **Collaborative Learning:** The bidirectional arrow between the two feature extraction networks is the most significant architectural feature, indicating a multi-view or federated learning approach where the two clients benefit from each other's data distributions.
* **Asymmetry:** While both clients contribute to the feature extraction stage, only Client A is explicitly shown providing a "Label" to the prediction network, suggesting Client A may be the primary domain or the source of the target variable.
### Interpretation
This diagram depicts a **Multi-View or Federated Learning architecture**.
The logic suggests that the system aims to solve a prediction problem where data is distributed across two clients (A and B). Because the clients might have different feature spaces (A1... vs B1...), the system uses a collaborative feature extraction process to align these disparate inputs into a unified representation ("Extracted features C1, C2, C3...").
By exchanging information during the extraction phase, the system likely creates a more robust feature set than if each client were processed independently. The final prediction network then consumes these refined features, combined with the specific labels from Client A, to perform the final inference. This is a common pattern in scenarios where one client has labeled data (Client A) and another client has unlabeled or auxiliary data (Client B) that can help improve the model's performance.
</details>
Figure 4: Overall of the FTL learning protocol.
## III Threats to Privacy in Each Federated Learning
In this section, we describe threats to privacy in each federated learning. Table I shows threads to privacy addressed in each federated learning. An inference attack uses data analysis to gather unauthorized information about a subject or database. If an attacker can confidently estimate the true value of a subject’s confidential information, it can be said to have been leaked. The most frequent variants of this approach are membership inference and feature [32]. In addition, we address privacy threats of label inference and ID leakage.
TABLE I: Threads to privacy addressed in each federated learning
| HFL VFL FTL (common features) | Low or above Already known Low | Already known Low or above Low or above | None Low or above Low or above | None High None |
| --- | --- | --- | --- | --- |
| FTL (common IDs) | Low | Low or above | Low or above | High |
### III-A Horizontal Federated Learning
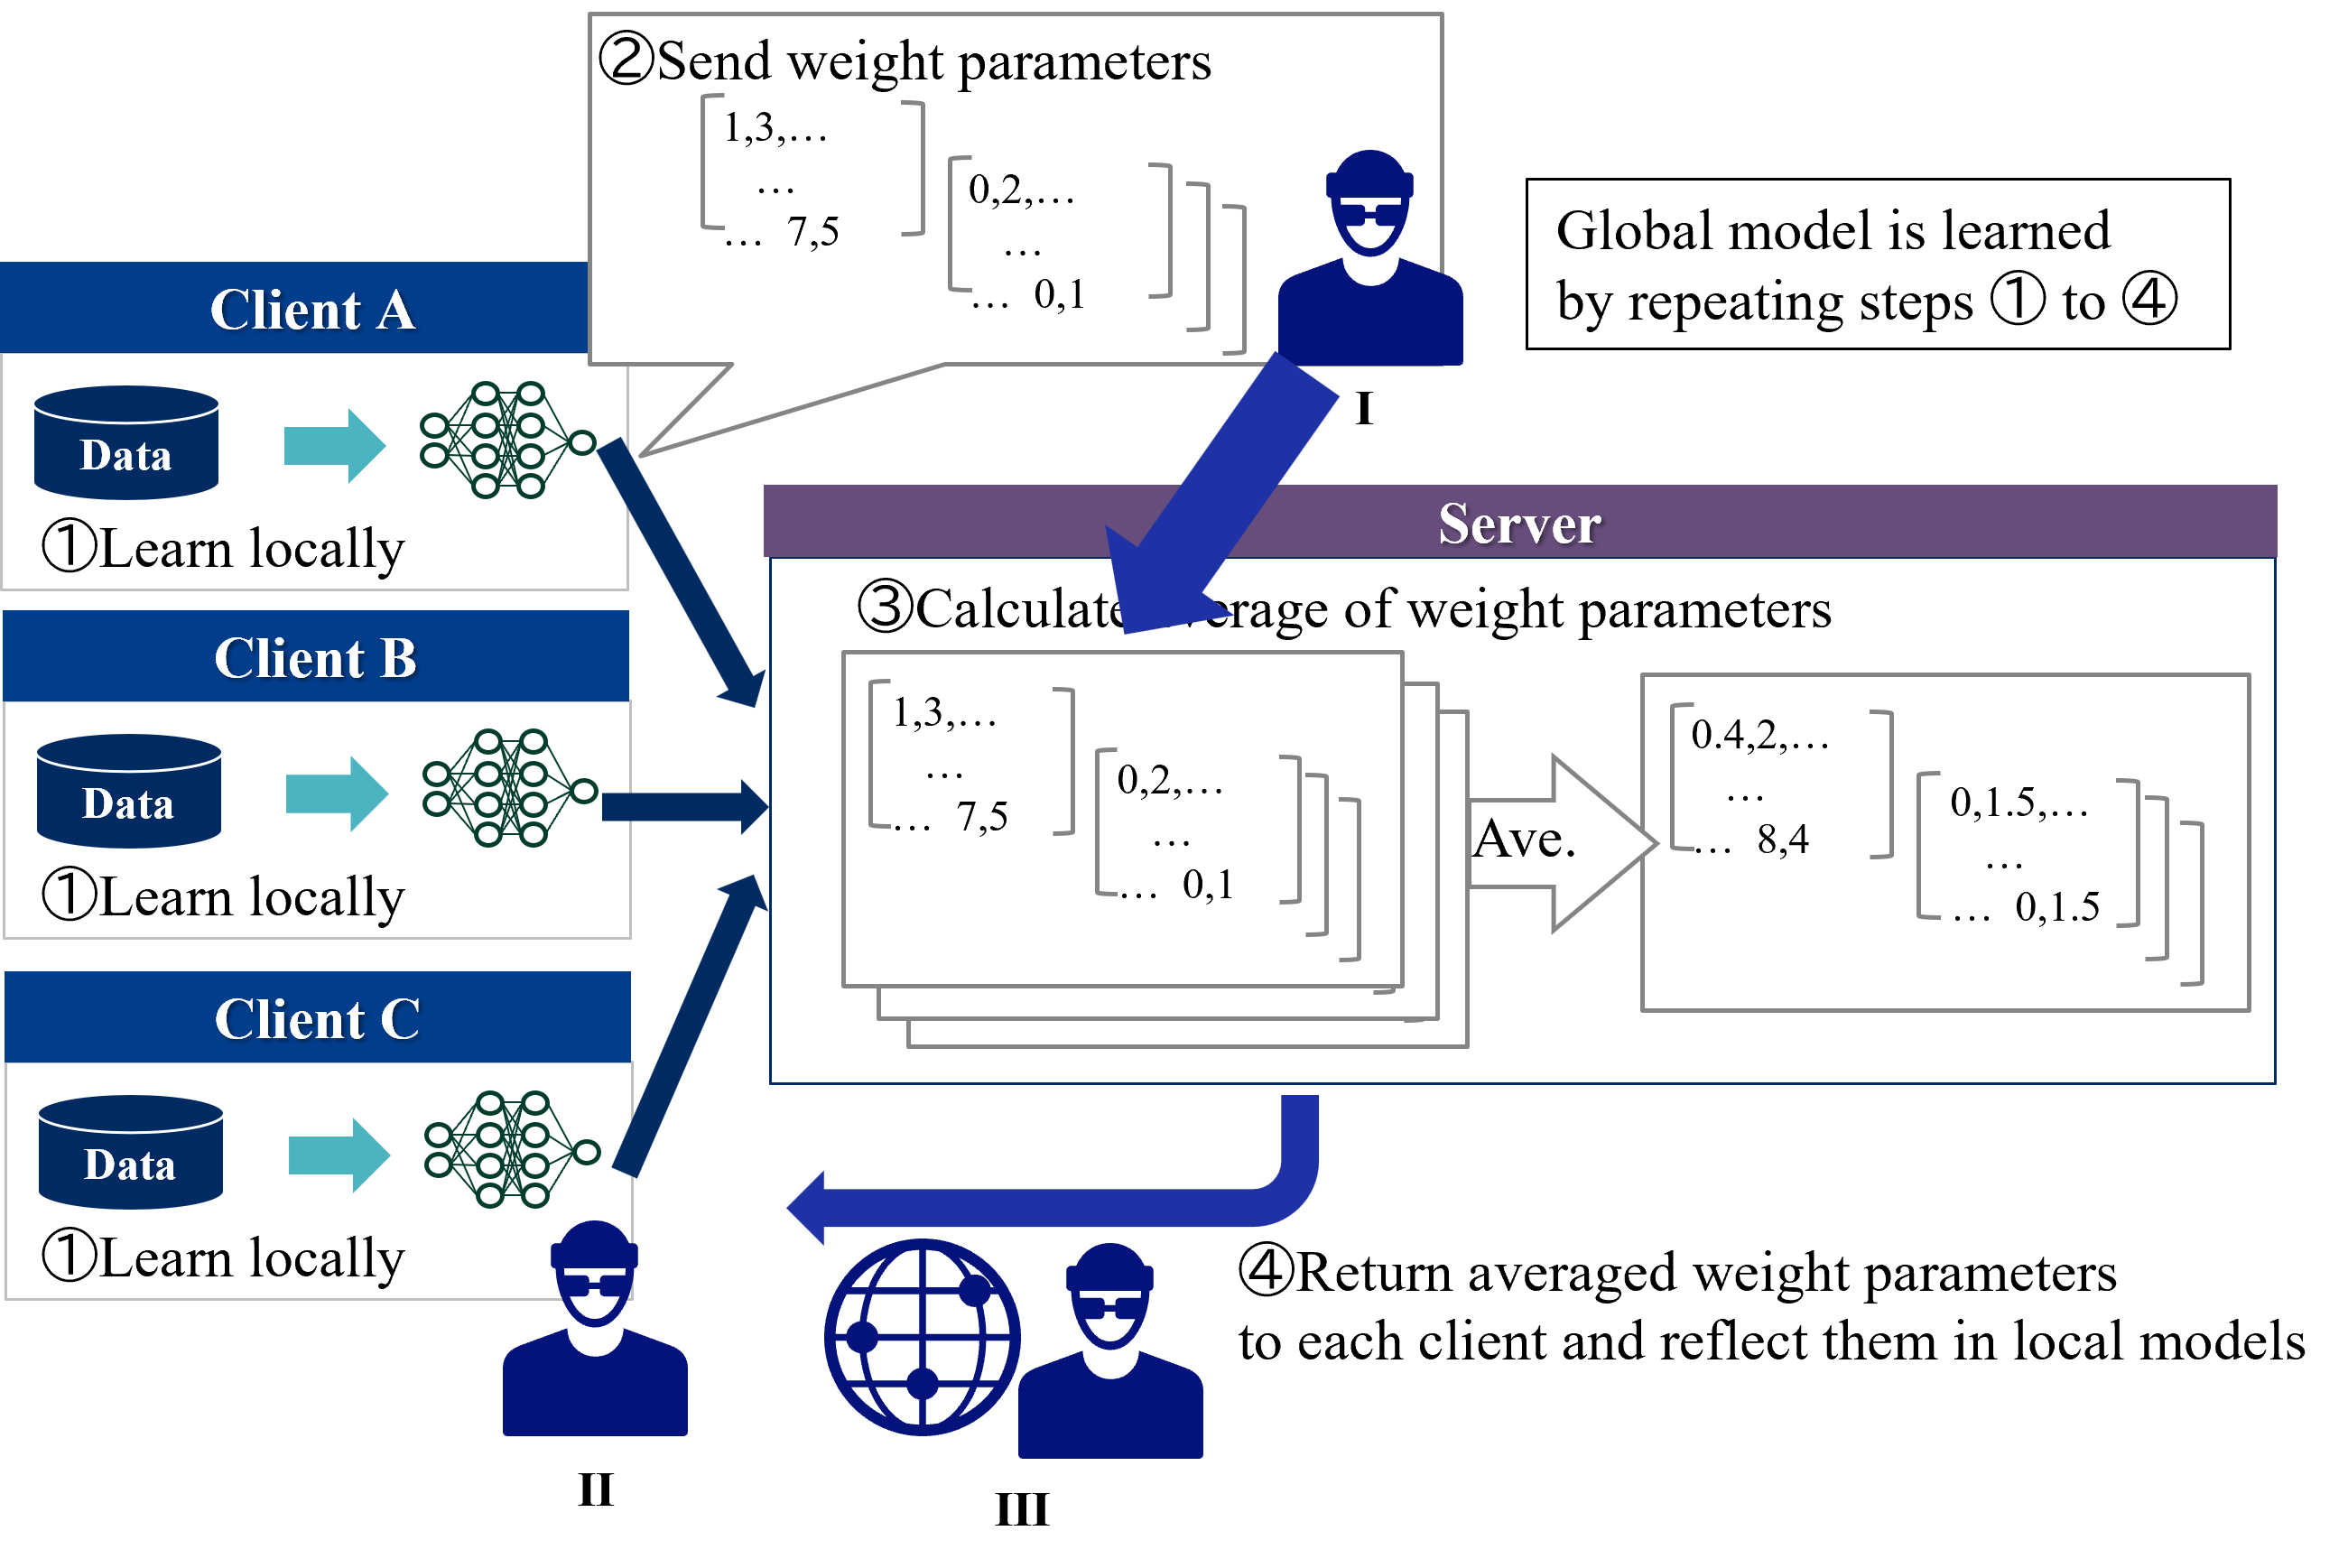
In HFL, client data is a major threat to privacy. Figure 5 shows threats to privacy in HFL. Possible attackers are as follows:
1. Server: Inference attack against the model to infer client data.
1. Clients: Inference attack against the global model received from the server to infer other clients’ data.
1. Third party: Eavesdrop on models that pass through the communication channel and infer client data through inference attacks.
<details>
<summary>extracted/5379099/fig/TP_HFL.png Details</summary>
### Visual Description
## Diagram: Federated Learning Process Flow
### Overview
The image is a technical process diagram illustrating the architecture and workflow of Federated Learning. It depicts a distributed system where multiple clients (Client A, Client B, Client C) train a model locally on their own data and communicate only weight parameters—not raw data—to a central server. The server aggregates these weights to update a global model, which is then distributed back to the clients.
### Components/Axes
* **Clients (Left Column):** Three distinct rectangular regions labeled "Client A", "Client B", and "Client C". Each contains:
* A database icon labeled "Data".
* A neural network icon (nodes and connections).
* A label "① Learn locally" below the neural network.
* **Server (Center/Right):** A large, central rectangular box labeled "Server".
* **Process Steps:** Numbered steps 1 through 4, describing the iterative lifecycle of the model.
* **Entities:** Three stylized human figures labeled "I", "II", and "III".
* **Mathematical Notation:** Matrix-like brackets representing weight tensors (e.g., `[1,3,... ... 7,5]`).
### Detailed Analysis
#### 1. Local Training (Step 1)
* **Position:** Left side, within each Client block.
* **Action:** Each client processes its local "Data" through a neural network.
* **Label:** "① Learn locally".
#### 2. Weight Transmission (Step 2)
* **Position:** Top-center, originating from the clients and pointing toward the Server.
* **Action:** Clients send their learned weight parameters to the server.
* **Label:** "② Send weight parameters".
* **Notation:** The weights are represented as matrices:
* Matrix 1: `[1,3,... ... 7,5]`
* Matrix 2: `[0,2,... ... 0,1]`
#### 3. Aggregation (Step 3)
* **Position:** Center of the Server box.
* **Action:** The server receives multiple weight matrices, stacks them, and calculates the average.
* **Label:** "③ Calculate average of weight parameters".
* **Notation:** The diagram shows multiple overlapping matrices entering an "Ave." (Average) function block.
* **Output:** The resulting averaged weights are shown as:
* Matrix 1: `[0.4,2,... ... 8,4]`
* Matrix 2: `[0,1.5,... ... 0,1.5]`
#### 4. Model Update (Step 4)
* **Position:** Bottom-center, pointing from the Server back to the Clients.
* **Action:** The server returns the averaged weights to the clients to update their local models.
* **Label:** "④ Return averaged weight parameters to each client and reflect them in local models".
#### 5. Global Context
* **Position:** Top-right, inside a text box.
* **Text:** "Global model is learned by repeating steps 1 to 4".
### Key Observations
* **Privacy Preservation:** The diagram explicitly shows "Data" icons remaining within the Client blocks, while only "weight parameters" move to the server. This visually confirms that raw data is never shared.
* **Iterative Nature:** The text in the top-right box confirms this is a cyclic process, not a one-time event.
* **Mathematical Abstraction:** The matrices are symbolic representations of high-dimensional tensors used in deep learning. The values (e.g., `0.4`, `1.5`) are illustrative placeholders rather than specific data points.
* **Entities:** The figures labeled I, II, and III appear to represent the stakeholders or participants in the federated ecosystem, though their specific roles are not defined by text.
### Interpretation
This diagram is a standard representation of the **Federated Averaging (FedAvg)** algorithm.
* **What the data demonstrates:** It demonstrates the decoupling of model training from data storage. By moving the computation to the data (at the client level) rather than moving the data to the computation (at the server level), the system achieves privacy and efficiency.
* **How elements relate:** The relationship is a hub-and-spoke model. The server acts as the central coordinator (hub), and the clients act as the distributed workers (spokes). The flow is bidirectional: weights go up (Step 2), and updated parameters come down (Step 4).
* **Reading between the lines:** The inclusion of the "I", "II", and "III" figures suggests that this process is not just a technical flow but a multi-party interaction. The "Ave." (Average) step is the critical point of the diagram; it is where the "Global model" is synthesized from the diverse experiences of the individual clients. The diagram implies that the global model's intelligence is the sum of the local models' experiences, without the server ever "seeing" the raw data.
</details>
Figure 5: Threats to privacy in HFL.
### III-B Vertical Federated Learning
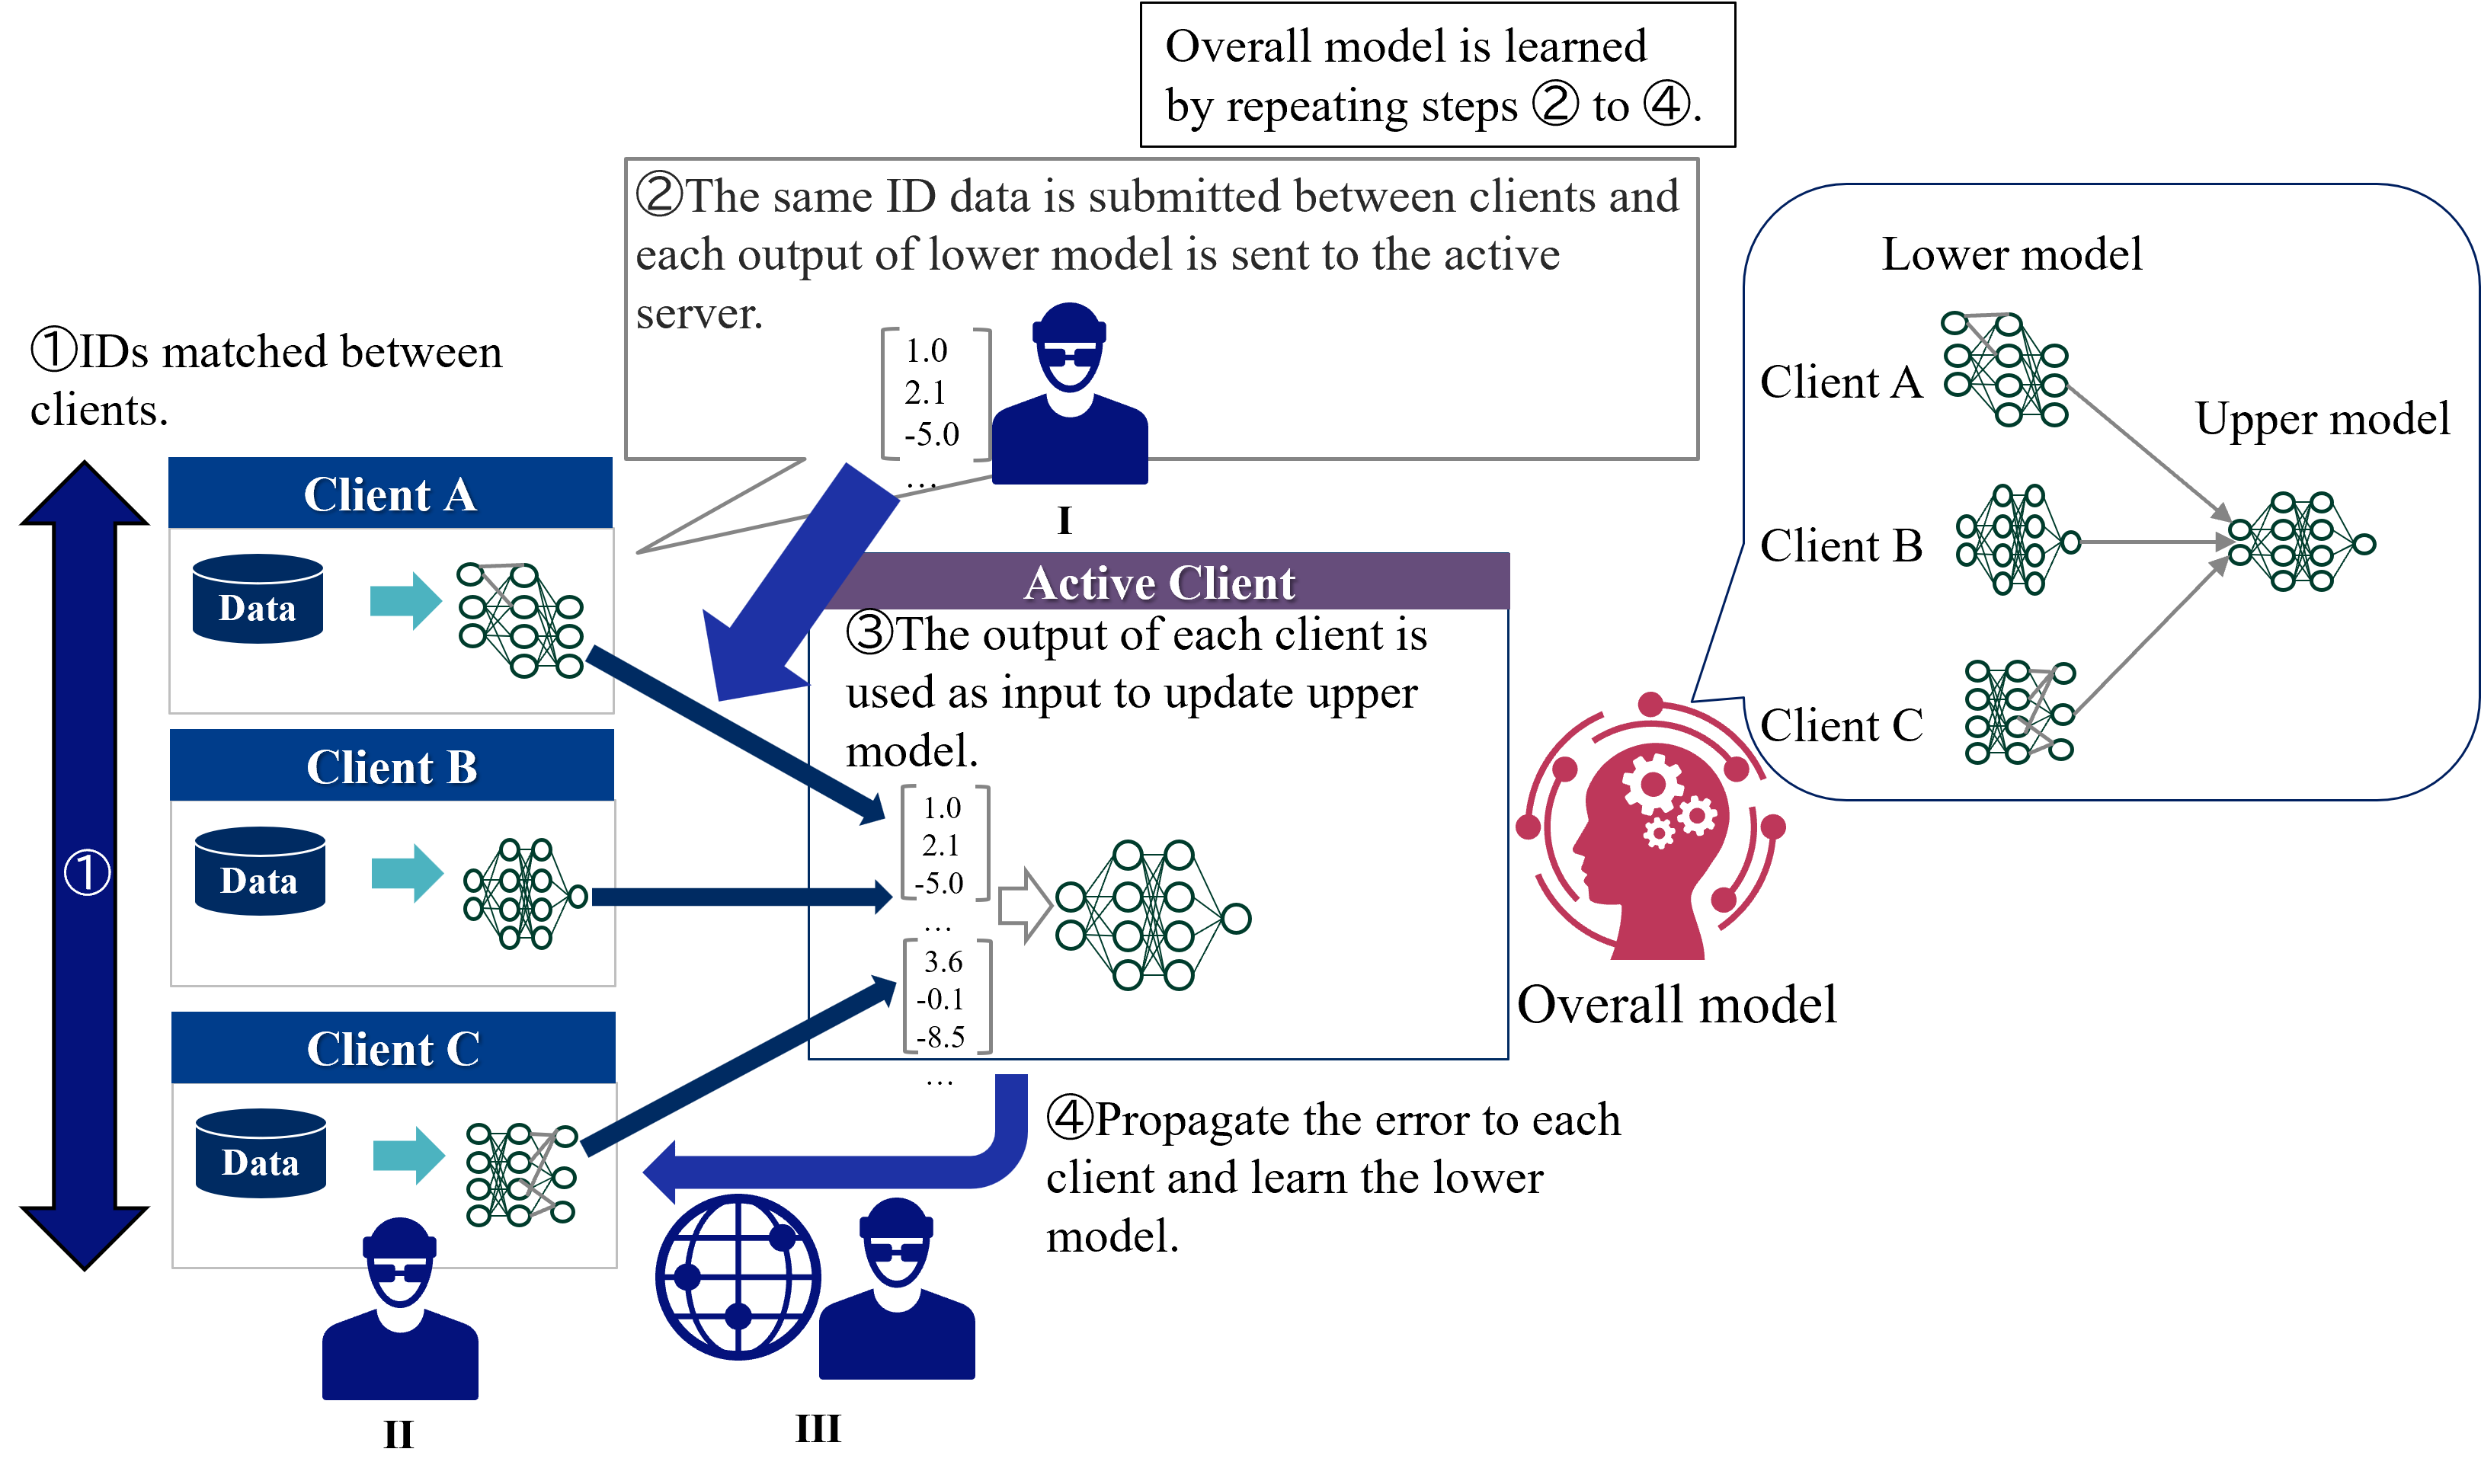
In VFL, a major threat to privacy is the leakage of identities due to identity matching between clients [33]. In addition to the leakage of identities, partial output from clients is also a threat. In case of ID matching, in order to create a single model for the overall system, it is necessary to match IDs that are common to each client’s data. This will reveal the presence of the same user to other clients. Figure 6 shows threats to privacy in VFL in case of partial output from clients, and possible attackers are as follows:
1. Active client: Inference attack against the output of lower model to infer client data.
1. Passive Clients: Inference attack against the output of upper model received from the active client to infer other clients’ data.
1. Third party: Eavesdrop on outputs that pass through the communication channel and infer client data through inference attacks.
<details>
<summary>extracted/5379099/fig/TP_VFL.png Details</summary>
### Visual Description
## Diagram: Split Learning / Vertical Federated Learning Architecture
### Overview
This diagram illustrates a distributed machine learning architecture, specifically a "Split Learning" or "Vertical Federated Learning" process. It depicts how multiple clients (A, B, and C) collaborate to train a global model without sharing raw data. The process is iterative, involving the separation of a model into a "Lower model" (residing on clients) and an "Upper model" (residing on an "Active Client").
### Components/Axes
* **Left Column (Clients):**
* **Client A, Client B, Client C:** Each contains a "Data" cylinder and a neural network icon representing the "Lower model."
* **Vertical Arrow (1):** Spans the height of the three clients, labeled "(1) IDs matched between clients."
* **Center (Active Client):**
* **Header:** "Active Client" (Purple background).
* **Content:** Contains a neural network icon (the "Upper model") and receives vector inputs from the clients.
* **Vector Data:**
* Top vector (from Client A): `[1.0, 2.1, -5.0]`
* Bottom vector (from Client C): `[3.6, -0.1, -8.5]`
* **Right Box (Overall Model):**
* **Header:** "Overall model"
* **Content:** Shows the "Lower model" (Clients A, B, C) connected to the "Upper model."
* **Annotations/Steps:**
* **Top Bubble:** "Overall model is learned by repeating steps (2) to (4)."
* **Top-Center Bubble:** "(2) The same ID data is submitted between clients and each output of lower model is sent to the active server."
* **Center Box Text:** "(3) The output of each client is used as input to update upper model."
* **Bottom-Right Text:** "(4) Propagate the error to each client and learn the lower model."
* **Icons:**
* **Person I:** Located below the Active Client bubble.
* **Person II:** Located below Client C.
* **Person III:** Located next to a globe icon, below Client C.
### Detailed Analysis
**The Iterative Process:**
1. **Step (1) - Alignment:** The vertical arrow indicates that the clients are aligned by ID. This confirms the architecture is designed for **Vertical Federated Learning**, where different clients hold different features for the same set of entities (IDs).
2. **Step (2) - Forward Pass:** Clients A, B, and C process their local data through their respective "Lower models." The resulting intermediate activations (vectors) are sent to the "Active Client."
* *Data Point 1:* Client A sends `[1.0, 2.1, -5.0]`.
* *Data Point 2:* Client C sends `[3.6, -0.1, -8.5]`.
3. **Step (3) - Aggregation/Update:** The "Active Client" receives these vectors and uses them as inputs for the "Upper model" (the final layers of the neural network).
4. **Step (4) - Backward Pass:** The error (gradient) is calculated at the "Upper model" and propagated back to the clients to update the weights of the "Lower model."
### Key Observations
* **Split Architecture:** The model is physically and logically split. The "Lower model" acts as a feature extractor on the client side, while the "Upper model" acts as the decision/classification layer on the server (Active Client) side.
* **Data Privacy:** The diagram implies that raw data never leaves the client cylinders. Only the intermediate vector outputs (activations) are transmitted, which is a core privacy-preserving feature of Split Learning.
* **Active Client Role:** The "Active Client" acts as the central orchestrator or server in this topology, holding the final layers of the model.
* **Visual Flow:** The thick blue arrows indicate the flow of data from the clients to the Active Client (forward pass) and the return path for error propagation (backward pass).
### Interpretation
This diagram demonstrates a collaborative learning framework designed for scenarios where data is vertically partitioned.
* **Why it matters:** In many real-world scenarios (e.g., banking, healthcare), different organizations hold different types of information about the same individuals. This architecture allows them to train a joint model (the "Overall model") without the legal or security risks of pooling raw data into a single database.
* **Peircean/Reading between the lines:** The inclusion of "Person I," "Person II," and "Person III" icons suggests distinct roles or entities. Person I is the "Active Client" (the server/aggregator), while Person II and III represent the participating data owners. The "Overall model" box on the right is a conceptual abstraction—it does not exist in one place, but is rather the *sum* of the distributed parts (Lower + Upper models) working in concert. The process is cyclical, implying that the "Overall model" is not static but evolves through the continuous repetition of the forward and backward passes.
</details>
Figure 6: Threads to privacy in VFL.
### III-C Federated Transfer Learning
In federated transfer learning, threats to privacy vary depending on the information in common [24]. We explain the case when features are common and when IDs are common, respectively.
#### III-C 1 Common Features
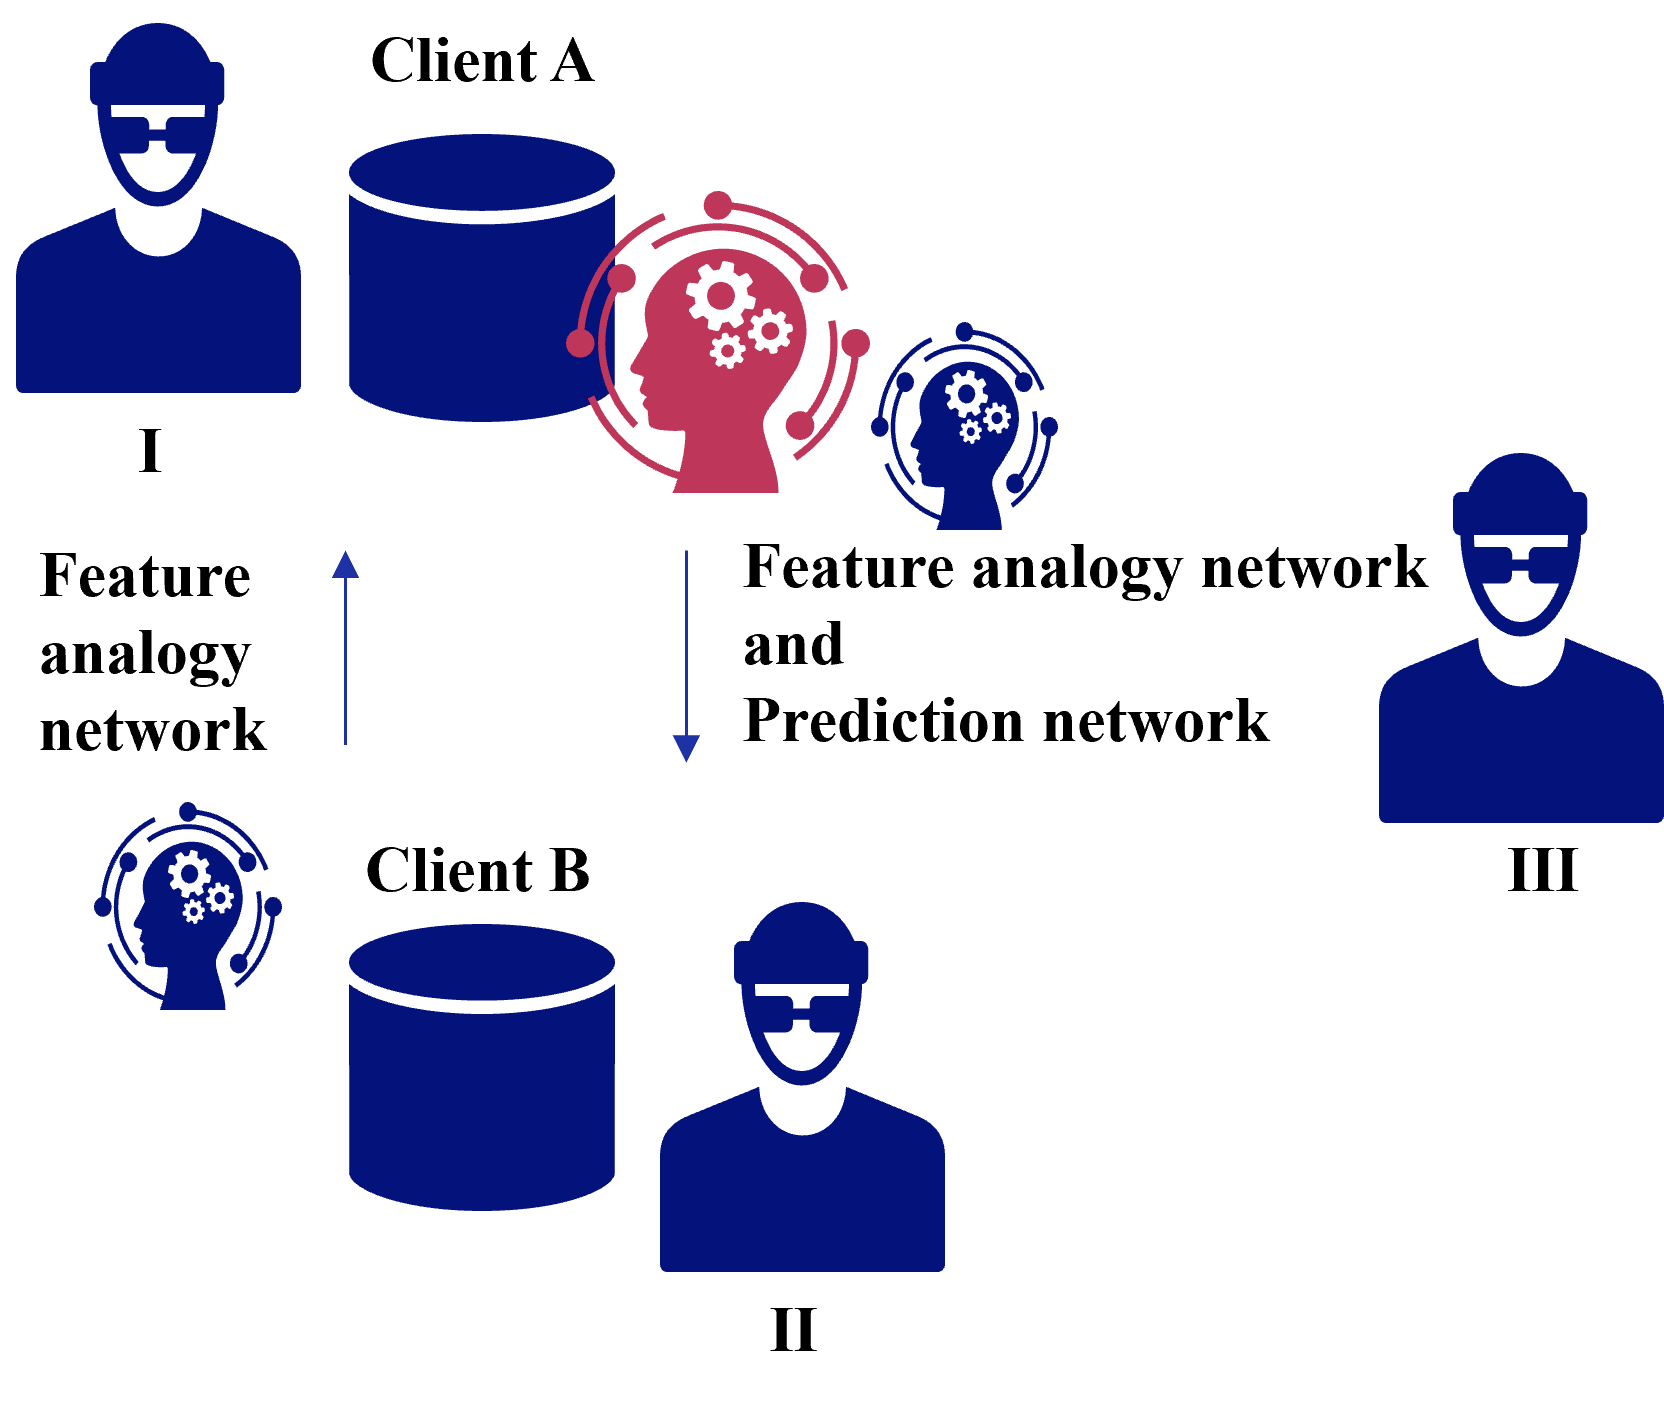
Figure 7 shows threats to privacy in case of common features in FTL, and possible attackers are as follows:
1. Client receiving a feature analogy network: Inference attack against feature analogy network to infer client data.
1. Client receiving a feature analogy network and prediction network: Inference attack against feature analogy network and prediction network to infer client data.
1. Third party: Eavesdrop on feature analogy network and prediction network pass through the communication channel and infer client data through inference attacks.
<details>
<summary>extracted/5379099/fig/CFTP_FTL.png Details</summary>
### Visual Description
## Diagram: System Architecture for Federated Learning/Feature Alignment
### Overview
The image is a conceptual system architecture diagram illustrating the interaction between two clients (Client A and Client B) and a third entity (Figure III). The diagram depicts a process involving "Feature analogy networks" and a "Prediction network," likely representing a federated learning or privacy-preserving machine learning framework where data representations are aligned between clients before a final prediction is made.
### Components/Axes
* **Entities (Icons):**
* **Figure I:** A stylized icon of a person wearing a hat and sunglasses, positioned at the top-left.
* **Figure II:** A stylized icon of a person wearing a hat and sunglasses, positioned at the bottom-center.
* **Figure III:** A stylized icon of a person wearing a hat and sunglasses, positioned on the right.
* **Data Stores:**
* **Client A:** A dark blue cylinder icon, positioned at the top-left, associated with Figure I.
* **Client B:** A dark blue cylinder icon, positioned at the bottom-left, associated with Figure II.
* **AI/Network Components:**
* **Red Brain Icon:** Located to the right of Client A. It contains gear symbols.
* **Blue Brain Icon (Left):** Located to the left of Client B. It contains gear symbols.
* **Blue Brain Icon (Right):** Located to the right of the Red Brain icon, closer to Figure III. It contains gear symbols.
* **Flow Indicators:**
* **Upward Arrow:** Positioned between the Client B/Blue Brain cluster and the Client A/Red Brain cluster.
* **Downward Arrow:** Positioned between the Client A/Red Brain cluster and the Client B/Blue Brain cluster.
### Content Details
* **Textual Labels:**
* **"Client A"**: Located above the top cylinder.
* **"Client B"**: Located above the bottom cylinder.
* **"I"**: Located below the top-left figure.
* **"II"**: Located below the bottom-center figure.
* **"III"**: Located below the right-side figure.
* **"Feature analogy network"**: This label appears twice. Once on the left side, vertically aligned between the two client clusters, and again as part of the label on the right.
* **"Feature analogy network and Prediction network"**: Located on the right side of the diagram, between the central brain icons and Figure III.
### Key Observations
* **Color Coding:** The diagram uses a distinct color scheme. The "Client A" side is associated with a red-colored brain icon, while the "Client B" side is associated with a blue-colored brain icon.
* **Bidirectional Flow:** The vertical arrows between the two client clusters suggest a continuous, iterative exchange of information (likely model parameters or gradients) between Client A and Client B.
* **Network Separation:** The "Feature analogy network" appears to be a shared or distributed component between the two clients, while the "Prediction network" is positioned closer to Figure III, suggesting it is the final stage of the pipeline.
* **Spatial Grouping:** The diagram is split into two distinct operational zones: the left side (Clients A and B interacting via Feature Analogy) and the right side (the final output/prediction stage involving Figure III).
### Interpretation
This diagram represents a **Federated Learning or Cross-Silo Learning architecture**.
* **Mechanism:** The "Feature analogy network" suggests that the system is designed to align data features between two disparate clients (A and B) that likely cannot share raw data due to privacy constraints. By using an analogy network, the system learns to map data from Client A and Client B into a common latent space.
* **Process Flow:** The bidirectional arrows indicate that the clients are likely performing collaborative training. They exchange information to update their respective "Feature analogy networks" until they reach a consensus or aligned representation.
* **Final Stage:** Once the features are aligned, the information is passed to the "Prediction network" (associated with Figure III). This implies that Figure III acts as the central server or the final inference engine that utilizes the aligned features from both clients to perform a specific prediction task.
* **Peircean/Inference:** The repetition of "Feature analogy network" on the left and right suggests that the analogy network is the *bridge* that enables the "Prediction network" to function effectively across heterogeneous data sources. The use of "hacker/user" icons (I, II, III) suggests this might be a security-focused or privacy-centric implementation where the identity of the data owners is protected.
</details>
Figure 7: Threats to privacy in case of common features in FTL.
#### III-C 2 Common IDs
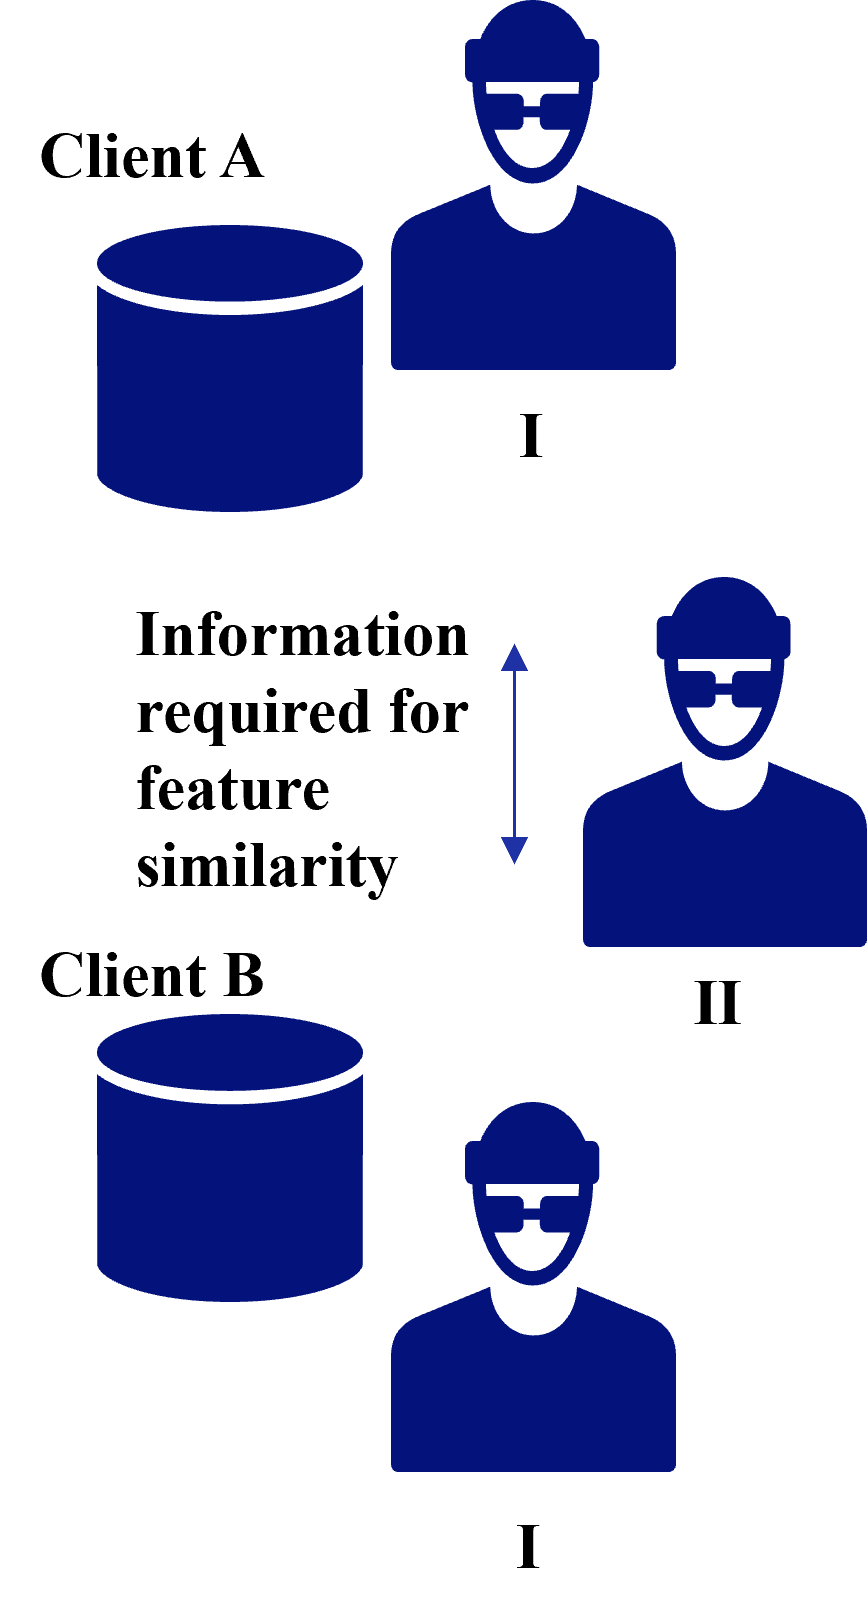
In case of Common IDs, a threat to privacy is the leakage of identities due to identity matching between clients as shown in VFL [33]. In addition to the leakage of identities, information required for feature similarity from clients is also a threat. Figure 8 shows threats to privacy in case of common IDs in FTL in case of information required for feature similarity, and possible attackers are as follows:
1. Client receiving information for feature similarity: Inference attack against information required for feature similarity to infer client data.
1. Third party: Eavesdrop on information required for feature similarity pass through the communication channel and infer client data through inference attacks.
<details>
<summary>extracted/5379099/fig/CITP_FTL.png Details</summary>
### Visual Description
## Diagram: Conceptual Data/Feature Similarity Flow
### Overview
This image is a conceptual diagram illustrating a data relationship or workflow involving two distinct clients (Client A and Client B) and two types of entities (labeled I and II). The diagram highlights a requirement for information exchange or comparison to establish "feature similarity" between these entities.
### Components/Axes
* **Entities:**
* **Client A (Top-Left):** Comprised of a database cylinder icon and a person icon labeled "I".
* **Client B (Bottom-Left):** Comprised of a database cylinder icon and a person icon labeled "I".
* **Person II (Middle-Right):** A standalone person icon positioned between the two client groups.
* **Textual Elements:**
* "Client A" (Top-left)
* "Client B" (Bottom-left)
* "Information required for feature similarity" (Center-left)
* "I" (Located below the person icons at the top and bottom)
* "II" (Located below the person icon in the middle)
* **Visual Indicators:**
* **Vertical Double-Headed Arrow:** Positioned to the right of the text "Information required for feature similarity," indicating a bidirectional relationship or a flow of information.
* **Cylinder Icons:** Representing data storage or databases for Client A and Client B.
* **Person Icons:** Representing users, agents, or data owners.
### Detailed Analysis
* **Top Region:** Contains the label "Client A" above a database cylinder. To the right of the database is a person icon labeled "I".
* **Middle Region:** Contains the text "Information required for feature similarity" aligned vertically. A double-headed arrow is placed to the right of this text, suggesting a connection between the top and bottom sections. To the right of this arrow is a person icon labeled "II".
* **Bottom Region:** Contains the label "Client B" above a database cylinder. To the right of the database is a person icon labeled "I".
* **Consistency:** The person icons labeled "I" are identical in design. The person icon labeled "II" is also identical in design to the "I" icons, suggesting they represent the same type of entity (e.g., a user or agent) but in different roles or contexts.
### Key Observations
* **Symmetry:** The diagram is vertically symmetrical regarding the "Client" and "Person I" components.
* **Centrality:** "Person II" acts as a central or intermediary figure, distinct from the local "Person I" entities associated with the databases.
* **Functional Requirement:** The text "Information required for feature similarity" is the central functional description, implying that the interaction between the entities is driven by the need to compare features without necessarily exposing raw data.
### Interpretation
This diagram likely represents a **Federated Learning** or **Privacy-Preserving Machine Learning** architecture.
* **The Data Silos:** "Client A" and "Client B" represent local data sources (databases) that cannot be merged directly.
* **The Local Agents:** "Person I" represents the local data owner or local compute agent at each client site.
* **The Aggregator/Server:** "Person II" represents a central server or an orchestrator.
* **The Process:** The text "Information required for feature similarity" suggests that the system needs to compute a similarity metric (e.g., cosine similarity, correlation) between the features of Client A and Client B. Because the data is siloed, the system must exchange specific, likely anonymized or aggregated, information with the central entity ("Person II") to perform this calculation without violating data privacy. The double-headed arrow indicates the iterative nature of this communication (e.g., sending gradients or feature embeddings and receiving updates).
</details>
Figure 8: Threads to privacy in case of common IDs in FTL.
## IV Countermeasures against Threats to Privacy in Each Federated Learning
In this section, we describe countermeasures against threats to privacy in each federated learning. Table II shows countermeasures against privacy threats addressed in each federated learning. Despite the wide variety of previous efforts to secure privacy in federated learning, the proposed methods typically fall into one of these categories: differential privacy, secure computation, encryption of communication, and ID dummying [32].
TABLE II: Countermeasures against privacy threats addressed in each federated learning.
| HFL VFL FTL (common features) | Client Side - Feature Analogy Network Exchange | Server Side Active Client Side - | Communication Line Communication Line Communication Line | - Client Table - |
| --- | --- | --- | --- | --- |
| FTL (common IDs) | - | Gradient Exchange | Communication Line | Client Table |
### IV-A Horizontal Federated Learning
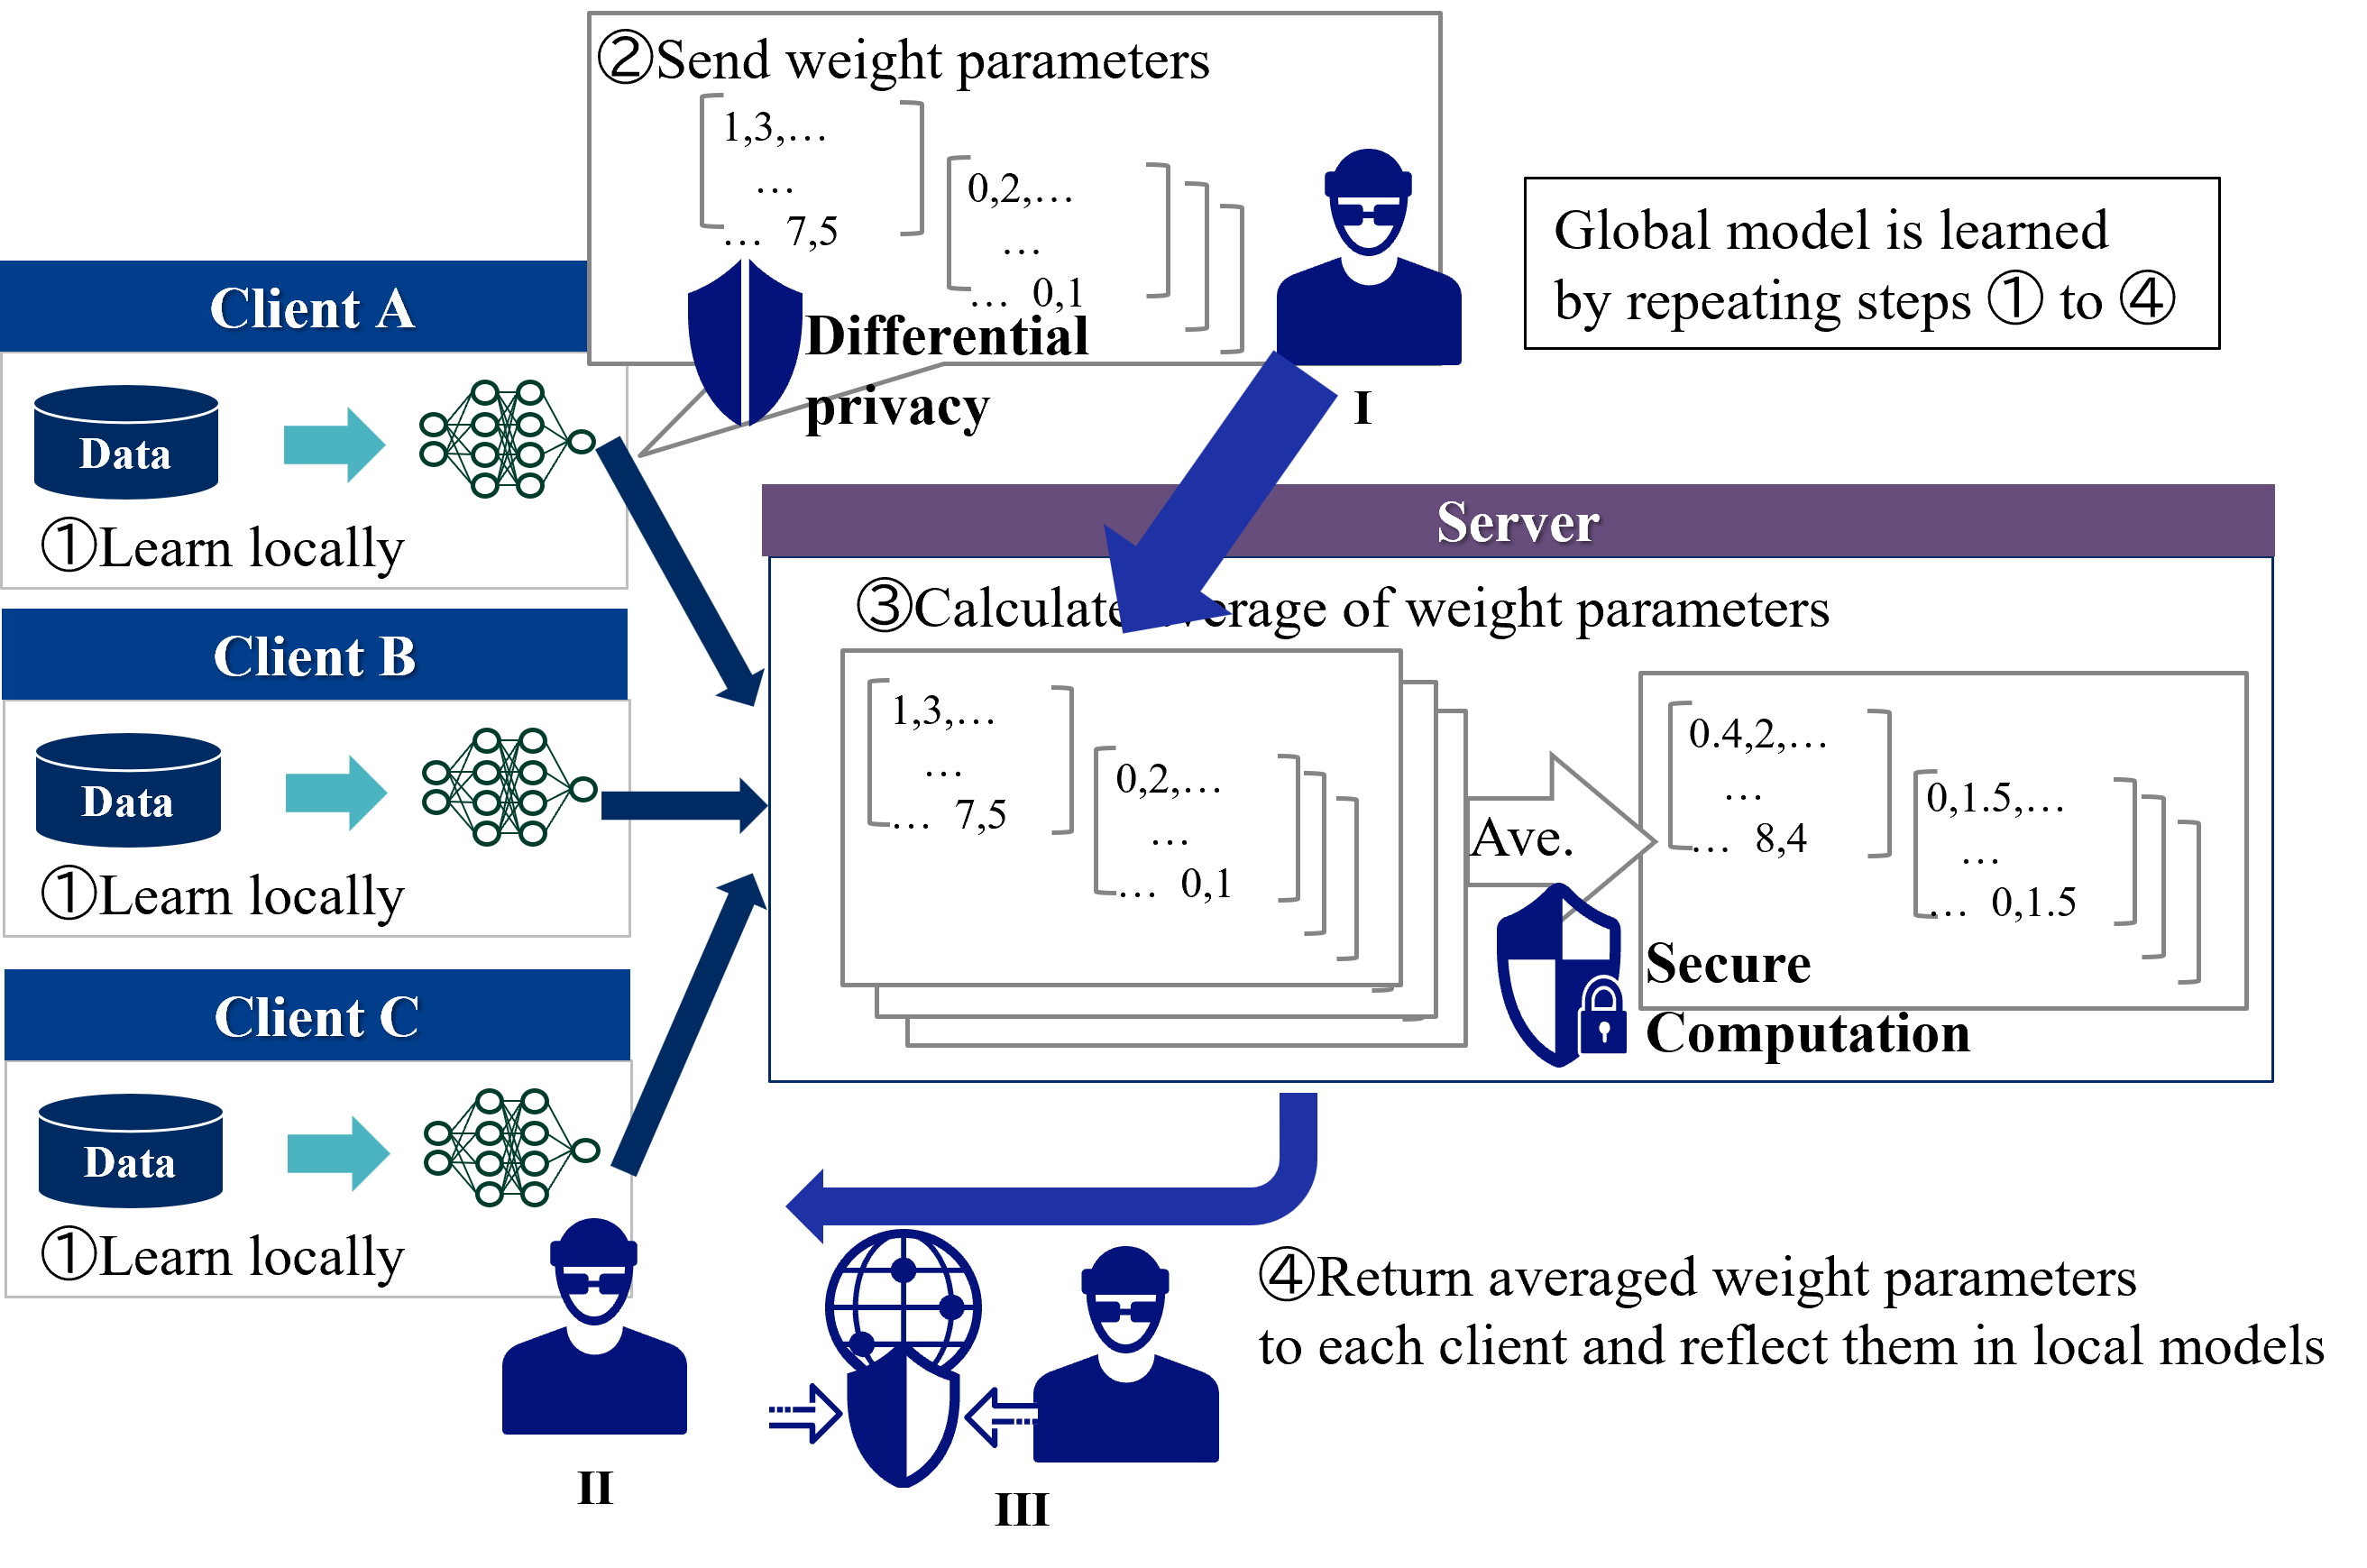
In HFL, a typical privacy measure for client data is to protect attacks by the server side with secure computation and attacks by the client side with differential privacy [34]. Figure 9 shows countermeasures against threads to privacy in HFL. The position of the attacker by these privacy measures is described as follows.
1. Server: Secure computation realizes global model integration calculations without seeing the model by the server [35, 36]
1. Client: Client A creates a model by adding noise through differential privacy [37, 38]. Client B receives the parameters of the global model via the server, but Client A’s model is protected by differential privacy.
1. Third party: Achieved by encryption of communication.
<details>
<summary>extracted/5379099/fig/CM_HFL.png Details</summary>
### Visual Description
## Diagram: Federated Learning Workflow with Privacy Enhancements
### Overview
This diagram illustrates a Federated Learning (FL) system architecture. It depicts the iterative process of training a global model across multiple distributed clients (A, B, and C) while maintaining data privacy. The workflow is divided into four distinct steps, incorporating privacy-preserving technologies—specifically Differential Privacy and Secure Computation—to protect against potential adversaries (represented by figures I, II, and III).
### Components/Axes
The diagram is organized into three primary functional areas:
1. **Client Side (Left):** Three identical blocks labeled "Client A", "Client B", and "Client C". Each contains:
* A cylinder icon labeled "Data".
* A neural network diagram.
* The label "1 Learn locally".
2. **Server Side (Center/Right):** A large rectangular box labeled "Server".
* Contains the label "3 Calculate average of weight parameters".
* Contains an "Ave." (Average) operation block.
* Contains a "Secure Computation" shield icon.
3. **Process Flow & Security:**
* **Numbered Steps:** 1 through 4, indicating the cyclical nature of the learning process.
* **Security Icons:** Two shield icons. One labeled "Differential privacy" (associated with Step 2) and one labeled "Secure Computation" (associated with Step 3).
* **Adversaries:** Three stylized figures labeled I, II, and III.
* **Text Box (Top Right):** "Global model is learned by repeating steps 1 to 4".
### Detailed Analysis
#### Step-by-Step Workflow
* **Step 1 (Learn locally):** Clients A, B, and C train their local neural network models using their respective local "Data".
* **Step 2 (Send weight parameters):** Clients transmit their trained weight parameters to the server.
* *Visual Representation:* Matrices are shown as `[1,3,...]` and `[0,2,...]`.
* *Security:* A shield icon labeled "Differential privacy" is positioned here, indicating that noise or perturbation is added to the weights before transmission to prevent information leakage.
* *Adversary I:* Positioned near the transmission path, suggesting an attempt to intercept or infer data from the raw weight updates.
* **Step 3 (Calculate average of weight parameters):** The server receives the parameters and performs an aggregation.
* *Operation:* The "Ave." block processes the incoming matrices.
* *Security:* A shield icon labeled "Secure Computation" is positioned here, indicating that the aggregation is performed in a way that the server cannot see the individual client updates.
* *Resulting Data:* The output matrices are shown as `[0.4,2,...]` and `[0,1.5,...]`.
* **Step 4 (Return averaged weight parameters):** The server sends the aggregated global model weights back to the clients.
* *Action:* The clients update their local models with these averaged parameters.
* *Adversaries II & III:* Positioned at the bottom, interacting with a globe icon and a shield, suggesting potential threats during the return phase or global communication.
### Key Observations
* **Cyclical Nature:** The diagram explicitly states that the global model is learned by repeating steps 1 through 4, confirming this is an iterative training loop.
* **Privacy Layering:** The diagram distinguishes between two types of privacy:
* **Differential Privacy:** Applied at the client-side output (Step 2) to protect individual client data from being inferred from the gradients.
* **Secure Computation:** Applied at the server-side aggregation (Step 3) to ensure the server performs the average without accessing the raw, unmasked weights.
* **Adversary Modeling:** The inclusion of figures I, II, and III suggests a threat model analysis. Figure I represents an eavesdropper on the uplink; Figures II and III represent threats related to the global network or the return path.
### Interpretation
This diagram demonstrates a robust **Privacy-Preserving Federated Learning (PPFL)** architecture.
The data suggests that the system is designed to mitigate the inherent privacy risks of Federated Learning, where sharing model weights can sometimes leak information about the underlying training data (e.g., via model inversion attacks).
* **Why it matters:** By combining Differential Privacy (which adds statistical noise to the weights) and Secure Computation (which uses cryptographic protocols to aggregate weights without revealing them), the system creates a "defense-in-depth" strategy.
* **Reading between the lines:** The change in matrix values from the input (e.g., `1,3`) to the output (e.g., `0.4,2`) visually represents the aggregation and potential perturbation process. The presence of the adversary figures implies that the system is designed to be resilient against "honest-but-curious" servers or malicious network observers. The diagram effectively communicates that privacy is not a single feature but a multi-stage requirement in distributed machine learning.
</details>
Figure 9: Countermeasures against threads to privacy in HFL.
### IV-B Vertical Federated Learning
In VFL, the threads to privacy are the leakage of identities and partial output from clients. We show how to respond in the case of each threat.
#### IV-B 1 IDs Matching
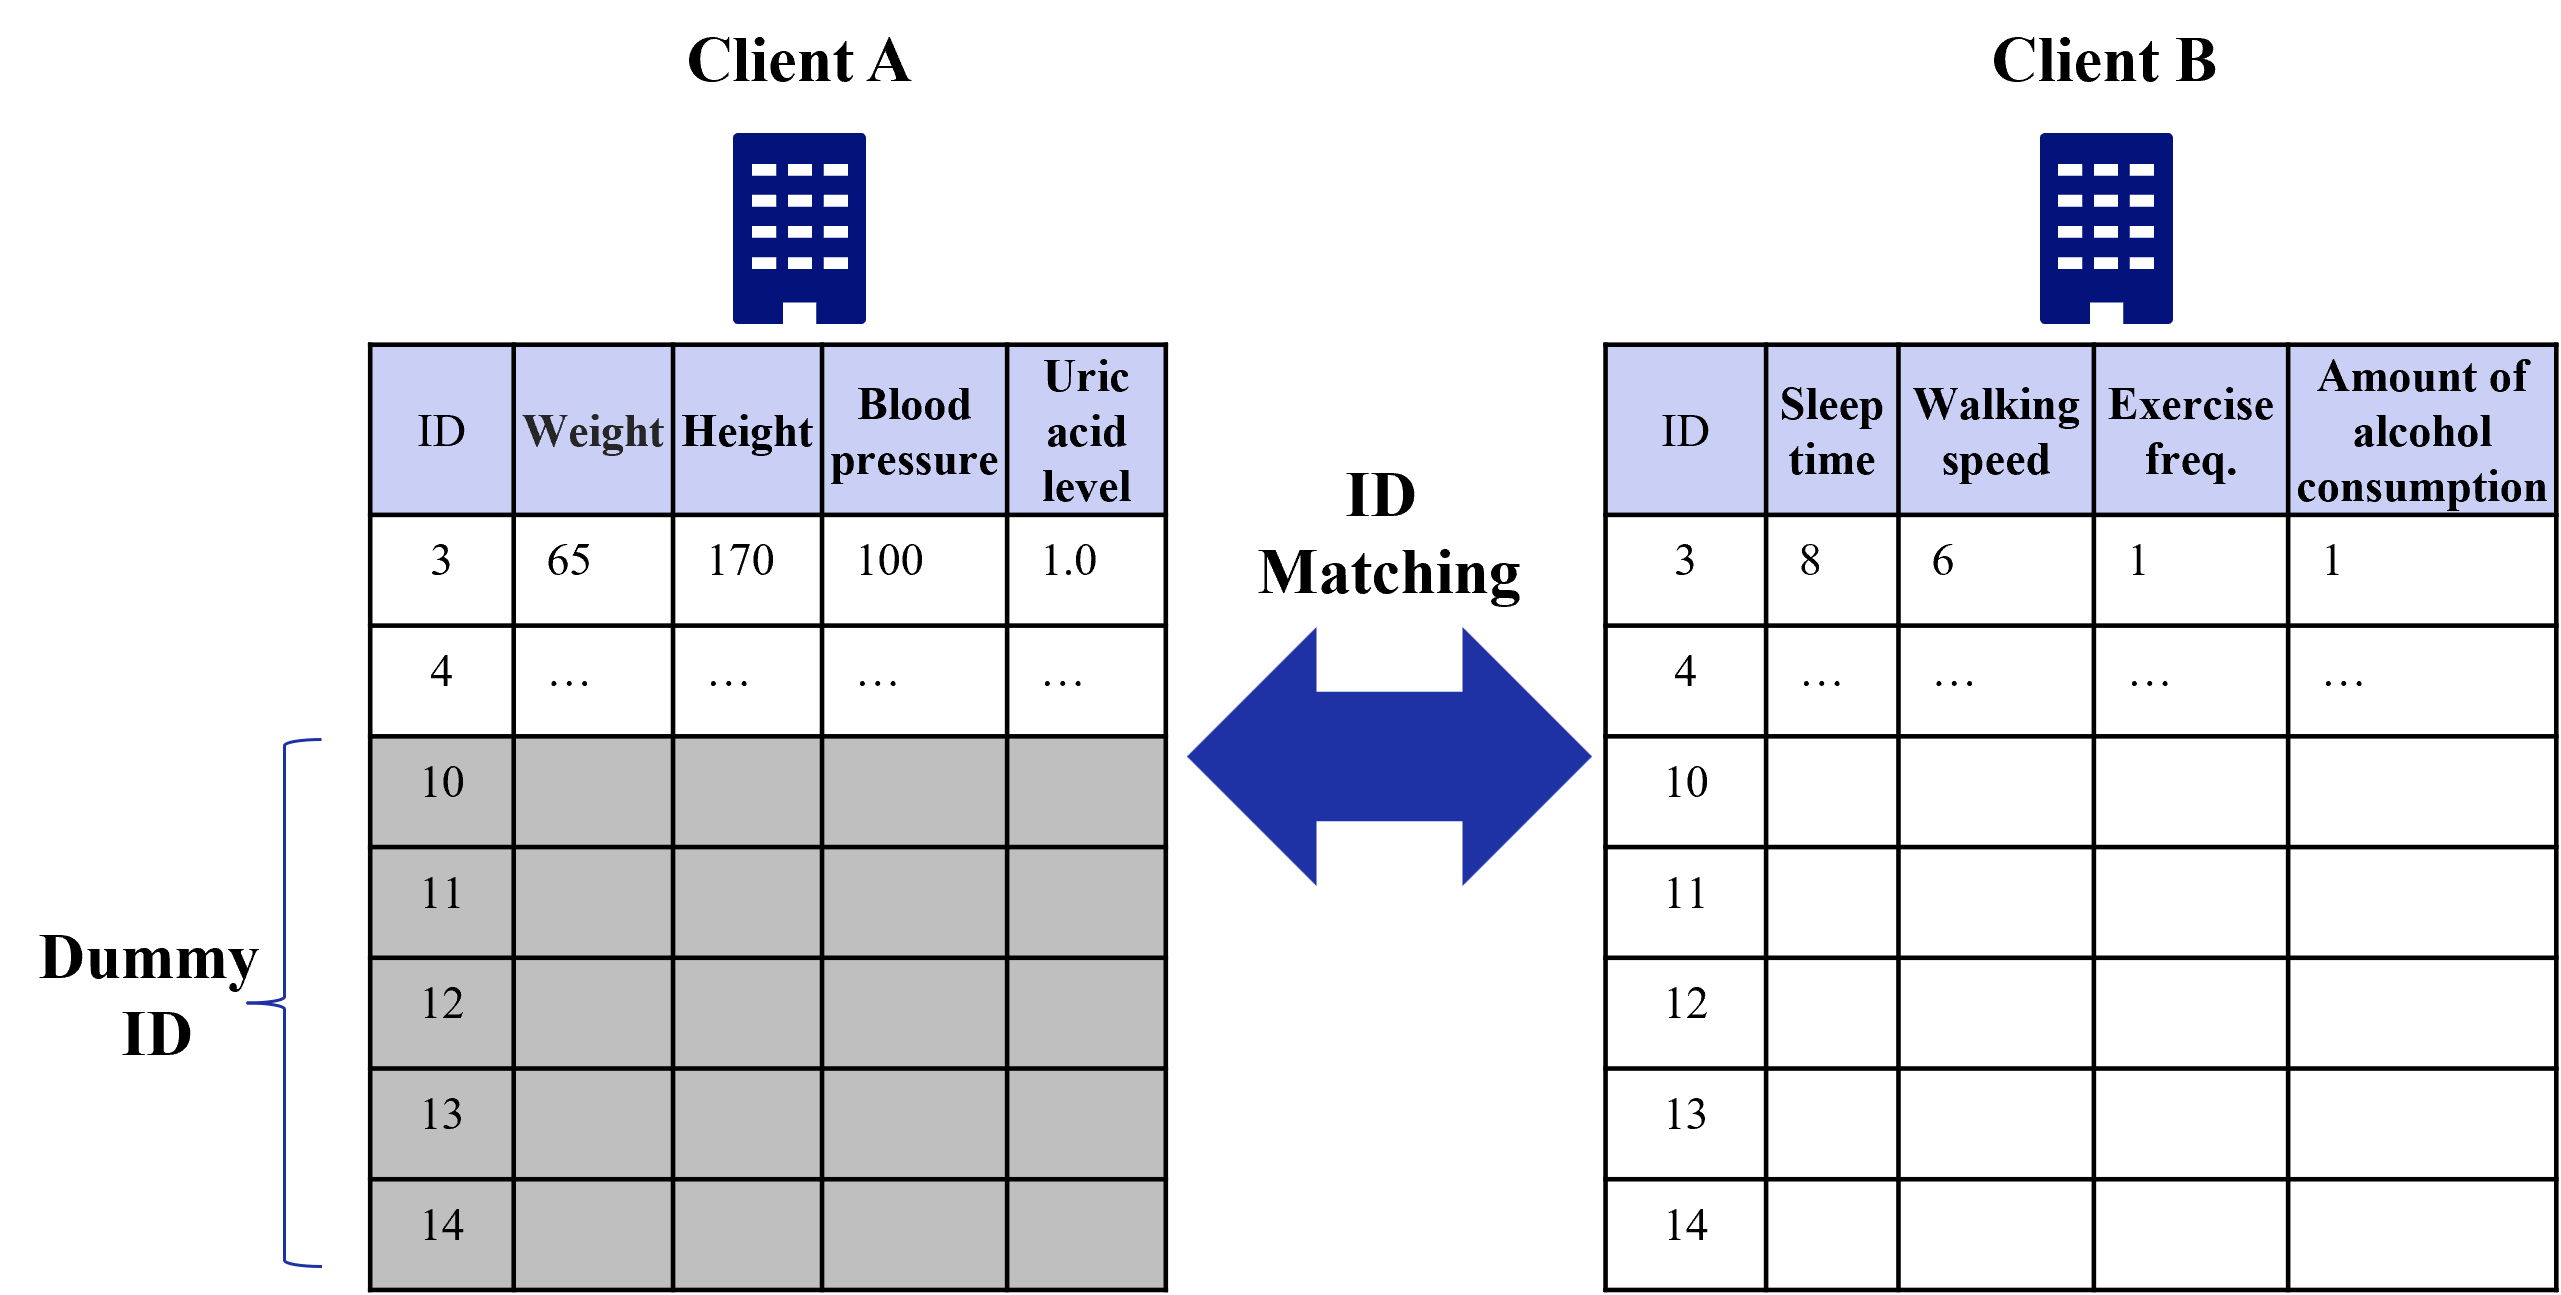
In case of IDs matching, Dummy IDs are prepared in addition to the original IDs [39]. For the dummy part of the ID, dummy variables that have no effect on learning are sent. Figure 10 shows an example of dummy IDs. Before dummy IDs are used, all IDs that match Client A are known to Client B (cf. ID 3,4). After dummy IDs are used, Client B does not know which of the IDs that match Client A is the real ID of Client A.
<details>
<summary>extracted/5379099/fig/CMID_VFL.png Details</summary>
### Visual Description
## Diagram: Data Integration via ID Matching
### Overview
This diagram illustrates a conceptual data integration process between two distinct datasets, labeled "Client A" and "Client B." The diagram demonstrates how two separate tables, containing different categories of information, can be linked or joined using a shared identifier ("ID").
### Components/Axes
The diagram is composed of three primary sections arranged horizontally:
1. **Left Section (Client A):** A table representing health-related metrics.
2. **Center Section (Connection):** A large, blue, double-headed arrow labeled "ID Matching" indicating the relationship between the two tables.
3. **Right Section (Client B):** A table representing lifestyle-related metrics.
**Table Structures:**
* **Client A Table:** Contains 5 columns: `ID`, `Weight`, `Height`, `Blood pressure`, and `Uric acid level`.
* **Client B Table:** Contains 5 columns: `ID`, `Sleep time`, `Walking speed`, `Exercise freq.`, and `Amount of alcohol consumption`.
### Detailed Analysis
#### Client A Table (Left)
* **Header:** "Client A" with a building icon.
* **Data Rows:**
* **Row 1:** ID `3` | Weight `65` | Height `170` | Blood pressure `100` | Uric acid level `1.0`.
* **Row 2:** ID `4` | `...` (ellipses indicating omitted data) in all columns.
* **Rows 10-14:** These rows are shaded gray. They contain the IDs `10`, `11`, `12`, `13`, and `14` respectively, but the data cells are empty.
* **Annotation:** A blue bracket on the far left spans rows 10 through 14, labeled "Dummy ID."
#### ID Matching (Center)
* A large, blue, double-headed arrow is positioned between the two tables.
* The text "ID Matching" is centered above this arrow.
#### Client B Table (Right)
* **Header:** "Client B" with a building icon.
* **Data Rows:**
* **Row 1:** ID `3` | Sleep time `8` | Walking speed `6` | Exercise freq. `1` | Amount of alcohol consumption `1`.
* **Row 2:** ID `4` | `...` (ellipses indicating omitted data) in all columns.
* **Rows 10-14:** These rows are white (unshaded) and contain the IDs `10`, `11`, `12`, `13`, and `14` respectively, but the data cells are empty.
### Key Observations
* **Shared Key:** The "ID" column is the common denominator between both tables, serving as the primary key for the matching process.
* **Data Complementarity:** Client A tracks physiological metrics (Weight, Height, BP, Uric Acid), while Client B tracks lifestyle metrics (Sleep, Walking, Exercise, Alcohol).
* **Dummy Data:** The rows labeled "Dummy ID" (10-14) appear to be placeholders or synthetic records, likely used for testing database joins or anonymization protocols.
* **Visual Distinction:** The "Dummy ID" rows in Client A are shaded gray, whereas the corresponding rows in Client B are white, suggesting a visual distinction between the two datasets even when they share the same ID structure.
### Interpretation
This diagram represents a **Database Join operation** or **Data Enrichment process**.
* **The "Why":** The diagram demonstrates how an organization can combine disparate datasets—one containing physical health data and the other containing lifestyle data—to create a more comprehensive profile of an individual (e.g., "ID 3").
* **The "How":** By using the "ID" as a relational key, the system can merge the attributes from Client A and Client B.
* **Peircean Investigative Note:** The presence of "Dummy ID" rows suggests this is likely a schematic for a software development or data engineering environment. The use of ellipses (`...`) indicates that the dataset is larger than what is shown, implying this is a representative sample rather than the full dataset. The "ID Matching" arrow implies a bidirectional relationship or a synchronization process where data might be pulled from either side to complete the record.
</details>
Figure 10: Example of dummy IDs.
#### IV-B 2 Output from Clients
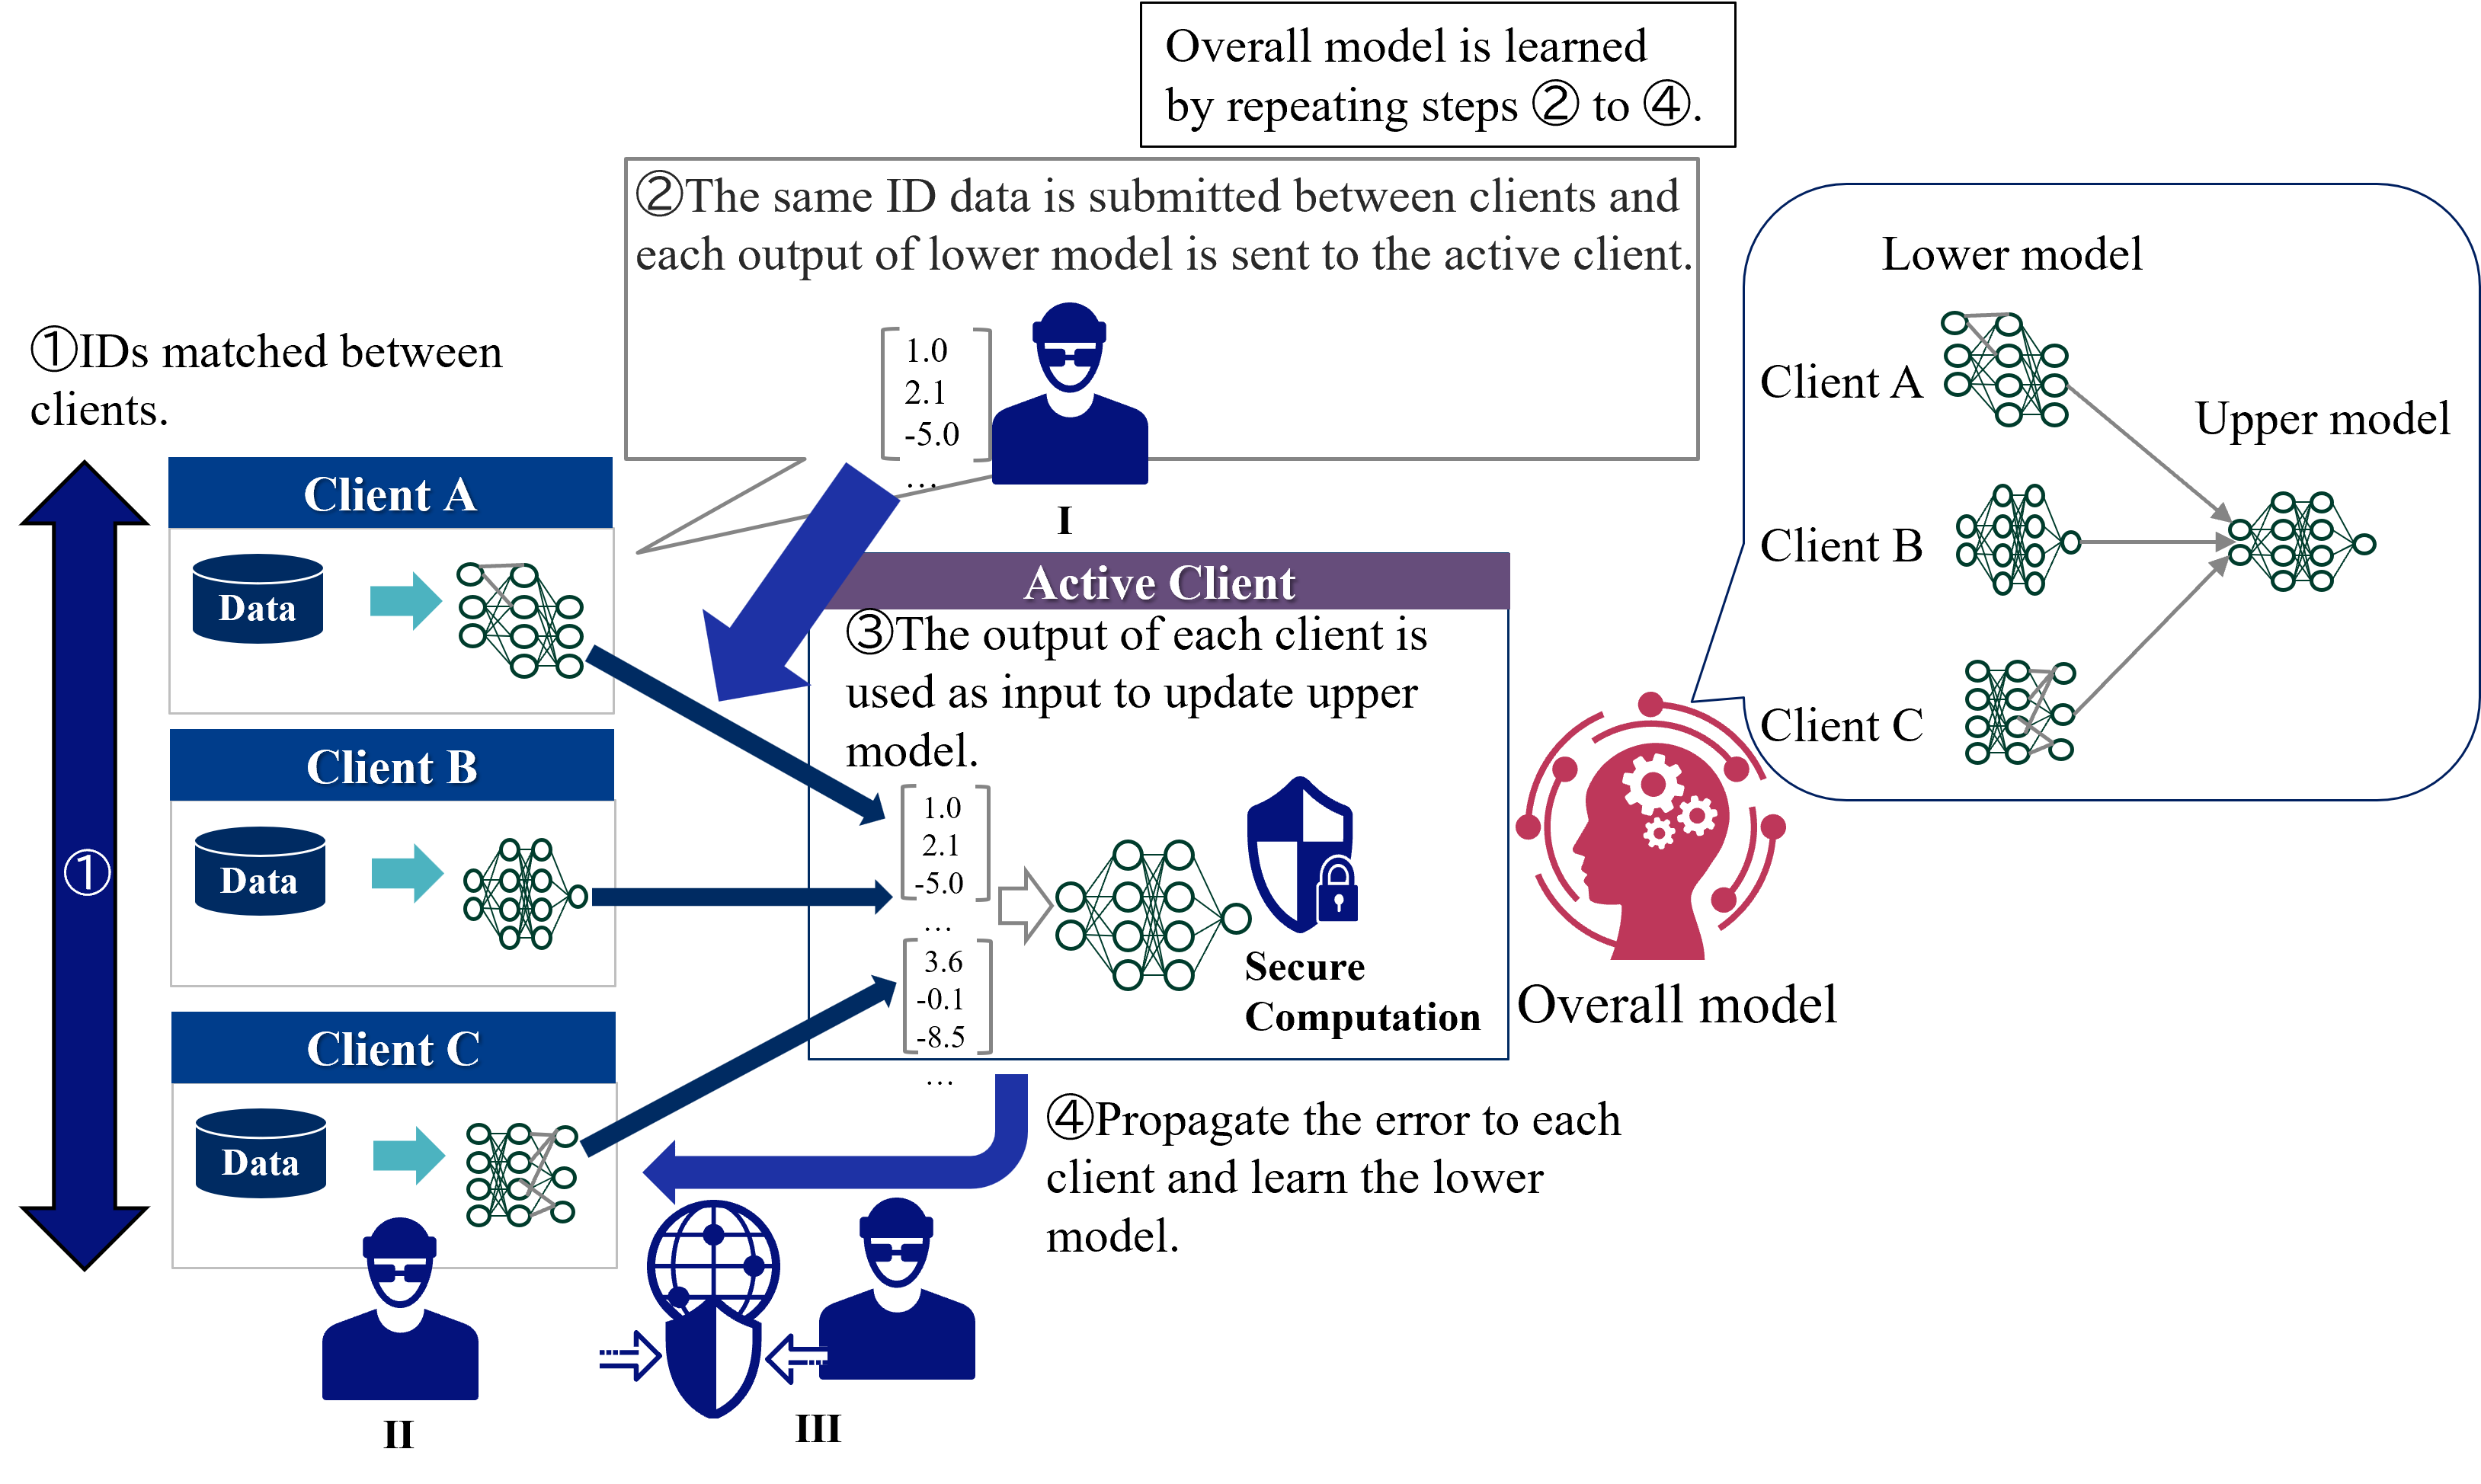
In case of output from clients, the typical privacy measure is the use of secure calculations [33]. Figure 11 shows countermeasures against threads in case of output from clients. The position of the attacker by these privacy measures is described as follows.
1. Active Client: Secure computation realizes global model integration calculations without seeing the model by the active client. [35].
1. Passive Clients: Client B receives the information used for updating from the upper model via the active client, but it is protected by secure computation.
1. Third party: Achieved by encryption of communication.
<details>
<summary>extracted/5379099/fig/CMOC_VFL.png Details</summary>
### Visual Description
## Diagram: Distributed Machine Learning Architecture with Secure Computation and Adversarial Threat Model
### Overview
This diagram illustrates a distributed machine learning architecture, likely representing a "Split Learning" or "Federated Learning" framework. It depicts the workflow of training an "Overall model" by splitting it into a "Lower model" (residing on client devices) and an "Upper model" (residing on a central server/Active Client). The diagram also incorporates a security context, identifying potential adversarial threats (represented by hacker icons) at various stages of the process.
### Components/Axes
* **Clients (Left):** Three distinct entities labeled "Client A", "Client B", and "Client C". Each contains a "Data" storage icon and a neural network icon representing the "Lower model".
* **Active Client (Center):** A central processing node that receives inputs from the clients, performs "Secure Computation" (indicated by a shield icon), and updates the "Upper model".
* **Overall Model (Right):** A conceptual diagram showing the flow from the "Lower model" (Clients A, B, C) to the "Upper model".
* **Adversarial Icons:** Three hacker icons labeled I, II, and III, indicating potential points of compromise.
* **Flow Indicators:** Numbered steps (1) through (4) indicating the sequence of operations.
### Content Details
**Numbered Workflow:**
1. **(1) IDs matched between clients:** Represented by a large vertical blue arrow on the far left, spanning the height of the three clients.
2. **(2) The same ID data is submitted between clients and each output of lower model is sent to the active client:** This is the data transmission phase.
* *Visual:* Vectors (e.g., `[1.0, 2.1, -5.0]`) are shown being transmitted from the clients to the Active Client.
3. **(3) The output of each client is used as input to update upper model:** This occurs within the "Active Client" box.
* *Visual:* The Active Client receives vectors (e.g., `[1.0, 2.1, -5.0]` and `[3.6, -0.1, -8.5]`), processes them through a neural network, and passes them through a "Secure Computation" shield.
4. **(4) Propagate the error to each client and learn the lower model:** Represented by a large blue arrow pointing from the Active Client back to the clients.
**Explanatory Text Boxes:**
* *Top Box:* "Overall model is learned by repeating steps (2) to (4)."
* *Top-Center Box:* "The same ID data is submitted between clients and each output of lower model is sent to the active client."
* *Center Box:* "The output of each client is used as input to update upper model."
* *Bottom-Right Box:* "Propagate the error to each client and learn the lower model."
**Adversarial Threat Points:**
* **I:** Positioned above the Active Client, near the incoming data vectors.
* **II:** Positioned below Client C.
* **III:** Positioned below the "Secure Computation" shield, near the Active Client.
### Key Observations
* **Data Vectors:** The numerical vectors (e.g., `[1.0, 2.1, -5.0]`) represent intermediate activations (embeddings) generated by the "Lower model" before being sent to the "Upper model."
* **Secure Computation:** The presence of the shield icon suggests that the system attempts to protect these intermediate activations from being inspected by the Active Client or intercepted by adversaries.
* **Adversarial Focus:** The inclusion of three distinct hacker icons (I, II, III) suggests this diagram is likely from a security research paper analyzing vulnerabilities in split learning, specifically focusing on how an adversary might exploit the ID matching, the intermediate activations, or the secure computation channel.
### Interpretation
This diagram serves as a **threat model** for a distributed machine learning system.
* **The Mechanism:** The system relies on splitting a neural network. Clients hold the "Lower model" (privacy-sensitive layers), and the "Active Client" holds the "Upper model." By sharing only the intermediate activations (the vectors), the system aims to preserve data privacy.
* **The Vulnerability:** The diagram highlights that this architecture is not inherently secure. The hacker icons (I, II, III) suggest that an adversary can intervene at multiple points:
* **Point I:** Intercepting the intermediate activations to perform inference attacks (reconstructing private data from the vectors).
* **Point II:** Compromising a client to inject malicious data or manipulate the local model.
* **Point III:** Attacking the "Secure Computation" process itself, potentially bypassing the privacy protections.
* **Conclusion:** The diagram demonstrates that while "Secure Computation" is a layer of defense, the overall architecture remains susceptible to adversarial actions at the input, transmission, and processing stages. The "ID matching" (Step 1) is a critical dependency; if the IDs are not handled securely, it creates a significant privacy leak.
</details>
Figure 11: Countermeasures against threads in case of output from clients.
### IV-C Federated Transfer Learning
In FTL, the threads to privacy depend on common information between clients [24]. We show how to respond in the case of each thread.
#### IV-C 1 Common Features
In case of common features, the threads to privacy are exchanges of feature analogy network and prediction network. Figure 12 shows countermeasures against threads in case of common features.
1. Client receiving a feature analogy network: Differential privacy makes it difficult to infer the model [37].
1. Client receiving a feature analogy network and prediction network: Differential privacy makes it difficult to infer the model.
1. Third party: Achieved by encryption of communication.
<details>
<summary>extracted/5379099/fig/CMCF_FTL.png Details</summary>
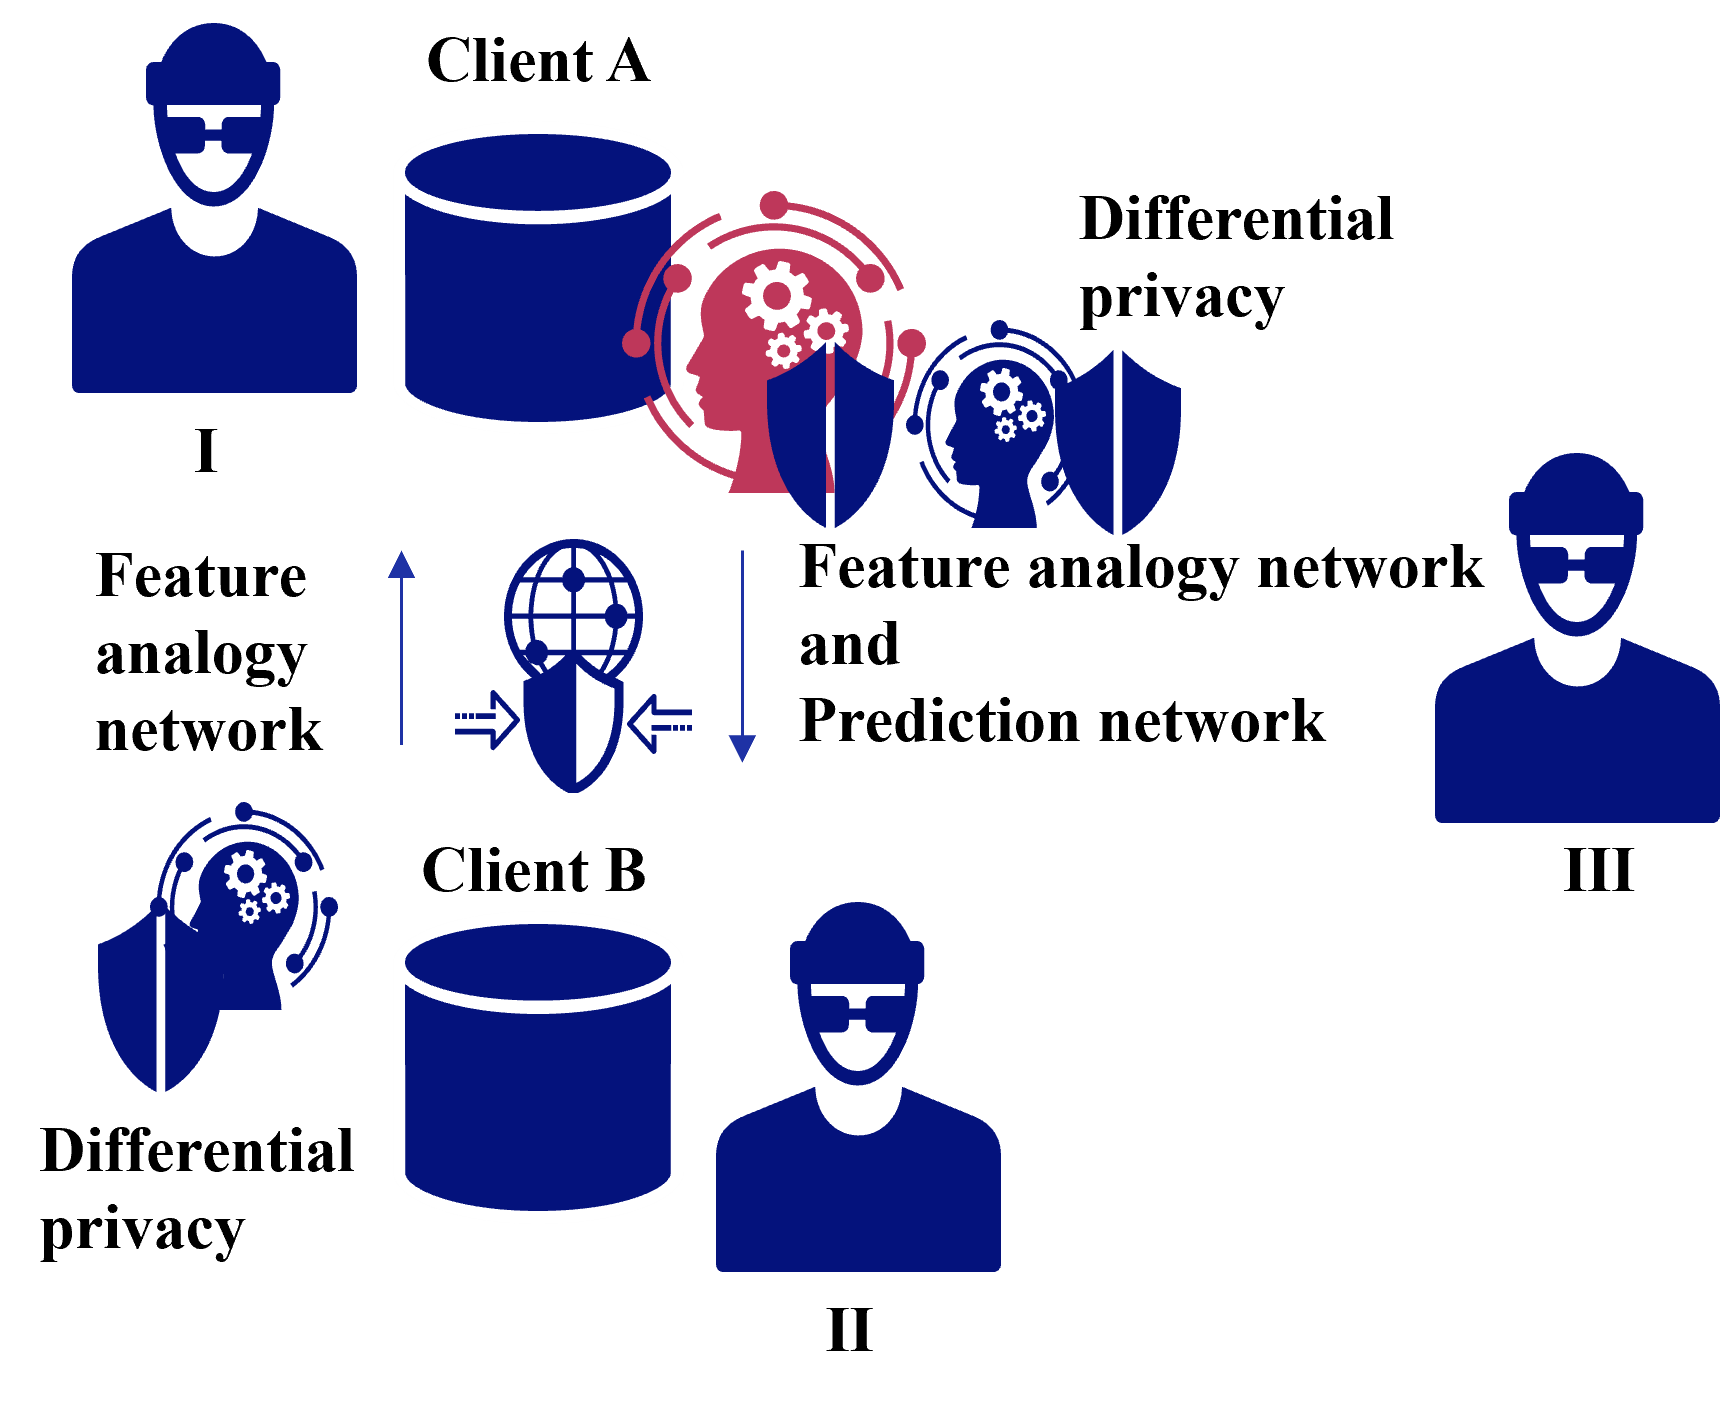
### Visual Description
## Diagram: Privacy-Preserving Federated Learning Architecture
### Overview
The image is a conceptual technical diagram illustrating a distributed machine learning system, likely a federated learning architecture. It depicts the interaction between multiple data sources (Clients), privacy-preserving mechanisms (Differential Privacy), and a central processing framework (Feature Analogy and Prediction Networks). The diagram uses icons to represent human participants, databases, and AI/security processes.
### Components/Axes
**Entities & Icons:**
* **Figures (I, II, III):** Represent human participants or distinct entities in the system.
* **Figure I:** Positioned at the top-left.
* **Figure II:** Positioned at the bottom-center.
* **Figure III:** Positioned at the right.
* **Database Icons:**
* **Client A:** Located at the top-left, associated with Figure I.
* **Client B:** Located at the bottom-left, associated with Figure II.
* **AI/Security Icons:**
* **Red Head with Gears:** Located between Client A and the center. Represents an AI/ML model or feature extraction process.
* **Blue Head with Gears (with Shield):** Located to the left of Client B. Represents a secured AI/ML model.
* **Globe with Shield:** Located in the center. Represents a global or network-level security/privacy layer.
* **Blue Shields:** Used throughout to denote security/privacy protection.
**Textual Labels:**
* **"Client A"**: Label for the top database.
* **"Client B"**: Label for the bottom database.
* **"Differential privacy"**: Appears twice (once near the top-left, once near the bottom-left).
* **"Feature analogy network"**: Appears on the left side, associated with the vertical flow.
* **"Feature analogy network and Prediction network"**: Appears on the right side, associated with Figure III.
### Detailed Analysis
**Spatial Layout & Flow:**
* **Left Region (Input/Processing):**
* **Top-Left:** Figure I is linked to "Client A". A red icon (head with gears) is positioned next to a blue shield. This suggests that data from Client A is processed through a feature extraction model (the red head) and protected by a shield.
* **Bottom-Left:** Figure II is linked to "Client B". A blue icon (head with gears) is protected by a shield. The text "Differential privacy" is placed below this, indicating that the data/model from Client B is subject to differential privacy constraints.
* **Center Region (Communication):**
* A central icon (globe with a shield) acts as a hub.
* Vertical blue arrows point up and down, indicating bidirectional communication or synchronization between the clients and the central network.
* The text "Feature analogy network" is placed to the left of the central arrows, suggesting this is the mechanism facilitating the connection between the clients.
* **Right Region (Output/Aggregation):**
* Figure III is positioned on the right.
* The text "Feature analogy network and Prediction network" is placed near Figure III, indicating that the final output or the aggregation of the system occurs here, combining the feature analogy and prediction capabilities.
### Key Observations
* **Color Coding:** The diagram predominantly uses blue for all elements, except for the "head with gears" icon associated with Client A, which is red. This may signify that Client A is the primary source, the active learner, or a specific type of node distinct from Client B.
* **Redundancy:** The term "Differential privacy" is explicitly labeled twice, emphasizing that it is a mandatory component for both Client A and Client B to ensure data security.
* **Symmetry:** The diagram is structured to show a balanced interaction between Client A and Client B, feeding into a central network, which then feeds into a final prediction network.
### Interpretation
This diagram illustrates a **Privacy-Preserving Federated Learning** workflow.
1. **Data Isolation:** By using "Client A" and "Client B" with "Differential privacy," the system ensures that raw data remains local to the clients and is not exposed during the training process.
2. **Feature Alignment:** The "Feature analogy network" suggests that the system is designed to align or map features between different clients (who may have heterogeneous data) so that a global model can be trained effectively without direct data sharing.
3. **Prediction:** The "Prediction network" on the right represents the final stage where the aggregated knowledge (derived from the feature analogy network) is used to perform inference or prediction tasks.
4. **Security:** The consistent use of shield icons and the explicit mention of "Differential privacy" indicates that security is a primary architectural constraint, likely designed to prevent model inversion attacks or data leakage from the participating clients.
</details>
Figure 12: Countermeasures against threads in case of common features.
#### IV-C 2 Common IDs
In case of common IDs, the threads to privacy are the leakage of identities and information required for feature similarity [24]. For the leakage of identities, Dummy IDs are prepared in addition to the original IDs as shown in Section IV-B 1 [39]. For information required for feature similarity, figure 13 shows countermeasures against threads in case of common IDs.
1. Client receiving information for feature similarity: Difficult to guess information due to secure computation [35].
1. Third party: Achieved by encryption of communication.
<details>
<summary>extracted/5379099/fig/CMCI_FTL.png Details</summary>
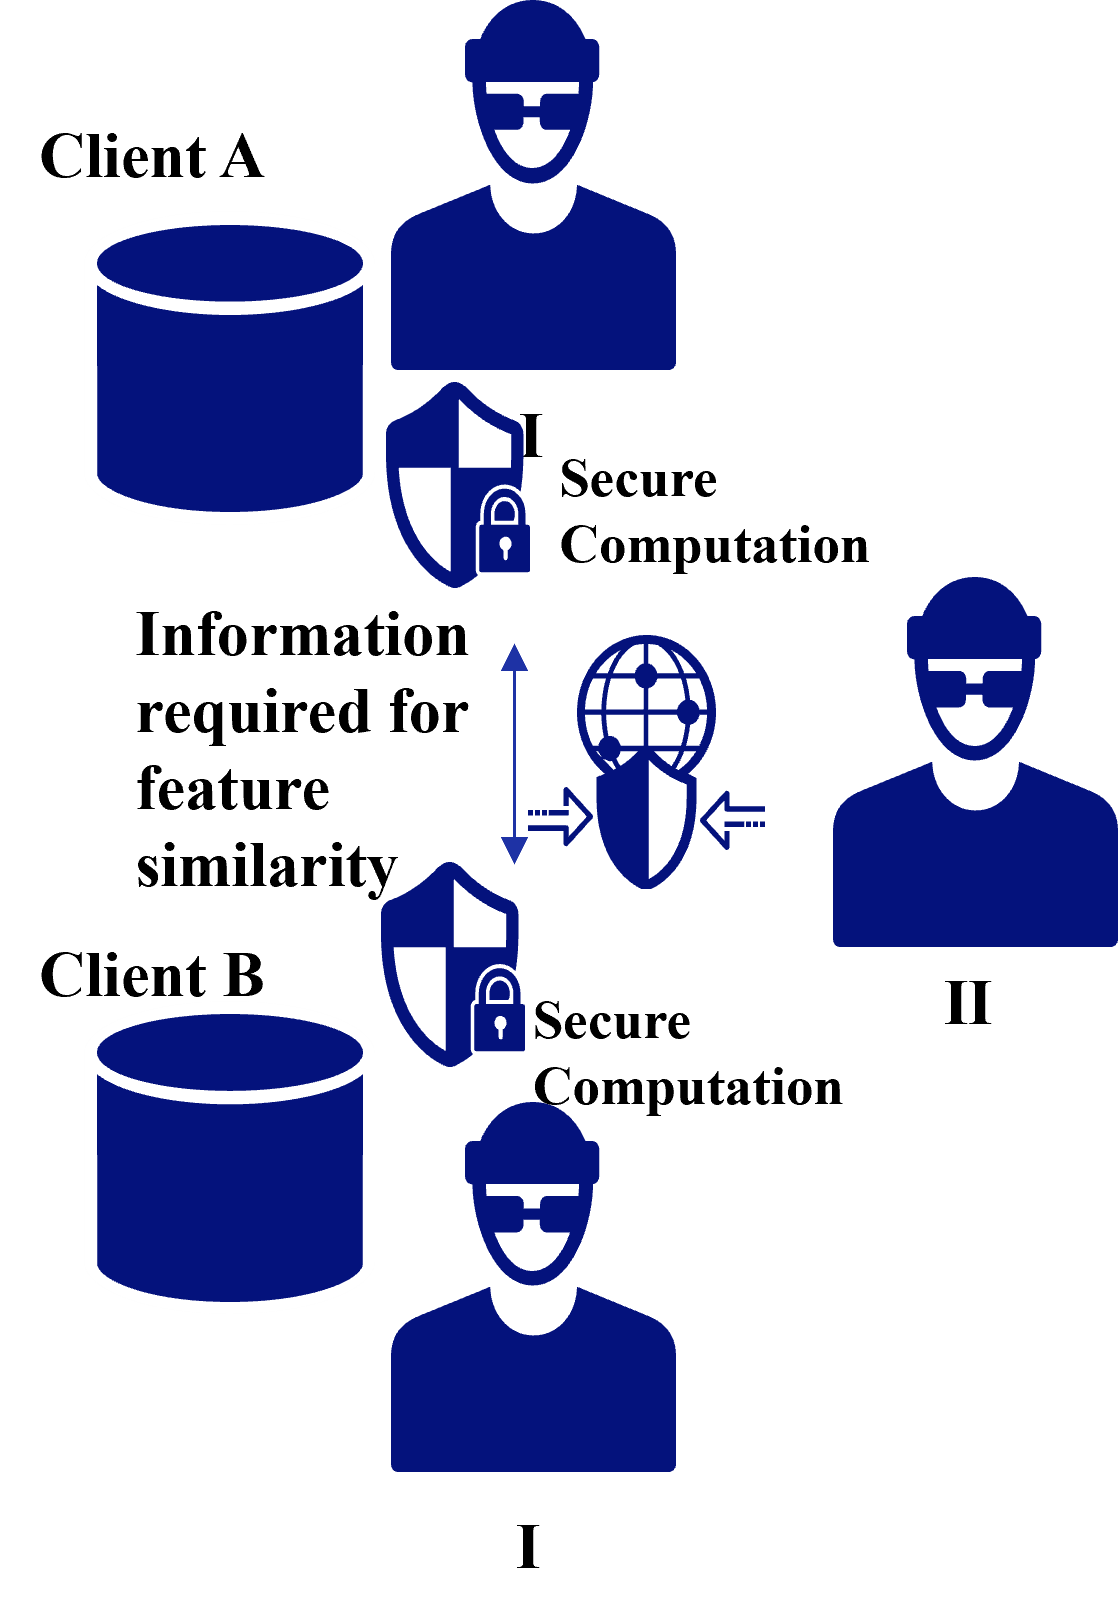
### Visual Description
## Diagram: Secure Computation Protocol Architecture
### Overview
The image is a conceptual diagram illustrating a secure computation architecture involving two clients (Client A and Client B) and two external entities (labeled I and II). The diagram depicts a process where information is exchanged for "feature similarity" while utilizing "Secure Computation" mechanisms to protect data integrity and privacy.
### Components/Axes
* **Entities:**
* **Client A:** Located at the top-left, represented by a database icon and a person icon.
* **Client B:** Located at the bottom-left, represented by a database icon and a person icon.
* **Entity I:** Located at the bottom-center, represented by a person icon.
* **Entity II:** Located at the right-center, represented by a person icon.
* **Central Hub:**
* **Globe with Shield:** Located in the center, representing the central computation or aggregation point.
* **Security Mechanisms:**
* **Secure Computation Shields:** Two shield icons with padlocks, positioned between the clients and the central globe.
* **Textual Labels:**
* "Client A" (Top-left)
* "Client B" (Bottom-left)
* "Secure Computation" (Appears twice, next to the shield icons)
* "Information required for feature similarity" (Left-center)
* "I" (Below the bottom-center person icon)
* "II" (Below the right-center person icon)
### Detailed Analysis
* **Spatial Layout:**
* The diagram is organized with the data sources (Clients A and B) on the left.
* The central processing hub (Globe/Shield) is in the middle.
* The external entities (I and II) are positioned at the bottom and right, respectively.
* **Flow and Interaction:**
* **Data Protection:** The "Secure Computation" shields are placed directly between the client databases and the central globe. This implies that data leaving the clients is encrypted or processed via secure computation protocols before reaching the central hub.
* **Information Exchange:** The text "Information required for feature similarity" is positioned to the left of the central globe. A vertical double-headed arrow indicates that this specific information is the subject of the exchange between the clients and the central hub.
* **Directionality:** Horizontal arrows point toward the central globe from the left (representing the clients) and from the right (representing Entity II), suggesting a multi-directional data flow into the central computation hub.
### Key Observations
* **Color Scheme:** The diagram uses a consistent dark blue color for all icons and text against a light gray background, creating a unified visual identity.
* **Iconography:** The use of a shield with a padlock is a standard industry symbol for encryption or secure computation. The globe icon typically represents a network or a global server.
* **Role Differentiation:** The labeling of entities as "I" and "II" suggests distinct roles in the protocol, though the diagram does not explicitly define the functional difference between these two entities.
### Interpretation
This diagram illustrates a **Secure Multi-Party Computation (SMPC)** or **Federated Learning** environment.
* **Purpose:** The primary goal is to calculate "feature similarity" between Client A and Client B. This is a common requirement in privacy-preserving machine learning or data analysis, where two parties want to know how similar their datasets are without revealing the raw data itself.
* **Mechanism:** The "Secure Computation" shields indicate that the raw data remains at the client side (in the databases). Only the necessary, computed, or encrypted information required for the similarity calculation is transmitted to the central globe.
* **Architecture:** The layout suggests a hub-and-spoke model. The central globe acts as the aggregator or the "honest broker" that performs the computation on the received secure inputs. The presence of entities "I" and "II" suggests that the protocol involves more than just the two data-holding clients; these entities likely represent the orchestrator, the computation server, or other participants necessary to facilitate the secure exchange.
</details>
Figure 13: Countermeasures against threads in case of common IDs.
## V Conclusion
In this paper, we have described privacy threats and countermeasures for federated learning in terms of HFL, VFL, and FTL. Privacy measures for federated learning include differential privacy to reduce the leakage of training data from the model, secure computation to keep the model computation process secret between clients and servers, encryption of communications to prevent information leakage to third parties, and ID dummying to prevent ID leakage.
## Acknowledgment
This R&D includes the results of ” Research and development of optimized AI technology by secure data coordination (JPMI00316)” by the Ministry of Internal Affairs and Communications (MIC), Japan.
## References
- [1] L. Lyu, H. Yu, and Q. Yang, “Threats to federated learning: A survey,” arXiv preprint arXiv:2003.02133, 2020.
- [2] Q. Yang, Y. Liu, T. Chen, and Y. Tong, “Federated machine learning: Concept and applications,” ACM Trans. Intell. Syst. Technol., vol. 10, no. 2, 2019.
- [3] B. McMahan, E. Moore, D. Ramage, S. Hampson, and B. A. y. Arcas, “Communication-Efficient Learning of Deep Networks from Decentralized Data,” in Proceedings of the 20th International Conference on Artificial Intelligence and Statistics, ser. Proceedings of Machine Learning Research, vol. 54. PMLR, 2017, pp. 1273–1282.
- [4] E. T. Martínez Beltrán, M. Q. Pérez, P. M. S. Sánchez, S. L. Bernal, G. Bovet, M. G. Pérez, G. M. Pérez, and A. H. Celdrán, “Decentralized federated learning: Fundamentals, state of the art, frameworks, trends, and challenges,” IEEE Communications Surveys & Tutorials, vol. 25, no. 4, pp. 2983–3013, 2023.
- [5] L. Zhao, L. Ni, S. Hu, Y. Chen, P. Zhou, F. Xiao, and L. Wu, “Inprivate digging: Enabling tree-based distributed data mining with differential privacy,” in IEEE INFOCOM 2018 - IEEE Conference on Computer Communications, 2018, pp. 2087–2095.
- [6] Q. Li, Z. Wen, and B. He, “Practical federated gradient boosting decision trees,” Proceedings of the AAAI Conference on Artificial Intelligence, vol. 34, no. 04, pp. 4642–4649, 2020.
- [7] F. Wang, J. Ou, and H. Lv, “Gradient boosting forest: a two-stage ensemble method enabling federated learning of gbdts,” in Neural Information Processing, T. Mantoro, M. Lee, M. A. Ayu, K. W. Wong, and A. N. Hidayanto, Eds. Cham: Springer International Publishing, 2021, pp. 75–86.
- [8] A. Gascón, P. Schoppmann, B. Balle, M. Raykova, J. Doerner, S. Zahur, and D. Evans, “Secure linear regression on vertically partitioned datasets,” IACR Cryptol. ePrint Arch., vol. 2016, p. 892, 2016.
- [9] S. Hardy, W. Henecka, H. Ivey-Law, R. Nock, G. Patrini, G. Smith, and B. Thorne, “Private federated learning on vertically partitioned data via entity resolution and additively homomorphic encryption,” CoRR, vol. abs/1711.10677, 2017.
- [10] R. Nock, S. Hardy, W. Henecka, H. Ivey-Law, G. Patrini, G. Smith, and B. Thorne, “Entity resolution and federated learning get a federated resolution,” CoRR, vol. abs/1803.04035, 2018.
- [11] S. Yang, B. Ren, X. Zhou, and L. Liu, “Parallel distributed logistic regression for vertical federated learning without third-party coordinator,” CoRR, vol. abs/1911.09824, 2019.
- [12] Q. Zhang, B. Gu, C. Deng, and H. Huang, “Secure bilevel asynchronous vertical federated learning with backward updating,” Proceedings of the AAAI Conference on Artificial Intelligence, vol. 35, no. 12, pp. 10 896–10 904, May 2021.
- [13] K. Cheng, T. Fan, Y. Jin, Y. Liu, T. Chen, D. Papadopoulos, and Q. Yang, “Secureboost: A lossless federated learning framework,” IEEE Intelligent Systems, vol. 36, no. 6, pp. 87–98, 2021.
- [14] J. Vaidya, C. Clifton, M. Kantarcioglu, and A. S. Patterson, “Privacy-preserving decision trees over vertically partitioned data,” ACM Trans. Knowl. Discov. Data, vol. 2, no. 3, oct 2008.
- [15] Y. Wu, S. Cai, X. Xiao, G. Chen, and B. C. Ooi, “Privacy preserving vertical federated learning for tree-based models,” Proc. VLDB Endow., vol. 13, no. 12, p. 2090–2103, jul 2020.
- [16] Y. Liu, Y. Liu, Z. Liu, Y. Liang, C. Meng, J. Zhang, and Y. Zheng, “Federated forest,” IEEE Transactions on Big Data, pp. 1–1, 2020.
- [17] Z. Tian, R. Zhang, X. Hou, J. Liu, and K. Ren, “Federboost: Private federated learning for GBDT,” CoRR, vol. abs/2011.02796, 2020.
- [18] Y. Hu, D. Niu, J. Yang, and S. Zhou, “Fdml: A collaborative machine learning framework for distributed features,” in Proceedings of the 25th ACM SIGKDD International Conference on Knowledge Discovery & Data Mining, ser. KDD ’19. New York, NY, USA: Association for Computing Machinery, 2019, p. 2232–2240.
- [19] Y. Liu, Y. Kang, X. Zhang, L. Li, Y. Cheng, T. Chen, M. Hong, and Q. Yang, “A communication efficient collaborative learning framework for distributed features,” CoRR, vol. abs/1912.11187, 2019.
- [20] D. Romanini, A. J. Hall, P. Papadopoulos, T. Titcombe, A. Ismail, T. Cebere, R. Sandmann, R. Roehm, and M. A. Hoeh, “Pyvertical: A vertical federated learning framework for multi-headed splitnn,” CoRR, vol. abs/2104.00489, 2021.
- [21] Q. He, W. Yang, B. Chen, Y. Geng, and L. Huang, “Transnet: Training privacy-preserving neural network over transformed layer,” Proc. VLDB Endow., vol. 13, no. 12, p. 1849–1862, jul 2020.
- [22] B. Gu, Z. Dang, X. Li, and H. Huang, “Federated doubly stochastic kernel learning for vertically partitioned data,” in Proceedings of the 26th ACM SIGKDD International Conference on Knowledge Discovery & Data Mining. New York, NY, USA: Association for Computing Machinery, 2020, p. 2483–2493.
- [23] R. Xu, N. Baracaldo, Y. Zhou, A. Anwar, J. Joshi, and H. Ludwig, “Fedv: Privacy-preserving federated learning over vertically partitioned data,” CoRR, vol. abs/2103.03918, 2021.
- [24] Y. Liu, Y. Kang, C. Xing, T. Chen, and Q. Yang, “A secure federated transfer learning framework,” IEEE Intelligent Systems, vol. 35, no. 4, pp. 70–82, 2020.
- [25] S. Sharma, C. Xing, Y. Liu, and Y. Kang, “Secure and efficient federated transfer learning,” in 2019 IEEE International Conference on Big Data (Big Data), 2019, pp. 2569–2576.
- [26] B. Zhang, C. Chen, and L. Wang, “Privacy-preserving transfer learning via secure maximum mean discrepancy,” arXiv preprint arXiv:2009.11680, 2020.
- [27] Y. Gao, M. Gong, Y. Xie, A. K. Qin, K. Pan, and Y.-S. Ong, “Multiparty dual learning,” IEEE Transactions on Cybernetics, vol. 53, no. 5, pp. 2955–2968, 2023.
- [28] D. Gao, Y. Liu, A. Huang, C. Ju, H. Yu, and Q. Yang, “Privacy-preserving heterogeneous federated transfer learning,” in 2019 IEEE International Conference on Big Data (Big Data), 2019, pp. 2552–2559.
- [29] J. Mori, I. Teranishi, and R. Furukawa, “Continual horizontal federated learning for heterogeneous data,” in 2022 International Joint Conference on Neural Networks (IJCNN), 2022, pp. 1–8.
- [30] D. Gao, C. Ju, X. Wei, Y. Liu, T. Chen, and Q. Yang, “Hhhfl: Hierarchical heterogeneous horizontal federated learning for electroencephalography,” arXiv preprint arXiv:1909.05784, 2019.
- [31] A. Rakotomamonjy, M. Vono, H. J. M. Ruiz, and L. Ralaivola, “Personalised federated learning on heterogeneous feature spaces,” arXiv preprint arXiv:2301.11447, 2023.
- [32] E. Hallaji, R. Razavi-Far, and M. Saif, Federated and Transfer Learning: A Survey on Adversaries and Defense Mechanisms. Cham: Springer International Publishing, 2023, pp. 29–55.
- [33] S. Hardy, W. Henecka, H. Ivey-Law, R. Nock, G. Patrini, G. Smith, and B. Thorne, “Private federated learning on vertically partitioned data via entity resolution and additively homomorphic encryption,” arXiv preprint arXiv:1711.10677, 2017.
- [34] K. Bonawitz, V. Ivanov, B. Kreuter, A. Marcedone, H. B. McMahan, S. Patel, D. Ramage, A. Segal, and K. Seth, “Practical secure aggregation for privacy-preserving machine learning,” in Proceedings of the 2017 ACM SIGSAC Conference on Computer and Communications Security, ser. CCS ’17. New York, NY, USA: Association for Computing Machinery, 2017, p. 1175–1191.
- [35] P. Mohassel and Y. Zhang, “Secureml: A system for scalable privacy-preserving machine learning,” in 2017 IEEE Symposium on Security and Privacy (SP), 2017, pp. 19–38.
- [36] T. Araki, J. Furukawa, Y. Lindell, A. Nof, and K. Ohara, “High-throughput semi-honest secure three-party computation with an honest majority,” in Proceedings of the 2016 ACM SIGSAC Conference on Computer and Communications Security, ser. CCS ’16. New York, NY, USA: Association for Computing Machinery, 2016, p. 805–817.
- [37] M. Abadi, A. Chu, I. Goodfellow, H. B. McMahan, I. Mironov, K. Talwar, and L. Zhang, “Deep learning with differential privacy,” in Proceedings of the 2016 ACM SIGSAC Conference on Computer and Communications Security, ser. CCS ’16. New York, NY, USA: Association for Computing Machinery, 2016, p. 308–318.
- [38] R. C. Geyer, T. Klein, and M. Nabi, “Differentially private federated learning: A client level perspective,” arXiv preprint arXiv:1712.07557, 2017.
- [39] Y. Liu, X. Zhang, and L. Wang, “Asymmetrical vertical federated learning,” arXiv preprint arXiv:2004.07427, 2020.