# Survey of Privacy Threats and Countermeasures in Federated Learning
**Authors**: Masahiro Hayashitani, Junki Mori, and Isamu Teranishi
> M. Hayashitani, J. Mori, and I. Teranishi are with NEC Secure System Platform Research Laboratories. E-mail:
## Abstract
Federated learning is widely considered to be as a privacy-aware learning method because no training data is exchanged directly between clients. Nevertheless, there are threats to privacy in federated learning, and privacy countermeasures have been studied. However, we note that common and unique privacy threats among typical types of federated learning have not been categorized and described in a comprehensive and specific way. In this paper, we describe privacy threats and countermeasures for the typical types of federated learning; horizontal federated learning, vertical federated learning, and transfer federated learning.
Index Terms: horizontal federated learning, vertical federated learning, transfer federated learning, threat to privacy, countermeasure against privacy threat.
## I Introduction
As computing devices become more ubiquitous, people generate vast amounts of data in their daily lives. Collecting this data in centralized storage facilities is costly and time-consuming [1]. Another important concern is user privacy and confidentiality, as usage data typically contains sensitive information. Sensitive data such as biometrics and healthcare can be used for targeted social advertising and recommendations, posing immediate or potential privacy risks. Therefore, private data should not be shared directly without any privacy considerations. As societies become more privacy-conscious, legal restrictions such as the General Data Protection Regulation (GDPR) and the EU AI ACT are emerging, making data aggregation practices less feasible. In this case, federated learning has emerged as a promising machine learning technique where each client learns and sends the information to a server.
Federated learning has attracted attention as a privacy-preserving machine learning technique because it can learn a global model without exchanging private raw data between clients. However, federated learning still poses a threat to privacy. Recent works have shown that federated learning may not always provide sufficient privacy guarantees, since the communication of model updates throughout the training process may still reveal sensitive information, even to a third party or to the central server [1]. Typical examples of federated learning include horizontal federated learning where features are common, vertical federated learning where IDs are common, and federated transfer learning where some features or IDs are common. However, we note that common and unique privacy threats among each type of federated learning have not been categorized and described in a comprehensive and specific way.
For example, in the case of horizontal federated learning, semi-honest server can infer client’s data by inference attacks on a model sent by the client. If the client is an attacker, the attacker can infer the data of other clients by inference attacks on a global model received from the server. Such an attack is possible because the global model is design to reflect the data of all clients. If the attacker is a third party that is neither a server nor a client, it can eavesdrop on models passing through the communication channel and infer client data through inference attacks. In vertical federated learning, the main threat to privacy is the identify leakage through identity matching between clients. In addition, since the intermediate outputs of a model are sent to the server, there is a possibility that client data can be inferred through an inference attack. Also, as in horizontal federated learning, client data can be inferred by an inference attack on the server. Finally, in federated transfer learning, member and attribute guessing attacks are possible by exploiting a prediction network. If IDs are common, gradient information is exchanged when features are made similar. Therefore member and attribute guessing attacks are possible by using gradient information. When there are common features among clients, attribute guessing attacks are possible by exploiting networks that complement the missing features from the common features.
In this paper, we discuss the above threats to privacy in detail and countermeasures against privacy threats in three types of federated learning; horizontal federated learning, vertical federated learning, and federated transfer learning. The paper is organized as follows: Section 2 presents learning methods for horizontal federated learning, vertical federated learning, and federated transfer learning; Section 3 discusses threats to privacy in each federated learning; Section 4 discusses countermeasures against privacy threats in each federated learning; and Section 5 concludes.
## II Categorization of Federated Learning
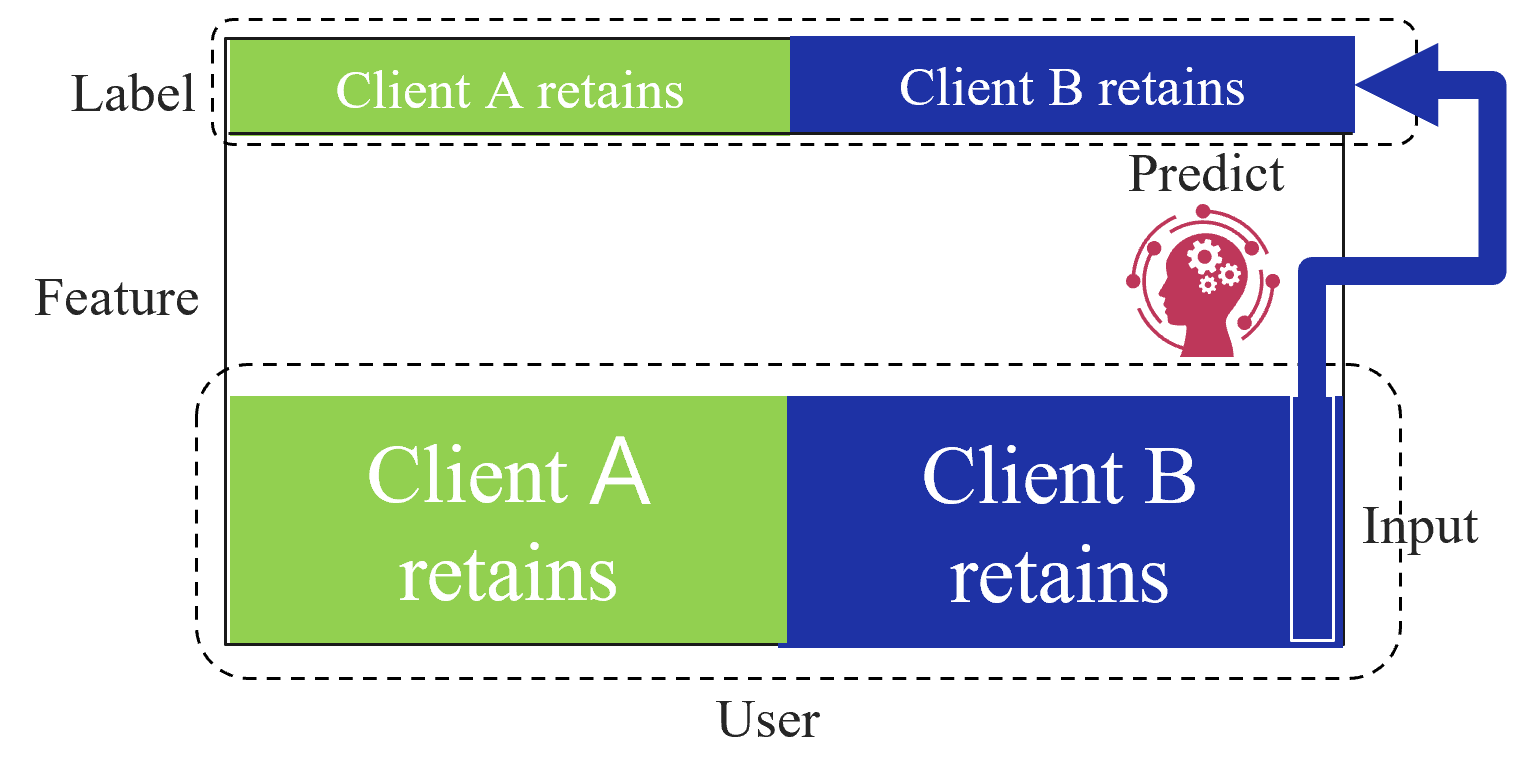
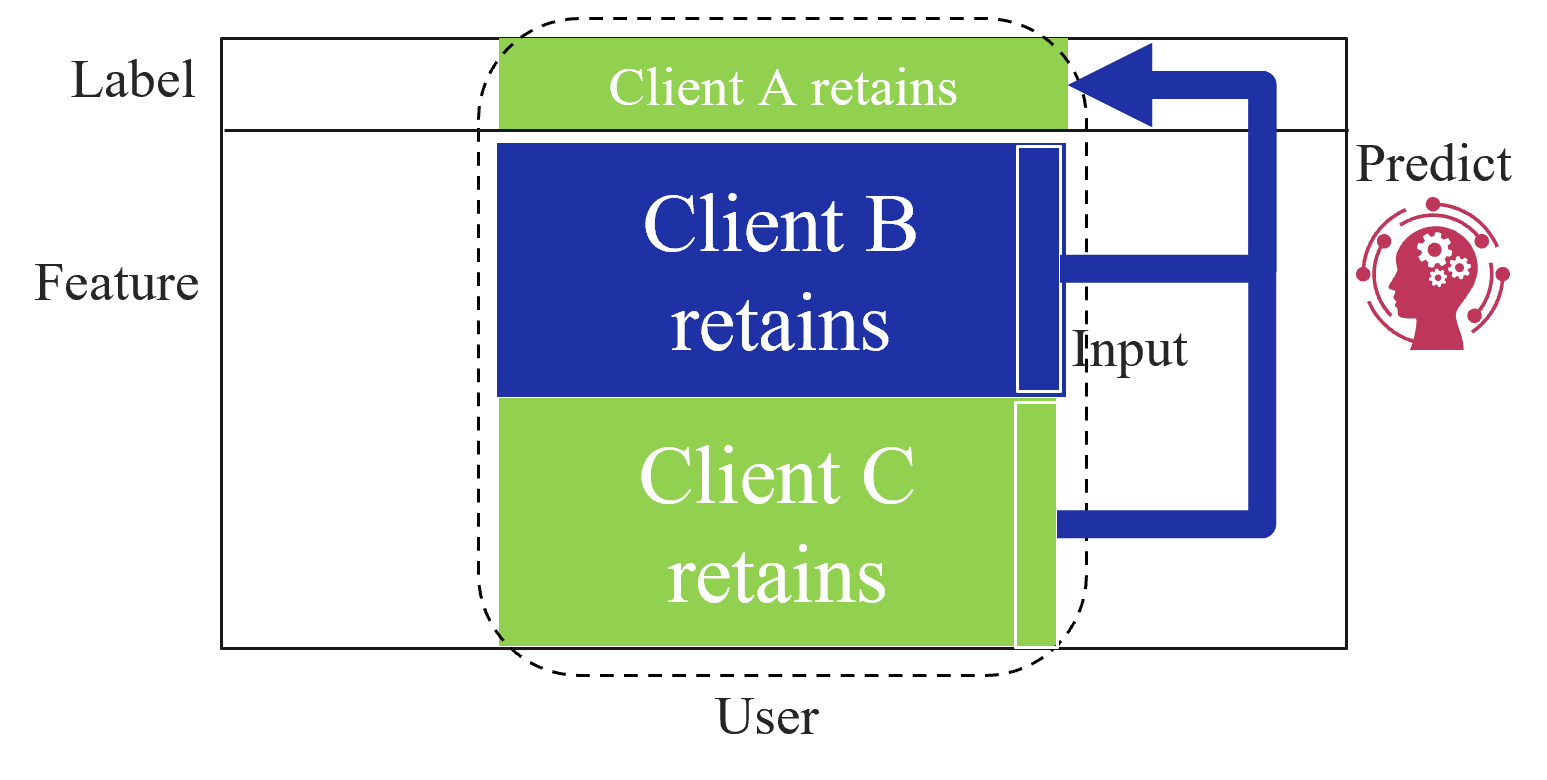
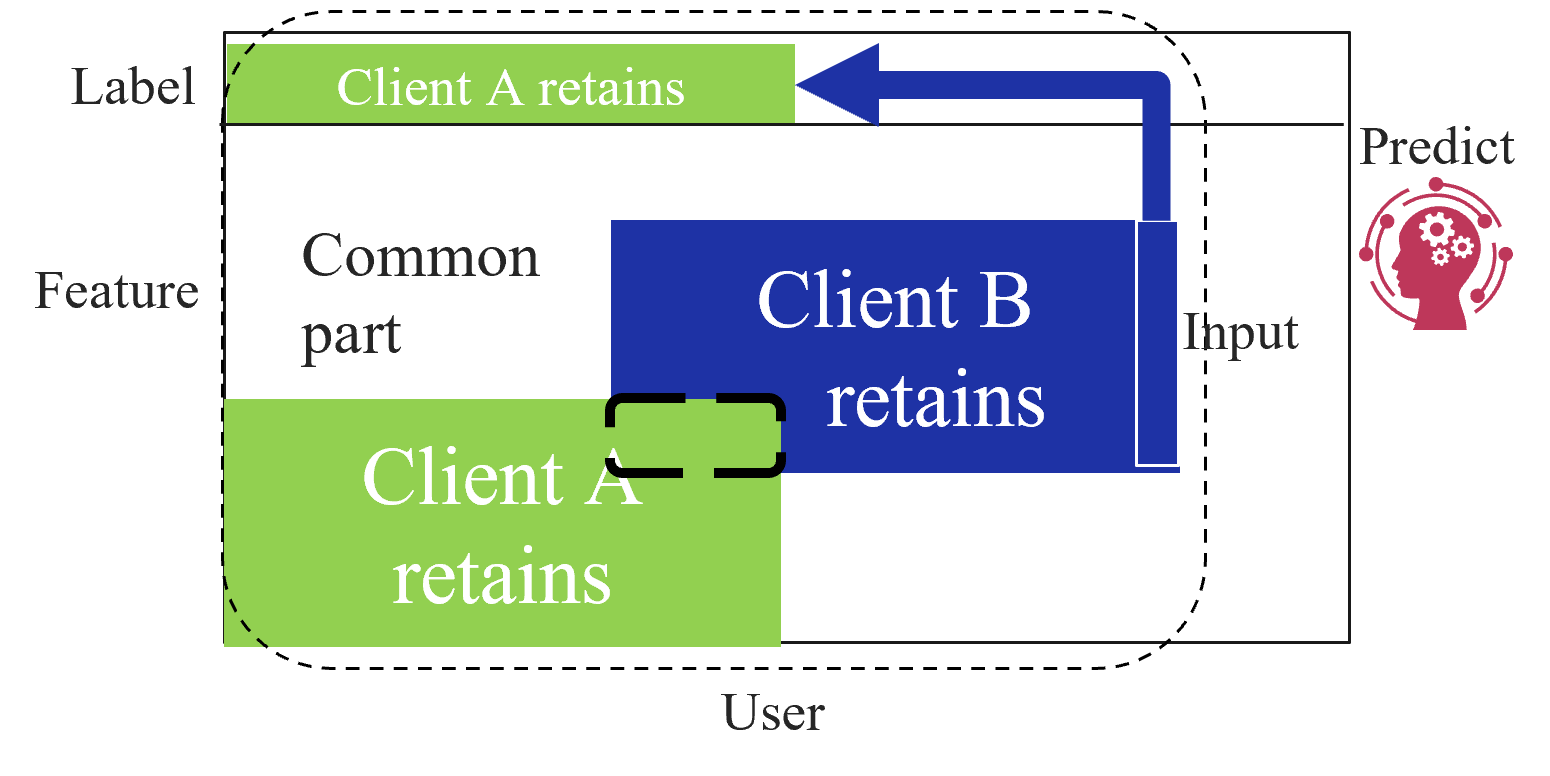
Based on the data structures among clients, federated learning is categorized into three types as first introduced by Yang et al. [2]: horizontal federated learning (HFL), vertical federated learning (VFL), and federated transfer learning (FTL). Figure 1 shows the data structure among clients for each type of federated learning. HFL assumes that each client has the same features and labels but different samples (Figure 1(a)). On the other hand, VFL assumes that each client has the same samples but disjoint features (Figure 1(a)). Finally, FTL applies to the scenario where each of the two clients has data that differ in not only samples but also features (Figure 1(c)).
In the following subsections, we describe the learning and prediction methods for each type of federated learning.
<details>
<summary>extracted/5379099/fig/HFL_structure.png Details</summary>
### Visual Description
## System Architecture Diagram: Distributed Client Data Retention for Prediction
### Overview
The image is a technical diagram illustrating a system architecture for a machine learning or data processing workflow involving two clients (Client A and Client B). The diagram emphasizes data partitioning and retention, showing how features and labels are held separately by each client before being used for a prediction task. The overall flow suggests a privacy-preserving or federated learning setup.
### Components/Axes
The diagram is structured into two primary horizontal sections, each enclosed by a dashed border, and a central prediction component.
**1. Top Section (Label):**
* **Label:** The word "Label" is positioned to the left of this section.
* **Content:** A horizontal bar is split into two colored segments:
* **Left Segment (Green):** Contains the text "Client A retains".
* **Right Segment (Blue):** Contains the text "Client B retains".
* **Spatial Grounding:** This entire "Label" bar is located in the upper portion of the diagram, spanning most of its width.
**2. Bottom Section (Feature):**
* **Label:** The word "Feature" is positioned to the left of this section.
* **Content:** A larger horizontal bar, also split into two colored segments:
* **Left Segment (Green):** Contains the text "Client A retains".
* **Right Segment (Blue):** Contains the text "Client B retains".
* **Spatial Grounding:** This "Feature" bar is located in the lower portion of the diagram, directly below the "Label" bar. It is taller than the label bar.
* **Additional Label:** The word "User" is centered below the "Feature" bar.
**3. Central Prediction Component:**
* **Label:** The word "Predict" is positioned above an icon.
* **Icon:** A red silhouette of a human head in profile, facing left. Inside the head are three white gears. Surrounding the head is a circular network of red dots connected by lines, suggesting a neural network or complex system.
* **Spatial Grounding:** This component is located in the center-right area of the diagram, between the "Label" and "Feature" bars.
**4. Data Flow Arrows:**
* **Input Arrow:** A thick, dark blue arrow originates from the right side of the "Feature" bar (specifically from the blue "Client B retains" segment). It is labeled "Input" at its base. The arrow travels vertically upward, then makes a 90-degree left turn.
* **Prediction Arrow:** The same dark blue arrow continues from the "Predict" icon, traveling horizontally to the left and then turning upward to point directly at the right end of the "Label" bar (the blue "Client B retains" segment). This creates a continuous flow: Feature (Input) -> Predict -> Label.
### Detailed Analysis
* **Color Coding & Data Retention:** The diagram uses a consistent color scheme to denote data ownership:
* **Green:** Represents data retained by **Client A**.
* **Blue:** Represents data retained by **Client B**.
This color coding is applied identically to both the "Feature" and "Label" bars, indicating that each client holds a distinct partition of both the input features and the output labels.
* **Component Relationships:** The architecture is defined by separation and a central processing step.
1. **Data Partitioning:** Features and labels are split between Client A and Client B. The dashed boxes around each section visually reinforce that this data is retained locally by each client.
2. **Prediction Process:** The "Predict" component (symbolized by the AI/model icon) takes the "Input" from the feature data (specifically shown coming from Client B's portion in this diagram) and generates an output.
3. **Output Target:** The prediction output is directed towards the "Label" bar, specifically to the segment retained by Client B. This implies the model's prediction is being compared to or used in conjunction with the labels held by Client B.
### Key Observations
* **Asymmetry in Flow:** While both clients retain data, the diagram's flow arrow explicitly originates from Client B's feature segment. This may illustrate a specific step in a process (e.g., Client B submitting its features for prediction) rather than implying Client A never provides input.
* **Privacy/Encapsulation Emphasis:** The dashed borders around the "Label" and "Feature" sections strongly suggest that the data within each client's partition is not fully shared or visible to the other party or even directly to the central prediction component in its raw form.
* **Iconography:** The "Predict" icon combines a human head (suggesting intelligence) with gears (suggesting machinery/processing) and a network (suggesting connectivity or complex models), clearly representing an AI or machine learning model.
### Interpretation
This diagram visually conceptualizes a **distributed or federated learning system** with a strong emphasis on **data privacy and partitioning**.
* **What it demonstrates:** The core idea is that sensitive data (both features and labels) does not need to be centralized. Instead, it remains "retained" by the respective data owners (Client A and Client B). A predictive model can still be trained or operated upon this distributed data. The flow suggests a scenario where one client (Client B) uses its local features as input to a model, and the model's prediction is relevant to the labels that same client holds.
* **How elements relate:** The separation into "Feature" and "Label" bars mirrors the standard machine learning paradigm of input (X) and output (y). The color-coded split within each bar maps this paradigm onto a multi-party setting. The "Predict" component acts as the bridge that learns from or operates on this partitioned data without requiring full data consolidation.
* **Notable Implications:** The architecture implies solutions to challenges like data sovereignty, regulatory compliance (e.g., GDPR), and commercial secrecy. It outlines a framework where collaborative model development or inference is possible while minimizing data exposure. The specific path of the arrow (from Client B's features to the prediction to Client B's labels) could represent a single validation step or a specific client's role in a larger training round.
</details>
(a) Horizontal federated learning.
<details>
<summary>extracted/5379099/fig/VFL_structure.png Details</summary>
### Visual Description
\n
## Diagram: Data Partitioning and Flow in a Federated Learning System
### Overview
The image is a conceptual diagram illustrating a data partitioning and prediction workflow, likely within a federated or privacy-preserving machine learning context. It shows how different data components (Label, Feature, User) are retained by separate clients (A, B, C) and how selected data flows to a prediction model.
### Components/Axes
The diagram is structured within a large rectangular boundary. The primary components are:
1. **Left-Side Categorical Labels:** Three text labels are aligned vertically along the left edge, defining data categories:
* `Label` (Top)
* `Feature` (Middle)
* `User` (Bottom)
2. **Central Data Blocks (Clients):** Three colored rectangular blocks are stacked vertically in the center, each representing a client's retained data. They are enclosed by a dashed, rounded rectangular line.
* **Top Block (Green):** Contains the text `Client A retains`. This block is positioned adjacent to the `Label` category.
* **Middle Block (Blue):** Contains the text `Client B retains`. This block is positioned adjacent to the `Feature` category.
* **Bottom Block (Green):** Contains the text `Client C retains`. This block is positioned adjacent to the `User` category.
3. **Right-Side Prediction Component:**
* The text `Predict` is located in the upper-right area.
* Below the text is a red icon depicting a human head silhouette with gears inside, surrounded by a circular network of nodes and lines, symbolizing an AI or machine learning model.
4. **Data Flow Arrows:**
* A thick, dark blue arrow originates from the right side of the `Client B retains` block. It travels right, then turns upward, and finally points left into the `Client A retains` block.
* A second thick, dark blue arrow originates from the right side of the `Client C retains` block. It travels right and then turns upward to join the path of the first arrow before pointing into the `Client A retains` block.
* The label `Input` is placed near the point where the two arrows from Clients B and C converge.
### Detailed Analysis
* **Spatial Grounding & Color Matching:**
* The `Client A retains` block (green) is at the top-center, within the dashed boundary.
* The `Client B retains` block (blue) is in the center, within the dashed boundary.
* The `Client C retains` block (green) is at the bottom-center, within the dashed boundary.
* The two data flow arrows are the same dark blue color. The arrow from the blue `Client B` block and the arrow from the green `Client C` block are visually identical in color and style, confirming they represent the same type of data flow ("Input").
* The `Predict` icon is positioned to the right of the central blocks, outside the dashed boundary.
* **Flow Description:**
1. Data from `Client B` (Feature data) and `Client C` (User data) is sent as `Input`.
2. This combined input flows toward the `Predict` model.
3. The arrow's final direction points into the `Client A retains` block (Label data), indicating that the prediction is made *against* or *in conjunction with* the labels held by Client A.
### Key Observations
* **Data Siloing:** The dashed line around the three client blocks visually emphasizes that each client's data is retained locally and is separate.
* **Asymmetric Data Roles:** The clients hold different types of data: Client A has labels, Client B has features, and Client C has user data. This is a classic setup for **vertical federated learning**, where different entities hold different features for the same set of users.
* **Prediction Mechanism:** The model (`Predict`) does not directly access the raw data from Clients B and C. Instead, it receives an "Input" derived from their data. The prediction output is associated with or applied to the labels held by Client A.
* **Color Coding:** The use of green for Clients A and C and blue for Client B may imply a grouping or relationship, though the specific meaning is not defined in the diagram.
### Interpretation
This diagram illustrates the core principle of **privacy-preserving collaborative machine learning**. The key insight is that valuable insights (predictions) can be generated without centralizing sensitive data.
* **What it demonstrates:** The system allows multiple parties (Clients A, B, C) to contribute to a machine learning task while keeping their primary data assets (labels, features, user info) private and local. Client A possesses the ground truth (labels), while Clients B and C possess the explanatory data (features and user attributes). The "Input" arrow likely represents processed data, gradients, or encrypted parameters—not the raw data itself—being shared to train a model that can predict Client A's labels.
* **Relationships:** The relationship is transactional and purpose-built for the prediction task. Clients B and C are data providers for the input features, and Client A is the data owner for the target labels. The `Predict` model acts as a neutral arbiter or a jointly trained entity.
* **Notable Implications:** This architecture mitigates privacy risks and complies with data protection regulations (like GDPR) by design, as raw data never leaves the client's environment. The "outlier" in the flow is that the final arrow points *to* Client A's data block, suggesting the prediction result is delivered to or evaluated against the label holder, completing the learning loop. The diagram abstracts away the complex cryptographic protocols (like secure multi-party computation or homomorphic encryption) that would be required to make this flow secure in practice.
</details>
(b) Vertical federated learning.
<details>
<summary>extracted/5379099/fig/FTL_structure.png Details</summary>
### Visual Description
## Diagram: Data Partitioning and Flow for Collaborative Prediction
### Overview
This diagram illustrates a data partitioning and processing scheme involving two clients (Client A and Client B) and a prediction model. It visually represents how a dataset, split into "Feature" and "Label" components, is divided between the two clients, with a "Common part" shared between them. The flow shows data from Client B being used to generate a prediction.
### Components/Axes
The diagram is structured within a rectangular boundary, with a dashed line indicating a "User" domain. The primary labeled regions and elements are:
* **Left Side (Data Domain):**
* **Label:** A horizontal green bar at the top, labeled "Client A retains".
* **Feature:** A large area below the Label bar. This area contains:
* A light gray region labeled "Common part".
* A large blue rectangle labeled "Client B retains".
* A large green rectangle at the bottom labeled "Client A retains".
* A black dashed rectangle highlights the overlap between the "Common part" and the "Client A retains" green rectangle.
* **Right Side (Prediction Domain):**
* **Predict:** A label next to a red icon depicting a human head silhouette with gears inside, symbolizing a model or AI.
* **Input:** A label next to a vertical blue bar that is part of the "Client B retains" block.
* **Flow Arrows:**
* A thick blue arrow originates from the top of the "Client B retains" blue block (near the "Input" label), travels upward, then left, and points into the "Client A retains" green Label bar.
* A second thick blue arrow originates from the same point on the "Client B retains" block and points directly right to the "Predict" icon.
* **Boundary:**
* **User:** A label at the bottom center, associated with a dashed line that encloses the entire data partitioning area (Feature, Label, and both clients' retained data) but excludes the "Predict" icon.
### Detailed Analysis
The diagram defines a specific data ownership and flow architecture:
1. **Data Segmentation:** The complete dataset is conceptually divided into two axes:
* **Feature Axis (Vertical):** The input variables.
* **Label Axis (Horizontal):** The target variable or outcome.
2. **Client Data Retention:**
* **Client A retains:** Two distinct green blocks.
* One block holds the **Label** data (top).
* Another block holds a portion of the **Feature** data (bottom left).
* **Client B retains:** One blue block holding a different portion of the **Feature** data (center-right).
* **Common part:** A region within the Feature space that is accessible to or shared between both clients. It overlaps with Client A's retained Feature block.
3. **Data Flow for Prediction:**
* The "Input" for the prediction model is derived from the data retained by **Client B**.
* This input data follows two paths:
* **Path 1 (Direct Prediction):** The data flows directly to the **Predict** model (red icon).
* **Path 2 (Label Association):** The data is also sent to the **Label** data retained by **Client A**. This suggests the model's prediction (using Client B's features) is being compared to or trained against the true labels held by Client A.
4. **Spatial Grounding:** The "User" boundary encapsulates the data held by the clients, implying this is the local or private data environment. The "Predict" model resides outside this boundary, indicating it may be a central server or an external service.
### Key Observations
* **Asymmetric Data Holding:** Client A holds both label data and some feature data, while Client B holds only feature data. This is a common setup in vertical federated learning.
* **Critical Data Pathway:** The blue arrow from Client B's data to Client A's label data is crucial. It represents the mechanism for aligning features from one party with labels from another without directly sharing the raw data.
* **Common Feature Space:** The "Common part" indicates an overlap in the feature sets held by the two clients, which may be necessary for aligning their data samples.
* **Model Externalization:** The prediction model is positioned outside the user/client domain, highlighting a separation between data holders and the model executor.
### Interpretation
This diagram depicts a **Vertical Federated Learning** or **Split Learning** scenario. The core idea is to collaboratively train or use a machine learning model without sharing raw data.
* **What it demonstrates:** It shows how two organizations (Client A and Client B) can leverage their respective data—Client A with user labels and some features, Client B with complementary features—to make a prediction. Client B processes its features to create an intermediate representation ("Input"), which is sent to the model. The model's output is then associated with Client A's labels for training or evaluation.
* **How elements relate:** The architecture enables privacy-preserving collaboration. The "Common part" allows for sample alignment. The data flow ensures that Client B's features are used for prediction, while Client A's labels provide the ground truth, all without either party exposing their complete dataset to the other or necessarily to the model server.
* **Notable Anomalies/Considerations:** The diagram is a high-level schematic. It abstracts away critical technical details such as the encryption methods used for the data transfer, the specific machine learning algorithm, how the "Common part" is established, and the exact nature of the "Input" (e.g., raw features, embeddings, or gradients). The security of the blue arrow pathway is paramount in a real-world implementation.
</details>
(c) Federated transfer learning.
Figure 1: Categorization of federated learning based on data structure owned by clients.
### II-A Horizontal Federated Learning
HFL is the most common federated learning category which was first introduced by Google [3]. The goal of HFL is for each client holding different samples to collaboratively improve the accuracy of a model with a common structure.
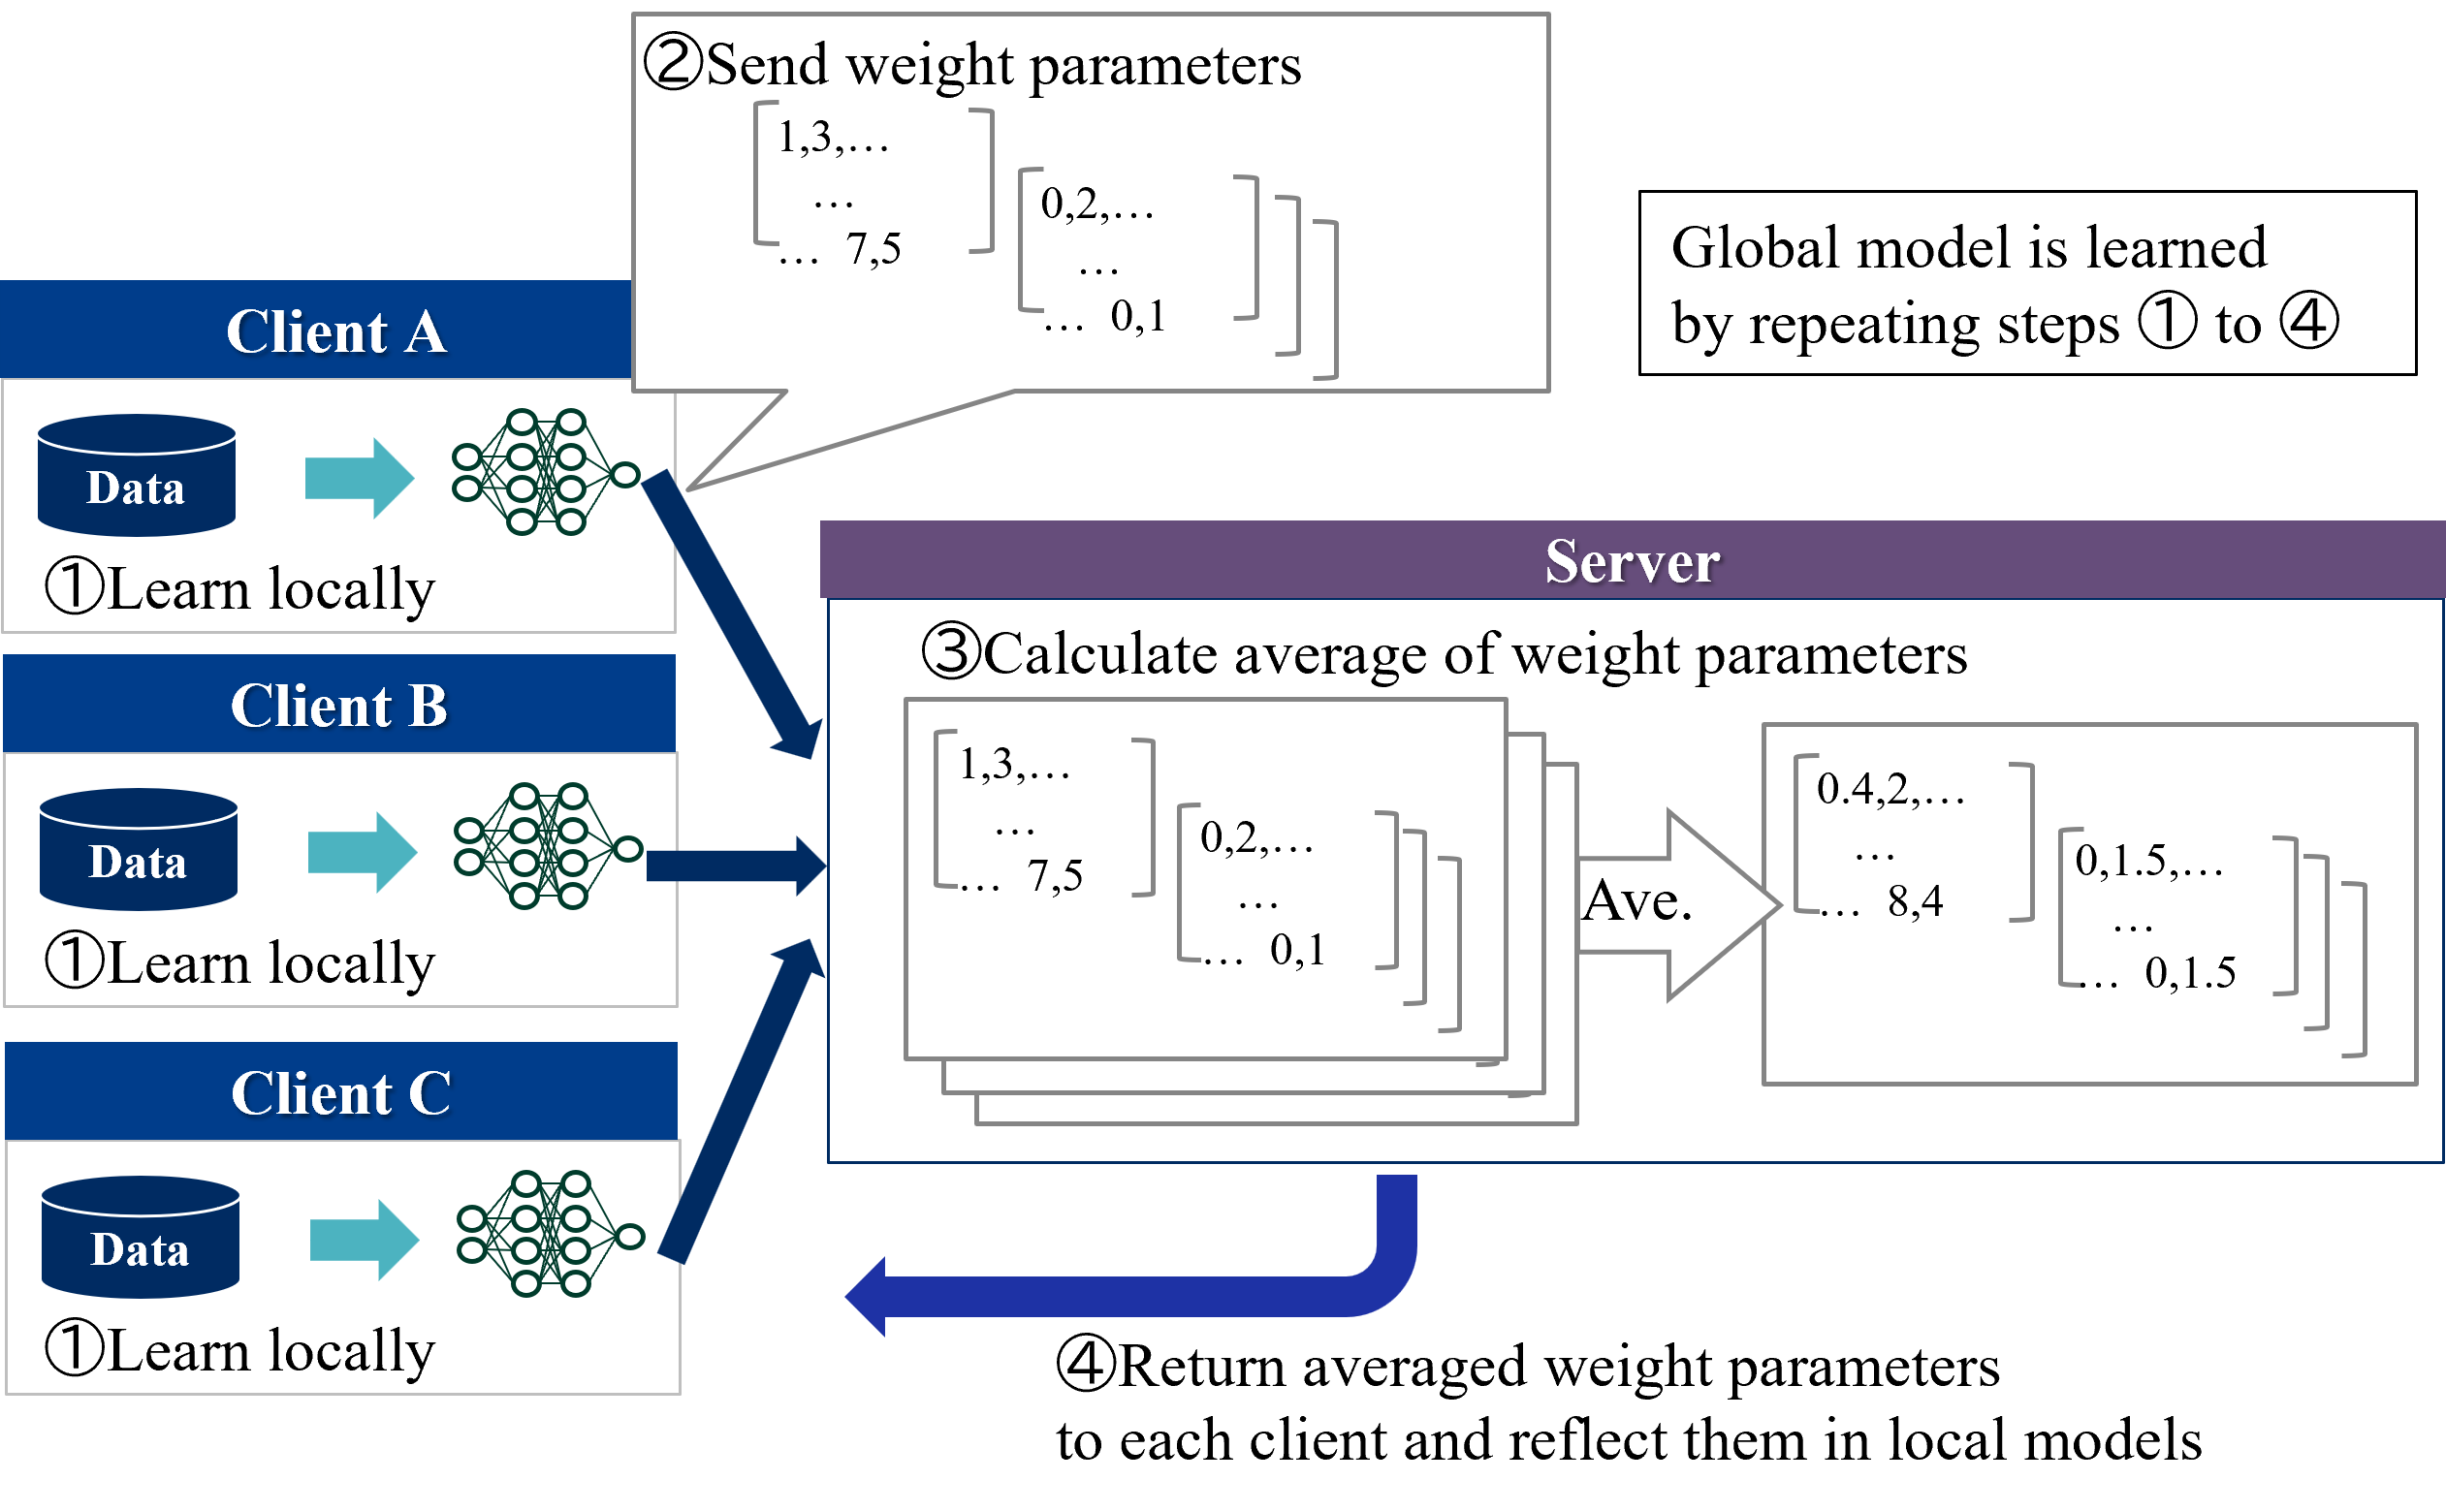
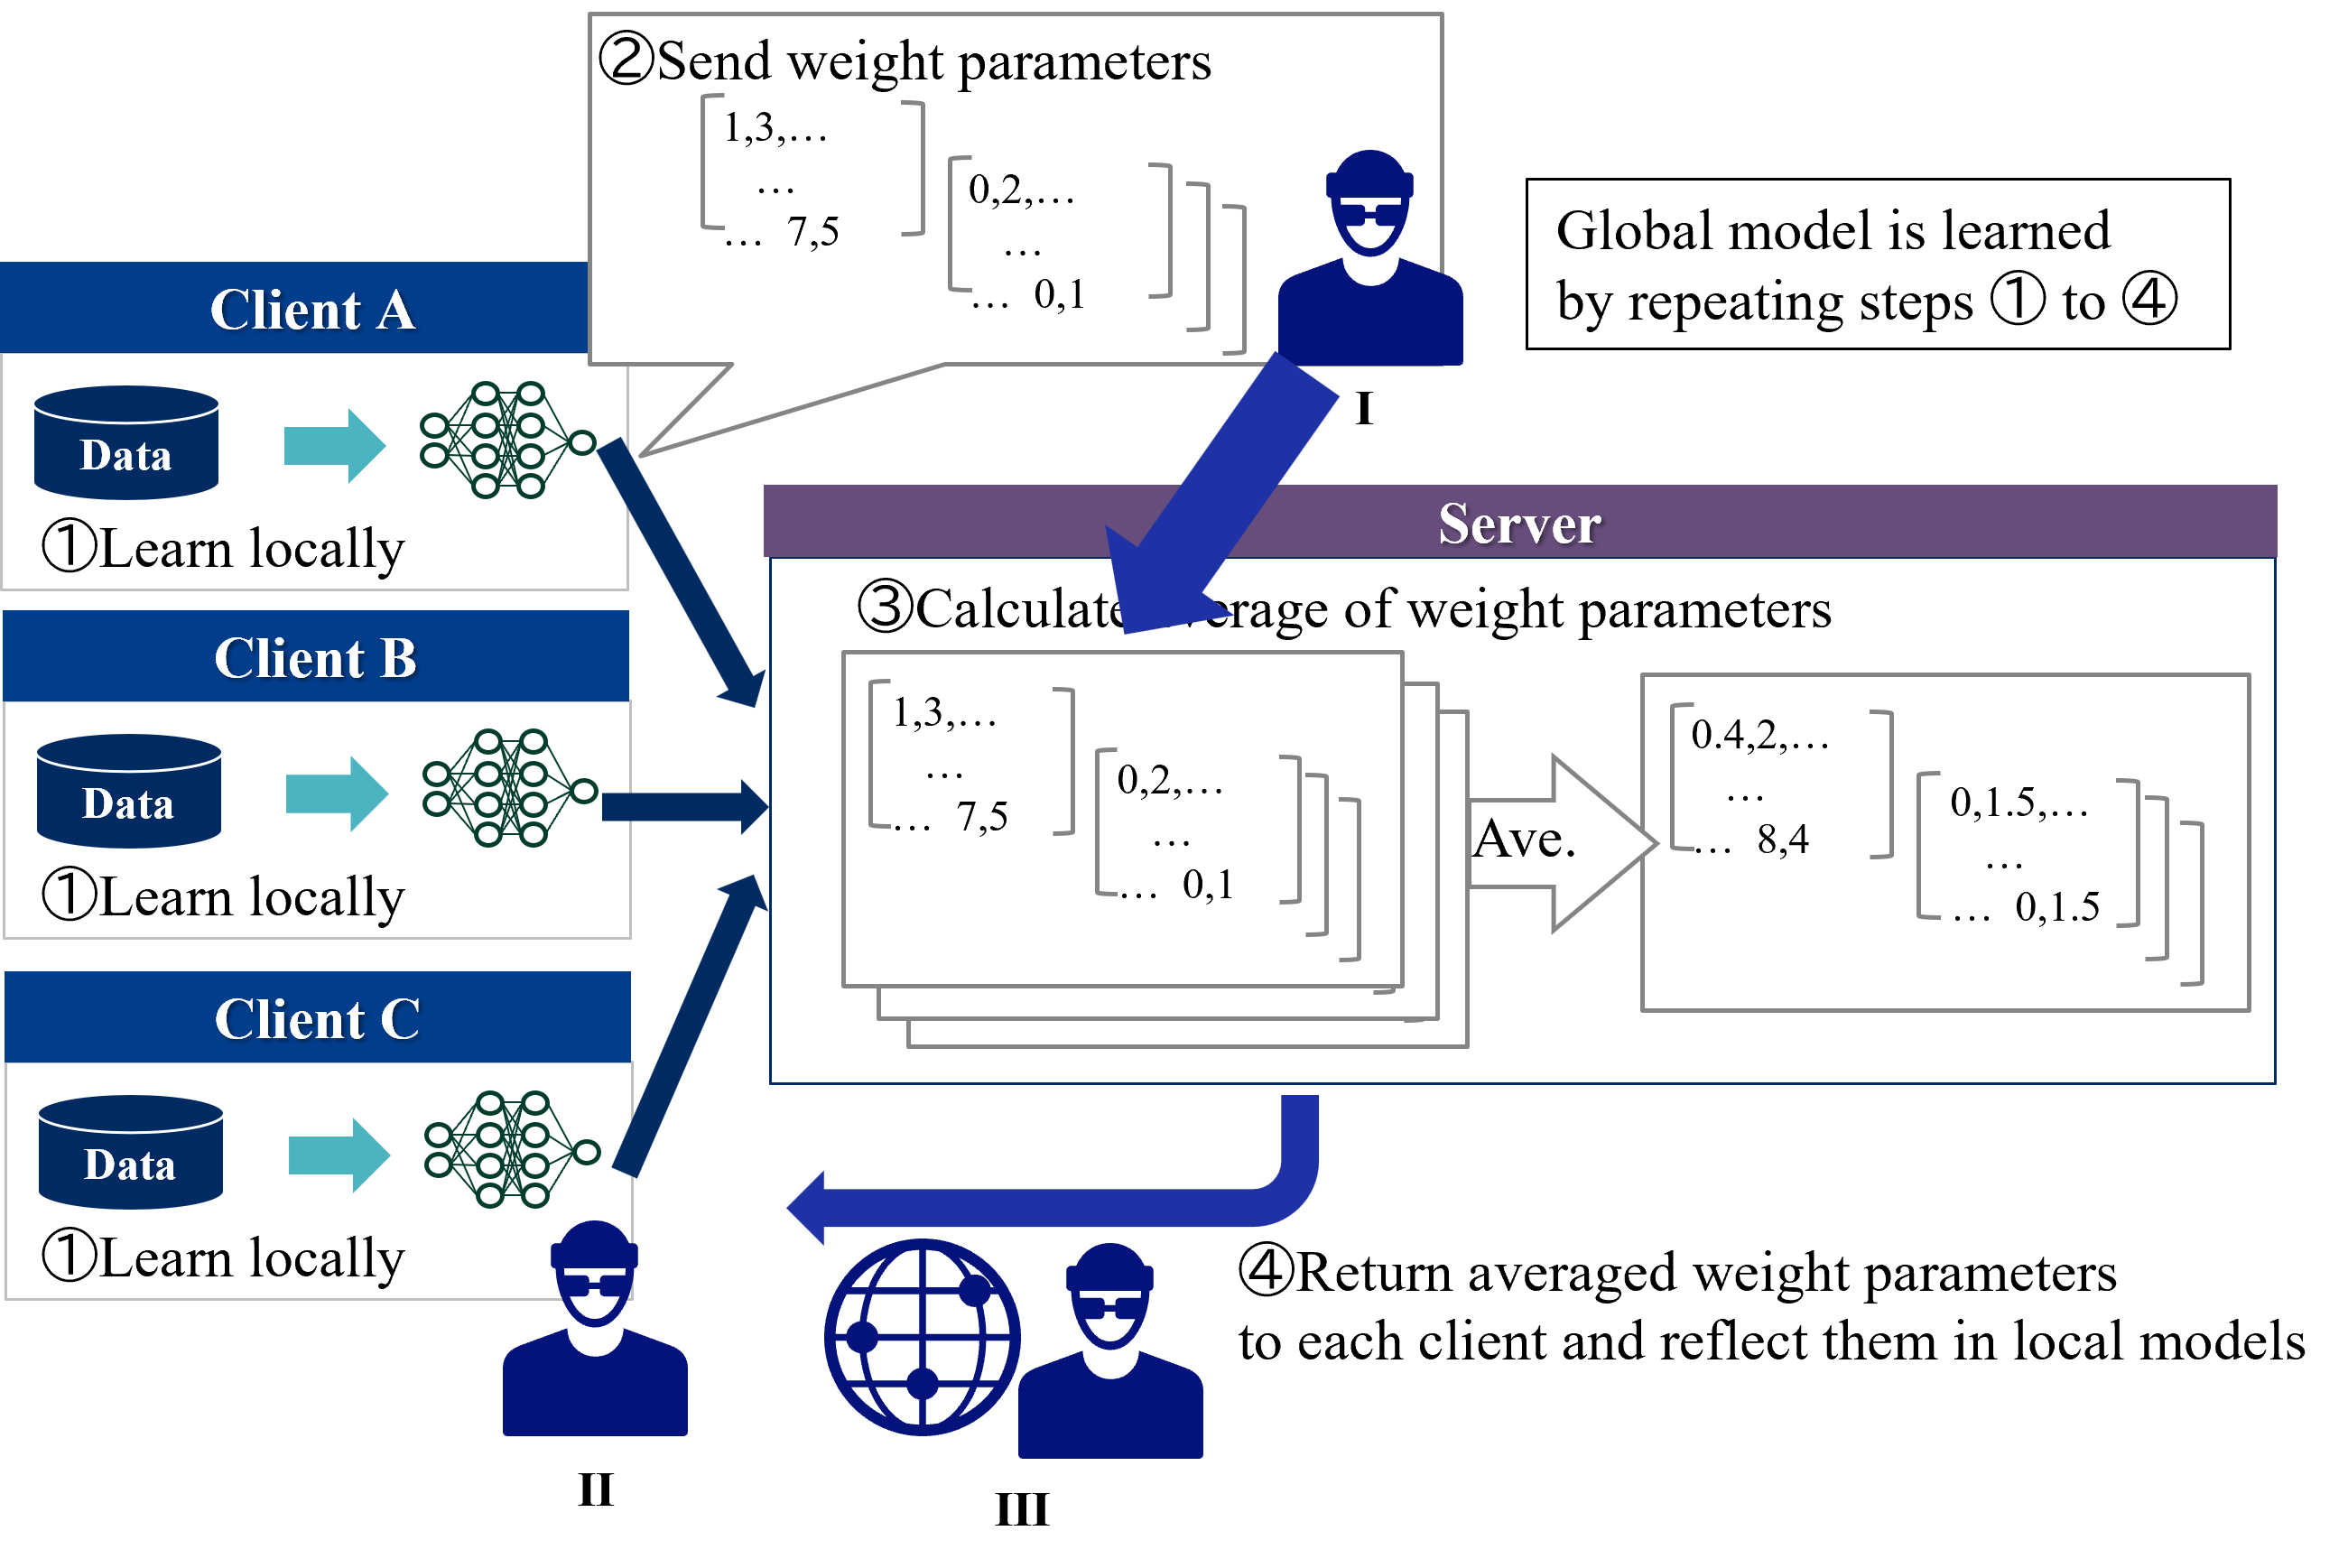
Figure 2 shows an overview of the HFL learning protocol. Two types of entities participate in learning of HFL:
1. Server - Coordinator. Server exchanges model parameters with the clients and aggregates model parameters received from the clients.
1. Clients - Data owners. Each client locally trains a model using their own private data and exchanges model parameters with the server.
Each clients first trains a local model for a few steps and sends the model parameters to the server. Next, the server updates a global model by aggregating (in standard methods such as FedAvg, simply averaging) the local models and sends it to all clients. This process is repeated until the convergence. During inference time, each client separately predicts the label using a global model and its own features.
The protocol described above is called centralized HFL because it requires a trusted third party, a central server. On the other hand, decentralized HFL, which eliminates the need for a central server, has emerged in recent years [4]. In decentralized HFL, clients directly communicates with each other, resulting in communication resource savings. There are various possible methods of communication between clients [4]. For example, the most common method for HFL of gradient boosting decision trees is for each client to add trees to the global model by sequence [5, 6, 7].
<details>
<summary>extracted/5379099/fig/LM_HFL.png Details</summary>
### Visual Description
## Diagram: Federated Learning Process Flowchart
### Overview
This image is a technical flowchart illustrating the four-step iterative process of **Federated Learning**, a decentralized machine learning paradigm. The diagram shows how multiple clients (Client A, Client B, Client C) collaboratively train a shared global model without directly sharing their local data. The process involves local training, parameter aggregation on a central server, and model synchronization.
### Components/Axes
The diagram is structured into two main sections:
1. **Left Column (Clients):** Three vertically stacked client blocks, each labeled "Client A", "Client B", and "Client C" in white text on a dark blue header bar. Each client block contains:
* A dark blue cylinder icon labeled "Data" in white text.
* A teal arrow pointing right.
* A green neural network diagram icon.
* The text "①Learn locally" below the data cylinder.
2. **Right Section (Server & Process Flow):**
* A large central block with a purple header labeled "Server" in white text.
* A text box in the top-right corner.
* Numbered step labels (②, ③, ④) with descriptive text.
* Arrows indicating data flow between clients and the server.
### Detailed Analysis
**Step-by-Step Process Flow:**
1. **Step ①: Learn locally**
* **Location:** Within each of the three client blocks on the left.
* **Action:** Each client uses its own local "Data" to train a local version of the neural network model. This is represented by the data cylinder icon pointing to the neural network icon.
2. **Step ②: Send weight parameters**
* **Location:** A callout box originating from the neural network icon of Client A, pointing towards the Server block.
* **Content:** The callout contains the text "②Send weight parameters" and two example matrices representing model weights.
* Matrix 1: `[1,3,... ... 7,5]`
* Matrix 2: `[0,2,... ... 0,1]`
* **Flow:** Dark blue arrows from the neural network icons of all three clients (A, B, C) point directly to the Server block, indicating that each client sends its locally updated weight parameters to the central server.
3. **Step ③: Calculate average of weight parameters**
* **Location:** Inside the main "Server" block.
* **Content:** The text "③Calculate average of weight parameters" is at the top. Below it is a visual representation of aggregation:
* **Input:** A stack of three matrices (representing the weights from Clients A, B, and C). The top matrix is shown with values `[1,3,... ... 7,5]` and `[0,2,... ... 0,1]`, matching the example from Step ②.
* **Process:** A large arrow labeled "Ave." (for Average) points from the input stack to the output.
* **Output:** A single averaged matrix with example values `[0.4,2,... ... 8,4]` and `[0,1.5,... ... 0,1.5]`.
4. **Step ④: Return averaged weight parameters**
* **Location:** A large, curved dark blue arrow originating from the bottom of the Server block and pointing back towards the left, encompassing all three clients.
* **Content:** The text "④Return averaged weight parameters to each client and reflect them in local models" is positioned below this arrow.
**Additional Text Element:**
* **Location:** A standalone text box in the top-right corner of the image.
* **Content:** "Global model is learned by repeating steps ① to ④". This explicitly states the iterative nature of the federated learning process.
### Key Observations
* **Decentralized Data:** The "Data" cylinders are contained within each client block, visually emphasizing that raw data never leaves the client devices.
* **Centralized Aggregation:** The "Server" block acts solely as an aggregation point for model updates (weight parameters), not a data repository.
* **Iterative Cycle:** The process is explicitly described as a repeating cycle (steps 1-4), which is fundamental to federated learning convergence.
* **Example Values:** The matrices use placeholder numerical values (e.g., `1,3,... 7,5`) to concretely illustrate the concept of weight parameters being sent and averaged. The averaged values (e.g., `0.4`, `1.5`) demonstrate the result of the aggregation operation.
### Interpretation
This diagram provides a clear, high-level schematic of the **Federated Averaging (FedAvg)** algorithm, which is the foundational protocol for federated learning. It visually communicates the core value proposition: enabling collaborative model training across distributed datasets while preserving data privacy.
* **Relationships:** The flowchart establishes a clear client-server relationship. Clients are autonomous training units, while the server is a stateless coordinator. The arrows define the direction of information flow: local updates flow upstream to the server, and the aggregated global model flows downstream to all clients.
* **Process Logic:** The sequence is logical and causal. Local learning (Step 1) must occur before updates can be sent (Step 2). The server cannot average (Step 3) until it receives updates. The updated global model must be distributed (Step 4) before the next local training round can begin with improved parameters.
* **Notable Implication:** The diagram abstracts away complexities like client selection, secure aggregation, communication costs, and handling of non-identical (non-IID) data across clients. It focuses purely on the core parameter averaging mechanism. The example matrices suggest a simple averaging operation, though real-world implementations may use weighted averages based on client dataset sizes.
* **Underlying Principle:** The entire process embodies the Peircean concept of **abduction**—forming the best explanation (the global model) from a set of observations (local data) gathered through a structured, iterative investigative process (the federated learning rounds). The "global model" is the abductive conclusion that best fits the distributed evidence.
</details>
Figure 2: Overview of the HFL learning protocol.
### II-B Vertical Federated Learning
VFL enables clients holding the different features of the same samples to collaboratively train a model which takes all of the various features each client has as input. There are VFL studies to deal with various models including linear/logistic regression [8, 9, 10, 11, 12], decision trees [13, 14, 15, 16, 17], neural networks [18, 19, 20, 21], and other non-linear models [22, 23].
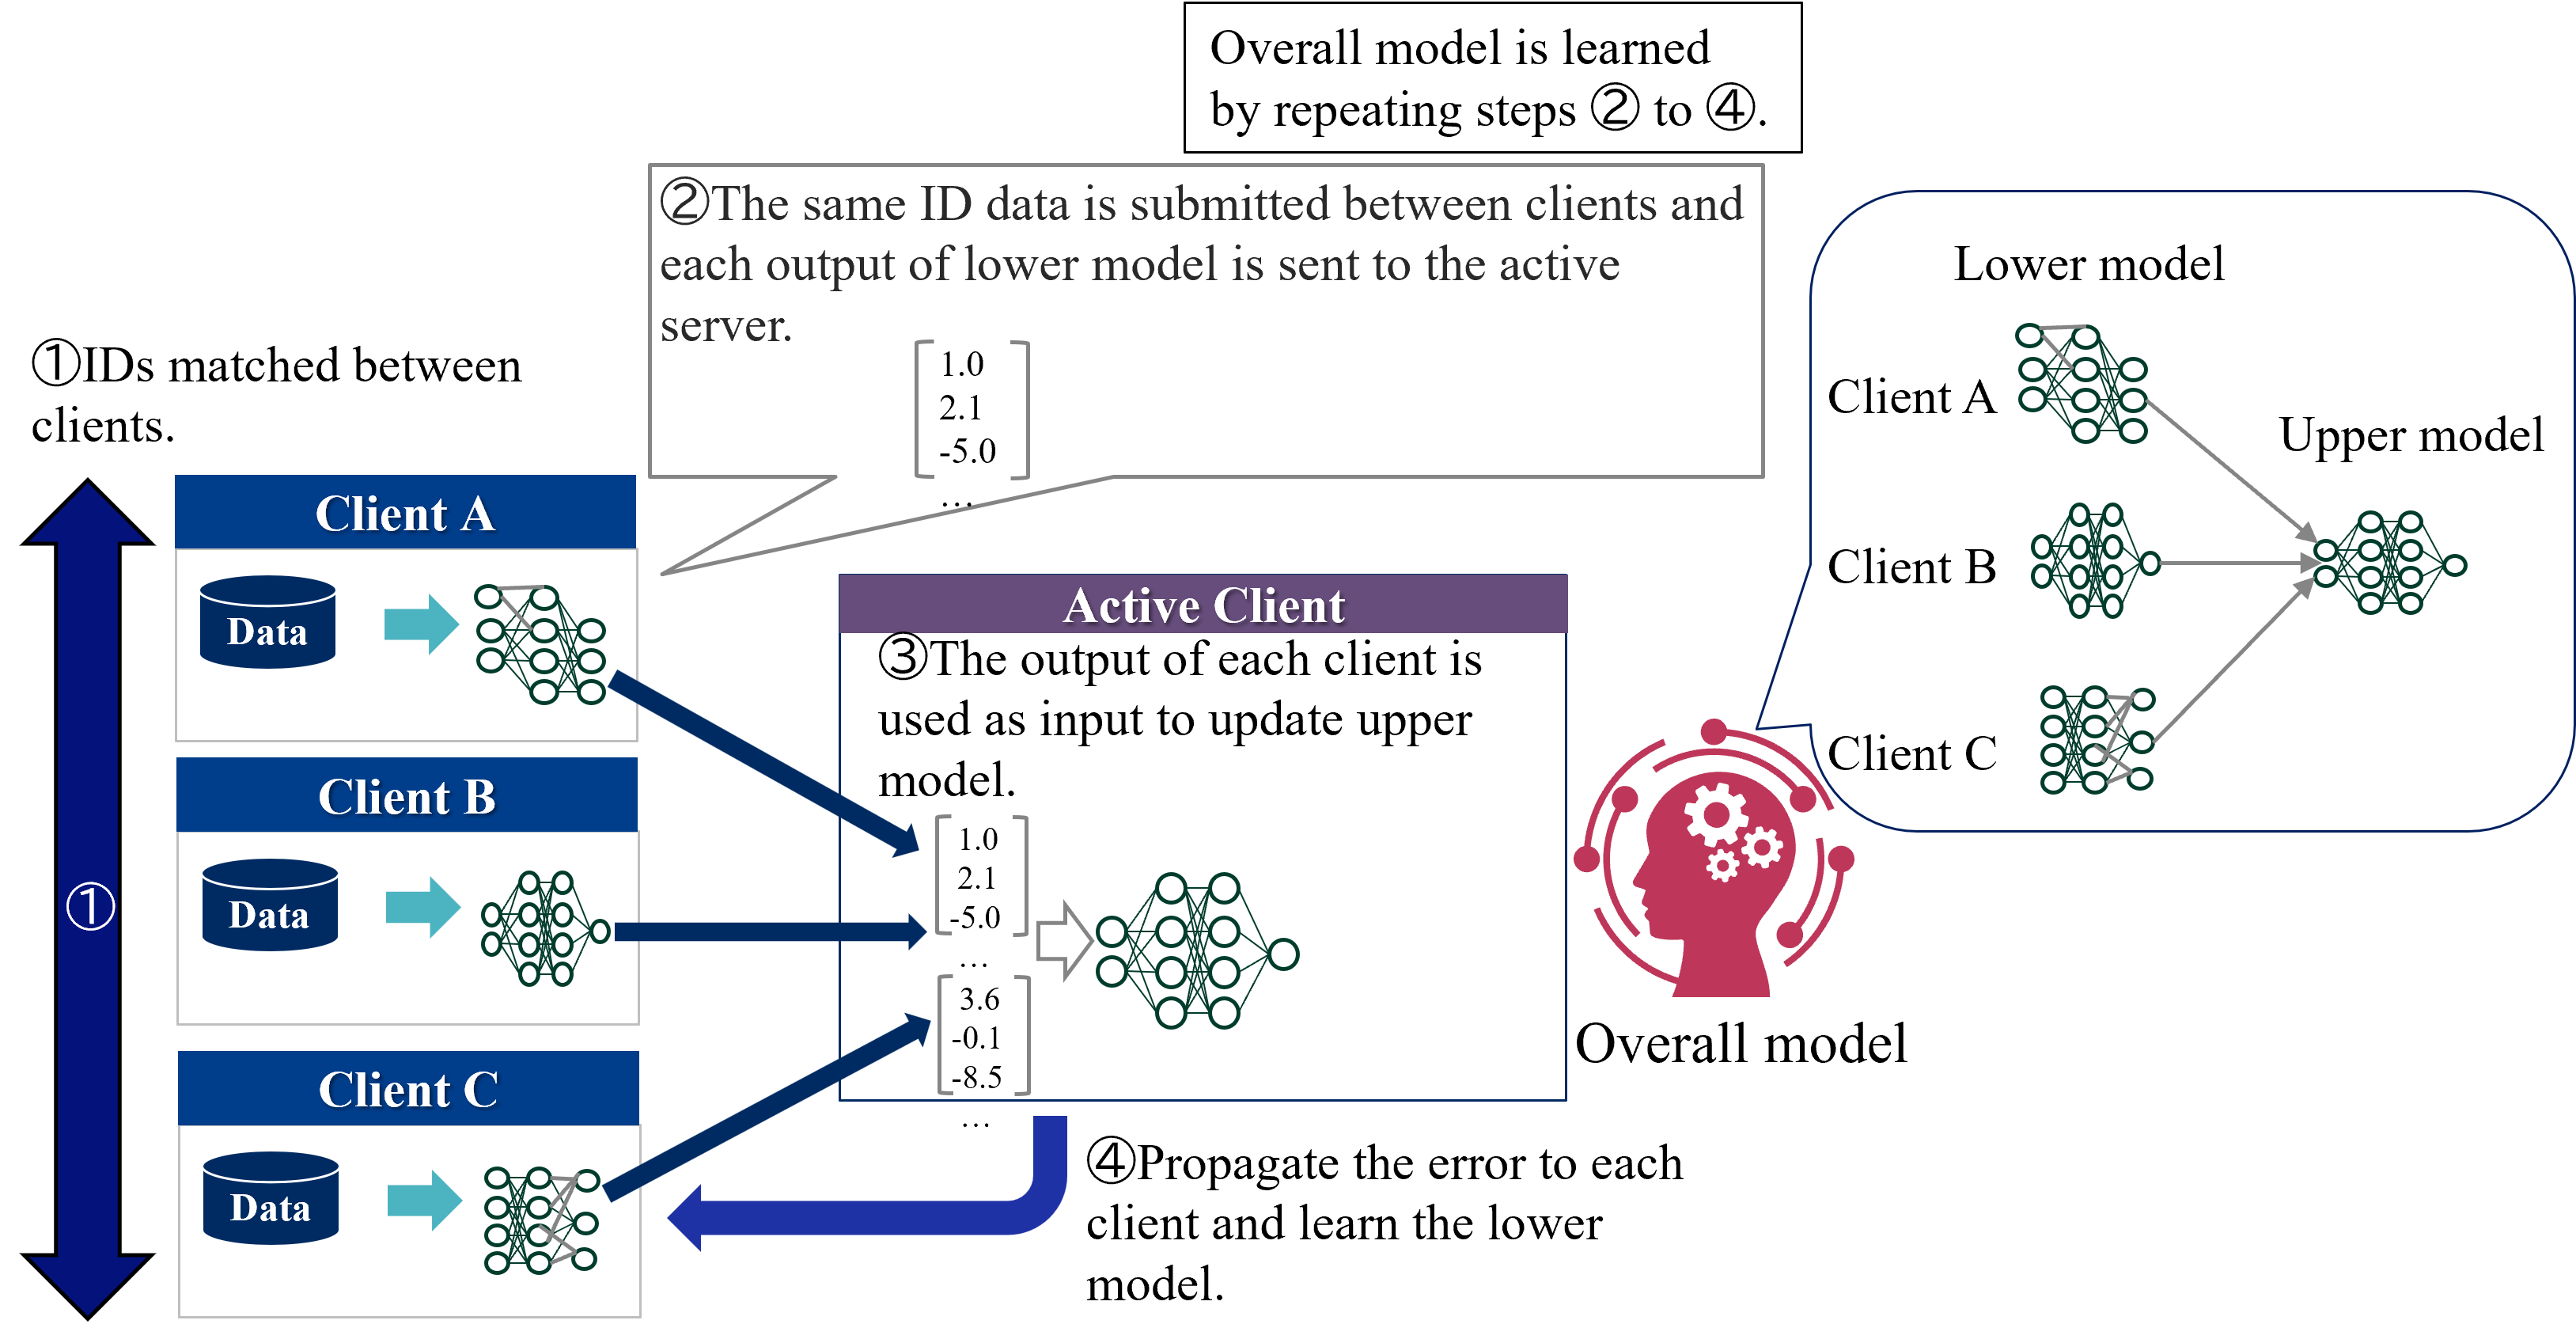
Figure 3 shows an overview of the standard VFL learning protocol. In VFL, only one client holds labels and it plays the role of a server. Therefore, two types of entities participate in learning of VFL:
1. Active client - Features and labels owner. Active client coordinates the learning procedure. It calculates the loss and exchanges intermediate results with the passive clients.
1. Passive clients - Features owners. Each passive client keeps both its features and model local but exchanges intermediate results with the active client.
VFL consists of two phases: IDs matching and learning phases. In IDs matching phases, all clients shares the common sample IDs. In learning phase, each client has a separate model with its own features as input, and the passive clients send the computed intermediate outputs to the active client. The active client calculates the loss based on the aggregated intermediate outputs and sends the gradients to all passive clients. Then, the passive clients updates its own model parameters. This process is repeated until the convergence. During inference time, all clients need to cooperate to predict the label of a sample.
<details>
<summary>extracted/5379099/fig/LM_VFL.png Details</summary>
### Visual Description
## Diagram: Federated Learning Process with Lower and Upper Models
### Overview
The image is a technical diagram illustrating a four-step federated learning or collaborative machine learning process. It depicts how multiple clients (A, B, C) with local data and models interact with an "Active Client" to train an "Overall model" without centralizing raw data. The process involves matching IDs, sharing model outputs, updating a central model, and propagating errors back to refine local models.
### Components/Axes
**Primary Components:**
1. **Clients (Left Column):** Three clients labeled "Client A", "Client B", and "Client C". Each is represented by a blue header box containing:
* A cylinder icon labeled "Data".
* A right-pointing arrow.
* A neural network icon representing a "Lower model".
2. **Active Client (Center):** A purple-header box labeled "Active Client". It contains:
* Text describing Step ③.
* Two example numerical vectors (e.g., `[1.0, 2.1, -5.0]`).
* A neural network icon representing the "Upper model".
3. **Overall Model (Right):** A red icon of a human head with gears, labeled "Overall model". A callout bubble connects it to a detailed view.
4. **Detailed Model View (Top Right):** A rounded rectangle showing the relationship between "Lower model" and "Upper model". It depicts three separate neural networks (for Clients A, B, C) feeding into a single, larger neural network.
5. **Process Flow Arrows:** Dark blue arrows indicate the direction of data and error flow between components.
6. **Numbered Steps:** Four circled numbers (①, ②, ③, ④) with accompanying descriptive text boxes.
**Textual Labels and Descriptions:**
* **Step ①:** "IDs matched between clients." (Positioned top-left, next to a vertical double-headed arrow spanning the three clients).
* **Step ②:** "The same ID data is submitted between clients and each output of lower model is sent to the active server." (Positioned top-center, with a speech bubble pointing to the output from Client A's model).
* **Step ③:** "The output of each client is used as input to update upper model." (Inside the "Active Client" box).
* **Step ④:** "Propagate the error to each client and learn the lower model." (Positioned bottom-center, with a curved arrow pointing back to the clients).
* **Top Summary Box:** "Overall model is learned by repeating steps ② to ④."
* **Model Labels:** "Lower model" and "Upper model" are explicitly labeled in the detailed view.
### Detailed Analysis
**Process Flow & Spatial Grounding:**
1. **Step ① (Left Side):** The process begins with the three clients (A, B, C) vertically aligned on the left. A vertical double-headed arrow labeled ① indicates that "IDs [are] matched between clients," establishing a common reference for data samples across parties.
2. **Step ② (Data Flow to Center):** From each client's "Lower model" neural network, a dark blue arrow points rightward to the "Active Client" box. This represents the submission of model outputs. Example output vectors are shown:
* From Client A: `[1.0, 2.1, -5.0, ...]`
* From Client C: `[3.6, -0.1, -8.5, ...]`
The text for Step ② clarifies this is done for "the same ID data."
3. **Step ③ (Central Update):** Inside the "Active Client" box, the collected outputs (represented by the vectors) are fed into the "Upper model" neural network. This step updates the central model.
4. **Step ④ (Error Propagation):** A large, curved dark blue arrow originates from the "Active Client" / "Upper model" and points back towards the clients on the left. This represents the backpropagation of error signals to update each client's local "Lower model."
5. **Overall Model & Iteration (Right & Top):** The "Overall model" icon on the right is connected to the detailed view showing the architecture: multiple "Lower models" (one per client) feeding into a single "Upper model." The top summary box states this entire cycle (Steps ② to ④) is repeated to learn the final overall model.
**Key Observations**
* **Architecture:** The system uses a two-tier model structure. Each client maintains a private "Lower model" trained on its local data. A central "Upper model" (the "Overall model") aggregates information from these lower models.
* **Data Privacy:** Raw data ("Data" cylinders) never leaves the clients. Only model outputs (numerical vectors) and error signals are communicated, which is a hallmark of federated learning aimed at preserving data privacy.
* **Central Coordination:** The "Active Client" acts as a server or aggregator in this round of the process, coordinating the update of the global upper model.
* **Iterative Learning:** The process is explicitly iterative, as noted in the top summary box.
### Interpretation
This diagram explains a **collaborative, privacy-preserving machine learning framework**. The core idea is to train a powerful global model ("Upper model") by leveraging data from multiple distributed sources (Clients A, B, C) without requiring them to share their sensitive raw data.
* **How it works:** Each client first trains a local "Lower model" on its own data. For a given set of data points (matched by ID), these local models generate outputs (embeddings or predictions). These outputs, not the raw data, are sent to a central coordinator (the "Active Client"). The coordinator uses these outputs as input to train the "Upper model." The error from the upper model is then sent back to each client, allowing them to refine their local lower models. This cycle repeats.
* **Why it matters:** This approach is critical in fields like healthcare, finance, or any domain with strict data sovereignty and privacy regulations (e.g., GDPR). It allows organizations to collaboratively build a more accurate and generalizable model than any could build alone, while keeping their data secure on their own servers.
* **Notable Design:** The separation into "Lower" and "Upper" models suggests a form of **representation learning** or **ensemble learning**. The lower models act as feature extractors tailored to each client's data distribution, while the upper model learns to combine these specialized representations for a global task. The "ID matching" step is crucial to ensure the upper model is learning from corresponding data points across clients.
</details>
Figure 3: Overview of the standard VFL learning protocol.
### II-C Federated Transfer Learning
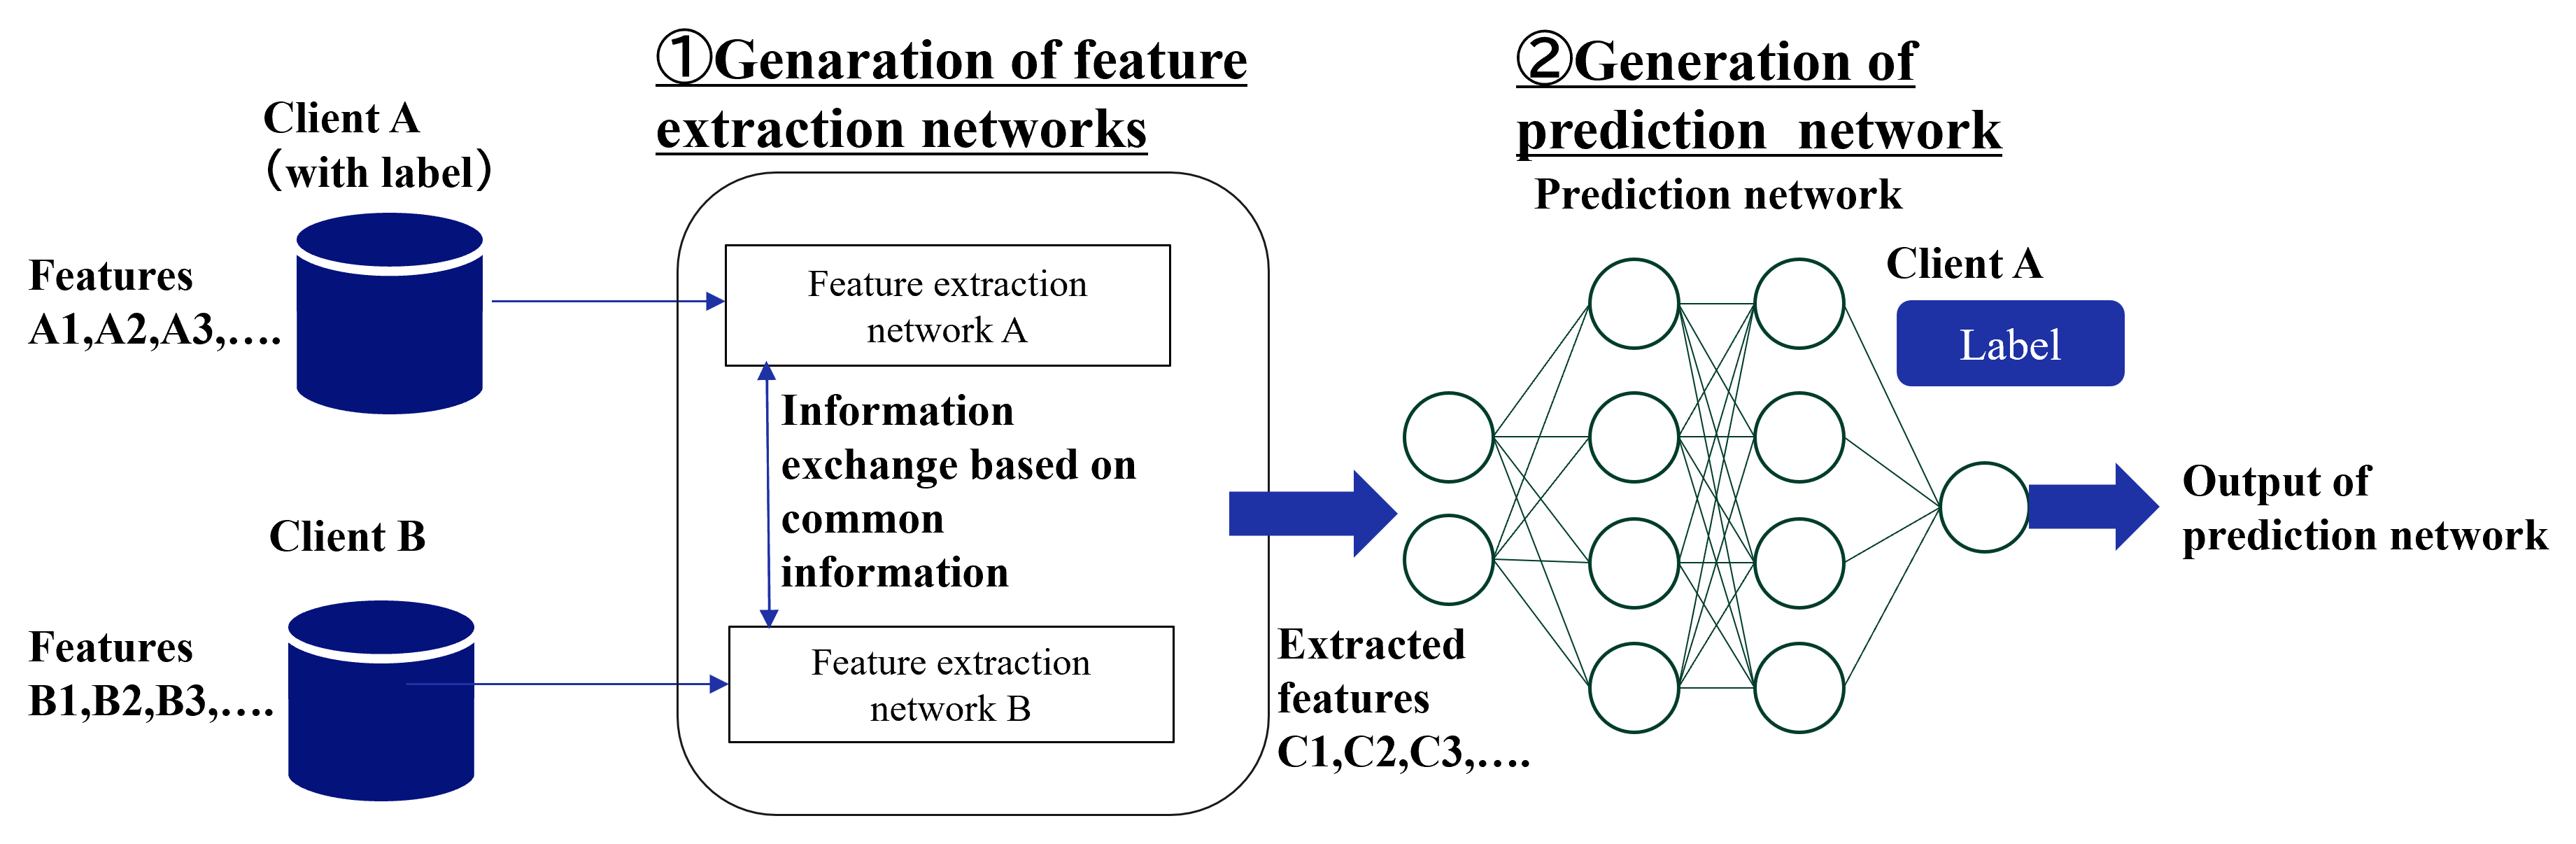
FTL assumes two clients that shares only a small portion of samples or features. The goal of FTL is to create a model that can predict labels on the client that does not possess labels (target client), by transferring the knowledge of the other client that does possess labels (source client) to the target client.
Figure 4 shows an overall of the FTL learning protocol. As noted above, two types of entities participate in FTL:
1. Source client - Features and labels owner. Source client exchanges intermediate results such as outputs and gradients with the target client and calculates the loss.
1. Target client - Features owners. Target client exchanges intermediate results with the source client.
In FTL, two clients exchange intermediate outputs to learn a common representation. The source client uses the labeled data to compute the loss and sends the gradient to the target client, which updates the target client’s representation. This process is repeated until the convergence. During inference time, the target client predicts the label of a sample using its own model and features.
The detail of the learning protocol varies depending on the specific method. Although only a limited number of FTL methods have been proposed, we introduce three major types of methods. FTL requires some supplementary information to bridge two clients, such as common IDs [24, 25, 26, 27], common features [28, 29], and labels of target client [30, 31].
#### II-C 1 Common IDs
Most FTL methods assumes the existence of the common ID’s samples between two clients. This type of FTL requires ID matching before the learning phase as with VFL. Liu et al. [24] proposed the first FTL protocol, which learns feature transformation functions so that the different features of the common samples are mapped into the same features. The following work by Sharma et al. [25] improved communication overhead of the first FTL using multi-party computation and enhanced the security by incorporating malicious clients. Gao et al. [27] proposed a dual learning framework in which two clients impute each other’s missing features by exchanging the outputs of the imputation models for the common samples.
#### II-C 2 Common features
In real-world applications, it is difficult to share samples with the same IDs. Therefore, Gao et al. [28] proposed a method to realize FTL by assuming common features instead of common samples. In that method, two clients mutually reconstruct the missing features by using exchanged feature mapping models. Then,using all features, the clients conduct HFL to obtain a label prediction model. In the original paper, the authors assumes that all clients posses labels, but this method is applicable to the target client that does not posses labels because the source client can learn the label prediction model only by itself. Mori et al. [29] proposed a method for neural networks in which each client incorporates its own unique features in addition to common features into HFL training. However, their method is based on HFL and cannot be applied to the target clients that does not possess labels.
#### II-C 3 Labels of target client
This type of methods assumes neither common IDs nor features, but instead assumes that all clients possess labels, allowing a common representation to be learned across clients. Since it is based on HFL, the participating entities are the same as in HFL. Gao et al. [30] learns a common representation by exchanging the intermediate outputs with the server and reducing maximum mean discrepancy loss. Rakotomamonjy et al. [31] proposed a method to learn a common representation by using Wasserstein distance for intermediate outputs, which enables that the clients only need to exchange statistical information such as mean and variance with the server.
<details>
<summary>extracted/5379099/fig/LM_FTL.png Details</summary>
### Visual Description
## Diagram: Federated Learning Framework for Collaborative Feature Extraction and Prediction
### Overview
The image is a technical flowchart illustrating a two-stage machine learning process involving two clients (Client A and Client B). The process involves collaborative feature extraction followed by the generation of a centralized prediction network. The diagram uses a left-to-right flow, with data sources on the left, processing in the middle, and the final model output on the right.
### Components/Axes
The diagram is segmented into two primary, numbered stages:
**Stage 1: ①Genaration of feature extraction networks** (Note: "Genaration" appears to be a typo for "Generation")
* **Location:** Left and center of the image.
* **Components:**
* **Client A (with label):** Represented by a blue cylinder icon. Associated text: "Features A1,A2,A3,.....".
* **Client B:** Represented by a blue cylinder icon. Associated text: "Features B1,B2,B3,.....".
* **Feature extraction network A:** A rectangular box receiving input from Client A.
* **Feature extraction network B:** A rectangular box receiving input from Client B.
* **Information exchange:** A vertical, double-headed blue arrow connecting the two feature extraction network boxes. The associated text reads: "Information exchange based on common information".
* **Output of Stage 1:** A large blue arrow points from the feature extraction block to Stage 2, labeled "Extracted features C1,C2,C3,.....".
**Stage 2: ②Generation of prediction network**
* **Location:** Right side of the image.
* **Components:**
* **Prediction network:** A schematic of a neural network with:
* An input layer (2 nodes).
* Two hidden layers (4 nodes each).
* An output layer (1 node).
* Nodes are white circles with green outlines, connected by green lines.
* **Client A Label:** A blue rounded rectangle labeled "Label" is positioned above the neural network, with a line connecting it to the network's output node.
* **Output:** A large blue arrow points from the neural network's output node to the final text: "Output of prediction network".
### Detailed Analysis
The process flow is as follows:
1. **Data Input:** Two separate clients, A and B, possess distinct feature sets (A-series and B-series). Client A's data includes labels, while Client B's does not.
2. **Collaborative Feature Learning:** Each client's data is fed into its respective feature extraction network (A or B). These two networks engage in an "Information exchange based on common information," suggesting a federated or collaborative learning mechanism where models share parameters or gradients without sharing raw data.
3. **Feature Output:** The result of this collaborative stage is a set of "Extracted features" denoted as C1, C2, C3, etc. These are presumably a unified or common representation learned from both clients' data.
4. **Prediction Model Training:** The extracted features (C-series) are used as input to train a separate "Prediction network." The training of this network is supervised using the "Label" provided by Client A.
5. **Final Output:** The trained prediction network produces an "Output of prediction network," which would be the model's predictions or classifications.
### Key Observations
* **Asymmetry in Data:** Client A has labels, Client B does not. This suggests a semi-supervised or transfer learning scenario where labeled data from one source helps improve a model trained on combined, partially unlabeled data.
* **Two-Stage Architecture:** The framework explicitly separates the learning of feature representations (Stage 1) from the learning of the final prediction task (Stage 2).
* **Centralized Prediction:** While feature extraction is distributed and collaborative between two clients, the final prediction model is centralized and trained solely on the combined features using Client A's labels.
* **Visual Coding:** Blue is used for data sources (cylinders), labels, and major process arrows. Green is used for the neural network structure (nodes and connections).
### Interpretation
This diagram depicts a **collaborative or federated learning framework** designed for scenarios where data is siloed across different clients (A and B), and at least one client (A) possesses labeled data. The core innovation appears to be in Stage 1, where the feature extraction networks for each client are not trained in isolation. Instead, they exchange information based on "common information," allowing them to learn a shared, robust feature representation (C1, C2, C3...) that captures patterns from both datasets. This addresses the challenge of data privacy and heterogeneity.
The learned features are then used to train a conventional prediction network. The framework implies that the quality of the final prediction model is enhanced by this collaborative pre-training of the feature extractors, even though the prediction model itself is only exposed to Client A's labels. This could lead to a model that generalizes better, as the features are informed by a broader data distribution from both clients. The separation of stages also offers modularity; the prediction network could potentially be swapped or retrained for different tasks using the same pre-extracted features.
</details>
Figure 4: Overall of the FTL learning protocol.
## III Threats to Privacy in Each Federated Learning
In this section, we describe threats to privacy in each federated learning. Table I shows threads to privacy addressed in each federated learning. An inference attack uses data analysis to gather unauthorized information about a subject or database. If an attacker can confidently estimate the true value of a subject’s confidential information, it can be said to have been leaked. The most frequent variants of this approach are membership inference and feature [32]. In addition, we address privacy threats of label inference and ID leakage.
TABLE I: Threads to privacy addressed in each federated learning
| HFL VFL FTL (common features) | Low or above Already known Low | Already known Low or above Low or above | None Low or above Low or above | None High None |
| --- | --- | --- | --- | --- |
| FTL (common IDs) | Low | Low or above | Low or above | High |
### III-A Horizontal Federated Learning
In HFL, client data is a major threat to privacy. Figure 5 shows threats to privacy in HFL. Possible attackers are as follows:
1. Server: Inference attack against the model to infer client data.
1. Clients: Inference attack against the global model received from the server to infer other clients’ data.
1. Third party: Eavesdrop on models that pass through the communication channel and infer client data through inference attacks.
<details>
<summary>extracted/5379099/fig/TP_HFL.png Details</summary>
### Visual Description
\n
## Diagram: Federated Learning Process
### Overview
The image is a technical diagram illustrating the four-step cycle of a federated learning system. It shows how multiple clients (Client A, Client B, Client C) collaboratively train a shared global model without centralizing their local data. The process involves local training, parameter aggregation on a server, and distribution of the updated global model.
### Components/Axes
The diagram is organized into three main spatial regions:
1. **Left Column (Clients):** Three vertically stacked client blocks (Client A, Client B, Client C). Each block contains:
* A blue cylinder labeled **"Data"**.
* A teal arrow pointing right.
* A green neural network icon.
* The text **"①Learn locally"**.
2. **Center (Server):** A large central block labeled **"Server"** in a purple header. It contains:
* The text **"③Calculate average of weight parameters"**.
* A stack of three matrices on the left, representing received parameters.
* A large arrow labeled **"Ave."** pointing right.
* A single matrix on the right, representing the averaged result.
3. **Right Side & Flow Arrows:**
* A text box in the top-right states: **"Global model is learned by repeating steps ① to ④"**.
* A large blue arrow labeled **"②Send weight parameters"** points from the clients up to the server. A callout bubble from this arrow shows example matrix values: `[1,3,... ... 7,5]` and `[0,2,... ... 0,1]`.
* A large blue arrow labeled **"④Return averaged weight parameters to each client and reflect them in local models"** points from the server back to the clients.
* Three stylized human icons with Roman numerals:
* **I** (top-right, near step 2 arrow).
* **II** (bottom-left, below Client C).
* **III** (bottom-center, next to a globe icon).
### Detailed Analysis
The process flow is explicitly numbered:
* **Step ① (Learn locally):** Each client (A, B, C) uses its local **"Data"** to train its own neural network model. The data does not leave the client.
* **Step ② (Send weight parameters):** Each client sends its locally updated model parameters (weights) to the central **Server**. The diagram provides example parameter values in matrix notation: `[1,3,... ... 7,5]` and `[0,2,... ... 0,1]`.
* **Step ③ (Calculate average of weight parameters):** The **Server** collects the parameter sets from all clients. It then computes an average (indicated by **"Ave."**) of these parameters. The output is a single, averaged parameter set shown as `[0.4,2,... ... 8,4]` and `[0,1.5,... ... 0,1.5]`.
* **Step ④ (Return averaged weight parameters...):** The server sends the newly computed global model parameters back to all clients. Each client then updates its local model with these averaged parameters.
* **Iteration:** The text box confirms this is a cyclic process: **"Global model is learned by repeating steps ① to ④"**.
### Key Observations
1. **Data Privacy:** The core principle is visually emphasized: raw **"Data"** remains within each client's cylinder. Only model parameters (weights) are transmitted.
2. **Centralized Aggregation:** The **Server** acts solely as an aggregator. It does not possess or train on raw data; it only computes the average of received parameters.
3. **Homogeneous Model Architecture:** The identical neural network icons for all clients and the server's averaging operation imply all clients are training the same model architecture.
4. **Parameter Example Discrepancy:** The example parameters sent by clients (`[1,3,...]`) differ from the averaged result (`[0.4,2,...]`), illustrating the aggregation effect. The values are illustrative, not mathematically precise averages of the shown inputs.
5. **Human/System Icons:** The icons labeled **I**, **II**, and **III** likely represent different roles or system components (e.g., **I**: Client Device, **II**: Local User, **III**: Global Coordinator/Network), though their specific functions are not detailed in the text.
### Interpretation
This diagram succinctly explains the federated learning paradigm, a machine learning approach designed for privacy and distributed data.
* **What it demonstrates:** It shows a decentralized training workflow where intelligence is improved collaboratively. The "global model" evolves through iterative consensus, learning patterns from diverse, isolated datasets without compromising data locality.
* **Relationships:** The clients are peers contributing to a common goal. The server is a facilitator, not a data holder. The arrows define a clear, closed-loop communication protocol.
* **Notable Implications:**
* **Privacy-Preserving:** The primary benefit is keeping sensitive data on local devices.
* **Communication Efficiency:** Only model updates (which can be compressed) are sent, not raw data.
* **Iterative Convergence:** The note about repeating steps highlights that the global model improves gradually over many cycles.
* **Assumption of Homogeneity:** The diagram assumes all clients can train the same model structure, which may not hold in more complex, real-world scenarios with heterogeneous devices.
The diagram serves as a high-level conceptual map for understanding how federated learning systems operate, emphasizing the sequence of operations and the flow of information (parameters) rather than specific algorithms or mathematical details.
</details>
Figure 5: Threats to privacy in HFL.
### III-B Vertical Federated Learning
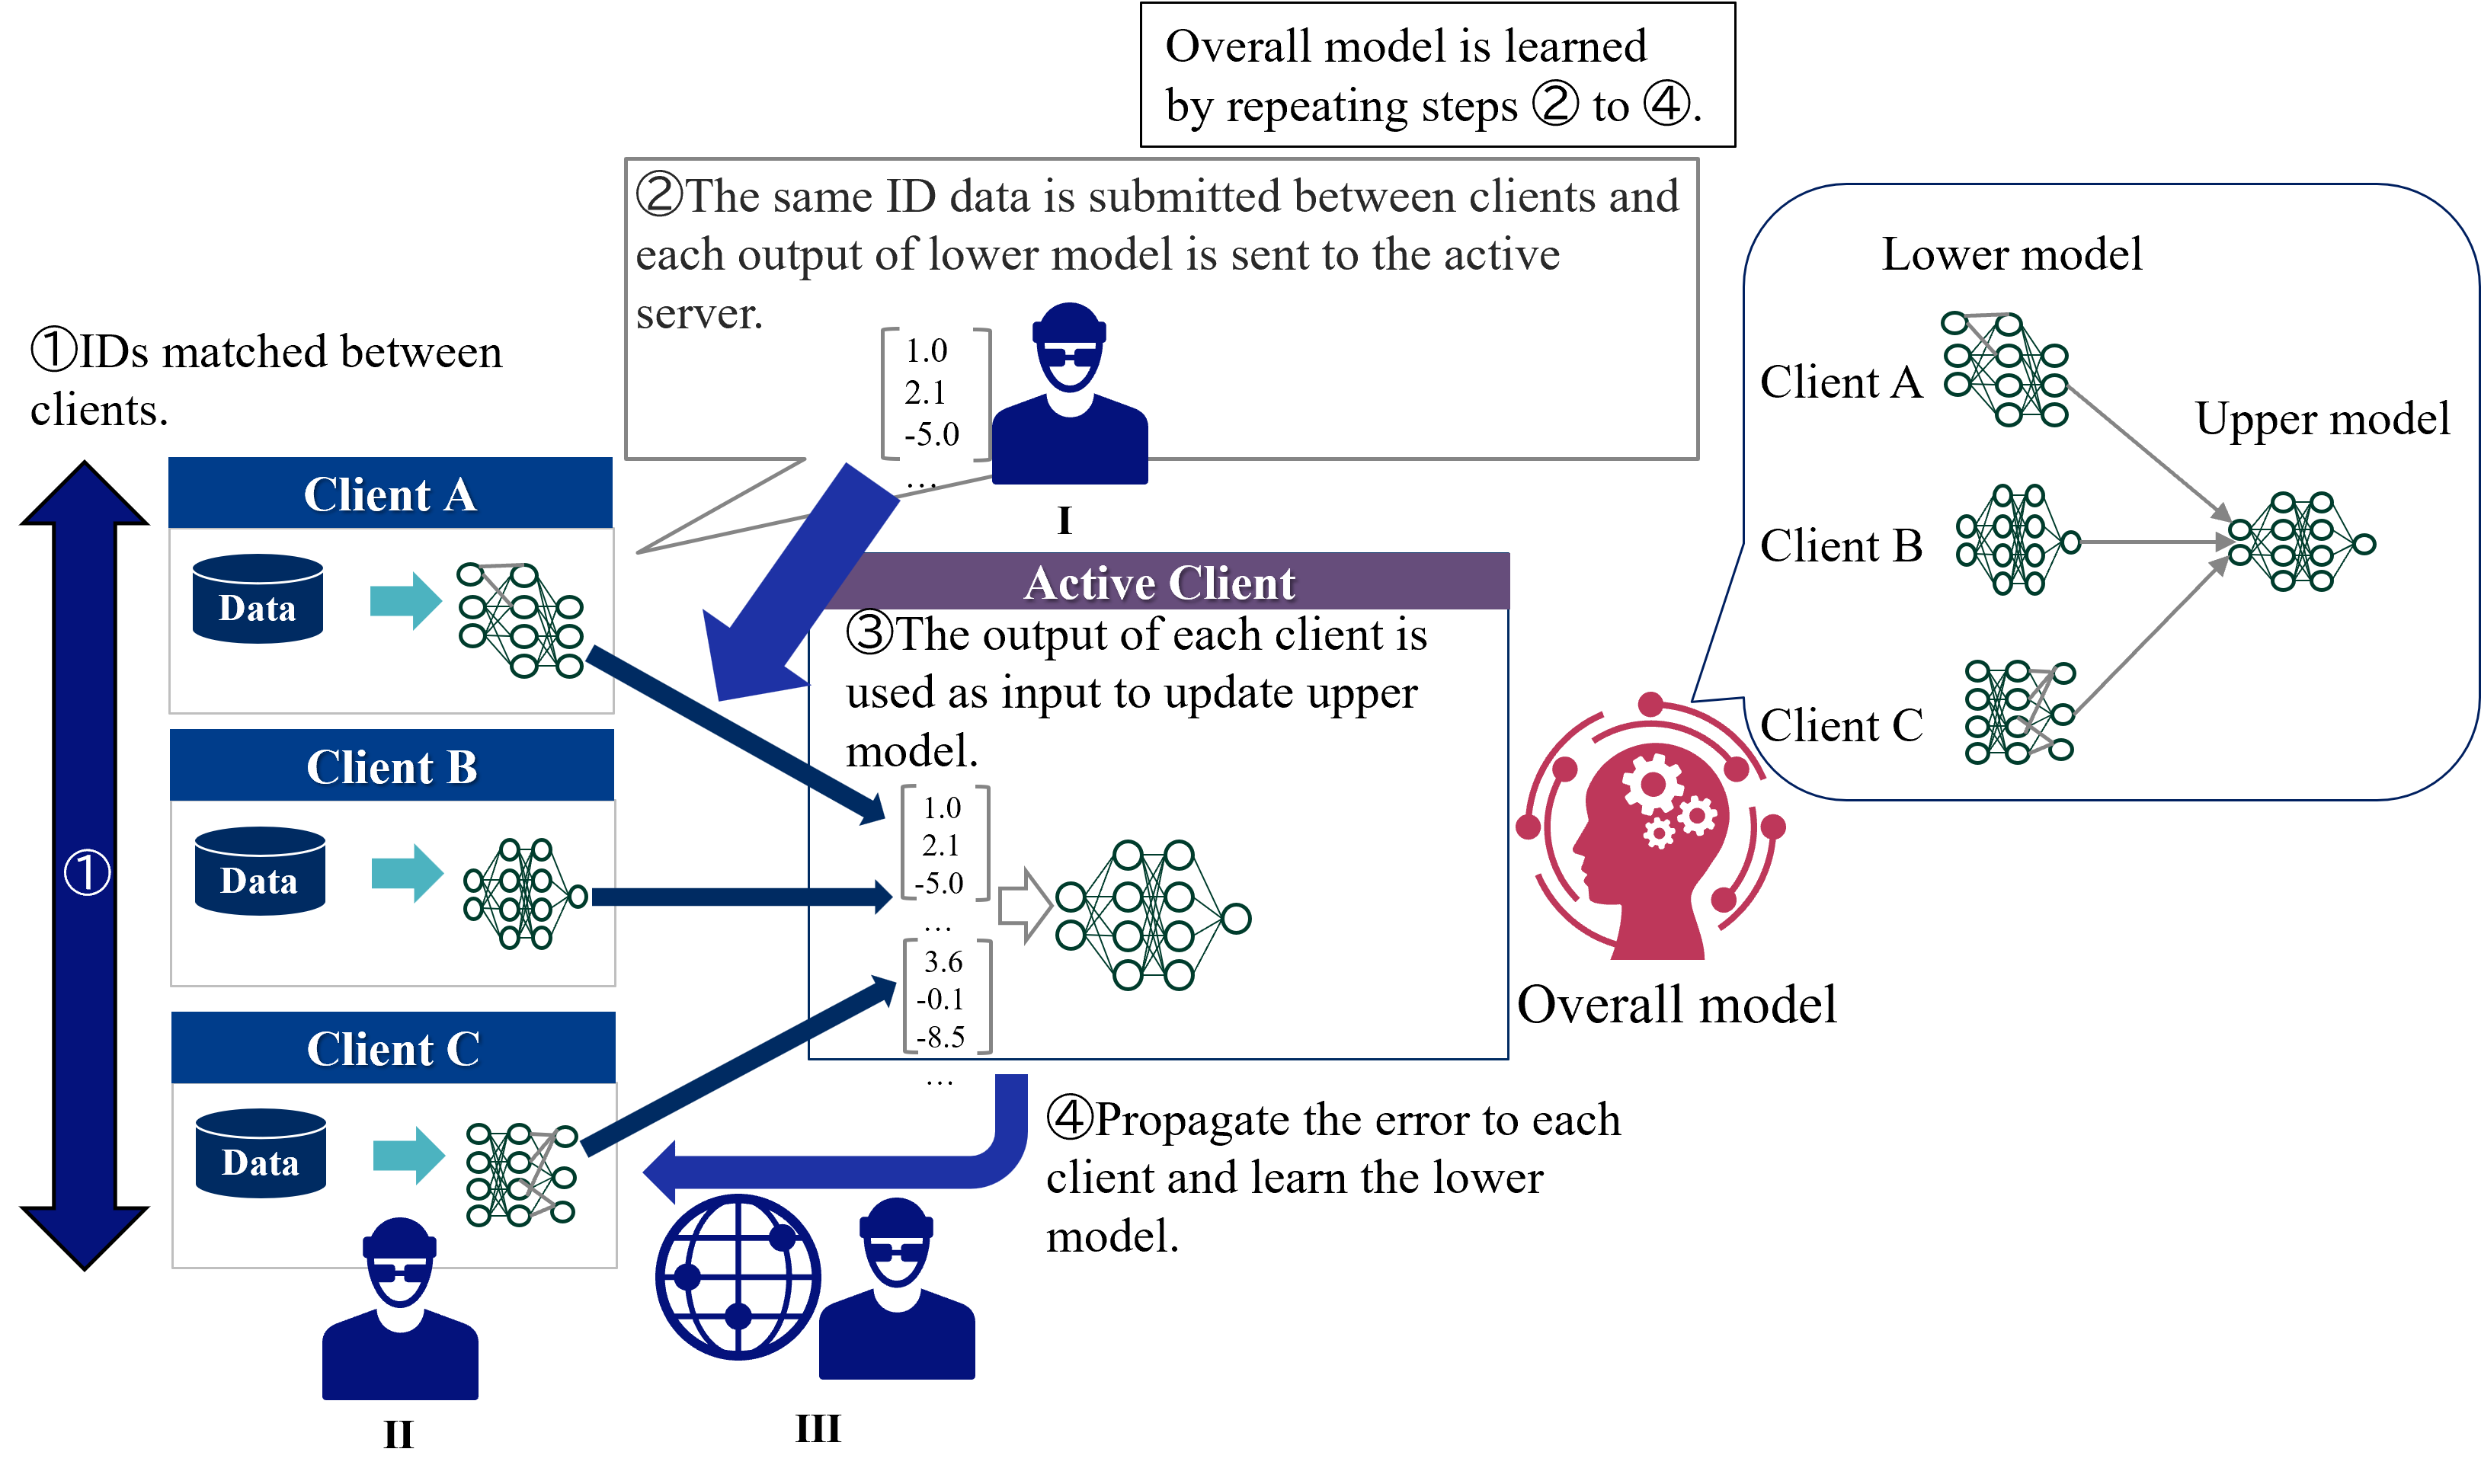
In VFL, a major threat to privacy is the leakage of identities due to identity matching between clients [33]. In addition to the leakage of identities, partial output from clients is also a threat. In case of ID matching, in order to create a single model for the overall system, it is necessary to match IDs that are common to each client’s data. This will reveal the presence of the same user to other clients. Figure 6 shows threats to privacy in VFL in case of partial output from clients, and possible attackers are as follows:
1. Active client: Inference attack against the output of lower model to infer client data.
1. Passive Clients: Inference attack against the output of upper model received from the active client to infer other clients’ data.
1. Third party: Eavesdrop on outputs that pass through the communication channel and infer client data through inference attacks.
<details>
<summary>extracted/5379099/fig/TP_VFL.png Details</summary>
### Visual Description
## Diagram: Federated Learning System with Hierarchical Models
### Overview
This image is a technical diagram illustrating a federated learning process involving multiple clients and a central server. The system uses a two-tier model architecture (lower and upper models) and operates through a four-step iterative cycle. The diagram is divided into three main spatial regions: a left column showing client data processing, a central area detailing the active client/server interaction, and a right section depicting the overall model hierarchy.
### Components/Axes
**Textual Elements & Labels:**
* **Top Header Box:** "Overall model is learned by repeating steps ② to ④."
* **Step ① Label (Left):** "①IDs matched between clients."
* **Step ② Label (Top-Center):** "②The same ID data is submitted between clients and each output of lower model is sent to the active server."
* **Step ③ Label (Center):** "③The output of each client is used as input to update upper model."
* **Step ④ Label (Bottom-Center):** "④Propagate the error to each client and learn the lower model."
* **Client Labels (Left Column):** "Client A", "Client B", "Client C".
* **Data Icons (Left Column):** Each client box contains a cylinder icon labeled "Data".
* **Central Entity Label:** "Active Client" (in a purple header bar).
* **Model Hierarchy Labels (Right):** "Lower model", "Upper model", "Overall model".
* **Roman Numeral Labels:** "I" (below the active server icon), "II" (below the client icons on the left), "III" (below the globe/user icon at the bottom).
**Visual Components & Flow:**
* **Left Column (Region II):** Three client blocks (A, B, C). Each shows a "Data" cylinder feeding into a neural network icon (representing the "lower model").
* **Central Region (Active Client/I):**
* An icon of a person at a computer (the active server).
* A box showing example output vectors from clients: `[1.0, 2.1, -5.0, ...]` and `[3.6, -0.1, -8.5, ...]`.
* A neural network icon representing the "upper model" being updated.
* A globe icon with a user (labeled III) connected via a blue arrow, indicating error propagation back to clients.
* **Right Region:** A schematic showing the model architecture. Three "Lower model" neural networks (one each for Client A, B, C) feed their outputs into a single "Upper model" neural network. This combined system is labeled "Overall model" and is accompanied by a red icon of a head with gears.
* **Flow Arrows:**
1. A large, double-headed blue arrow on the far left labeled "①" connects the three clients, indicating ID matching.
2. Blue arrows from each client's lower model point to the central "Active Client" server, corresponding to step ②.
3. A blue arrow from the "Active Client" server points to the upper model network, corresponding to step ③.
4. A large, curved blue arrow from the "Active Client" region points back to the clients via the globe icon, corresponding to step ④.
### Detailed Analysis
**Process Flow (Step-by-Step):**
1. **Step ① - ID Matching:** Client A, Client B, and Client C align their datasets using matched identifiers. This is a prerequisite for the federated process.
2. **Step ② - Forward Pass to Server:** Each client processes its local data through its own "lower model" neural network. The output vectors (exemplified by `[1.0, 2.1, -5.0, ...]`) are sent to a central "Active Client" server.
3. **Step ③ - Upper Model Update:** The server aggregates the outputs from all clients' lower models. These aggregated outputs are used as input to train or update a central "upper model" neural network.
4. **Step ④ - Error Propagation & Lower Model Update:** The error or gradient signal from the updated upper model is propagated back through the network (symbolized by the globe) to each individual client. Each client then uses this error to update its own local "lower model."
**Model Architecture:**
* **Lower Models:** Client-specific neural networks. There is one lower model per client (A, B, C).
* **Upper Model:** A single, central neural network that learns from the combined outputs of all lower models.
* **Overall Model:** The complete system, comprising the distributed lower models and the central upper model, learned iteratively.
### Key Observations
* **Hierarchical Separation:** The architecture explicitly separates client-specific feature extraction (lower models) from a centralized aggregation and decision model (upper model).
* **Iterative Learning:** The process is cyclical, with the overall model improving through repeated iterations of steps ② through ④.
* **Active Client Role:** The diagram designates one entity as the "Active Client," which appears to function as the central server coordinating the upper model update and error propagation.
* **Data Privacy Implication:** Raw data never leaves the clients (only model outputs/updates are shared), which is a core principle of federated learning.
* **Visual Metaphors:** The "head with gears" icon for the "Overall model" suggests centralized intelligence, while the globe icon for error propagation implies a distributed network.
### Interpretation
This diagram depicts a **federated learning framework with a hierarchical model structure**. The core innovation or focus is the separation of the learning task into two tiers:
1. **Distributed Representation Learning (Lower Models):** Each client trains a local model to extract features or create representations from its private data. This allows for personalization and data privacy.
2. **Centralized Aggregation & Inference (Upper Model):** The server learns a global model that combines the representations from all clients. This upper model likely performs the final task (e.g., classification, regression) and provides a unified learning signal.
The process ensures that sensitive data remains on local devices while still allowing a powerful global model to be trained. The "ID matching" step (①) is critical, implying the data across clients must be aligned for the same entities (e.g., the same users, products, or time periods) for the federated learning to be meaningful. The system's power comes from its iterative nature, where the global model's feedback continuously improves the local models, creating a virtuous cycle of distributed learning. This approach is valuable in scenarios like mobile keyboard prediction, medical research across hospitals, or financial fraud detection, where data cannot be centralized due to privacy, regulation, or volume.
</details>
Figure 6: Threads to privacy in VFL.
### III-C Federated Transfer Learning
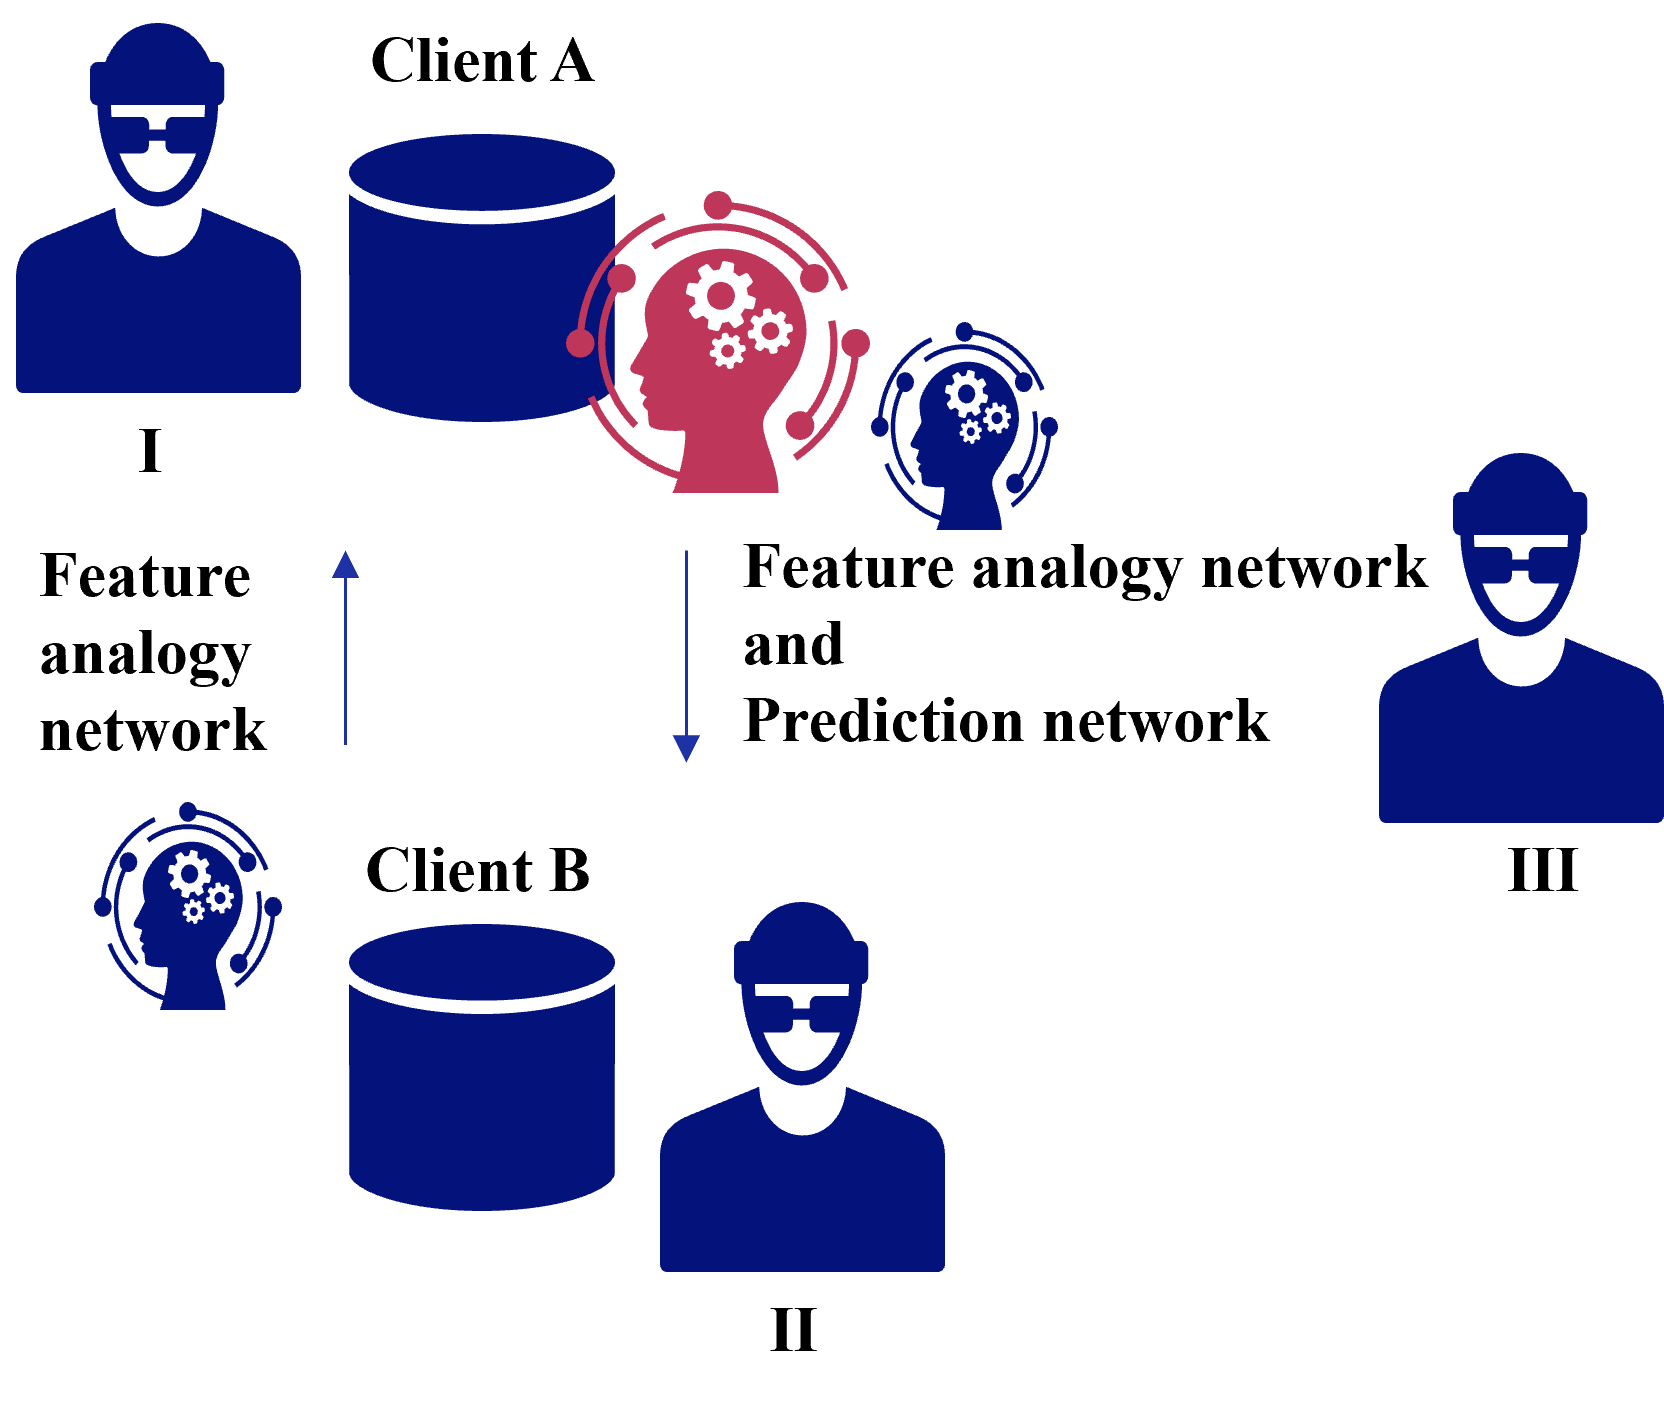
In federated transfer learning, threats to privacy vary depending on the information in common [24]. We explain the case when features are common and when IDs are common, respectively.
#### III-C 1 Common Features
Figure 7 shows threats to privacy in case of common features in FTL, and possible attackers are as follows:
1. Client receiving a feature analogy network: Inference attack against feature analogy network to infer client data.
1. Client receiving a feature analogy network and prediction network: Inference attack against feature analogy network and prediction network to infer client data.
1. Third party: Eavesdrop on feature analogy network and prediction network pass through the communication channel and infer client data through inference attacks.
<details>
<summary>extracted/5379099/fig/CFTP_FTL.png Details</summary>
### Visual Description
## System Architecture Diagram: Federated Learning with Feature Analogy Networks
### Overview
The image is a conceptual system architecture diagram illustrating a federated or collaborative machine learning workflow involving multiple clients and specialized neural networks. The diagram uses icons and text labels to represent entities and data flows, with no numerical data or charts present.
### Components/Axes
The diagram is composed of the following labeled components, arranged spatially on a light gray background:
**Top-Left Region (Section I):**
* **Icon:** A dark blue silhouette of a person wearing glasses, labeled with the Roman numeral **"I"**.
* **Component:** A dark blue cylinder icon labeled **"Client A"**.
* **Network Icon:** A red silhouette of a human head in profile, containing white gears and surrounded by a circular network of red nodes and lines. This is positioned to the right of the Client A database.
**Bottom-Center Region (Section II):**
* **Icon:** A dark blue silhouette of a person wearing glasses, labeled with the Roman numeral **"II"**.
* **Component:** A dark blue cylinder icon labeled **"Client B"**.
* **Network Icon:** A dark blue silhouette of a human head in profile, containing white gears and surrounded by a circular network of blue nodes and lines. This is positioned to the left of the Client B database.
**Right Region (Section III):**
* **Icon:** A dark blue silhouette of a person wearing glasses, labeled with the Roman numeral **"III"**.
* **Network Icon:** A dark blue silhouette of a human head in profile, containing white gears and surrounded by a circular network of blue nodes and lines. This is positioned to the left of the person icon.
**Text Labels and Flow Indicators:**
* **Left Side:** The text **"Feature analogy network"** is placed vertically between the icons for Client B and Client A. A blue arrow points **upward** from the Client B network icon toward the Client A network icon.
* **Center-Right:** The text **"Feature analogy network and Prediction network"** is placed between the red network icon (from Client A) and the network icon for Client III. A blue arrow points **downward** from the red network icon toward the Client III network icon.
### Detailed Analysis
The diagram depicts a structured data flow between three parties (I, II, III) associated with two data-holding clients (A and B).
1. **Data Source & Initial Processing:**
* **Client A (I)** possesses a dataset (cylinder icon). Data from Client A is processed by a **red "Feature analogy network"** (head with gears icon).
* **Client B (II)** possesses a separate dataset. Data from Client B is processed by a **blue "Feature analogy network"**.
2. **Primary Data Flow (Upward):**
* An upward arrow indicates that information from Client B's feature analogy network is sent to Client A's feature analogy network. The label "Feature analogy network" on the left confirms this channel is dedicated to sharing feature-based analogies or representations.
3. **Secondary Data Flow & Prediction (Downward):**
* A downward arrow originates from Client A's red feature analogy network and points toward the network icon associated with **Client III (III)**.
* The label for this flow is **"Feature analogy network and Prediction network"**. This indicates that the output from Client A's network—which likely combines its own features with analogies received from Client B—is used to inform or generate predictions for Client III.
### Key Observations
* **Color Coding:** The network icon for Client A is **red**, while the network icons for Client B and Client III are **blue**. This visually distinguishes the primary processing node (Client A) from the others.
* **Asymmetric Roles:** Client A (I) acts as a central hub, receiving data from Client B and sending processed information to Client III. Client B (II) is a data contributor, and Client III (III) is a data consumer or prediction recipient.
* **Network Types:** The diagram explicitly names two types of neural network components: a **"Feature analogy network"** (present at all three nodes) and a **"Prediction network"** (implied to be part of the processing at Client A or Client III).
* **Spatial Layout:** The legend/labels are integrated directly next to the flow arrows they describe, rather than in a separate legend box. The Roman numerals (I, II, III) clearly label the human stakeholders.
### Interpretation
This diagram illustrates a **privacy-preserving or federated learning framework**. The core concept is that clients (A and B) do not share raw data. Instead, they train local "Feature analogy networks" to extract high-level, abstract features from their private datasets.
Client B shares its learned feature analogies with Client A. Client A then integrates these external analogies with its own features to train a more robust model. The combined knowledge is then used—either directly or via a separate "Prediction network"—to generate insights or predictions for a third party, Client III.
The architecture suggests a scenario where Client A has a central role, perhaps as a model aggregator or service provider, leveraging distributed knowledge from Client B to serve predictions to Client III. The use of "analogy" implies the networks are learning relational or similarity-based representations rather than direct data mappings. The primary goal is collaborative model improvement without exposing sensitive underlying data.
</details>
Figure 7: Threats to privacy in case of common features in FTL.
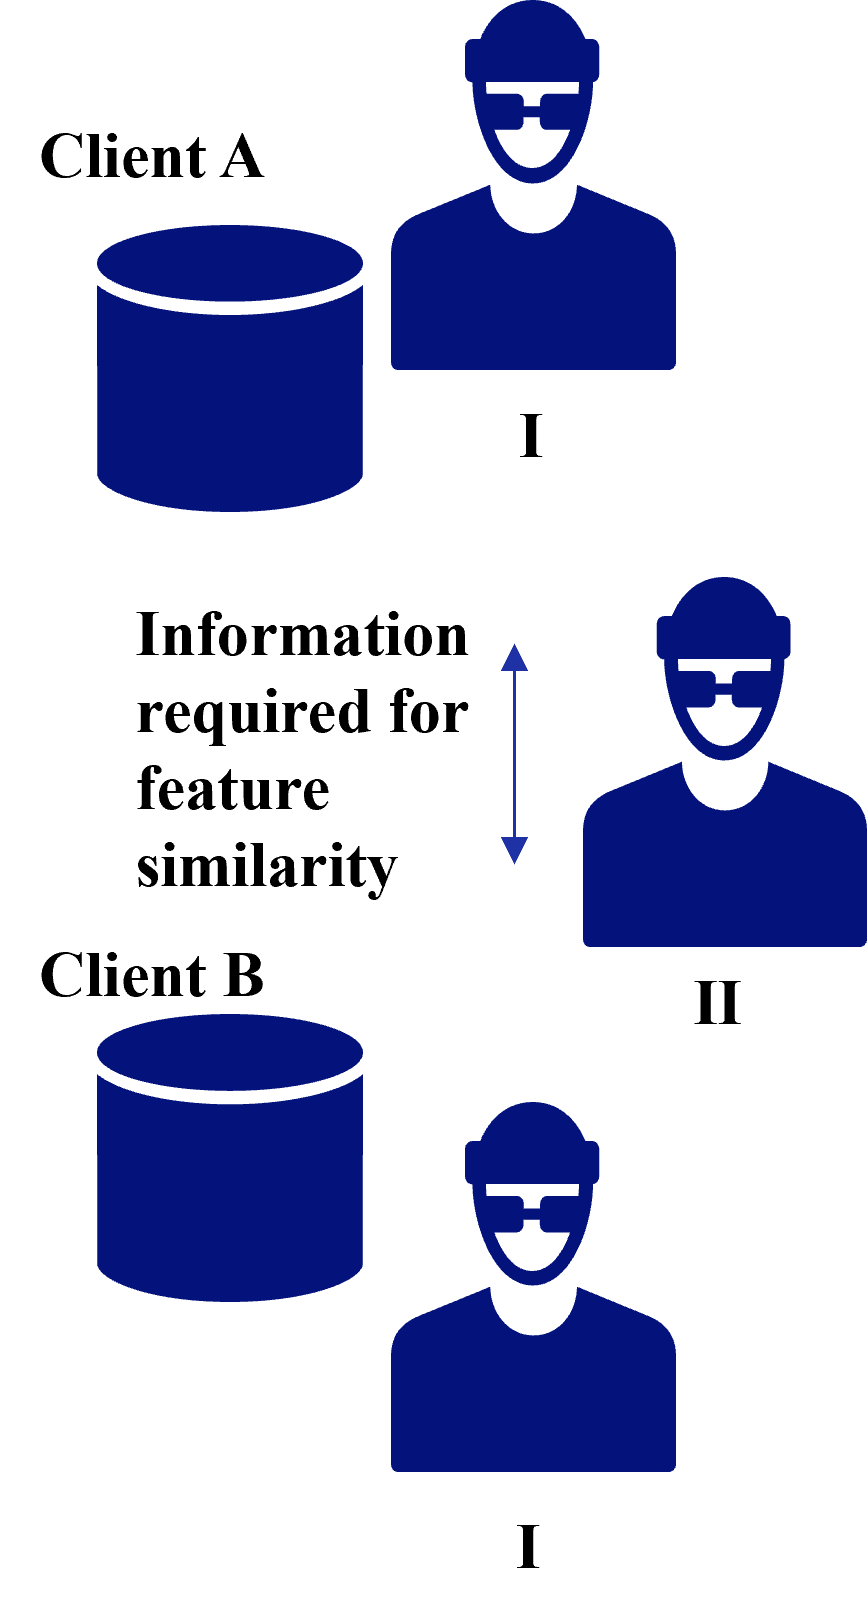
#### III-C 2 Common IDs
In case of Common IDs, a threat to privacy is the leakage of identities due to identity matching between clients as shown in VFL [33]. In addition to the leakage of identities, information required for feature similarity from clients is also a threat. Figure 8 shows threats to privacy in case of common IDs in FTL in case of information required for feature similarity, and possible attackers are as follows:
1. Client receiving information for feature similarity: Inference attack against information required for feature similarity to infer client data.
1. Third party: Eavesdrop on information required for feature similarity pass through the communication channel and infer client data through inference attacks.
<details>
<summary>extracted/5379099/fig/CITP_FTL.png Details</summary>
### Visual Description
## Diagram: Client Data and Feature Similarity Requirement
### Overview
The image is a conceptual diagram illustrating two clients (Client A and Client B), each associated with a data store and a user entity. The central theme is the bidirectional requirement of information between the clients to assess "feature similarity." The diagram uses simple, stylized blue icons on a light gray background.
### Components/Axes
The diagram is composed of the following labeled elements, positioned as described:
1. **Client A (Top-Left Quadrant):**
* **Label:** "Client A" (text, top-left).
* **Data Store:** A blue cylinder icon (representing a database or data repository) positioned directly below the "Client A" label.
* **User Entity:** A blue human figure icon (head and shoulders, wearing glasses) positioned to the right of the cylinder. It is labeled with the Roman numeral "I" below it.
2. **Central Text Block (Center):**
* **Text:** "Information required for feature similarity" (three lines of text).
* **Graphic Element:** A vertical, double-headed blue arrow (↕) is positioned to the right of this text block, indicating a bidirectional relationship or flow.
3. **Client B (Bottom-Left Quadrant):**
* **Label:** "Client B" (text, positioned below the central text block and to the left).
* **Data Store:** A blue cylinder icon, identical in style to Client A's, positioned directly below the "Client B" label.
* **User Entity:** A blue human figure icon, identical to the one in Client A's section, positioned to the right of Client B's cylinder. It is labeled with the Roman numeral "I" below it.
4. **Additional User Entity (Center-Right):**
* A third blue human figure icon, identical to the others, is positioned to the right of the central text block and arrow. It is labeled with the Roman numeral "II" below it.
### Detailed Analysis
* **Spatial Relationships:** The diagram is organized into two primary vertical sections (Client A on top, Client B below) connected by a central conceptual requirement. The user entities labeled "I" are directly associated with their respective client's data store. The user entity labeled "II" is positioned separately, adjacent to the central requirement text.
* **Visual Flow:** The double-headed arrow next to the text "Information required for feature similarity" is the only directional element, emphasizing a mutual or reciprocal need. There are no connecting lines between the cylinders or figures, implying the relationship is conceptual rather than a direct data flow path.
* **Consistency:** All icons (cylinders and human figures) are rendered in the same solid blue color and minimalist style. The text is in a black, serif font.
### Key Observations
1. **Duplicate Labeling:** Both user entities associated directly with a client cylinder are labeled with the Roman numeral "I". This suggests they may represent the same role, type, or instance within their respective client contexts.
2. **Distinct Entity:** The user entity labeled "II" is spatially separate and associated with the central requirement, not directly with a client's data store. This implies a different role, perhaps an arbitrator, a common service, or a point of comparison.
3. **Abstract Representation:** The diagram contains no numerical data, axes, or quantitative information. It is purely a schematic illustrating a relationship and requirement between entities.
### Interpretation
This diagram models a scenario where two distinct parties (Client A and Client B), each possessing their own data and user base, need to exchange or compare information. The core purpose of this exchange is to determine "feature similarity."
* **What it suggests:** The system likely involves comparing attributes (features) of data or users from Client A with those from Client B. This is common in fields like federated learning, privacy-preserving record linkage, or collaborative filtering, where entities want to find commonalities without sharing raw data.
* **Relationship of Elements:** The clients are parallel entities. The central text and arrow define the *process* that connects them. The user icons labeled "I" represent the local subjects of the data, while the icon labeled "II" could represent a shared model, a third-party service, or the abstract concept of the comparison algorithm itself.
* **Notable Implication:** The lack of direct lines between the client cylinders underscores that the "information required" is likely not the raw data itself, but derived features, hashes, embeddings, or other metadata necessary for the similarity computation. The diagram emphasizes the *requirement* for this information exchange as the foundational step for the similarity task.
</details>
Figure 8: Threads to privacy in case of common IDs in FTL.
## IV Countermeasures against Threats to Privacy in Each Federated Learning
In this section, we describe countermeasures against threats to privacy in each federated learning. Table II shows countermeasures against privacy threats addressed in each federated learning. Despite the wide variety of previous efforts to secure privacy in federated learning, the proposed methods typically fall into one of these categories: differential privacy, secure computation, encryption of communication, and ID dummying [32].
TABLE II: Countermeasures against privacy threats addressed in each federated learning.
| HFL VFL FTL (common features) | Client Side - Feature Analogy Network Exchange | Server Side Active Client Side - | Communication Line Communication Line Communication Line | - Client Table - |
| --- | --- | --- | --- | --- |
| FTL (common IDs) | - | Gradient Exchange | Communication Line | Client Table |
### IV-A Horizontal Federated Learning
In HFL, a typical privacy measure for client data is to protect attacks by the server side with secure computation and attacks by the client side with differential privacy [34]. Figure 9 shows countermeasures against threads to privacy in HFL. The position of the attacker by these privacy measures is described as follows.
1. Server: Secure computation realizes global model integration calculations without seeing the model by the server [35, 36]
1. Client: Client A creates a model by adding noise through differential privacy [37, 38]. Client B receives the parameters of the global model via the server, but Client A’s model is protected by differential privacy.
1. Third party: Achieved by encryption of communication.
<details>
<summary>extracted/5379099/fig/CM_HFL.png Details</summary>
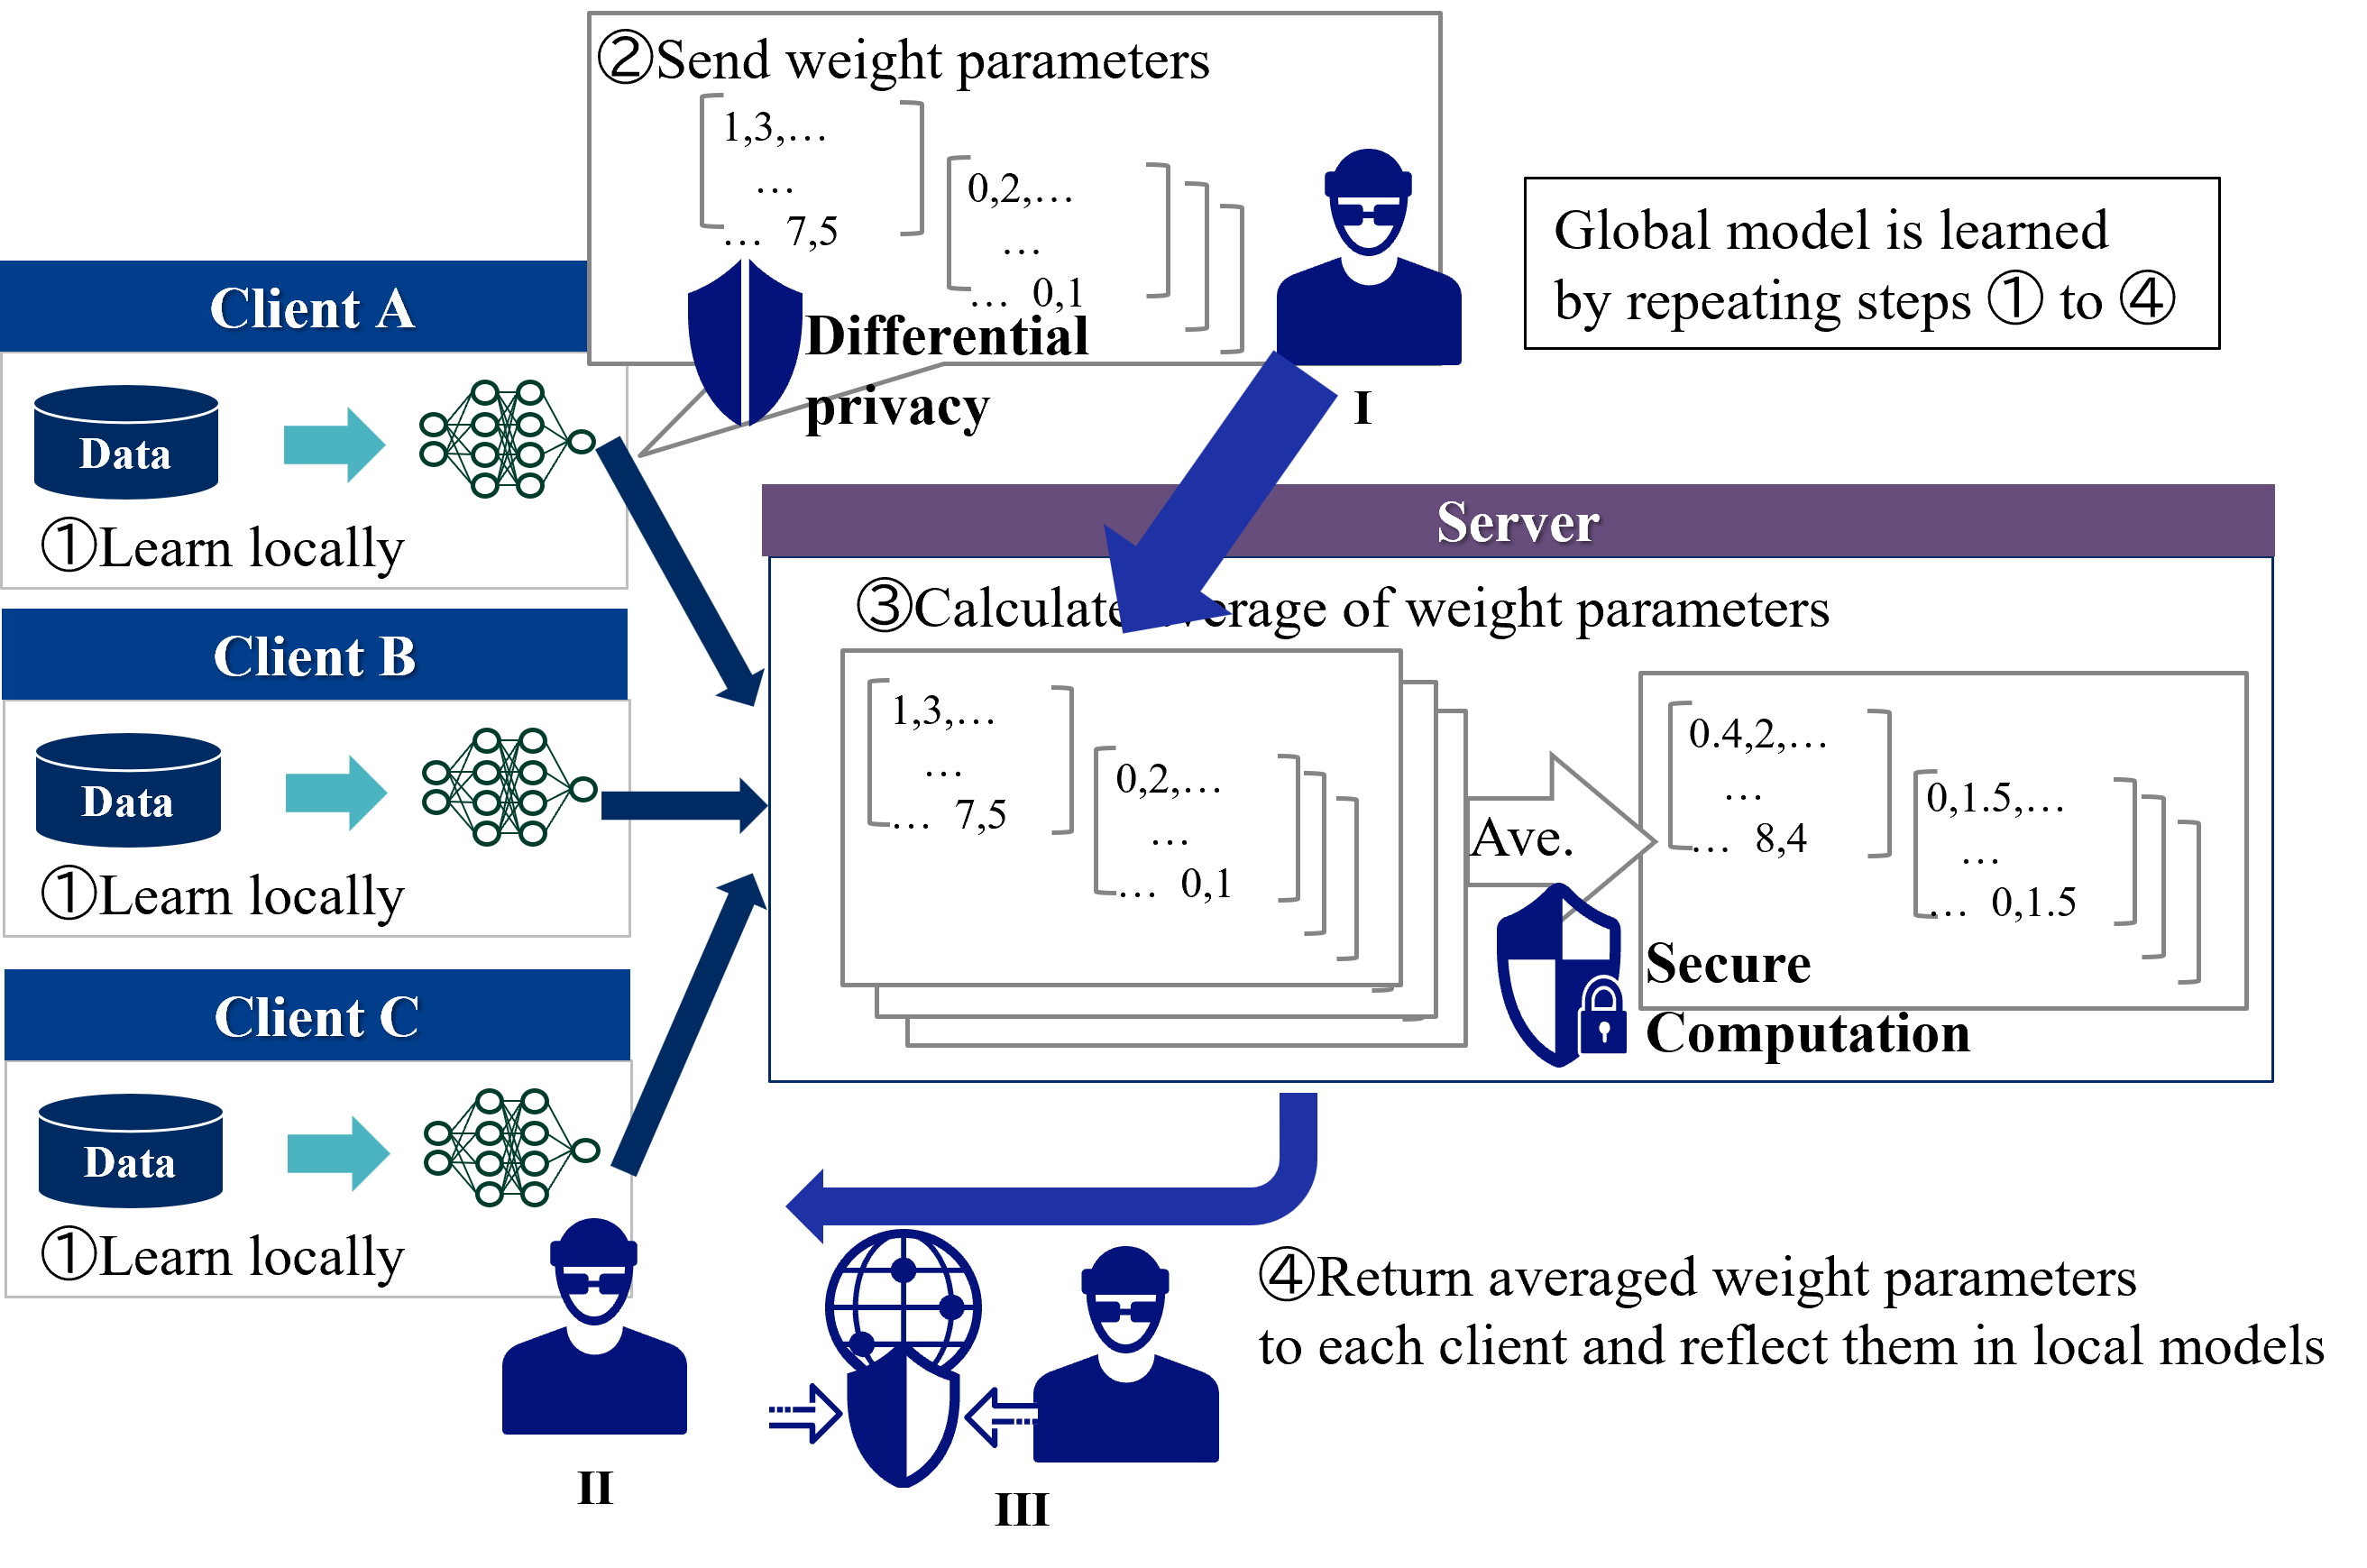
### Visual Description
## Diagram: Federated Learning with Differential Privacy and Secure Computation
### Overview
The image is a technical flowchart illustrating a four-step federated learning process. It depicts multiple clients (A, B, C) collaboratively training a global machine learning model without sharing their raw local data. The process incorporates two key privacy/security mechanisms: **Differential Privacy** applied during parameter transmission and **Secure Computation** applied during server-side aggregation. The diagram uses icons, arrows, and text boxes to show the flow of data and operations.
### Components/Axes
The diagram is organized into three main spatial regions:
1. **Left Column (Clients):** Contains three vertically stacked client blocks (Client A, Client B, Client C). Each block contains:
* A blue cylinder icon labeled **"Data"**.
* A teal arrow pointing right.
* A green neural network icon.
* The text **"①Learn locally"**.
2. **Center/Right (Server & Process Flow):** Contains the main process flow, centered around a large purple-header box labeled **"Server"**.
3. **Top Right (Global Note):** A standalone text box states: **"Global model is learned by repeating steps ① to ④"**.
**Key Process Steps (Numbered Circles):**
* **① Learn locally:** Performed by each client on their local data.
* **② Send weight parameters:** Performed by clients, sending parameters to the server. This step is visually associated with a **"Differential privacy"** label and a shield icon.
* **③ Calculate average of weight parameters:** Performed by the server. This step is visually associated with a **"Secure Computation"** label and a shield-with-lock icon.
* **④ Return averaged weight parameters to each client and reflect them in local models:** Performed by the server, sending the aggregated model back to clients.
**Icons and Symbols:**
* **Person Icons (I, II, III):** Represent actors in the process. Icon **I** is near the "Send weight parameters" step. Icons **II** and **III** are near the "Return" step, with a globe-and-shield icon between them.
* **Shield Icons:** Represent security/privacy measures. One shield is labeled **"Differential privacy"**. Another shield with a padlock is labeled **"Secure Computation"**.
* **Arrows:** Thick blue arrows indicate the direction of data/parameter flow between clients and the server.
### Detailed Analysis
**Step-by-Step Process Flow:**
1. **Step ① - Local Learning:**
* **Location:** Left column, within each Client block (A, B, C).
* **Action:** Each client uses its local **"Data"** (blue cylinder) to train a local model, represented by a green neural network icon. The text **"①Learn locally"** confirms this action.
2. **Step ② - Parameter Transmission with Differential Privacy:**
* **Location:** Top-center, originating from the clients and pointing to the server.
* **Action:** Clients send their locally updated model weight parameters to the server.
* **Data Transmitted:** Example weight parameter matrices are shown:
* `[1,3,... ... 7,5]`
* `[0,2,... ... 0,1]`
* **Privacy Mechanism:** A blue shield icon labeled **"Differential privacy"** is placed over the transmission path, indicating noise is added to the parameters before sending to protect individual data points.
3. **Step ③ - Secure Aggregation on Server:**
* **Location:** Inside the large "Server" box.
* **Action:** The server receives the differentially private weight parameters from all clients and calculates their average.
* **Input Data:** The same example matrices from Step ② are shown stacked, representing inputs from multiple clients.
* **Process:** An arrow labeled **"Ave."** points to the output.
* **Output Data:** The averaged result is shown as new matrices:
* `[0.4,2,... ... 8,4]`
* `[0,1.5,... ... 0,1.5]`
* **Security Mechanism:** A shield-with-padlock icon labeled **"Secure Computation"** is placed next to the averaging operation, indicating the aggregation is performed on encrypted or otherwise secured data.
4. **Step ④ - Global Model Distribution:**
* **Location:** Bottom-center, originating from the server and pointing back to the clients.
* **Action:** The server returns the averaged (global) weight parameters to each client.
* **Text:** **"④Return averaged weight parameters to each client and reflect them in local models"**.
* **Visual:** A thick blue arrow curves from the server output back towards the client side. Person icons **II** and **III** and a globe-shield icon are positioned along this return path.
### Key Observations
* **Iterative Process:** The note in the top-right corner explicitly states the entire four-step cycle is repeated to train the global model.
* **Dual Privacy/Security Layers:** The diagram highlights two distinct protective measures: **Differential Privacy** (for data minimization during sharing) and **Secure Computation** (for protected processing during aggregation).
* **Asymmetric Data Flow:** The flow is cyclical: Clients → Server (Steps 1-2), Server processes (Step 3), Server → Clients (Step 4).
* **Example Data:** The numerical matrices (`[1,3,...]`, `[0.4,2,...]`, etc.) are illustrative placeholders to concretely show the transformation from client parameters to an averaged global parameter.
### Interpretation
This diagram visually explains a **privacy-preserving federated learning architecture**. It demonstrates how multiple entities (clients) can jointly train a shared AI model while keeping their sensitive training data local and protected.
* **Core Problem Solved:** It addresses the fundamental tension in collaborative AI: needing to combine knowledge from diverse datasets without compromising the privacy or security of the underlying data.
* **Mechanism Relationship:** **Differential Privacy** acts at the *communication boundary*, adding mathematical noise to obscure any single client's contribution. **Secure Computation** acts at the *aggregation point*, ensuring the server itself cannot inspect individual client parameters during the averaging process. Together, they provide defense-in-depth.
* **Process Significance:** The cyclical nature (repeating steps 1-4) is crucial. It shows that model improvement is incremental, with each cycle allowing the global model to benefit from all clients' data patterns without ever directly accessing it. This is foundational for applications in healthcare, finance, or any field where data cannot be centralized due to regulation, competition, or privacy concerns.
* **Notable Design Choice:** The use of clear, numbered steps and distinct icons for security mechanisms makes a complex technical process accessible. The inclusion of concrete (though example) numerical matrices helps ground the abstract concept of "weight parameters" in a tangible form.
</details>
Figure 9: Countermeasures against threads to privacy in HFL.
### IV-B Vertical Federated Learning
In VFL, the threads to privacy are the leakage of identities and partial output from clients. We show how to respond in the case of each threat.
#### IV-B 1 IDs Matching
In case of IDs matching, Dummy IDs are prepared in addition to the original IDs [39]. For the dummy part of the ID, dummy variables that have no effect on learning are sent. Figure 10 shows an example of dummy IDs. Before dummy IDs are used, all IDs that match Client A are known to Client B (cf. ID 3,4). After dummy IDs are used, Client B does not know which of the IDs that match Client A is the real ID of Client A.
<details>
<summary>extracted/5379099/fig/CMID_VFL.png Details</summary>
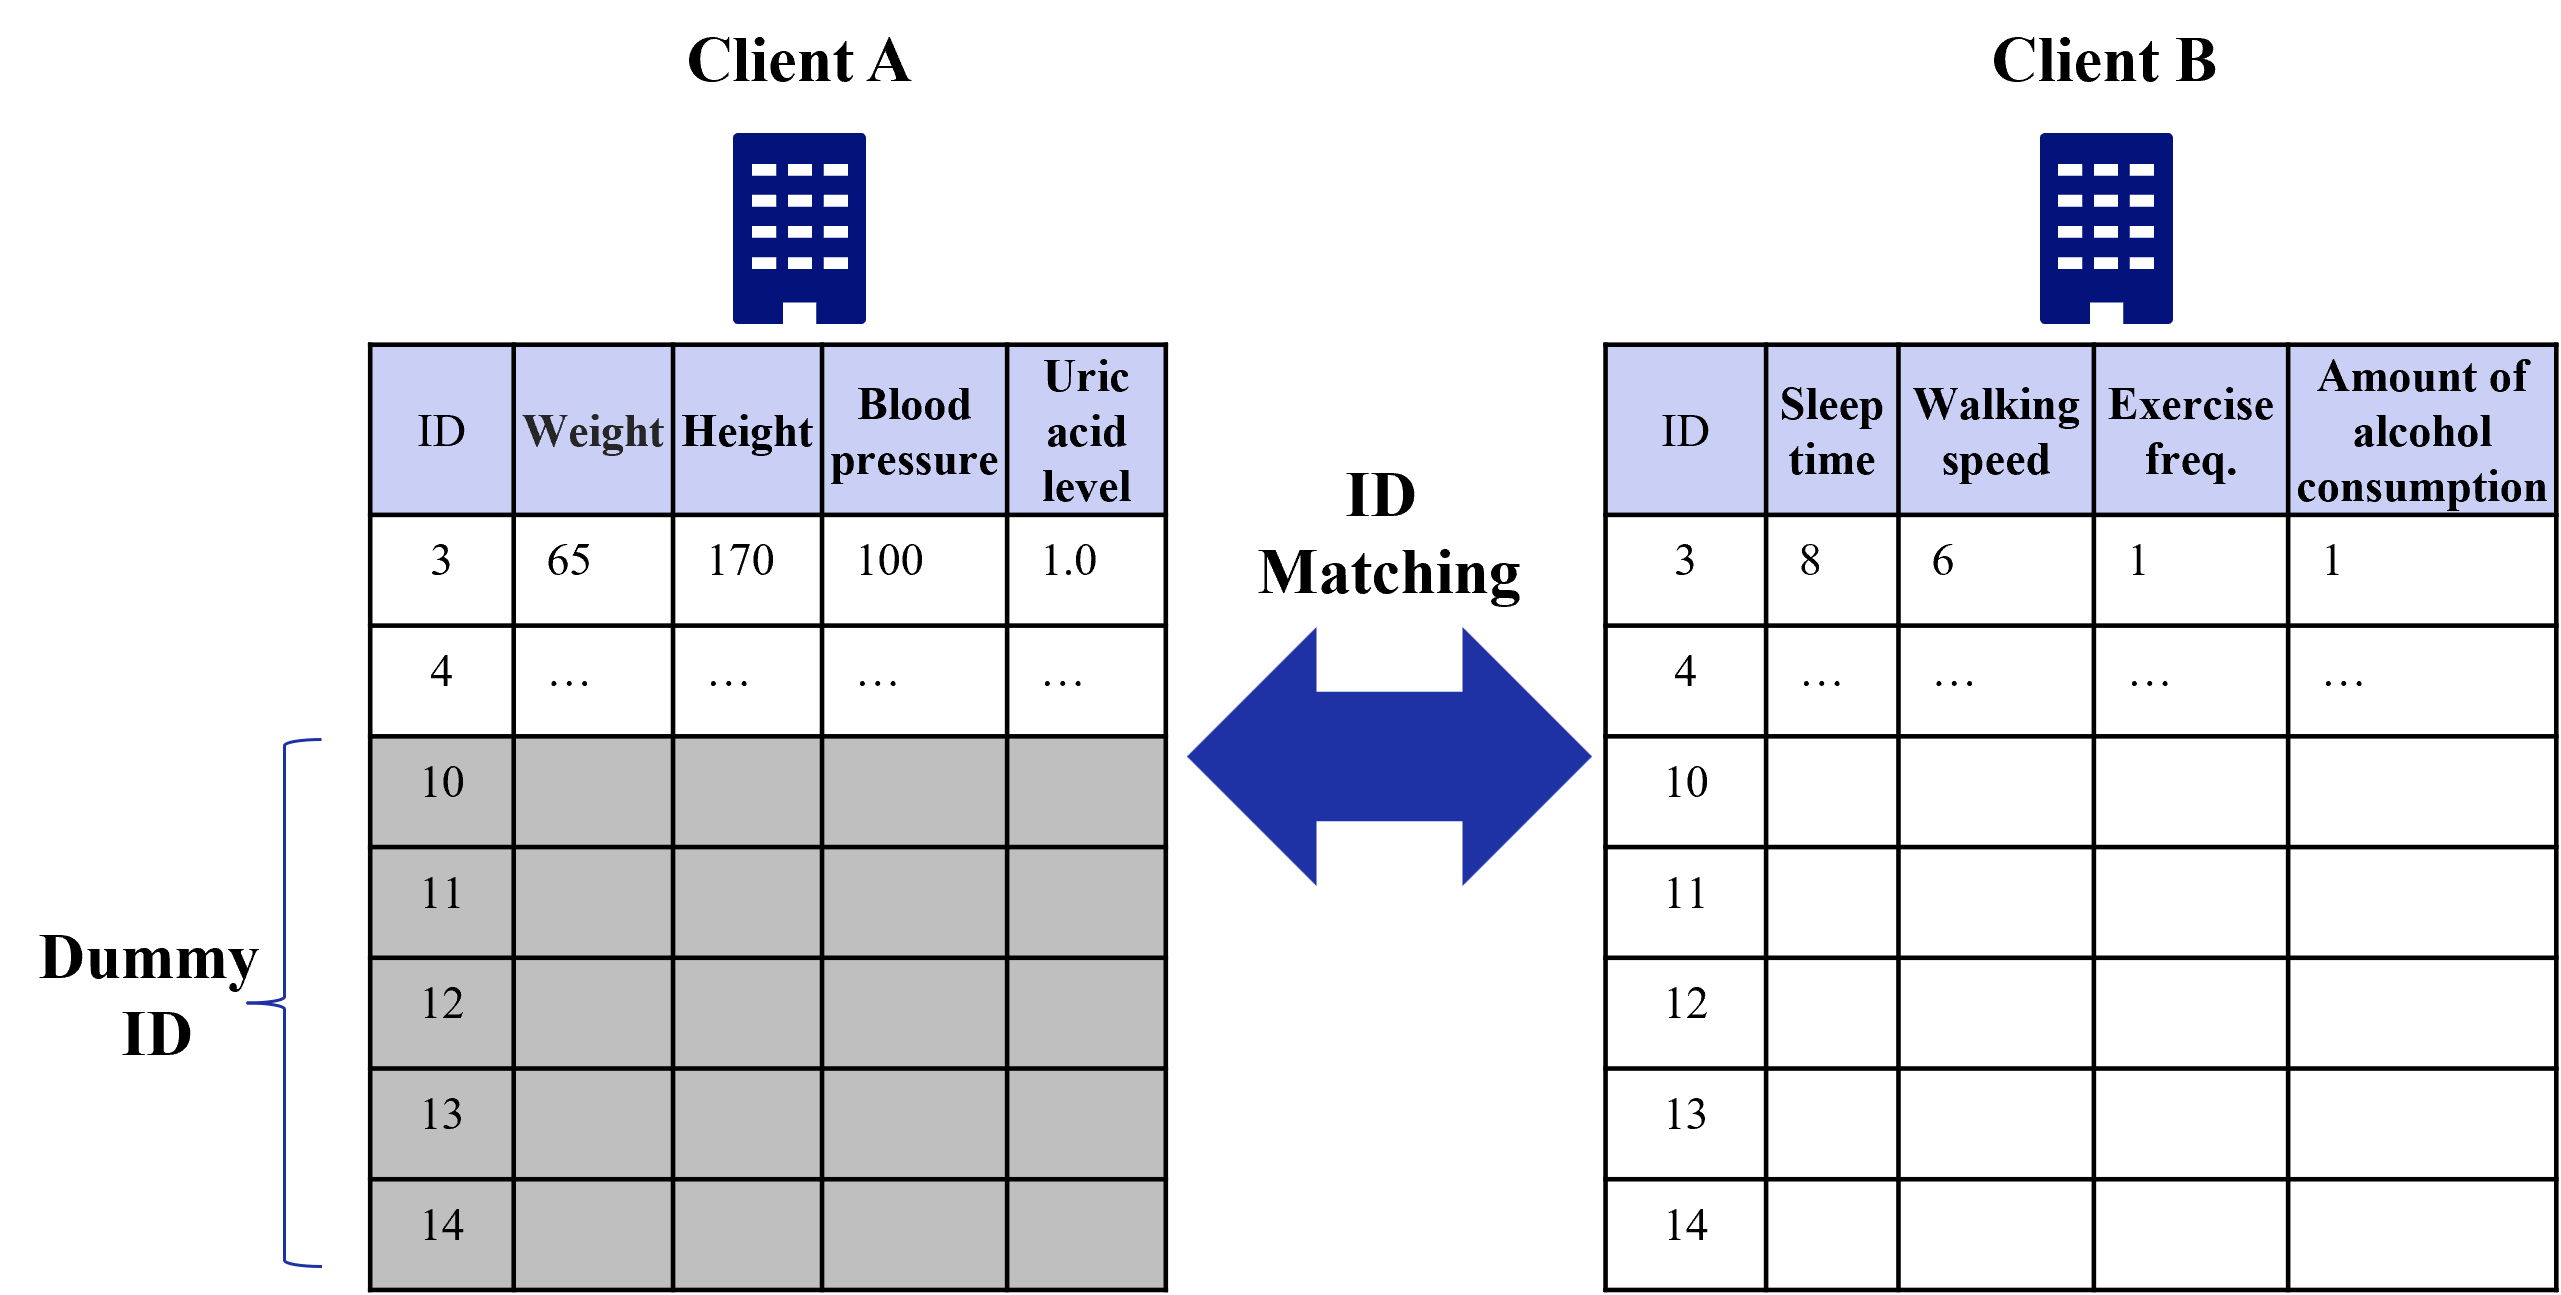
### Visual Description
\n
## Diagram: Data Integration via ID Matching
### Overview
The image is a technical diagram illustrating a data matching process between two separate datasets, labeled "Client A" and "Client B." The core concept is linking records from these two sources using a common identifier (ID). The diagram visually represents the structure of the data tables and the matching operation.
### Components/Axes
The diagram consists of three main components arranged horizontally:
1. **Left Component (Client A):**
* **Header:** "Client A" with a blue building icon above a data table.
* **Table Structure:** A 5-column table with a light blue header row.
* **Column Headers (Left to Right):** `ID`, `Weight`, `Height`, `Blood pressure`, `Uric acid level`.
* **Data Rows:**
* Row 1: `3`, `65`, `170`, `100`, `1.0`
* Row 2: `4`, `...`, `...`, `...`, `...`
* Rows 3-7: IDs `10`, `11`, `12`, `13`, `14`. These rows are shaded gray.
* **Annotation:** A curly brace labeled **"Dummy ID"** points to the grayed-out rows (IDs 10-14).
2. **Central Component (Process):**
* A large, double-headed blue arrow pointing left and right.
* Text label above the arrow: **"ID Matching"**.
3. **Right Component (Client B):**
* **Header:** "Client B" with an identical blue building icon above a data table.
* **Table Structure:** A 5-column table with a light blue header row.
* **Column Headers (Left to Right):** `ID`, `Sleep time`, `Walking speed`, `Exercise freq.`, `Amount of alcohol consumption`.
* **Data Rows:**
* Row 1: `3`, `8`, `6`, `1`, `1`
* Row 2: `4`, `...`, `...`, `...`, `...`
* Rows 3-7: IDs `10`, `11`, `12`, `13`, `14`. These rows are empty (white background).
### Detailed Analysis
The diagram presents a snapshot of two datasets poised for integration.
* **Client A's Data:** Appears to contain biometric or health metrics (Weight, Height, Blood pressure, Uric acid level). The first record (ID 3) is fully populated. The second record (ID 4) is indicated as having data, but it is omitted (`...`). Records with IDs 10 through 14 are explicitly marked as "Dummy ID" and are visually distinguished with gray shading, suggesting they are placeholder, test, or non-active entries.
* **Client B's Data:** Appears to contain lifestyle or activity metrics (Sleep time, Walking speed, Exercise freq., Amount of alcohol consumption). The structure mirrors Client A: ID 3 is fully populated, ID 4 has omitted data (`...`), and IDs 10-14 are present but empty.
* **The Matching Process:** The central "ID Matching" arrow signifies an operation that will join or link rows from the two tables where the `ID` values correspond. For example, the record for ID 3 from Client A (biometrics) would be associated with the record for ID 3 from Client B (lifestyle data).
### Key Observations
1. **Common Key:** The `ID` column is the sole common field between the two datasets, serving as the primary key for the join operation.
2. **Data Completeness:** Only the first record (ID 3) in each table shows complete sample data. The second record (ID 4) implies existence but withholds details. The remaining records (IDs 10-14) are structurally present but contain no attribute data in this view.
3. **Dummy Data Designation:** The explicit "Dummy ID" label and gray shading for IDs 10-14 in Client A's table is a critical annotation. It indicates these entries are not genuine records, which is important for understanding data quality or the scope of a real matching exercise.
4. **Symmetry and Asymmetry:** The tables are symmetric in structure (5 columns each, same ID list) but asymmetric in content (different attribute columns) and visual treatment (gray vs. white background for dummy rows).
### Interpretation
This diagram is a conceptual model for **data fusion or entity resolution**. It demonstrates how disparate data sources (Client A and Client B), which hold different attributes about the same set of entities (identified by `ID`), can be integrated.
* **Purpose:** The likely goal is to create a unified profile for each ID by combining biometric data from one source with lifestyle data from another. This is a common pattern in healthcare analytics, customer 360 platforms, or research studies.
* **Relationship:** The bidirectional arrow suggests the matching process is mutual or that the relationship can be queried from either side. It doesn't imply directionality of data flow.
* **Notable Implications:**
* The presence of "Dummy ID" entries highlights a common real-world data issue: the need to handle placeholder or test records during integration to avoid corrupting analysis.
* The omitted data (`...`) for ID 4 suggests the diagram is a simplified example, focusing on the structure and process rather than exhaustive data.
* The successful match for ID 3 implies that for this entity, a complete, multi-dimensional dataset (biometrics + lifestyle) can be constructed, enabling richer analysis (e.g., correlating sleep time with blood pressure).
In essence, the image communicates the **architecture of a data join operation**, emphasizing the role of a common identifier and the careful handling of different data types and record statuses.
</details>
Figure 10: Example of dummy IDs.
#### IV-B 2 Output from Clients
In case of output from clients, the typical privacy measure is the use of secure calculations [33]. Figure 11 shows countermeasures against threads in case of output from clients. The position of the attacker by these privacy measures is described as follows.
1. Active Client: Secure computation realizes global model integration calculations without seeing the model by the active client. [35].
1. Passive Clients: Client B receives the information used for updating from the upper model via the active client, but it is protected by secure computation.
1. Third party: Achieved by encryption of communication.
<details>
<summary>extracted/5379099/fig/CMOC_VFL.png Details</summary>
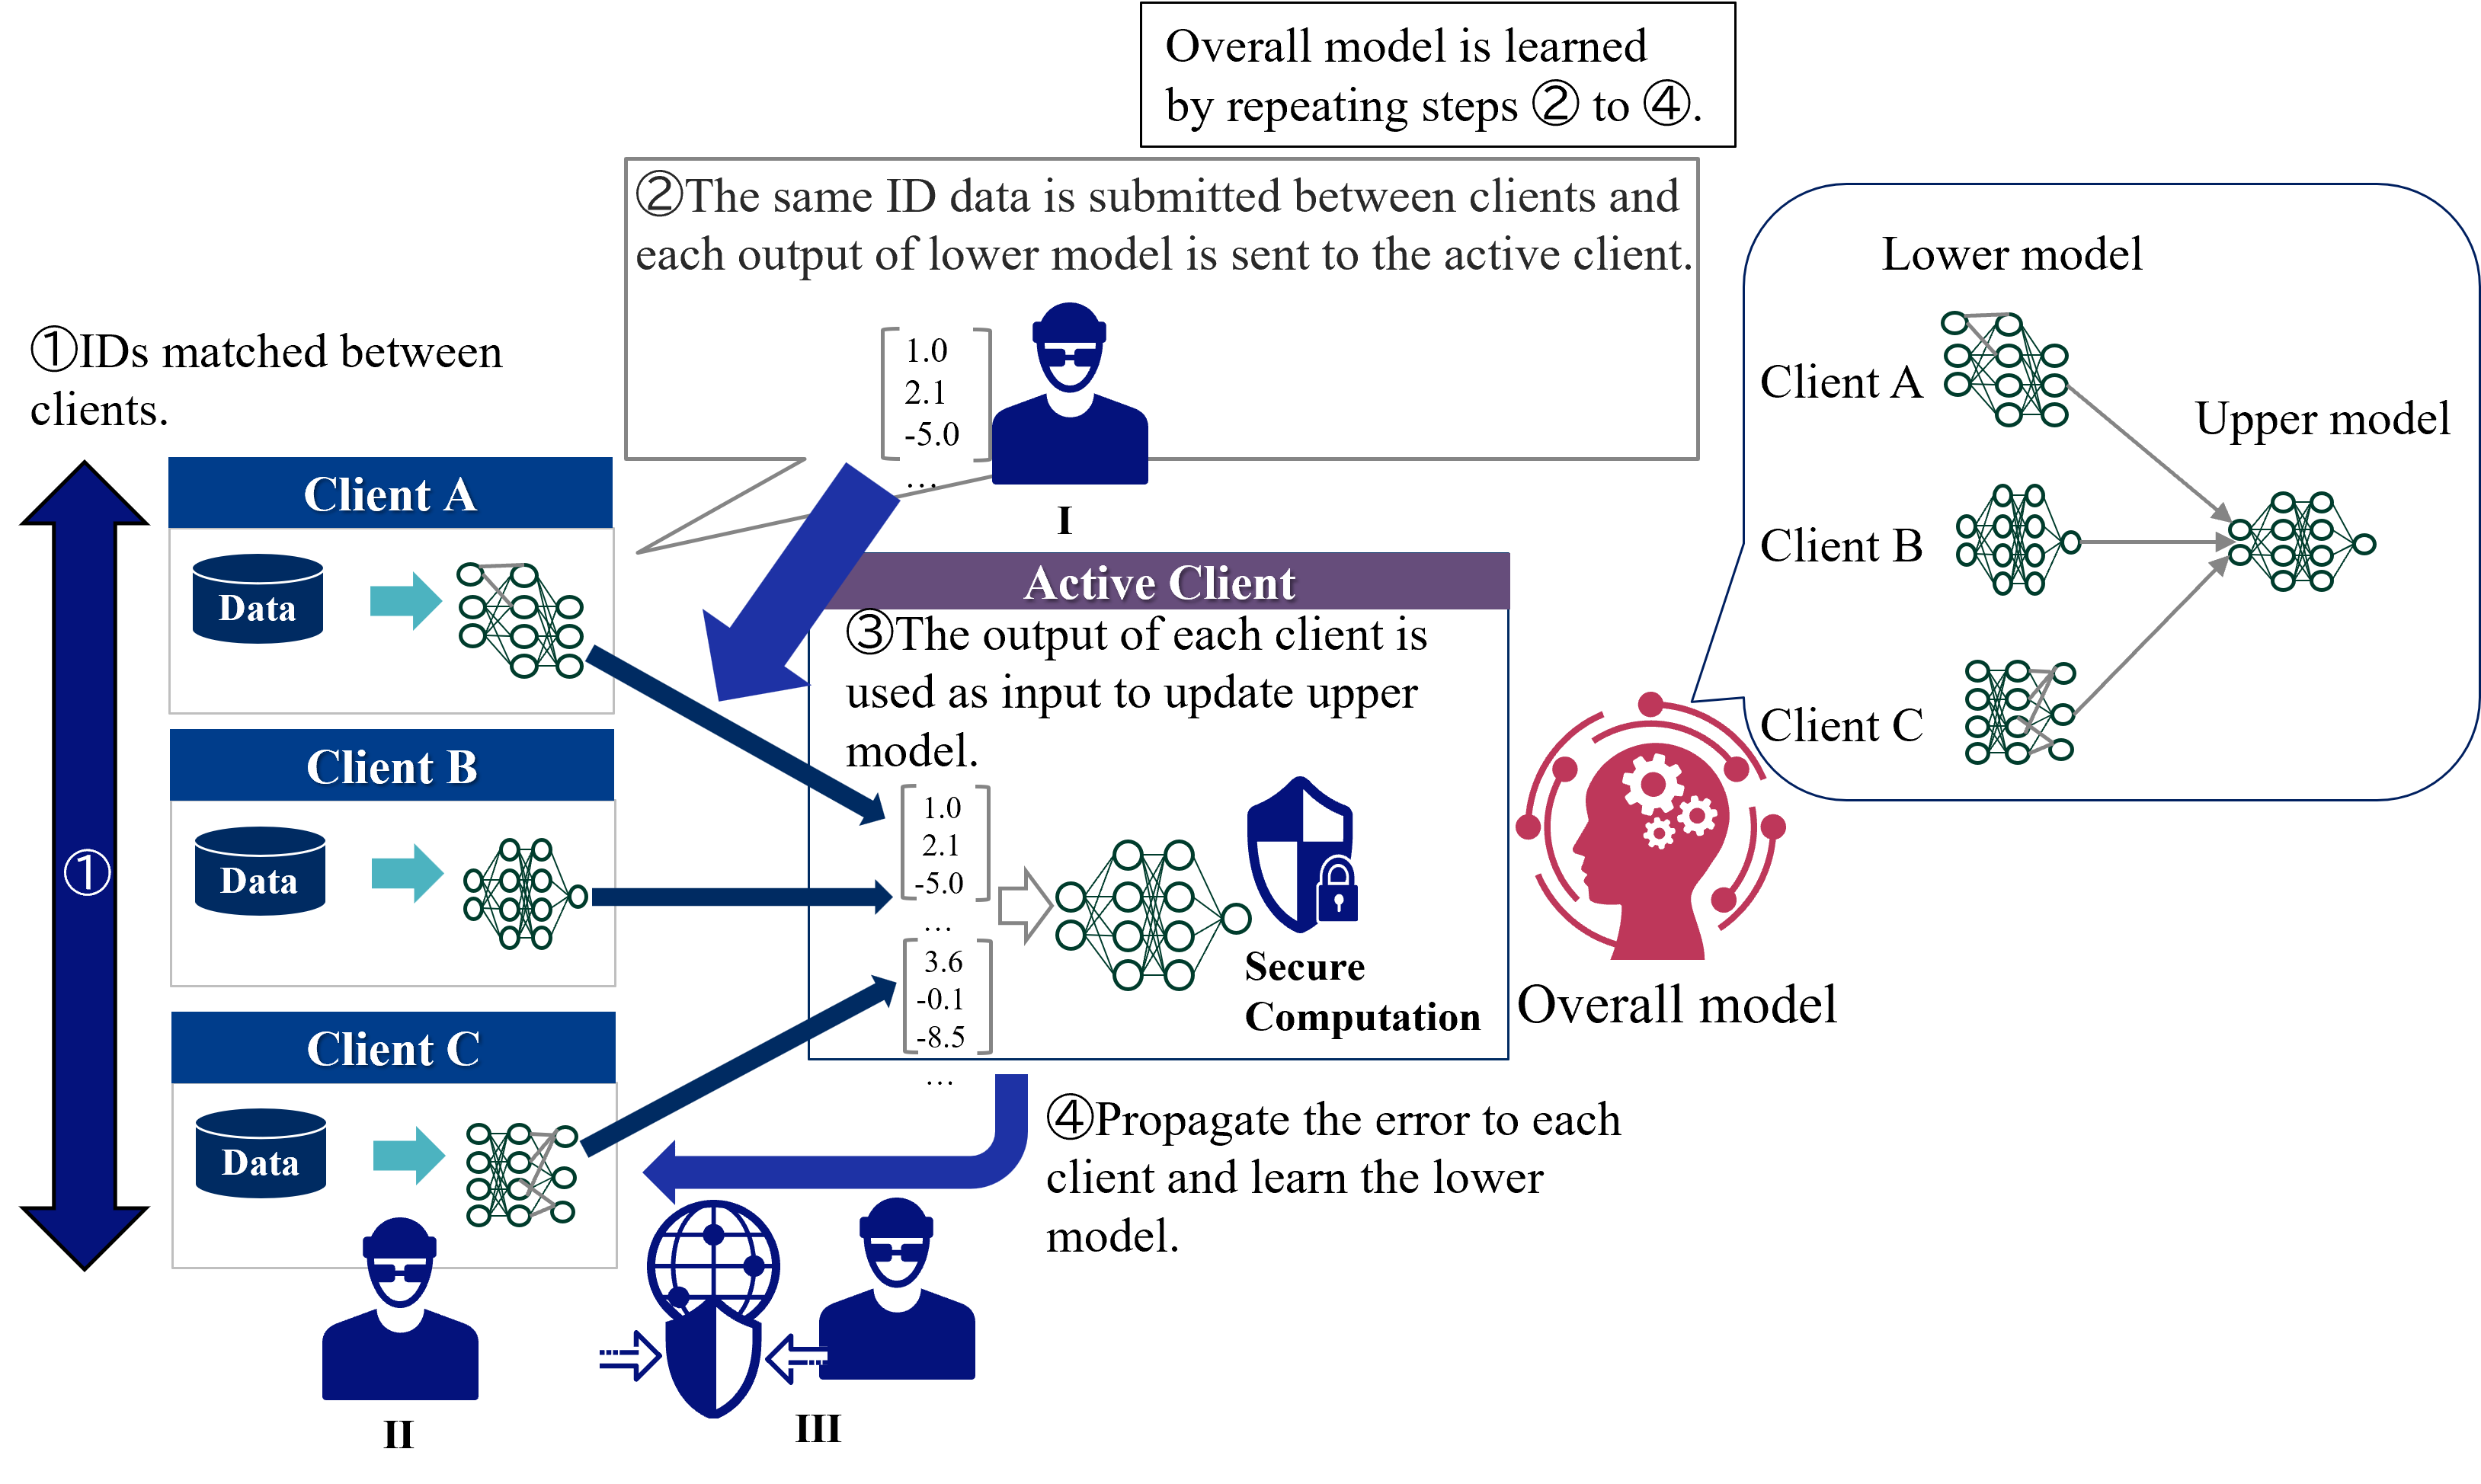
### Visual Description
## Technical Diagram: Federated Learning with Secure Computation
### Overview
The image is a technical diagram illustrating a multi-step, iterative process for training a federated machine learning model across multiple clients (Client A, Client B, Client C). The process involves matching client IDs, exchanging model outputs, updating a central "Upper model" via an "Active Client," and propagating errors back to update client-specific "Lower models." A key component is "Secure Computation," represented by a shield icon, indicating privacy-preserving operations. The overall model is learned by repeating steps ② to ④.
### Components/Elements
The diagram is segmented into several key regions and components:
**1. Header (Top Center):**
* A text box states: "Overall model is learned by repeating steps ② to ④."
**2. Main Diagram - Left Side (Client Column):**
* **Vertical Double-Headed Arrow (Labeled ①):** Positioned on the far left, spanning the height of the three client boxes. It is labeled with the circled number ① and the text "IDs matched between clients."
* **Client Boxes (A, B, C):** Three vertically stacked, identical blue-header boxes.
* **Client A:** Header text "Client A". Contains a blue cylinder labeled "Data" with a teal arrow pointing right to a neural network icon (a "Lower model").
* **Client B:** Header text "Client B". Same internal structure as Client A.
* **Client C:** Header text "Client C". Same internal structure as Client A.
* **Client Icons (Bottom Left):** Below the client boxes are three stylized human icons.
* Icon **II** is below Client C.
* Icon **III** is to the right of II, next to a globe/shield icon.
* A third, unlabeled icon is to the left of II.
**3. Main Diagram - Center (Process Flow & Active Client):**
* **Step ② Description (Top Center Box):** A text box reads: "②The same ID data is submitted between clients and each output of lower model is sent to the active client."
* **Data Vector (I):** Below the Step ② box, a vertical vector is shown: `[1.0, 2.1, -5.0, ...]`. It is labeled with the Roman numeral **I** and is associated with a blue human icon wearing glasses.
* **Active Client Box (Central Purple Box):** A large box with a purple header labeled "Active Client".
* **Step ③ Description:** Text inside reads: "③The output of each client is used as input to update upper model."
* **Input Data Vectors:** Three vectors are shown entering from the left, corresponding to outputs from Clients A, B, and C:
* Top vector: `[1.0, 2.1, -5.0, ...]` (matches vector I).
* Middle vector: `[3.6, -0.1, -8.5, ...]`.
* Bottom vector: `...` (ellipsis indicating continuation).
* **Neural Network & Secure Computation:** These vectors feed into a neural network icon. To its right is a blue shield icon with a padlock, labeled "Secure Computation".
* **Step ④ Description (Bottom Center):** Text reads: "④Propagate the error to each client and learn the lower model." A thick blue arrow curves from the "Secure Computation" output back towards the client column on the left.
**4. Main Diagram - Right Side (Model Architecture):**
* **Model Architecture Box:** A large rounded rectangle on the right.
* **"Lower model" Label:** At the top left inside the box.
* **Client-Specific Lower Models:** Three neural network icons are vertically aligned, labeled "Client A", "Client B", and "Client C".
* **"Upper model" Label:** At the top right inside the box.
* **Central Upper Model:** A single, larger neural network icon on the right.
* **Connections:** Gray arrows flow from each client's lower model icon to the central upper model icon, illustrating the aggregation of client outputs.
* **"Overall model" Label & Icon:** Below the model architecture box is a red silhouette of a human head with gears inside, labeled "Overall model".
### Detailed Analysis
The diagram explicitly details a four-step cyclic process:
1. **Step ① (ID Matching):** Clients (A, B, C) first align their datasets by matching user IDs. This is represented by the vertical arrow spanning the client column.
2. **Step ② (Data Submission & Lower Model Output):** Each client processes its local "Data" through its local "Lower model" neural network. The output vectors (e.g., `[1.0, 2.1, -5.0, ...]`) are sent to a designated "Active Client."
3. **Step ③ (Upper Model Update):** The "Active Client" collects the output vectors from all clients. These vectors serve as the input to update the central "Upper model." This update process is performed using "Secure Computation," ensuring privacy.
4. **Step ④ (Error Propagation & Lower Model Update):** The error from the updated upper model is propagated back to each individual client. Each client then uses this error signal to update its own local "Lower model."
The process is iterative, as stated in the header: "Overall model is learned by repeating steps ② to ④."
### Key Observations
* **Hierarchical Model Structure:** The architecture clearly separates client-specific "Lower models" from a centralized "Upper model." The "Overall model" is the composite result of this hierarchy.
* **Centralized Coordination via an "Active Client":** While the learning is federated, coordination and secure aggregation are handled by one client designated as "Active" for a given iteration.
* **Privacy-Preserving Mechanism:** The "Secure Computation" component (shield icon) is critically placed at the point where client data (in the form of model outputs) is aggregated to update the upper model, highlighting its role in protecting data privacy.
* **Bidirectional Data Flow:** The process involves a forward pass (client outputs to upper model) and a backward pass (error propagation from upper model to clients), mirroring backpropagation in a distributed setting.
* **Visual Consistency:** Neural network icons are used consistently to represent both lower and upper models. Blue arrows consistently indicate the primary flow of data and instructions.
### Interpretation
This diagram illustrates a **Vertical Federated Learning** or **Split Learning** paradigm. In this setup, different clients hold different features for the same set of users (enabled by Step ① ID matching). Each client's "Lower model" processes its private features into an intermediate representation (the output vectors). These representations, not the raw data, are sent to the "Active Client" and combined to train the "Upper model," which makes the final prediction.
The "Secure Computation" step is crucial; it implies techniques like homomorphic encryption, secure multi-party computation, or trusted execution environments are used to aggregate the client outputs without exposing them, thus preserving data privacy. The iterative nature (repeating steps ②-④) is how the entire distributed system converges to an optimal "Overall model."
The presence of multiple client icons (I, II, III) at the bottom may suggest different roles or instances across training rounds, with the "Active Client" role potentially rotating. The diagram effectively communicates a complex, privacy-conscious machine learning workflow, emphasizing the separation of data, the hierarchy of models, and the cyclic nature of distributed training.
</details>
Figure 11: Countermeasures against threads in case of output from clients.
### IV-C Federated Transfer Learning
In FTL, the threads to privacy depend on common information between clients [24]. We show how to respond in the case of each thread.
#### IV-C 1 Common Features
In case of common features, the threads to privacy are exchanges of feature analogy network and prediction network. Figure 12 shows countermeasures against threads in case of common features.
1. Client receiving a feature analogy network: Differential privacy makes it difficult to infer the model [37].
1. Client receiving a feature analogy network and prediction network: Differential privacy makes it difficult to infer the model.
1. Third party: Achieved by encryption of communication.
<details>
<summary>extracted/5379099/fig/CMCF_FTL.png Details</summary>
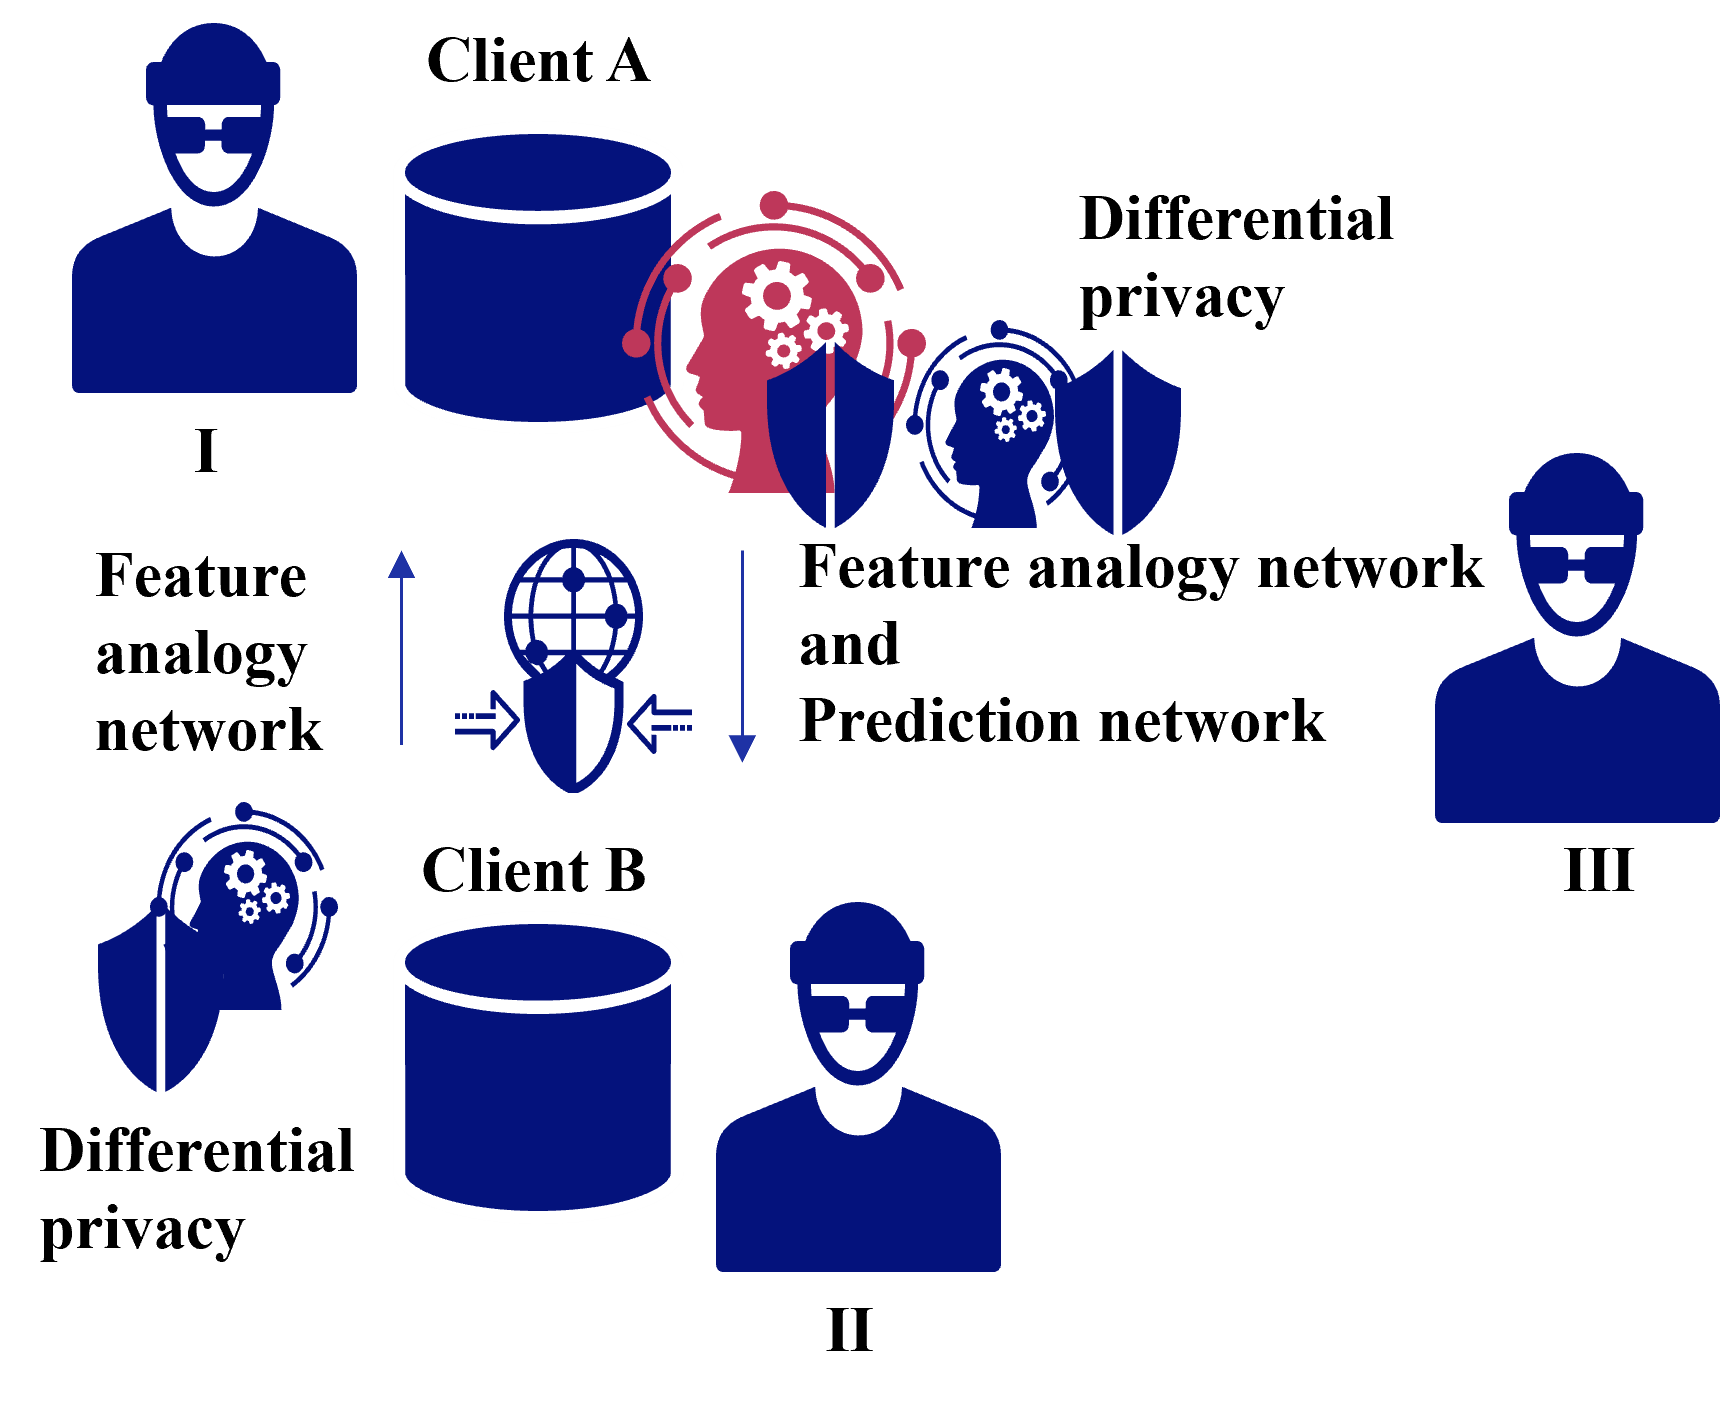
### Visual Description
## Diagram: Federated Learning System with Differential Privacy and Feature Analogy Networks
### Overview
The image is a technical diagram illustrating a multi-party machine learning system, likely a federated learning framework. It depicts two clients (Client A and Client B) and a central server or aggregator, with components for differential privacy and neural networks (Feature Analogy Network and Prediction Network). The diagram uses icons and text labels to show the flow of data and model components between entities.
### Components/Axes
The diagram is organized into three primary regions, labeled with Roman numerals:
**Region I (Top-Left):**
* **Entity:** A blue human icon labeled "Client A".
* **Data Store:** A blue cylinder icon representing a database, positioned to the right of the Client A icon.
* **Privacy Component:** A red icon depicting a human head silhouette with gears inside, surrounded by a circular network of nodes and lines. This is labeled "Differential privacy" to its right.
* **Network Component:** A blue icon of a human head silhouette with gears inside, protected by a shield. This is positioned to the right of the red differential privacy icon.
**Region II (Bottom-Center):**
* **Entity:** A blue human icon labeled "Client B".
* **Data Store:** A blue cylinder icon representing a database, positioned to the left of the Client B icon.
* **Privacy Component:** A blue icon depicting a human head silhouette with gears inside, protected by a shield. This is positioned to the left of the Client B database and is labeled "Differential privacy" below it.
**Region III (Right):**
* **Entity:** A blue human icon labeled "III". This likely represents a central server, aggregator, or another client.
**Central Network & Flow Components:**
* **Feature Analogy Network Label:** The text "Feature analogy network" appears twice. Once on the left side, between Regions I and II. Once on the right side, as part of a longer label.
* **Prediction Network Label:** The text "Prediction network" appears on the right side, below "Feature analogy network".
* **Combined Label:** The full text "Feature analogy network and Prediction network" is positioned in the center-right area.
* **Globe/Network Icon:** A blue globe icon with a grid pattern, overlaid with a shield. It has two horizontal arrows pointing towards it from the left and right, and two vertical arrows (one pointing up, one pointing down) on its left and right sides, respectively. This icon is centrally located between the left and right sides of the diagram.
### Detailed Analysis
The diagram illustrates a data and model flow between clients and a central entity, incorporating privacy-preserving techniques.
1. **Client A (Region I):** Possesses local data (database icon). It applies a "Differential privacy" mechanism (red icon) to its data or model updates. The output from this process is then processed by a "Feature analogy network" (blue shielded head icon).
2. **Client B (Region II):** Also possesses local data (database icon). It applies its own "Differential privacy" mechanism (blue shielded head icon) to its data or updates.
3. **Central Communication Hub:** The globe/shield icon in the center represents a secure communication channel or aggregation server. The horizontal arrows suggest bidirectional data flow between the clients (via their respective networks) and this central hub. The vertical arrows may indicate the upload of local updates and the download of a global model.
4. **Central Entity (Region III):** Labeled "III", this entity is connected to the central hub. The label "Feature analogy network and Prediction network" is placed near it, suggesting this entity hosts or manages these global network components. The flow implies that processed updates from clients are aggregated here, and a global model (incorporating the Feature Analogy and Prediction networks) is distributed back.
**Text Transcription (All text is in English):**
* Client A
* I
* Feature analogy network
* Differential privacy
* Feature analogy network and Prediction network
* Client B
* II
* Differential privacy
* III
### Key Observations
* **Asymmetric Privacy Icons:** The "Differential privacy" component for Client A is red and lacks a shield, while for Client B it is blue and includes a shield. This could indicate different privacy algorithms, different stages of application (e.g., noise addition vs. secure aggregation), or simply a visual distinction.
* **Network Component Placement:** The "Feature analogy network" icon (blue shielded head) is shown as part of Client A's pipeline but is also referenced in the central label associated with Entity III. This suggests it is a shared model component.
* **Centralized Architecture:** The diagram follows a star topology, with clients (I and II) communicating through a central hub (globe icon) to a main server/aggregator (III).
* **Lack of Explicit Data Flow Lines:** While arrows indicate general communication directions, specific lines connecting icons (e.g., from Client A's database to its differential privacy icon) are not drawn, leaving the exact sequence of operations to be inferred.
### Interpretation
This diagram represents a **privacy-preserving federated learning system**. The core idea is to train a machine learning model across multiple decentralized clients (Client A and Client B) holding local data, without sharing the raw data.
* **Differential Privacy (DP):** This is a key privacy technique. The presence of DP icons at each client indicates that local data or model updates are being perturbed with statistical noise before being shared. This protects the confidentiality of individual data points within each client's dataset. The different visual styles for Client A and B might imply heterogeneous privacy requirements or methods.
* **Feature Analogy Network & Prediction Network:** These are likely the core neural network architectures being trained. The "Feature analogy network" may be responsible for learning invariant representations or mappings between features across different clients' data distributions (addressing data heterogeneity). The "Prediction network" performs the final task (e.g., classification). The fact that they are labeled centrally suggests they form the global model that is iteratively updated by aggregating the differentially private updates from all clients.
* **Workflow:** The inferred workflow is: 1) Each client trains the global model locally on its private data. 2) They apply differential privacy to their model updates (gradients). 3) The privatized updates are sent securely (via the globe/shield channel) to the central server (III). 4) The server aggregates these updates (e.g., via federated averaging) to improve the global Feature Analogy and Prediction Networks. 5) The updated global model is sent back to the clients for the next training round.
* **Purpose:** The system aims to achieve two goals simultaneously: **collaborative learning** (improving a shared model by leveraging diverse data from multiple sources) and **privacy preservation** (ensuring no client's raw data can be reverse-engineered from the shared updates, thanks to differential privacy). This is crucial in domains like healthcare or finance where data sensitivity is paramount.
</details>
Figure 12: Countermeasures against threads in case of common features.
#### IV-C 2 Common IDs
In case of common IDs, the threads to privacy are the leakage of identities and information required for feature similarity [24]. For the leakage of identities, Dummy IDs are prepared in addition to the original IDs as shown in Section IV-B 1 [39]. For information required for feature similarity, figure 13 shows countermeasures against threads in case of common IDs.
1. Client receiving information for feature similarity: Difficult to guess information due to secure computation [35].
1. Third party: Achieved by encryption of communication.
<details>
<summary>extracted/5379099/fig/CMCI_FTL.png Details</summary>
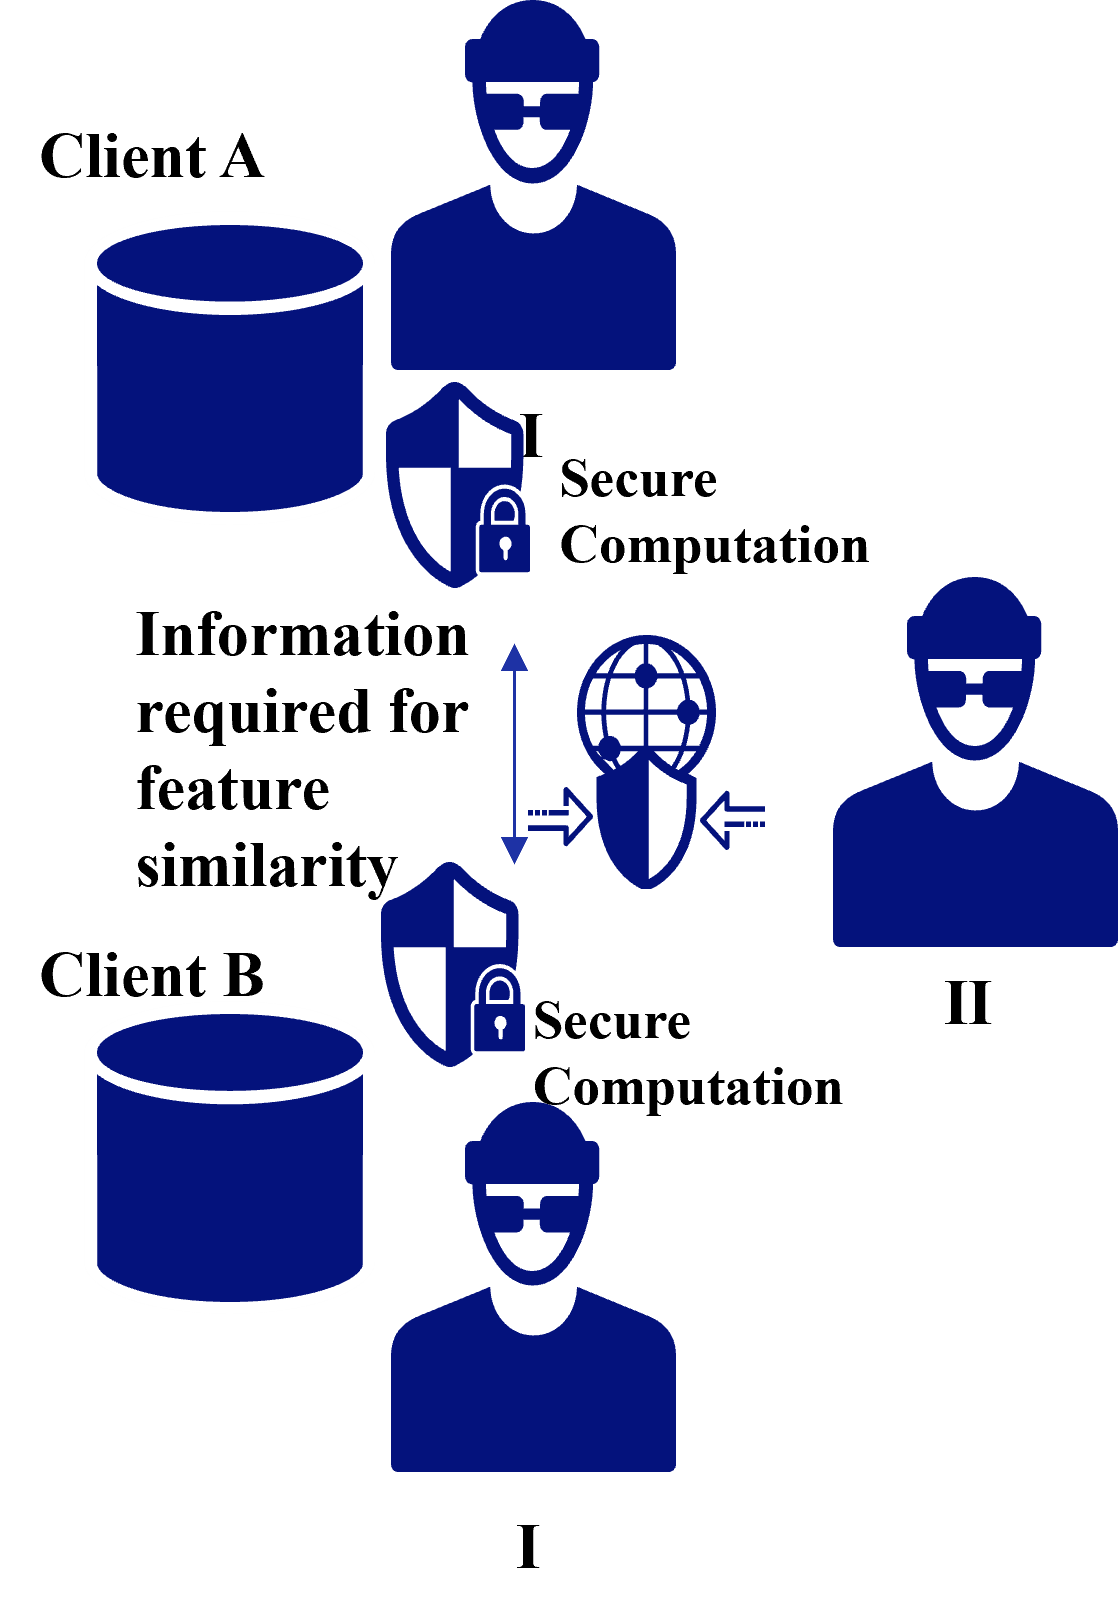
### Visual Description
## Diagram: Secure Multi-Party Computation for Feature Similarity
### Overview
The image is a conceptual diagram illustrating a secure computation protocol between two distinct clients (Client A and Client B) to determine feature similarity without directly sharing their underlying data. The process involves local secure computation at each client and a mediated, secure exchange of information through a central entity.
### Components/Axes
The diagram is composed of several key visual components, all rendered in a dark blue color on a light gray background.
**1. Client Entities:**
* **Client A (Top-Left):** Represented by a person icon (labeled "I") and a cylindrical database icon.
* **Client B (Bottom-Left):** Represented by a person icon (labeled "I") and a cylindrical database icon.
* **Central Entity (Right):** Represented by a person icon (labeled "II") and a composite icon of a globe overlaid with a shield.
**2. Process Labels & Icons:**
* **"Secure Computation" (Appears twice):** This text is placed next to a shield icon containing a padlock. One instance is positioned between Client A's database and the central entity. The second instance is positioned between Client B's database and the central entity.
* **"Information required for feature similarity" (Center-Left):** This block of text describes the data being exchanged. It is connected by a vertical, double-headed arrow to the central globe/shield icon.
* **Shield with Padlock Icon:** Appears twice, associated with the "Secure Computation" label for each client.
* **Globe with Shield Icon (Center-Right):** Represents the central, secure communication or computation channel. It has two horizontal, dashed arrows pointing inward from the left and right, indicating bidirectional data flow into this secure channel.
**3. Labels:**
* **"I" (Roman Numeral):** Appears below the person icon for Client A and below the person icon for Client B.
* **"II" (Roman Numeral):** Appears below the person icon for the central entity on the right.
### Detailed Analysis
The diagram depicts a specific workflow:
1. **Local Processing:** Both Client A and Client B perform "Secure Computation" on their own local data (represented by their respective databases). This is indicated by the shield/padlock icon next to each client's data store.
2. **Information Exchange:** The core requirement for the process is identified as "Information required for feature similarity." This information is not the raw data itself but a derived, secure representation.
3. **Secure Mediation:** This required information is exchanged through a central, secure channel represented by the globe/shield icon. The dashed arrows pointing into this icon from both sides signify that both clients contribute information to this secure environment.
4. **Role Distinction:** The labels "I" and "II" suggest a distinction in roles. Clients A and B are both role "I" (data holders/participants), while the entity on the right is role "II" (likely a coordinator, aggregator, or trusted execution environment).
### Key Observations
* **Symmetry:** The setup for Client A and Client B is visually symmetrical, indicating they perform analogous roles in the protocol.
* **Security Emphasis:** The repeated use of shield and padlock icons, along with the explicit label "Secure Computation," highlights that privacy and data security are the primary concerns of this architecture.
* **Abstraction:** The diagram is high-level and abstract. It does not specify the cryptographic techniques (e.g., homomorphic encryption, secure multi-party computation, federated learning) used to achieve "Secure Computation."
* **Data Flow:** The flow is not directly between Client A and Client B. Instead, both clients interact with a central secure entity (II), which likely facilitates the computation without having access to the raw data.
### Interpretation
This diagram illustrates a privacy-preserving framework for collaborative data analysis. The core problem it solves is how two parties (Client A and B) can jointly compute a similarity metric on their respective feature sets without revealing the sensitive raw data to each other or to a central server.
The "Information required for feature similarity" is the critical, privacy-protected output of each client's local secure computation. This could be encrypted data, model gradients, or other cryptographic shares. The central entity (II) acts as a secure aggregator or computation node that combines these protected inputs to calculate the final similarity result.
The architecture suggests a scenario common in fields like healthcare (comparing patient data across hospitals), finance (fraud detection across banks), or competitive business analytics, where collaboration is valuable but data sharing is restricted by regulation, privacy, or competition. The diagram emphasizes a solution where trust is minimized through cryptographic security ("Secure Computation") and a structured, mediated communication flow.
</details>
Figure 13: Countermeasures against threads in case of common IDs.
## V Conclusion
In this paper, we have described privacy threats and countermeasures for federated learning in terms of HFL, VFL, and FTL. Privacy measures for federated learning include differential privacy to reduce the leakage of training data from the model, secure computation to keep the model computation process secret between clients and servers, encryption of communications to prevent information leakage to third parties, and ID dummying to prevent ID leakage.
## Acknowledgment
This R&D includes the results of ” Research and development of optimized AI technology by secure data coordination (JPMI00316)” by the Ministry of Internal Affairs and Communications (MIC), Japan.
## References
- [1] L. Lyu, H. Yu, and Q. Yang, “Threats to federated learning: A survey,” arXiv preprint arXiv:2003.02133, 2020.
- [2] Q. Yang, Y. Liu, T. Chen, and Y. Tong, “Federated machine learning: Concept and applications,” ACM Trans. Intell. Syst. Technol., vol. 10, no. 2, 2019.
- [3] B. McMahan, E. Moore, D. Ramage, S. Hampson, and B. A. y. Arcas, “Communication-Efficient Learning of Deep Networks from Decentralized Data,” in Proceedings of the 20th International Conference on Artificial Intelligence and Statistics, ser. Proceedings of Machine Learning Research, vol. 54. PMLR, 2017, pp. 1273–1282.
- [4] E. T. Martínez Beltrán, M. Q. Pérez, P. M. S. Sánchez, S. L. Bernal, G. Bovet, M. G. Pérez, G. M. Pérez, and A. H. Celdrán, “Decentralized federated learning: Fundamentals, state of the art, frameworks, trends, and challenges,” IEEE Communications Surveys & Tutorials, vol. 25, no. 4, pp. 2983–3013, 2023.
- [5] L. Zhao, L. Ni, S. Hu, Y. Chen, P. Zhou, F. Xiao, and L. Wu, “Inprivate digging: Enabling tree-based distributed data mining with differential privacy,” in IEEE INFOCOM 2018 - IEEE Conference on Computer Communications, 2018, pp. 2087–2095.
- [6] Q. Li, Z. Wen, and B. He, “Practical federated gradient boosting decision trees,” Proceedings of the AAAI Conference on Artificial Intelligence, vol. 34, no. 04, pp. 4642–4649, 2020.
- [7] F. Wang, J. Ou, and H. Lv, “Gradient boosting forest: a two-stage ensemble method enabling federated learning of gbdts,” in Neural Information Processing, T. Mantoro, M. Lee, M. A. Ayu, K. W. Wong, and A. N. Hidayanto, Eds. Cham: Springer International Publishing, 2021, pp. 75–86.
- [8] A. Gascón, P. Schoppmann, B. Balle, M. Raykova, J. Doerner, S. Zahur, and D. Evans, “Secure linear regression on vertically partitioned datasets,” IACR Cryptol. ePrint Arch., vol. 2016, p. 892, 2016.
- [9] S. Hardy, W. Henecka, H. Ivey-Law, R. Nock, G. Patrini, G. Smith, and B. Thorne, “Private federated learning on vertically partitioned data via entity resolution and additively homomorphic encryption,” CoRR, vol. abs/1711.10677, 2017.
- [10] R. Nock, S. Hardy, W. Henecka, H. Ivey-Law, G. Patrini, G. Smith, and B. Thorne, “Entity resolution and federated learning get a federated resolution,” CoRR, vol. abs/1803.04035, 2018.
- [11] S. Yang, B. Ren, X. Zhou, and L. Liu, “Parallel distributed logistic regression for vertical federated learning without third-party coordinator,” CoRR, vol. abs/1911.09824, 2019.
- [12] Q. Zhang, B. Gu, C. Deng, and H. Huang, “Secure bilevel asynchronous vertical federated learning with backward updating,” Proceedings of the AAAI Conference on Artificial Intelligence, vol. 35, no. 12, pp. 10 896–10 904, May 2021.
- [13] K. Cheng, T. Fan, Y. Jin, Y. Liu, T. Chen, D. Papadopoulos, and Q. Yang, “Secureboost: A lossless federated learning framework,” IEEE Intelligent Systems, vol. 36, no. 6, pp. 87–98, 2021.
- [14] J. Vaidya, C. Clifton, M. Kantarcioglu, and A. S. Patterson, “Privacy-preserving decision trees over vertically partitioned data,” ACM Trans. Knowl. Discov. Data, vol. 2, no. 3, oct 2008.
- [15] Y. Wu, S. Cai, X. Xiao, G. Chen, and B. C. Ooi, “Privacy preserving vertical federated learning for tree-based models,” Proc. VLDB Endow., vol. 13, no. 12, p. 2090–2103, jul 2020.
- [16] Y. Liu, Y. Liu, Z. Liu, Y. Liang, C. Meng, J. Zhang, and Y. Zheng, “Federated forest,” IEEE Transactions on Big Data, pp. 1–1, 2020.
- [17] Z. Tian, R. Zhang, X. Hou, J. Liu, and K. Ren, “Federboost: Private federated learning for GBDT,” CoRR, vol. abs/2011.02796, 2020.
- [18] Y. Hu, D. Niu, J. Yang, and S. Zhou, “Fdml: A collaborative machine learning framework for distributed features,” in Proceedings of the 25th ACM SIGKDD International Conference on Knowledge Discovery & Data Mining, ser. KDD ’19. New York, NY, USA: Association for Computing Machinery, 2019, p. 2232–2240.
- [19] Y. Liu, Y. Kang, X. Zhang, L. Li, Y. Cheng, T. Chen, M. Hong, and Q. Yang, “A communication efficient collaborative learning framework for distributed features,” CoRR, vol. abs/1912.11187, 2019.
- [20] D. Romanini, A. J. Hall, P. Papadopoulos, T. Titcombe, A. Ismail, T. Cebere, R. Sandmann, R. Roehm, and M. A. Hoeh, “Pyvertical: A vertical federated learning framework for multi-headed splitnn,” CoRR, vol. abs/2104.00489, 2021.
- [21] Q. He, W. Yang, B. Chen, Y. Geng, and L. Huang, “Transnet: Training privacy-preserving neural network over transformed layer,” Proc. VLDB Endow., vol. 13, no. 12, p. 1849–1862, jul 2020.
- [22] B. Gu, Z. Dang, X. Li, and H. Huang, “Federated doubly stochastic kernel learning for vertically partitioned data,” in Proceedings of the 26th ACM SIGKDD International Conference on Knowledge Discovery & Data Mining. New York, NY, USA: Association for Computing Machinery, 2020, p. 2483–2493.
- [23] R. Xu, N. Baracaldo, Y. Zhou, A. Anwar, J. Joshi, and H. Ludwig, “Fedv: Privacy-preserving federated learning over vertically partitioned data,” CoRR, vol. abs/2103.03918, 2021.
- [24] Y. Liu, Y. Kang, C. Xing, T. Chen, and Q. Yang, “A secure federated transfer learning framework,” IEEE Intelligent Systems, vol. 35, no. 4, pp. 70–82, 2020.
- [25] S. Sharma, C. Xing, Y. Liu, and Y. Kang, “Secure and efficient federated transfer learning,” in 2019 IEEE International Conference on Big Data (Big Data), 2019, pp. 2569–2576.
- [26] B. Zhang, C. Chen, and L. Wang, “Privacy-preserving transfer learning via secure maximum mean discrepancy,” arXiv preprint arXiv:2009.11680, 2020.
- [27] Y. Gao, M. Gong, Y. Xie, A. K. Qin, K. Pan, and Y.-S. Ong, “Multiparty dual learning,” IEEE Transactions on Cybernetics, vol. 53, no. 5, pp. 2955–2968, 2023.
- [28] D. Gao, Y. Liu, A. Huang, C. Ju, H. Yu, and Q. Yang, “Privacy-preserving heterogeneous federated transfer learning,” in 2019 IEEE International Conference on Big Data (Big Data), 2019, pp. 2552–2559.
- [29] J. Mori, I. Teranishi, and R. Furukawa, “Continual horizontal federated learning for heterogeneous data,” in 2022 International Joint Conference on Neural Networks (IJCNN), 2022, pp. 1–8.
- [30] D. Gao, C. Ju, X. Wei, Y. Liu, T. Chen, and Q. Yang, “Hhhfl: Hierarchical heterogeneous horizontal federated learning for electroencephalography,” arXiv preprint arXiv:1909.05784, 2019.
- [31] A. Rakotomamonjy, M. Vono, H. J. M. Ruiz, and L. Ralaivola, “Personalised federated learning on heterogeneous feature spaces,” arXiv preprint arXiv:2301.11447, 2023.
- [32] E. Hallaji, R. Razavi-Far, and M. Saif, Federated and Transfer Learning: A Survey on Adversaries and Defense Mechanisms. Cham: Springer International Publishing, 2023, pp. 29–55.
- [33] S. Hardy, W. Henecka, H. Ivey-Law, R. Nock, G. Patrini, G. Smith, and B. Thorne, “Private federated learning on vertically partitioned data via entity resolution and additively homomorphic encryption,” arXiv preprint arXiv:1711.10677, 2017.
- [34] K. Bonawitz, V. Ivanov, B. Kreuter, A. Marcedone, H. B. McMahan, S. Patel, D. Ramage, A. Segal, and K. Seth, “Practical secure aggregation for privacy-preserving machine learning,” in Proceedings of the 2017 ACM SIGSAC Conference on Computer and Communications Security, ser. CCS ’17. New York, NY, USA: Association for Computing Machinery, 2017, p. 1175–1191.
- [35] P. Mohassel and Y. Zhang, “Secureml: A system for scalable privacy-preserving machine learning,” in 2017 IEEE Symposium on Security and Privacy (SP), 2017, pp. 19–38.
- [36] T. Araki, J. Furukawa, Y. Lindell, A. Nof, and K. Ohara, “High-throughput semi-honest secure three-party computation with an honest majority,” in Proceedings of the 2016 ACM SIGSAC Conference on Computer and Communications Security, ser. CCS ’16. New York, NY, USA: Association for Computing Machinery, 2016, p. 805–817.
- [37] M. Abadi, A. Chu, I. Goodfellow, H. B. McMahan, I. Mironov, K. Talwar, and L. Zhang, “Deep learning with differential privacy,” in Proceedings of the 2016 ACM SIGSAC Conference on Computer and Communications Security, ser. CCS ’16. New York, NY, USA: Association for Computing Machinery, 2016, p. 308–318.
- [38] R. C. Geyer, T. Klein, and M. Nabi, “Differentially private federated learning: A client level perspective,” arXiv preprint arXiv:1712.07557, 2017.
- [39] Y. Liu, X. Zhang, and L. Wang, “Asymmetrical vertical federated learning,” arXiv preprint arXiv:2004.07427, 2020.