# INSIDE: LLMs’ Internal States Retain the Power of Hallucination Detection
**Authors**:
- Zhihang Fu, Jieping Ye (Alibaba Cloud Zhejiang University)
> Corresponding Author
Abstract
Knowledge hallucination have raised widespread concerns for the security and reliability of deployed LLMs. Previous efforts in detecting hallucinations have been employed at logit-level uncertainty estimation or language-level self-consistency evaluation, where the semantic information is inevitably lost during the token-decoding procedure. Thus, we propose to explore the dense semantic information retained within LLMs’ IN ternal S tates for halluc I nation DE tection (INSIDE). In particular, a simple yet effective EigenScore metric is proposed to better evaluate responses’ self-consistency, which exploits the eigenvalues of responses’ covariance matrix to measure the semantic consistency/diversity in the dense embedding space. Furthermore, from the perspective of self-consistent hallucination detection, a test time feature clipping approach is explored to truncate extreme activations in the internal states, which reduces overconfident generations and potentially benefits the detection of overconfident hallucinations. Extensive experiments and ablation studies are performed on several popular LLMs and question-answering (QA) benchmarks, showing the effectiveness of our proposal. Code is available at https://github.com/alibaba/eigenscore
1 Introduction
Large Language Models (LLMs) have recently achieved a milestone breakthrough and demonstrated impressive abilities in various applications (Ouyang et al., 2022; OpenAI, 2023). However, it has been widely observed that even the state-of-the-art LLMs often make factually incorrect or nonsense generations (Cohen et al., 2023; Ren et al., 2022; Kuhn et al., 2022), which is also known as knowledge hallucination (Ji et al., 2023). The potentially unreliable generations make it risky to deploy LLMs in practical scenarios. Therefore, hallucination detection, that is, accurately detecting and rejecting responses when hallucinations occur in LLMs, has attracted more and more attention from the academic community (Azaria & Mitchell, 2023; Ren et al., 2022; Kuhn et al., 2022).
The token-level uncertainty estimation (e.g., predictive confidence or entropy) has shown its efficacy in hallucination detection on conventional NLP tasks (Malinin & Gales, 2020; Huang et al., 2023). However, how to derive the sentence-level uncertainty from the token-level remains a challenge, especially for modern auto-regressive LLMs whose response contents are generally diverse and sophisticated (Malinin & Gales, 2020; Kuhn et al., 2022; Duan et al., 2023). Thus, to avoid complicated token-to-sentence uncertainty derivation, researchers propose to evaluate the sentence uncertainty by the output languages directly (Kadavath et al., 2022; Yin et al., 2023; Zhou et al., 2023). Among the recent advancements, prompting LLMs to generate multiple responses to the same question and evaluating the self-consistency of those responses has been proven effective in hallucination detection (Wang et al., 2022; Shi et al., 2022). However, such a post-hoc semantic measurement on decoded language sentences is inferior to precisely modeling the logical consistency/divergence Manakul et al. (2023); Zhang et al. (2023).
Hence, instead of logit-level or language-level uncertainty estimation, this paper proposes to leverage the internal states of LLMs to conduct hallucination detection. The motivation is intuitive: LLMs preserve the highly-concentrated semantic information of the entire sentence within their internal states (Azaria & Mitchell, 2023), allowing for the direct detection of hallucinated responses in the sentence embedding space.
In particular, with the generalized framework of IN ternal S tates for halluc I nation DE tection (INSIDE), this paper performs hallucination detection from two perspectives. First, skipping secondary semantic extraction via extra models, we directly measure the self-consistency/divergence of the output sentences using internal states of LLMs. In order to explore semantic consistency in the embedding space, Section 3.1 introduces an EigenScore metric regarding the eigenvalues of sentence embeddings’ covariance matrix. Second, to handle the self-consistent (overconfident) hallucinations, we propose to rectify abnormal activations of the internal states. Specifically, Section 3.2 develops a feature clipping approach to truncate extreme features, which tends to prevent overconfident generations during the auto-regressive procedure. In Section 4, the effectiveness of our method is validated through extensive experiments on several well-established QA benchmarks.
The main contributions of our work are as follows:
- We propose a generalized INSIDE framework that leverages the internal states of LLMs to perform hallucination detection.
- We develop an EigenScore metric to measure the semantic consistency in the embedding space, and demonstrate that the proposed EigenScore represents the differential entropy in the sentence embedding space.
- A test time feature clipping approach is introduced to truncate extreme activations in the feature space, which implicitly reduces overconfident generations and helps identify the overconfident hallucinations.
- We achieve state-of-the-art hallucination detection performance on several QA benchmarks, and conduct extensive ablation studies to verify the efficacy of our method.
2 Background on Hallucination Detection
In this work, we mainly focus on the knowledge hallucination detection of natural language generation based on LLMs, especially for Q&A task (Reddy et al., 2019; Kwiatkowski et al., 2019). Given an input context $\bm{x}$ , a typical LLM (Zhang et al., 2022; Touvron et al., 2023a) parameterized with $\bm{\theta}$ is able to generate output sequences in autoregressive manner $y_{t}=f(\bm{x},y_{1},y_{2},·s,y_{t-1}|\bm{\theta})$ , where $\bm{y}=[y_{1},y_{2},·s,y_{T}]$ denotes the output sequence and $y_{t}$ denotes the t- $th$ output token. We denote $p(y_{t}|y_{<t},\bm{x})$ the Maximum Softmax Probability (MSP) of $t$ -th token. For a traditional classification model, the MSP measures the confidence level of the classification result and has been widely used as an uncertainty measure of predictions (Hendrycks & Gimpel, 2016). Therefore, for sequence generation task, a straightforward sequence uncertainty can be defined as the joint probability of different tokens, which is known as Perplexity (Ren et al., 2022),
$$
P(\bm{y}|\bm{x},\bm{\theta})=-\frac{1}{T}\log\prod_{t}p(y_{t}|y_{<t},\bm{x})=-%
\frac{1}{T}\sum_{t}\log p(y_{t}|y_{<t},\bm{x}) \tag{1}
$$
As shorter sequences generally have lower perplexity, the length of the output sequence $T$ is utilized to normalize the joint probability. Since different tokens contribute differently to the semantics of the sentence (Raj et al., 2023; Duan et al., 2023), the perplexity defined by averaging token-level uncertainty cannot effectively capture the uncertainty of the entire sequence. It has been demonstrated that utilizing multiple generations for one input is beneficial to estimate the sequence-level uncertainty (Malinin & Gales, 2020; Kuhn et al., 2022; Manakul et al., 2023). We denote $\mathcal{Y}=[\bm{y}^{1},\bm{y}^{2},·s,\bm{y}^{K}]$ as $K$ generated responses for input context $\bm{x}$ . For a given LLM, multiple responses could be easily obtained by the top-p/top-k sampling strategy during inference time (Touvron et al., 2023a; Kadavath et al., 2022). In Malinin & Gales (2020), the Length Normalized Entropy is proposed to measure the sequence-level uncertainty by making use of multiple generations, which is defined as
$$
H(\mathcal{Y}|\bm{x},\bm{\theta})=-\mathbb{E}_{\bm{y}\in\mathcal{Y}}\frac{1}{T%
_{\bm{y}}}\sum_{t}\log p(y_{t}|y_{<t},\bm{x}) \tag{2}
$$
When a model is uncertain about its response, it generates hallucination context, resulting in an answer distribution with a high entropy (Kadavath et al., 2022). It has been shown that the length-normalized entropy performs better than the non-normalized one (Lin et al., 2023).
In addition to the predictive uncertainty or entropy, the semantic consistency (Lin et al., 2023; Raj et al., 2023) among multiple responses has also been widely explored to measure the hallucination degree of LLMs, which hypothesis that the LLMs are expected to generate similar outputs if they know the input context and they are sure about the answers (Wang et al., 2022; Manakul et al., 2023). An intuitive semantic consistency metric is Lexical Similarity (Lin et al., 2022; 2023), which explores the average similarity across multiple answers as consistency measure
$$
S(\mathcal{Y}|\bm{x},\bm{\theta})=\frac{1}{C}\sum_{i=1}^{K}\sum_{j=i+1}^{K}sim%
(\bm{y}^{i},\bm{y}^{j}) \tag{3}
$$
where $C=K·(K-1)/2$ and $sim(·,·)$ is the similarity defined by Rouge-L Lin (2004).
3 Method
<details>
<summary>x1.png Details</summary>
### Visual Description
## Diagram: LLM Question Answering Process
### Overview
The image is a diagram illustrating the process of a Language Model (LLM) answering a question. It shows the flow of information from the input question, through the LLM's internal components, to the final output. The diagram includes decision-making based on an "EigenScore" to determine if the LLM can provide a supported answer.
### Components/Axes
* **Input:** A rounded rectangle labeled "Input" containing the question: "Q: On what date in 1969 did Neil Armstrong first set foot on the Moon?".
* **LLM:** A rounded rectangle labeled "LLM" containing the following components:
* FC Layer (Fully Connected Layer)
* Feature Clip
* Decoder
* Input Tokens (represented by gray rectangles)
* **Embedding of answer 1:** A series of connected purple rectangles.
* **Embedding of answer 2:** A series of connected orange rectangles.
* **Embedding of answer K:** A series of connected yellow rectangles.
* **Eigenvector:** A blue rounded rectangle containing a matrix of embeddings and three vectors (orange, blue, and green) labeled "Eigenvector".
* **High EigenScore?:** A diamond shape colored orange, used as a decision point.
* **Output (Top):** A rounded rectangle labeled "Output" containing the answer: "The answer is 20th July.".
* **Output (Bottom):** A rounded rectangle labeled "Output" containing the statement: "Sorry we don't support answer for this question.".
* **Legend (Bottom):**
* Token Embedding (light yellow rectangle)
* Current Token Embedding (light orange rectangle)
* Output Logit (light pink rectangle)
* Sentence Embedding (black outlined rectangle)
### Detailed Analysis or ### Content Details
1. **Input:** The input question is "On what date in 1969 did Neil Armstrong first set foot on the Moon?".
2. **LLM Processing:**
* The input tokens are fed into the Decoder.
* The Decoder's output is processed by the Feature Clip and FC Layer.
3. **Answer Embeddings:** The LLM generates multiple answer embeddings (1, 2, ..., K), represented by sequences of colored rectangles (purple, orange, yellow).
4. **Eigenvector Calculation:** The answer embeddings are combined and processed to calculate an Eigenvector.
5. **Decision Point:** The EigenScore is evaluated.
* If the EigenScore is high ("Yes"), the LLM outputs "Sorry we don't support answer for this question.".
* If the EigenScore is not high ("No"), the LLM outputs "The answer is 20th July.".
### Key Observations
* The diagram illustrates a question-answering system using an LLM.
* The LLM processes the input question and generates multiple potential answers.
* An Eigenvector is calculated based on the answer embeddings.
* The EigenScore is used to determine if the LLM can provide a supported answer.
* If the EigenScore is not high, the LLM provides an answer. If it is high, the LLM indicates that it cannot support the question.
### Interpretation
The diagram depicts a system where an LLM attempts to answer a question. The use of an EigenScore suggests a confidence or relevance metric. If the LLM is confident in its answer (low EigenScore), it provides the answer. If the LLM is not confident (high EigenScore), it declines to answer, indicating a mechanism for avoiding incorrect or unsupported responses. The "Sorry we don't support answer for this question" output suggests a fallback mechanism when the LLM's confidence in its answer is low. The diagram highlights the complexity of question-answering systems, including the need for confidence metrics and fallback mechanisms.
</details>
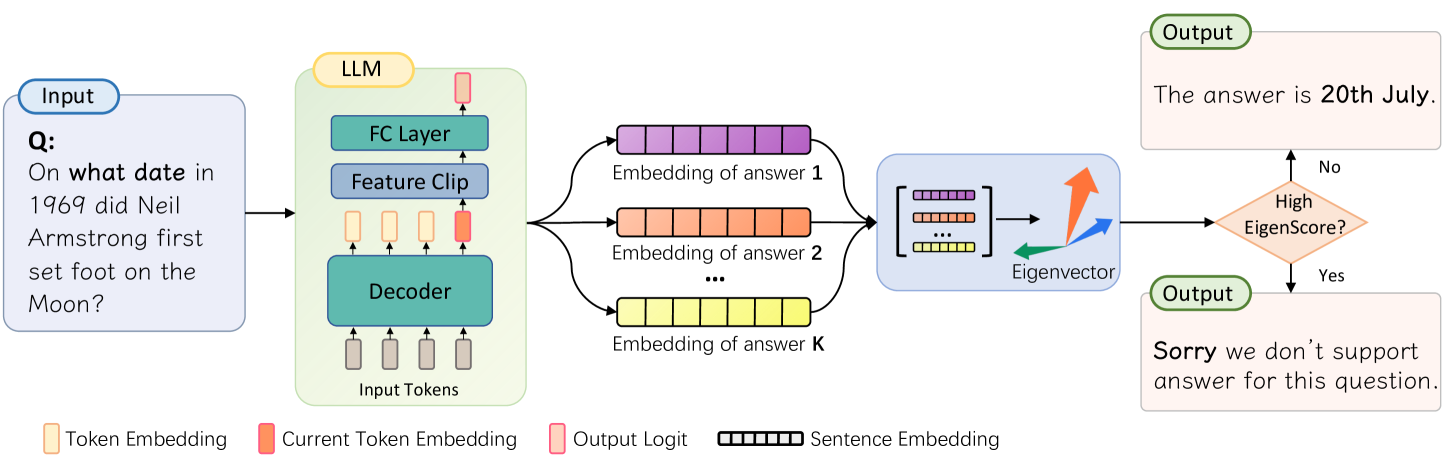
Figure 1: Illustration of our proposed hallucination detection pipeline. During inference time, for a given question, the extreme features in the penultimate layer are truncated and the EigenScore is computed based on the sentence embeddings across multiple responses.
In this section, we introduce the details of our proposed INSIDE framework for hallucination detection. The whole pipeline is illustrated as Fig. 1. In section 3.1, we demonstrate a simple but effective EigenScore metric by exploring sentence-level semantics in the internal states of LLMs. In section 3.2, a test-time feature clipping approach is introduced to effectively alleviate the issue of overconfident generation, thereby aiding in the identification of self-consistent hallucinations
3.1 Hallucination Detection by EigenScore
The existing uncertainty or consistency based hallucination detection metrics are exploited in the logit or language space, which neglect the dense semantic information that is retained within the internal states of LLMs. To better exploit the dense semantic information, we propose to measure the semantic divergence in the sentence embedding space. For the $t$ -th output token $y_{t}$ , we denote the hidden embedding in the $l$ -th layer as $\bm{h}^{l}_{t}∈\mathbb{R}^{d}$ , where $d$ is the dimension of the hidden embedding ( $d=4096$ for LLaMA-7B and $d=5120$ for LLaMA-13B). According to Ren et al. (2022); Azaria & Mitchell (2023), the sentence embedding can be obtained by averaging the token embedding $\bm{z}=\frac{1}{T}\sum_{t=1}^{T}\bm{h}_{t}$ , or taking the last token embedding as sentence embedding $\bm{z}=\bm{h}_{T}$ . In our main experiments, we use the embedding of the last token in the middle layer as the sentence embedding, as it effectively captures the sentence semantic (Azaria & Mitchell, 2023). The comparison results of using different sentence embeddings are demonstrated in the ablation studies 4.3. For $K$ generated sequences, the covariance matrix of $K$ sentence embeddings can be computed as
$$
\bm{\Sigma}=\mathbf{Z}^{\top}\cdot\mathbf{J}_{d}\cdot\mathbf{Z} \tag{4}
$$
where $\bm{\Sigma}∈\mathbb{R}^{K× K}$ represents the covariance matrix that captures the relationship between different sentences in the embedding space, $\mathbf{Z}=[\bm{z}_{1},\bm{z}_{2},·s,\bm{z}_{K}]∈\mathbb{R}^{d× K}$ represents the embedding matrix of different sentences, $\mathbf{J}_{d}=\bm{I}_{d}-\frac{1}{d}\mathbf{1}_{d}\mathbf{1}_{d}^{→p}$ is the centering matrix and $\mathbf{1}_{d}∈\mathbb{R}^{d}$ is the all-one column vector. Then, the proposed EigenScore can be defined as the logarithm determinant (LogDet) of the covariance matrix,
$$
E(\mathcal{Y}|\bm{x},\bm{\theta})=\frac{1}{K}\log\text{det}(\bm{\Sigma}+\alpha%
\cdot\mathbf{I}_{K}) \tag{5}
$$
Here, $\text{det}(\mathbf{X})$ represents the determinant of matrix $\mathbf{X}$ , and a small regularization term $\alpha·\mathbf{I}_{K}$ is added to the covariance matrix to explicitly make it full rank. Since the matrix determinant can be obtained by solving the eigenvalues, the EigenScore can be computed as
$$
E(\mathcal{Y}|\bm{x},\bm{\theta})=\frac{1}{K}\log(\prod_{i}\lambda_{i})=\frac{%
1}{K}\sum_{i}^{K}\log(\lambda_{i}) \tag{6}
$$
where $\lambda=\{\lambda_{1},\lambda_{2},·s,\lambda_{K}\}$ denotes the eigenvalues of the regularized covariance matrix $\bm{\Sigma}+\alpha·\mathbf{I}$ , which can be solved by Singular Value Decomposition (SVD). Eq. 6 shows that the hallucination degree of LLM’s generation can be measured by the average logarithm of the eigenvalues. The conclusion is intuitive, as the eigenvalues of covariance matrix capture the divergence and correlation relationship between embeddings of different sentences. When the LLM is confident to the answers and $K$ generations have similar semantic, the sentence embeddings will be highly correlated and most eigenvalues will be close to 0. On the contrary, when the LLM is indecisive and hallucinating contents, the model will generate multiple sentences with diverse semantics leading to more significant eigenvalues. The following remark is also provided to explain why the proposed EigenScore is a good measure of knowledge hallucination.
Remark 1. LogDet of covariance matrix represents the differential entropy in the sentence embedding space. Differential Entropy is the natural extension of discrete Shannon Entropy $H_{e}(X)=-\sum_{X}-p(x)\log p(x)$ . The differential entropy $H_{de}(X)$ in continuous space can be defined by replacing the probability function with its density function $f(x)$ and integrating over $x$ , i.e., $H_{de}(X)=-∈t_{x}f(x)\log f(x)dx$ . In principle (Zhouyin & Liu, 2021), for a multivariate Gaussian distribution $X\sim N(\bm{\mu},\mathbf{\Sigma})$ , the differential entropy can be represented as
$$
H_{de}(X)=\frac{1}{2}\log\text{det}(\mathbf{\Sigma})+\frac{d}{2}(\log 2\pi+1)=%
\frac{1}{2}\sum_{i=1}^{d}\log\lambda_{i}+C \tag{7}
$$
where $d$ is the dimension of variables and $C$ is a constant. Therefore, the differential entropy is determined by the eigenvalues (LogDet) of the covariance matrix.
According to Remark 1, the proposed EigenScore defined by Eq. 6 represents the differential entropy in the sentence embedding space, which offers valuable insight into using EigenScore as a semantic divergence measure. Compared to existing uncertainty or consistency metrics that obtained in logit or language space (Malinin & Gales, 2020; Huang et al., 2023; Lin et al., 2022), the advantages of EigenScore are: (1) It captures the semantic divergence (entropy) in the dense embedding space, which is expected to retain highly-concentrated semantic information compared to logits or languages (Reimers & Gurevych, 2019). (2) Representing semantic divergence in embedding space can effectively solve the semantic equivalence (linguistic invariances) problem (Kuhn et al., 2022) in natural language space. (3) Fine-grained semantic relationship among different responses can be exploited by using eigenvalues of covariance matrix. Therefore, through the exploration of dense semantic information in the internal states, the EigenScore is expected to outperform existing uncertainty and consistency metrics, resulting in improved hallucination detection performance.
<details>
<summary>x2.png Details</summary>
### Visual Description
## Chart: Neuron Activation Distribution
### Overview
The image is a line chart displaying the distribution of neuron activations across a range of neuron indexes. The chart shows the activation levels of individual neurons, with several spikes and dips indicating varying levels of activity.
### Components/Axes
* **Title:** Neuron Activation Distribution
* **X-axis:** Neuron Indexes
* Scale: 0 to 4000, with markers at 0, 1000, 2000, 3000, and 4000.
* **Y-axis:** Neuron Activations
* Scale: -30 to 30, with markers at -30, -20, -10, 0, 10, 20, and 30.
* **Data Series:** A single turquoise line representing the neuron activation levels.
### Detailed Analysis
The turquoise line represents the activation levels of neurons. The line fluctuates around the 0 activation level, with several significant positive and negative spikes.
* **General Trend:** The line generally hovers around the 0 mark, indicating that most neurons have low activation levels.
* **Positive Spikes:**
* A spike near index 100 reaches approximately 27.
* A spike near index 1400 reaches approximately 28.
* A spike near index 2600 reaches approximately 20.
* A spike near index 3400 reaches approximately 12.
* **Negative Spikes:**
* A dip near index 800 reaches approximately -12.
* A dip near index 2200 reaches approximately -35.
* A dip near index 3000 reaches approximately -10.
### Key Observations
* Most neurons have activation levels close to zero.
* A few neurons exhibit significantly higher or lower activation levels, indicated by the spikes and dips.
* The distribution appears relatively uniform across the neuron indexes, with no specific region showing consistently higher or lower activation.
### Interpretation
The chart illustrates the activation patterns within a neural network layer. The presence of spikes and dips suggests that certain neurons are more responsive to the input data than others. The overall distribution indicates that the network might be sparsely activated, with only a small subset of neurons actively contributing to the computation. The large negative spike at index 2200 could indicate a neuron that is actively suppressing certain features or patterns. The distribution of neuron activations can be used to diagnose potential issues in the network, such as dead neurons or vanishing gradients, and to optimize the network's performance.
</details>
(a) Neuron Activation
<details>
<summary>x3.png Details</summary>
### Visual Description
## Histogram: Neuron Activation Distribution
### Overview
The image is a histogram showing the distribution of neuron activations. The x-axis represents normalized features, and the y-axis represents density. The distribution appears roughly normal, centered around a positive value.
### Components/Axes
* **Title:** Neuron Activation Distribution
* **X-axis:** Normalized Features
* Scale: -0.75 to 1.00, with increments of 0.25
* **Y-axis:** Density
* Scale: 0.0 to 3.0, with increments of 0.5
* **Data:** The distribution is shown in teal.
### Detailed Analysis
The histogram shows the density of neuron activations across a range of normalized feature values. The distribution is unimodal and appears to be skewed slightly to the right.
* The peak density occurs around 0.25.
* The density is close to zero for normalized features less than -0.75 and greater than 1.00.
* The distribution is not perfectly symmetrical, with a longer tail on the right side.
### Key Observations
* The neuron activations are concentrated around a positive value of normalized features.
* There is a significant range of activation values, indicating that the neurons are responding to a variety of features.
* The slight skewness suggests that there may be some features that tend to activate the neurons more strongly than others.
### Interpretation
The histogram provides insights into how neurons in a neural network respond to different features. The distribution suggests that the neurons are most sensitive to features with normalized values around 0.25, but they also respond to a wider range of features. The skewness of the distribution could indicate that certain features are more important for the task the network is trained to perform. The data suggests that the neurons are not uniformly activated, but rather exhibit a preference for certain feature ranges. This could be due to the specific architecture of the network or the nature of the training data.
</details>
(b) Feature Distribution
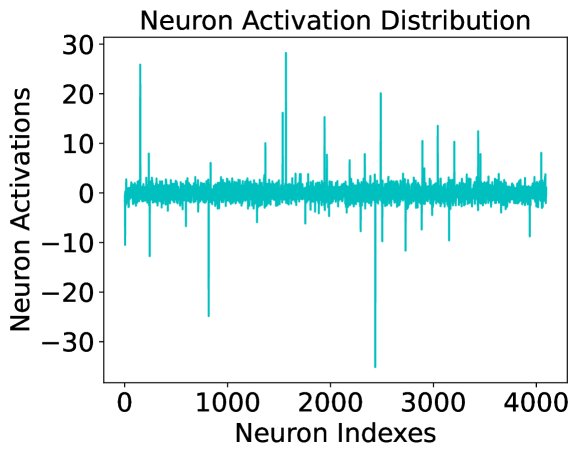
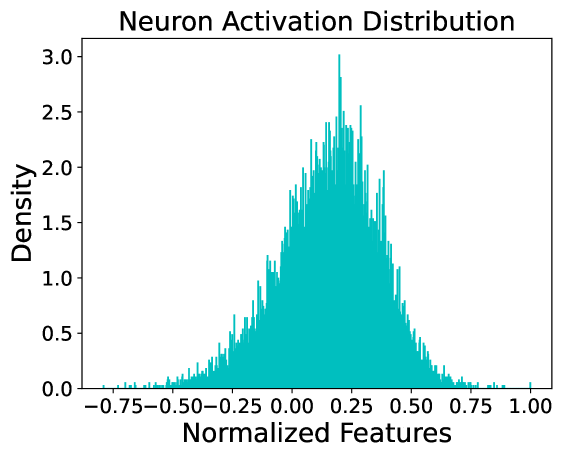
Figure 2: Illustration of activation distributions in the penultimate layer of LLaMA-7B. (a) Activation distribution in the penultimate layer for a randomly sampled token. (b) Activation distribution for a randomly sampled neuron activation of numerous tokens.
3.2 Test Time Feature Clipping
Recent works have shown that the LLMs are subject to the risks of self-consistent (overconfident) hallucinations (Ren et al., 2022; Ji et al., 2023), which has not been considered by existing consistency based methods. Therefore, to address those failure cases caused by overconfident generation, a test time feature clipping approach is introduced during the computation of EigenScore. As shown in Figure. 2, we illustrate the activation distribution in the penultimate layer of LLaMA-7B. An intuitive observation is that the penultimate layer of LLMs tends to exhibit numerous extreme features, consequently increasing the likelihood of generating overconfident and self-consistent generations. Inspired by prior works that rectify internal activations to reduce overconfident prediction for Out-of-Distribution (OOD) detection (Sun et al., 2021; Djurisic et al., 2022; Chen et al., 2024), we introduce a test time feature clipping (FC) method to prevent LLMs generate overconfident hallucinations. To rectify those extreme features, the FC operation is defined as the following piecewise function
$$
FC(h)=\begin{cases}h_{min},&h<h_{min}\\
h,&h_{min}\leq h\leq h_{max}\\
h_{max}&h>h_{max}\end{cases} \tag{8}
$$
where $h$ represents the feature of the hidden embeddings in the penultimate layer of the LLMs, $h_{min}$ and $h_{max}$ are two thresholds for determining the minimum and maximum truncation activations. When $h_{min}=-∞$ and $h_{max}=+∞$ , the output feature embedding is equivalent to the original output. For the determination of the optimal truncation thresholds, a memory bank which dynamically pushes and pops element in it, is utilized to conserve $N$ token embeddings during test time. Then, for each hidden neuron, the thresholds $h_{min}$ and $h_{max}$ are set to the top and bottom $p$ -th percentiles of the features in the memory bank. Refer to the three-sigma-rule Pukelsheim (1994), we set $p=0.2$ in all cases. This implies that the activations falling within the largest and smallest top 0.2% in the memory bank are identified as abnormal features and subsequently truncated for reducing overconfident generation.
4 Experiments
4.1 Experimental Setup
Datasets. We utilize four widely used question answering (QA) datasets for evaluation, including two open-book conversational QA datasets CoQA (Reddy et al., 2019) and SQuAD (Rajpurkar et al., 2016), as well as two closed-book QA datasets TriviaQA (Joshi et al., 2017) and Natural Questions (NQ) (Kwiatkowski et al., 2019). We follow Lin et al. (2023) to utilize the development split of CoQA with 7983 QA pairs, the validation split of NQ with 3610 QA pairs and the validation split of the TriviaQA (rc.nocontext subset) with 9,960 deduplicated QA pairs. For the SQuAD dataset, we filter out the QA pairs with their flag is_impossible = True, and utilize the subset of the development-v2.0 split with 5928 QA pairs. The lengths of the sequences vary in the four datasets. Specifically, the ground truth answers in CoQA and SQuAD are relatively longer, while and TriviaQA typically consists of answers that are only with one or two words.
Models. We use two representative open source LLMs, including LLaMA (Touvron et al., 2023a) and OPT (Zhang et al., 2022) in our experiments. Specifically, we consider off-the-shelf LLaMA-7B https://huggingface.co/decapoda-research/llama-7b-hf, LLaMA-13B https://huggingface.co/decapoda-research/llama-13b-hf, OPT-6.7B https://huggingface.co/facebook/opt-6.7b and their corresponding tokenizer provided by Hugging Face. We use the pre-trained wights and do not finetune these models in all cases.
Evaluation Metrics. Following prior work Kuhn et al. (2022); Ren et al. (2022), we evaluate the hallucination detection ability of different methods by employing them to determine whether the generation is correct or not. Therefore, the area under the receiver operator characteristic curve (AUROC) and Pearson Correlation Coefficient (PCC) are utilized as the performance measure. AUROC is a popular metric to evaluate the quality of a binary classifier and uncertainty measure (Ren et al., 2022; Lin et al., 2023). Higher AUROC scores are better. PCC is utilized to measure the correlation between the hallucination detection metric and the correctness measure, which is usually defined as the ROUGE score (Lin, 2004) or semantic similarity (Reimers & Gurevych, 2019) between the generated answers and ground truth answers. A higher PCC score is better.
Baselines. We compare our proposal with the most popular uncertainty-based methods Perplexity Ren et al. (2022) and Length-normalized Entropy (LN-Entropy) Malinin & Gales (2020), and the consistency-based metric Lexical Similarity (Lin et al., 2022). Besides, in order to investigate whether traditional OOD detection methods can be used for hallucination detection, we also introduce a popular OOD detection method Energy score (Liu et al., 2020) as a comparison method.
Correctness Measure. We follow Kuhn et al. (2022); Lin et al. (2023) to utilize both the ROUGE-L (Lin, 2004) and the semantic similarity (Reimers & Gurevych, 2019) as the correctness measure. ROUGE-L https://github.com/google-research/google-research/tree/master/rouge is an n-gram based metric that computes the longest common subsequence between two pieces of text. The generation is regarded as correct when the ROUGE-L (f-measure) is large than a given threshold, which we set to 0.5 in our main experiments. Besides, we also use the embedding similarity as the correctness measure. The sentence embeddings of model generation and the ground truth answer are extracted by the nli-roberta-large model https://huggingface.co/sentence-transformers/nli-roberta-large, and the generation is regarded as true when the cosine similarity between two embeddings is larger than 0.9.
Implementation Details. Implementation of this work is based on pytorch and transformers libraries. For the hyperparameters that are used for sampling strategies of LLMs’ decoder, we set temperature to 0.5, top-p to 0.99 and top-k to 5 through the experiments. The number of generations is set to $K=10$ . For the sentence embedding used in our proposal, we use the last token embedding of the sentence in the middle layer, i.e., the layer index is set to int(L/2). For the regularization term of the covariance matrix, we set $\alpha=0.001$ . For the memory bank used to conserve token embeddings, we set $N=3000$ . When implement the Energy Score, we average the token-level energy score as the sentence-level energy score.
4.2 Main Results
Table 1: Hallucination detection performance evaluation of different methods on four QA tasks. AUROC (AUC) and Pearson Correlation Coefficient (PCC) are utilized to measure the performance. $\text{AUC}_{s}$ represents AUROC score with sentence similarity as correctness measure, and $\text{AUC}_{r}$ represents AUROC score with ROUGE-L score as correctness measure. All numbers are percentages.
| LLaMA-7B Energy LN-Entropy | Perplexity 51.7 68.7 | 64.1 54.7 73.6 | 68.3 1.0 30.6 | 20.4 45.1 70.1 | 57.5 47.6 70.9 | 60.0 -10.7 30.0 | 10.2 64.3 72.8 | 74.0 64.8 73.7 | 74.7 18.2 29.8 | 30.1 66.8 83.4 | 83.6 67.1 83.2 | 83.6 29.1 54.0 | 54.4 |
| --- | --- | --- | --- | --- | --- | --- | --- | --- | --- | --- | --- | --- | --- |
| Lexical Similarity | 74.8 | 77.8 | 43.5 | 74.9 | 76.4 | 44.0 | 73.8 | 75.9 | 30.6 | 82.6 | 84.0 | 55.6 | |
| EigenScore | 80.4 | 80.8 | 50.8 | 81.5 | 81.2 | 53.5 | 76.5 | 77.1 | 38.3 | 82.7 | 82.9 | 57.4 | |
| LLaMA-13B | Perplexity | 63.2 | 66.2 | 20.1 | 59.1 | 61.7 | 14.2 | 73.5 | 73.4 | 36.3 | 84.7 | 84.5 | 56.5 |
| Energy | 47.5 | 49.2 | -5.9 | 36.0 | 39.2 | -20.2 | 59.1 | 59.8 | 14.7 | 71.3 | 71.5 | 36.7 | |
| LN-Entropy | 68.8 | 72.9 | 31.2 | 72.4 | 74.0 | 36.6 | 74.9 | 75.2 | 39.4 | 83.4 | 83.1 | 54.2 | |
| Lexical Similarity | 74.8 | 77.6 | 44.1 | 77.4 | 79.1 | 48.6 | 74.9 | 76.8 | 40.3 | 82.9 | 84.3 | 57.5 | |
| EigenScore | 79.5 | 80.4 | 50.2 | 83.8 | 83.9 | 57.7 | 78.2 | 78.1 | 49.0 | 83.0 | 83.0 | 58.4 | |
| OPT-6.7B | Perplexity | 60.9 | 63.5 | 11.5 | 58.4 | 69.3 | 8.6 | 76.4 | 77.0 | 32.9 | 82.6 | 82.0 | 50.0 |
| Energy | 45.6 | 45.9 | -14.5 | 41.6 | 43.3 | -16.4 | 60.3 | 58.6 | 25.6 | 70.6 | 68.8 | 37.3 | |
| LN-Entropy | 61.4 | 65.4 | 18.0 | 65.5 | 66.3 | 22.0 | 74.0 | 76.1 | 28.4 | 79.8 | 80.0 | 43.0 | |
| Lexical Similarity | 71.2 | 74.0 | 38.4 | 72.8 | 74.0 | 39.3 | 71.5 | 74.3 | 23.1 | 78.2 | 79.7 | 42.5 | |
| EigenScore | 76.5 | 77.5 | 45.6 | 81.7 | 80.8 | 49.9 | 77.9 | 77.2 | 33.5 | 80.3 | 80.4 | 0.485 | |
Effectiveness of EigenScore. In Table. 1, we compare our proposed EigenScore with several representative reliability evaluation methods on three LLMs and four QA datasets. The results show that: (1) In both LLaMA and OPT models, our proposed EigenScore consistently outperforms other comparison methods by a large margin in CoQA, SQuAD and NQ datasets under different evaluation metrics. In particular, the EigenScore outperforms Lexical Similarity by 5.6% in CoQA and 8.9% in SQuAD with AUROC metric at most. (2) It’s interesting to see that the Perplexity performs best in TriviaQA dataset but performs poorly on other datasets, especially for CoQA and SQuAD. This is because the generations and ground truth answers on TrivaiQA dataset is very simple, with only one or two words in the most cases. Therefore, the performance of different methods in TriviaQA is close and by simply averaging the token-level confidence as uncertainty measure performs well. (3) On average, the performance in LLaMA-13B is better than that in LLaMA-7B and OPT-6.7B, while the performances in LLaMA-7B is slightly better than that in OPT-6.7B. It demonstrates that better hallucination detection performance can be achieved with a more powerful pre-trained LLM.
Effectiveness of Feature Clipping. To demonstrate the effectiveness of the introduced test-time feature clipping, we compare the hallucination detection performance of different methods with and without applying the feature clipping technique. The results are shown in Table 2. As can be seen, the introduced feature clipping consistently improves the performance of different methods, with the largest improvement being 1.8% in AUROC.
Table 2: Hallucination detection performance evaluation of different methods with and without (w/o) applying feature clipping (FC). ”+FC” denotes applying feature clipping and EigenScore (w/o) denotes EigenScore without applying feature clipping. All numbers are percentages.
| Model | LLaMA-7B | OPT-6.7B | | | | | | |
| --- | --- | --- | --- | --- | --- | --- | --- | --- |
| Datasets | CoQA | NQ | CoQA | NQ | | | | |
| Methods | AUC s | PCC | AUC s | PCC | AUC s | PCC | AUC s | PCC |
| LN-Entropy | 68.7 | 30.6 | 72.8 | 29.8 | 61.4 | 18.0 | 74.0 | 28.4 |
| LN-Entropy + FC | 70.0 | 33.4 | 73.4 | 31.1 | 62.6 | 21.4 | 74.8 | 30.3 |
| Lexical Similarity | 74.8 | 43.5 | 73.8 | 30.6 | 71.2 | 38.4 | 71.5 | 23.1 |
| Lexical Similarity + FC | 76.6 | 46.3 | 74.8 | 32.1 | 72.6 | 40.2 | 72.4 | 24.2 |
| EigenScore (w/o) | 79.3 | 48.9 | 75.9 | 38.3 | 75.3 | 43.1 | 77.1 | 32.2 |
| EigenScore | 80.4 | 50.8 | 76.5 | 38.3 | 76.5 | 45.6 | 77.9 | 33.5 |
4.3 Ablation Studies
<details>
<summary>x4.png Details</summary>
### Visual Description
## Line Chart: AUROC vs. Number of Generations
### Overview
The image is a line chart comparing the performance of three different methods (LN-Entropy, Lexical Similarity, and EigenScore) based on their AUROC (Area Under the Receiver Operating Characteristic curve) scores across varying numbers of generations. The x-axis represents the number of generations, and the y-axis represents the AUROC score.
### Components/Axes
* **Title:** There is no explicit title on the chart.
* **X-axis:**
* Label: "Number of Generations"
* Scale: 5, 10, 15, 20, 30, 40
* **Y-axis:**
* Label: "AUROC"
* Scale: 72, 74, 76, 78, 80
* **Legend:** Located in the top-left corner.
* LN-Entropy (Gray line with diamond markers)
* Lexical Similarity (Teal line with circle markers)
* EigenScore (Orange line with star markers)
### Detailed Analysis
* **LN-Entropy (Gray):** The line starts at approximately 72.4 AUROC at 5 generations. It increases slightly to around 72.8 at 15 generations, then decreases slightly to approximately 72.7 at 30 generations, and ends at approximately 73.0 at 40 generations. Overall, the trend is relatively flat with a slight increase.
* (5, 72.4)
* (10, 72.7)
* (15, 73.2)
* (20, 73.0)
* (30, 72.8)
* (40, 73.0)
* **Lexical Similarity (Teal):** The line starts at approximately 73.0 AUROC at 5 generations. It increases to approximately 73.9 at 10 generations, then to approximately 74.6 at 15 generations, then to approximately 74.7 at 20 generations, then to approximately 75.0 at 30 generations, and ends at approximately 75.2 at 40 generations. Overall, the trend is increasing.
* (5, 73.0)
* (10, 73.9)
* (15, 74.6)
* (20, 74.7)
* (30, 75.0)
* (40, 75.2)
* **EigenScore (Orange):** The line starts at approximately 74.5 AUROC at 5 generations. It increases sharply to approximately 76.4 at 10 generations, then to approximately 77.3 at 15 generations, then to approximately 77.3 at 20 generations, then to approximately 77.6 at 30 generations, and ends at approximately 77.8 at 40 generations. The trend shows a rapid initial increase, followed by a plateau.
* (5, 74.5)
* (10, 76.4)
* (15, 77.3)
* (20, 77.3)
* (30, 77.6)
* (40, 77.8)
### Key Observations
* EigenScore consistently outperforms Lexical Similarity and LN-Entropy across all numbers of generations.
* LN-Entropy shows the least improvement with increasing generations.
* EigenScore shows a significant initial increase in AUROC, but the improvement plateaus after 15 generations.
* Lexical Similarity shows a steady increase in AUROC with increasing generations.
### Interpretation
The chart suggests that EigenScore is the most effective method among the three for this particular task, as it consistently achieves the highest AUROC scores. While Lexical Similarity shows a steady improvement with more generations, LN-Entropy's performance remains relatively stable and lower than the other two. The plateauing of EigenScore's performance after 15 generations indicates that increasing the number of generations beyond this point may not yield significant improvements in AUROC. The data implies that the relationship between the number of generations and AUROC is not linear and varies depending on the method used.
</details>
<details>
<summary>x5.png Details</summary>
### Visual Description
## Bar Chart: AUROC vs. Layer Indexes
### Overview
The image is a bar chart showing the AUROC (Area Under the Receiver Operating Characteristic curve) values for different layer indexes. The chart includes a horizontal dashed orange line at approximately 80.4 and a horizontal dashed gray line at approximately 78.8. The bars are teal.
### Components/Axes
* **Y-axis:** AUROC, ranging from 75 to 82.
* **X-axis:** Layer Indexes, with values 5, 10, 20, 30, and 33.
* **Horizontal Lines:**
* Dashed Orange line at AUROC ~80.4
* Dashed Gray line at AUROC ~78.8
### Detailed Analysis
* **Layer Index 5:** AUROC is approximately 78.9.
* **Layer Index 10:** AUROC is approximately 80.1.
* **Layer Index 20:** AUROC is approximately 80.6.
* **Layer Index 30:** AUROC is approximately 80.3.
* **Layer Index 33:** AUROC is approximately 79.2.
The AUROC values generally increase from layer index 5 to 20, then decrease slightly at layer index 30, and decrease further at layer index 33.
### Key Observations
* The highest AUROC value is observed at layer index 20.
* The lowest AUROC value is observed at layer index 5.
* The AUROC values fluctuate within a relatively narrow range (approximately 78.9 to 80.6).
### Interpretation
The chart suggests that the model's performance, as measured by AUROC, varies depending on the layer index. The optimal performance appears to be around layer index 20. The dashed lines may represent target or baseline performance levels, with the orange line indicating a desired level and the gray line indicating a minimum acceptable level. The model's performance exceeds the minimum level across all layer indexes but only reaches the desired level around layer indexes 10, 20, and 30. The performance drops off at layer index 33.
</details>
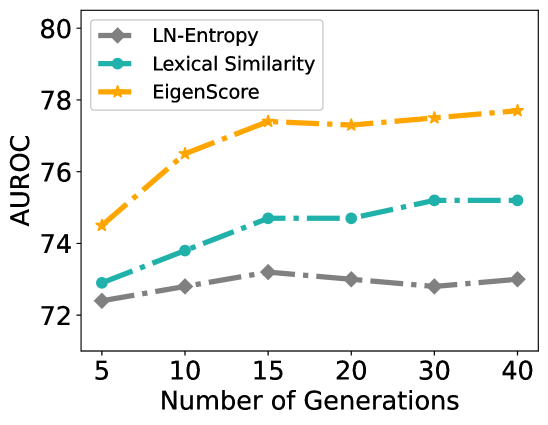
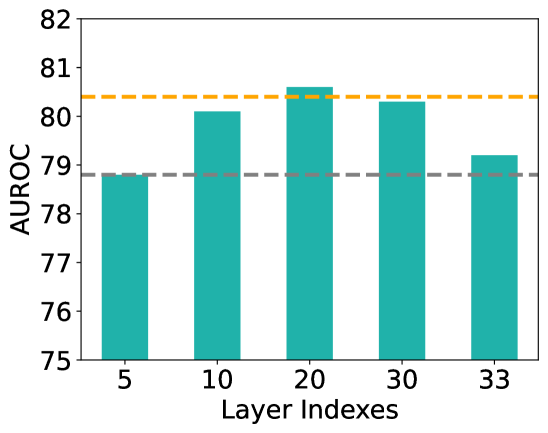
Figure 3: (a) Performance in LLaMA-7B and NQ dataset with different number of generations. (b) Performance in LLaMA-7B and CoQA dataset with sentence embedding in different layers. Orange line indicates using the last token’s embedding in the middle layer (layer 17) as sentence embedding. Gray line indicates using the averaged token embedding in the last layer as sentence embedding. The performance is measured by $\text{AUROC}_{s}$ .
Number of Generations. For the methods that explore semantic consistency for hallucination detection, the number of generations $K$ is a key factor to the performance. Therefore, to evaluate the impact of the number of generations, we select $K$ from $\{5,10,15,20,30,40\}$ and perform experiments with LLaMA-7B and the NQ dataset. The performance in Figure 3 shows that: (1) Our proposed EigenScore consistently outperforms LN-Entropy and Lexical Similarity by a large margin for different $K$ . (2) When $K<15$ , the performance of different methods increases as $K$ increases and when $K>15$ , the performance tends to remain stable. The results suggeste that setting K to 20 provides the optimal trade-off between performance and inference cost. (3) Compared to EigenScore and Lexical Similarity, LN-Entropy is less sensitive to the number of generations, which demonstrates that Lexical Similarity and our EigenScore are more effective at utilizing the information in different generations.
How EigenScore Performs with Different Sentence Embeddings. In the main experiments, we employ the embedding of the last token in the middle layer as sentence embedding. Here, we also investigate how the model performs with different sentence embeddings. In Figure. 3, we show the hallucination detection performance by using sentence embedding from different layers. The results show that using the sentence embedding in the shallow and final layers yields significantly inferior performance compared to using sentence embedding in the layers close to the middle. Besides, another interesting observation is that utilizing the embedding of the last token as the sentence embedding achieves superior performance compared to simply averaging the token embeddings, which suggests that the last token of the middle layers retain more information about the truthfulness.
Sensitivity to Correctness Measures. It’s difficult to develop automatic metrics for QA task that correlate well with human evaluations. Therefore, the choice of correctness measures is a crucial component of hallucination detection evaluation. In this section, we evaluate the performance with different correctness measure thresholds in LLaMA-7B and CoQA dataset. The experimental results are presented in Table. 3. It shows that the threshold has a great influence on the final hallucination detection performance. Significantly, our proposed EigenScore consistently outperforms comparison methods in different thresholds. Besides, the results also indicate that the hallucination detection performance of different methods will be better under a rigorous correctness measure.
Table 3: Performance evaluation with different correctness measure thresholds in LLaMA-7B and CoQA dataset. The ROUGE-L (f-measure) score and Sentence Similarity with different thresholds are employed to measure the correctness of the generated answers.
| Perplexity | 65.2 | 68.3 | 68.1 | 63.7 | 63.5 | 64.1 |
| --- | --- | --- | --- | --- | --- | --- |
| LN-Entropy | 67.4 | 73.6 | 74.1 | 65.2 | 65.6 | 68.7 |
| Lexical Similarity | 75.8 | 77.8 | 79.3 | 72.8 | 73.9 | 74.8 |
| EigenScore | 76.4 | 80.8 | 83.5 | 75.9 | 77.2 | 80.4 |
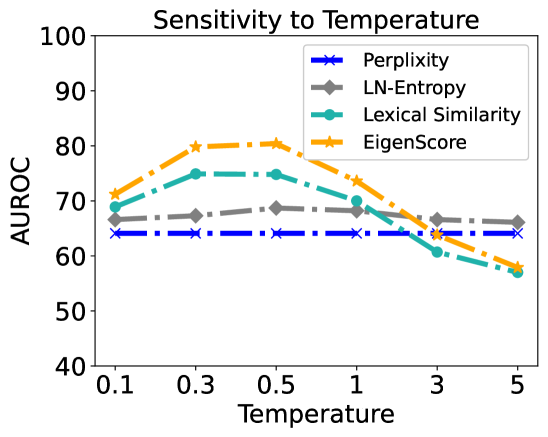
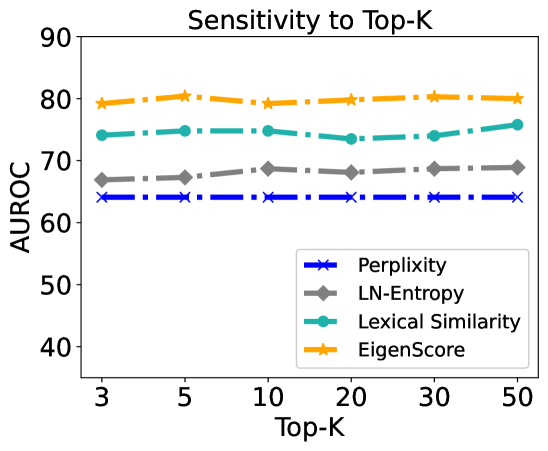
Sensitivity to Hyperparameters. The hyperparameters, including temperature, top-k and top-p, of the LLMs’ decoder determine the diversity of the generations. To evaluate the impact of those hyperparameters. We provide a sensitivity analysis in Figure 4. As observed, the performance is greatly influenced by temperature but shows little sensitivity to top-k. The performance of the consistency based methods (EigenScore and Lexical Similarity) drops significantly when the temperature is greater than 1. The optimal temperature can be selected from $[0.1,1.0]$ .
<details>
<summary>x6.png Details</summary>
### Visual Description
## Line Chart: Sensitivity to Temperature
### Overview
The image is a line chart showing the sensitivity of four different metrics (Perplexity, LN-Entropy, Lexical Similarity, and EigenScore) to temperature. The x-axis represents temperature, and the y-axis represents AUROC (Area Under the Receiver Operating Characteristic curve).
### Components/Axes
* **Title:** Sensitivity to Temperature
* **X-axis:** Temperature, with tick marks at 0.1, 0.3, 0.5, 1, 3, and 5.
* **Y-axis:** AUROC, with tick marks at 40, 50, 60, 70, 80, 90, and 100.
* **Legend:** Located at the top-right of the chart.
* **Blue (dash-dot line with x markers):** Perplexity
* **Gray (solid line with diamond markers):** LN-Entropy
* **Teal (solid line with circle markers):** Lexical Similarity
* **Orange (dash-dot line with star markers):** EigenScore
### Detailed Analysis
* **Perplexity (Blue):** The line is relatively flat, hovering around an AUROC of 64, with minor fluctuations.
* At Temperature 0.1, AUROC is approximately 64.
* At Temperature 0.3, AUROC is approximately 64.
* At Temperature 0.5, AUROC is approximately 64.
* At Temperature 1, AUROC is approximately 64.
* At Temperature 3, AUROC is approximately 64.
* At Temperature 5, AUROC is approximately 64.
* **LN-Entropy (Gray):** The line starts around 67 AUROC, increases slightly to around 69 at 0.5, and then decreases to around 65 at temperature 3 and 5.
* At Temperature 0.1, AUROC is approximately 67.
* At Temperature 0.3, AUROC is approximately 68.
* At Temperature 0.5, AUROC is approximately 69.
* At Temperature 1, AUROC is approximately 68.
* At Temperature 3, AUROC is approximately 66.
* At Temperature 5, AUROC is approximately 64.
* **Lexical Similarity (Teal):** The line starts around 69 AUROC, increases to around 75 at 0.3, remains relatively stable until temperature 1, and then decreases to around 57 at temperature 5.
* At Temperature 0.1, AUROC is approximately 69.
* At Temperature 0.3, AUROC is approximately 75.
* At Temperature 0.5, AUROC is approximately 75.
* At Temperature 1, AUROC is approximately 70.
* At Temperature 3, AUROC is approximately 61.
* At Temperature 5, AUROC is approximately 57.
* **EigenScore (Orange):** The line starts around 72 AUROC, increases to around 80 at 0.3 and 0.5, and then decreases to around 62 at temperature 5.
* At Temperature 0.1, AUROC is approximately 72.
* At Temperature 0.3, AUROC is approximately 80.
* At Temperature 0.5, AUROC is approximately 80.
* At Temperature 1, AUROC is approximately 74.
* At Temperature 3, AUROC is approximately 66.
* At Temperature 5, AUROC is approximately 58.
### Key Observations
* Perplexity is the least sensitive to temperature changes, maintaining a consistently low AUROC.
* EigenScore and Lexical Similarity show a similar trend: an initial increase in AUROC followed by a decrease as temperature increases.
* LN-Entropy shows a slight increase and then a decrease.
* All metrics except Perplexity show a decrease in AUROC at higher temperatures.
### Interpretation
The chart suggests that the performance of different metrics, as measured by AUROC, is affected by temperature. Perplexity appears to be the most stable metric across different temperatures, while EigenScore and Lexical Similarity are more sensitive, showing a peak in performance at lower temperatures (0.3-0.5) and a decline at higher temperatures. This could indicate that these metrics are more effective within a specific temperature range, while Perplexity's consistent performance might make it a more reliable choice across varying conditions. The decrease in AUROC for most metrics at higher temperatures could imply that the models or systems using these metrics become less accurate or reliable as temperature increases.
</details>
<details>
<summary>x7.png Details</summary>
### Visual Description
## Chart: Sensitivity to Top-K
### Overview
The image is a line chart showing the sensitivity of four different metrics (Perplexity, LN-Entropy, Lexical Similarity, and EigenScore) to the "Top-K" parameter. The y-axis represents AUROC (Area Under the Receiver Operating Characteristic curve), a measure of classification performance. The x-axis represents the Top-K value, which ranges from 3 to 50.
### Components/Axes
* **Title:** Sensitivity to Top-K
* **X-axis:** Top-K, with values 3, 5, 10, 20, 30, and 50.
* **Y-axis:** AUROC, ranging from 40 to 90.
* **Legend:** Located in the bottom-right of the chart.
* Blue with "x" markers: Perplexity
* Gray with diamond markers: LN-Entropy
* Teal with circle markers: Lexical Similarity
* Orange with star markers: EigenScore
### Detailed Analysis
* **Perplexity (Blue):** The line is relatively flat, with AUROC values consistently around 64-65.
* Top-K = 3: AUROC ≈ 64
* Top-K = 5: AUROC ≈ 64
* Top-K = 10: AUROC ≈ 64
* Top-K = 20: AUROC ≈ 64
* Top-K = 30: AUROC ≈ 64
* Top-K = 50: AUROC ≈ 64
* **LN-Entropy (Gray):** The line shows a slight upward trend, with AUROC values increasing from approximately 67 to 69.
* Top-K = 3: AUROC ≈ 67
* Top-K = 5: AUROC ≈ 67
* Top-K = 10: AUROC ≈ 68
* Top-K = 20: AUROC ≈ 68
* Top-K = 30: AUROC ≈ 69
* Top-K = 50: AUROC ≈ 69
* **Lexical Similarity (Teal):** The line is relatively flat, with a slight upward trend, with AUROC values ranging from approximately 74 to 76.
* Top-K = 3: AUROC ≈ 74
* Top-K = 5: AUROC ≈ 75
* Top-K = 10: AUROC ≈ 75
* Top-K = 20: AUROC ≈ 75
* Top-K = 30: AUROC ≈ 74
* Top-K = 50: AUROC ≈ 76
* **EigenScore (Orange):** The line is relatively flat, with AUROC values consistently around 79-80.
* Top-K = 3: AUROC ≈ 79
* Top-K = 5: AUROC ≈ 80
* Top-K = 10: AUROC ≈ 79
* Top-K = 20: AUROC ≈ 79
* Top-K = 30: AUROC ≈ 80
* Top-K = 50: AUROC ≈ 80
### Key Observations
* EigenScore consistently achieves the highest AUROC values across all Top-K values.
* Perplexity consistently achieves the lowest AUROC values across all Top-K values.
* LN-Entropy shows a slight improvement in AUROC as Top-K increases.
* Lexical Similarity shows a slight improvement in AUROC as Top-K increases.
* The sensitivity to Top-K is relatively low for all four metrics, as the AUROC values do not change drastically with varying Top-K values.
### Interpretation
The chart suggests that EigenScore is the most effective metric for the task being evaluated, as it consistently achieves the highest AUROC values. Perplexity, on the other hand, appears to be the least effective. The relatively flat lines for all metrics indicate that the performance is not highly sensitive to the Top-K parameter within the range of 3 to 50. This could mean that the task is relatively robust to the choice of Top-K, or that the optimal Top-K value lies outside this range. The slight upward trend for LN-Entropy and Lexical Similarity suggests that increasing Top-K may lead to marginal improvements in performance for these metrics.
</details>
Figure 4: (a) Performance sensitivity to temperature. (b) Performance sensitivity to top-k. The performance is measured by $\text{AUROC}_{s}$ .
5 Related Work
Reliability Evaluation of LLMs During real-world deployments, the reliability of LLMs poses a substantial challenge, as LLMs reveal their propensity to exhibit unreliable generations (Ji et al., 2023; Zhang et al., 2023). Therefore, considerable efforts has been made to address the security and reliability evaluation of LLMs (Huang et al., 2023; Malinin & Gales, 2020; Kuhn et al., 2022; Kadavath et al., 2022; Cohen et al., 2023; Azaria & Mitchell, 2023). Among those methods, uncertainty based metric has been widely explored, which typically involves predictive confidence or entropy of the output token (Malinin & Gales, 2020; Kuhn et al., 2022; Duan et al., 2023). Besides, consistency based methods also play an important role in reliability evaluation, which hypothesizes that LLMs tend to generate logically inconsistent responses to the same question when they are indecisive and hallucinating contents (Kuhn et al., 2022; Raj et al., 2023; Manakul et al., 2023). Based on the consistency hypothesis, researchers also found it is feasible to prompt the LLMs to evaluate their responses themselves (Kadavath et al., 2022; Cohen et al., 2023; Manakul et al., 2023).
Eigenvalue as Divergence Measure The eigenvalue or determinant of covariance matrix captures the variability of the data and has been widely explored as divergence measure in a wide range of machine learning tasks (Wold et al., 1987; Kulesza & Taskar, 2011; Xu et al., 2021; Zhouyin & Liu, 2021; Cai et al., 2015). For instance, in Wold et al. (1987), the authors proposed the well-known Principal Components Analysis (PCA) and demonstrates that the most largest eigenvalues of sample covariance matrix corresponds to the principle semantic of sample set. Besides, the determinant of covariance matrix, determined by the eigenvalues, has been utilized to sample a diversity subset in determinantal point processes (DDP) (Kulesza & Taskar, 2011) and activation learning (Xu et al., 2021) tasks, which demonstrates the determinant of covariance matrix is a good diversity measure. Besides, several studies also proposed to approximate the differential entropy with the logarithm determinant of covariance matrix (Zhouyin & Liu, 2021; Klir & Wierman, 1999).
6 Conclusion
Measuring the hallucination degree of LLM’s generation is of critical importance in enhancing the security and reliability of LLM-based AI systems. This work presents an INSIDE framework to exploit the semantic information that are retained within the internal states of LLMs for hallucination detection. Specifically, a simple yet effective EigenScore is proposed to measure the semantic consistency across different generations in the embedding space. Besides, to identify those self-consistent (overconfident) hallucinations which have been overlooked by previous methods, a feature clipping technique is introduced to reduce overconfident generations by truncating extreme features. Significant performance improvement has been achieved in several popular LLMs and QA benchmarks. Although our experiments focus on QA task, our method does not make any assumptions about the task modality, and we believe our method is widely applicable to other tasks, such as summarization and translation. We hope that our insights inspire future research to further explore the internal semantics of LLMs for hallucination detection.
References
- Almazrouei et al. (2023) Ebtesam Almazrouei, Hamza Alobeidli, Abdulaziz Alshamsi, Alessandro Cappelli, Ruxandra Cojocaru, Maitha Alhammadi, Mazzotta Daniele, Daniel Heslow, Julien Launay, Quentin Malartic, et al. The falcon series of language models: Towards open frontier models. Hugging Face repository, 2023.
- Azaria & Mitchell (2023) Amos Azaria and Tom Mitchell. The internal state of an llm knows when its lying. arXiv preprint arXiv:2304.13734, 2023.
- Bai et al. (2022) Yuntao Bai, Andy Jones, Kamal Ndousse, Amanda Askell, Anna Chen, Nova DasSarma, Dawn Drain, Stanislav Fort, Deep Ganguli, Tom Henighan, et al. Training a helpful and harmless assistant with reinforcement learning from human feedback. arXiv preprint arXiv:2204.05862, 2022.
- Cai et al. (2015) T Tony Cai, Tengyuan Liang, and Harrison H Zhou. Law of log determinant of sample covariance matrix and optimal estimation of differential entropy for high-dimensional gaussian distributions. Journal of Multivariate Analysis, 137:161–172, 2015.
- Chang et al. (2023) Yupeng Chang, Xu Wang, Jindong Wang, Yuan Wu, Kaijie Zhu, Hao Chen, Linyi Yang, Xiaoyuan Yi, Cunxiang Wang, Yidong Wang, et al. A survey on evaluation of large language models. arXiv preprint arXiv:2307.03109, 2023.
- Chen et al. (2024) Chao Chen, Zhihang Fu, Kai Liu, Ze Chen, Mingyuan Tao, and Jieping Ye. Optimal parameter and neuron pruning for out-of-distribution detection. Advances in Neural Information Processing Systems, 36, 2024.
- Cohen et al. (2023) Roi Cohen, May Hamri, Mor Geva, and Amir Globerson. Lm vs lm: Detecting factual errors via cross examination. arXiv e-prints, pp. arXiv–2305, 2023.
- Djurisic et al. (2022) Andrija Djurisic, Nebojsa Bozanic, Arjun Ashok, and Rosanne Liu. Extremely simple activation shaping for out-of-distribution detection. In The Eleventh International Conference on Learning Representations, 2022.
- Duan et al. (2023) Jinhao Duan, Hao Cheng, Shiqi Wang, Chenan Wang, Alex Zavalny, Renjing Xu, Bhavya Kailkhura, and Kaidi Xu. Shifting attention to relevance: Towards the uncertainty estimation of large language models. arXiv preprint arXiv:2307.01379, 2023.
- Hendrycks & Gimpel (2016) Dan Hendrycks and Kevin Gimpel. A baseline for detecting misclassified and out-of-distribution examples in neural networks. In International Conference on Learning Representations, 2016.
- Huang et al. (2023) Yuheng Huang, Jiayang Song, Zhijie Wang, Huaming Chen, and Lei Ma. Look before you leap: An exploratory study of uncertainty measurement for large language models. arXiv e-prints, pp. arXiv–2307, 2023.
- Ji et al. (2023) Ziwei Ji, Nayeon Lee, Rita Frieske, Tiezheng Yu, Dan Su, Yan Xu, Etsuko Ishii, Ye Jin Bang, Andrea Madotto, and Pascale Fung. Survey of hallucination in natural language generation. ACM Computing Surveys, 55(12):1–38, 2023.
- Joshi et al. (2017) Mandar Joshi, Eunsol Choi, Daniel S Weld, and Luke Zettlemoyer. Triviaqa: A large scale distantly supervised challenge dataset for reading comprehension. In Proceedings of the 55th Annual Meeting of the Association for Computational Linguistics (Volume 1: Long Papers), pp. 1601–1611, 2017.
- Kadavath et al. (2022) Saurav Kadavath, Tom Conerly, Amanda Askell, Tom Henighan, Dawn Drain, Ethan Perez, Nicholas Schiefer, Zac Hatfield Dodds, Nova DasSarma, Eli Tran-Johnson, et al. Language models (mostly) know what they know. arXiv e-prints, pp. arXiv–2207, 2022.
- Klir & Wierman (1999) George Klir and Mark Wierman. Uncertainty-based information: elements of generalized information theory, volume 15. Springer Science & Business Media, 1999.
- Kuhn et al. (2022) Lorenz Kuhn, Yarin Gal, and Sebastian Farquhar. Semantic uncertainty: Linguistic invariances for uncertainty estimation in natural language generation. In The Eleventh International Conference on Learning Representations, 2022.
- Kulesza & Taskar (2011) Alex Kulesza and Ben Taskar. k-dpps: Fixed-size determinantal point processes. In Proceedings of the 28th International Conference on Machine Learning (ICML-11), pp. 1193–1200, 2011.
- Kwiatkowski et al. (2019) Tom Kwiatkowski, Jennimaria Palomaki, Olivia Redfield, Michael Collins, Ankur Parikh, Chris Alberti, Danielle Epstein, Illia Polosukhin, Jacob Devlin, Kenton Lee, et al. Natural questions: a benchmark for question answering research. Transactions of the Association for Computational Linguistics, 7:453–466, 2019.
- Li et al. (2023) Kenneth Li, Oam Patel, Fernanda Viégas, Hanspeter Pfister, and Martin Wattenberg. Inference-time intervention: Eliciting truthful answers from a language model. arXiv preprint arXiv:2306.03341, 2023.
- Liang et al. (2022) Percy Liang, Rishi Bommasani, Tony Lee, Dimitris Tsipras, Dilara Soylu, Michihiro Yasunaga, Yian Zhang, Deepak Narayanan, Yuhuai Wu, Ananya Kumar, et al. Holistic evaluation of language models. arXiv preprint arXiv:2211.09110, 2022.
- Lin (2004) Chin-Yew Lin. Rouge: A package for automatic evaluation of summaries. In Text summarization branches out, pp. 74–81, 2004.
- Lin et al. (2023) Zhen Lin, Shubhendu Trivedi, and Jimeng Sun. Generating with confidence: Uncertainty quantification for black-box large language models. arXiv e-prints, pp. arXiv–2305, 2023.
- Lin et al. (2022) Zi Lin, Jeremiah Zhe Liu, and Jingbo Shang. Towards collaborative neural-symbolic graph semantic parsing via uncertainty. Findings of the Association for Computational Linguistics: ACL 2022, 2022.
- Liu et al. (2020) Weitang Liu, Xiaoyun Wang, John Owens, and Yixuan Li. Energy-based out-of-distribution detection. Advances in neural information processing systems, 33:21464–21475, 2020.
- Malinin & Gales (2020) Andrey Malinin and Mark Gales. Uncertainty estimation in autoregressive structured prediction. In International Conference on Learning Representations, 2020.
- Manakul et al. (2023) Potsawee Manakul, Adian Liusie, and Mark JF Gales. Selfcheckgpt: Zero-resource black-box hallucination detection for generative large language models. arXiv preprint arXiv:2303.08896, 2023.
- OpenAI (2023) OpenAI. Gpt-4 technical report, 2023.
- Ouyang et al. (2022) Long Ouyang, Jeffrey Wu, Xu Jiang, Diogo Almeida, Carroll Wainwright, Pamela Mishkin, Chong Zhang, Sandhini Agarwal, Katarina Slama, Alex Ray, et al. Training language models to follow instructions with human feedback. Advances in Neural Information Processing Systems, 35:27730–27744, 2022.
- Pukelsheim (1994) Friedrich Pukelsheim. The three sigma rule. The American Statistician, 48(2):88–91, 1994.
- Raj et al. (2023) Harsh Raj, Vipul Gupta, Domenic Rosati, and Subhabrata Majumdar. Semantic consistency for assuring reliability of large language models. arXiv preprint arXiv:2308.09138, 2023.
- Rajpurkar et al. (2016) Pranav Rajpurkar, Jian Zhang, Konstantin Lopyrev, and Percy Liang. Squad: 100,000+ questions for machine comprehension of text. In Proceedings of the 2016 Conference on Empirical Methods in Natural Language Processing, pp. 2383–2392, 2016.
- Reddy et al. (2019) Siva Reddy, Danqi Chen, and Christopher D Manning. Coqa: A conversational question answering challenge. Transactions of the Association for Computational Linguistics, 7:249–266, 2019.
- Reimers & Gurevych (2019) Nils Reimers and Iryna Gurevych. Sentence-bert: Sentence embeddings using siamese bert-networks. In Proceedings of the 2019 Conference on Empirical Methods in Natural Language Processing and the 9th International Joint Conference on Natural Language Processing (EMNLP-IJCNLP). Association for Computational Linguistics, 2019.
- Ren et al. (2022) Jie Ren, Jiaming Luo, Yao Zhao, Kundan Krishna, Mohammad Saleh, Balaji Lakshminarayanan, and Peter J Liu. Out-of-distribution detection and selective generation for conditional language models. In The Eleventh International Conference on Learning Representations, 2022.
- Shi et al. (2022) Freda Shi, Daniel Fried, Marjan Ghazvininejad, Luke Zettlemoyer, and Sida I Wang. Natural language to code translation with execution. In Proceedings of the 2022 Conference on Empirical Methods in Natural Language Processing, pp. 3533–3546, 2022.
- Sun et al. (2021) Yiyou Sun, Chuan Guo, and Yixuan Li. React: Out-of-distribution detection with rectified activations. Advances in Neural Information Processing Systems, 34:144–157, 2021.
- Touvron et al. (2023a) Hugo Touvron, Thibaut Lavril, Gautier Izacard, Xavier Martinet, Marie-Anne Lachaux, Timothée Lacroix, Baptiste Rozière, Naman Goyal, Eric Hambro, Faisal Azhar, et al. Llama: Open and efficient foundation language models. arXiv preprint arXiv:2302.13971, 2023a.
- Touvron et al. (2023b) Hugo Touvron, Louis Martin, Kevin Stone, Peter Albert, Amjad Almahairi, Yasmine Babaei, Nikolay Bashlykov, Soumya Batra, Prajjwal Bhargava, Shruti Bhosale, et al. Llama 2: Open foundation and fine-tuned chat models. arXiv preprint arXiv:2307.09288, 2023b.
- Wang et al. (2022) Xuezhi Wang, Jason Wei, Dale Schuurmans, Quoc Le, Ed Chi, Sharan Narang, Aakanksha Chowdhery, and Denny Zhou. Self-consistency improves chain of thought reasoning in language models. arXiv preprint arXiv:2203.11171, 2022.
- Wold et al. (1987) Svante Wold, Kim Esbensen, and Paul Geladi. Principal component analysis. Chemometrics and intelligent laboratory systems, 2(1-3):37–52, 1987.
- Xu et al. (2021) Xinyi Xu, Zhaoxuan Wu, Chuan Sheng Foo, and Bryan Kian Hsiang Low. Validation free and replication robust volume-based data valuation. Advances in Neural Information Processing Systems, 34:10837–10848, 2021.
- Yin et al. (2023) Zhangyue Yin, Qiushi Sun, Qipeng Guo, Jiawen Wu, Xipeng Qiu, and Xuanjing Huang. Do large language models know what they don’t know? arXiv preprint arXiv:2305.18153, 2023.
- Zhang et al. (2022) Susan Zhang, Stephen Roller, Naman Goyal, Mikel Artetxe, Moya Chen, Shuohui Chen, Christopher Dewan, Mona Diab, Xian Li, Xi Victoria Lin, et al. Opt: Open pre-trained transformer language models. arXiv preprint arXiv:2205.01068, 2022.
- Zhang et al. (2023) Yue Zhang, Yafu Li, Leyang Cui, Deng Cai, Lemao Liu, Tingchen Fu, Xinting Huang, Enbo Zhao, Yu Zhang, Yulong Chen, et al. Siren’s song in the ai ocean: A survey on hallucination in large language models. arXiv preprint arXiv:2309.01219, 2023.
- Zhou et al. (2023) Kaitlyn Zhou, Dan Jurafsky, and Tatsunori Hashimoto. Navigating the grey area: Expressions of overconfidence and uncertainty in language models. arXiv preprint arXiv:2302.13439, 2023.
- Zhouyin & Liu (2021) Zhanghao Zhouyin and Ding Liu. Understanding neural networks with logarithm determinant entropy estimator. arXiv preprint arXiv:2105.03705, 2021.
Appendix A Performance Evaluation on TruthfulQA
TruthfulQA is an important benchmark to evaluate the truthfulness of LLMs (Joshi et al., 2017). Therefore, we also compare our proposal with the baseline methods in the TruthfulQA benchmark. The optimal classification thresholds is determined by maximizing the G-Mean value, which is defined as $\textbf{G-Mean}=\sqrt{TPR*(1-FPR)}$ . The results are presented in Table 4. For the ITI Li et al. (2023), which trains multiple binary classifiers with the internal embeddings for hallucination detection, we report the best performance in their paper. As can be seen, our proposal consistently outperforms the baseline methods and achieves comparable performance as ITI when we utilize 50 in-distribution prompts. It’s worth nothing that the ITI relies on training 1024 binary classifiers in TruthQA datasets, and they report the best performance (83.3) in the validation set. Therefore, their best performance is better than our proposal which has not been trained on TruthfulQA. However, training on the validation set also limits the generalization of their method on other domains (Li et al., 2023). As TruthfulQA is a very challenging dataset for LLMs, zero-shot inference results in poor performance. Therefore, we follow previous work (Bai et al., 2022) to utilize different number of in-distribution prompts during inference time. The results show that the performance could be significantly improved when we increase the number of prompts, which also explains why ITI performs good.
Table 4: Performance comparison of different methods on TruthfulQA dataset. LexialSim denotes Lexical Similarity and SelfCKGPT denotes SelfCheckGPT. Hallucination detection accuracy is reported. # Prompt denotes the number of prompt templates. For ITI Li et al. (2023), we report the best number in their paper directly. All numbers are percentages.
| 5 20 50 | 70.0 76.4 73.1 | 71.2 77.7 77.9 | 73.6 77.9 73.6 | 74.2 76.8 78.3 | 83.3 83.3 83.3 | 76.7 79.5 81.3 |
| --- | --- | --- | --- | --- | --- | --- |
Appendix B Comparison with More Competitive Methods
To demonstrate the effectiveness of our proposal, we also compare our EigenScore with several competitive methods, including Semantic Entropy (SemanticEnt) (Kuhn et al., 2022), Shifting Attention to Relevance (SentSAR) (Duan et al., 2023) and SelfCheckGPT (SelfCKGPT) (Manakul et al., 2023). We follow the experimental setting in Duan et al. (2023) to set the number of generation to $N=10$ for OPT-6.7B and $N=5$ for LLaMA. For the results of SementicEnt and SentSAR, we report the number in Duan et al. (2023) directly. For the implementation of SelfCheckGPT, we leverage the SelfCheckBERTScore provided in the official code package https://github.com/potsawee/selfcheckgpt. The comparison results in Table 5 demonstrate that our EigenScore significantly outperforms the competitors. Additionally, both SentSAR and SelfCheckGPT exhibit comparable performance, which is much superior to Semantic Entropy. Note that both SentSAR, SelfCheckGPT and our proposal evaluate the quality of LLMs’ generation by exploring the self-consistency across multiple outputs. However, compared to Semantic Entropy (Kuhn et al., 2022) or SelfCheckGPT (Manakul et al., 2023) which relies on another language model for sentence embedding extraction, our approach leverages the internal states of LLMs, which retain highly-concentrated semantic information. Besides, the EigenScore defined by the LogDet of the sentence covariance matrix is able to capture the semantic consistency more effectively compared to the sentence-wise similarity (Manakul et al., 2023). Furthermore, the proposed feature clipping strategy allows our model to identify the overconfident hallucinations, which has not been investigated by previous works (Kuhn et al., 2022; Manakul et al., 2023)
Table 5: Performance comparison of EigenScore and and several state-of-the-art methods on CoQA dataset. AUC s represents AUROC with the sentence similarity as correctness measure, and AUC r represents using ROUGE-L as correctness measure. All numbers are percentages.
| OPT-6.7B | 63.1 | 71.7 | 69.8 | 72.2 | 70.2 | 74.1 | 71.9 | 77.5 |
| --- | --- | --- | --- | --- | --- | --- | --- | --- |
| LLaMA-7B | 64.9 | 68.2 | 70.4 | 65.8 | 68.7 | 72.9 | 71.2 | 75.7 |
| LLaMA-13B | 65.3 | 66.7 | 71.4 | 64.7 | 68.1 | 77.0 | 72.8 | 79.8 |
Appendix C Performance Evaluation on More LLMs
In the main experiments, we evaluate the performance of different methods in LLaMA-7B, LLaMA-13B and OPT-6.7B. To demonstrate the robustness of our method across different models, we also provide the performance comparison in the recent LLaMA2-7B (Touvron et al., 2023b) and Falcon-7B models (Almazrouei et al., 2023). Table 6 reveals that our proposal consistently exhibits superior performance compared to the other methods across different LLMs.
Table 6: Performance evaluation on LLaMA2-7B and Falcon-7B. LexicalSim denotes Lexical Similarity and SelfCKGPT denotes SelfCheckGPT. AUC s and AUC r are utilized as correctness measure. Other experimental settings are consistent with Table 1.
| LLaMA2-7b | CoQA | 62.2 | 66.6 | 69.9 | 75.2 | 74.4 | 77.5 | 72.4 | 75.1 | 78.6 | 80.7 |
| --- | --- | --- | --- | --- | --- | --- | --- | --- | --- | --- | --- |
| NQ | 70.8 | 70.2 | 72.1 | 71.2 | 72.1 | 72.9 | 69.1 | 68.1 | 74.4 | 73.7 | |
| Falcon-7b | CoQA | 57.0 | 60.6 | 62.6 | 63.2 | 74.8 | 76.4 | 76.7 | 77.9 | 80.8 | 80.6 |
| NQ | 74.3 | 74.7 | 74.6 | 74.7 | 73.8 | 75.4 | 74.7 | 74.0 | 76.3 | 75.7 | |
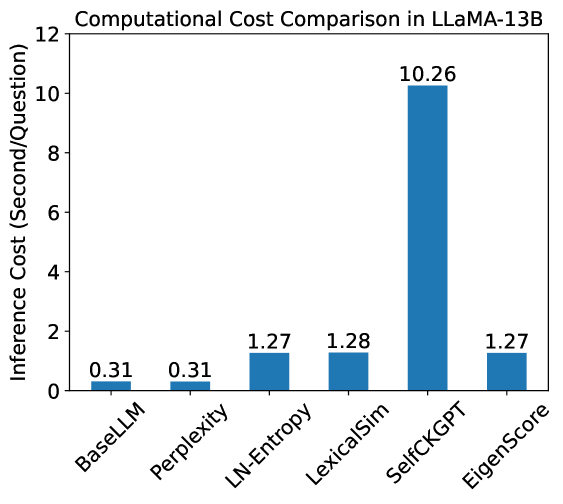
Appendix D Computational Efficiency Analysis
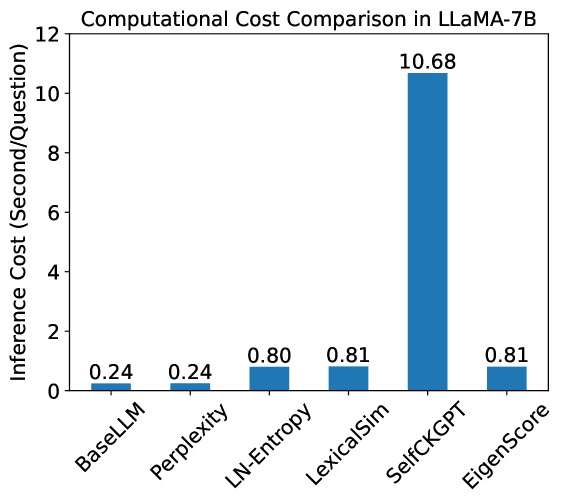
As our proposal is a sampling based approach, additional inference cost is required to generate multiple outputs for accurate hallucination detection. We compare our proposal with the base LLM and other comparing methods in LLaMA-7B and LLaMA-13B. All experiments are performed on NVIDIA-A100 and we set the number of generations to $N=10$ through the experiments. The average inference time per question is shown in Fig. 5. As observed, our EigenScore is about 10 times more efficient than the methods that rely on another large model to measure the self-consistency (such as SelfCheckGPT (Manakul et al., 2023)), and shares the similar computational overhead with the LN-Entropy and Lexical Similarity. Compared to the computational overhead of generating multiple outputs, the cost of feature clipping and EigenScore computation is negligible (0.06s). It is worth noting that the inference overhead required to generate multiple results is not linearly proportional to the time required to generate a single output, owing to the sampling and decoding strategy of the autoregressive LLM model.
<details>
<summary>x8.png Details</summary>
### Visual Description
## Bar Chart: Computational Cost Comparison in LLaMA-7B
### Overview
The image is a bar chart comparing the computational cost (inference cost in seconds per question) of different methods in LLaMA-7B. The x-axis represents the methods, and the y-axis represents the inference cost.
### Components/Axes
* **Title:** Computational Cost Comparison in LLaMA-7B
* **X-axis:** Methods (BaseLLM, Perplexity, LN-Entropy, LexicalSim, SelfCKGPT, EigenScore)
* **Y-axis:** Inference Cost (Second/Question), with a scale from 0 to 12.
* **Bars:** Each bar represents a method, with its height corresponding to the inference cost. The bars are all the same color: blue.
### Detailed Analysis
The chart displays the inference cost for each method. The values are as follows:
* **BaseLLM:** 0.24 seconds/question
* **Perplexity:** 0.24 seconds/question
* **LN-Entropy:** 0.80 seconds/question
* **LexicalSim:** 0.81 seconds/question
* **SelfCKGPT:** 10.68 seconds/question
* **EigenScore:** 0.81 seconds/question
### Key Observations
* SelfCKGPT has a significantly higher inference cost (10.68 seconds/question) compared to the other methods.
* BaseLLM and Perplexity have the lowest inference costs, both at 0.24 seconds/question.
* LN-Entropy, LexicalSim, and EigenScore have similar inference costs, around 0.80-0.81 seconds/question.
### Interpretation
The chart demonstrates that SelfCKGPT is computationally much more expensive than the other methods when used with LLaMA-7B. BaseLLM and Perplexity are the most efficient in terms of inference cost. The other methods (LN-Entropy, LexicalSim, and EigenScore) have similar, moderate inference costs. This suggests that SelfCKGPT might involve more complex computations or require more resources during inference.
</details>
(a) LLaMA-7B
<details>
<summary>x9.png Details</summary>
### Visual Description
## Bar Chart: Computational Cost Comparison in LLaMA-13B
### Overview
The image is a bar chart comparing the computational cost (inference cost in seconds per question) of different methods within the LLaMA-13B model. The x-axis represents the methods, and the y-axis represents the inference cost.
### Components/Axes
* **Title:** Computational Cost Comparison in LLaMA-13B
* **X-axis:**
* Labels: BaseLLM, Perplexity, LN-Entropy, LexicalSim, SelfCKGPT, EigenScore
* **Y-axis:**
* Label: Inference Cost (Second/Question)
* Scale: 0 to 12, with tick marks at intervals of 2 (0, 2, 4, 6, 8, 10, 12)
* **Bars:** Each bar represents a method, with the height indicating the inference cost. All bars are the same color (blue).
### Detailed Analysis
The chart displays the inference cost for each method. The values are as follows:
* **BaseLLM:** 0.31
* **Perplexity:** 0.31
* **LN-Entropy:** 1.27
* **LexicalSim:** 1.28
* **SelfCKGPT:** 10.26
* **EigenScore:** 1.27
### Key Observations
* SelfCKGPT has a significantly higher inference cost (10.26) compared to the other methods.
* BaseLLM and Perplexity have the lowest inference costs, both at 0.31.
* LN-Entropy, LexicalSim, and EigenScore have similar inference costs, around 1.27-1.28.
### Interpretation
The chart demonstrates that SelfCKGPT is computationally much more expensive than the other methods when used with LLaMA-13B. BaseLLM and Perplexity are the most efficient in terms of inference cost. The other methods (LN-Entropy, LexicalSim, and EigenScore) have similar, moderate inference costs. This suggests that SelfCKGPT might involve more complex calculations or require more resources during inference. The data highlights the trade-offs between different methods in terms of computational cost, which is an important consideration when deploying these models.
</details>
(b) LLaMA-13B
Figure 5: Inference cost comparison of different methods in LLaMA-7B and LLaMA-13B. BaseLLM denotes the LLM without using any hallucination detection metrics. LexicalSim denotes Lexical Similarity and SelfCKGPT denotes SelfCkeckGPT.
Appendix E Evaluation with Exact Match
In the main experiments, we employ the ROUGE and sentence similarity as correctness measure, which are widely used for natural language generation evaluation (Chang et al., 2023; Kuhn et al., 2022; Huang et al., 2023). In order to facilitate the comparison of our work’s performance with other works, we also provide the evaluation results by employing exact match (Liang et al., 2022) as the correctness score, which is much more strict to determine a generation as correct. The results in Table 7 show similar conclusions to those in Table 1, which demonstrates that our proposal significantly outperforms the compared methods in most cases.
Table 7: Performance evaluation with Exact Match as correctness measure. LexicalSim denotes the Lexical Similarity. The experimental settings are consistent with Table 1.
| LLaMA-7B | CoQA | 63.7 | 70.7 | 76.1 | 83.0 |
| --- | --- | --- | --- | --- | --- |
| SQuAD | 57.3 | 72.1 | 76.9 | 83.9 | |
| NQ | 75.3 | 75.6 | 75.8 | 80.1 | |
| TriviaQA | 82.5 | 83.4 | 81.8 | 82.4 | |
| OPT-6.7B | CoQA | 59.4 | 61.7 | 71.8 | 79.4 |
| SQuAD | 56.7 | 65.2 | 72.7 | 82.9 | |
| NQ | 79.8 | 78.1 | 73.2 | 79.8 | |
| TriviaQA | 83.8 | 81.3 | 79.3 | 82.7 | |
Appendix F More visualization and ablation for Feature Clipping
In Fig. 6, we illustrate the distributions of neuron activation from four selected tokens. As can be seen, the distribution changes a lot across samples. Therefore, it is risky to determine the clipping threshold with only the current input sample (EigenScore-C). A feasible solution is to pre-compute the optimal threshold based on a batch of input samples (EigenScore-P). Besides, another solution is to dynamically record the activation values and determine the threshold during the inference process (EigenScore-MB). We have experimented with both solutions and the experimental results are presented in Table 8. The results demonstrate that determining the thresholds with a memory bank works slightly better. We attribute this variability to potential differences in the activation distributions across various datasets.
Table 8: Ablation study of determining the clipping threshold with different technique. EigenScore-C indicates determining the threshold with the current input sample. EigenScore-P indicates pre-computing the threshold with a batch of samples. EigenScore-MB denotes using memory bank to determine the optimal threshold. AUC s is reported.
| EigenScore-C | 78.1 | 74.8 |
| --- | --- | --- |
| EigenScore-P | 79.9 | 75.3 |
| EigenScore-MB | 80.4 | 76.5 |
<details>
<summary>x10.png Details</summary>
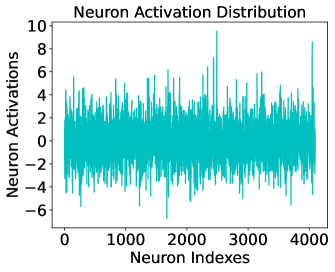
### Visual Description
## Chart: Neuron Activation Distribution
### Overview
The image is a line chart showing the distribution of neuron activations across a range of neuron indexes. The chart displays the activation level of each neuron, providing a visual representation of the neural network's activity.
### Components/Axes
* **Title:** Neuron Activation Distribution
* **X-axis:** Neuron Indexes
* Scale: 0 to 4000, with markers at 0, 1000, 2000, 3000, and 4000.
* **Y-axis:** Neuron Activations
* Scale: -6 to 10, with markers at -6, -4, -2, 0, 2, 4, 6, 8, and 10.
* **Data Series:** A single line in teal color representing the neuron activation levels.
### Detailed Analysis
The teal line represents the activation level for each neuron index. The line fluctuates significantly, indicating varying levels of activation across the neurons.
* **General Trend:** The line oscillates around the 0 level, with most activations falling between -4 and 6.
* **Peaks:** There are a few noticeable peaks where the activation level spikes significantly.
* Around index 2500, there is a peak reaching approximately 9.
* Near index 4000, there is another peak reaching approximately 8.
* **Valleys:** There are also valleys where the activation level dips significantly.
* Around index 1000, there is a valley reaching approximately -5.
### Key Observations
* The majority of neurons have activation levels close to zero, suggesting a sparse activation pattern.
* The presence of peaks indicates that some neurons are highly active, potentially playing a crucial role in the network's function.
* The valleys indicate that some neurons are strongly inhibited.
### Interpretation
The chart provides insights into the activity of a neural network layer. The distribution of neuron activations suggests that the network employs a sparse activation strategy, where only a subset of neurons are highly active at any given time. The peaks and valleys highlight specific neurons that are either strongly activated or inhibited, potentially indicating their importance in processing information. The overall distribution can be used to assess the health and performance of the neural network, and to identify potential issues such as dead neurons or runaway activations.
</details>
<details>
<summary>x11.png Details</summary>
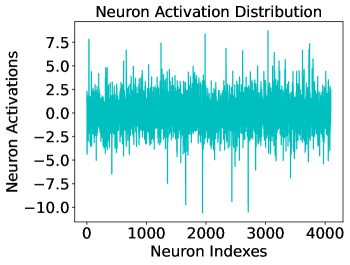
### Visual Description
## Chart: Neuron Activation Distribution
### Overview
The image is a line chart showing the distribution of neuron activations across a range of neuron indexes. The chart displays the activation levels of individual neurons, providing insight into the activity patterns within a neural network.
### Components/Axes
* **Title:** Neuron Activation Distribution
* **X-axis:** Neuron Indexes, ranging from 0 to 4000 in increments of 1000.
* **Y-axis:** Neuron Activations, ranging from -10.0 to 7.5. The scale is marked at -10.0, -7.5, -5.0, -2.5, 0.0, 2.5, 5.0, and 7.5.
* **Data Series:** A single data series represented by a teal line.
### Detailed Analysis
The teal line represents the neuron activation levels. The line fluctuates around the 0.0 mark, indicating that some neurons have positive activations while others have negative activations.
* **Trend:** The line appears to oscillate randomly around the 0.0 level, with no clear upward or downward trend.
* **Range:** The activation values range from approximately -10.0 to 7.5.
* **Fluctuations:** There are several sharp spikes and dips, indicating significant variations in activation levels for certain neurons.
### Key Observations
* The neuron activations are distributed around zero, suggesting a balanced activation pattern.
* The presence of spikes indicates that some neurons are highly active (either positively or negatively).
* The overall distribution appears random, with no clear pattern or structure.
### Interpretation
The chart provides a snapshot of the activation levels of neurons in a neural network. The distribution around zero suggests that the network is not biased towards positive or negative activations. The spikes indicate that some neurons are playing a more significant role in the network's processing. The random distribution suggests that the network is not exhibiting any specific pattern or structure in its activation patterns. This could be indicative of a well-trained network or a network that is still in the process of learning. Further analysis would be needed to determine the specific characteristics of the network and its performance.
</details>
<details>
<summary>x12.png Details</summary>
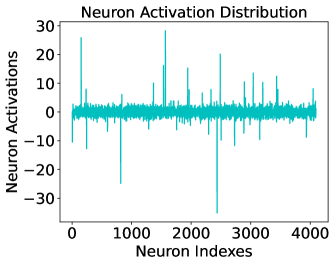
### Visual Description
## Chart: Neuron Activation Distribution
### Overview
The image is a plot showing the distribution of neuron activations across a range of neuron indexes. The plot displays neuron activation values on the y-axis against neuron indexes on the x-axis. The data appears as a series of vertical lines, indicating the activation level for each neuron.
### Components/Axes
* **Title:** Neuron Activation Distribution
* **X-axis:** Neuron Indexes, ranging from 0 to 4000 in increments of 1000.
* **Y-axis:** Neuron Activations, ranging from -30 to 30 in increments of 10.
* **Data:** The data is represented by a teal line.
### Detailed Analysis
The plot shows the activation levels of neurons, with the x-axis representing the neuron index and the y-axis representing the activation value.
* **Trend:** The majority of neuron activations are clustered around 0. There are several spikes indicating high positive and negative activation values for specific neurons.
* **Specific Values:**
* At Neuron Index 0, the activation is approximately 2.
* At Neuron Index 200, the activation spikes to approximately 25.
* At Neuron Index 1000, the activation is approximately 1.
* At Neuron Index 1500, the activation spikes to approximately 28.
* At Neuron Index 2000, the activation is approximately 0.
* At Neuron Index 2200, the activation drops to approximately -30.
* At Neuron Index 3000, the activation spikes to approximately 20.
* At Neuron Index 4000, the activation is approximately 2.
### Key Observations
* Most neurons have activation values close to zero.
* A few neurons show significantly high positive or negative activation values, indicating potential importance or specific roles in the network.
* The distribution is not uniform, with clusters of neurons showing similar activation patterns.
### Interpretation
The plot illustrates the activation patterns of neurons in a neural network. The spikes in activation suggest that certain neurons are highly responsive to the input data, while the majority of neurons remain relatively inactive. This could indicate that the network has learned to selectively activate specific neurons for particular features or patterns in the data. The presence of both positive and negative activations suggests that the network is using both excitatory and inhibitory connections to process information. The data suggests that the network is not uniformly activated, but rather relies on a subset of neurons to perform its computations.
</details>
<details>
<summary>x13.png Details</summary>
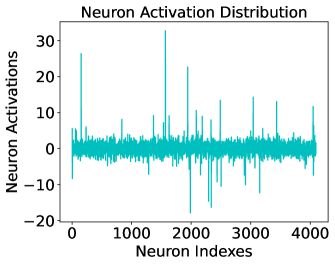
### Visual Description
## Chart Type: Line Graph
### Overview
The image is a line graph titled "Neuron Activation Distribution". It displays the distribution of neuron activations across a range of neuron indexes. The y-axis represents neuron activations, and the x-axis represents neuron indexes. The graph shows fluctuations in neuron activation levels, with some notable spikes and dips.
### Components/Axes
* **Title:** Neuron Activation Distribution
* **X-axis:** Neuron Indexes, ranging from 0 to 4000.
* **Y-axis:** Neuron Activations, ranging from -20 to 30.
* **Data Series:** A single teal line representing the neuron activation distribution.
### Detailed Analysis
The data series (teal line) shows the following trends:
* The baseline activation level fluctuates around 0.
* There are several positive spikes, indicating high activation levels at specific neuron indexes.
* There are also negative dips, indicating suppressed activation levels.
* The most prominent positive spikes occur around neuron indexes 200, 1750, and 3800.
* The most prominent negative dips occur around neuron indexes 2200 and 3200.
Specific data points (approximate):
* At Neuron Index 0, Neuron Activation is approximately 2.
* At Neuron Index 200, Neuron Activation peaks at approximately 28.
* At Neuron Index 1000, Neuron Activation is approximately -2.
* At Neuron Index 1750, Neuron Activation peaks at approximately 32.
* At Neuron Index 2000, Neuron Activation is approximately 2.
* At Neuron Index 2200, Neuron Activation dips to approximately -15.
* At Neuron Index 3000, Neuron Activation is approximately 1.
* At Neuron Index 3200, Neuron Activation dips to approximately -12.
* At Neuron Index 3800, Neuron Activation peaks at approximately 15.
* At Neuron Index 4000, Neuron Activation is approximately 2.
### Key Observations
* The neuron activation distribution is highly variable.
* There are distinct peaks and dips in activation levels, suggesting specific neurons or groups of neurons are more or less active.
* The majority of neurons have activation levels close to zero.
### Interpretation
The graph illustrates the activation patterns of neurons within a neural network or biological system. The spikes indicate neurons that are strongly activated, potentially responding to specific stimuli or features. The dips indicate neurons that are suppressed, possibly due to inhibitory signals or lack of relevant input. The overall distribution provides insights into the network's activity and how it processes information. The variability suggests that different neurons play different roles in the network's function. The presence of both positive and negative activations indicates a balance between excitatory and inhibitory processes.
</details>
Figure 6: Activation distributions of four selected tokens in LLaMA-7B.
Appendix G Limitations and future work
By exploring the internal states of LLM and introducing an EigenScore metric, the hallucination detection performance has been significantly improved. However, there are several limitations of this study. One critical limitation is that the proposed method relies on the internal information of the LLMs, therefore cannot be applied to the black-box models (OpenAI, 2023), where users can not access the hidden states. Additionally, our proposal is a sampling-based approach, necessitating the generation of multiple outputs, which introduces additional inference overhead for accurate hallucination detection. Furthermore, another limitation is that we only focus on hallucination detection in this study and have not yet mitigate the hallucination with our proposal. In the future work, we hope to reduce the inference cost of our proposal and leverage the EigenScore to mitigate hallucinations. We believe the proposed EigenScore is a strong baseline for detecting hallucination and we invite further researchers to utilize and enhance our proposal.
Appendix H Cases Study
H.1 Hallucination Detection Cases
We show several cases with LLaMA-7B and NQ dataset. The number of generation is set to $N=10$ . We determine the optimal detection threshold by maximizing the G-Mean value, which is defined as $\textbf{G-Mean}=\sqrt{TPR*(1-FPR)}$ . The hallucination detection thresholds for different metrics are Perplexity: 0.535; LN-Entropy: 0.153; LexicalSimilarity 0.489; SelfCheckGPT: 0.168; EigenScore: -1.74. For LexicalSimilarity, a score larger than the threshold indicates non-hallucination. For other metrics, a score smaller than the thresholds indicates non-hallucination. Green indicates non-hallucination answer and Red indicates hallucination answer generated by LLM. ✓ (✗) indicates that the hallucination is (not) correctly identified by the metric.
Question: the german princes who chose the holy roman empire were called GTAns: prince-electors LLMAns: electors BatchGenerations: [’electors’, ’electors’, ’electors’, ’electors’, ’electors’, ’electors’, ’electors’, ’electors’, ’electors’, ’electors’] Perplexity: 0.361 ✓ LN-Entropy: 0.027 ✓ LexicalSimilarity: 1.0 ✓ SentBERTScore: 0.0 ✓ EigenScore: -2.63 ✓ EigenValue: [4.87719579e+00 1.00000000e-03 1.00000000e-03 1.00000000e-03 1.00000000e-03 1.00000000e-03 1.00000000e-03 1.00000000e-03 1.00000000e-03 1.00000000e-03]
Question: where is fe best absorbed in the body GTAns: in the duodenum LLMAns: in the small intestine BatchGenerations: [’in the liver’, ’small intestine’, ’in the intestines’, ’the small intestine’, ’the small intestine’, ’in the liver’, ’small intestine’, ’fat’, ’in the small intestine’, ’fatty tissues’] Perplexity: 0.641 ✓ LN-Entropy: 0.213 ✓ LexicalSimilarity: 0.357 ✓ SentBERTScore: 0.258 ✓ EigenScore: -1.40 ✓ EigenValue: [3.71561676e+00 4.34496729e-01 3.77751922e-01 1.75326593e-01 9.92596975e-02 4.20723353e-02 2.49385766e-02 1.00000000e-03 1.00000000e-03 1.00000000e-03]
Question: who did the united states win its independence from GTAns: the British Empire LLMAns: britain BatchGenerations: [’britain’, ’england’, ’great britain’, ’great britain’, ’england’, ’england’, ’england’, ’england’, ’great britain’, ’great britain’] Perplexity: 0.598 ✗ LN-Entropy: 0.266 ✗ LexicalSimilarity: 0.415 ✗ SentBERTScore: 0.397 ✗ EigenScore: -2.23 ✓ EigenValue: [4.46843402e+00 2.82423429e-01 3.88702191e-02 1.00000000e-03 1.00000000e-03 1.00000000e-03 1.00000000e-03 1.00000000e-03 1.00000000e-03 1.00000000e-03]
Question: who won the most stanley cups in history GTAns: Montreal Canadiens LLMAns: the detroit red wings BatchGenerations: [’the detroit red wings’, ’the detroit red wings’, ’the detroit red wings’, ’the detroit red wings’, ’the detroit red wings’, ’the detroit red wings’, ’the detroit red wings’, ’the detroit red wings’, ’the detroit red wings’, ’the detroit red wings’] Perplexity: 0.366 ✗ LN-Entropy: 0.025 ✗ LexicalSimilarity: 1.0 ✗ SentBERTScore: 0.0 ✗ EigenScore: -2.63 ✗ EigenValue: [5.23534401e+00 1.00000000e-03 1.00000000e-03 1.00000000e-03 1.00000000e-03 1.00000000e-03 1.00000000e-03 1.00000000e-03 1.00000000e-03 1.00000000e-03]
Question: what is the second book in the alchemyst series GTAns: The Magician LLMAns: the alchemyst: the secret of the immortal Nicholas flamel BatchGenerations: [’the magician in the middle’, ”the magician’s nephew”, ’the magician’, ’the alchemyst’, ’the magician’, ’the alchemyst’, ’the magician in the middle’, ’the magician in amsterdam’, ’the magician in the middle’, ’the secret of the near witch’] Perplexity: 0.459 ✗ LN-Entropy: 0.207 ✓ LexicalSimilarity: 0.499 ✗ SentBERTScore: 0.431 ✓ EigenScore: -1.41 ✓ EigenValue: [2.09138499e+00 6.95605781e-01 3.85931973e-01 3.40671669e-01 2.15372994e-01 1.77304781e-01 1.00000000e-03 1.00000000e-03 1.00000000e-03 1.00000000e-03]
Question: a good that can be used in place of another good GTAns: A substitute good LLMAns: substitute BatchGenerations: [’a substitute’, ’a substitute’, ’substitute’, ’a substitute’, ’substitute’, ’substitute’, ’substitute’, ’substitute’, ’substitute’, ’substitute’] Perplexity: 0.614 ✗ LN-Entropy: 0.194 ✗ LexicalSimilarity: 0.844 ✓ SentBERTScore: 0.076 ✓ EigenScore: -2.40 ✓ EigenValue: [5.11365925e+00 1.75884104e-01 1.00000000e-03 1.00000000e-03 1.00000000e-03 1.00000000e-03 1.00000000e-03 1.00000000e-03 1.00000000e-03 1.00000000e-03]
Question: who said i will not go quietly into the night GTAns: Welsh poet Dylan Thomas LLMAns: douglas macarthur BatchGenerations: [’douglas macarthur’, ’elvis presley’, ’douglas macarthur’, ’douglas macarthur’, ’douglas macarthur’, ’robin williams’, ’robert f. kennedy’, ’robin williams’, ’robert f kennedy’, ’Dwight Eisenhower’] Perplexity: 0.502 ✗ LN-Entropy: 0.121 ✗ LexicalSimilarity: 0.178 ✓ SentBERTScore: 0.337 ✓ EigenScore: -1.61 ✓ EigenValue: [3.32824135e+00 5.87944819e-01 3.70390066e-01 1.70849836e-01 1.17707239e-01 5.17925563e-03 1.00000000e-03 1.00000000e-03 1.00000000e-03 1.00000000e-03]
Question: when did they stop saying mass in latin GTAns: from 1967 onwards LLMAns: 1969 BatchGenerations: [’in 1969’, ’1969’, ’around 1969’, ’in 1965’, ’in 1969’, ’1969’, ’In 1969, the Roman Missal was changed from Latin to the vernacular.’, ’1969’, ’1969 when the second vatican council was held’, ’1969’] Perplexity: 0.631 ✓ LN-Entropy: 0.152 ✗ LexicalSimilarity: 0.540 ✗ SentBERTScore: 0.273 ✓ EigenScore: -1.59 ✓ EigenValue: [3.80408192e+00 4.83987672e-01 3.03207580e-01 8.80366008e-02 6.59790286e-02 3.26742841e-02 1.00000000e-03 1.00000000e-03 1.00000000e-03 1.00000000e-03]
Question: where does the highway of heroes start and end GTAns: Glen Miller Road in Trenton LLMAns: it starts in ottawa and ends in toronto BatchGenerations: [’start in ottawa and end in toronto’, ’it starts in toronto and ends in ottawa’, ”it starts at the queen’s park gate at queen’s park and ends at toronto’s coronation park”, ”it starts in toronto and ends at queen’s park”, ’starts in Toronto and ends in Trenton’, ’it starts at the CNE and ends at the cenotaph in downtown toronto’, ’it starts in downtown toronto and ends in ottawa’, ’it starts in the city of Toronto and ends in the city of Hamilton’, ’it starts in toronto and ends in ottawa’, ’it starts in Toronto and ends in Ottawa’] Perplexity: 0.657 ✓ LN-Entropy: 0.260 ✓ LexicalSimilarity: 0.594 ✗ SentBERTScore: 0.149 ✗ EigenScore: -1.05 ✓ EigenValue: [3.31983018e+00 3.98560810e-01 2.17094299e-01 2.06965709e-01 1.53575354e-01 1.27925588e-01 7.82365136e-02 3.28158137e-02 1.01995086e-02 1.00000000e-03]
Question: which body part(s) occupy the greatest portion of the primary motor cortex GTAns: face LLMAns: the hand BatchGenerations: [’the hand’, ’the hand’, ’the fingers’, ’the hand’, ’the hand’, ’the hand and the foot’, ’the hand’, ’the hand and the foot’, ’the hand and face’, ’arms and legs’] Perplexity: 1.41 ✓ LN-Entropy: 0.300 ✓ LexicalSimilarity: 0.568 ✗ SentBERTScore: 0.163 ✗ EigenScore: -1.69 ✓ EigenValue: [3.76273036e+00 6.16284067e-01 1.96541049e-01 1.73505005e-01 1.28407153e-01 1.00000000e-03 1.00000000e-03 1.00000000e-03 1.00000000e-03 1.00000000e-03]
Question: who said have you no sense of decency GTAns: Joseph Nye Welch LLMAns: Joseph Nye Welch BatchGenerations: [’Joseph N. Welch’, ’Joseph N. Welch’, ’joe stalin’, ’joseph mccarthy’, ’Joseph N. Welch’, ’Joseph N. Welch’, ’Joseph Nye Welch’, ’joseph mccarthy’, ’joe mccarthy’, ’joseph mccarthy’] Perplexity: 0.666 ✗ LN-Entropy: 0.212 ✗ LexicalSimilarity: 0.437 ✗ SentBERTScore: 0.391 ✗ EigenScore: -1.85 ✓ EigenValue: [3.63114083e+00 8.11672323e-01 2.00385898e-01 3.19140618e-02 1.74251264e-02 1.00000000e-03 1.00000000e-03 1.00000000e-03 1.00000000e-03 1.00000000e-03]
H.2 Model generations with many and few Outliers
To demonstrate the relationship between the number of extreme features and model outputs, we provide several examples with many/few extreme features. The results show that when there are many extreme features, the model tends to generate consistent hallucination outputs across multiple generations. Instead, when there are few extreme features, the model generates diverse hallucination outputs which can be spotted by different hallucination detection metrics.
Question: who sang on great gig in the sky GTAns: Clare Torry LLMAns: freddie mercury AvgNumOutliers: 15 BatchGenerations: [’freddie mercury’, ’freddie mercury’, ’freddie mercury’, ’freddie mercury’, ’freddie mercury’, ’freddie mercury’, ’freddie mercury’, ’freddie mercury’, ’freddie mercury’, ’freddie mercury’] Perplexity: 0.263 ✗ LN-Entropy: 0.028 ✗ LexicalSimilarity: 1.0 ✗ SentBERTScore: 0.0 ✗ EigenScore: -2.63 ✗ EigenValue: [4.65740187e+00 1.00000000e-03 1.00000000e-03 1.00000000e-03 1.00000000e-03 1.00000000e-03 1.00000000e-03 1.00000000e-03 1.00000000e-03 1.00000000e-03]
Question: what are the top five wine producing states GTAns: Washington LLMAns: California AvgNumOutliers: 13 BatchGenerations: [’ California,’, ’ California,’, ’ california,’, ’ California,’, ’ California,’, ’ California,’, ’ California,’, ’ california,’, ’ California,’, ’ California,’] Perplexity: 0.368 ✗ LN-Entropy: 0.075 ✗ LexicalSimilarity: 1.0 ✗ SentBERTScore: 0.054 ✗ EigenScore: -2.42 ✗ EigenValue: [5.30709315e+00 1.13222379e-01 1.00000000e-03 1.00000000e-03 1.00000000e-03 1.00000000e-03 1.00000000e-03 1.00000000e-03 1.00000000e-03 1.00000000e-03]
Question: how many seasons of rules of engagement is there GTAns: 7 LLMAns: 4 seasons AvgNumOutliers: 2 BatchGenerations: [’3 seasons’, ’4 seasons’, ’4 seasons’, ’6 seasons’, ’7 seasons’, ’3 (2007-2009)’, ’3 (2007-2009)’, ’4 seasons’, ’three’, ’11 seasons’] Perplexity: 0.996 ✓ LN-Entropy: 0.292 ✓ LexicalSimilarity: 0.307 ✓ SentBERTScore: 0.285 ✓ EigenScore: -1.60 ✓ EigenValue: [3.58548815e+00 5.87838054e-01 2.28057934e-01 1.36461300e-01 3.49712302e-02 1.11346059e-02 3.82259086e-03 1.00000000e-03 1.00000000e-03 1.00000000e-03]
Question: where did the first persian gulf war take place GTAns: Israel LLMAns: kuwait AvgNumOutliers: 3 BatchGenerations: [’Iraq’, ’Iraq and Kuwait’, ’Iraq’, ’kuwait’, ’kuwait’, ’in the middle east’, ’in iraq’, ’kuwait’, ’iraq’, ’kuwait’] Perplexity: 0.546 ✓ LN-Entropy: 0.281 ✓ LexicalSimilarity: 0.339 ✓ SentBERTScore: 0.224 ✓ EigenScore: -1.62 ✓ EigenValue: [3.59463352e+00 4.23782982e-01 2.57087067e-01 1.41513403e-01 6.20790226e-02 1.75980481e-02 1.00000000e-03 1.00000000e-03 1.00000000e-03 1.00000000e-03]
H.3 Impact of Feature Clipping
The texts in yellow represents model generations after applying feature clipping. The results show that after feature clipping, the overconfident generations can be appropriately suppressed, and some self-consistent hallucinations are finally identified.
Question: what are the top five wine producing states GTAns: Washington LLMAns: California BatchGenerations: [’ California,’, ’ California,’, ’ california,’, ’ California,’, ’ California,’, ’ California,’, ’ California,’, ’ california,’, ’ California,’, ’ California,’] Perplexity: 0.368 ✗ LN-Entropy: 0.075 ✗ LexicalSimilarity: 1.0 ✗ SentBERTScore: 0.054 ✗ EigenScore: -2.42 ✗ EigenValue: [5.30709315e+00 1.13222379e-01 1.00000000e-03 1.00000000e-03 1.00000000e-03 1.00000000e-03 1.00000000e-03 1.00000000e-03 1.00000000e-03 1.00000000e-03] BatchGenerations: [’california’, ’california’, ’Washington’, ’california’, ’new york’, ’california’, ’washington’, ’california’, ’new york’, ’michigan’] EigenScore: -1.32 ✓ EigenValue: [3.23392755e+00 8.41049340e-01 2.52322804e-01 1.33473529e-01 7.19449437e-02 6.12184197e-02 1.02734249e-02 5.33703500e-03 3.09878029e-03 1.00000000e-03]
Question: who sang on great gig in the sky GTAns: Clare Torry LLMAns: freddie mercury AvgNumOutliers: 15 BatchGenerations: [’freddie mercury’, ’freddie mercury’, ’freddie mercury’, ’freddie mercury’, ’freddie mercury’, ’freddie mercury’, ’freddie mercury’, ’freddie mercury’, ’freddie mercury’, ’freddie mercury’] Perplexity: 0.263 ✗ LN-Entropy: 0.028 ✗ LexicalSimilarity: 1.0 ✗ SentBERTScore: 0.0 ✗ EigenScore: -2.63 ✗ EigenValue: [4.65740187e+00 1.00000000e-03 1.00000000e-03 1.00000000e-03 1.00000000e-03 1.00000000e-03 1.00000000e-03 1.00000000e-03 1.00000000e-03 1.00000000e-03] BatchGenerations: [’claire torry’, ’freddie mercury’, ’freddie mercury’, ’freddie mercury’, ’freddie mercury’, ’freddie mercury’, ’freddie mercury’, ’freddie mercury’, ’freddie mercury’, ’freddie mercury’] EigenScore: -2.38 ✗ EigenValue: [4.38745800e+00 3.14982649e-01 1.00000000e-03 1.00000000e-03 1.00000000e-03 1.00000000e-03 1.00000000e-03 1.00000000e-03 1.00000000e-03 1.00000000e-03]
Question: who are you in assassin’s creed 4 GTAns: third-person perspective LLMAns: Edward Kenway BatchGenerations: [’Edward Kenway’, ’Edward Kenway’, ’Edward Kenway’, ’Edward Kenway’, ’Edward Kenway’, ’Edward Kenway’, ’Edward Kenway’, ’Edward Kenway’, ’Edward Kenway’, ’Edward Kenway’] Perplexity: 0.264 ✗ LN-Entropy: 0.002 ✗ LexicalSimilarity: 1.0 ✗ SentBERTScore: 0.0 ✗ EigenScore: -2.67 ✗ EigenValue: [2.10973201e+00 1.00000000e-03 1.00000000e-03 1.00000000e-03 1.00000000e-03 1.00000000e-03 1.00000000e-03 1.00000000e-03 1.00000000e-03 1.00000000e-03] BatchGenerations: [’Edward Kenway’, ’Edward Kenway’, ’Connor’, ’Edward Kenway’, ’connor’, ’Connor’, ’alexander hamilton’, ’Edward Kenway’, ’ezio’, ’connor’] EigenScore: -1.68 ✓ EigenValue: [3.47825477e+00 7.48127381e-01 3.24792650e-01 2.17182636e-01 8.15050807e-02 1.00000000e-03 1.00000000e-03 1.00000000e-03 1.00000000e-03 1.00000000e-03]