# ConceptMath: A Bilingual Concept-wise Benchmark for Measuring Mathematical Reasoning of Large Language Models
Abstract
This paper introduces ConceptMath, a bilingual (English and Chinese), fine-grained benchmark that evaluates concept-wise mathematical reasoning of Large Language Models (LLMs). Unlike traditional benchmarks that evaluate general mathematical reasoning with an average accuracy, ConceptMath systematically organizes math problems under a hierarchy of math concepts, so that mathematical reasoning can be evaluated at different granularity with concept-wise accuracies. Based on our ConcepthMath, we evaluate a broad range of LLMs, and we observe existing LLMs, though achieving high average accuracies on traditional benchmarks, exhibit significant performance variations across different math concepts and may even fail catastrophically on the most basic ones. Besides, we also introduce an efficient fine-tuning strategy to enhance the weaknesses of existing LLMs. Finally, we hope ConceptMath could guide the developers to understand the fine-grained mathematical abilities of their models and facilitate the growth of foundation models The data and code are available at https://github.com/conceptmath/conceptmath.. footnotetext: * First three authors contributed equally. footnotetext: ${}^{\dagger}$ Corresponding Author: Jiaheng Liu.
1 Introduction
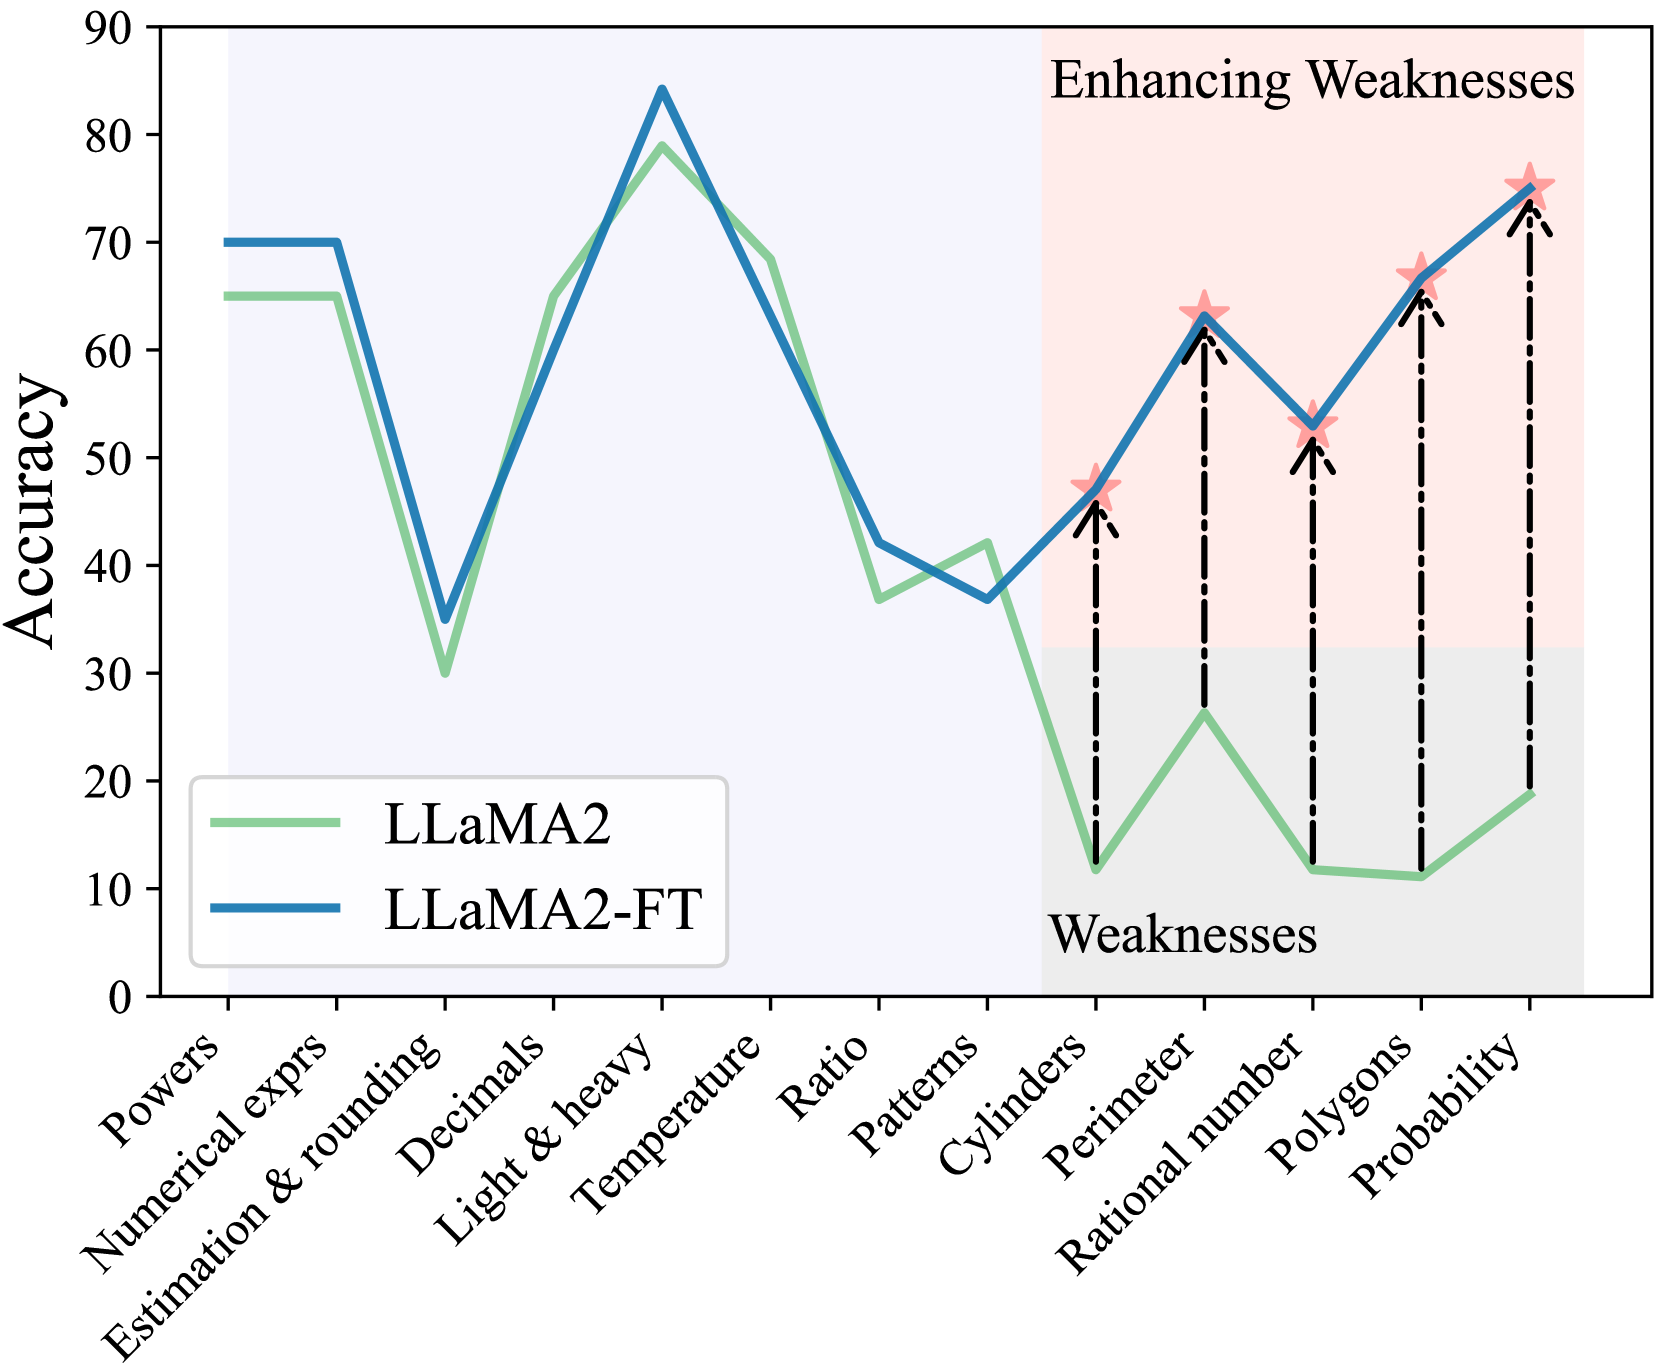
Mathematical reasoning is a crucial capability for Large Language Models (LLMs). Recent advancements in LLMs, including Anthropic Anthropic (2023), GPT-4 (OpenAI, 2023), and LLaMA (Touvron et al., 2023a), have demonstrated impressive mathematical reasoning on existing benchmarks with high average accuracies on datasets like GSM8K (Cobbe et al., 2021). Although these benchmarks are able to measure the overall mathematical reasoning capabilities of LLMs on average, they fail to probe the fine-grained failure modes of mathematical reasoning on specific mathematical concepts. For example, Fig. 1 shows that the performance of LLaMA2-13B varies significantly across different concepts and fails on simple concepts like Rational number and Cylinders. It is crucial to know these specific failure modes of the language model, especially in some practical applications where we need to focus on specific mathematical abilities. For example, for financial analysts, calculation and statistics are the concepts of most interest while others like geometry are not as important.
Moreover, the mathematics system, by its nature, is more fine-grained than holistic. It is typically organized into distinct math concepts https://en.wikipedia.org/wiki/Lists_of_mathematics_topics, and humans develop comprehensive mathematical capabilities through a concept-by-concept, curriculum-based learning process (Simon, 2011; Fritz et al., 2013). These issues underscore the core motivation of this paper: the need for a fine-grained benchmark that evaluates concept-wise mathematical reasoning capabilities of LLMs.
<details>
<summary>x1.png Details</summary>
### Visual Description
## Line Chart: Enhancing Weaknesses
### Overview
This line chart compares the accuracy of two language models, LLaMA2 and LLaMA2-FT, across a range of mathematical and logical reasoning tasks identified as "Weaknesses". The chart displays accuracy on the y-axis against different task categories on the x-axis. The chart aims to demonstrate the impact of fine-tuning (FT) on improving performance in areas where the base model (LLaMA2) struggles.
### Components/Axes
* **Title:** "Enhancing Weaknesses" (top-center)
* **X-axis Label:** Task Categories (bottom-center)
* Categories: "Powers", "Numerical exprs", "Estimation & rounding", "Decimals", "Light & heavy", "Temperature", "Ratio", "Patterns", "Cylinders", "Perimeter", "Rational number", "Polygons", "Probability"
* **Y-axis Label:** "Accuracy" (left-center), ranging from 0 to 90.
* **Legend:** (bottom-left)
* Light Green Line: "LLaMA2"
* Dark Blue Line: "LLaMA2-FT"
### Detailed Analysis
The chart presents two lines representing the accuracy of each model across the listed task categories.
**LLaMA2 (Light Green Line):**
* **Trend:** The line fluctuates significantly. It starts at approximately 70 accuracy for "Powers", dips to around 20 for "Numerical exprs", rises to approximately 70 for "Estimation & rounding", then falls to around 50 for "Decimals". It peaks at approximately 85 for "Temperature", drops to around 60 for "Ratio", then declines to a low of approximately 10 for "Patterns". It then rises to approximately 60 for "Cylinders", falls to approximately 40 for "Perimeter", rises to approximately 60 for "Rational number", then rises to approximately 75 for "Polygons", and finally falls to approximately 15 for "Probability".
* **Data Points (approximate):**
* Powers: 70
* Numerical exprs: 20
* Estimation & rounding: 70
* Decimals: 50
* Light & heavy: 60
* Temperature: 85
* Ratio: 60
* Patterns: 10
* Cylinders: 60
* Perimeter: 40
* Rational number: 60
* Polygons: 75
* Probability: 15
**LLaMA2-FT (Dark Blue Line):**
* **Trend:** This line also fluctuates, but generally maintains higher accuracy than LLaMA2, especially in the "Weaknesses" categories. It starts at approximately 65 for "Powers", dips to around 30 for "Numerical exprs", rises to approximately 65 for "Estimation & rounding", then falls to around 40 for "Decimals". It peaks at approximately 80 for "Temperature", drops to around 50 for "Ratio", then rises to approximately 65 for "Patterns". It then rises to approximately 70 for "Cylinders", falls to approximately 55 for "Perimeter", rises to approximately 65 for "Rational number", then rises to approximately 75 for "Polygons", and finally rises to approximately 70 for "Probability".
* **Data Points (approximate):**
* Powers: 65
* Numerical exprs: 30
* Estimation & rounding: 65
* Decimals: 40
* Light & heavy: 55
* Temperature: 80
* Ratio: 50
* Patterns: 65
* Cylinders: 70
* Perimeter: 55
* Rational number: 65
* Polygons: 75
* Probability: 70
### Key Observations
* LLaMA2-FT consistently outperforms LLaMA2 across all categories.
* Both models exhibit the lowest accuracy on "Patterns" and "Probability".
* The largest performance gains from fine-tuning are observed in "Patterns", "Cylinders", "Polygons", and "Probability".
* "Temperature" is the category where both models achieve their highest accuracy.
* The gap between the two models is most pronounced in the "Weaknesses" categories (Patterns, Cylinders, Perimeter, Rational number, Polygons, Probability).
### Interpretation
The chart demonstrates that fine-tuning (LLaMA2-FT) significantly improves the accuracy of the LLaMA2 model, particularly in areas where the base model struggles. The tasks categorized as "Weaknesses" show the most substantial gains from fine-tuning, suggesting that the fine-tuning process effectively addresses these specific challenges. The consistent outperformance of LLaMA2-FT indicates that the fine-tuning data and methodology were successful in enhancing the model's reasoning capabilities. The low accuracy scores for "Patterns" and "Probability" for both models suggest these areas remain challenging for the model, even after fine-tuning, and may require further investigation or specialized training. The high accuracy on "Temperature" could be due to the relative simplicity of this task or the presence of relevant information in the pre-training data. The chart provides strong evidence that fine-tuning is a valuable technique for improving the performance of language models on specific tasks and addressing identified weaknesses.
</details>
Figure 1: The concept-wise accuracies of LLaMA2-13B and the fine-tuned version based on our efficient fine-tuning method (i.e., LLaMA2-FT).
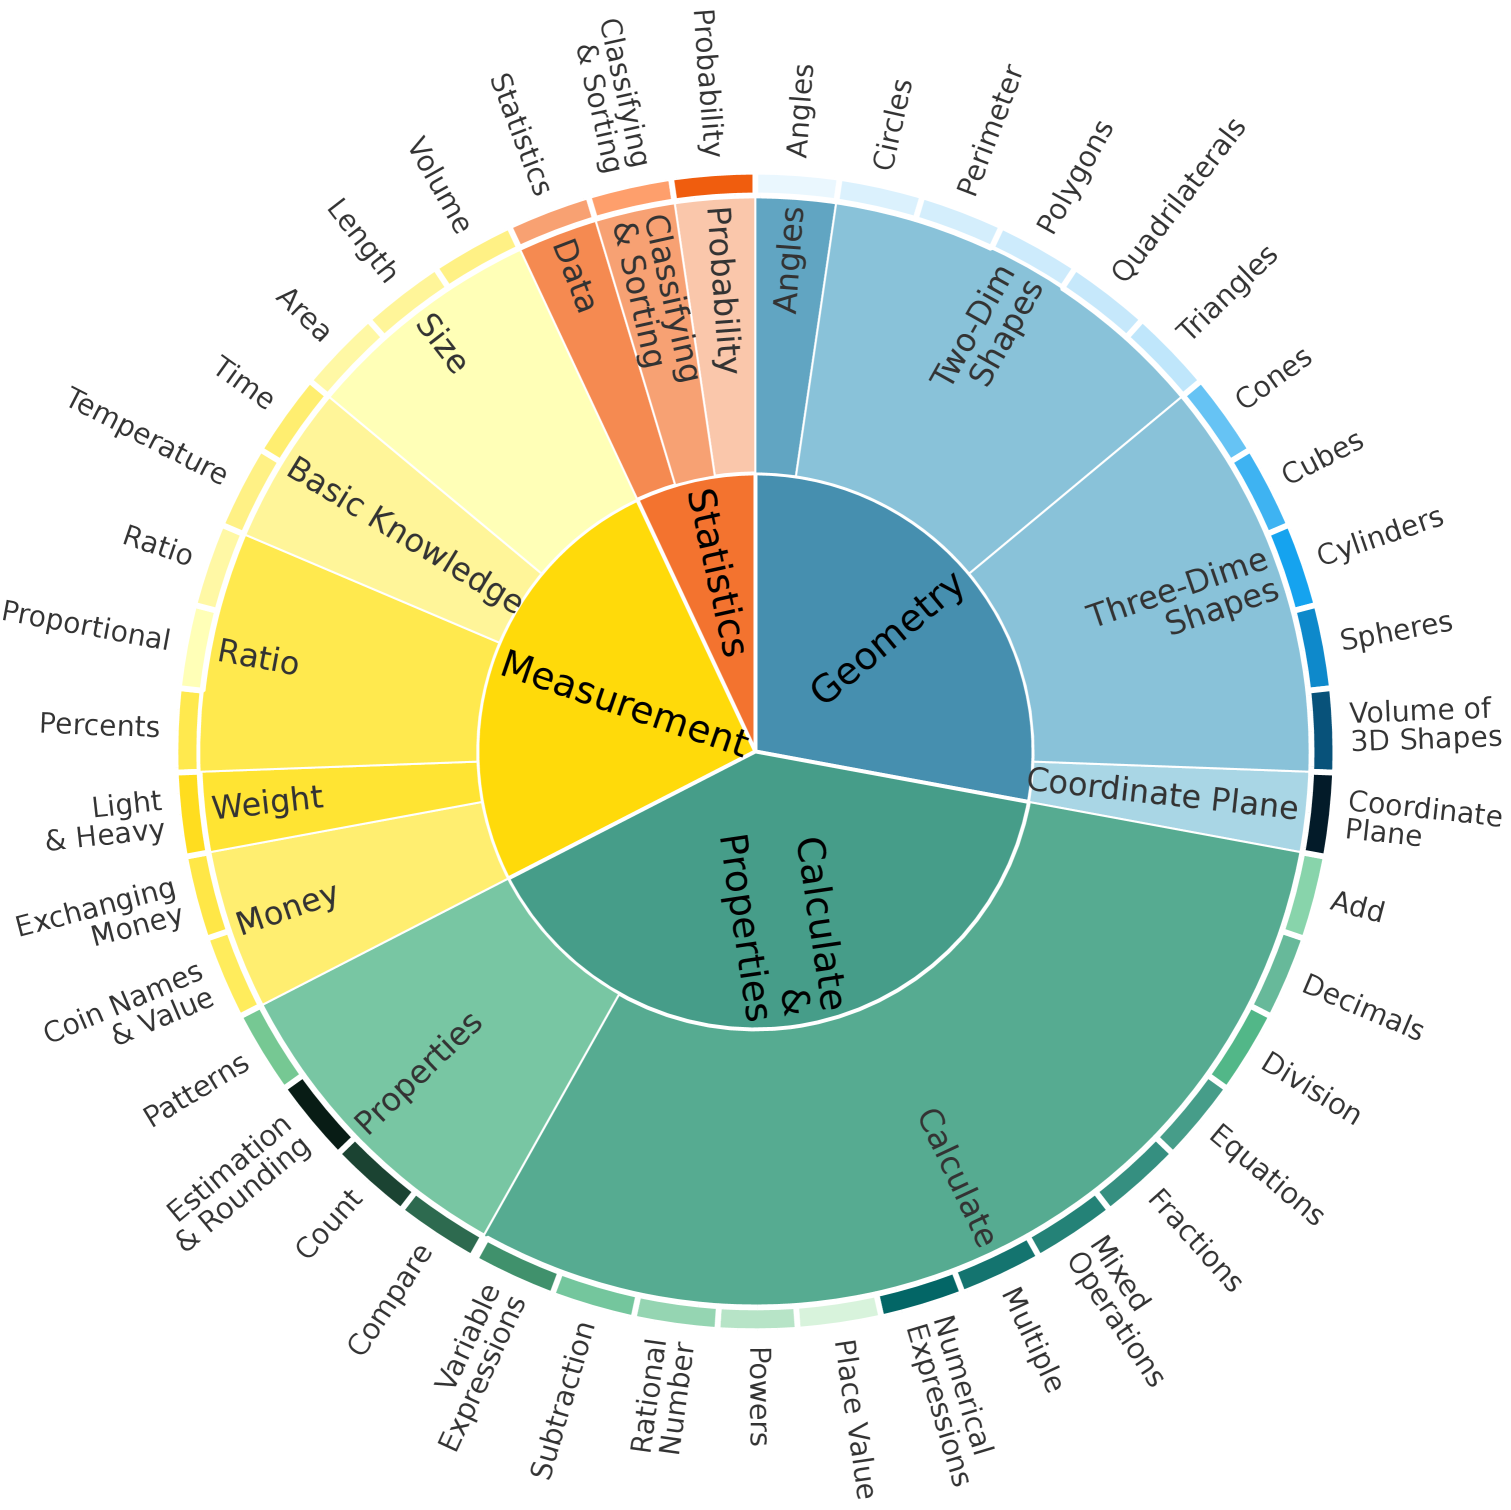
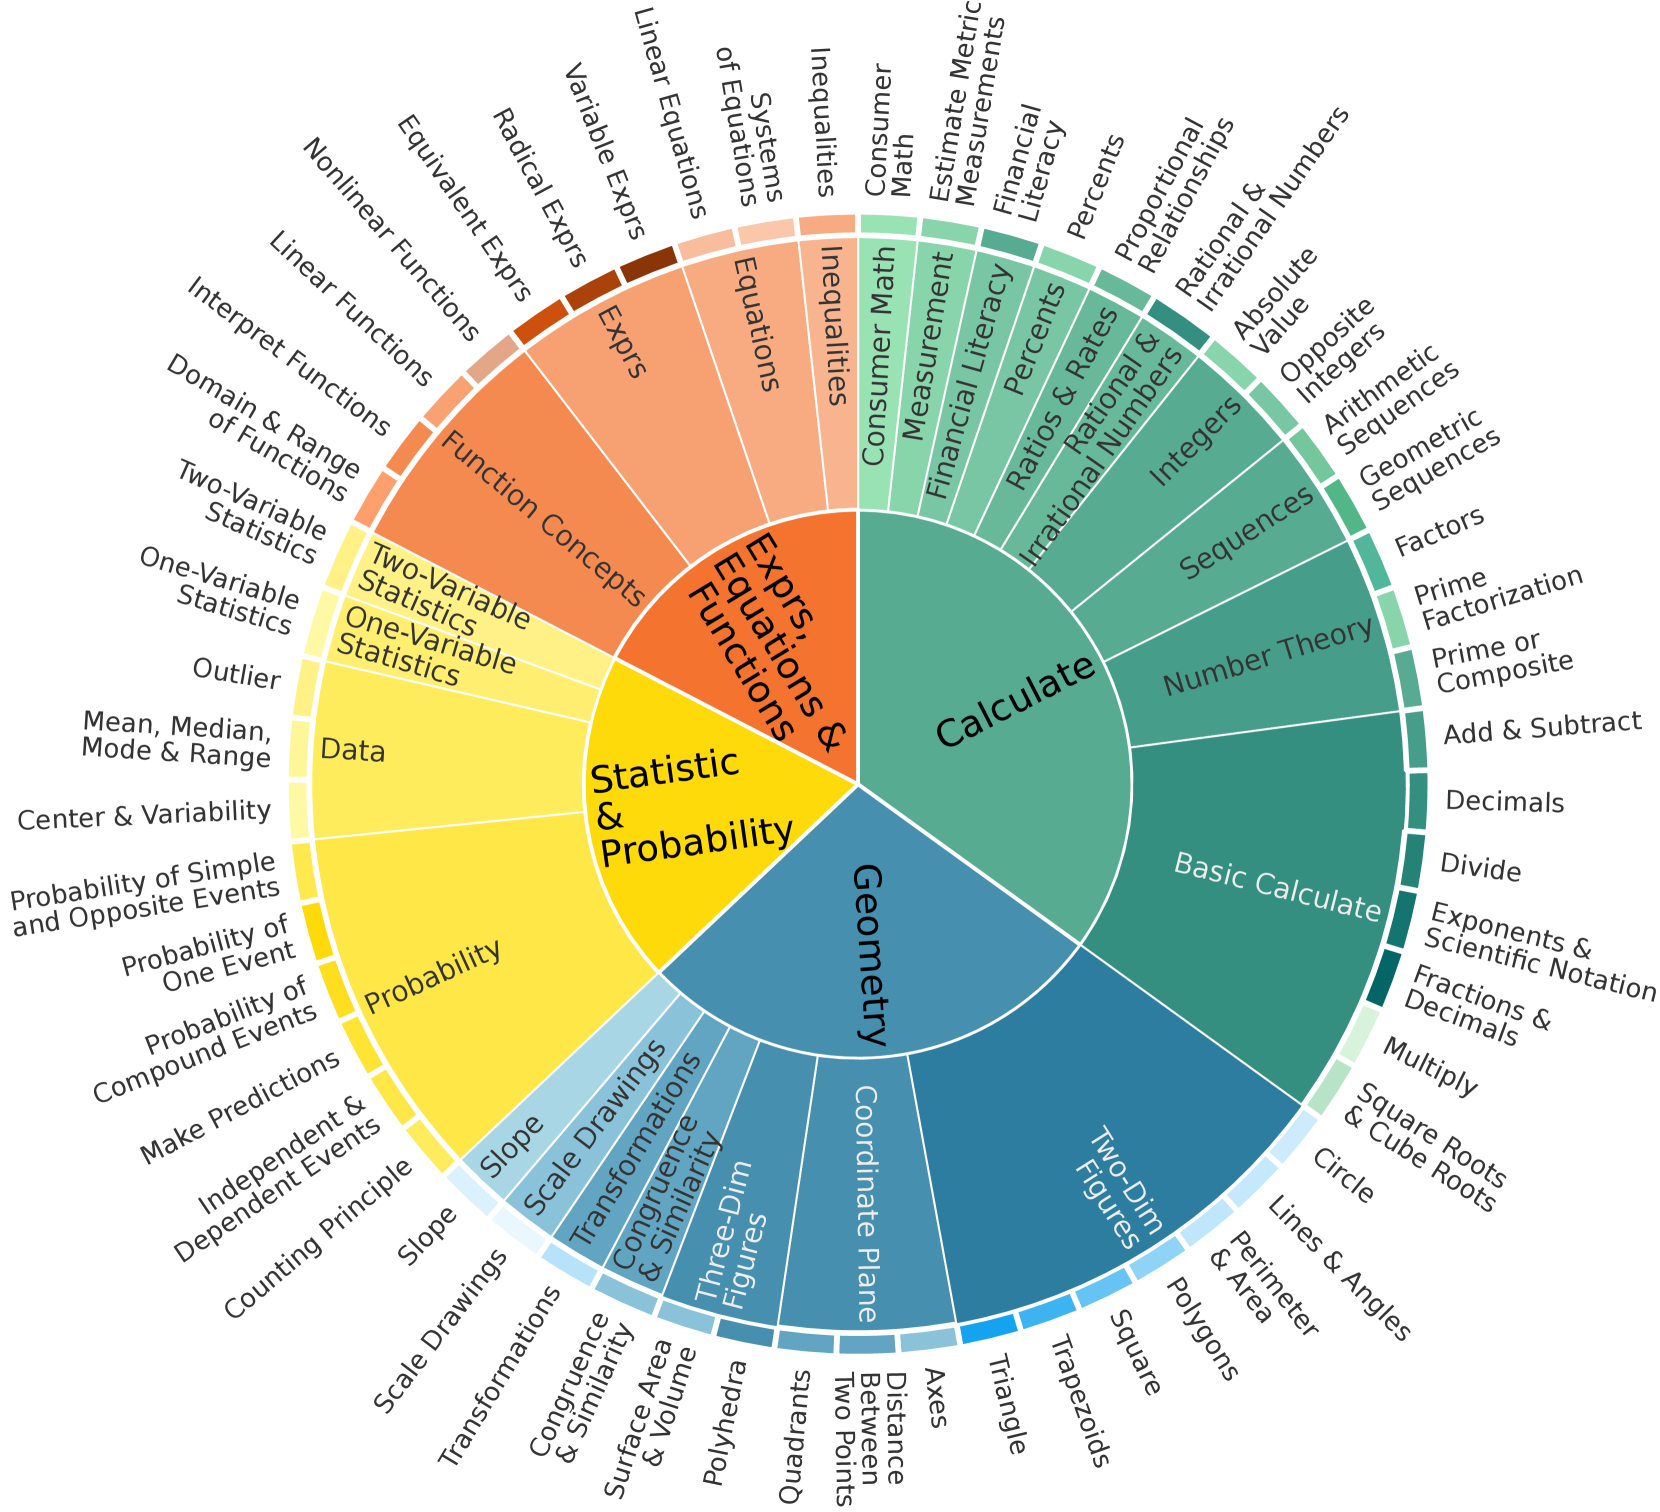
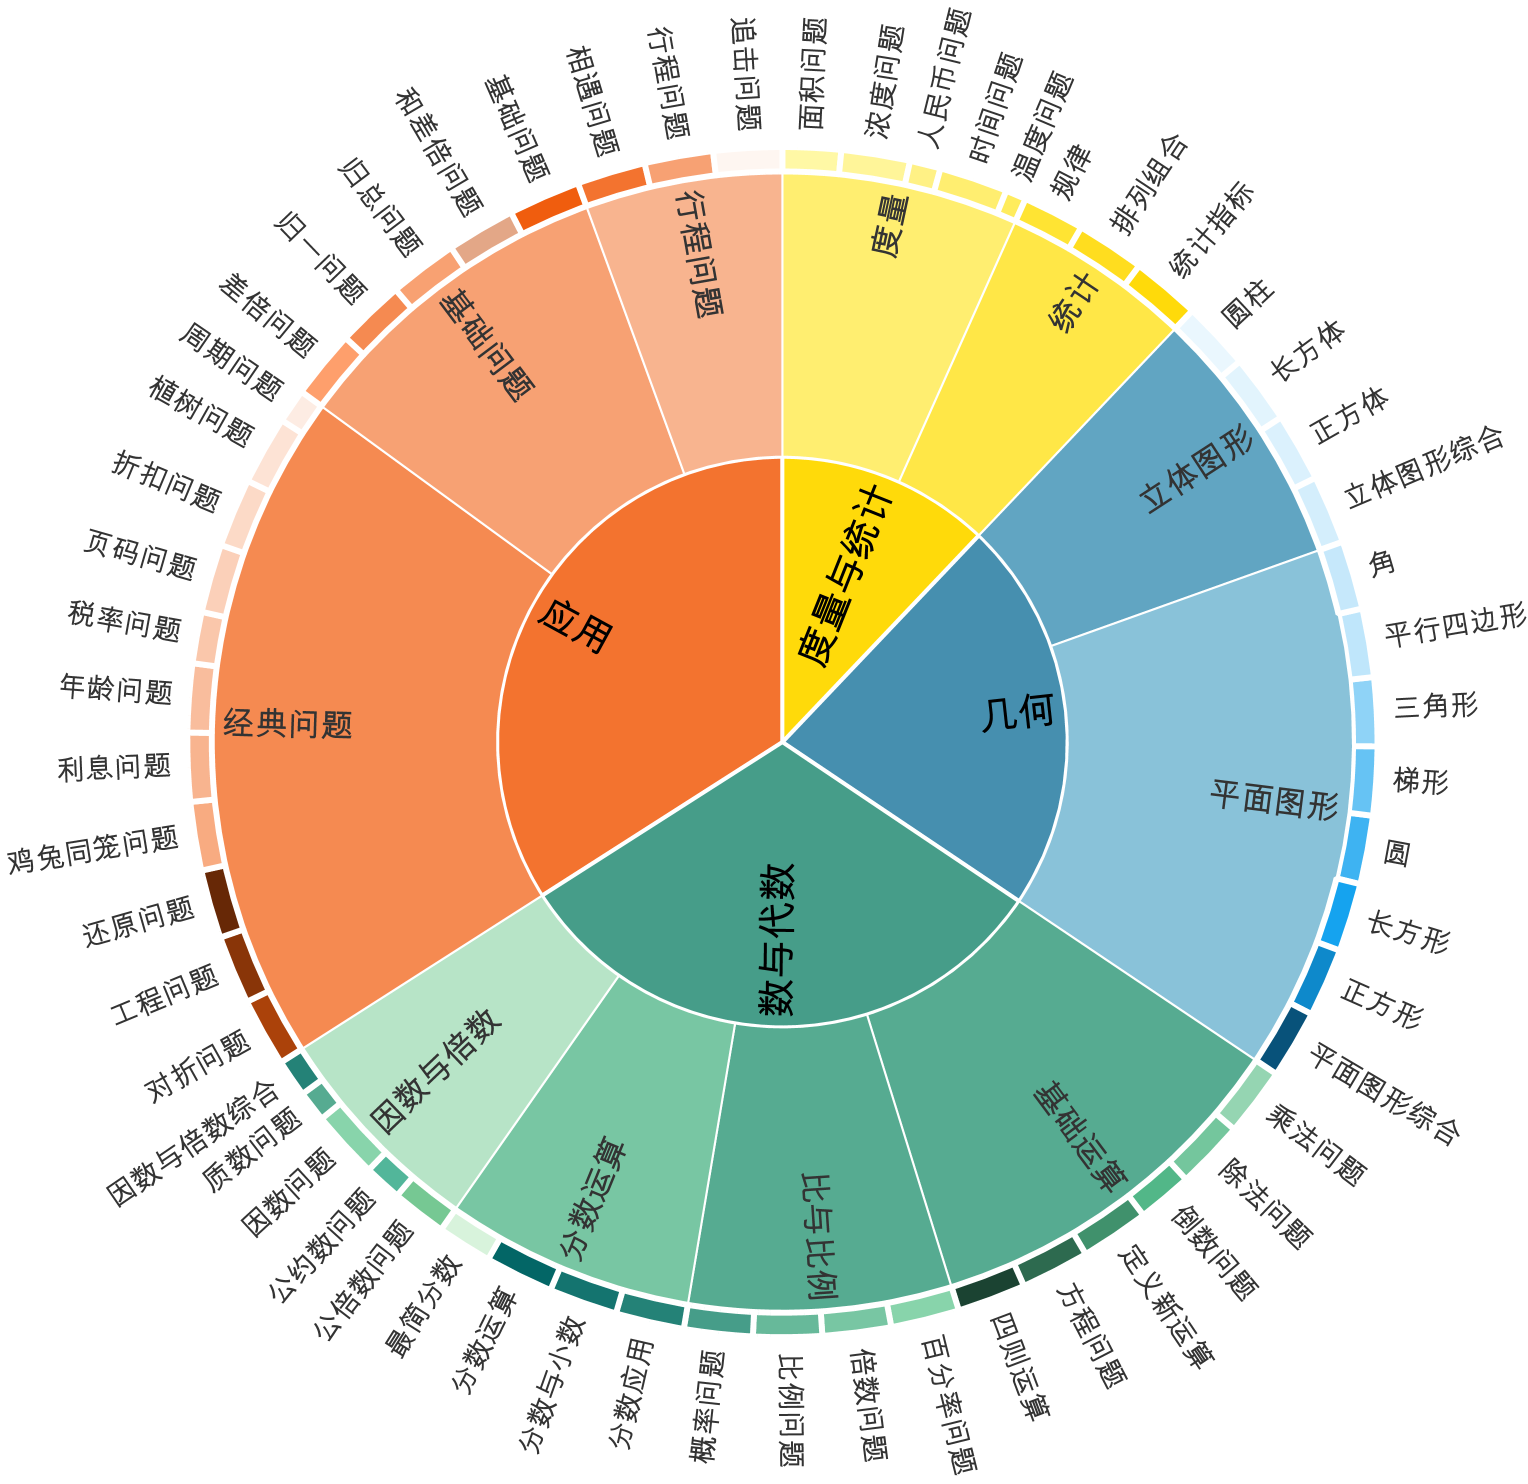
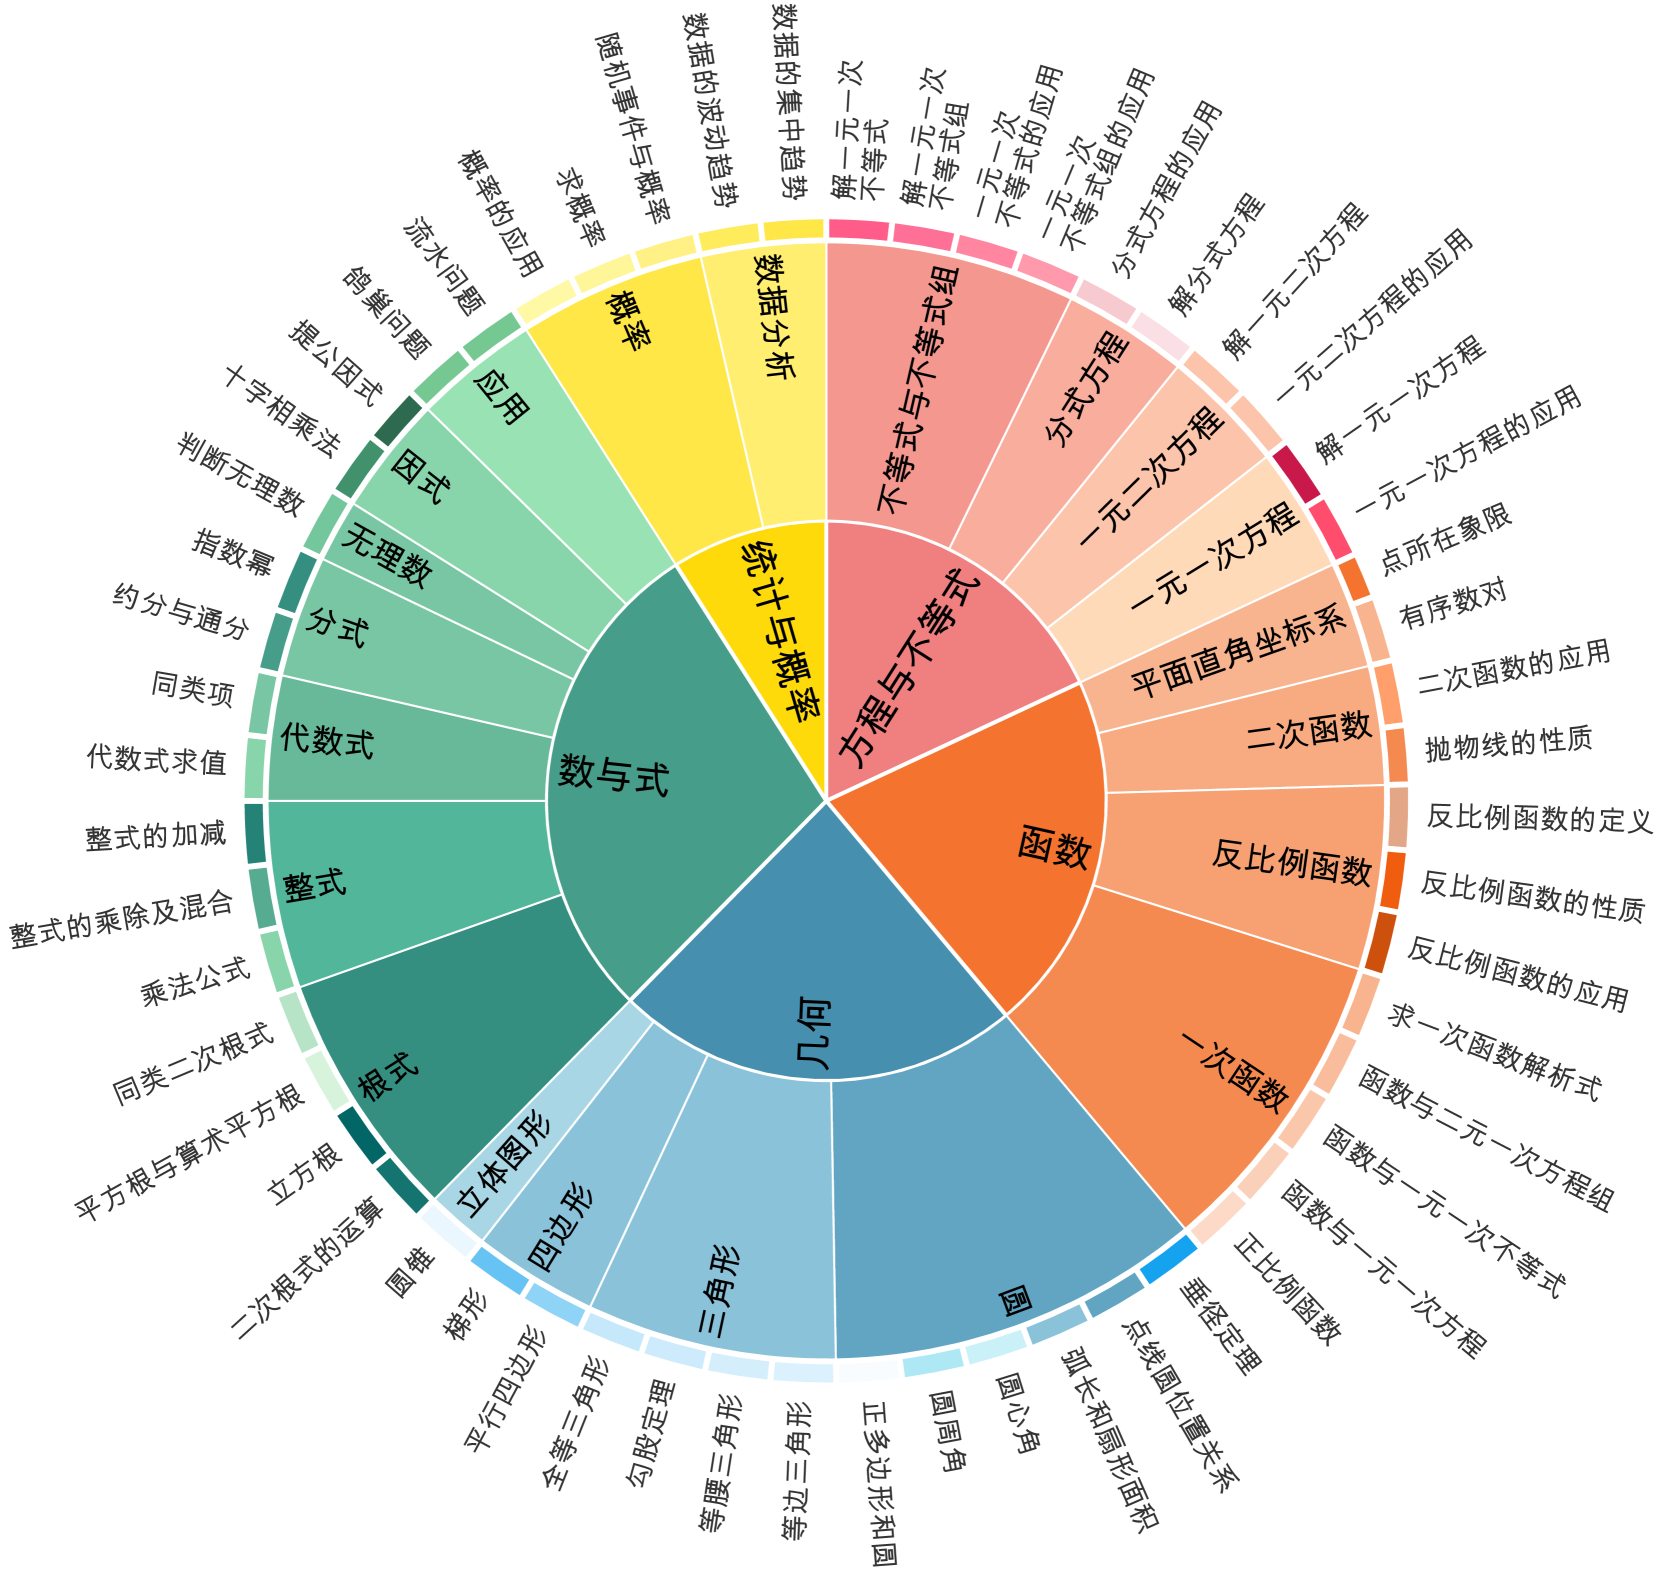
Therefore, first, we introduce ConceptMath, the first bilingual (English and Chinese), concept-wise benchmark for measuring mathematical reasoning. ConceptMath gathers math concepts from four educational systems, resulting in four distinct mathematical concept systems: English Elementary, English Middle, Chinese Elementary, and Chinese Middle The four concept systems are abbreviated as Elementary-EN, Middle-EN, Elementary-ZH, and Middle-ZH.. Each of these concept systems organizes around 50 atomic math concepts under a three-level hierarchy and each concept includes approximately 20 mathematical problems. Overall, ConceptMath comprises a total of 4011 math word problems across 214 math concepts, and Fig. 2 shows the diagram overview of ConceptMath.
Second, based on our ConceptMath, we perform extensive experiments to assess the mathematical reasoning of existing LLMs, including 2 close-sourced LLMs and 17 open-sourced LLMs. These evaluations were performed in zero-shot, chain-of-thought (CoT), and few-shot settings. To our surprise, even though most of the evaluated LLMs claim to achieve high average accuracies on traditional mathematical benchmarks (e.g., GSM8K), they fail catastrophically across a wide spectrum of mathematical concepts.
Third, to make targeted improvements on underperformed math concepts, we propose an efficient fine-tuning strategy by first training a concept classifier and then crawling a set of samples from a large open-sourced math dataset Paster et al. (2023); Wang et al. (2023b) for further LLMs fine-tuning. In Fig. 1, for LLaMA2-FT, we observe that the results of these weaknesses improved a lot after using the efficient fine-tuning method.
In summary, our contributions are as follows:
- We introduce ConceptMath, the first bilingual, concept-wise benchmark for measuring mathematical reasoning. ConceptMath encompasses 4 systems, approximately 214 math concepts, and 4011 math word problems, which can guide further improvements on the mathematical reasoning of existing models.
- Based on ConceptMath, we evaluate many LLMs and perform a comprehensive analysis of their results. For example, we observe that most of these LLMs (including open-sourced, closed-sourced, general-purpose, or math-specialized models) show significant variations in their performance results across math concepts.
- We also evaluate the contamination rate of our ConceptMath and introduce a simple and efficient fine-tuning method to improve the weaknesses of existing LLMs.
<details>
<summary>x2.png Details</summary>
### Visual Description
\n
## Diagram: Math Curriculum Wheel
### Overview
The image depicts a circular diagram, resembling a wheel or pie chart, representing a math curriculum. The center of the wheel is labeled "
</details>
((a)) English Elementary (Elementary-EN)
<details>
<summary>x3.png Details</summary>
### Visual Description
\n
## Diagram: Math Concepts Map
### Overview
The image is a diagram representing a mind map or concept map of various mathematical topics. It's structured around a central node labeled "Exprs, Equations & Functions" with branches radiating outwards, categorizing different areas of mathematics. The diagram uses a radial layout, with topics becoming more specific as they move further from the center.
### Components/Axes
The diagram consists of the following main branches/categories:
* **Exprs (Expressions)**: Includes topics like Nonlinear Expressions, Radical Expressions, Variable Equations, Linear Equations, Equivalent Equations, and Systems of Equations.
* **Equations**: Includes topics like Consumer Math, Measurement Math, Estimate Metric Measurements, Financial Literacy, Percents, Proportional Relationships, Rational & Irrational Numbers, Absolute Value, Integers, Arithmetic Sequences, Geometric Sequences, Factors, Prime Factorization, Prime or Composite.
* **Functions**: Includes topics like Function Concepts, Interpret Functions, Domain & Range of Functions, Two-Variable Statistics, One-Variable Statistics, Outlier, Mean, Median, Mode & Range, Data, Center & Variability.
* **Calculate**: Includes topics like Number Theory, Sequences, Basic Calculate, Add & Subtract, Decimals, Divide, Exponents & Scientific Notation, Fractions & Decimals, Multiply, Square Roots & Cube Roots.
* **Geometry**: Includes topics like Probability, Statistic & Probability, Probability of Simple and Opposite Events, Probability of One Event, Probability of Events, Compound Events, Make Predictions, Independent & Dependent Events, Counting Principle, Slope, Scale Drawings, Transformations, Congruence & Similarity, Three-Dim Figures, Coordinate Plane Geometry, Quadrants, Distance Between Two Points, Triangle, Axes, Polyhedra, Square, Trapezoids, Two-Dim Figures, Perimeter & Angles, Circle, Lines & Area.
### Detailed Analysis or Content Details
The diagram is a visual organization of mathematical concepts, not a quantitative chart. It doesn't contain numerical data. Instead, it presents a hierarchical structure of topics.
* **Central Node:** "Exprs, Equations & Functions" is positioned at the center of the diagram.
* **First Level Branches:** The five main branches (Exprs, Equations, Functions, Calculate, Geometry) radiate outwards from the central node.
* **Second Level Branches:** Each main branch further divides into more specific subtopics. For example, under "Exprs," we find "Nonlinear Expressions," "Radical Expressions," etc.
* **Third Level Branches:** Some branches extend to a third level of specificity. For example, under "Geometry" we find "Triangle", "Axes", "Polyhedra", "Square", "Trapezoids", "Two-Dim Figures", "Perimeter & Angles", "Circle", "Lines & Area".
* **Branching Pattern:** The diagram uses a consistent branching pattern, with topics becoming increasingly specific as you move away from the center.
### Key Observations
* The diagram provides a broad overview of mathematical concepts, covering algebra, statistics, geometry, and basic arithmetic.
* The arrangement suggests relationships between different areas of mathematics. For example, "Functions" is closely linked to "Statistics" and "Data."
* The diagram is visually appealing and easy to understand, making it a useful tool for students or anyone looking to grasp the overall structure of mathematics.
* The diagram does not indicate the difficulty level or prerequisites for each topic.
### Interpretation
The diagram serves as a conceptual map of mathematics, illustrating the interconnectedness of various topics. It's a high-level overview, designed to provide a sense of the scope and structure of the subject. The central node, "Exprs, Equations & Functions," suggests that these concepts are fundamental to many areas of mathematics. The branching structure implies a hierarchical relationship, with more general topics branching out into more specific ones. The diagram could be used as a study aid, a curriculum guide, or a visual representation of the mathematical landscape. It's a qualitative representation of knowledge, rather than a quantitative one. The diagram doesn't offer any insights into the relative importance of different topics or the difficulty of learning them. It simply presents a structured overview of the subject matter.
</details>
((b)) English Middle (Middle-EN)
<details>
<summary>x4.png Details</summary>
### Visual Description
\n
## Chart: Risk Assessment Radial Diagram
### Overview
This image presents a radial chart, resembling a sunburst or pie chart with multiple layers, used for risk assessment. The chart categorizes risks into several layers, with each layer representing a broader risk category and subsequent layers detailing specific risk factors. The chart is primarily in Chinese, with some elements appearing to be descriptive labels.
### Components/Axes
The chart is structured around a central point labeled “几何” (Jǐhé - Geometry). Radiating outwards are several concentric layers, each divided into segments representing different risk categories and sub-categories. The outermost layer contains the broadest categories, while inner layers provide more granular detail. The layers, moving from the center outwards, are:
1. 几何 (Jǐhé - Geometry)
2. 风险 (Fēngxiǎn - Risk)
3. 数量化数 (Shùliànghuà shù - Quantification)
4. 度量与统计 (Dùliáng yǔ tǒngjì - Measurement and Statistics)
5. 工程问题 (Gōngchéng wèntí - Engineering Problems)
6. 基础问题 (Jīchǔ wèntí - Basic Problems)
7. 应用问题 (Yìngyòng wèntí - Application Problems)
Each segment within these layers is labeled with a specific risk factor in Chinese. The chart does not have explicit numerical axes or scales; instead, the size of each segment visually represents the relative importance or frequency of the associated risk.
### Detailed Analysis or Content Details
The chart is divided into seven concentric layers, each with varying numbers of segments. Here's a breakdown of the risk categories and sub-categories, transcribed from the image:
* **几何 (Jǐhé - Geometry):** Central label.
* **风险 (Fēngxiǎn - Risk):**
* 应用问题 (Yìngyòng wèntí - Application Problems)
* 基础问题 (Jīchǔ wèntí - Basic Problems)
* 工程问题 (Gōngchéng wèntí - Engineering Problems)
* **数量化数 (Shùliànghuà shù - Quantification):**
* 参数化数 (Cānshù huà shù - Parameterized Numbers)
* 分数运算 (Fēnshù yùnsuàn - Fractional Operations)
* 分数后用 (Fēnshù hòu yòng - Post-Fractional Use)
* 最简分数 (Zuì jiǎn fēnshù - Simplest Fraction)
* 公数约数 (Gōng shù yuēshù - Common Divisor)
* 分数与倍数 (Fēnshù yǔ bèi shù - Fractions and Multiples)
* 分数学合 (Fēnshù xué hé - Fractional Combination)
* 工程问题 (Gōngchéng wèntí - Engineering Problems)
* **度量与统计 (Dùliáng yǔ tǒngjì - Measurement and Statistics):**
* 概率问题 (Gàilǜ wèntí - Probability Problems)
* 税率问题 (Shuìlǜ wèntí - Tax Rate Problems)
* 年龄问题 (Niánlíng wèntí - Age Problems)
* 利息问题 (Lìxì wèntí - Interest Problems)
* 鸿兔定圆问题 (Hóng tù dìng yuán wèntí - Hare Circle Problem)
* 还剩问题 (Hái shèng wèntí - Remaining Problems)
* 折扣问题 (Zhé kòu wèntí - Discount Problems)
* 页兔定圆问题 (Yè tù dìng yuán wèntí - Page Hare Circle Problem)
* **工程问题 (Gōngchéng wèntí - Engineering Problems):**
* 工程问题 (Gōngchéng wèntí - Engineering Problems)
* 工作问题 (Gōngzuò wèntí - Work Problems)
* 水与塔综合 (Shuǐ yǔ tǎ zōnghé - Water and Tower Integration)
* 水与塔 (Shuǐ yǔ tǎ - Water and Tower)
* 正方形 (Zhèngfāngxíng - Square)
* 三角形 (Sānjiǎoxíng - Triangle)
* 梯形 (Tīxíng - Trapezoid)
* 圆形 (Yuánxíng - Circle)
* 平面图形 (Píngmiàn túxíng - Plane Figures)
* 长方形 (Chángfāngxíng - Rectangle)
* **基础问题 (Jīchǔ wèntí - Basic Problems):**
* 基础问题 (Jīchǔ wèntí - Basic Problems)
* 追赶问题 (Zhuīgǎn wèntí - Catch-up Problems)
* 相遇问题 (Xiāngyù wèntí - Meeting Problems)
* 逆流问题 (Nìliú wèntí - Countercurrent Problems)
* 和差问题 (Hé chā wèntí - Sum-Difference Problems)
* 归总问题 (Guī zǒng wèntí - Total Problems)
* **应用问题 (Yìngyòng wèntí - Application Problems):**
* 应用问题 (Yìngyòng wèntí - Application Problems)
* 时间问题 (Shíjiān wèntí - Time Problems)
* 速度问题 (Sùdù wèntí - Speed Problems)
* 距离问题 (Jùlí wèntí - Distance Problems)
* 排到组合 (Pái dào zǔhé - Ranking Combination)
* 统计指标 (Tǒngjì zhǐbiāo - Statistical Indicators)
* 预计指标 (Yùjì zhǐbiāo - Estimated Indicators)
* 正方 (Zhèngfāng - Positive Square)
* 正方体综合 (Zhèngfāngtǐ zōnghé - Positive Cube Integration)
* 立体体综合 (Lìtǐ tǐ zōnghé - Solid Body Integration)
* 平面立体综合 (Píngmiàn lìtǐ zōnghé - Plane Solid Integration)
* 平均问题 (Píngjūn wèntí - Average Problems)
* 定义问题 (Dìngyì wèntí - Definition Problems)
* 倒水问题 (Dào shuǐ wèntí - Pouring Water Problems)
* 四水问题 (Sì shuǐ wèntí - Four Water Problems)
The color scheme is a gradient, with segments in the innermost layers being darker shades of green and blue, transitioning to lighter shades of orange and yellow in the outer layers.
### Key Observations
The chart visually emphasizes the interconnectedness of different risk factors. The central "Geometry" label suggests a foundational element, with risks branching out from it. The outermost layer categorizes risks into broad areas (Application, Basic, Engineering), while the inner layers provide more specific details. The varying sizes of the segments likely indicate the relative importance or frequency of each risk factor. The chart does not provide any quantitative data, relying solely on visual representation.
### Interpretation
This chart appears to be a conceptual framework for risk assessment, likely used in an educational or analytical context. It demonstrates a hierarchical approach to identifying and categorizing risks, starting from fundamental geometric principles and extending to practical application problems. The radial format highlights the relationships between different risk factors and their potential impact. The absence of numerical data suggests that the chart is intended to facilitate qualitative analysis and discussion rather than precise quantification. The chart's structure suggests a focus on problem-solving and analytical thinking, particularly in the context of mathematical and engineering applications. The use of Chinese language indicates the chart is intended for a Chinese-speaking audience.
</details>
((c)) Chinese Elementary (Elementary-ZH)
<details>
<summary>x5.png Details</summary>
### Visual Description
\n
## Chart: Knowledge System Classification
### Overview
The image presents a circular diagram, resembling a radar chart or a sunburst chart, categorizing different aspects of a knowledge system. The diagram is divided into several concentric rings and sectors, with labels radiating outwards from the center. The primary language is Chinese.
### Components/Axes
The diagram is structured around a central point labeled “多维知识中心” (Duōwéi zhīshì zhōngxīn - Multidimensional Knowledge Center). The diagram is divided into 9 main categories radiating from the center:
1. 几何图形 (Jǐhé túxíng - Geometric Shapes)
2. 图表 (Túbiǎo - Charts/Diagrams)
3. 数式 (Shùshì - Formulas)
4. 方式 (Fāngshì - Methods)
5. 思想 (Sīxiǎng - Thoughts)
6. 应用 (Yìngyòng - Applications)
7. 规律 (Guīlǜ - Rules/Patterns)
8. 概念 (Gàiniàn - Concepts)
9. 三角形 (Sānjiǎoxíng - Triangles)
Each of these main categories is further subdivided into several sub-categories, with labels extending outwards. There is no explicit numerical scale or axis, but the radial distance from the center could potentially represent a degree of relatedness or importance, though this is not explicitly stated.
### Detailed Analysis or Content Details
Here's a transcription of the labels, organized by the main categories. Note that due to the radial arrangement and potential overlap, some labels are approximate.
**1. 几何图形 (Geometric Shapes):**
* 圆 (Yuán - Circle)
* 圆心角 (Yuánxīn jiǎo - Central Angle)
* 圆周角 (Yuánzhōujiǎo - Inscribed Angle)
* 弧长 (Húcháng - Arc Length)
* 扇形面积 (Shànxíng miànjī - Sector Area)
* 等弧 (Děng hú - Equal Arcs)
* 圆柱 (Yuánzhù - Cylinder)
* 圆锥 (Yuánzhuī - Cone)
* 球形 (Qiúxíng - Sphere)
* 等腰三角形 (Děngyāo sānjiǎoxíng - Isosceles Triangle)
* 平均四边形 (Píngjūn sìbiānxíng - Average Quadrilateral)
* 二次四边形 (Èrcì sìbiānxíng - Second-Order Quadrilateral)
* 其它图形 (Qítā túxíng - Other Shapes)
**2. 图表 (Charts/Diagrams):**
* 一次函数分析 (Yīcì hánshù fēnxī - Linear Function Analysis)
* 函数与一元二次方程 (Hánshù yǔ yīyuán èrcì fāngchéng - Functions and Quadratic Equations)
* 正比例函数 (Zhèng bǐlì hánshù - Direct Proportion Function)
* 反比例函数 (Fǎnbǐlì hánshù - Inverse Proportion Function)
* 反比例函数的定义 (Fǎnbǐlì hánshù de dìngyì - Definition of Inverse Proportion Function)
* 反比例函数的性质 (Fǎnbǐlì hánshù de xìngzhì - Properties of Inverse Proportion Function)
* 二次函数的应用 (Èrcì hánshù de yìngyòng - Application of Quadratic Function)
* 抛物线的性质 (Pāowùxiàn de xìngzhì - Properties of Parabola)
* 平面直角坐标系 (Píngmiàn zhíjiǎo zuòbiāo xì - Cartesian Coordinate System)
* 一次函数 (Yīcì hánshù - Linear Function)
* 二次函数 (Èrcì hánshù - Quadratic Function)
**3. 数式 (Formulas):**
* 代数式求值 (Dàishùshì qiúzhí - Evaluating Algebraic Expressions)
* 同类项 (Tónglèixiàng - Like Terms)
* 约分 (Yuēfēn - Simplification of Fractions)
* 百分之通过 (Bǎifēnzhī tōngguò - Percentage Pass Rate)
* 撇式加式 (Piěshì jiāshì - Addition and Subtraction of Fractions)
**4. 方式 (Methods):**
* 分类 (Fēnlèi - Classification)
* 公式方程 (Gōngshì fāngchéng - Formula Equation)
* 一元二次方程 (Yīyuán èrcì fāngchéng - Quadratic Equation)
* 解一元二次方程 (Jiě yīyuán èrcì fāngchéng - Solving Quadratic Equation)
* 解方程 (Jiě fāngchéng - Solving Equations)
* 解二次方程 (Jiě èrcì fāngchéng - Solving Quadratic Equations)
**5. 思想 (Thoughts):**
* 判断 (Pànduàn - Judgement)
* 判断推理 (Pànduàn tuīlǐ - Logical Reasoning)
* 判断题 (Pànduàntí - True/False Questions)
* 十字相乘法 (Shízì xiāngchéngfǎ - Cross Multiplication Method)
* 微小思通过 (Wēixiǎo sī tōngguò - Small Thought Passage)
**6. 应用 (Applications):**
* 概念问题 (Gàiniàn wèntí - Conceptual Problems)
* 概率问题 (Gàilǜ wèntí - Probability Problems)
* 概率的运用 (Gàilǜ de yùnyòng - Application of Probability)
* 求概率 (Qiú gàilǜ - Calculating Probability)
* 求概率的运用 (Qiú gàilǜ de yùnyòng - Application of Calculating Probability)
**7. 规律 (Rules/Patterns):**
* 整式的加减 (Zhěngshì de jiājiǎn - Addition and Subtraction of Polynomials)
* 整式的乘除 (Zhěngshì de chéngchú - Multiplication and Division of Polynomials)
* 整式的乘除及混合 (Zhěngshì de chéngchú jí hùnhé - Multiplication, Division and Combination of Polynomials)
**8. 概念 (Concepts):**
* 概念 (Gàiniàn - Concept)
* 公股定理 (Gōnggǔ dìnglǐ - Common Stock Theorem)
* 等差公式 (Děngchā gōngshì - Arithmetic Progression Formula)
* 等比公式 (Děngbǐ gōngshì - Geometric Progression Formula)
**9. 三角形 (Triangles):**
* 等边三角形 (Děngbiān sānjiǎoxíng - Equilateral Triangle)
* 等腰三角形 (Děngyāo sānjiǎoxíng - Isosceles Triangle)
* 直角三角形 (Zhíjiǎo sānjiǎoxíng - Right Triangle)
* 三角形的面积 (Sānjiǎoxíng de miànjī - Area of Triangle)
* 三角形与一元二次方程 (Sānjiǎoxíng yǔ yīyuán èrcì fāngchéng - Triangle and Quadratic Equation)
### Key Observations
The diagram appears to be a hierarchical classification of knowledge related to mathematics, particularly algebra and geometry. The central "Multidimensional Knowledge Center" suggests an attempt to integrate various aspects of mathematical understanding. The density of sub-categories varies across the main categories, potentially indicating the relative complexity or importance of those areas. The arrangement is radial, implying interconnectedness between the different categories.
### Interpretation
This diagram represents a conceptual map of mathematical knowledge, likely intended for educational purposes. It aims to illustrate the relationships between different concepts, methods, and applications. The use of a circular diagram suggests a holistic view, where all elements are interconnected. The diagram could be used as a learning tool to help students understand the broader context of their studies and identify areas where they need to strengthen their understanding. The emphasis on geometric shapes, formulas, and problem-solving methods indicates a focus on practical application of mathematical principles. The diagram's structure suggests a top-down approach to learning, starting with fundamental concepts and progressing to more complex applications. The Chinese language indicates the target audience is likely Chinese-speaking students or educators.
</details>
((d)) Chinese Middle (Middle-ZH)
Figure 2: Diagram overview of four concept systems in ConceptMath. We have provided translated Chinese concept names in English (See Appendix A).
2 ConceptMath
ConceptMath is the first bilingual, concept-wise benchmark for measuring mathematical reasoning. In this section, we describe the design principle, dataset collection process, dataset statistics and an efficient fine-tuning strategy to enhance the weaknesses identified by our ConceptMath.
2.1 Design Principle
We created ConceptMath based on the following two high-level design principles:
Concept-wised Hierarchical System.
The primary goal of ConceptMath is to evaluate the mathematical reasoning capacities of language models at different granularity. Therefore, ConceptMath organizes math problems within a three-level hierarchy of mathematical concepts in Fig. 2. This approach provides concept-wise evaluation for mathematical reasoning of language models and makes targeted and effective improvements possible.
Bilingualism.
Most of the current mathematical benchmark focuses solely on English, leaving multi-lingual mathematical reasoning unexplored. As an early effort to explore multi-lingual mathematical reasoning, we evaluate mathematical reasoning in two languages: English and Chinese. Besides, since cultures and educational systems vary across different languages, common math concepts can differ a lot. Therefore, we carefully collect concepts in both languages, instead of merely translating from one language to another. For example, measurement metrics (e.g., money, size) are different for English and Chinese.
2.2 Data Collection
Subsequently, for data collection, we take a two-step approach to operationalize the aforementioned design principles: First, we recruit experts to delineate a hierarchy of math concepts based on different education systems. Secondly, we collect problems for each concept from various sources or design problems manually, which is succeeded by quality assessment and data cleaning.
Math Concept System Construction.
Since the education systems provide a natural hierarchy of math concepts, we recruited four teachers from elementary and middle schools, specializing in either English or Chinese, to organize a hierarchy of math concepts for different education systems. This leads to four concept systems: Elementary-EN, Middle-EN, Elementary-ZH, and Middle-ZH, with each system consisting of a three-level hierarchy of around 50 atomic math concepts (Fig. 2).
Math Problem Construction.
Then we conducted a thorough data acquisition from various sources (including educational websites, textbooks, and search engines with specific concepts) to collect math word problems (including both questions and answers) for each math concept. To guarantee a balance across all concepts, approximately 20 problems were gathered for each math concept. Following this, both GPT-4 OpenAI (2023) and human experts were employed to verify and rectify the categorization and the solution of each problem. However, we observed that for some concepts, the problem count was significantly below 20. To address this issue, manual efforts were undertaken to augment these categories, ensuring a consistent collection of 20 problems for each concept. Furthermore, to broaden the diversity of the dataset and minimize the risk of data contamination, all gathered problems were paraphrased using GPT-4. It is important to note that the collection and annotation processes were carried out by a team of six members, each possessing a university degree in an engineering discipline, to maintain a high level of technical expertise in executing these tasks.
2.3 Dataset Statistics
Comparison to existing datasets. As shown in Table 1, our ConceptMath differs from related datasets in various aspects: (1) ConceptMath is the first dataset to study fine-grained mathematical concepts and encompasses 4 systems, 214 math concepts, and 4011 math word problems. (2) Problems in ConcepthMath are carefully annotated based on the mainstream education systems for English (EN) and Chinese (ZH).
Details on the hierarchical system. Apart from Fig. 2, we also provide the details on the hierarchical system more clearly in Appendix A.
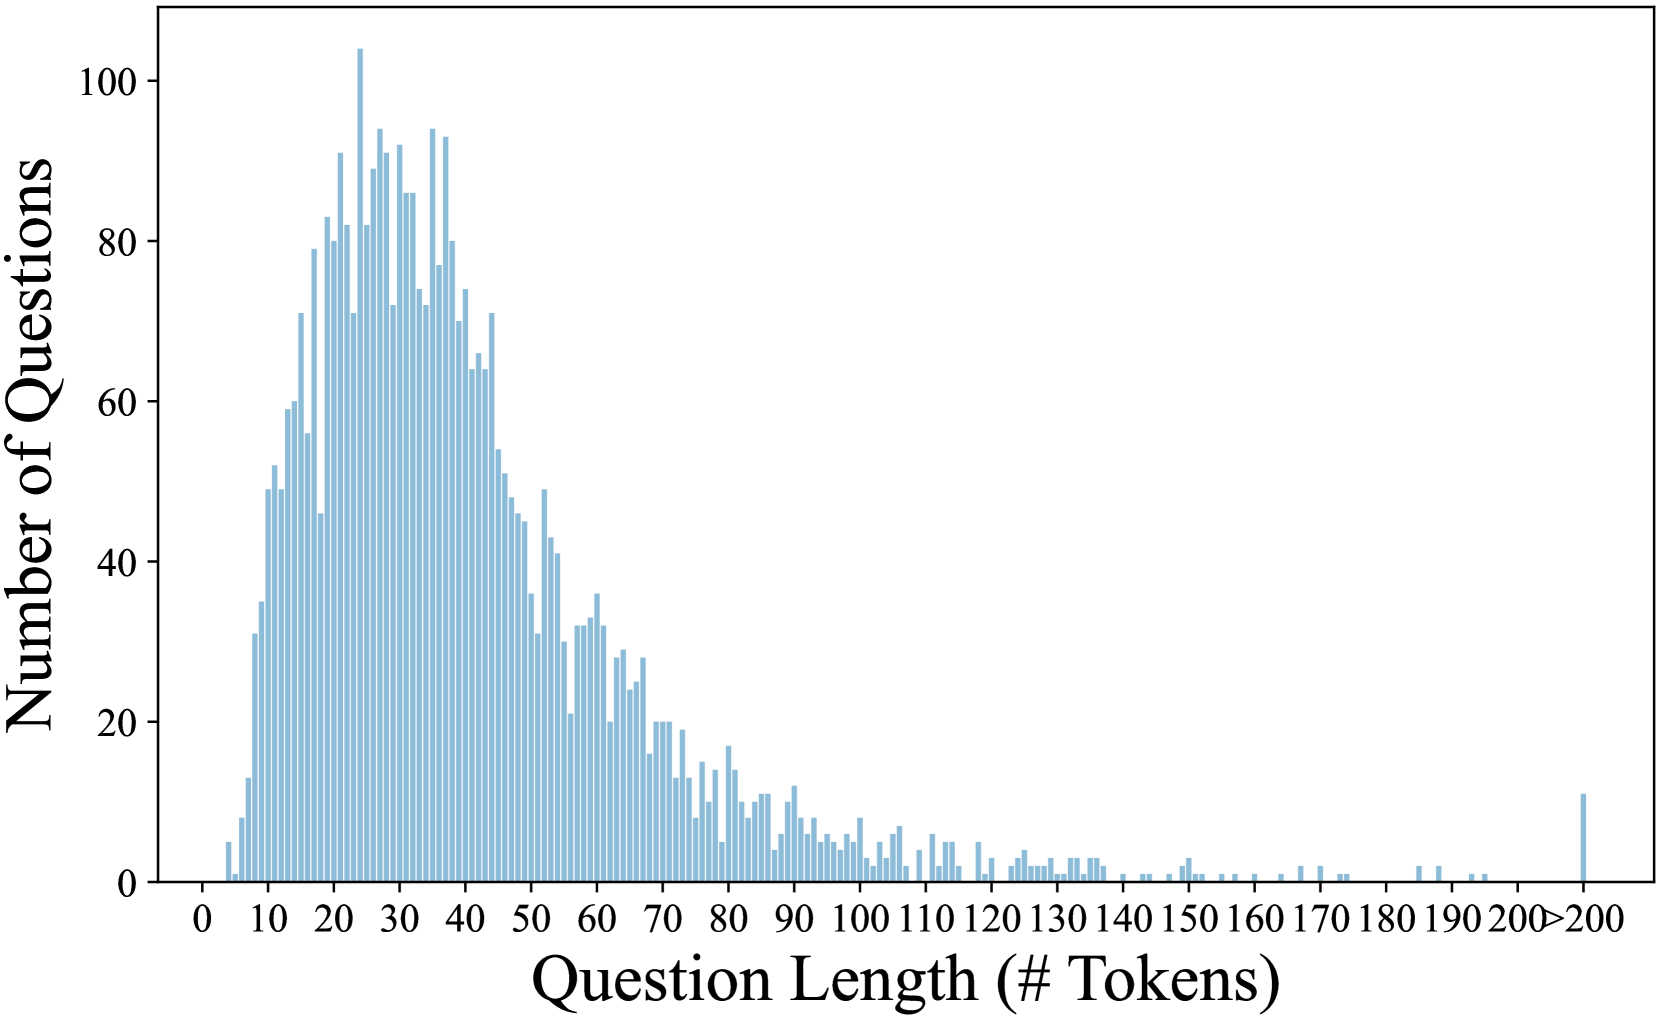
Length distribution. Fig. 3 shows the length distribution of our ConcepthMath, where number of tokens is reported We use the “cl100k_base” tokenizer from https://github.com/openai/tiktoken. The minimum, average and maximum of the tokens for these questions are 4, 41 and 309, respectively, which shows that they have lexical richness.
| Benchmark | Language | Fine-grained | Size |
| --- | --- | --- | --- |
| GSM8K | EN | ✗ | 1319 |
| MATH | EN | ✗ | 5000 |
| TabMWP | EN | ✗ | 7686 |
| Dolphin18K | EN | ✗ | 1504 |
| Math23K | ZH | ✗ | 1000 |
| ASDiv | EN | ✗ | 2305 |
| SVAMP | EN | ✗ | 300 |
| SingleOp | EN | ✗ | 159 |
| MMLU-Math | EN | ✗ | 906 |
| ConceptMath | EN&ZH | ✓ | 4011 |
Table 1: A comparison of our ConceptMath with some notable mathematical datasets. Note that the size is the number of samples of the test split.
<details>
<summary>x6.png Details</summary>
### Visual Description
\n
## Histogram: Distribution of Question Lengths
### Overview
The image presents a histogram visualizing the distribution of question lengths, measured in the number of tokens. The x-axis represents the question length, ranging from 0 to 200 tokens, while the y-axis represents the number of questions falling within each length bin. The histogram is constructed using vertical bars, each representing a range of question lengths.
### Components/Axes
* **X-axis Title:** "Question Length (# Tokens)"
* **X-axis Scale:** Ranges from 0 to 200 tokens, with tick marks every 10 tokens.
* **Y-axis Title:** "Number of Questions"
* **Y-axis Scale:** Ranges from 0 to 100, with tick marks every 20 questions.
* **Histogram Bars:** Represent the frequency of questions within each token length bin. The bars are filled with a light blue color.
### Detailed Analysis
The histogram shows a strong concentration of questions falling within the length range of approximately 20 to 60 tokens. The distribution is heavily skewed to the right, indicating that most questions are relatively short, with a decreasing number of questions as the length increases.
Here's a breakdown of approximate values, reading from left to right:
* **0-10 Tokens:** Approximately 5-10 questions.
* **10-20 Tokens:** Approximately 20-30 questions.
* **20-30 Tokens:** Approximately 80-90 questions.
* **30-40 Tokens:** Approximately 90-100 questions.
* **40-50 Tokens:** Approximately 70-80 questions.
* **50-60 Tokens:** Approximately 40-50 questions.
* **60-70 Tokens:** Approximately 20-30 questions.
* **70-80 Tokens:** Approximately 10-20 questions.
* **80-90 Tokens:** Approximately 5-10 questions.
* **90-100 Tokens:** Approximately 5 questions.
* **100-110 Tokens:** Approximately 2-5 questions.
* **110-120 Tokens:** Approximately 2-5 questions.
* **120-130 Tokens:** Approximately 1-3 questions.
* **130-140 Tokens:** Approximately 1-3 questions.
* **140-150 Tokens:** Approximately 1 question.
* **150-160 Tokens:** Approximately 1 question.
* **160-170 Tokens:** Approximately 0-1 questions.
* **170-180 Tokens:** Approximately 0-1 questions.
* **180-190 Tokens:** Approximately 0-1 questions.
* **190-200 Tokens:** Approximately 0-1 questions.
The peak of the distribution is around 30-40 tokens, with a slight decline as the length increases. There is a sharp drop-off in the number of questions beyond 80 tokens.
### Key Observations
* The distribution is unimodal, with a single prominent peak.
* The majority of questions are relatively short (less than 60 tokens).
* There are very few questions exceeding 100 tokens.
* The distribution is right-skewed, indicating a long tail of longer questions.
### Interpretation
The data suggests that the questions being analyzed are generally concise. This could be due to several factors, such as the nature of the task, the target audience, or the constraints of the system generating the questions. The concentration of questions around 30-40 tokens might indicate an optimal length for effective communication or processing. The long tail of longer questions could represent more complex or nuanced inquiries. The overall distribution provides insights into the characteristics of the question set and can be used to inform the design of systems that process or respond to these questions. The data could be used to optimize question answering systems, or to understand the types of questions users are likely to ask.
</details>
Figure 3: Length distributions of our ConceptMath.
2.4 Efficient Fine-Tuning
Based on our ConceptMath, we are able to identify the weaknesses in the mathematical reasoning capability of LLMs through concept-wise evaluation. In this section, we explore a straightforward approach to enhance mathematical abilities towards specific concepts by first training a concept classifier and then curating a set of samples from a large open-sourced math dataset. Specifically, first, by additionally collecting extra 10 problems per concept, we construct a classifier capable of identifying the concept class of a given question. The backbone of this classifier is a pretrained bilingual LLM, where the classification head is operated on its last hidden output feature. Then, we proceed to fine-tune LLMs using this specific dataset combined with the existing general math dataset, which aims to avoid overfitting on a relatively small dataset. More details have been provided in the Appendix B.
3 Experiments
In this section, we perform extensive experiments to demonstrate the effect of our ConceptMath.
3.1 Experimental Setup
Evaluated Models.
We assess the mathematical reasoning of existing advanced LLMs on ConceptMath, including 2 close-sourced LLMs (i.e., GPT-3.5/GPT-4 (OpenAI, 2023)) and 17 open-sourced LLMs (i.e., WizardMath-13B Luo et al. (2023), MetaMath-13B Yu et al. (2023), MAmmoTH-13B Yue et al. (2023), Qwen-14B/72B Bai et al. (2023b), Baichuan2-13B Baichuan (2023), ChatGLM3-6B Du et al. (2022), InternLM2-7B/20B Team (2023a), InternLM2-Math-7B/20B Ying et al. (2024), LLaMA2-7B/13B/70B Touvron et al. (2023b), Yi-6B/34B Team (2023b) and DeepSeekMath-7B Shao et al. (2024)). Note that WizardMath-13B, MetaMath-13B, and MAmmoTH-13B are specialized math language models fine-tuned from LLaMA2. InternLM2-Math and DeepSeekMath-7B are specialized math language models fine-tuned from corresponding language models. More details of these evaluated models can be seen in Appendix C.
| Model | Elementary-EN | Middle-EN | Elementary-ZH | Middle-ZH | Avg. | | | | | | | | |
| --- | --- | --- | --- | --- | --- | --- | --- | --- | --- | --- | --- | --- | --- |
| ZS | ZS-COT | FS | ZS | ZS-COT | FS | ZS | ZS-COT | FS | ZS | ZS-COT | FS | | |
| Yi-6B | 67.94 | 67.56 | 59.03 | 65.55 | 64.59 | 56.05 | 34.33 | 31.91 | 37.86 | 36.46 | 36.19 | 36.46 | 49.49 |
| ChatGLM3-6B | 60.69 | 63.10 | 53.18 | 51.25 | 60.17 | 51.34 | 46.23 | 43.63 | 40.74 | 44.77 | 43.32 | 40.43 | 49.90 |
| DeepSeekMath-7B | 66.92 | 77.35 | 73.92 | 56.53 | 69.87 | 66.31 | 60.47 | 62.33 | 64.19 | 56.50 | 56.95 | 56.86 | 64.02 |
| InternLM2-Math-7B | 71.12 | 72.01 | 69.59 | 63.44 | 62.96 | 63.05 | 57.30 | 58.23 | 58.60 | 53.79 | 53.16 | 53.88 | 61.43 |
| InternLM2-7B | 68.83 | 69.97 | 66.67 | 37.04 | 65.83 | 55.47 | 47.63 | 49.02 | 53.02 | 45.22 | 45.40 | 44.86 | 54.08 |
| LLaMA2-7B | 36.51 | 42.62 | 38.68 | 34.26 | 39.16 | 33.69 | 15.72 | 17.67 | 17.58 | 30.87 | 32.22 | 27.80 | 30.57 |
| MAmmoTH-13B | 61.32 | 52.42 | 56.49 | 53.93 | 45.20 | 48.08 | 22.33 | 33.30 | 23.81 | 27.98 | 43.05 | 29.15 | 41.42 |
| WizardMath-13B | 41.73 | 44.78 | 34.99 | 36.85 | 37.72 | 45.11 | 10.51 | 11.26 | 18.70 | 12.36 | 15.52 | 22.92 | 27.70 |
| MetaMath-13B | 54.45 | 51.78 | 47.96 | 44.24 | 43.47 | 47.50 | 11.44 | 17.30 | 27.53 | 21.21 | 26.08 | 29.60 | 35.21 |
| Baichuan2-13B | 68.83 | 68.58 | 54.07 | 67.66 | 69.67 | 40.40 | 57.02 | 58.23 | 22.05 | 55.05 | 55.32 | 26.90 | 53.65 |
| LLaMA2-13B | 44.02 | 49.75 | 47.07 | 44.72 | 46.45 | 43.09 | 20.19 | 24.19 | 22.14 | 33.30 | 35.38 | 26.17 | 36.37 |
| Qwen-14B | 46.95 | 65.78 | 72.65 | 38.48 | 59.60 | 67.85 | 28.09 | 65.12 | 64.47 | 22.92 | 58.30 | 62.09 | 54.36 |
| InternLM2-Math-20B | 74.05 | 75.32 | 73.41 | 64.11 | 71.21 | 70.83 | 62.98 | 61.95 | 61.77 | 55.14 | 55.78 | 56.86 | 65.28 |
| InternLM2-20B | 53.31 | 72.52 | 73.28 | 45.11 | 67.47 | 56.72 | 48.19 | 55.53 | 59.81 | 45.13 | 50.63 | 56.68 | 57.03 |
| Yi-34B | 74.68 | 73.66 | 56.36 | 72.26 | 74.66 | 65.83 | 50.05 | 51.16 | 38.79 | 45.40 | 43.95 | 40.97 | 57.31 |
| LLaMA2-70B | 56.11 | 60.31 | 30.53 | 58.06 | 60.94 | 31.67 | 28.65 | 26.70 | 24.37 | 37.64 | 34.30 | 28.43 | 39.81 |
| Qwen-72B | 77.10 | 75.06 | 77.23 | 74.66 | 69.87 | 73.99 | 71.16 | 68.65 | 61.86 | 71.30 | 65.43 | 62.45 | 70.73 |
| GPT-3.5 | 85.75 | 92.37 | 84.35 | 83.88 | 90.12 | 82.73 | 56.47 | 53.21 | 56.93 | 51.90 | 53.52 | 55.69 | 70.58 |
| GPT-4 | 86.77 | 90.20 | 89.57 | 84.26 | 89.83 | 88.68 | 67.91 | 72.28 | 72.00 | 63.81 | 64.26 | 66.61 | 78.02 |
| Avg. | 63.00 | 66.59 | 61.00 | 56.65 | 62.57 | 57.28 | 41.93 | 45.35 | 43.49 | 42.67 | 45.72 | 43.41 | 52.47 |
Table 2: Results of different models on our constructed ConceptMath benchmark dataset. Note that “ZS”, “ZS-COT”, “FS” represents “zero-shot”, “zero-shot w/ chain-of-thought” and “few-shot”, repsectively. Models are grouped roughly according to their model sizes.
Evaluation Settings.
We employ three distinct evaluation settings: zero-shot, zero-shot with chain-of-thought (CoT), and few-shot promptings. The zero-shot prompting assesses the models’ intrinsic problem-solving abilities without any prior examples. The zero-shot with CoT prompting evaluates the models’ ability to employ a logical chain of thought. In the few-shot prompting setting, the model is provided with fixed 5-shot prompts for different systems (See Appendix E), which includes five newly created examples with concise ground truth targets. This approach is designed to measure the in-context learning abilities. Besides, following MATH (Hendrycks et al., 2021b), all questions and answers in ConceptMath have been carefully curated, and each problem is evaluated based on exact matches. Moreover, greedy decoding with a temperature of 0 is used.
3.2 Results
Overall Accuracy
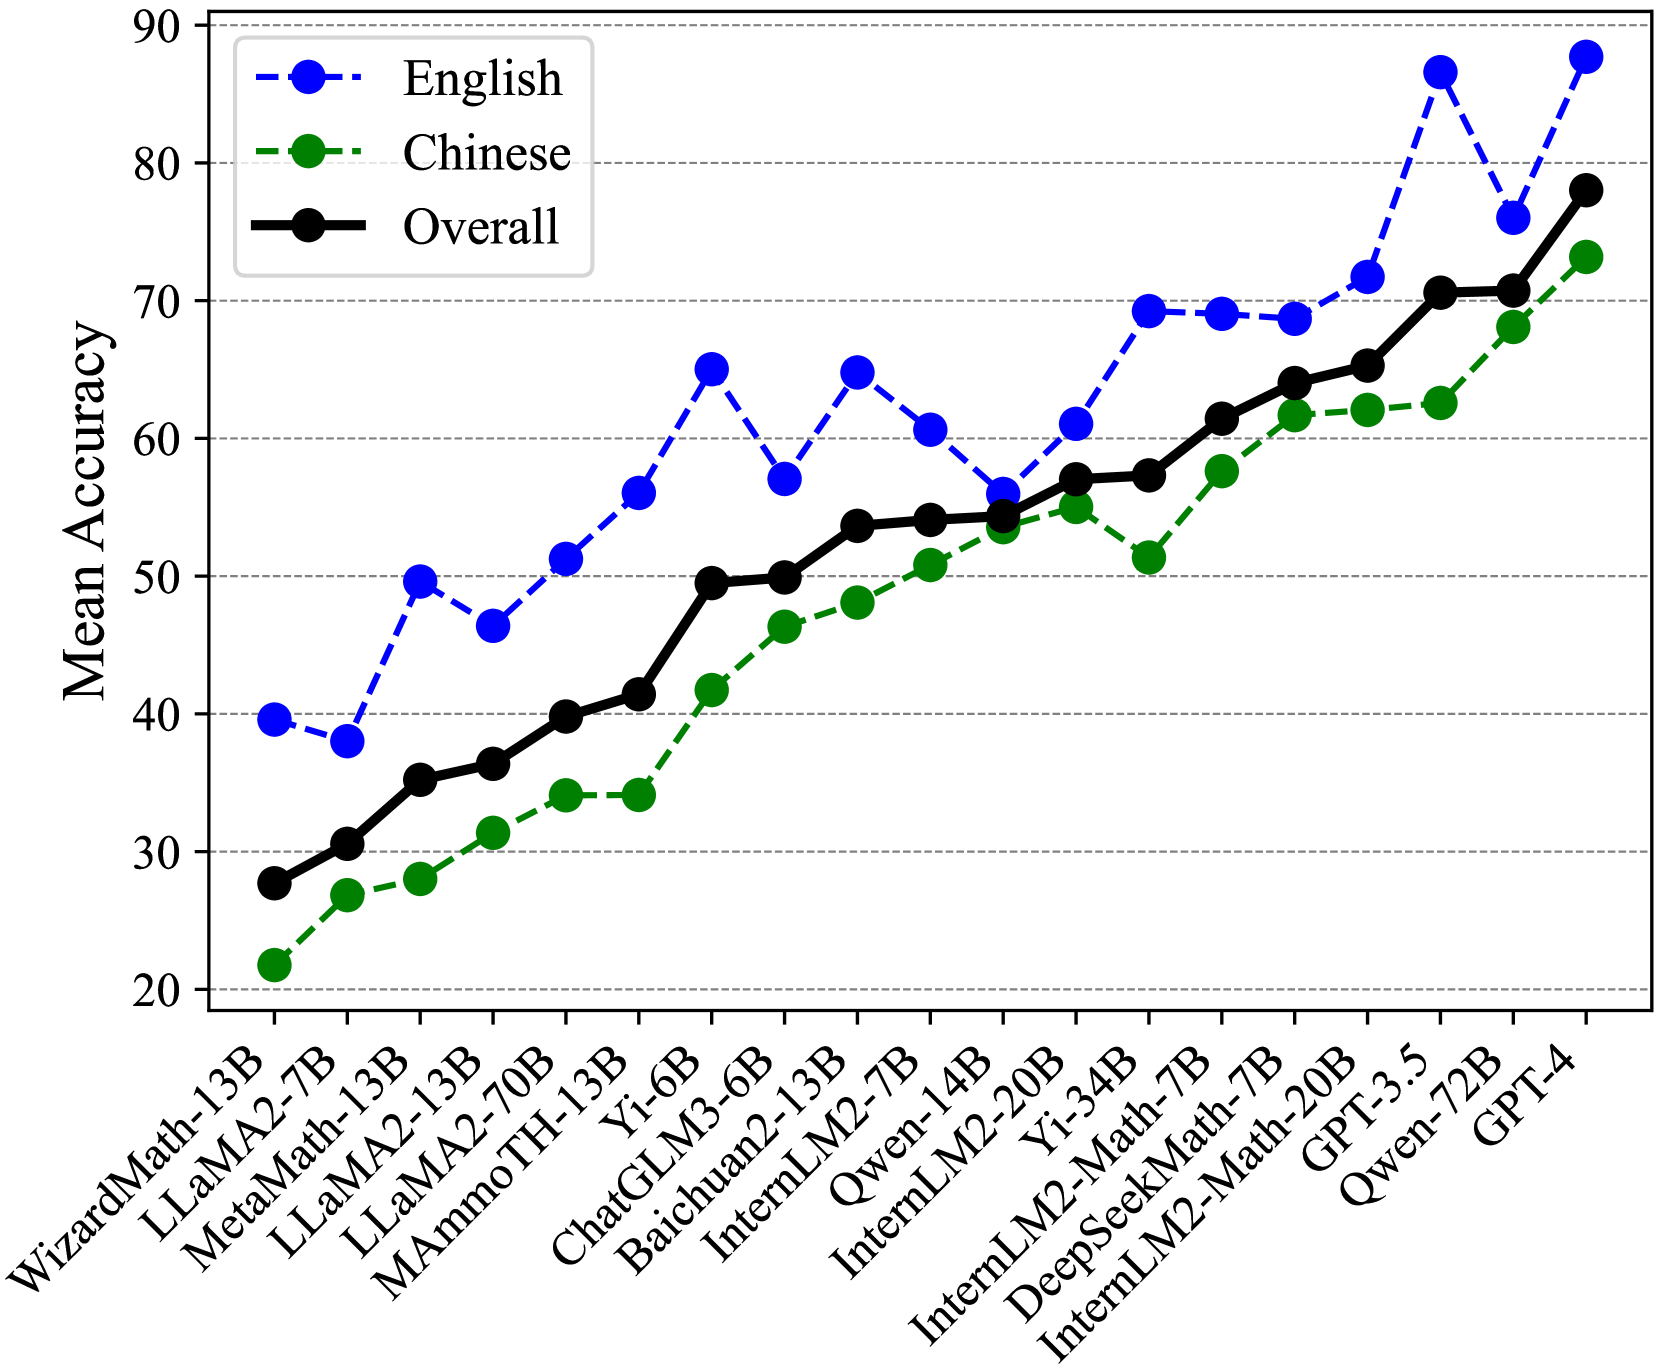
We present the overall accuracies of different LLMs on our ConceptMath benchmark under various prompt settings in Table 2. Subsequently, we analyzed the mathematical abilities of these LLMs in both English and Chinese in Fig. 4. Our analysis led to the following key findings: (1) GPT-3.5/4 showcases the most advanced mathematical reasoning abilities among LLMs in both English and Chinese systems, and the leading open-source Qwen-72B model archives comparable performance compared with GPT-3.5. (2) The scores on Chinese systems of most existing LLMs are lower than English systems a lot. For example, accuracies on Middle-ZH and Middle-EN for GPT-4 are 63.81 and 84.26. (3) Several models (e.g., WizardMath-13B or MetaMath-13B) fine-tuned from LLaMA2-13B achieve slight improvements on English systems, but the performance results are lower than LLaMA2-13B on Chinese systems a lot, which indicates that domain-specific fine-tuning may degrade the generalization abilities of LLMs. (4). The mathematical models (i.e., InternLM2-Math-7B/20B and DeepSeekMath-7B) by continuing pretraining on the large-scale math-related dataset (¿=100B tokens) show sufficient improvements when compared to models with similar size, which indicates that large-scale pertaining is effective to improve the mathematical reasoning abilities.
<details>
<summary>x7.png Details</summary>
### Visual Description
## Line Chart: Mean Accuracy of Language Models
### Overview
This line chart displays the mean accuracy of several language models on tasks in English, Chinese, and overall. The x-axis represents different language models, and the y-axis represents the mean accuracy, ranging from approximately 20 to 90. Three distinct lines represent the performance in each language/overall.
### Components/Axes
* **X-axis:** Language Model (WizardMath-13B, LLaMA2-7B, MetaMath-13B, LLaMA2-13B, LLaMA2-70B, MAmmoTH-13B, Yi-6B, ChatGLM3-6B, Baichuan2-13B, InternLM2-7B, Qwen-14B, InternLM2-20B, Yi-34B, InternLM2-Math-7B, DeepSeekMath-7B, InternLM2-Math-20B, GPT-3.5, Qwen-72B, GPT-4)
* **Y-axis:** Mean Accuracy (Scale from approximately 20 to 90)
* **Legend:**
* Blue dashed line: English
* Green dotted line: Chinese
* Black solid line: Overall
### Detailed Analysis
The chart shows the accuracy of different language models across English, Chinese, and overall performance.
* **WizardMath-13B:** English: ~38, Chinese: ~24, Overall: ~32
* **LLaMA2-7B:** English: ~40, Chinese: ~28, Overall: ~35
* **MetaMath-13B:** English: ~42, Chinese: ~30, Overall: ~37
* **LLaMA2-13B:** English: ~45, Chinese: ~33, Overall: ~40
* **LLaMA2-70B:** English: ~55, Chinese: ~40, Overall: ~50
* **MMoTH-13B:** English: ~58, Chinese: ~45, Overall: ~53
* **Yi-6B:** English: ~48, Chinese: ~38, Overall: ~44
* **ChatGLM3-6B:** English: ~52, Chinese: ~42, Overall: ~48
* **Baichuan2-13B:** English: ~55, Chinese: ~45, Overall: ~50
* **InternLM2-7B:** English: ~58, Chinese: ~48, Overall: ~54
* **Qwen-14B:** English: ~62, Chinese: ~52, Overall: ~58
* **InternLM2-20B:** English: ~65, Chinese: ~55, Overall: ~61
* **Yi-34B:** English: ~68, Chinese: ~58, Overall: ~64
* **InternLM2-Math-7B:** English: ~66, Chinese: ~56, Overall: ~62
* **DeepSeekMath-7B:** English: ~70, Chinese: ~60, Overall: ~66
* **InternLM2-Math-20B:** English: ~72, Chinese: ~62, Overall: ~68
* **GPT-3.5:** English: ~78, Chinese: ~68, Overall: ~74
* **Qwen-72B:** English: ~85, Chinese: ~75, Overall: ~81
* **GPT-4:** English: ~88, Chinese: ~78, Overall: ~84
**Trends:**
* **English:** The English accuracy line generally slopes upward, with a steeper increase towards the end of the model list. It starts around 38 and reaches approximately 88.
* **Chinese:** The Chinese accuracy line also slopes upward, but is consistently lower than the English line. It starts around 24 and reaches approximately 78.
* **Overall:** The overall accuracy line generally follows the English line, starting around 32 and reaching approximately 84.
### Key Observations
* GPT-4 consistently demonstrates the highest overall accuracy.
* English accuracy is generally higher than Chinese accuracy across all models.
* The gap between English and Chinese accuracy appears to narrow for some models (e.g., Qwen-72B, GPT-4).
* There are some fluctuations in accuracy for certain models, indicating potential variations in performance.
### Interpretation
The data suggests that language models are generally more accurate on English tasks than on Chinese tasks. This could be due to a variety of factors, including the availability of more training data in English, the complexity of the Chinese language, or the specific tasks used for evaluation. The increasing trend in accuracy across the model list indicates that language model performance is improving over time. The performance of GPT-4 and Qwen-72B suggests that larger models with more parameters are capable of achieving higher accuracy. The narrowing gap between English and Chinese accuracy for the most advanced models suggests that these models are becoming more proficient in handling both languages. The fluctuations in accuracy for certain models may indicate that their performance is sensitive to the specific task or dataset used for evaluation. This chart provides a comparative analysis of language model performance, highlighting the strengths and weaknesses of different models in different languages.
</details>
Figure 4: Mean accuracies for English, Chinese, and overall educational systems.
Average Concept-wised Accuracy.
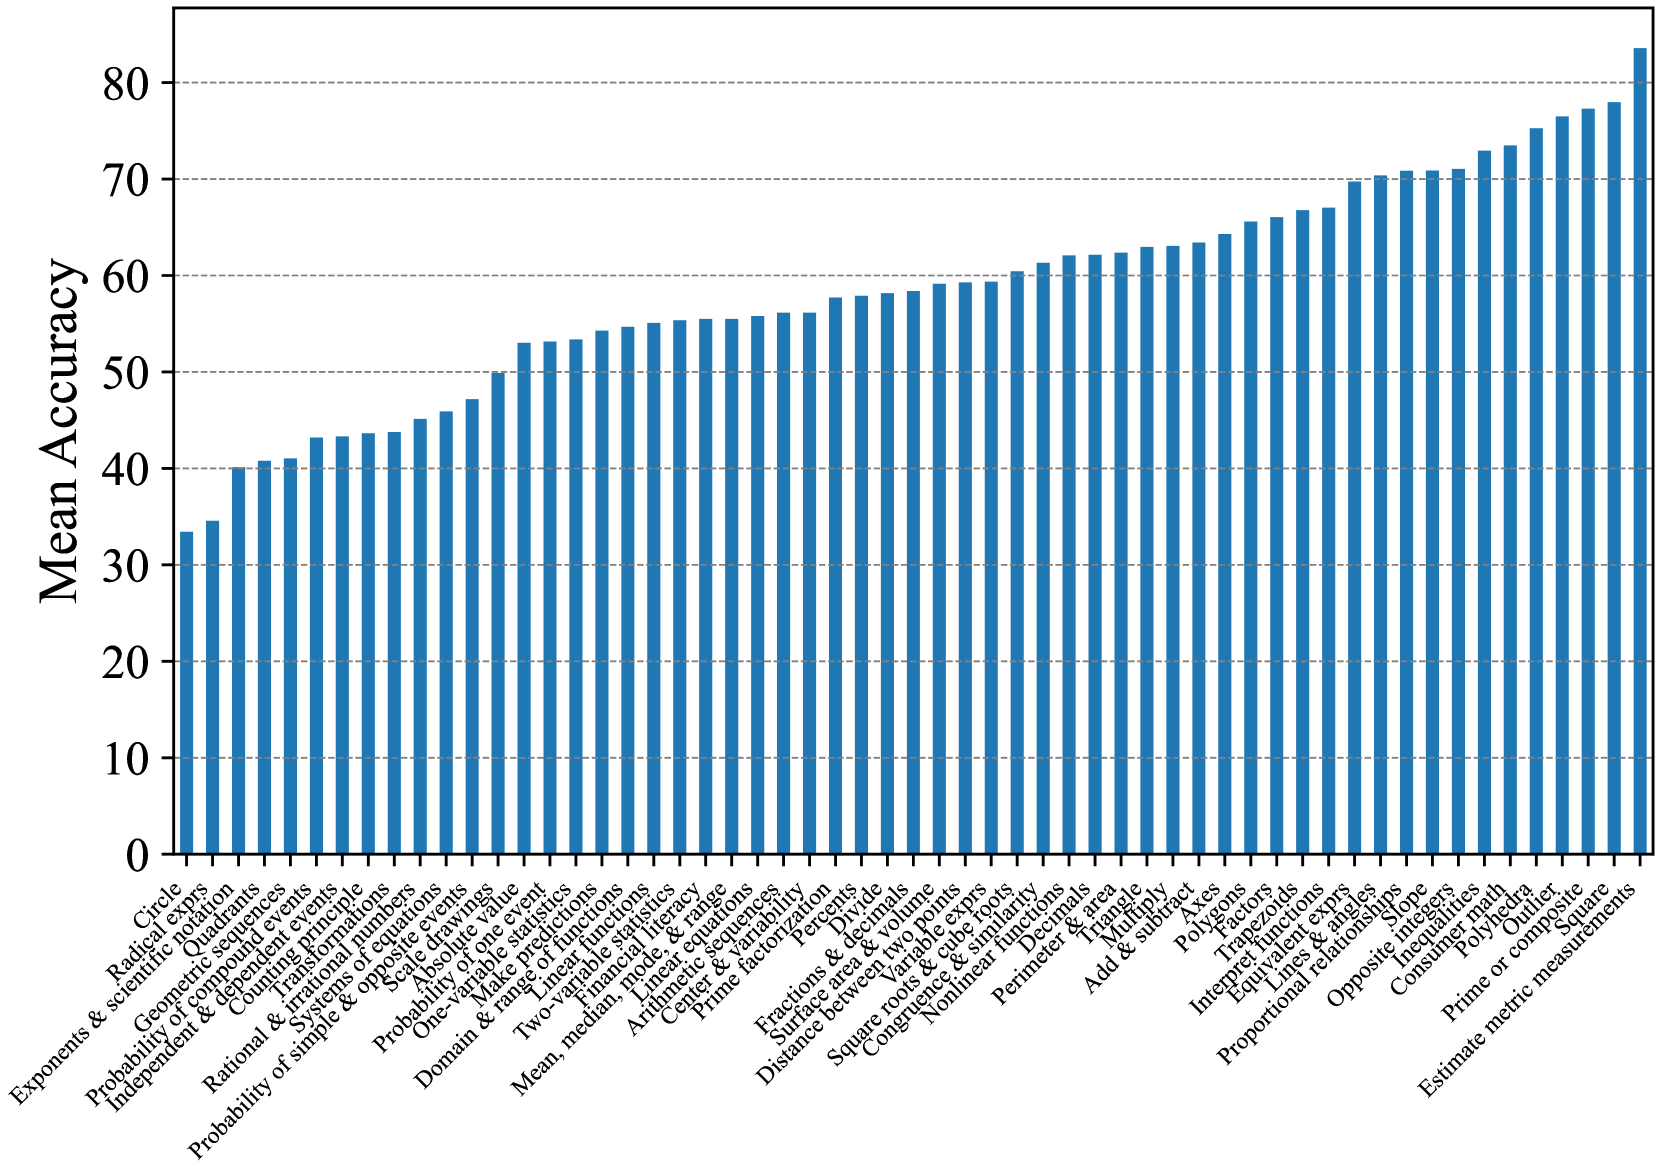
In Fig. 5 and Fig. 6, to better analyze the effectiveness of our ConceptMath, we further provide the concept-wised accuracies average on evaluated models for different mathematical concepts by zero-shot prompting on Middle-EN and Middle-ZH. (See Appendix D for more results on Elementary-EN and Elementary-ZH). In Fig. 5 and Fig. 6, we observe that the accuracies across concepts vary a lot for existing LLMs. For example, for Middle-ZH in Fig. 6, around 18% of concepts exhibit an accuracy lower than 30%. Thus, to improve the mathematical abilities of LLMs, these concepts with large room for improvement should be given the highest priority, which further shows the advantage of ConceptMath.
<details>
<summary>x8.png Details</summary>
### Visual Description
\n
## Bar Chart: Mean Accuracy by Mathematical Concept
### Overview
This image presents a bar chart illustrating the mean accuracy achieved on a set of mathematical concepts. The x-axis represents different mathematical topics, and the y-axis represents the mean accuracy score, ranging from 0 to 80. Three lines are overlaid on the bar chart, representing different models or groups (likely different student cohorts or model versions). The chart visually compares the performance across these concepts and models.
### Components/Axes
* **X-axis Title:** Mathematical Concepts (listed along the bottom)
* **Y-axis Title:** Mean Accuracy
* **Y-axis Scale:** 0 to 80, with increments of 10.
* **Data Series 1 (Blue Line):** Represents one model/group.
* **Data Series 2 (Green Line):** Represents a second model/group.
* **Data Series 3 (Red Line):** Represents a third model/group.
* **Bars:** Represent the mean accuracy for each mathematical concept.
* **Mathematical Concepts (X-axis labels):**
1. Exponents & Scientific Notation
2. Circle
3. Geometric Mean
4. Independent & Dependent Events
5. Conditional Probability
6. Probability of simple & compound events
7. Rational & Irrational Numbers
8. Domain & Range
9. One-to-One Functions
10. Probability: Make predictions
11. Two-variable Statistics
12. Mean, Median, Mode
13. Linear & Quadratic Functions
14. Arithmetic Sequences
15. Logarithms
16. Prime Factorization
17. Functions & Derivatives
18. Square Roots & Cube Roots
19. Congruence & Similarity
20. Perimeter & Area
21. Add & Subtract
22. Multiply & Divide
23. Polygons
24. Integers & Factors
25. Equivalent Fractions
26. Proportional Relationships
27. Opposite & Reciprocal
28. Common Denominator
29. Prime or Composite
30. Estimate metric measurements
### Detailed Analysis
The chart displays accuracy scores for 30 different mathematical concepts. The blue line generally shows the lowest accuracy across most concepts, while the red line shows the highest. The green line falls in between.
Here's a breakdown of approximate accuracy values, reading from left to right, and cross-referencing with the line colors:
* **Exponents & Scientific Notation:** Blue ~30, Green ~40, Red ~50.
* **Circle:** Blue ~32, Green ~42, Red ~52.
* **Geometric Mean:** Blue ~34, Green ~44, Red ~54.
* **Independent & Dependent Events:** Blue ~36, Green ~46, Red ~56.
* **Conditional Probability:** Blue ~38, Green ~48, Red ~58.
* **Probability of simple & compound events:** Blue ~40, Green ~50, Red ~60.
* **Rational & Irrational Numbers:** Blue ~42, Green ~52, Red ~62.
* **Domain & Range:** Blue ~44, Green ~54, Red ~64.
* **One-to-One Functions:** Blue ~46, Green ~56, Red ~66.
* **Probability: Make predictions:** Blue ~48, Green ~58, Red ~68.
* **Two-variable Statistics:** Blue ~50, Green ~60, Red ~70.
* **Mean, Median, Mode:** Blue ~52, Green ~62, Red ~72.
* **Linear & Quadratic Functions:** Blue ~54, Green ~64, Red ~74.
* **Arithmetic Sequences:** Blue ~56, Green ~66, Red ~76.
* **Logarithms:** Blue ~58, Green ~68, Red ~78.
* **Prime Factorization:** Blue ~60, Green ~70, Red ~80.
* **Functions & Derivatives:** Blue ~62, Green ~72, Red ~80.
* **Square Roots & Cube Roots:** Blue ~64, Green ~74, Red ~80.
* **Congruence & Similarity:** Blue ~66, Green ~76, Red ~80.
* **Perimeter & Area:** Blue ~68, Green ~78, Red ~80.
* **Add & Subtract:** Blue ~70, Green ~78, Red ~80.
* **Multiply & Divide:** Blue ~72, Green ~78, Red ~80.
* **Polygons:** Blue ~74, Green ~78, Red ~80.
* **Integers & Factors:** Blue ~76, Green ~78, Red ~80.
* **Equivalent Fractions:** Blue ~78, Green ~78, Red ~80.
* **Proportional Relationships:** Blue ~78, Green ~78, Red ~80.
* **Opposite & Reciprocal:** Blue ~78, Green ~78, Red ~80.
* **Common Denominator:** Blue ~78, Green ~78, Red ~80.
* **Prime or Composite:** Blue ~78, Green ~78, Red ~80.
* **Estimate metric measurements:** Blue ~78, Green ~78, Red ~80.
The blue line shows a generally increasing trend, starting around 30 and ending around 78. The green line also increases, starting around 40 and ending around 78. The red line shows the steepest increase, starting around 50 and reaching 80.
### Key Observations
* The red line consistently outperforms the blue and green lines across all concepts.
* The blue line consistently underperforms the green and red lines.
* Accuracy generally increases as the concepts progress from left to right.
* The difference in accuracy between the models is most pronounced for the earlier concepts (Exponents & Scientific Notation, Circle, Geometric Mean).
* For the last several concepts, all three lines converge at or near 80% accuracy.
### Interpretation
The data suggests that the three models/groups have varying levels of proficiency in mathematical concepts. The red model demonstrates the strongest understanding, consistently achieving higher accuracy scores. The blue model struggles the most, particularly with foundational concepts. The green model falls in between.
The increasing trend in accuracy across the concepts could indicate that the concepts are presented in increasing order of difficulty, or that earlier concepts are prerequisites for later ones. The convergence of the lines towards the end suggests that the later concepts are mastered by all groups, or that they are simpler to grasp.
The consistent performance differences between the models suggest that the differences are not due to random chance, but rather to underlying differences in knowledge or skills. This data could be used to identify areas where the blue model needs additional support, or to understand the factors that contribute to the success of the red model. The chart provides a clear visual representation of the relative strengths and weaknesses of each model across a range of mathematical topics.
</details>
Figure 5: Mean concept accuracies on Middle-EN.
Figure 6: Mean concept accuracies on Middle-ZH.
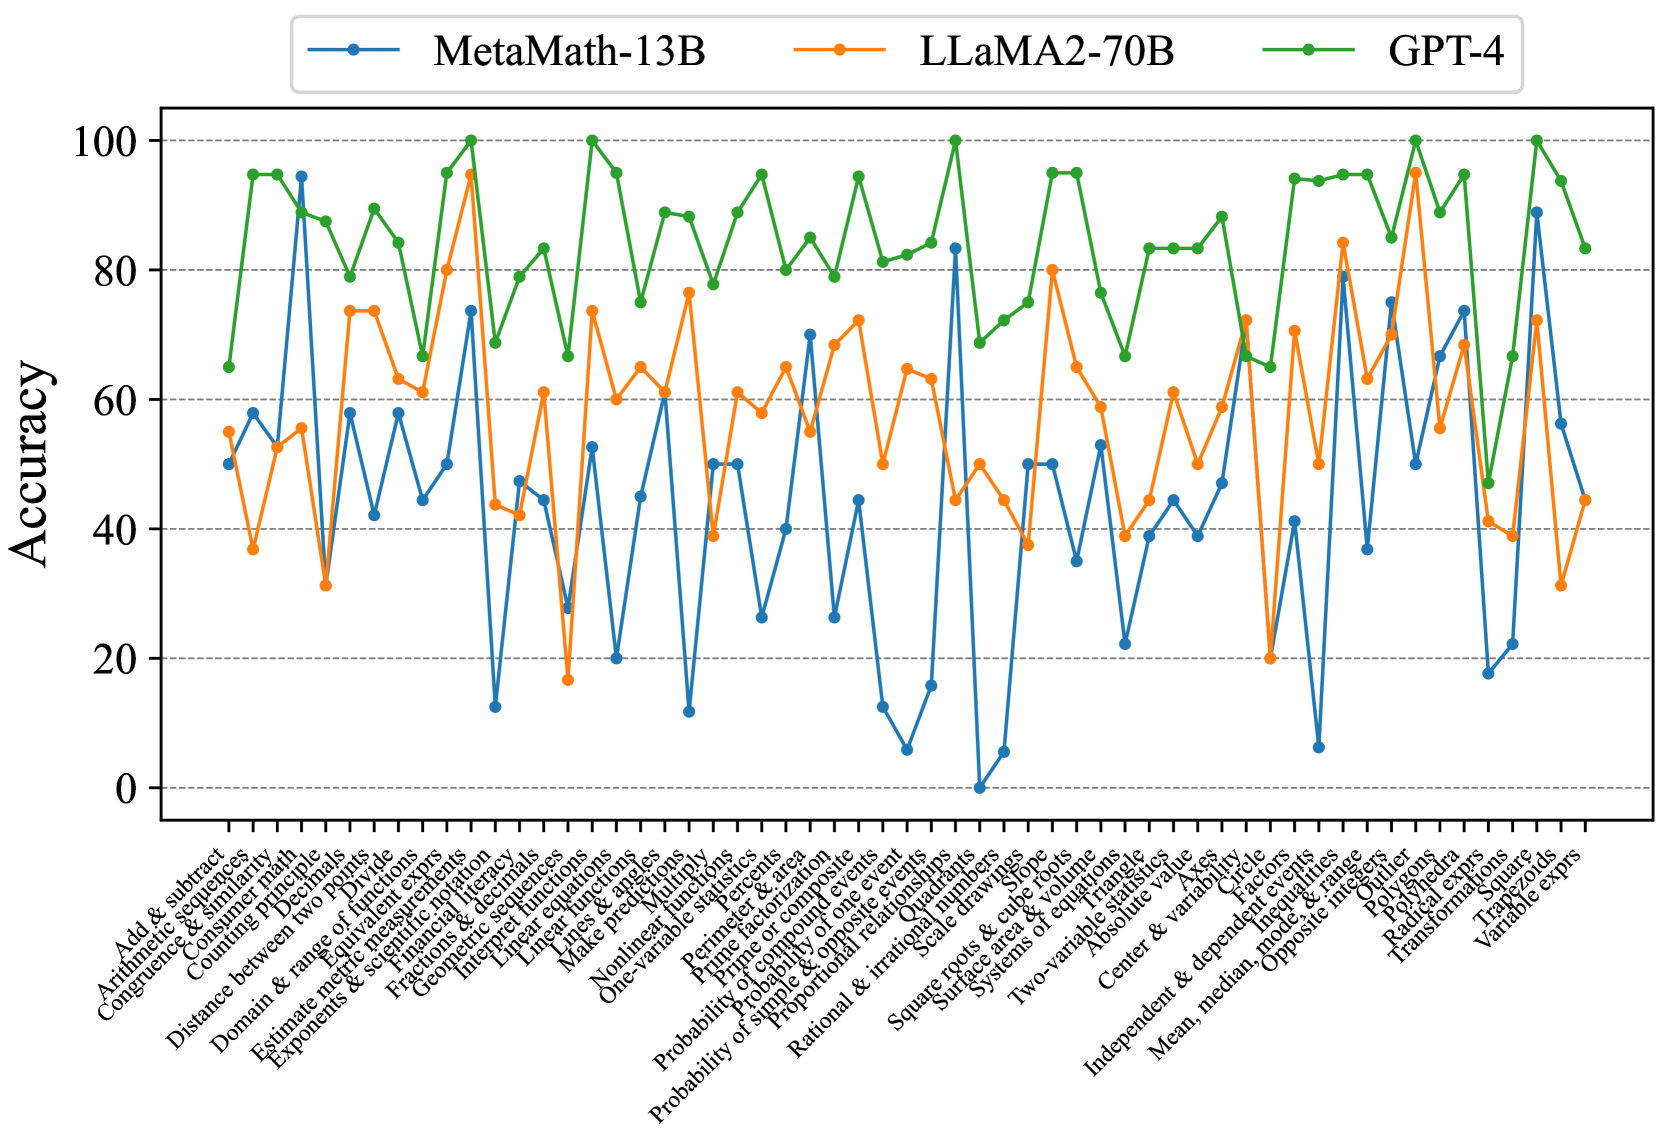
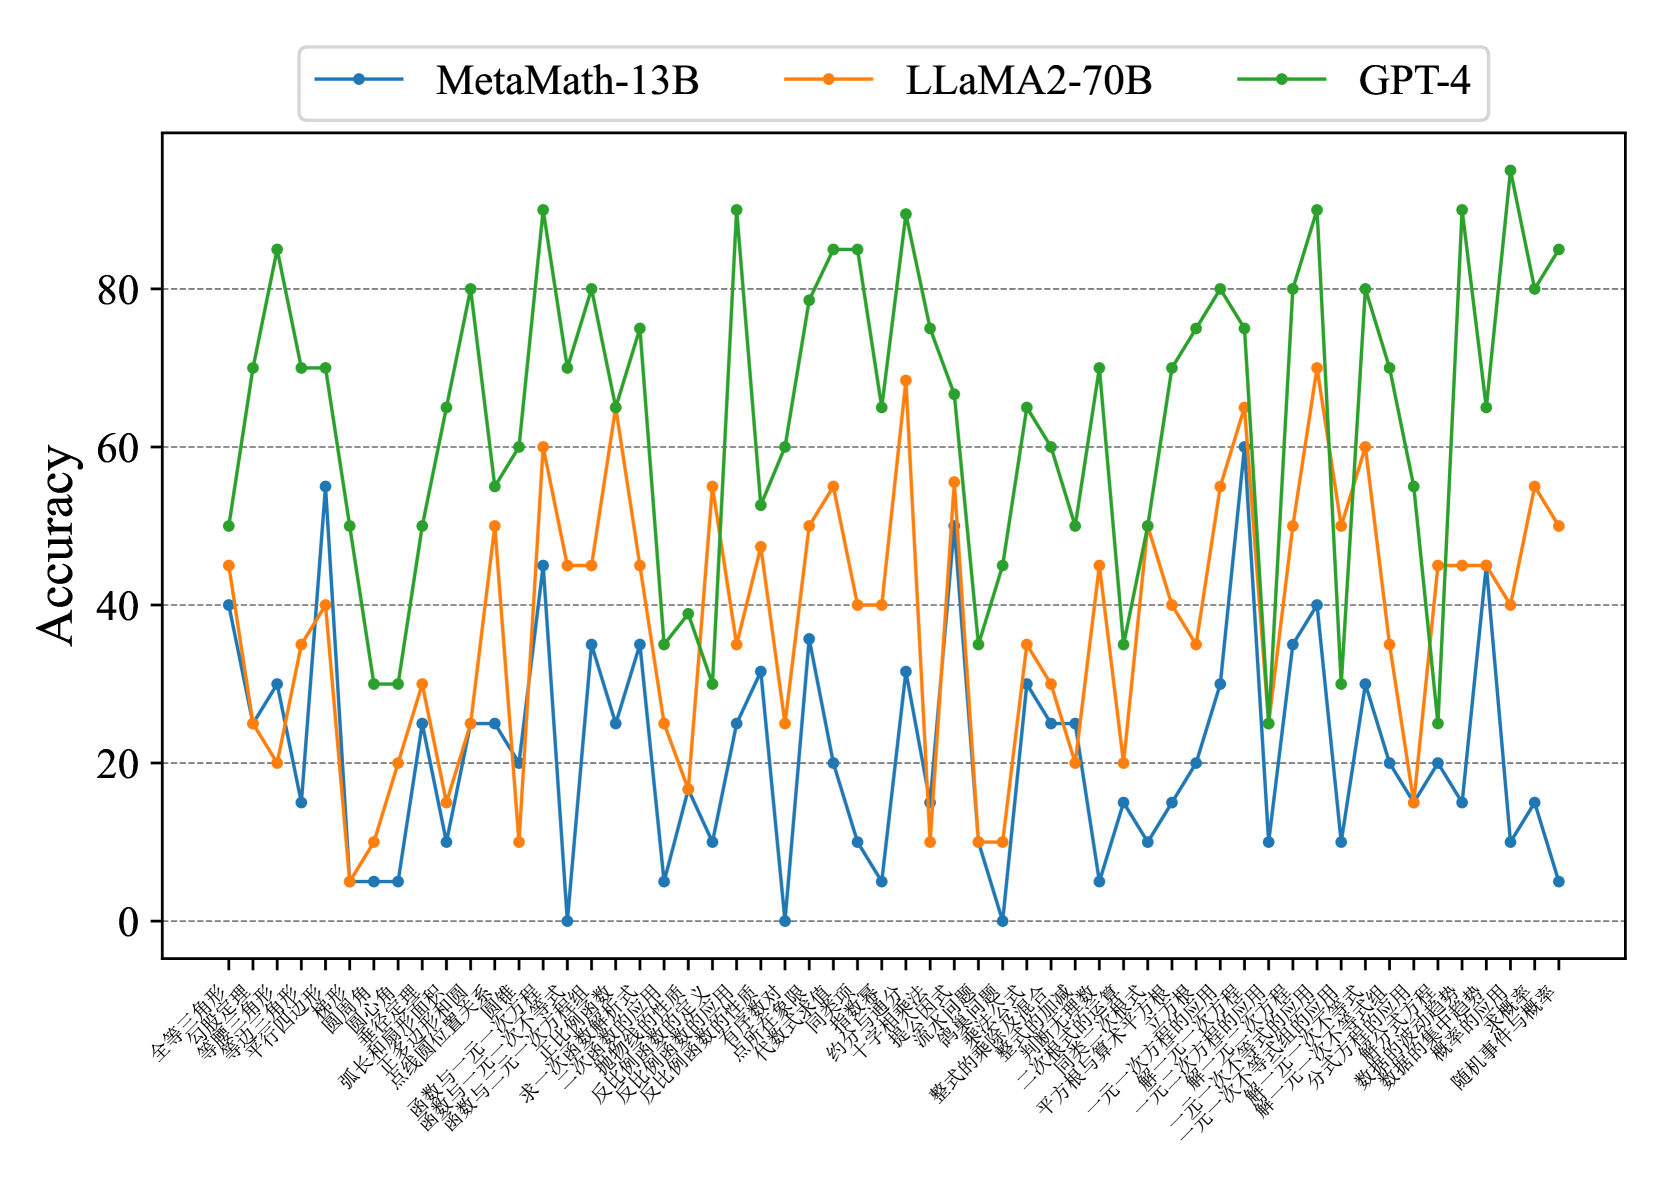
Concept-wised Accuracy.
Fig. 7 and Fig. 8 show that most existing LLMs, whether open-sourced, closed-sourced, general-purpose, or math-specialized, exhibit notable differences in their concept accuracies in the zero-shot prompt setting. These disparities may stem from variations in training datasets, strategies, and model sizes, which suggests that apart from common weaknesses, each model possesses its unique areas of deficiency or shortcomings. For the sake of brevity in the presentation, we only show a subset of models on Middle-EN and Middle-ZH. The concept accuracies of Elementary-EN and Elementary-ZH systems and all results of all models can be found in Appendix D.
<details>
<summary>x10.png Details</summary>
### Visual Description
\n
## Line Chart: Mathematical Problem Solving Accuracy
### Overview
This image presents a line chart comparing the accuracy of three large language models – MetaMath-13B, LLaMA2-70B, and GPT-4 – on a series of mathematical problems. The x-axis represents different mathematical topics, and the y-axis represents the accuracy score (ranging from 0 to 100). The chart visually demonstrates the performance of each model across these topics, allowing for a comparison of their strengths and weaknesses.
### Components/Axes
* **X-axis Title:** Mathematical Topics (listed along the bottom of the chart)
* **Y-axis Title:** Accuracy (ranging from 0 to 100, listed on the left side of the chart)
* **Legend:** Located at the top-center of the chart, identifying each line with a color and model name:
* Blue Line: MetaMath-13B
* Orange Line: LLaMA2-70B
* Green Line: GPT-4
* **X-axis Markers:** The following mathematical topics are listed (from left to right):
* Arithmetic
* Add & Subtract
* Arithmetic Equivalence
* Congruence & Similarity
* Counting Problems
* Distance between two points
* Domain & range of functions
* Exponents & Scientific Notation
* Estimate square roots
* Fractions & decimals
* Geometric Measurement
* Linear equations
* Make predictions
* One variable equations
* Nonlinear functions
* Permutation & combination
* Prime factorization
* Probability of one event
* Probability of multiple events
* Proportional relationships
* Rational & irrational numbers
* Scale drawings
* Systems of equations
* Two-variable equations
* Absolute value
* Center & variable
* Independent & dependent variables
* Mean, median, opposite
* Inequality
* Polygons
* Radial expressions
* Transformations
* Variable expressions
### Detailed Analysis
The chart displays accuracy scores for each model across the listed mathematical topics.
* **GPT-4 (Green Line):** The GPT-4 line generally maintains a high accuracy, fluctuating between approximately 70% and 100%. It shows a slight dip around the "Probability of one event" and "Probability of multiple events" topics, dropping to around 70-75%, but quickly recovers. It consistently outperforms the other two models.
* **LLaMA2-70B (Orange Line):** The LLaMA2-70B line exhibits more variability. It starts around 70% accuracy, dips significantly to around 40-50% for topics like "Arithmetic Equivalence" and "Counting Problems", then rises again to around 80-90% for "Linear Equations" and "Systems of Equations". It generally stays below GPT-4.
* **MetaMath-13B (Blue Line):** The MetaMath-13B line shows the most significant fluctuations. It starts at approximately 20%, rises to around 80% for "Fractions & Decimals", then drops dramatically to near 0% for "Nonlinear Functions" and "Permutation & Combination". It generally performs the worst among the three models.
Here's a more detailed breakdown of approximate accuracy values for specific topics:
| Topic | MetaMath-13B | LLaMA2-70B | GPT-4 |
| --------------------------- | ------------ | ---------- | ------- |
| Arithmetic | ~10% | ~70% | ~90% |
| Add & Subtract | ~20% | ~75% | ~95% |
| Arithmetic Equivalence | ~5% | ~45% | ~80% |
| Congruence & Similarity | ~15% | ~60% | ~85% |
| Counting Problems | ~10% | ~50% | ~80% |
| Distance between two points | ~30% | ~70% | ~90% |
| Domain & range of functions| ~20% | ~65% | ~85% |
| Exponents & Scientific Notation| ~25% | ~70% | ~90% |
| Estimate square roots | ~30% | ~75% | ~90% |
| Fractions & decimals | ~80% | ~85% | ~95% |
| Geometric Measurement | ~20% | ~60% | ~80% |
| Linear equations | ~60% | ~85% | ~95% |
| Make predictions | ~30% | ~70% | ~85% |
| One variable equations | ~40% | ~75% | ~90% |
| Nonlinear functions | ~0% | ~40% | ~70% |
| Permutation & combination | ~0% | ~30% | ~60% |
| Prime factorization | ~10% | ~50% | ~75% |
| Probability of one event | ~20% | ~60% | ~70% |
| Probability of multiple events| ~15% | ~55% | ~70% |
| Proportional relationships | ~30% | ~70% | ~85% |
| Rational & irrational numbers| ~20% | ~60% | ~80% |
| Scale drawings | ~25% | ~65% | ~85% |
| Systems of equations | ~60% | ~85% | ~95% |
| Two-variable equations | ~50% | ~80% | ~90% |
| Absolute value | ~30% | ~70% | ~85% |
| Center & variable | ~20% | ~60% | ~80% |
| Independent & dependent variables| ~30% | ~70% | ~85% |
| Mean, median, opposite | ~40% | ~75% | ~90% |
| Inequality | ~30% | ~70% | ~85% |
| Polygons | ~20% | ~60% | ~80% |
| Radial expressions | ~10% | ~50% | ~75% |
| Transformations | ~20% | ~60% | ~80% |
| Variable expressions | ~30% | ~70% | ~85% |
### Key Observations
* GPT-4 consistently demonstrates the highest accuracy across all mathematical topics.
* LLaMA2-70B shows moderate accuracy, with significant dips in certain areas.
* MetaMath-13B exhibits the most variability and generally the lowest accuracy, particularly in more complex topics.
* All models perform relatively well on "Fractions & Decimals" and "Linear Equations".
* All models struggle with "Nonlinear Functions" and "Permutation & Combination", although GPT-4 maintains a higher accuracy even in these challenging areas.
### Interpretation
The data suggests that GPT-4 is the most proficient model in solving a wide range of mathematical problems, followed by LLaMA2-70B, and then MetaMath-13B. The performance differences likely stem from variations in model size, training data, and architectural design. The consistent high performance of GPT-4 indicates a strong understanding of mathematical concepts and problem-solving abilities. The fluctuations in accuracy for LLaMA2-70B and MetaMath-13B suggest that their performance is more sensitive to the specific type of mathematical problem. The significant drop in accuracy for MetaMath-13B on complex topics highlights its limitations in handling advanced mathematical concepts. This chart provides valuable insights into the capabilities and limitations of these large language models in the domain of mathematics, which can inform future research and development efforts. The models' relative strengths and weaknesses can be leveraged to create more effective educational tools or automated problem-solving systems.
</details>
Figure 7: Concept accuracies on Middle-EN.
<details>
<summary>x11.png Details</summary>
### Visual Description
## Line Chart: Model Accuracy on Mathematical Problems
### Overview
This image presents a line chart comparing the accuracy of three large language models – MetaMath-13B, LLaMA2-70B, and GPT-4 – across a series of mathematical problems. The x-axis represents different mathematical problem sets, labeled in Chinese characters, and the y-axis represents the accuracy achieved by each model, ranging from 0 to 80.
### Components/Axes
* **Y-axis Title:** "Accuracy"
* **X-axis Labels:** A series of mathematical problem sets labeled in Chinese. The labels are densely packed and appear to represent different mathematical topics or difficulty levels.
* **Legend:** Located at the top-center of the chart.
* Blue Line: MetaMath-13B
* Orange Line: LLaMA2-70B
* Green Line: GPT-4
* **Gridlines:** Horizontal gridlines are present to aid in reading accuracy values.
### Detailed Analysis
The chart displays the accuracy of each model as a line plotted against the problem sets.
**MetaMath-13B (Blue Line):** The line fluctuates significantly. It starts at approximately 75, drops to around 10, then oscillates between approximately 15 and 40 for the majority of the problem sets. Towards the end, it declines to around 10.
* Initial Accuracy: ~75
* Lowest Accuracy: ~8
* Highest Accuracy (excluding initial point): ~40
* Final Accuracy: ~10
**LLaMA2-70B (Orange Line):** This line also exhibits considerable fluctuation. It begins at around 25, rises to a peak of approximately 65, then generally oscillates between 20 and 55. It ends at around 45.
* Initial Accuracy: ~25
* Lowest Accuracy: ~15
* Highest Accuracy: ~65
* Final Accuracy: ~45
**GPT-4 (Green Line):** This line demonstrates the most consistent and generally highest accuracy. It starts at approximately 45, rises to a peak of around 85, and remains largely above 60 throughout the chart. It ends at approximately 85.
* Initial Accuracy: ~45
* Lowest Accuracy: ~60
* Highest Accuracy: ~85
* Final Accuracy: ~85
**X-Axis Labels (Chinese):**
The x-axis labels are in Chinese. A rough transliteration and potential meaning (based on common mathematical terms) is provided below. Note that this is an approximation.
1. 全面微积分 (Quánmiàn wēijífēn) - Comprehensive Calculus
2. 初等代数 (Chūděng dàishù) - Elementary Algebra
3. 高等代数 (Gāoděng dàishù) - Advanced Algebra
4. 三角学 (Sānjiǎoxué) - Trigonometry
5. 概率与统计 (Gàilǜ yǔ tǒngjì) - Probability and Statistics
6. 求和 (Qiúhé) - Summation
7. 反常积分 (Fǎncháng jīfēn) - Improper Integral
8. 反三角函数 (Fǎn sānjiǎo hánshù) - Inverse Trigonometric Functions
9. 极限 (Jìxiàn) - Limits
10. 导数 (Dǎoshù) - Derivatives
11. 积分 (Jīfēn) - Integrals
12. 级数 (Jíshù) - Series
13. 微分方程 (Wēifēn fāngchéng) - Differential Equations
14. 线性代数 (Xiànxìng dàishù) - Linear Algebra
15. 平面几何 (Píngmiàn jǐhè) - Plane Geometry
16. 立体几何 (Lìtǐ jǐhè) - Solid Geometry
17. 一元二次方程 (Yīyuán èrcì fāngchéng) - Quadratic Equation
18. 一元三次方程 (Yīyuán sān cì fāngchéng) - Cubic Equation
19. 概率 (Gàilǜ) - Probability
20. 期望 (Qīwàng) - Expectation
21. 方差 (Fāngchā) - Variance
22. 偏导数 (Piāndǎoshù) - Partial Derivatives
23. 向量 (Xiàngliàng) - Vectors
### Key Observations
* GPT-4 consistently outperforms both MetaMath-13B and LLaMA2-70B across all problem sets.
* MetaMath-13B exhibits the most volatile performance, with large swings in accuracy.
* LLaMA2-70B shows moderate performance, generally falling between MetaMath-13B and GPT-4.
* The problem sets appear to vary in difficulty, as evidenced by the fluctuations in accuracy for all models.
### Interpretation
The data strongly suggests that GPT-4 possesses superior mathematical reasoning capabilities compared to MetaMath-13B and LLaMA2-70B. The consistent high accuracy of GPT-4 indicates a robust understanding of mathematical concepts and problem-solving skills. The significant fluctuations in accuracy for MetaMath-13B suggest that its performance is highly sensitive to the specific type of mathematical problem presented. LLaMA2-70B provides a middle ground, demonstrating better performance than MetaMath-13B but still lagging behind GPT-4.
The Chinese labels on the x-axis indicate that the models were evaluated on a diverse range of mathematical topics, including calculus, algebra, trigonometry, probability, and geometry. The varying accuracy levels across these topics suggest that the models may have different strengths and weaknesses in specific areas of mathematics. The chart provides valuable insights into the mathematical reasoning abilities of these large language models and highlights the potential for further research and development in this field.
</details>
Figure 8: Concept accuracies on Middle-ZH.
| Model | Elementary-EN | Middle-EN | Elementary-ZH | Middle-ZH | Avg. $\downarrow$ |
| --- | --- | --- | --- | --- | --- |
| Yi-6B | 5.30 / 1.73 | 5.21 / 1.37 | 0.04 / 0.20 | 0.36 / 0.35 | 2.73 / 0.91 |
| ChatGLM3-6B | 7.42 / 0.22 | 7.55 / 0.23 | 0.11 / 0.02 | 0.35 / 0.05 | 3.86 / 0.13 |
| InternLM2-Math-7B | 7.42 / 0.22 | 7.55 / 0.23 | 0.11 / 0.02 | 0.35 / 0.05 | 3.86 / 0.13 |
| InternLM2-7B | 5.36 / 1.03 | 5.27 / 0.84 | 0.01 / 0.37 | 0.33 / 0.49 | 2.74 / 0.68 |
| MAmmoTH-13B | 7.67 / 0.47 | 7.97 / 0.46 | 0.00 / 0.03 | 0.35 / 0.03 | 4.00 / 0.25 |
| WizardMath-13B | 8.41 / 0.35 | 8.23 / 0.34 | 0.00 / 0.02 | 0.55 / 0.02 | 4.30 / 0.18 |
| MetaMath-13B | 7.67 / 0.47 | 7.97 / 0.46 | 0.00 / 0.03 | 0.35 / 0.03 | 4.00 / 0.25 |
| Baichuan2-13B | 7.20 / 1.43 | 6.58 / 1.18 | 0.05 / 0.54 | 0.41 / 0.65 | 3.56 / 0.95 |
| LLaMA2-13B | 6.80 / 0.73 | 6.36 / 0.64 | 0.01 / 0.15 | 0.56 / 0.16 | 3.43 / 0.42 |
| Qwen-14B | 11.04 / 1.58 | 9.73 / 1.08 | 1.43 / 1.27 | 0.70 / 0.93 | 5.73 / 1.22 |
| InternLM2-Math-20B | 5.58 / 1.30 | 5.51 / 0.99 | 0.03 / 0.47 | 0.34 / 0.47 | 2.86 / 0.81 |
| InternLM2-20B | 7.20 / 1.43 | 6.58 / 1.18 | 0.05 / 0.54 | 0.41 / 0.65 | 3.56 / 0.95 |
| GPT-3.5 | 9.48 / - | 9.21 / - | 0.00 / - | 0.31 / - | 4.75 / - |
| GPT-4 | 8.68 / - | 8.24 / - | 0.15 / - | 0.68 / - | 4.44 / - |
Table 3: Data contamination rate of LLMs. We provide two different contamination detection methods. The values in the table represent “Rouge / Prob”. Note that the second method based on output probability distributions can only be applied to the open-source models.
3.3 Analysis
Contamination.
To determine whether a text is in the pretraining data of a LLM, we provide two different contamination detection methods (i.e., Rouge-based and Prob-based methods) to analyze our ConceptMath in Table 3. Specifically, for the Rouge-based method, we just input the first 50% of the question as the input and compute the Rouge-L score between the generation results and the ground-truth label of the last 50% of the text, where a lower Rouge-L score means a lower contamination rate. For the Prob-based method, we follow Shi et al. (2023) to use the MIN-K% probability metric, which first gets the probability for each token in the test, and selects the K% tokens with minimum probabilities and calculates their average log-likelihood. If the average log-likelihood is high, the text is likely in the pretraining data. Note that we choose $K$ as 10 in our setting. In Table 3, we observe that the contaminate rates on our ConceptMath are very low, which means that our ConceptMath can provide a reasonable evaluation for existing LLMs.
| Concept | Concept Acc | Error Type | Example |
| --- | --- | --- | --- |
| Perimeter | 26.32 | Calculation Error | Q: Find the perimeter of a 16 by 18 feet rectangle. A: The perimeter is 16 + 18 + 16 + 18 = 72 feet. |
| Knowledge Error | Q: The perimeter of a rectangular sticker is 14 centimeters. The sticker is 2 centimeters wide. How tall is it? A: The height equals the perimeter subtracts the width. The height of the rectangle is $14-12=12$ centimeters. | | |
| Polygons | 11.11 | Knowledge Error | Q: A regular polygon has an interior angle that measures 120 degrees. How many sides does this polygon have? A: Let $n$ be the number of sides of the polygon. We have that $n× 120=360$ . Hence: $n=3$ . |
| Cylinders | 11.76 | Calculation Error | Q: How much soup can a cylinder-shaped can store, if the radius of the can is 3 inches and the height is 5 inches? A: … The volume of the can is V = $\pi× 3^{2}× 5=30\pi$ . |
Table 4: Error reasons of several unmastered concepts of LLaMA2-13B.
Unmastered Concepts.
We also highlight the several unmastered concepts of the LLaMA2-13B in Table 4, which shows ConceptMath is effective in guiding further refinement of existing LLMs.
| Models | LLaMA2 | LLaMA2 | LLaMA2 |
| --- | --- | --- | --- |
| (w/ MMQA) | (w/ MMQA | | |
| &CS) | | | |
| Cones | 0.00 | 17.65 | 23.53 |
| Spheres | 5.88 | 29.41 | 35.29 |
| Polygons | 11.11 | 61.11 | 66.67 |
| Rational Number | 11.76 | 23.53 | 52.94 |
| Cylinders | 11.76 | 35.29 | 47.06 |
| Angles | 11.76 | 47.06 | 58.82 |
| Probability | 18.75 | 25.00 | 75.00 |
| Perimeter | 26.32 | 42.11 | 63.16 |
| Volume | 27.78 | 38.89 | 66.67 |
| Proportional | 27.78 | 33.33 | 44.44 |
| Avg Acc. | 15.29 | 36.88 | 53.36 |
| (over 10 concepts) | | | |
| Avg Acc. | 51.94 | 58.14 | 60.67 |
| (over 33 concepts) | | | |
| Overall Acc. | 44.02 | 53.94 | 59.29 |
Table 5: Results of fine-tuning models. “MMQA” and “CS” denote MetaMathQA and our constructed Concept-Specific training datasets, respectively. Introducing CS data specifically for the bottom 10 concepts significantly enhances these concepts’ performance, while slightly improving the performance across the remaining 33 concepts.
Evaluation Prompting.
Different from the few-shot or cot prompting evaluation that can boost closed-source models, we find that zero-shot prompting is more effective for certain open-source LLMs in Table 2. This disparity may arise either because the models are not sufficiently powerful to own mathematical CoT capabilities Yu et al. (2023); Wei et al. (2022) or because these models have already incorporated CoT data during training Longpre et al. (2023). Consequently, to ensure a comprehensive analysis, we have employed all three prompting methods for evaluation.
Efficient Fine-tuning.
To show the effect of efficient fine-tuning, we take the LLaMA2-13B as an example in Table 5. Specifically, for LLaMA2-13B, we first select 10 concepts with the lowest accuracies in Elementary-EN. Then, we crawl 495 samples (about 50 samples per concept) using the trained classifier as the Concept-Specific (CS) training data (See Appendix B for more details). Meanwhile, to avoid overfitting, we introduce the MetaMathQA (MMQA Yu et al. (2023) ) data to preserve general mathematical abilities. After that, we can fine-tune LLaMA2-13B by only using MMQA (i.e., LLaMA2 (w/ MMQA)), or using both MMQA and CS data (i.e., LLaMA2 (w/ MMQA & CS)). In Table 5, we observe that LLaMA2 (w/ MMQA & CS) archives significant improvements on the lowest 10 concepts and preserves well on the other 33 concepts, which shows the effect of efficient fine-tuning and the advantages of our ConceptMath.
4 Related Work
Large Language Models for Mathematics.
Large Language Models (LLMs) such as GPT-3.5 and GPT-4 have exhibited promising capabilities in complex mathematical tasks. However, the proficiency of open-source alternatives like LLaMA (Touvron et al., 2023a) and LLaMA2 (Touvron et al., 2023b) remains notably inferior on these datasets, particularly in handling non-English problems. In contrast, models like Baichuan2 (Baichuan, 2023) and Qwen (Bai et al., 2023b) pretrained on multilingual datasets (i.e., Chinese and English) have achieved remarkable performance. Recently, many domain-specialized math language models have been proposed. For example, MetaMath (Yu et al., 2023) leverages the LLaMA2 models and finetunes on the constructed MetaMathQA dataset. MAmmoTH (Yue et al., 2023) synergizes Chain-of-Thought (CoT) and Program-of-Thought (PoT) rationales.
Mathmatical Reasoning Benchmarks.
Recently, many mathematical datasets Roy and Roth (2015); Koncel-Kedziorski et al. (2015); Lu et al. (2023); Huang et al. (2016); Miao et al. (2020); Patel et al. (2021) have been proposed. For example, SingleOp (Roy et al., 2015), expands the scope to include more complex operations like multiplication and division. Math23k (Wang et al., 2017) gathers 23,161 problems labeled with structured equations and corresponding answers. GSM8K (Cobbe et al., 2021) is a widely used dataset, which requires a sequence of elementary calculations with basic arithmetic operations.
Fine-Grained Benchmarks.
Traditional benchmarks focus on assessing certain abilities of models on one task Guo et al. (2023b); Wang et al. (2023a); Liu et al. (2020); Guo et al. (2022); Chai et al. (2024); Liu et al. (2024); Guo et al. (2024, 2023c); Bai et al. (2023a); Liu et al. (2022); Guo et al. (2023a); Bai et al. (2024); Liu et al. (2021) (e.g., reading comprehension (Rajpurkar et al., 2018), machine translation (Bojar et al., 2014), and summarization (Narayan et al., 2018)). For example, the GLUE benchmark (Wang et al., 2019) combines a collection of tasks, and has witnessed superhuman model performance for pretraining models (Kenton and Toutanova, 2019; Radford et al., 2019) (Hendrycks et al., 2021a) introduced MMLU, a benchmark with multiple-choice questions across 57 subjects including STEM, humanities, and social sciences, for assessing performance and identifying weaknesses. (et al., 2022) proposed BIG-bench with over 200 tasks. To enhance the mathematical capabilities of LLMs, we introduce a comprehensive mathematical reasoning ConceptMath dataset designed to assess model performance across over 200 diverse mathematical concepts in both Chinese and English.
5 Conclusion
We introduce a new bilingual concept-wise math reasoning dataset called ConceptMath to assess models across a diverse set of concepts. First, ConceptMath covers more than 200 concepts across elementary and middle schools for mainstream English and Chinese systems. Second, we extensively evaluate existing LLMs by three prompting methods, which can guide further improvements for these LLMs on mathematical abilities. Third, we analyze the contamination rates, error cases and provide a simple and efficient fine-tuning strategy to enhance the weaknesses.
Limitations.
Human efforts are required to carefully design the hierarchical systems of mathematical concepts. In the future, we have three plans as follows: (1) Extend the input modality to multi-modalities. (2) Extend the education systems to high school and college levels. (3) Extend the reasoning abilities to more STEM fields.
References
- Anthropic (2023) Anthropic. 2023. Model card and evaluations for claude models.
- Bai et al. (2024) Ge Bai, Jie Liu, Xingyuan Bu, Yancheng He, Jiaheng Liu, Zhanhui Zhou, Zhuoran Lin, Wenbo Su, Tiezheng Ge, Bo Zheng, and Wanli Ouyang. 2024. Mt-bench-101: A fine-grained benchmark for evaluating large language models in multi-turn dialogues. arXiv.
- Bai et al. (2023a) Jiaqi Bai, Hongcheng Guo, Jiaheng Liu, Jian Yang, Xinnian Liang, Zhao Yan, and Zhoujun Li. 2023a. Griprank: Bridging the gap between retrieval and generation via the generative knowledge improved passage ranking. CIKM.
- Bai et al. (2023b) Jinze Bai, Shuai Bai, Yunfei Chu, Zeyu Cui, Kai Dang, Xiaodong Deng, Yang Fan, Wenbin Ge, Yu Han, Fei Huang, Binyuan Hui, Luo Ji, Mei Li, Junyang Lin, Runji Lin, Dayiheng Liu, Gao Liu, Chengqiang Lu, Keming Lu, Jianxin Ma, Rui Men, Xingzhang Ren, Xuancheng Ren, Chuanqi Tan, Sinan Tan, Jianhong Tu, Peng Wang, Shijie Wang, Wei Wang, Shengguang Wu, Benfeng Xu, Jin Xu, An Yang, Hao Yang, Jian Yang, Shusheng Yang, Yang Yao, Bowen Yu, Hongyi Yuan, Zheng Yuan, Jianwei Zhang, Xingxuan Zhang, Yichang Zhang, Zhenru Zhang, Chang Zhou, Jingren Zhou, Xiaohuan Zhou, and Tianhang Zhu. 2023b. Qwen technical report. arXiv preprint arXiv:2309.16609.
- Baichuan (2023) Baichuan. 2023. Baichuan 2: Open large-scale language models. arXiv preprint arXiv:2309.10305.
- Bojar et al. (2014) Ondřej Bojar, Christian Buck, Christian Federmann, Barry Haddow, Philipp Koehn, Johannes Leveling, Christof Monz, Pavel Pecina, Matt Post, Herve Saint-Amand, Radu Soricut, Lucia Specia, and Aleš Tamchyna. 2014. Findings of the 2014 workshop on statistical machine translation. In Proceedings of the Ninth Workshop on Statistical Machine Translation, pages 12–58, Baltimore, Maryland, USA. Association for Computational Linguistics.
- Chai et al. (2024) Linzheng Chai, Jian Yang, Tao Sun, Hongcheng Guo, Jiaheng Liu, Bing Wang, Xiannian Liang, Jiaqi Bai, Tongliang Li, Qiyao Peng, et al. 2024. xcot: Cross-lingual instruction tuning for cross-lingual chain-of-thought reasoning. arXiv preprint arXiv:2401.07037.
- Cobbe et al. (2021) Karl Cobbe, Vineet Kosaraju, Mohammad Bavarian, Mark Chen, Heewoo Jun, Lukasz Kaiser, Matthias Plappert, Jerry Tworek, Jacob Hilton, Reiichiro Nakano, Christopher Hesse, and John Schulman. 2021. Training verifiers to solve math word problems.
- Du et al. (2022) Zhengxiao Du, Yujie Qian, Xiao Liu, Ming Ding, Jiezhong Qiu, Zhilin Yang, and Jie Tang. 2022. Glm: General language model pretraining with autoregressive blank infilling. In Proceedings of the 60th Annual Meeting of the Association for Computational Linguistics (Volume 1: Long Papers), pages 320–335.
- et al. (2022) Aarohi Srivastava et al. 2022. Beyond the imitation game: Quantifying and extrapolating the capabilities of language models. arXiv preprint arXiv: Arxiv-2206.04615.
- Fritz et al. (2013) Annemarie Fritz, Antje Ehlert, and Lars Balzer. 2013. Development of mathematical concepts as basis for an elaborated mathematical understanding. South African Journal of Childhood Education, 3(1):38–67.
- Guo et al. (2022) Hongcheng Guo, Jiaheng Liu, Haoyang Huang, Jian Yang, Zhoujun Li, Dongdong Zhang, Zheng Cui, and Furu Wei. 2022. Lvp-m3: language-aware visual prompt for multilingual multimodal machine translation. EMNLP.
- Guo et al. (2023a) Hongcheng Guo, Boyang Wang, Jiaqi Bai, Jiaheng Liu, Jian Yang, and Zhoujun Li. 2023a. M2c: Towards automatic multimodal manga complement. In Findings of the Association for Computational Linguistics: EMNLP 2023, pages 9876–9882.
- Guo et al. (2024) Hongcheng Guo, Jian Yang, Jiaheng Liu, Jiaqi Bai, Boyang Wang, Zhoujun Li, Tieqiao Zheng, Bo Zhang, Qi Tian, et al. 2024. Logformer: A pre-train and tuning pipeline for log anomaly detection. AAAI.
- Guo et al. (2023b) Hongcheng Guo, Jian Yang, Jiaheng Liu, Liqun Yang, Linzheng Chai, Jiaqi Bai, Junran Peng, Xiaorong Hu, Chao Chen, Dongfeng Zhang, et al. 2023b. Owl: A large language model for it operations. arXiv preprint arXiv:2309.09298.
- Guo et al. (2023c) Jinyang Guo, Jiaheng Liu, Zining Wang, Yuqing Ma, Ruihao Gong, Ke Xu, and Xianglong Liu. 2023c. Adaptive contrastive knowledge distillation for bert compression. In Findings of the Association for Computational Linguistics: ACL 2023, pages 8941–8953.
- Hendrycks et al. (2021a) Dan Hendrycks, Collin Burns, Steven Basart, Andy Zou, Mantas Mazeika, Dawn Song, and Jacob Steinhardt. 2021a. Measuring massive multitask language understanding. Proceedings of the International Conference on Learning Representations (ICLR).
- Hendrycks et al. (2021b) Dan Hendrycks, Collin Burns, Saurav Kadavath, Akul Arora, Steven Basart, Eric Tang, Dawn Song, and Jacob Steinhardt. 2021b. Measuring mathematical problem solving with the math dataset. In Thirty-fifth Conference on Neural Information Processing Systems Datasets and Benchmarks Track (Round 2).
- Huang et al. (2016) Danqing Huang, Shuming Shi, Chin-Yew Lin, Jian Yin, and Wei-Ying Ma. 2016. How well do computers solve math word problems? large-scale dataset construction and evaluation. In Proceedings of the 54th Annual Meeting of the Association for Computational Linguistics (Volume 1: Long Papers), pages 887–896.
- Kenton and Toutanova (2019) Jacob Devlin Ming-Wei Chang Kenton and Lee Kristina Toutanova. 2019. Bert: Pre-training of deep bidirectional transformers for language understanding. In Proceedings of NAACL-HLT, pages 4171–4186.
- Koncel-Kedziorski et al. (2015) Rik Koncel-Kedziorski, Hannaneh Hajishirzi, Ashish Sabharwal, Oren Etzioni, and Siena Dumas Ang. 2015. Parsing algebraic word problems into equations. Transactions of the Association for Computational Linguistics, 3:585–597.
- Liu et al. (2024) Jiaheng Liu, Zhiqi Bai, Yuanxing Zhang, Chenchen Zhang, Yu Zhang, Ge Zhang, Jiakai Wang, Haoran Que, Yukang Chen, Wenbo Su, et al. 2024. E2-llm: Efficient and extreme length extension of large language models. arXiv preprint arXiv:2401.06951.
- Liu et al. (2021) Jiaheng Liu, Yudong Wu, Yichao Wu, Chuming Li, Xiaolin Hu, Ding Liang, and Mengyu Wang. 2021. Dam: discrepancy alignment metric for face recognition. In Proceedings of the IEEE/CVF International Conference on Computer Vision, pages 3814–3823.
- Liu et al. (2022) Jiaheng Liu, Tan Yu, Hanyu Peng, Mingming Sun, and Ping Li. 2022. Cross-lingual cross-modal consolidation for effective multilingual video corpus moment retrieval. In Findings of the Association for Computational Linguistics: NAACL 2022, pages 1854–1862.
- Liu et al. (2020) Jiaheng Liu, Shunfeng Zhou, Yichao Wu, Ken Chen, Wanli Ouyang, and Dong Xu. 2020. Block proposal neural architecture search. IEEE Transactions on Image Processing, 30:15–25.
- Longpre et al. (2023) Shayne Longpre, Le Hou, Tu Vu, Albert Webson, Hyung Won Chung, Yi Tay, Denny Zhou, Quoc V. Le, Barret Zoph, Jason Wei, and Adam Roberts. 2023. The flan collection: designing data and methods for effective instruction tuning. In Proceedings of the 40th International Conference on Machine Learning, ICML’23. JMLR.org.
- Lu et al. (2023) Pan Lu, Liang Qiu, Kai-Wei Chang, Ying Nian Wu, Song-Chun Zhu, Tanmay Rajpurohit, Peter Clark, and Ashwin Kalyan. 2023. Dynamic prompt learning via policy gradient for semi-structured mathematical reasoning. In The Eleventh International Conference on Learning Representations.
- Luo et al. (2023) Haipeng Luo, Qingfeng Sun, Can Xu, Pu Zhao, Jianguang Lou, Chongyang Tao, Xiubo Geng, Qingwei Lin, Shifeng Chen, and Dongmei Zhang. 2023. Wizardmath: Empowering mathematical reasoning for large language models via reinforced evol-instruct. arXiv preprint arXiv:2308.09583.
- Megill and Wheeler (2019) Norman Megill and David A Wheeler. 2019. Metamath: a computer language for mathematical proofs. Lulu. com.
- Miao et al. (2020) Shen-Yun Miao, Chao-Chun Liang, and Keh-Yih Su. 2020. A diverse corpus for evaluating and developing english math word problem solvers. In Proceedings of the 58th Annual Meeting of the Association for Computational Linguistics, pages 975–984.
- Narayan et al. (2018) Shashi Narayan, Shay B. Cohen, and Mirella Lapata. 2018. Don’t give me the details, just the summary! topic-aware convolutional neural networks for extreme summarization. In Proceedings of the 2018 Conference on Empirical Methods in Natural Language Processing, pages 1797–1807, Brussels, Belgium. Association for Computational Linguistics.
- OpenAI (2023) OpenAI. 2023. Gpt-4 technical report. PREPRINT.
- Paster et al. (2023) Keiran Paster, Marco Dos Santos, Zhangir Azerbayev, and Jimmy Ba. 2023. Openwebmath: An open dataset of high-quality mathematical web text.
- Patel et al. (2021) Arkil Patel, Satwik Bhattamishra, and Navin Goyal. 2021. Are nlp models really able to solve simple math word problems? In Proceedings of the 2021 Conference of the North American Chapter of the Association for Computational Linguistics: Human Language Technologies, pages 2080–2094.
- Radford et al. (2019) Alec Radford, Jeff Wu, Rewon Child, David Luan, Dario Amodei, and Ilya Sutskever. 2019. Language models are unsupervised multitask learners.
- Rajpurkar et al. (2018) Pranav Rajpurkar, Robin Jia, and Percy Liang. 2018. Know what you don’t know: Unanswerable questions for squad. In Proceedings of the 56th Annual Meeting of the Association for Computational Linguistics (Volume 2: Short Papers), pages 784–789.
- Roy and Roth (2015) Subhro Roy and Dan Roth. 2015. Solving general arithmetic word problems. In Proceedings of the 2015 Conference on Empirical Methods in Natural Language Processing, pages 1743–1752.
- Roy et al. (2015) Subhro Roy, Tim Vieira, and Dan Roth. 2015. Reasoning about quantities in natural language. Transactions of the Association for Computational Linguistics, 3:1–13.
- Shao et al. (2024) Zhihong Shao, Peiyi Wang, Qihao Zhu, Runxin Xu, Junxiao Song, Mingchuan Zhang, Y.K. Li, Y. Wu, and Daya Guo. 2024. Deepseekmath: Pushing the limits of mathematical reasoning in open language models.
- Shi et al. (2023) Weijia Shi, Anirudh Ajith, Mengzhou Xia, Yangsibo Huang, Daogao Liu, Terra Blevins, Danqi Chen, and Luke Zettlemoyer. 2023. Detecting pretraining data from large language models. arXiv preprint arXiv:2310.16789.
- Simon (2011) Martin A Simon. 2011. Studying mathematics conceptual learning: Student learning through their mathematical activity. North American Chapter of the International Group for the Psychology of Mathematics Education.
- Team (2023a) InternLM Team. 2023a. Internlm: A multilingual language model with progressively enhanced capabilities. https://github.com/InternLM/InternLM-techreport.
- Team (2023b) Yi Team. 2023b. Yi: Building the next generation of open-source and bilingual llms. https://github.com/01-ai/Yi.
- Touvron et al. (2023a) Hugo Touvron, Thibaut Lavril, Gautier Izacard, Xavier Martinet, Marie-Anne Lachaux, Timothée Lacroix, Baptiste Rozière, Naman Goyal, Eric Hambro, Faisal Azhar, et al. 2023a. Llama: Open and efficient foundation language models. arXiv preprint arXiv:2302.13971.
- Touvron et al. (2023b) Hugo Touvron, Louis Martin, Kevin Stone, Peter Albert, Amjad Almahairi, Yasmine Babaei, Nikolay Bashlykov, Soumya Batra, Prajjwal Bhargava, Shruti Bhosale, et al. 2023b. Llama 2: Open foundation and fine-tuned chat models. arXiv preprint arXiv:2307.09288.
- Wang et al. (2019) Alex Wang, Amanpreet Singh, Julian Michael, Felix Hill, Omer Levy, and Samuel R. Bowman. 2019. GLUE: A multi-task benchmark and analysis platform for natural language understanding. In International Conference on Learning Representations.
- Wang et al. (2017) Yan Wang, Xiaojiang Liu, and Shuming Shi. 2017. Deep neural solver for math word problems. In Proceedings of the 2017 conference on empirical methods in natural language processing, pages 845–854.
- Wang et al. (2023a) Zekun Moore Wang, Zhongyuan Peng, Haoran Que, Jiaheng Liu, Wangchunshu Zhou, Yuhan Wu, Hongcheng Guo, Ruitong Gan, Zehao Ni, Man Zhang, Zhaoxiang Zhang, Wanli Ouyang, Ke Xu, Wenhu Chen, Jie Fu, and Junran Peng. 2023a. Rolellm: Benchmarking, eliciting, and enhancing role-playing abilities of large language models. arXiv preprint arXiv: 2310.00746.
- Wang et al. (2023b) Zengzhi Wang, Rui Xia, and Liu Pengfei. 2023b. Generative ai for math: Part i – mathpile: A billion-token-scale pretraining corpus for math. arXiv preprint arXiv:2312.17120.
- Wei et al. (2022) Jason Wei, Xuezhi Wang, Dale Schuurmans, Maarten Bosma, Fei Xia, Ed Chi, Quoc V Le, Denny Zhou, et al. 2022. Chain-of-thought prompting elicits reasoning in large language models. Advances in Neural Information Processing Systems, 35:24824–24837.
- Ying et al. (2024) Huaiyuan Ying, Shuo Zhang, Linyang Li, Zhejian Zhou, Yunfan Shao, Zhaoye Fei, Yichuan Ma, Jiawei Hong, Kuikun Liu, Ziyi Wang, Yudong Wang, Zijian Wu, Shuaibin Li, Fengzhe Zhou, Hongwei Liu, Songyang Zhang, Wenwei Zhang, Hang Yan, Xipeng Qiu, Jiayu Wang, Kai Chen, and Dahua Lin. 2024. Internlm-math: Open math large language models toward verifiable reasoning.
- Yu et al. (2023) Longhui Yu, Weisen Jiang, Han Shi, Jincheng Yu, Zhengying Liu, Yu Zhang, James T Kwok, Zhenguo Li, Adrian Weller, and Weiyang Liu. 2023. Metamath: Bootstrap your own mathematical questions for large language models. arXiv preprint arXiv:2309.12284.
- Yue et al. (2023) Xiang Yue, Xingwei Qu, Ge Zhang, Yao Fu, Wenhao Huang, Huan Sun, Yu Su, and Wenhu Chen. 2023. Mammoth: Building math generalist models through hybrid instruction tuning. arXiv preprint arXiv: 2309.05653.
- Zeng et al. (2022) Aohan Zeng, Xiao Liu, Zhengxiao Du, Zihan Wang, Hanyu Lai, Ming Ding, Zhuoyi Yang, Yifan Xu, Wendi Zheng, Xiao Xia, et al. 2022. Glm-130b: An open bilingual pre-trained model. arXiv preprint arXiv:2210.02414.
Appendix A Details on the ConceptMath
As shown in Table 7, Table 8, Table 17 and Table 9, we have provided the details on the three-level hierarchical system of our ConceptMath for better illustration.
<details>
<summary>x12.png Details</summary>
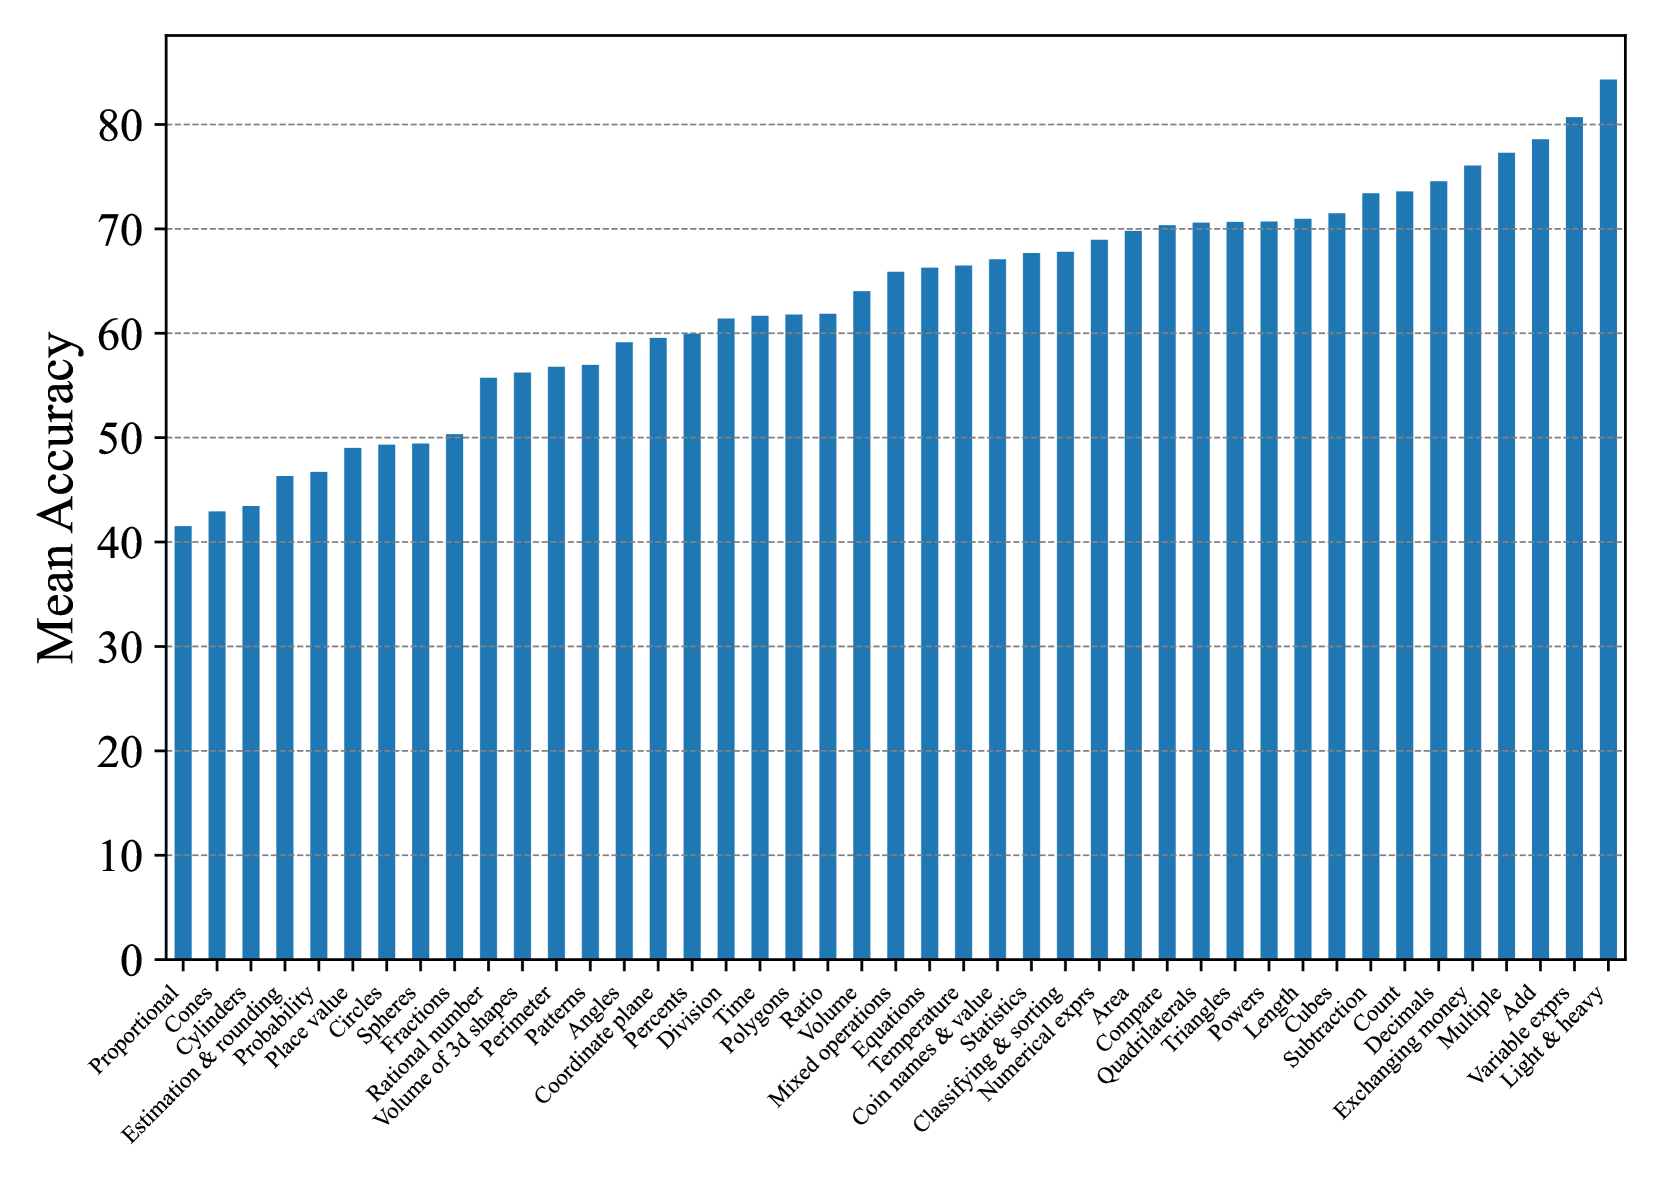
### Visual Description
\n
## Bar Chart: Mean Accuracy by Mathematical Concept
### Overview
This image presents a bar chart illustrating the mean accuracy scores for various mathematical concepts. The x-axis lists the concepts, and the y-axis represents the mean accuracy, ranging from 0 to 80. Each concept is represented by a single bar, with the height of the bar corresponding to the mean accuracy score.
### Components/Axes
* **X-axis Label:** Mathematical Concepts (listed below)
* **Y-axis Label:** Mean Accuracy
* **Y-axis Scale:** 0 to 80, with increments of 10.
* **Concepts (X-axis):** Proportional, Cones, Estimation & rounding, Probability, Place value, Circles, Spheres, Fractions, Rational number, Volume of 3D shapes, Perimeter, Patterns, Angles, Coordinate Plane, Percents, Division, Polygons, Time, Ratio, Volume, Mixed operations, Equations, Temperature, Coin names & value, Classifying & sorting, Numeric expressions, Area, Compare, Quadrilaterals, Triangles, Length, Cubes, Count, Decimals, Exchanging money, Multiple, Add, Light & heavy.
### Detailed Analysis
The bars represent the mean accuracy for each mathematical concept. The trend is generally upward, with accuracy increasing as you move from left to right across the chart.
Here's a breakdown of approximate accuracy values for each concept (reading from left to right):
* **Proportional:** ~5%
* **Cones:** ~15%
* **Estimation & rounding:** ~20%
* **Probability:** ~25%
* **Place value:** ~30%
* **Circles:** ~35%
* **Spheres:** ~38%
* **Fractions:** ~42%
* **Rational number:** ~45%
* **Volume of 3D shapes:** ~50%
* **Perimeter:** ~52%
* **Patterns:** ~55%
* **Angles:** ~57%
* **Coordinate Plane:** ~58%
* **Percents:** ~60%
* **Division:** ~62%
* **Polygons:** ~64%
* **Time:** ~65%
* **Ratio:** ~66%
* **Volume:** ~67%
* **Mixed operations:** ~68%
* **Equations:** ~69%
* **Temperature:** ~70%
* **Coin names & value:** ~71%
* **Classifying & sorting:** ~72%
* **Numeric expressions:** ~73%
* **Area:** ~74%
* **Compare:** ~75%
* **Quadrilaterals:** ~76%
* **Triangles:** ~77%
* **Length:** ~78%
* **Cubes:** ~79%
* **Count:** ~79%
* **Decimals:** ~79%
* **Exchanging money:** ~80%
* **Multiple:** ~80%
* **Add:** ~80%
* **Light & heavy:** ~80%
### Key Observations
* The lowest mean accuracy is observed for "Proportional" (~5%).
* The highest mean accuracies are observed for "Exchanging money", "Multiple", "Add", and "Light & heavy" (~80%).
* There's a significant jump in accuracy between "Rational number" (~45%) and "Volume of 3D shapes" (~50%).
* Accuracy generally increases with the complexity of the mathematical concept, but there are some exceptions.
### Interpretation
The data suggests that students generally perform better on more concrete and practical mathematical concepts (like "Exchanging money" and "Add") compared to more abstract or complex ones (like "Proportional" and "Cones"). The upward trend indicates that as students progress through different mathematical topics, their overall accuracy tends to improve. The jump in accuracy around "Volume of 3D shapes" might indicate a shift in the curriculum or a foundational concept being mastered. The relatively low accuracy for "Proportional" suggests this concept may require additional focus or different teaching strategies. The chart provides a valuable overview of student performance across a range of mathematical concepts, which can be used to inform instructional decisions and identify areas where students may need additional support.
</details>
Figure 9: Mean concept accuracies of Elementary-EN.
<details>
<summary>x13.png Details</summary>
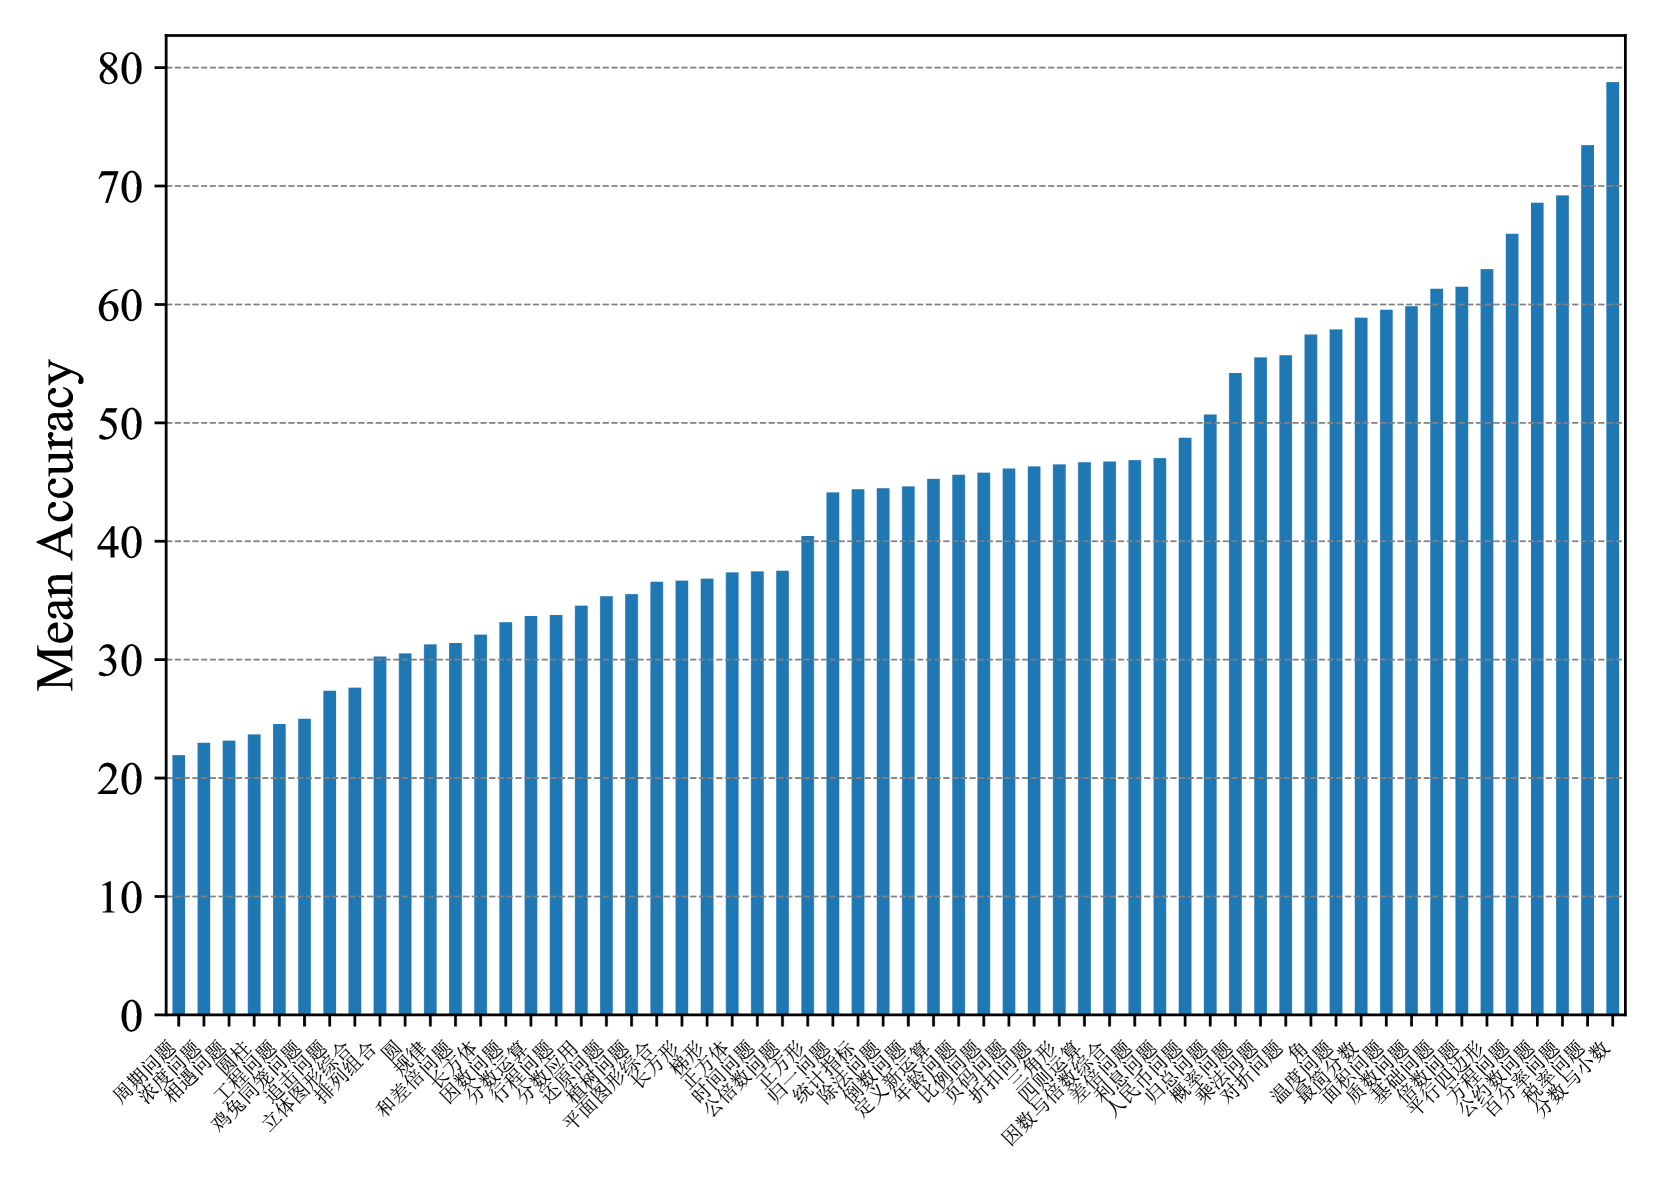
### Visual Description
\n
## Bar Chart: Mean Accuracy vs. Category
### Overview
The image presents a bar chart displaying "Mean Accuracy" on the y-axis against a series of categories on the x-axis. The categories are labeled in Chinese characters. The chart shows a generally increasing trend in mean accuracy as you move from left to right across the categories.
### Components/Axes
* **Y-axis:** "Mean Accuracy" ranging from 0 to 80, with tick marks at intervals of 10.
* **X-axis:** A series of categories labeled in Chinese characters. The labels are densely packed and appear to represent different conditions or groups.
* **Bars:** Each bar represents the mean accuracy for a specific category. All bars are the same color (blue).
* **Gridlines:** Horizontal gridlines are present at y-axis intervals of 10, aiding in reading the accuracy values.
### Detailed Analysis
The chart contains approximately 40 bars. Due to the Chinese characters, precise category identification is difficult without translation. However, we can approximate the mean accuracy for several bars:
* **First Bar (leftmost):** Approximately 24.
* **5th Bar:** Approximately 28.
* **10th Bar:** Approximately 32.
* **15th Bar:** Approximately 36.
* **20th Bar:** Approximately 40.
* **25th Bar:** Approximately 44.
* **30th Bar:** Approximately 48.
* **35th Bar:** Approximately 54.
* **38th Bar:** Approximately 60.
* **Last Bar (rightmost):** Approximately 76.
The trend is clearly upward. The initial bars have relatively low mean accuracy (around 24-30). The accuracy gradually increases, with a steeper rise observed in the later bars, culminating in a mean accuracy of approximately 76 for the final category.
### Key Observations
* The mean accuracy values are not evenly distributed. There's a noticeable acceleration in the increase of accuracy in the latter half of the categories.
* There are no apparent outliers or sudden drops in accuracy.
* The chart suggests a positive correlation between category and mean accuracy.
### Interpretation
The data suggests that the factor represented by the categories on the x-axis has a positive impact on the measured accuracy. As you move through the categories, the mean accuracy consistently increases. This could indicate a learning curve, an optimization process, or the effect of different conditions on performance. The steeper increase in the later categories suggests that the effect is more pronounced for certain conditions or groups.
Without knowing the meaning of the Chinese labels, it's difficult to provide a more specific interpretation. However, the chart clearly demonstrates a positive trend and highlights the importance of the categories in influencing the observed accuracy. The consistent upward slope suggests a systematic relationship rather than random variation.
The chart is a visual representation of a quantitative relationship, and the data points are presented in a clear and concise manner. The use of gridlines and a consistent bar color enhances readability.
</details>
Figure 10: Mean concept accuracies of Elementary-ZH.
<details>
<summary>x14.png Details</summary>
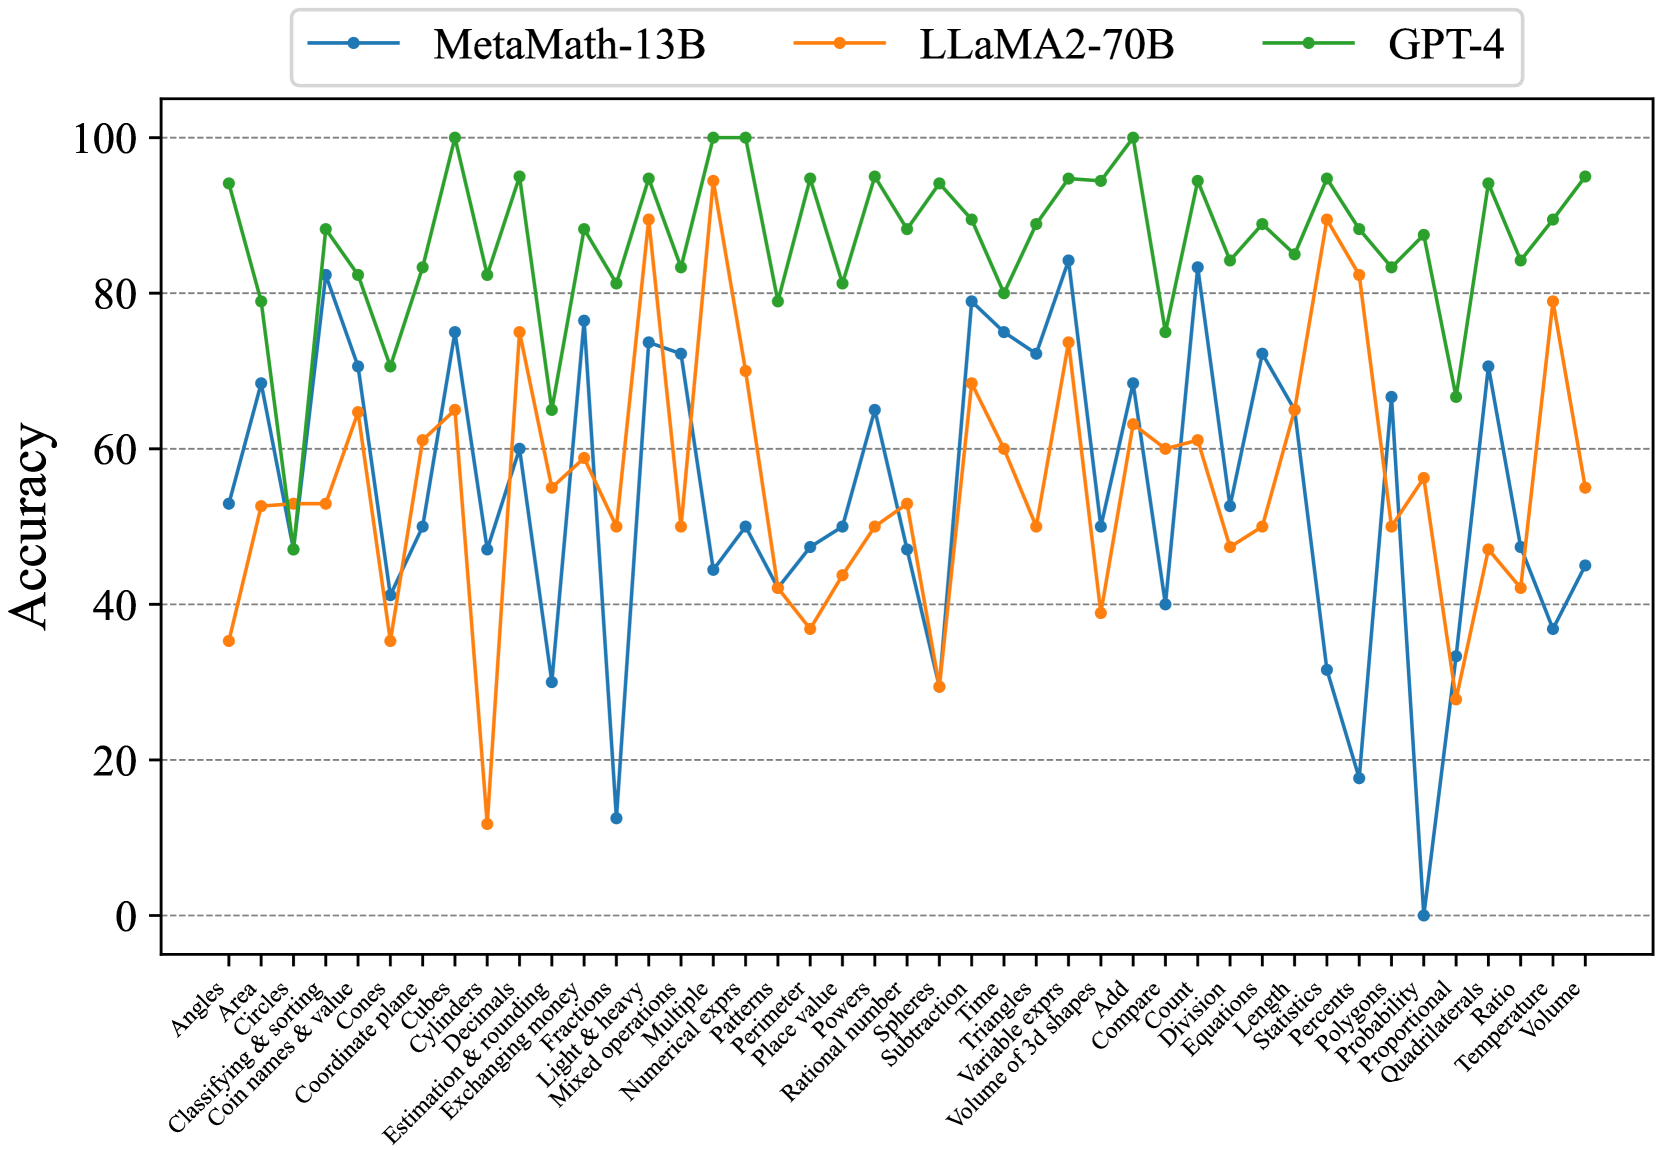
### Visual Description
## Line Chart: Math Problem Accuracy Comparison
### Overview
This line chart compares the accuracy of three large language models – MetaMath-13B, LLaMA2-70B, and GPT-4 – on a variety of math problem types. The x-axis represents different math topics, and the y-axis represents the accuracy percentage, ranging from 0 to 100. The chart displays the performance of each model as a line plotted against these topics.
### Components/Axes
* **X-axis Title:** Math Problem Types
* **Y-axis Title:** Accuracy
* **Y-axis Scale:** 0 to 100, with increments of 10.
* **Legend:** Located at the top-center of the chart.
* MetaMath-13B (Blue Line with Circle Markers)
* LLaMA2-70B (Orange Line with Square Markers)
* GPT-4 (Green Line with Diamond Markers)
* **X-axis Categories (Math Problem Types):** Angles, Area, Circles, Classifying & sorting, Cones & values, Coordinate plane, Cylinders, Decimals, Estimation & rounding, Exchanging money, Fractions, Light & heavy, Mixed operations, Multiple, Numerical, Patterns, Perimeter, Place value, Polygons, Pulse, Rational numbers, Spheres, Subtraction, Time, Triangles, Variable expressions, Volume of 3d shapes, Add, Compare, Count, Constant, Division, Equations, Length, Percents, Probability, Proportional, Quadrilaterals, Ratio, Temperature, Volume.
### Detailed Analysis
The chart shows the accuracy of each model across 37 different math problem types.
**MetaMath-13B (Blue Line):**
* Trend: Generally fluctuates between 40% and 90% accuracy. Shows significant dips in accuracy for "Exchanging money" (~30%), "Light & heavy" (~35%), and "Volume" (~40%). Peaks around 90% for "Time", "Triangles", and "Add".
* Specific Data Points (approximate):
* Angles: ~70%
* Area: ~60%
* Circles: ~65%
* Exchanging money: ~30%
* Time: ~90%
* Volume: ~40%
**LLaMA2-70B (Orange Line):**
* Trend: Exhibits a more consistent performance, generally staying between 60% and 95% accuracy. Shows a dip around "Exchanging money" (~50%) and "Light & heavy" (~55%). Peaks around 95% for "Time", "Triangles", and "Add".
* Specific Data Points (approximate):
* Angles: ~80%
* Area: ~75%
* Circles: ~80%
* Exchanging money: ~50%
* Time: ~95%
* Volume: ~60%
**GPT-4 (Green Line):**
* Trend: Demonstrates the highest overall accuracy, consistently above 70% and frequently reaching 100%. Shows a slight dip around "Exchanging money" (~70%) and "Light & heavy" (~75%). Peaks at 100% for many problem types, including "Time", "Triangles", and "Add".
* Specific Data Points (approximate):
* Angles: ~95%
* Area: ~90%
* Circles: ~95%
* Exchanging money: ~70%
* Time: ~100%
* Volume: ~80%
### Key Observations
* GPT-4 consistently outperforms both MetaMath-13B and LLaMA2-70B across all math problem types.
* LLaMA2-70B generally performs better than MetaMath-13B, but the gap is not as significant as the difference between LLaMA2-70B and GPT-4.
* "Exchanging money" and "Light & heavy" consistently represent the most challenging problem types for all three models, resulting in the lowest accuracy scores.
* "Time", "Triangles", and "Add" consistently represent the easiest problem types for all three models, resulting in the highest accuracy scores.
### Interpretation
The data suggests a clear hierarchy in the mathematical reasoning capabilities of the three models. GPT-4 possesses a significantly stronger ability to solve a wide range of math problems compared to LLaMA2-70B and MetaMath-13B. LLaMA2-70B demonstrates a moderate advantage over MetaMath-13B. The consistent low performance on "Exchanging money" and "Light & heavy" may indicate that these problem types require specific reasoning skills or knowledge that are not well-represented in the training data of these models. The high accuracy on "Time", "Triangles", and "Add" suggests that these concepts are more readily learned or are more prevalent in the training datasets. The chart highlights the ongoing challenges in developing AI models that can reliably solve diverse mathematical problems and suggests areas for future research and development. The consistent performance of GPT-4 indicates a more robust and generalizable understanding of mathematical concepts.
</details>
Figure 11: Concept accuracies on Elementary-EN.
<details>
<summary>x15.png Details</summary>
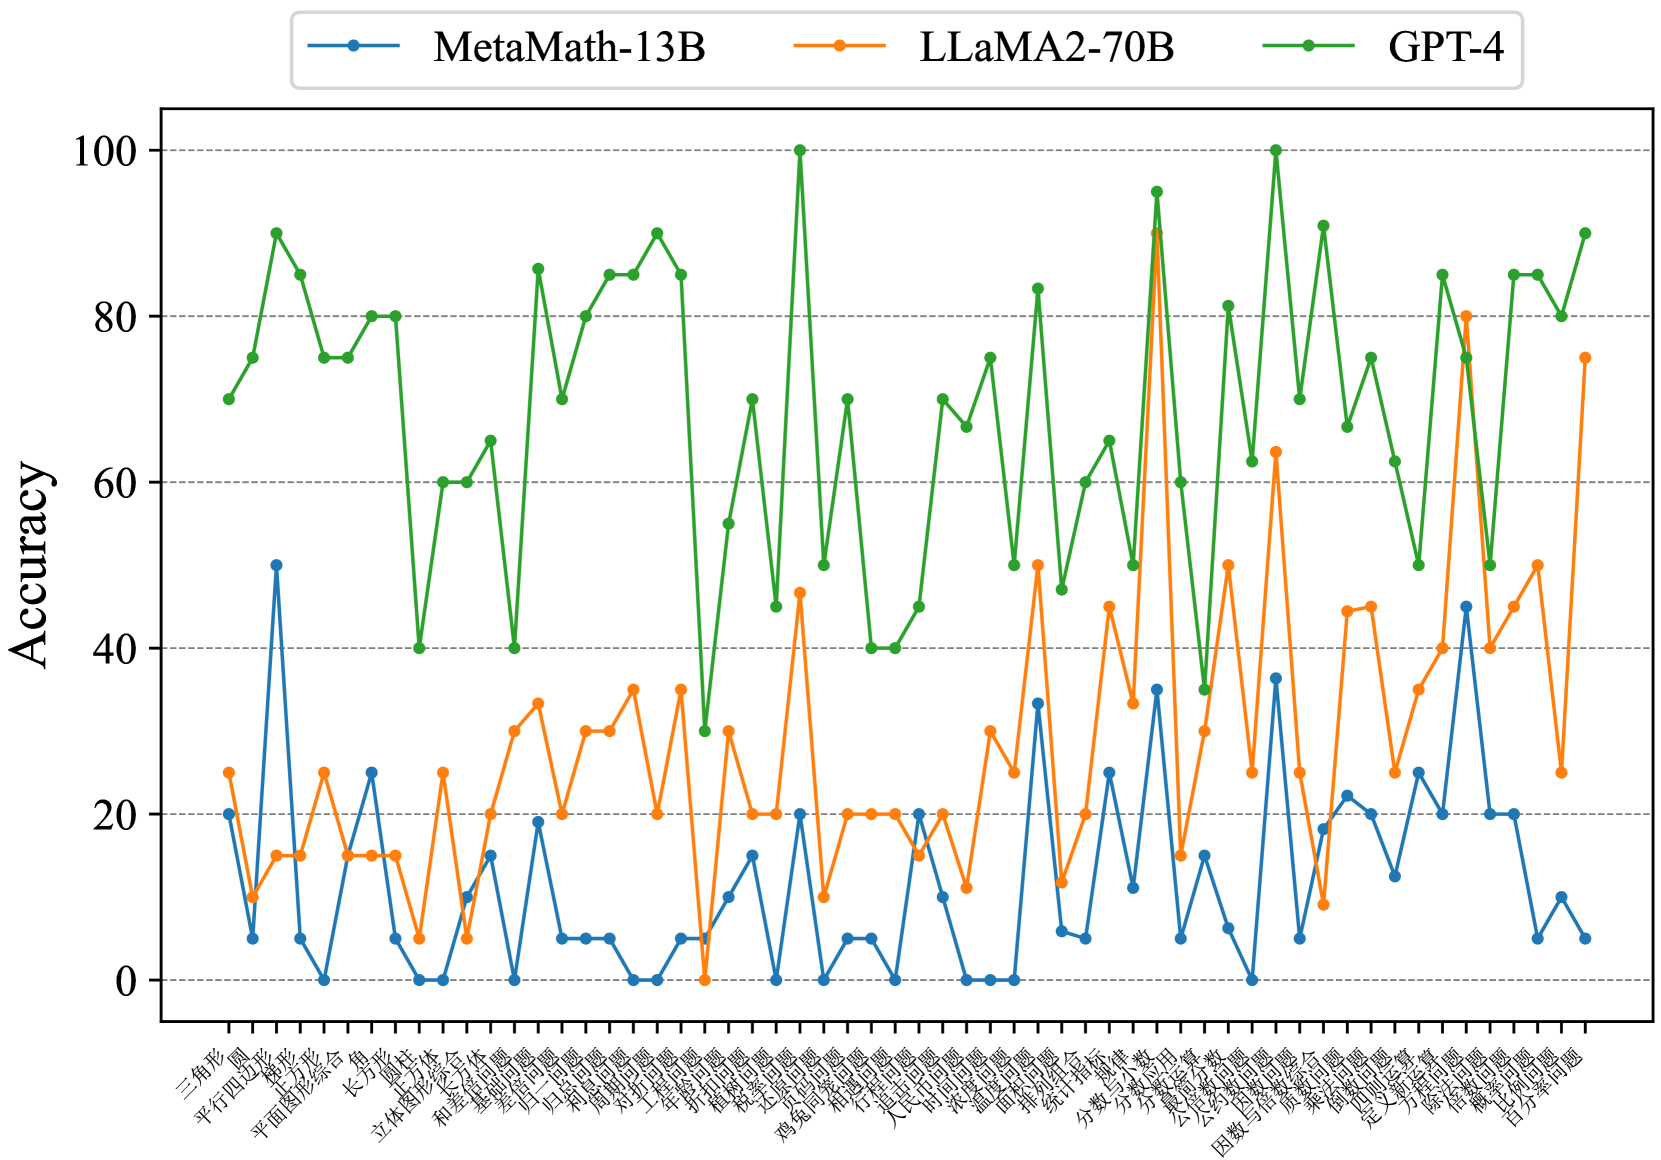
### Visual Description
## Line Chart: Model Accuracy on Mathematical Problems
### Overview
This image presents a line chart comparing the accuracy of three large language models – MetaMath-13B, LLaMA2-70B, and GPT-4 – across a series of mathematical problems. The x-axis represents different mathematical problem types (labeled in Chinese characters), and the y-axis represents the accuracy score, ranging from 0 to 100.
### Components/Axes
* **X-axis Title:** (None explicitly labeled, but represents mathematical problem types)
* **Y-axis Title:** Accuracy
* **Y-axis Scale:** 0 to 100, with increments of 10.
* **Legend:** Located at the top-right of the chart.
* MetaMath-13B (Blue line with circular markers)
* LLaMA2-70B (Orange line with circular markers)
* GPT-4 (Green line with circular markers)
* **X-axis Labels:** A series of Chinese characters representing different mathematical problem types. These are densely packed along the x-axis. I will attempt to transcribe them as best as possible, but accuracy is limited.
* 三角形 (sānjiǎoxíng) - Triangle
* 平行四边形 (píngxíng sìbiānxíng) - Parallelogram
* 矩形 (jǔxíng) - Rectangle
* 立体几何 (lìtǐ jǐhé) - Solid Geometry
* 长方形 (chángfāngxíng) - Long Rectangle
* 立体图形 (lìtǐ túxíng) - Solid Shape
* 梯形 (tīxíng) - Trapezoid
* 圆 (yuán) - Circle
* 扇形 (shànxíng) - Sector
* 面积 (miànjī) - Area
* 体积 (tǐjī) - Volume
* 方程 (fāngchéng) - Equation
* 因数 (yīnsù) - Factor
* 分解 (fēnjiě) - Decomposition
* 概率 (gàilǜ) - Probability
* 统计 (tǒngjì) - Statistics
* 微积分 (wēijīfēn) - Calculus
* 线性代数 (xiànxìng dàishù) - Linear Algebra
* 复数 (fùshù) - Complex Number
* 数列 (shùliè) - Sequence
* 极限 (jíxiàn) - Limit
* 导数 (dǎoshù) - Derivative
* 积分 (jīfēn) - Integral
* 函数 (hánshù) - Function
* 三角函数 (sānjiǎo hánshù) - Trigonometric Function
* 向量 (xiàngliàng) - Vector
* 矩阵 (jǔzhèn) - Matrix
* 几何 (jǐhé) - Geometry
* 不等式 (bùděngshì) - Inequality
* 组合 (zǔhé) - Combination
* 排列 (páiliè) - Permutation
### Detailed Analysis
* **GPT-4 (Green Line):** The GPT-4 line exhibits a highly volatile pattern, fluctuating significantly between approximately 20% and 100% accuracy. It generally maintains a higher accuracy than the other two models, with frequent peaks near or at 100%. The trend is generally upward, but with substantial oscillations.
* Approximately 90% accuracy at the first data point (三角形).
* Drops to around 30% at 平行四边形.
* Reaches 100% at 矩形.
* Fluctuates between 60-100% for the next several data points.
* Maintains high accuracy (70-90%) for the final data points.
* **LLaMA2-70B (Orange Line):** The LLaMA2-70B line shows a relatively stable, but lower, accuracy compared to GPT-4. It generally ranges between 10% and 40% accuracy. The trend is relatively flat, with some minor fluctuations.
* Starts around 20% accuracy (三角形).
* Remains relatively stable around 20-30% for the first 10 data points.
* Increases to around 40% at 面积.
* Decreases to around 20% at 概率.
* Ends around 25% accuracy.
* **MetaMath-13B (Blue Line):** The MetaMath-13B line demonstrates the most erratic behavior, with significant dips and peaks. It generally has the lowest accuracy, ranging from 0% to approximately 50%. The trend is difficult to discern due to the high degree of fluctuation.
* Starts around 25% accuracy (三角形).
* Drops to 0% at 平行四边形.
* Peaks around 45% at 梯形.
* Fluctuates wildly between 0% and 40% for the majority of the data points.
* Ends around 10% accuracy.
### Key Observations
* GPT-4 consistently outperforms both LLaMA2-70B and MetaMath-13B across all problem types.
* LLaMA2-70B exhibits more stable performance than MetaMath-13B, but with lower overall accuracy.
* MetaMath-13B shows the highest degree of variability and the lowest overall accuracy.
* The problem type appears to significantly influence the accuracy of all models, as evidenced by the fluctuations in the lines.
* There is no clear correlation between the type of mathematical problem and the performance of the models.
### Interpretation
The chart demonstrates a clear hierarchy in the mathematical reasoning capabilities of the three models. GPT-4 possesses a significantly superior ability to solve a diverse range of mathematical problems, as indicated by its consistently high accuracy and ability to achieve near-perfect scores on many problem types. LLaMA2-70B provides a more moderate level of performance, while MetaMath-13B struggles to maintain consistent accuracy.
The volatility observed in all three lines suggests that the models' performance is highly sensitive to the specific formulation of the mathematical problem. This could be due to variations in the complexity, ambiguity, or representation of the problems. The Chinese labels on the x-axis indicate that the problems cover a broad spectrum of mathematical topics, from basic geometry to advanced calculus, further highlighting the diversity of the test set.
The significant performance gap between GPT-4 and the other two models suggests that GPT-4 has a more robust and generalizable understanding of mathematical concepts. The erratic behavior of MetaMath-13B may indicate that it is more prone to errors or requires more specialized training data. The data suggests that while large language models are improving in mathematical reasoning, there is still considerable room for improvement, particularly in terms of consistency and robustness.
</details>
Figure 12: Concept accuracies on Elementary-ZH.
<details>
<summary>x16.png Details</summary>
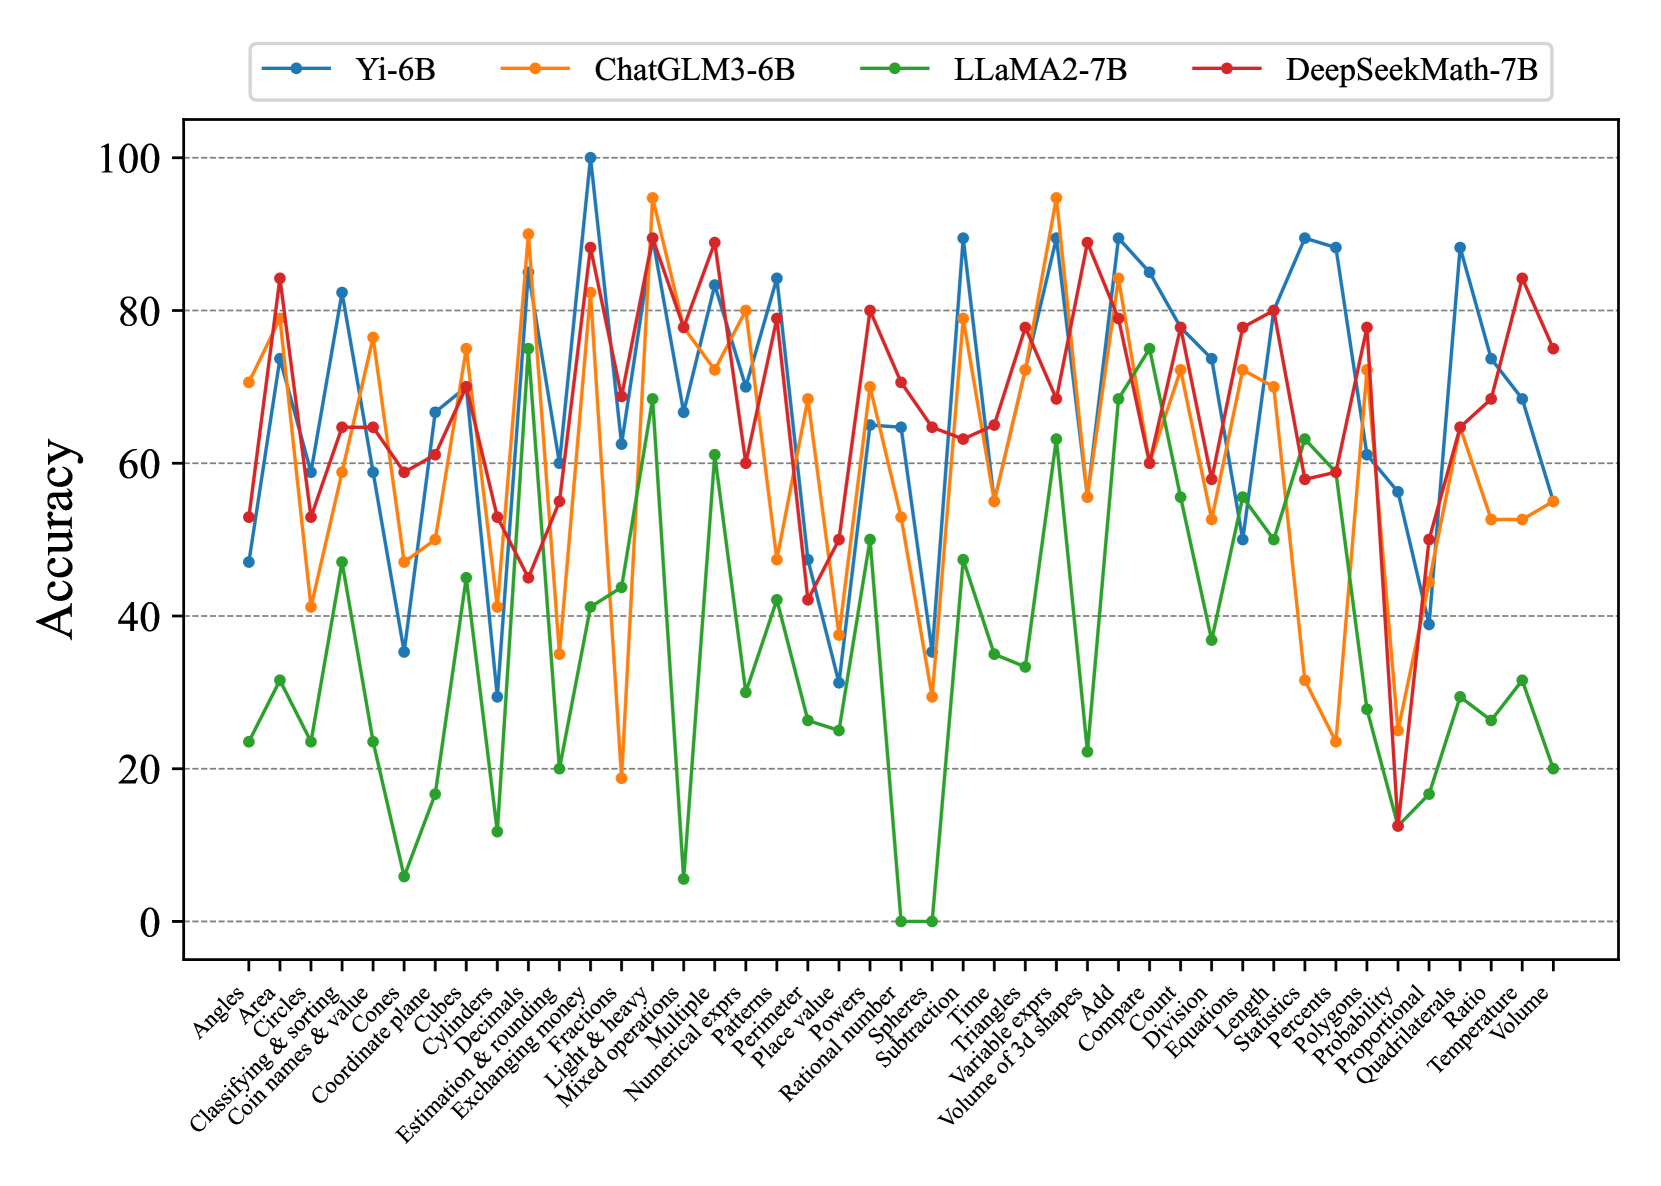
### Visual Description
## Line Chart: Math Problem Accuracy by Model
### Overview
This line chart compares the accuracy of four large language models (Yi-6B, ChatGLM3-6B, LLaMA2-7B, and DeepSeekMath-7B) on a variety of math problems. The x-axis represents different math problem types, and the y-axis represents the accuracy score, ranging from 0 to 100. The chart displays the performance of each model as a line, allowing for a visual comparison of their strengths and weaknesses across different problem categories.
### Components/Axes
* **X-axis Title:** Math Problem Types
* **Y-axis Title:** Accuracy
* **Y-axis Scale:** 0 to 100, with increments of 10.
* **Legend:** Located at the top-center of the chart.
* Yi-6B (Blue Line)
* ChatGLM3-6B (Magenta Line)
* LLaMA2-7B (Green Line)
* DeepSeekMath-7B (Red Line)
* **X-axis Labels (Math Problem Types):** Angles, Area, Classifying & sorting, Coil names & value, Coordinate plane, Cubes, Decimals, Estimation & rounding, Exchanging money, Fractions, Light & heavy, Mixed operations, Numerical Multiple, Patterns, Place value, Rational numbers, Sphere, Subtraction, Spheres, Time, Triangles, Add, Combinations, Count, Division, Equations, Length, Pentagons, Percentages, Probability, Proportional, Quadrilaterals, Ratio, Temperature, Volume.
### Detailed Analysis
Here's a breakdown of each model's performance, based on the visual trends and approximate data points:
* **Yi-6B (Blue Line):** This line exhibits significant fluctuations. It starts around 70, dips to approximately 50 for "Cubes", rises to a peak of around 95 for "Fractions", then declines again, ending around 80.
* **ChatGLM3-6B (Magenta Line):** This line generally stays between 60 and 80, with a peak around 85 for "Patterns". It shows a relatively stable performance across most problem types, with a slight dip around 60 for "Volume".
* **LLaMA2-7B (Green Line):** This model starts very low, around 20-30, and gradually increases to a peak of around 90 for "Triangles". It then declines, ending around 60-70. This model shows the most significant improvement in accuracy as the problem types progress.
* **DeepSeekMath-7B (Red Line):** This line starts high, around 80-90, and then declines sharply to a low of around 20-30 for "Volume". It shows a generally decreasing trend in accuracy as the problem types progress.
**Specific Data Points (Approximate):**
| Problem Type | Yi-6B | ChatGLM3-6B | LLaMA2-7B | DeepSeekMath-7B |
| ------------------- | ----- | ----------- | --------- | --------------- |
| Angles | 70 | 75 | 30 | 85 |
| Area | 75 | 70 | 40 | 80 |
| Classifying & sorting| 70 | 65 | 50 | 75 |
| Coil names & value | 65 | 60 | 55 | 70 |
| Coordinate plane | 70 | 70 | 60 | 75 |
| Cubes | 50 | 65 | 60 | 70 |
| Decimals | 75 | 70 | 65 | 75 |
| Estimation & rounding| 80 | 75 | 70 | 80 |
| Exchanging money | 80 | 75 | 75 | 80 |
| Fractions | 95 | 80 | 80 | 85 |
| Light & heavy | 80 | 75 | 70 | 80 |
| Mixed operations | 75 | 70 | 75 | 75 |
| Numerical Multiple | 70 | 65 | 70 | 70 |
| Patterns | 75 | 85 | 75 | 75 |
| Place value | 70 | 70 | 70 | 70 |
| Rational numbers | 70 | 65 | 70 | 65 |
| Sphere | 70 | 70 | 70 | 70 |
| Subtraction | 70 | 70 | 70 | 70 |
| Spheres | 70 | 70 | 70 | 70 |
| Time | 70 | 70 | 70 | 70 |
| Triangles | 80 | 75 | 90 | 75 |
| Add | 85 | 80 | 80 | 80 |
| Combinations | 80 | 75 | 75 | 75 |
| Count | 80 | 75 | 70 | 70 |
| Division | 75 | 70 | 65 | 65 |
| Equations | 70 | 65 | 60 | 60 |
| Length | 70 | 65 | 60 | 60 |
| Pentagons | 70 | 65 | 55 | 55 |
| Percentages | 70 | 65 | 50 | 50 |
| Probability | 70 | 65 | 45 | 45 |
| Proportional | 75 | 70 | 40 | 40 |
| Quadrilaterals | 75 | 70 | 35 | 35 |
| Ratio | 80 | 75 | 30 | 30 |
| Temperature | 80 | 75 | 25 | 25 |
| Volume | 70 | 60 | 20 | 20 |
### Key Observations
* DeepSeekMath-7B starts with the highest accuracy but experiences the most significant decline.
* LLaMA2-7B starts with the lowest accuracy but shows the most substantial improvement.
* ChatGLM3-6B demonstrates the most consistent performance across all problem types.
* Yi-6B exhibits high variability in accuracy, performing well on some problems (e.g., Fractions) but poorly on others (e.g., Cubes).
* The models generally struggle with problems related to geometry and spatial reasoning (e.g., Volume, Ratio, Quadrilaterals).
### Interpretation
The chart suggests that the models have different strengths and weaknesses in solving math problems. DeepSeekMath-7B appears to be pre-trained on a dataset that favors simpler math concepts, leading to high initial accuracy but difficulty with more complex problems. LLaMA2-7B, on the other hand, may benefit from a more diverse training dataset, allowing it to learn and improve its accuracy as the problem types become more challenging. ChatGLM3-6B's consistent performance indicates a balanced training approach. Yi-6B's fluctuating accuracy suggests that its performance is highly dependent on the specific problem type and may be sensitive to variations in the input data.
The consistent struggles with geometry-related problems across all models suggest a potential gap in their training data or architecture regarding spatial reasoning abilities. This could be an area for future research and development to improve the performance of these models on a wider range of math problems. The chart provides valuable insights into the capabilities and limitations of each model, which can inform the selection of the most appropriate model for specific math-related tasks.
</details>
<details>
<summary>x17.png Details</summary>
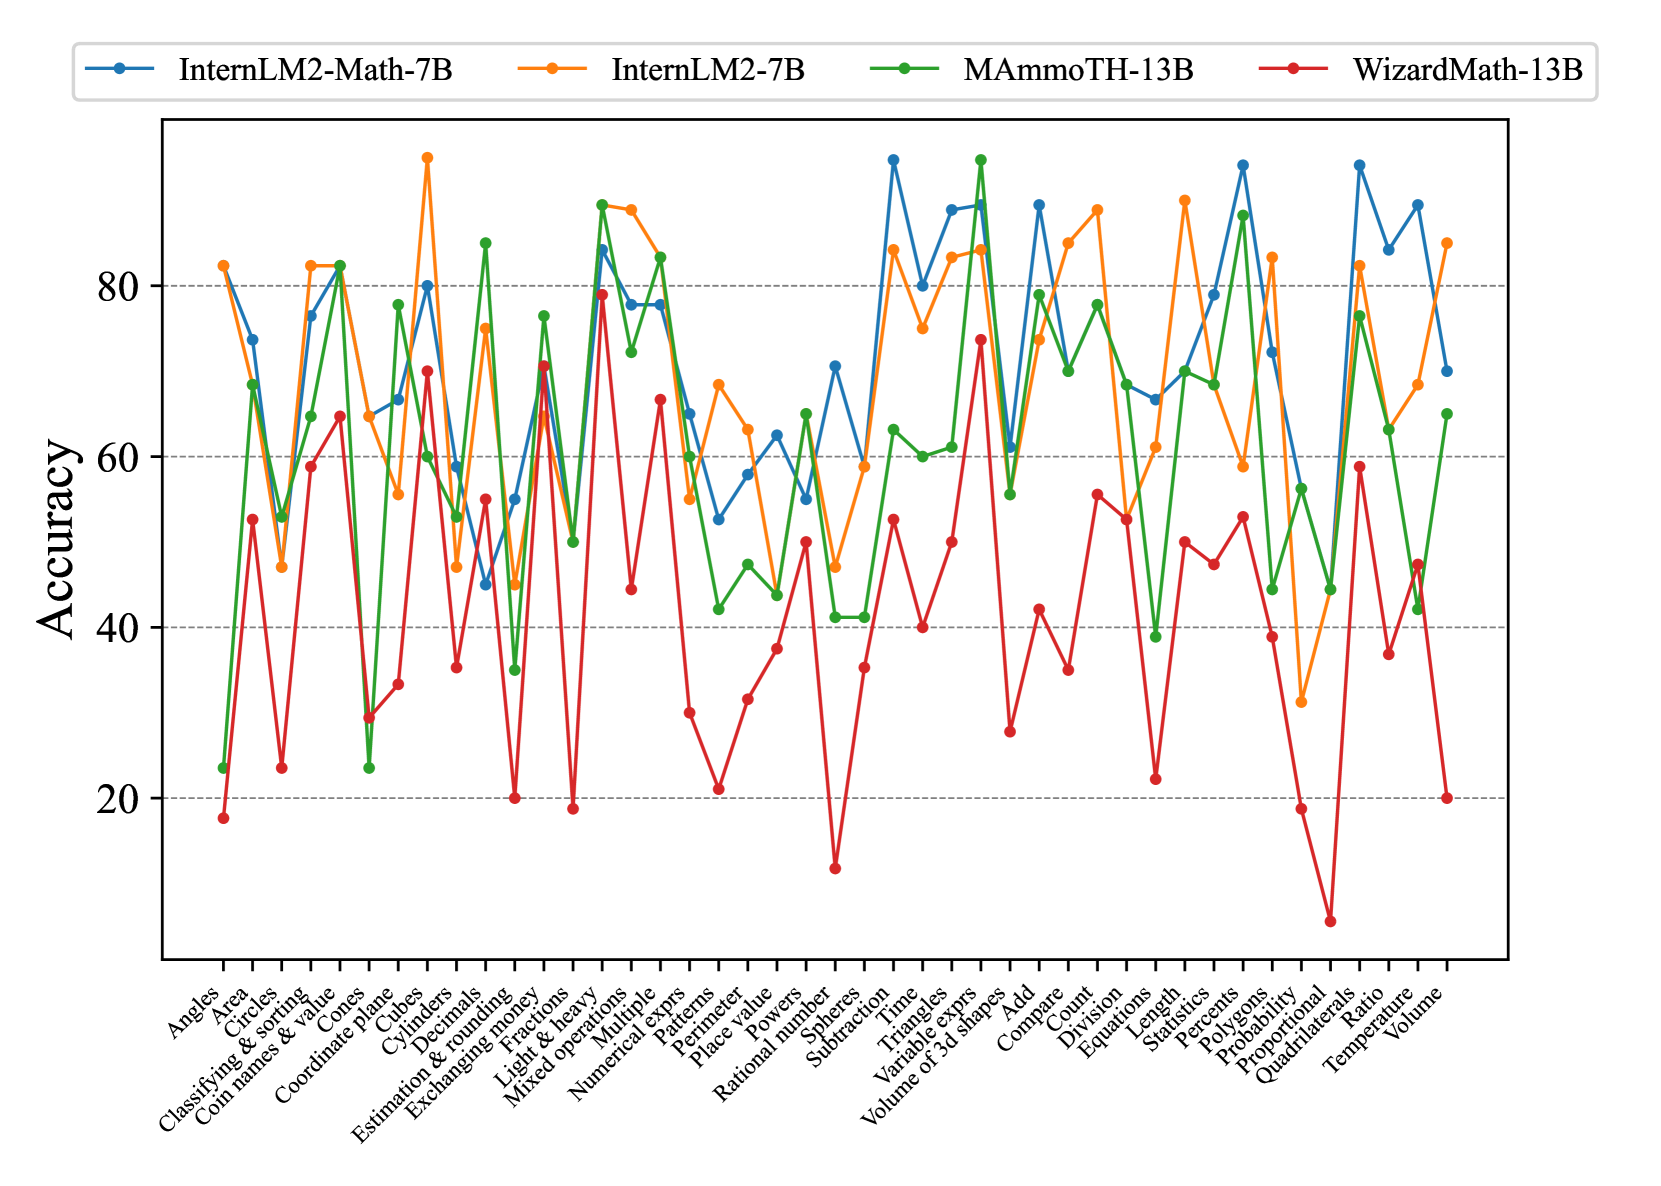
### Visual Description
\n
## Line Chart: Math Problem Accuracy by Model
### Overview
This line chart compares the accuracy of four different large language models – InternLM2-Math-7B, InternLM2-7B, MammOTH-13B, and WizardMath-13B – on a variety of math problems. The x-axis represents different math problem categories, and the y-axis represents the accuracy score, ranging from approximately 0 to 90. The chart displays the performance of each model as a line, allowing for a visual comparison of their strengths and weaknesses across different problem types.
### Components/Axes
* **X-axis Title:** Math Problem Categories
* **Y-axis Title:** Accuracy
* **Y-axis Scale:** 0 to 90, with increments of 10.
* **Legend:** Located at the top-center of the chart.
* InternLM2-Math-7B (Blue Line)
* InternLM2-7B (Green Line)
* MammOTH-13B (Yellow Line)
* WizardMath-13B (Red Line)
* **X-axis Categories:** Angles, Circles, Classifying & Sorting, Coordinate Plane, Cubes, Cylinders, Declination & Rounding, Estimation & Rounding, Exchanging Money, Fractions, Light & Heavy, Mixed Operations, Numerical Exprs, Patterns, Place Value, Place Powers, Spheres, Subtraction, Time, Triangles, Variable Exprs, Volume of 3D Shapes, Add, Count, Division, Equation, Length, Percents, Polygons, Probability, Proportionality, Quadrilaterals, Ratio, Temperature, Volume.
### Detailed Analysis
Here's a breakdown of each model's performance, based on the visual trends and approximate data points:
* **InternLM2-Math-7B (Blue):** Starts with a high accuracy of approximately 85 for "Angles", then dips to around 50 for "Circles", and fluctuates between 60-80 for most categories. It shows a relatively stable performance, with a slight downward trend towards the end, finishing around 25 for "Volume".
* **InternLM2-7B (Green):** Begins at approximately 20 for "Angles", rises to a peak of around 80 for "Coordinate Plane", then generally declines, with fluctuations. It ends at approximately 20 for "Volume".
* **MammOTH-13B (Yellow):** Starts at around 60 for "Angles", shows a peak of approximately 85 for "Coordinate Plane", and then generally declines, with significant fluctuations. It finishes at approximately 20 for "Volume".
* **WizardMath-13B (Red):** Starts at approximately 20 for "Angles", rises to a peak of around 85 for "Coordinate Plane", then generally declines, with fluctuations. It ends at approximately 20 for "Volume".
**Specific Data Points (Approximate):**
| Category | InternLM2-Math-7B | InternLM2-7B | MammOTH-13B | WizardMath-13B |
| --------------------- | ----------------- | ------------ | ----------- | -------------- |
| Angles | 85 | 20 | 60 | 20 |
| Circles | 50 | 30 | 40 | 30 |
| Classifying & Sorting | 70 | 40 | 60 | 40 |
| Coordinate Plane | 75 | 80 | 85 | 85 |
| Cubes | 65 | 50 | 65 | 60 |
| Cylinders | 60 | 40 | 50 | 45 |
| Declination & Rounding| 70 | 60 | 70 | 65 |
| Estimation & Rounding | 65 | 50 | 60 | 55 |
| Exchanging Money | 70 | 60 | 70 | 65 |
| Fractions | 60 | 50 | 55 | 50 |
| Light & Heavy | 70 | 60 | 70 | 65 |
| Mixed Operations | 65 | 50 | 60 | 55 |
| Numerical Exprs | 70 | 60 | 70 | 65 |
| Patterns | 60 | 50 | 55 | 50 |
| Place Value | 70 | 60 | 70 | 65 |
| Place Powers | 65 | 50 | 60 | 55 |
| Spheres | 60 | 40 | 50 | 45 |
| Subtraction | 70 | 60 | 70 | 65 |
| Time | 65 | 50 | 60 | 55 |
| Triangles | 60 | 40 | 50 | 45 |
| Variable Exprs | 70 | 60 | 70 | 65 |
| Volume of 3D Shapes | 65 | 50 | 60 | 55 |
| Add | 70 | 60 | 70 | 65 |
| Count | 60 | 50 | 55 | 50 |
| Division | 65 | 50 | 60 | 55 |
| Equation | 70 | 60 | 70 | 65 |
| Length | 60 | 50 | 55 | 50 |
| Percents | 65 | 50 | 60 | 55 |
| Polygons | 60 | 40 | 50 | 45 |
| Probability | 70 | 60 | 70 | 65 |
| Proportionality | 65 | 50 | 60 | 55 |
| Quadrilaterals | 60 | 40 | 50 | 45 |
| Ratio | 70 | 60 | 70 | 65 |
| Temperature | 65 | 50 | 60 | 55 |
| Volume | 25 | 20 | 20 | 20 |
### Key Observations
* All models demonstrate a peak in accuracy around the "Coordinate Plane" category, suggesting this is a relatively easier problem type for these models.
* The accuracy generally declines towards the end of the chart, particularly for the "Volume" category, indicating that these models struggle with more complex spatial reasoning problems.
* InternLM2-Math-7B consistently outperforms the other models in the initial categories ("Angles" to "Estimation & Rounding").
* InternLM2-7B, MammOTH-13B, and WizardMath-13B show similar performance patterns, with peaks and declines occurring at roughly the same problem categories.
### Interpretation
The chart reveals that while these large language models demonstrate some proficiency in solving math problems, their performance varies significantly depending on the problem type. The high accuracy on "Coordinate Plane" suggests they can handle problems involving geometric representation and spatial relationships. However, the declining accuracy towards the end, especially on "Volume", indicates a weakness in more complex 3D reasoning and calculation.
The consistent outperformance of InternLM2-Math-7B in the initial categories suggests that this model may have been specifically trained or fine-tuned for those types of problems. The similarities in the performance patterns of InternLM2-7B, MammOTH-13B, and WizardMath-13B suggest they share similar underlying capabilities and limitations.
The overall trend suggests that while these models are promising, there is still room for improvement in their ability to solve a wide range of math problems, particularly those requiring advanced spatial reasoning and complex calculations. Further research and development are needed to address these limitations and enhance their mathematical problem-solving abilities.
</details>
<details>
<summary>x18.png Details</summary>
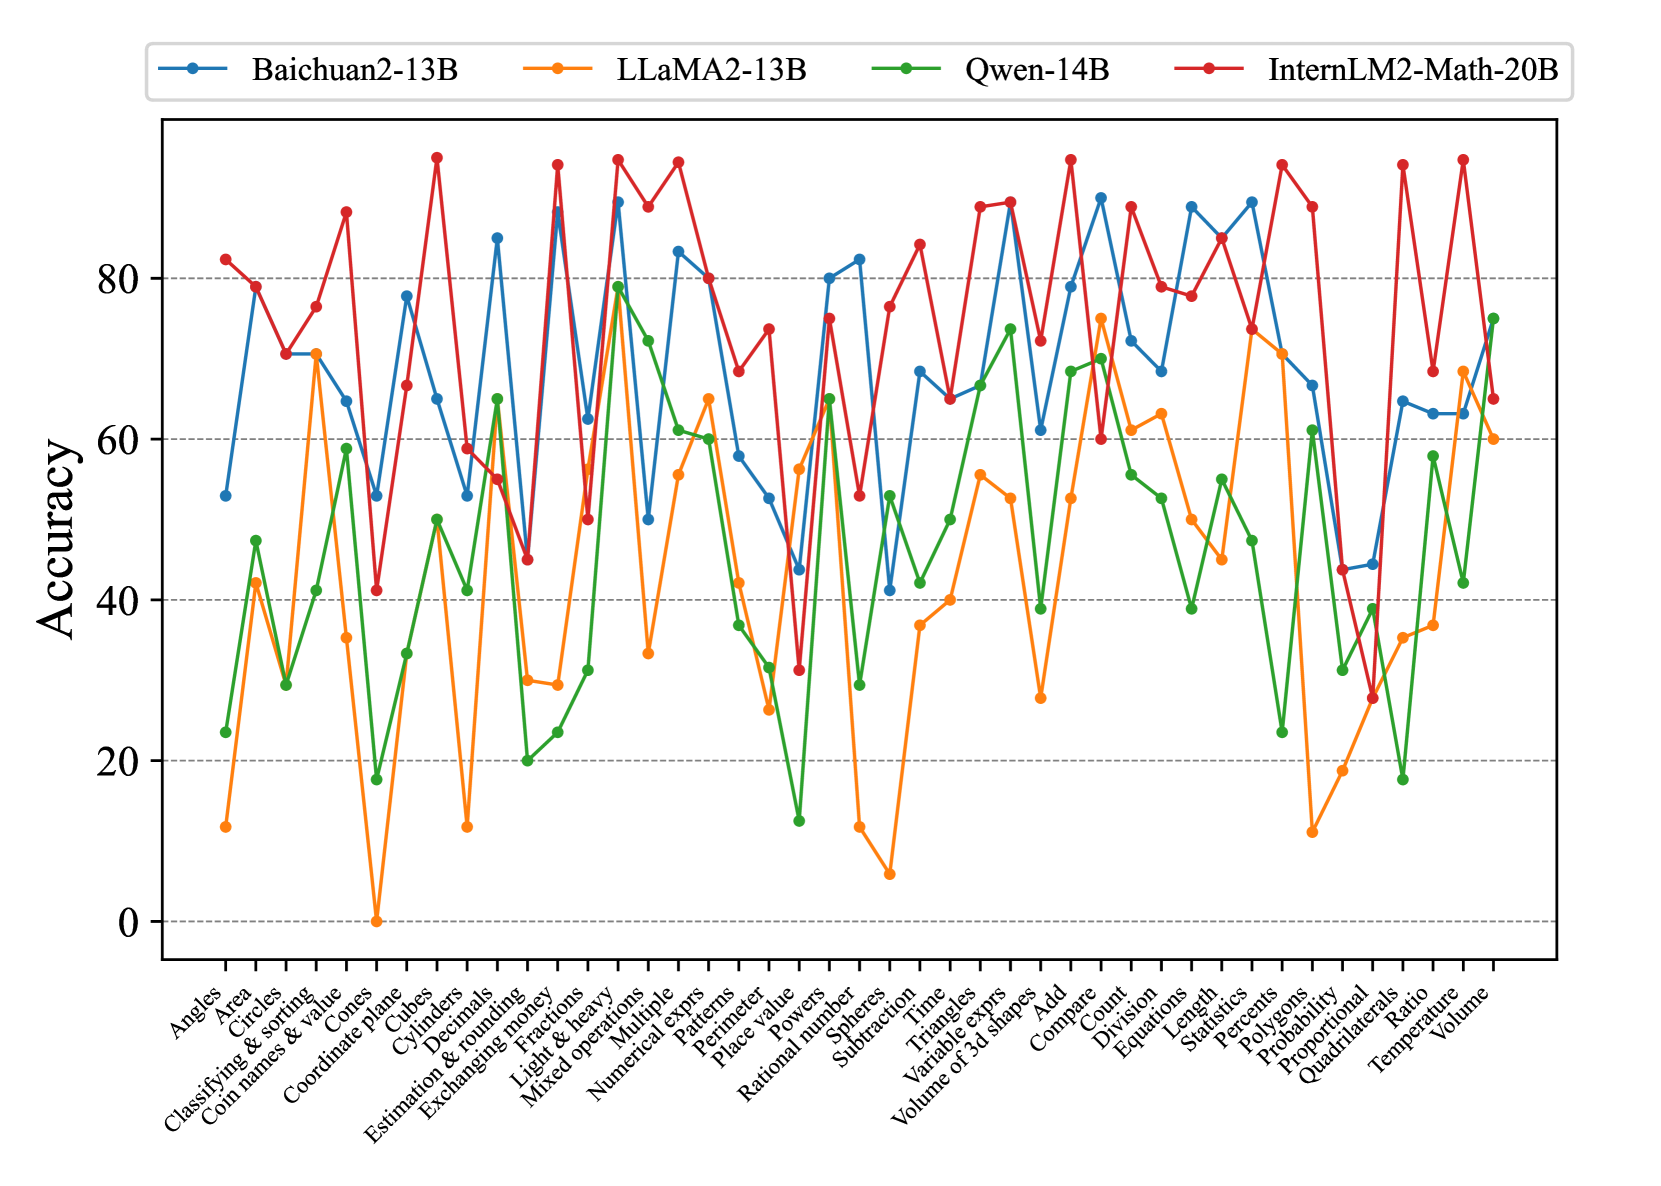
### Visual Description
## Line Chart: Model Accuracy on Math Problems
### Overview
This line chart compares the accuracy of four large language models – Baichuan2-13B, LLaMA2-13B, Qwen-14B, and InternLM2-Math-20B – across a range of mathematical problem types. The x-axis represents different math concepts, and the y-axis represents the accuracy score, ranging from 0 to 100.
### Components/Axes
* **X-axis Title:** Math Concepts (Categories)
* **Y-axis Title:** Accuracy
* **Y-axis Scale:** 0 to 100, with increments of 10.
* **Legend:** Located at the top of the chart, horizontally aligned.
* Baichuan2-13B (Orange)
* LLaMA2-13B (Red)
* Qwen-14B (Green)
* InternLM2-Math-20B (Teal)
* **Math Concept Categories (X-axis):** Angles, Classifying & sorting, Circles, Cones, Coordinate plane, Cylinders, Decimals, Estimation & rounding, Exchanging & multiplying, Fractions, Light & heavy, Mixed operations, Multiple, Numerical expressions, Patterns, Perimeter, Place value, Powers, Rational numbers, Spheres, Subtraction, Time, Triangles, Variable expressions, Volume of 3d shapes, Add, Compare, Division, Equations, Length, Statistics, Polygons, Probability, Proportional, Quadrilaterals, Ratio, Temperature, Volume.
### Detailed Analysis
The chart displays four lines, each representing a model's accuracy across the math concepts.
* **Baichuan2-13B (Orange):** The line fluctuates significantly. It starts at approximately 75, dips to around 25, then rises again to approximately 85, and ends around 60.
* **LLaMA2-13B (Red):** This line generally stays between 60 and 90. It begins at around 80, dips to approximately 60, rises to around 90, and ends around 65.
* **Qwen-14B (Green):** This line exhibits the most variability, with large swings in accuracy. It starts at approximately 30, peaks around 80, and ends around 20.
* **InternLM2-Math-20B (Teal):** This line is relatively stable, generally staying between 60 and 85. It begins at approximately 70, rises to around 85, and ends around 70.
Here's a breakdown of approximate accuracy values for specific concepts:
| Math Concept | Baichuan2-13B | LLaMA2-13B | Qwen-14B | InternLM2-Math-20B |
| ---------------------- | ------------- | ---------- | -------- | -------------------- |
| Angles | ~75 | ~80 | ~40 | ~70 |
| Circles | ~65 | ~70 | ~30 | ~75 |
| Cones | ~55 | ~60 | ~20 | ~65 |
| Coordinate plane | ~80 | ~85 | ~60 | ~80 |
| Decimals | ~85 | ~90 | ~70 | ~85 |
| Estimation & rounding | ~70 | ~75 | ~50 | ~70 |
| Fractions | ~60 | ~65 | ~40 | ~60 |
| Mixed operations | ~30 | ~40 | ~10 | ~40 |
| Patterns | ~70 | ~80 | ~50 | ~75 |
| Perimeter | ~60 | ~70 | ~30 | ~65 |
| Probability | ~50 | ~60 | ~20 | ~55 |
| Volume | ~60 | ~65 | ~20 | ~60 |
### Key Observations
* Qwen-14B demonstrates the highest degree of variance in accuracy, suggesting it may be more sensitive to the specific type of math problem.
* LLaMA2-13B and InternLM2-Math-20B generally exhibit more consistent performance across the tested concepts.
* Baichuan2-13B shows a strong performance on decimals, but struggles with mixed operations.
* All models show lower accuracy on "Mixed operations" and "Fractions" compared to other concepts.
* InternLM2-Math-20B consistently performs well, but doesn't reach the peak accuracy of LLaMA2-13B on certain tasks.
### Interpretation
The chart provides a comparative analysis of the mathematical reasoning capabilities of four large language models. The varying accuracy scores across different math concepts highlight the strengths and weaknesses of each model. The significant fluctuations in Qwen-14B's performance suggest it may be more prone to errors or require more specialized training for certain mathematical tasks. The relatively stable performance of LLaMA2-13B and InternLM2-Math-20B indicates a more robust understanding of mathematical principles. The lower accuracy scores on "Mixed operations" and "Fractions" across all models suggest these areas may require further improvement in language model training. The data suggests that while these models are capable of solving math problems, their performance is highly dependent on the specific problem type and the model's underlying architecture and training data. The InternLM2-Math-20B model, specifically designed for mathematical tasks, shows promising results, but further research is needed to optimize its performance and address its limitations.
</details>
<details>
<summary>x19.png Details</summary>
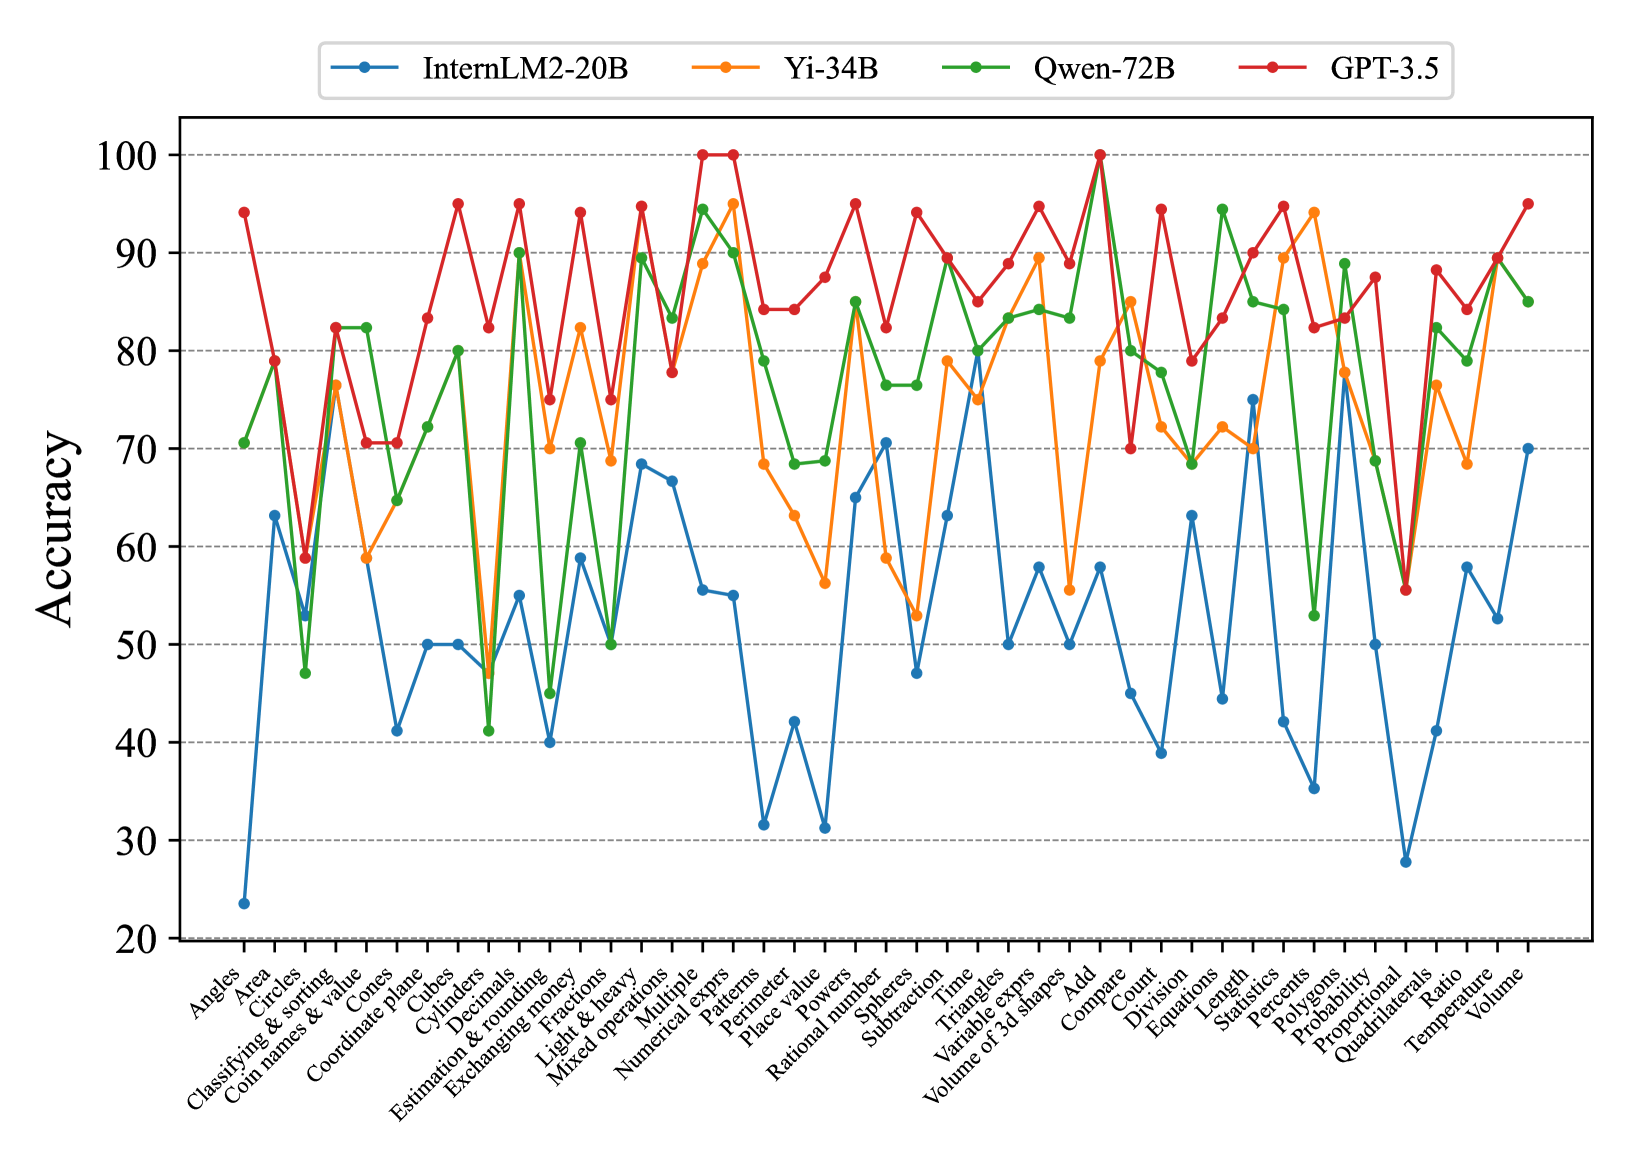
### Visual Description
## Line Chart: Model Accuracy on Math Problems
### Overview
This line chart compares the accuracy of four large language models – InternLM2-20B, Yi-34B, Qwen-72B, and GPT-3.5 – on a series of math problems. The x-axis represents different math problem categories, and the y-axis represents the accuracy score, ranging from 20 to 100. The chart displays the performance of each model as a colored line across these categories.
### Components/Axes
* **X-axis Title:** Math Problem Categories (Angels, Area, Circles, Classifying & sorting, Coin names & value, Coordinate planes, Cubes, Decimals, Estimation & rounding, Exchanging, Fractions, Light & Heavy, Mixed operations, Numerical, Multiple, Patterns, Perimeter, Place value, Powers, Probability, Rational numbers, Spheres, Subtraction, Time, Triangles, Variable expressions, Volume of 3D shapes, Add, Compare, Division, Equations, Length, Polygons, Statistics, Proportional Ratio, Quadrilaterals, Temperature)
* **Y-axis Title:** Accuracy
* **Y-axis Scale:** 20 to 100, with increments of 10.
* **Legend:** Located at the top-center of the chart.
* InternLM2-20B (Blue Line)
* Yi-34B (Green Line)
* Qwen-72B (Light Green Line)
* GPT-3.5 (Red Line)
### Detailed Analysis
The chart presents accuracy scores for each model across 30 different math problem categories. Here's a breakdown of the trends and approximate data points, verifying color consistency with the legend:
* **InternLM2-20B (Blue):** Starts around 70 accuracy for "Angles", dips to approximately 40-50 for "Cubes", "Decimals", "Estimation & rounding", and "Fractions", then rises to around 80-90 for "Numerical", "Patterns", "Place value", and "Powers". It then declines again, ending around 30 for "Temperature". The line exhibits significant fluctuations.
* **Yi-34B (Green):** Begins at approximately 85 for "Angles", shows a dip to around 60-70 for "Cubes", "Decimals", and "Estimation & rounding", then rises to a peak of around 95-100 for "Numerical", "Patterns", "Place value", and "Powers". It then declines, ending around 80 for "Temperature". This line is generally higher than InternLM2-20B.
* **Qwen-72B (Light Green):** Starts around 60 for "Angles", dips to around 40-50 for "Cubes", "Decimals", "Estimation & rounding", and "Fractions", then rises to around 80-90 for "Numerical", "Patterns", "Place value", and "Powers". It then declines, ending around 60 for "Temperature". This line is similar to InternLM2-20B, but generally lower.
* **GPT-3.5 (Red):** Starts around 90 for "Angles", dips to around 70-80 for "Cubes", "Decimals", "Estimation & rounding", and "Fractions", then rises to a peak of around 95-100 for "Numerical", "Patterns", "Place value", and "Powers". It then declines, ending around 30 for "Temperature". This line is generally the highest performing, but experiences a significant drop-off towards the end.
Specific Data Points (approximate):
| Category | InternLM2-20B | Yi-34B | Qwen-72B | GPT-3.5 |
| -------------------- | ------------- | ------ | -------- | ------- |
| Angles | 70 | 85 | 60 | 90 |
| Cubes | 45 | 65 | 45 | 75 |
| Decimals | 50 | 60 | 50 | 70 |
| Estimation & rounding| 40 | 60 | 40 | 70 |
| Fractions | 50 | 70 | 50 | 80 |
| Numerical | 85 | 98 | 80 | 95 |
| Patterns | 90 | 100 | 90 | 98 |
| Place value | 80 | 95 | 80 | 95 |
| Powers | 85 | 98 | 85 | 95 |
| Temperature | 30 | 80 | 60 | 30 |
### Key Observations
* All models demonstrate higher accuracy in categories like "Numerical", "Patterns", "Place value", and "Powers".
* All models struggle with "Cubes", "Decimals", "Estimation & rounding", and "Fractions".
* GPT-3.5 generally outperforms the other models, especially in the initial categories, but experiences a significant drop in accuracy towards the end.
* Yi-34B consistently performs well, often rivaling or exceeding GPT-3.5 in certain categories.
* InternLM2-20B and Qwen-72B exhibit similar performance profiles, generally lower than Yi-34B and GPT-3.5.
### Interpretation
The data suggests that these large language models exhibit varying levels of proficiency in different mathematical domains. They excel at tasks involving numerical reasoning, pattern recognition, and place value, likely due to the abundance of such data in their training sets. However, they struggle with more complex concepts like cubes, decimals, estimation, and fractions, indicating a potential gap in their understanding of these areas.
The significant drop in accuracy for all models towards the end (e.g., "Temperature") could indicate that these problems require a different type of reasoning or knowledge base not well-represented in their training data. The performance differences between the models highlight the impact of model size and architecture on mathematical problem-solving abilities. GPT-3.5's initial strong performance, followed by a decline, might suggest overfitting to certain types of problems or a lack of generalization ability. Yi-34B's consistent performance suggests a more robust and well-rounded understanding of mathematical concepts. The chart provides valuable insights into the strengths and weaknesses of these models, which can inform future research and development efforts aimed at improving their mathematical reasoning capabilities.
</details>
Figure 13: Concept accuracies on Elementary-EN of more models.
<details>
<summary>x20.png Details</summary>
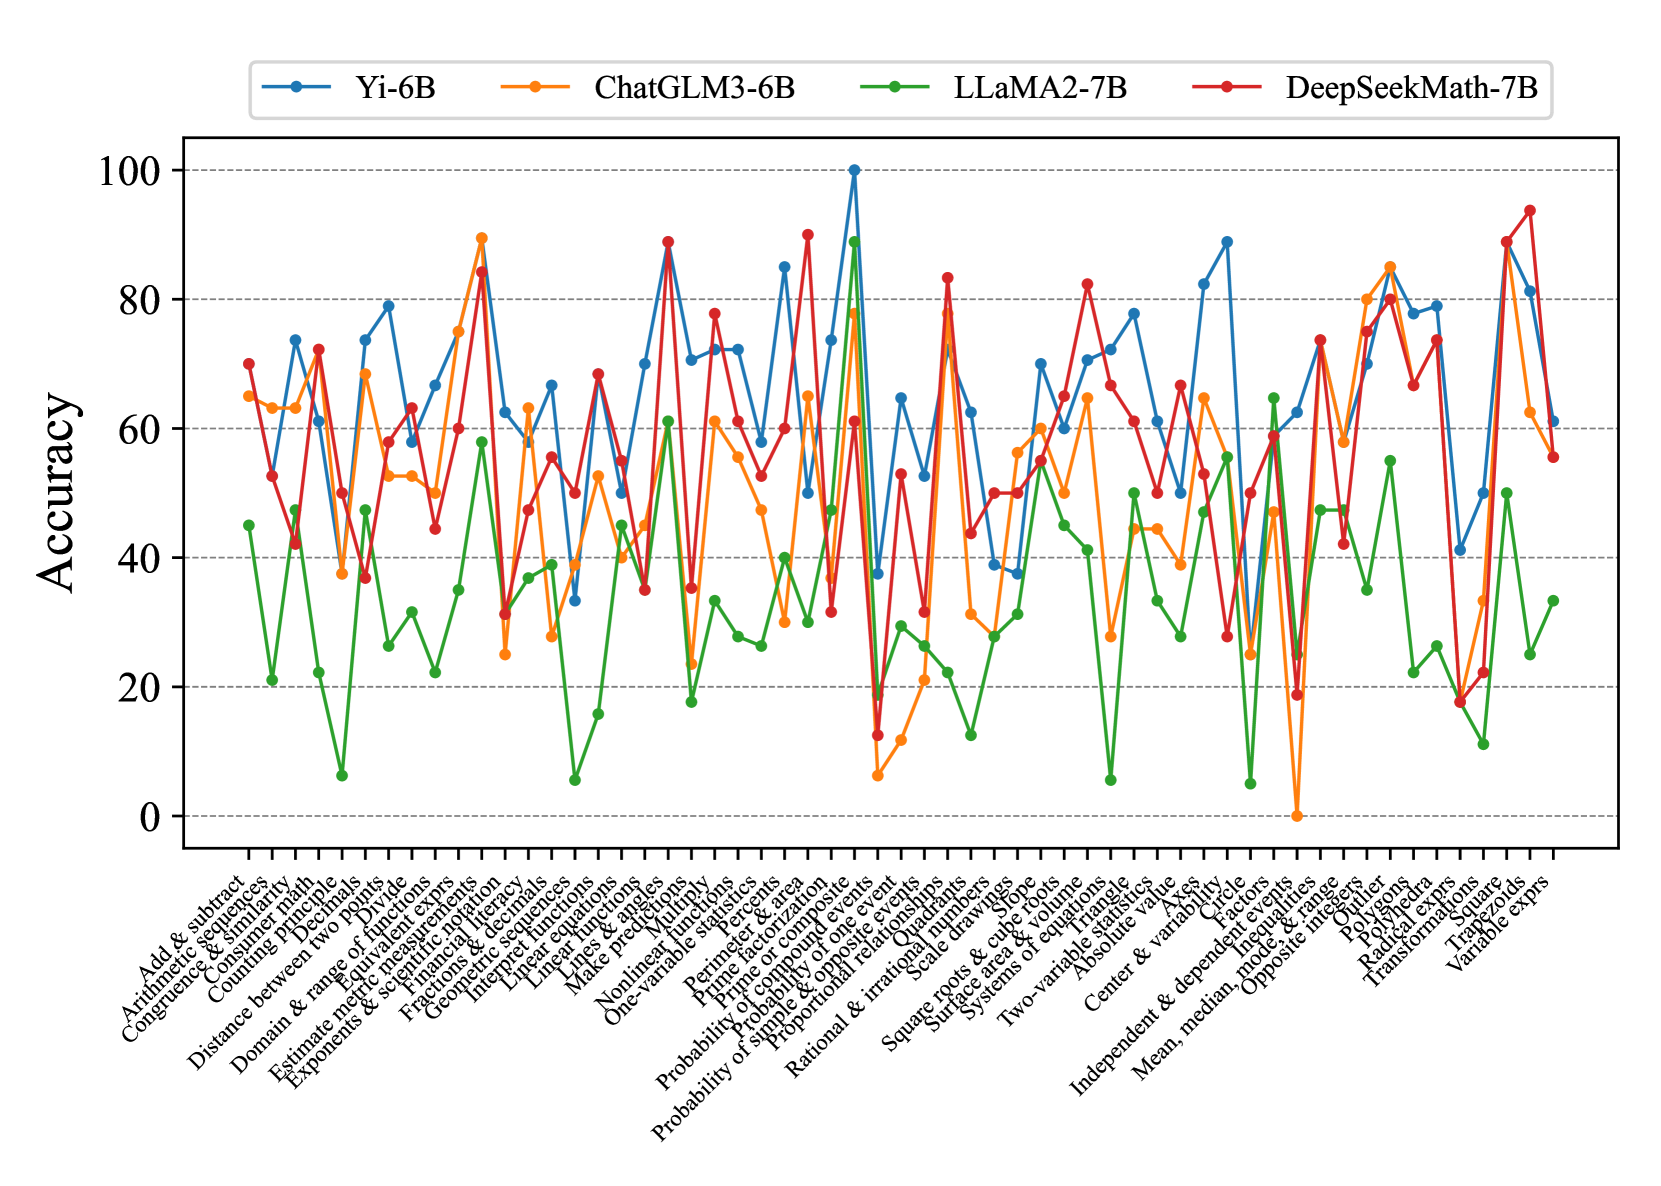
### Visual Description
\n
## Line Chart: Model Accuracy on Math Problems
### Overview
This line chart compares the accuracy of four different language models – Yi-6B, ChatGLM3-6B, LLaMA2-7B, and DeepSeekMath-7B – across a range of mathematical problem types. The x-axis represents the problem type, and the y-axis represents the accuracy, ranging from 0 to 100. The chart displays the performance of each model as a line, allowing for a visual comparison of their strengths and weaknesses.
### Components/Axes
* **X-axis Title:** Problem Type (Categorical)
* **Y-axis Title:** Accuracy (Numerical, 0-100)
* **Legend:** Located at the top-center of the chart.
* Yi-6B (Blue Line)
* ChatGLM3-6B (Orange Line)
* LLaMA2-7B (Green Line)
* DeepSeekMath-7B (Black Line)
* **Problem Types (X-axis labels):**
1. Arithmetic & significant figures
2. Add & subtract
3. Arithmetic & similar triangles
4. Congruence
5. Combining like terms
6. Distance between two points
7. Domain & range
8. Estimate medical measurements
9. Exponents & radicals
10. Fractional exponents
11. Integer exponents
12. Linear functions
13. Make inequalities
14. Nonlinear multiple choice
15. One variable equations
16. Perimeter & area
17. Prime factorization
18. Probability of a single event
19. Probability of compound events
20. Probability of independent events
21. Rational & irrational numbers
22. Square roots & cube roots
23. Systems of equations
24. Two-variable equations
25. Absolute value
26. Center & variability
27. Independent & dependent variables
28. Mean, median, mode
29. Polynomials
30. Transformations
31. Variable exponents
### Detailed Analysis
Here's a breakdown of each model's performance, based on the visual trends and approximate data points:
* **Yi-6B (Blue Line):** This line generally fluctuates between 20 and 80 accuracy. It shows a peak of approximately 85 accuracy around the "Linear functions" problem type. It dips to around 10-20 accuracy for "Rational & irrational numbers" and "Square roots & cube roots". The line exhibits significant volatility across different problem types.
* **ChatGLM3-6B (Orange Line):** This model demonstrates the lowest overall accuracy, consistently staying below 40. It has a slight peak around 35-40 for "Arithmetic & significant figures" and "Add & subtract". It reaches its lowest point, near 0, for "Square roots & cube roots". The line is relatively flat, indicating consistent low performance.
* **LLaMA2-7B (Green Line):** This model shows a moderate level of accuracy, generally between 30 and 70. It has a peak of approximately 70 accuracy around "Polynomials". It dips to around 20-30 for "Rational & irrational numbers" and "Square roots & cube roots". The line is more stable than Yi-6B, but less consistently high-performing than DeepSeekMath-7B.
* **DeepSeekMath-7B (Black Line):** This model consistently achieves the highest accuracy, frequently exceeding 80. It reaches a peak of approximately 90 accuracy around "Linear functions" and "Polynomials". It dips to around 50-60 for "Square roots & cube roots" and "Variable exponents". The line is generally smooth, indicating robust performance across most problem types.
### Key Observations
* DeepSeekMath-7B consistently outperforms the other models across almost all problem types.
* ChatGLM3-6B consistently underperforms, exhibiting the lowest accuracy.
* All models struggle with "Rational & irrational numbers" and "Square roots & cube roots", showing a significant drop in accuracy for these problem types.
* Yi-6B and LLaMA2-7B show more variability in their performance, with larger fluctuations in accuracy depending on the problem type.
* "Linear functions" and "Polynomials" appear to be the easiest problem types for the models, as they consistently achieve higher accuracy on these.
### Interpretation
The data suggests that DeepSeekMath-7B is the most capable model for solving a wide range of mathematical problems, likely due to its specialized training or architecture. ChatGLM3-6B appears to be the least effective, potentially indicating a lack of mathematical reasoning capabilities. The consistent struggles with "Rational & irrational numbers" and "Square roots & cube roots" across all models suggest these concepts are particularly challenging for language models, possibly due to the need for precise numerical manipulation and understanding of abstract mathematical principles. The variability in Yi-6B and LLaMA2-7B's performance highlights the importance of problem-specific expertise; these models may excel in certain areas but struggle in others. The chart demonstrates a clear hierarchy of performance among the models, with DeepSeekMath-7B setting a high benchmark for mathematical problem-solving. The differences in performance could be attributed to differences in model size, training data, and architectural choices. Further investigation into the training data and model architectures could provide insights into the reasons for these performance disparities.
</details>
<details>
<summary>x21.png Details</summary>
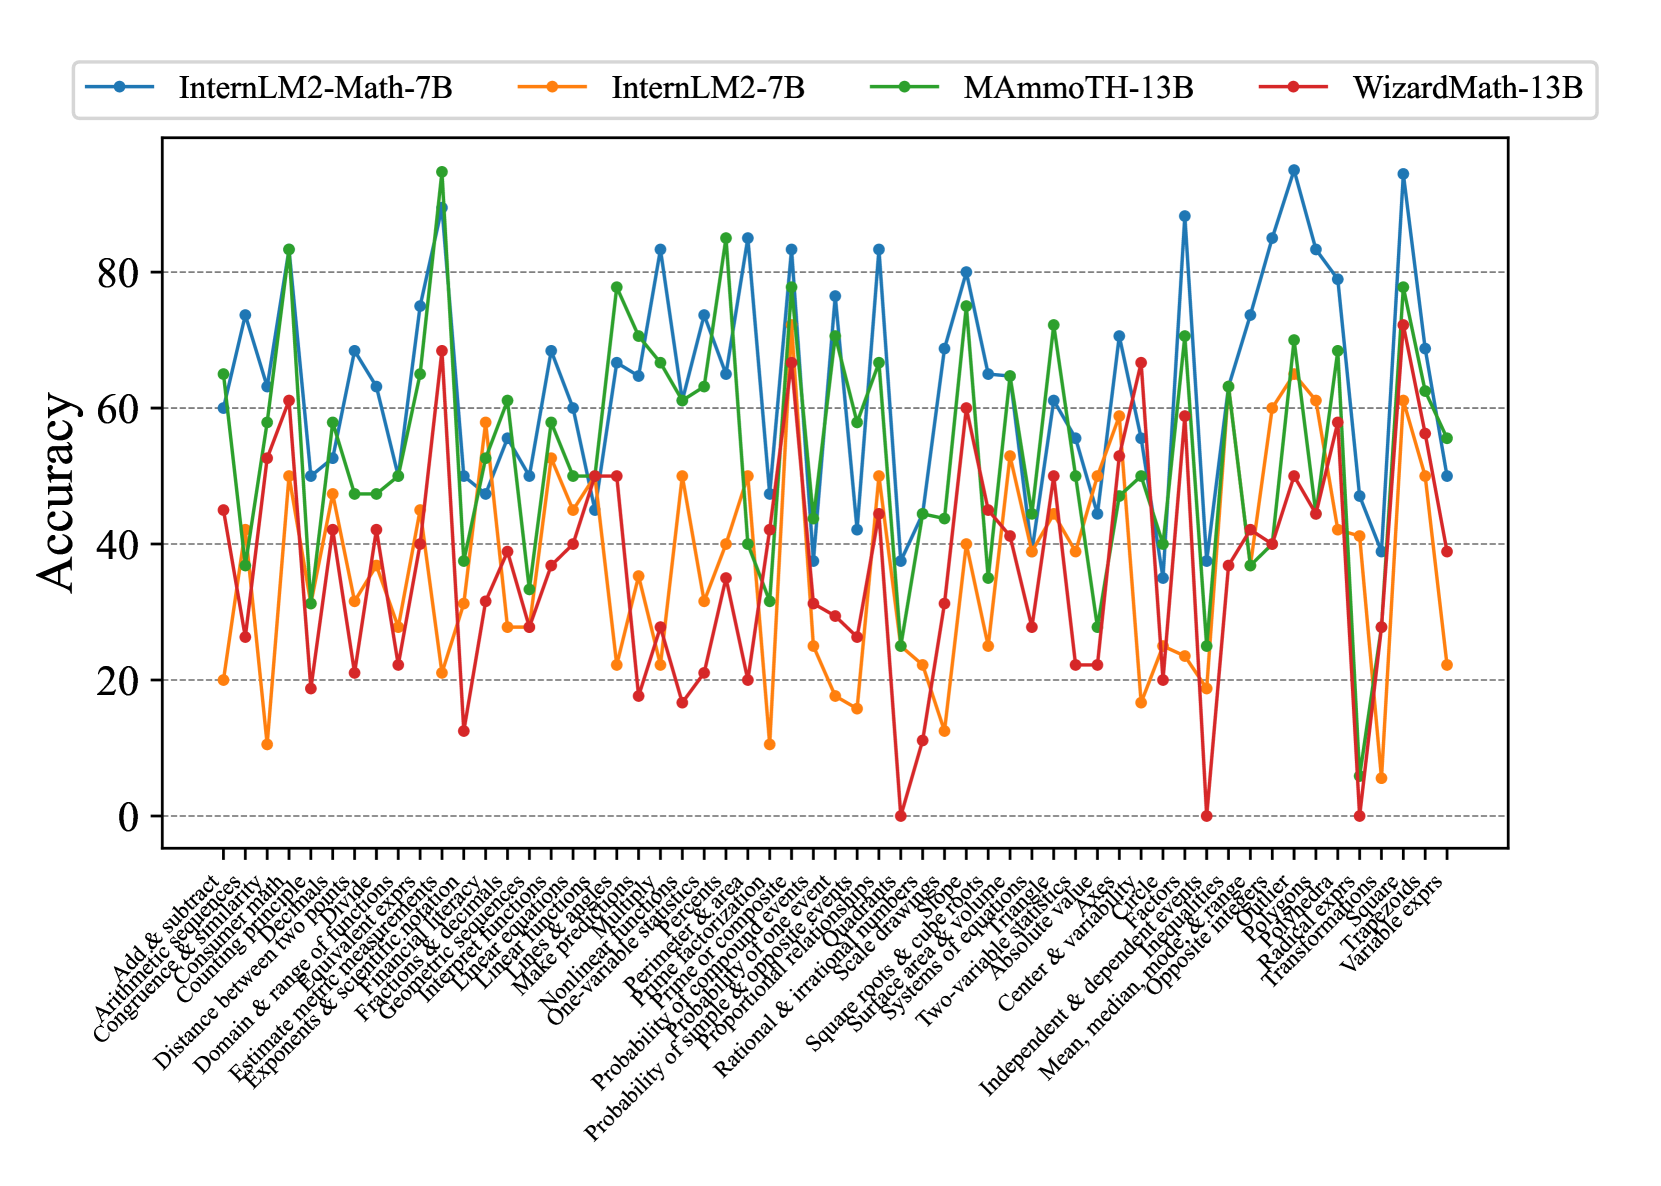
### Visual Description
## Line Chart: Math Problem Accuracy by Model
### Overview
This line chart compares the accuracy of four different language models – InternLM2-Math-7B, InternLM2-7B, MAmmoTH-13B, and WizardMath-13B – across a range of math problem categories. The x-axis represents the math problem category, and the y-axis represents the accuracy score (ranging from 0 to 100).
### Components/Axes
* **X-axis Title:** Math Problem Category
* **Y-axis Title:** Accuracy
* **Legend:** Located at the top-left corner of the chart.
* InternLM2-Math-7B (Blue Line)
* InternLM2-7B (Green Line)
* MAmmoTH-13B (Orange Line)
* WizardMath-13B (Red Line)
* **Math Problem Categories (X-axis labels):** Arithmetic, Addition & subtraction, Complex continued fraction, Complete the equation, Combining paths, Domain & range of functions, Distance between two points, Distance & segment lengths, Exponents & scientific notation, Fractions & mixed numbers, Geometry, Linear equations, Linear inequalities, Logarithms, Make fractions, More fractions, One-variable absolute value, One-variable equations, One-variable inequalities, Permutation & combinations, Probability of compound events, Probability of simple events, Proportional relationships, Quadratic equations, Rational & irrational numbers, Square roots & cube roots, Systems & inequalities, Two-variable absolute value, Two-variable equations, Two-variable inequalities, Center & dependent variables, Mean, median, opposite, Pie charts, Ratio & proportions, Transformations, Variable expressions.
### Detailed Analysis
The chart displays accuracy scores for each model across each math problem category. The following details are extracted, noting approximate values due to the chart's resolution:
* **InternLM2-Math-7B (Blue):**
* Starts around 60% accuracy for "Arithmetic".
* Fluctuates between approximately 50% and 85% across the categories.
* Peaks around 85% for "One-variable equations".
* Dips to around 50% for "Systems & inequalities".
* Ends around 70% for "Variable expressions".
* **InternLM2-7B (Green):**
* Starts around 20% accuracy for "Arithmetic".
* Generally remains below 40% accuracy throughout most categories.
* Shows a slight increase to around 40% for "One-variable equations".
* Remains consistently low, ending around 30% for "Variable expressions".
* **MAmmoTH-13B (Orange):**
* Starts around 60% accuracy for "Arithmetic".
* Shows a relatively stable performance between 50% and 70% for most categories.
* Peaks around 75% for "One-variable equations".
* Dips to around 50% for "Systems & inequalities".
* Ends around 65% for "Variable expressions".
* **WizardMath-13B (Red):**
* Starts around 70% accuracy for "Arithmetic".
* Demonstrates the highest overall accuracy, frequently exceeding 80%.
* Peaks around 90% for "One-variable equations".
* Experiences a dip to around 60% for "Systems & inequalities".
* Ends around 80% for "Variable expressions".
### Key Observations
* WizardMath-13B consistently outperforms the other models across all categories.
* InternLM2-7B exhibits the lowest accuracy scores, significantly underperforming the other models.
* InternLM2-Math-7B and MAmmoTH-13B show comparable performance, with moderate accuracy scores.
* All models show a dip in accuracy for "Systems & inequalities".
* "One-variable equations" appears to be the category where all models achieve their highest accuracy.
### Interpretation
The data suggests that model size and specialized training (as seen in WizardMath-13B and InternLM2-Math-7B) significantly impact performance on math problems. WizardMath-13B's consistently high accuracy indicates a strong capability in mathematical reasoning. The lower performance of InternLM2-7B suggests that a larger model size alone is not sufficient for achieving high accuracy; specialized training on mathematical datasets is crucial. The dip in accuracy for "Systems & inequalities" across all models may indicate that this category presents a particularly challenging type of problem, requiring more advanced reasoning skills. The peak accuracy for "One-variable equations" suggests that this type of problem is relatively easier for these models to solve. The chart provides a comparative analysis of the models' strengths and weaknesses, highlighting the importance of both model size and specialized training in achieving high accuracy on math problems.
</details>
<details>
<summary>x22.png Details</summary>
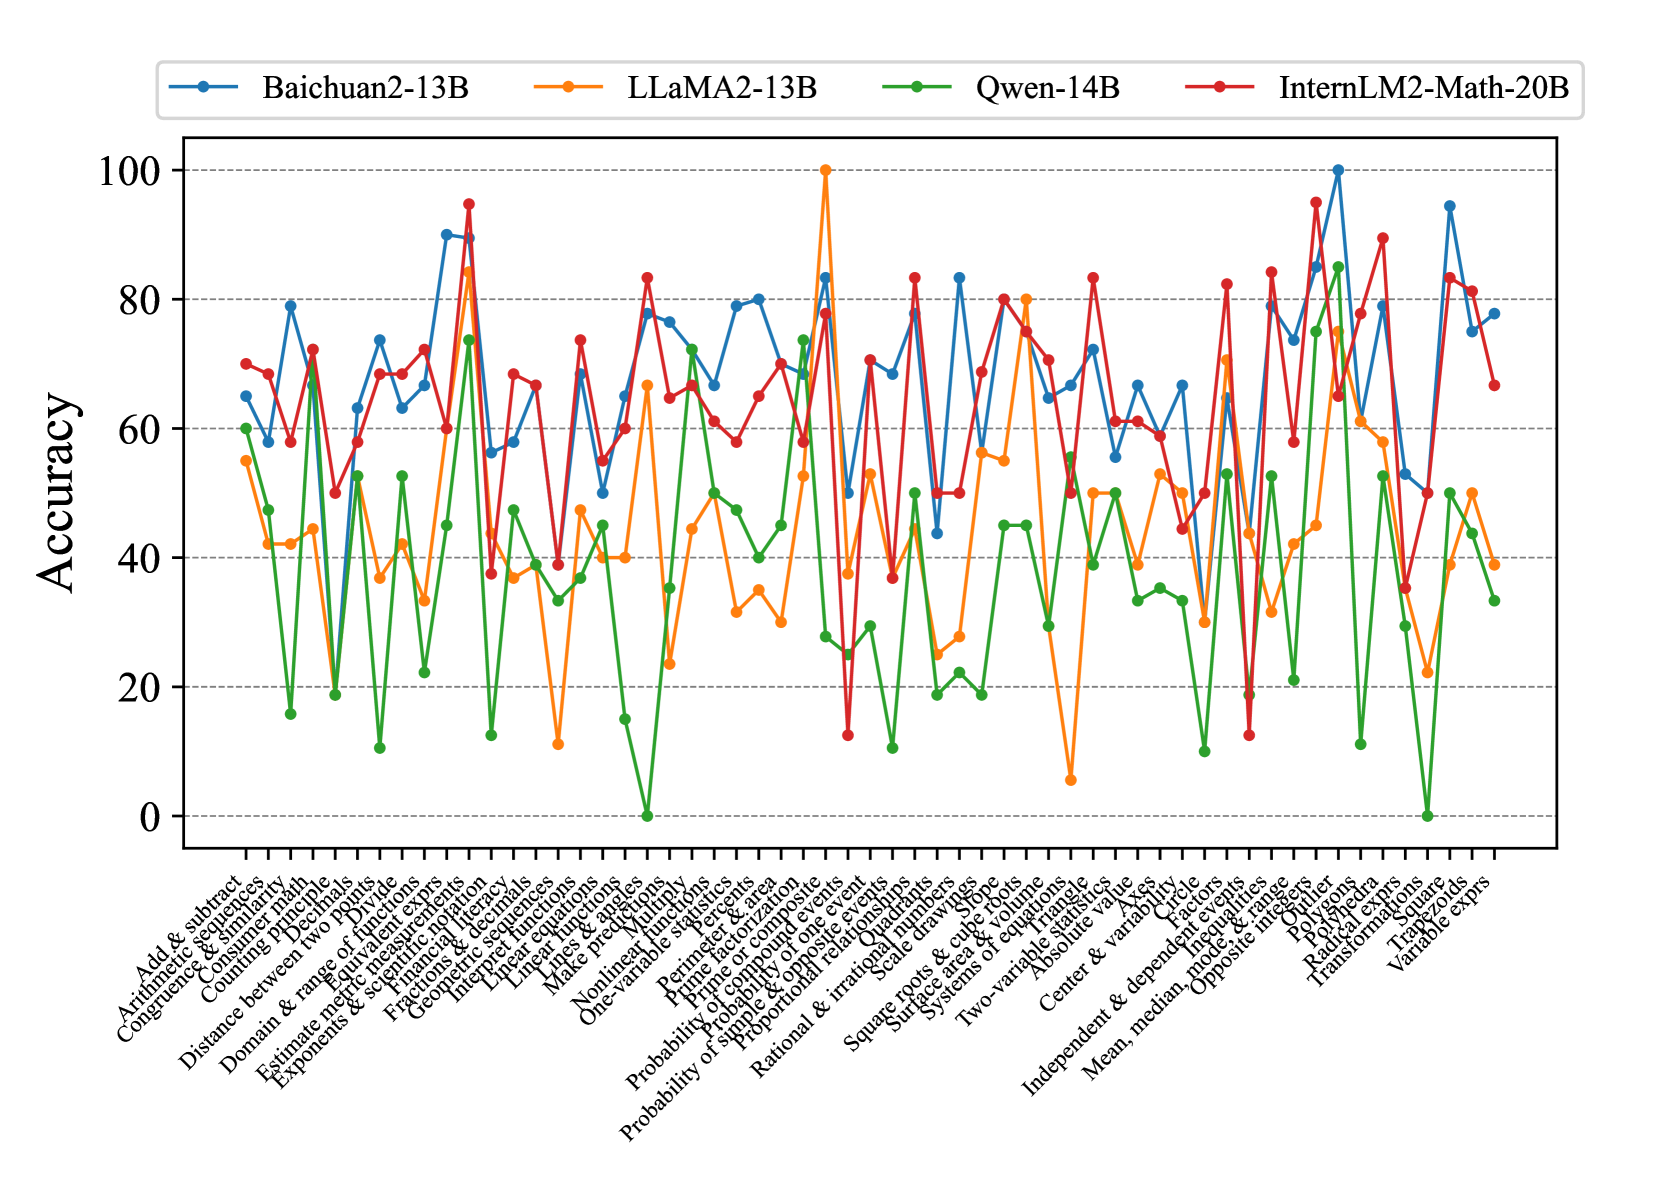
### Visual Description
\n
## Line Chart: Model Accuracy on Math Problems
### Overview
This line chart compares the accuracy of four large language models – Baichuan2-13B, LLaMA2-13B, Qwen-14B, and InternLM2-Math-20B – across a series of 31 different math problem types. The y-axis represents accuracy (ranging from 0 to 100), and the x-axis lists the math problem types. Each model's performance is represented by a distinct colored line.
### Components/Axes
* **Y-axis Title:** Accuracy
* **X-axis Title:** Math Problem Types (listed along the bottom)
* **Legend:** Located at the top-left corner, identifying each line with its corresponding model:
* Baichuan2-13B (Blue)
* LLaMA2-13B (Orange)
* Qwen-14B (Green)
* InternLM2-Math-20B (Red)
* **Math Problem Types (X-axis labels):**
1. Arithmetic & subtract
2. Complete similarity
3. Counting principles
4. Combining like terms
5. Distance between two points
6. Domain & range of functions
7. Estimates & rounding
8. Exponents & radicals
9. Fractions & percentages
10. Interpreting graphs
11. Linear equations
12. Make predictions
13. One-variable equations
14. One-variable inequalities
15. Perimeter & area
16. Probability of composite events
17. Probability of simple events
18. Proportional relationships
19. Rational & irrational numbers
20. Square roots & cube roots
21. Systems of equations
22. Two-variable equations
23. Two-variable inequalities
24. Absolute value
25. Center & variable
26. Mean, median, opposite
27. Polynomials
28. Polygon angles
29. Transform equations
30. Variable expressions
31. Volume
### Detailed Analysis
Here's a breakdown of each model's performance, noting trends and approximate accuracy values. Accuracy values are approximate due to the chart's resolution.
* **Baichuan2-13B (Blue):** The line fluctuates significantly. Starts around 60, dips to ~30, rises to ~95, then declines to ~40. Notable peaks around problem types 10, 16, and 27. Generally performs well on problems 10-17, but struggles with problems 1-9 and 28-31.
* **LLaMA2-13B (Orange):** Shows a generally increasing trend initially, peaking around 85-90 for problems 10-16. Then declines, with significant dips around problems 21, 24, and 31, falling to around 20-30. Starts around 65, peaks around 88, and ends around 30.
* **Qwen-14B (Green):** The most volatile line, with large swings in accuracy. Starts around 60, drops to near 0 for problem type 6, then rises to over 95 for problem type 10. Continues to fluctuate wildly, ending around 50. Demonstrates high accuracy on problems 10-12, but very low accuracy on problems 6, 20, and 26.
* **InternLM2-Math-20B (Red):** The most consistently high-performing model. Starts around 70, rises to a peak of approximately 98 around problem type 10, and remains relatively high (between 60 and 90) throughout the chart. Experiences a dip around problem type 26, falling to ~50, but recovers quickly.
**Specific Data Points (Approximate):**
| Problem Type | Baichuan2-13B | LLaMA2-13B | Qwen-14B | InternLM2-Math-20B |
|---|---|---|---|---|
| 1 | 60 | 65 | 60 | 70 |
| 6 | 40 | 50 | 0 | 60 |
| 10 | 95 | 88 | 98 | 98 |
| 16 | 85 | 90 | 95 | 90 |
| 21 | 50 | 25 | 60 | 75 |
| 26 | 40 | 60 | 0 | 50 |
| 31 | 30 | 30 | 50 | 70 |
### Key Observations
* InternLM2-Math-20B consistently outperforms the other models across most problem types.
* Qwen-14B exhibits the highest variability in accuracy, suggesting it may be more sensitive to the specific problem type.
* LLaMA2-13B shows a clear upward trend initially, followed by a decline, indicating it may struggle with more complex problems.
* Baichuan2-13B's performance is moderate and fluctuates considerably.
* Problem types 10-16 generally yield higher accuracy scores for all models.
* Problem types 6, 20, 26, and 31 consistently result in lower accuracy scores.
### Interpretation
The data suggests that InternLM2-Math-20B is the most robust and accurate model for solving a diverse range of math problems. The significant differences in performance across problem types highlight the challenges in developing general-purpose math solvers. The volatility observed in Qwen-14B's performance could be due to its training data or architecture, making it more prone to errors on certain types of problems. The initial success of LLaMA2-13B followed by a decline suggests a potential limitation in its ability to generalize to more complex mathematical concepts. The consistent performance of InternLM2-Math-20B likely stems from its specialized training on mathematical data. The lower accuracy on problem types 6, 20, 26, and 31 could indicate these areas require further research and development in language model-based math solving. The chart provides valuable insights into the strengths and weaknesses of each model, guiding future research efforts towards improving their mathematical reasoning capabilities.
</details>
<details>
<summary>x23.png Details</summary>
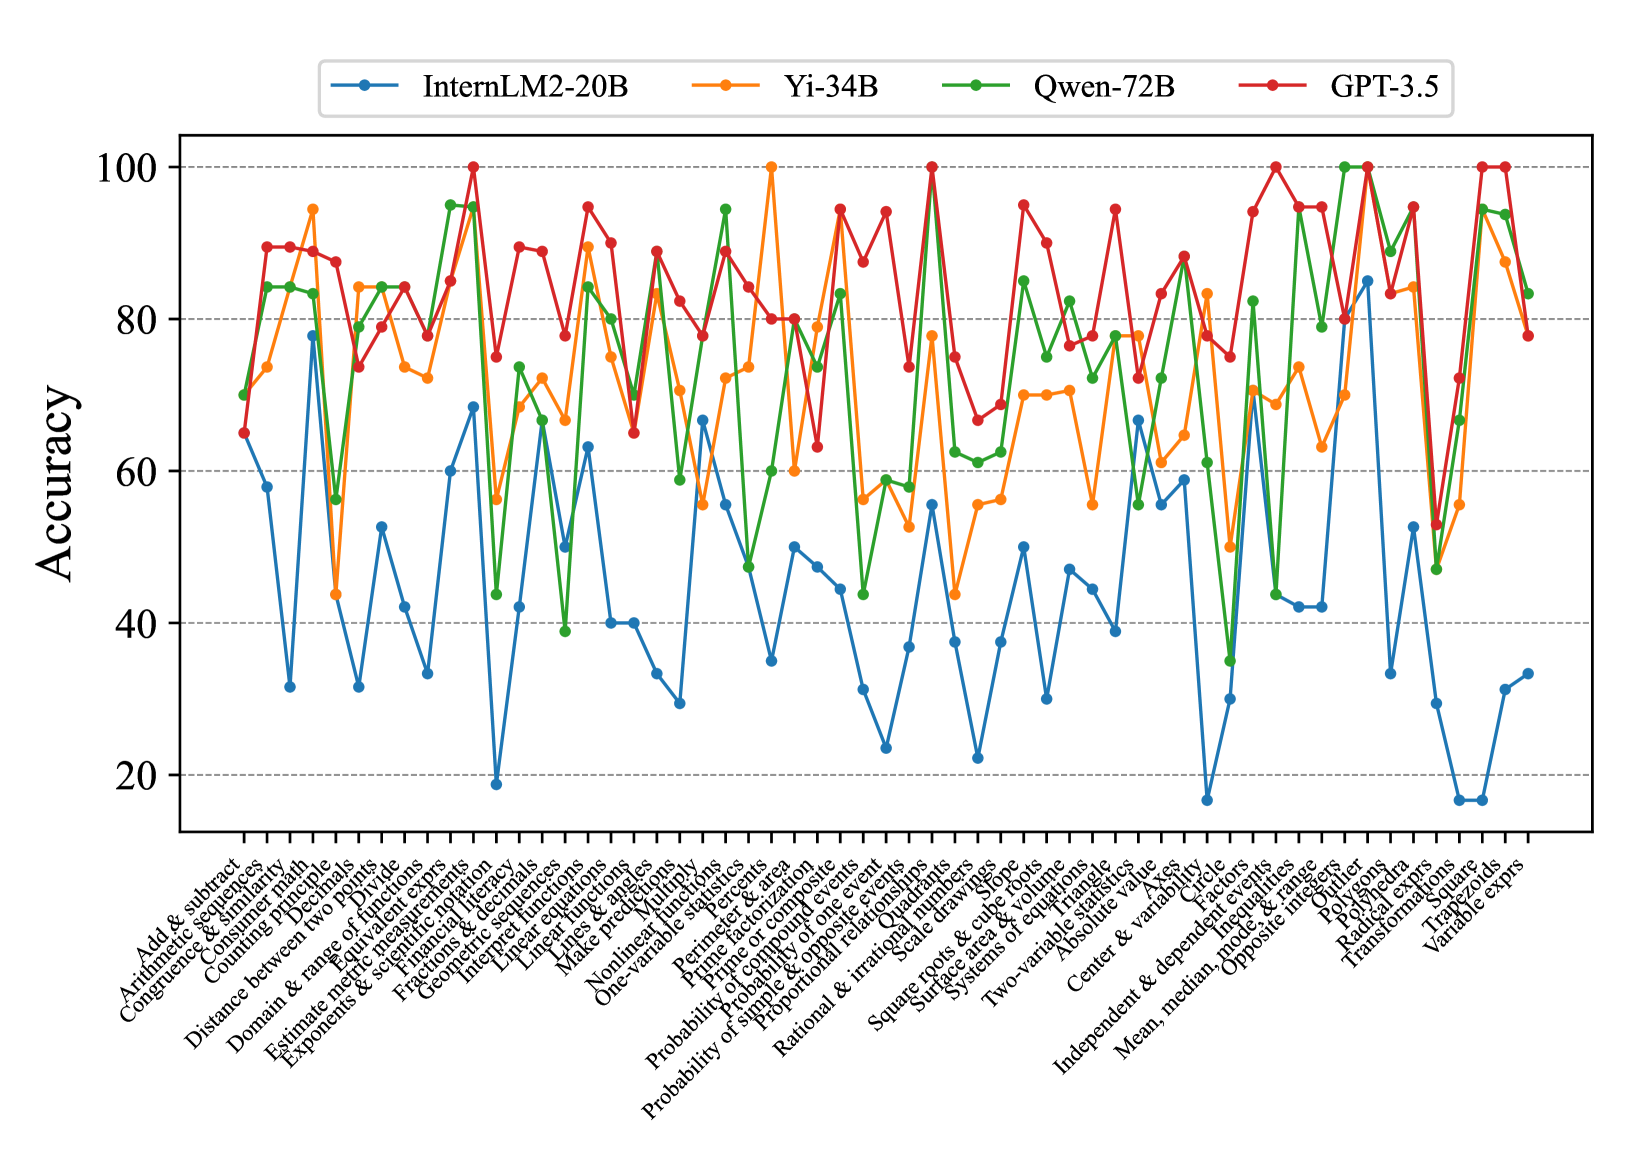
### Visual Description
\n
## Line Chart: Model Accuracy on Math Problems
### Overview
This line chart compares the accuracy of four large language models – InternLM2-20B, Yi-34B, Qwen-72B, and GPT-3.5 – on a series of 33 math problems. The x-axis represents the math problem type, and the y-axis represents the accuracy score, ranging from 0 to 100. The chart displays the performance of each model as a line, allowing for a visual comparison of their strengths and weaknesses across different problem types.
### Components/Axes
* **X-axis:** Math Problem Type (Categorical). The problems are listed as: "Add & subtract", "Arithmetic & significant", "Congruence & similar", "Comparing decimals", "Domain & range", "Distance between two points", "Estimate & measure", "Exponents & radicals", "Experience & decimals", "Factorize & expand", "Integers & decimals", "Linear functions", "Make predictions", "Nonlinear functions", "One-variable equations", "Parallel & perpendicular", "Perimeter & area", "Prime & composite", "Probability of one event", "Probability of simple events", "Probability of two events", "Rational & irrational", "Solve equations", "Surface area & volume", "Systems of equations", "Two-variable equations", "Absolute value", "Center & variation", "Independent & dependent variable", "Mean, median, mode", "Opposite & inverse", "Radial measure", "Transformations", "Variable expressions".
* **Y-axis:** Accuracy (Numerical, 0-100).
* **Legend:** Located at the top-left of the chart, identifying each line by model name and color:
* InternLM2-20B (Yellow)
* Yi-34B (Orange)
* Qwen-72B (Green)
* GPT-3.5 (Red)
### Detailed Analysis
The chart shows the accuracy of each model for each math problem. I will analyze each model's performance, noting trends and approximate values.
* **InternLM2-20B (Yellow):** Starts at approximately 80% accuracy for "Add & subtract", dips to around 20% for "Congruence & similar", rises to around 60% for "Linear functions", then fluctuates between 20-40% for most subsequent problems, ending at approximately 25% for "Variable expressions". The line is generally volatile.
* **Yi-34B (Orange):** Begins at approximately 85% for "Add & subtract", drops to around 30% for "Congruence & similar", peaks at around 95% for "Factorize & expand", then generally declines, fluctuating between 30-70% for the remaining problems, finishing at approximately 40% for "Variable expressions". This line shows more pronounced peaks and valleys.
* **Qwen-72B (Green):** Starts at approximately 75% for "Add & subtract", dips to around 20% for "Congruence & similar", rises to around 80% for "Linear functions", then generally declines, fluctuating between 20-60% for the remaining problems, ending at approximately 30% for "Variable expressions". This line is relatively stable compared to the others.
* **GPT-3.5 (Red):** Starts at approximately 90% for "Add & subtract", dips to around 60% for "Congruence & similar", remains relatively high (70-100%) for many problems, including "Factorize & expand", "Linear functions", and "Solve equations", then declines towards the end, finishing at approximately 65% for "Variable expressions". This line consistently demonstrates the highest accuracy across most problem types.
### Key Observations
* GPT-3.5 consistently outperforms the other models across most problem types, maintaining a higher accuracy level.
* All models struggle with "Congruence & similar" problems, exhibiting the lowest accuracy scores for this category.
* Yi-34B shows a significant peak in accuracy for "Factorize & expand", exceeding the performance of other models on this specific problem.
* InternLM2-20B exhibits the most volatile performance, with large fluctuations in accuracy across different problem types.
* The accuracy of all models generally declines towards the end of the problem sequence, suggesting increasing difficulty or a shift in problem characteristics.
### Interpretation
The data suggests that GPT-3.5 is the most proficient model in solving the presented range of math problems. The consistent high accuracy indicates a strong understanding of mathematical concepts and problem-solving abilities. The shared weakness across all models on "Congruence & similar" problems suggests this area requires further improvement in language model training. The peak performance of Yi-34B on "Factorize & expand" could be attributed to specific training data or architectural strengths related to algebraic manipulation. The declining accuracy towards the end of the sequence might indicate that the later problems are more complex or require different mathematical skills than the earlier ones. The volatility of InternLM2-20B suggests it may be more sensitive to the specific phrasing or structure of the problems. Overall, the chart provides valuable insights into the strengths and weaknesses of different language models in the domain of mathematical reasoning.
</details>
Figure 14: Concept accuracies on Middle-EN of more models.
<details>
<summary>x24.png Details</summary>
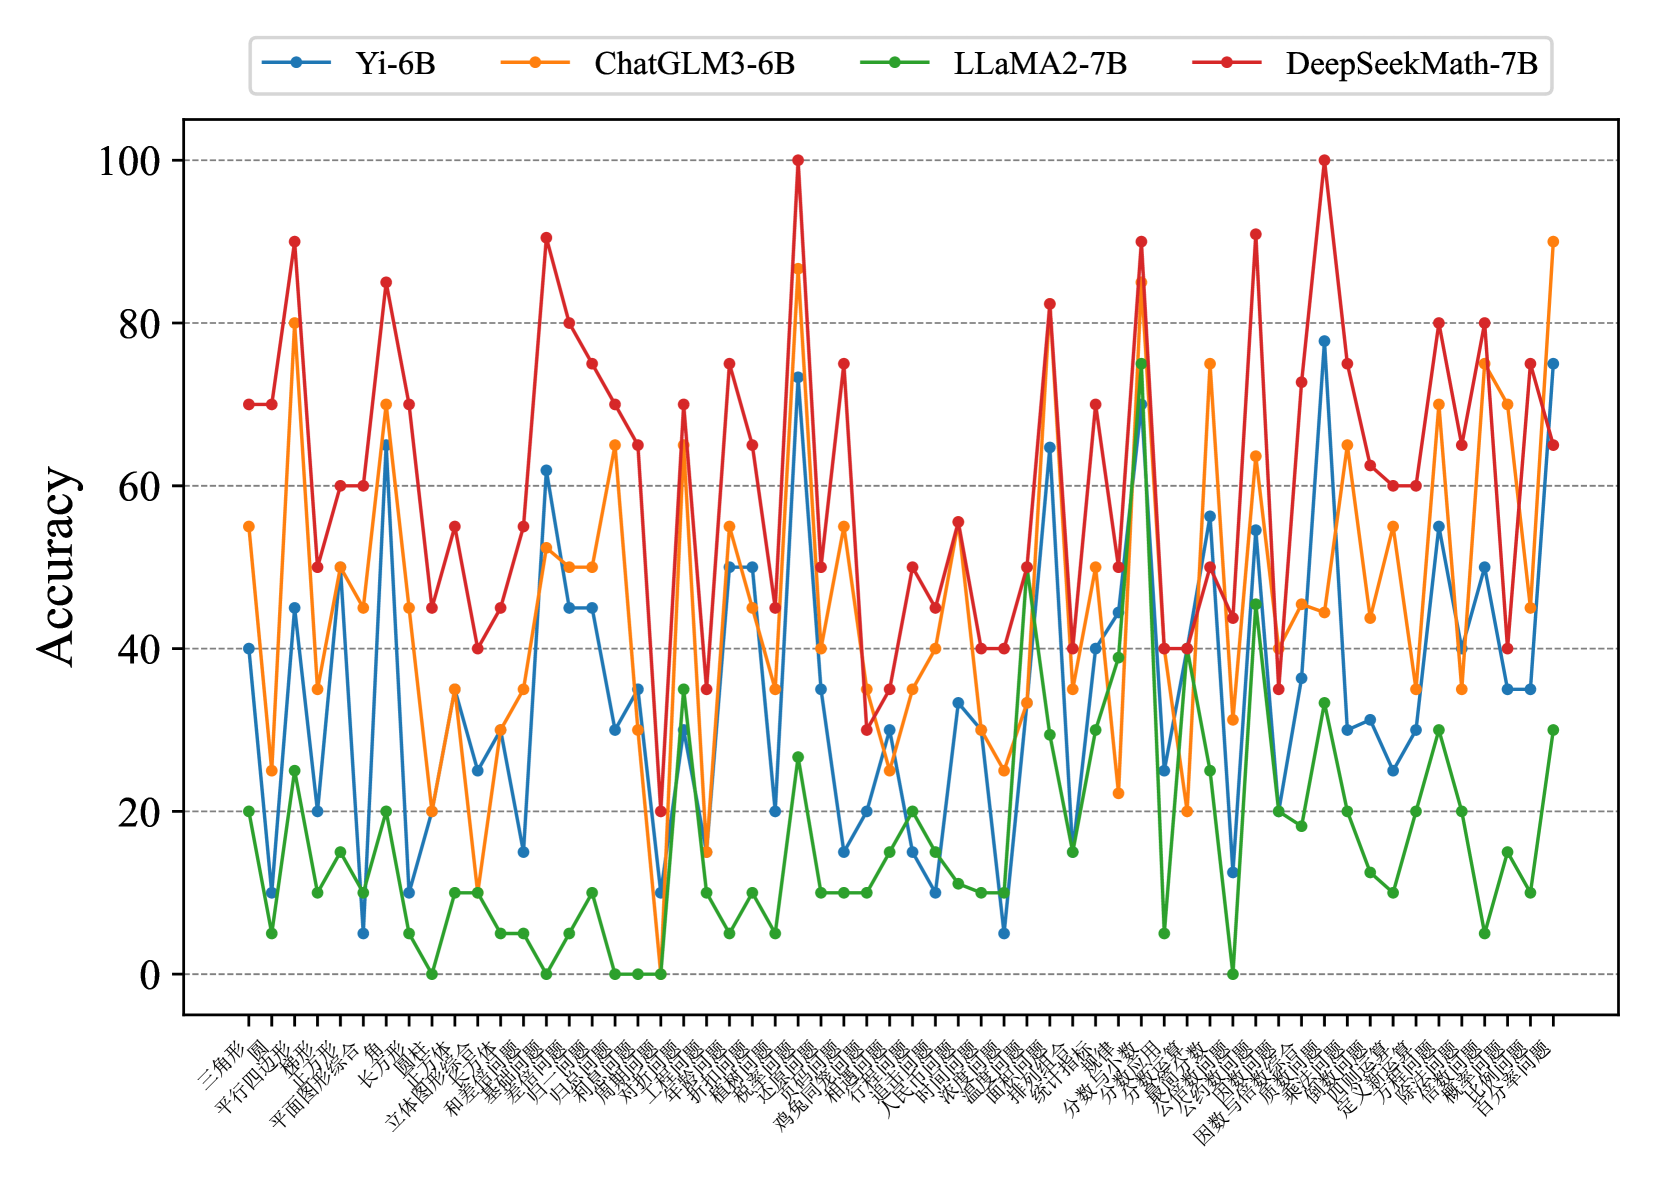
### Visual Description
\n
## Line Chart: Model Accuracy on Math Problems
### Overview
This line chart compares the accuracy of four different language models (Yi-6B, ChatGLM3-6B, LLaMA2-7B, and DeepSeekMath-7B) across a series of math problems. The x-axis represents the math problems, labeled in Chinese characters, and the y-axis represents the accuracy, ranging from 0 to 100.
### Components/Axes
* **Y-axis Title:** Accuracy
* **X-axis Title:** (Chinese characters representing math problem types - see "Detailed Analysis" for approximate translations)
* **Legend:** Located at the top-center of the chart.
* Yi-6B (Light Blue Line)
* ChatGLM3-6B (Red Line)
* LLaMA2-7B (Green Line)
* DeepSeekMath-7B (Orange Line)
* **Y-axis Scale:** Linear, from 0 to 100, with increments of 20.
* **X-axis Scale:** Categorical, representing different math problems. The labels are in Chinese.
### Detailed Analysis
The chart displays accuracy scores for each model on each problem. The x-axis labels, translated approximately, are as follows (with uncertainty due to translation):
1. 三角形 (Triangle)
2. 平方和差 (Sum and Difference of Squares)
3. 平面向量 (Plane Vector)
4. 立体几何 (Solid Geometry)
5. 和 (Sum)
6. 不等式 (Inequality)
7. 函数 (Function)
8. 数列 (Sequence)
9. 三角函数 (Trigonometric Function)
10. 导数 (Derivative)
11. 积分 (Integral)
12. 极限 (Limit)
13. 概率 (Probability)
14. 统计 (Statistics)
15. 向量 (Vector)
16. 几何 (Geometry)
17. 计数 (Counting)
18. 组合 (Combination)
19. 概率 (Probability) - *Repeated*
20. 统计 (Statistics) - *Repeated*
21. 抽样 (Sampling)
22. 期望 (Expectation)
23. 方差 (Variance)
24. 离散 (Discrete)
25. 连续 (Continuous)
Here's a breakdown of the trends and approximate accuracy values for each model:
* **Yi-6B (Light Blue):** Generally maintains an accuracy between 20-40%, with some fluctuations. It shows a peak of approximately 50% around the "导数" (Derivative) problem.
* **ChatGLM3-6B (Red):** Exhibits the highest overall accuracy, frequently exceeding 80%. It has several peaks close to 100% on problems like "立体几何" (Solid Geometry), "和" (Sum), "不等式" (Inequality), and "积分" (Integral). It dips to around 30% on "三角形" (Triangle).
* **LLaMA2-7B (Green):** Shows the lowest accuracy, generally below 30%. It has a few peaks around 40% but remains consistently lower than the other models. It reaches a minimum near 0% on the last problem "连续" (Continuous).
* **DeepSeekMath-7B (Orange):** Performs better than LLaMA2-7B but generally lower than Yi-6B and ChatGLM3-6B. It fluctuates between 30-70%, with peaks around 70% on problems like "立体几何" (Solid Geometry) and "和" (Sum).
### Key Observations
* ChatGLM3-6B consistently outperforms the other models across most problems.
* LLaMA2-7B consistently underperforms, indicating a lower capability in solving these math problems.
* DeepSeekMath-7B shows moderate performance, positioned between Yi-6B and ChatGLM3-6B.
* There is significant variation in accuracy across different problem types for all models. Some problems are consistently easier (higher accuracy) than others.
* The repeated "概率" (Probability) and "统计" (Statistics) problems show similar accuracy scores for each model, suggesting consistency in performance on these topics.
### Interpretation
The data suggests that ChatGLM3-6B is the most proficient model for solving the presented set of math problems, while LLaMA2-7B struggles significantly. The performance differences likely stem from variations in model architecture, training data, and optimization strategies. The fluctuations in accuracy across different problem types indicate that the models have varying strengths and weaknesses in specific mathematical areas. The fact that DeepSeekMath-7B, designed for mathematical tasks, performs better than the general-purpose LLaMA2-7B but not as well as ChatGLM3-6B suggests that specialized training can improve performance, but the quality of the training data and model design are crucial. The repeated problems provide a check for consistency, and the similar results suggest the models are not simply overfitting to specific instances. This chart provides a comparative analysis of model capabilities in a mathematical domain, highlighting the importance of model selection for specific tasks.
</details>
<details>
<summary>x25.png Details</summary>
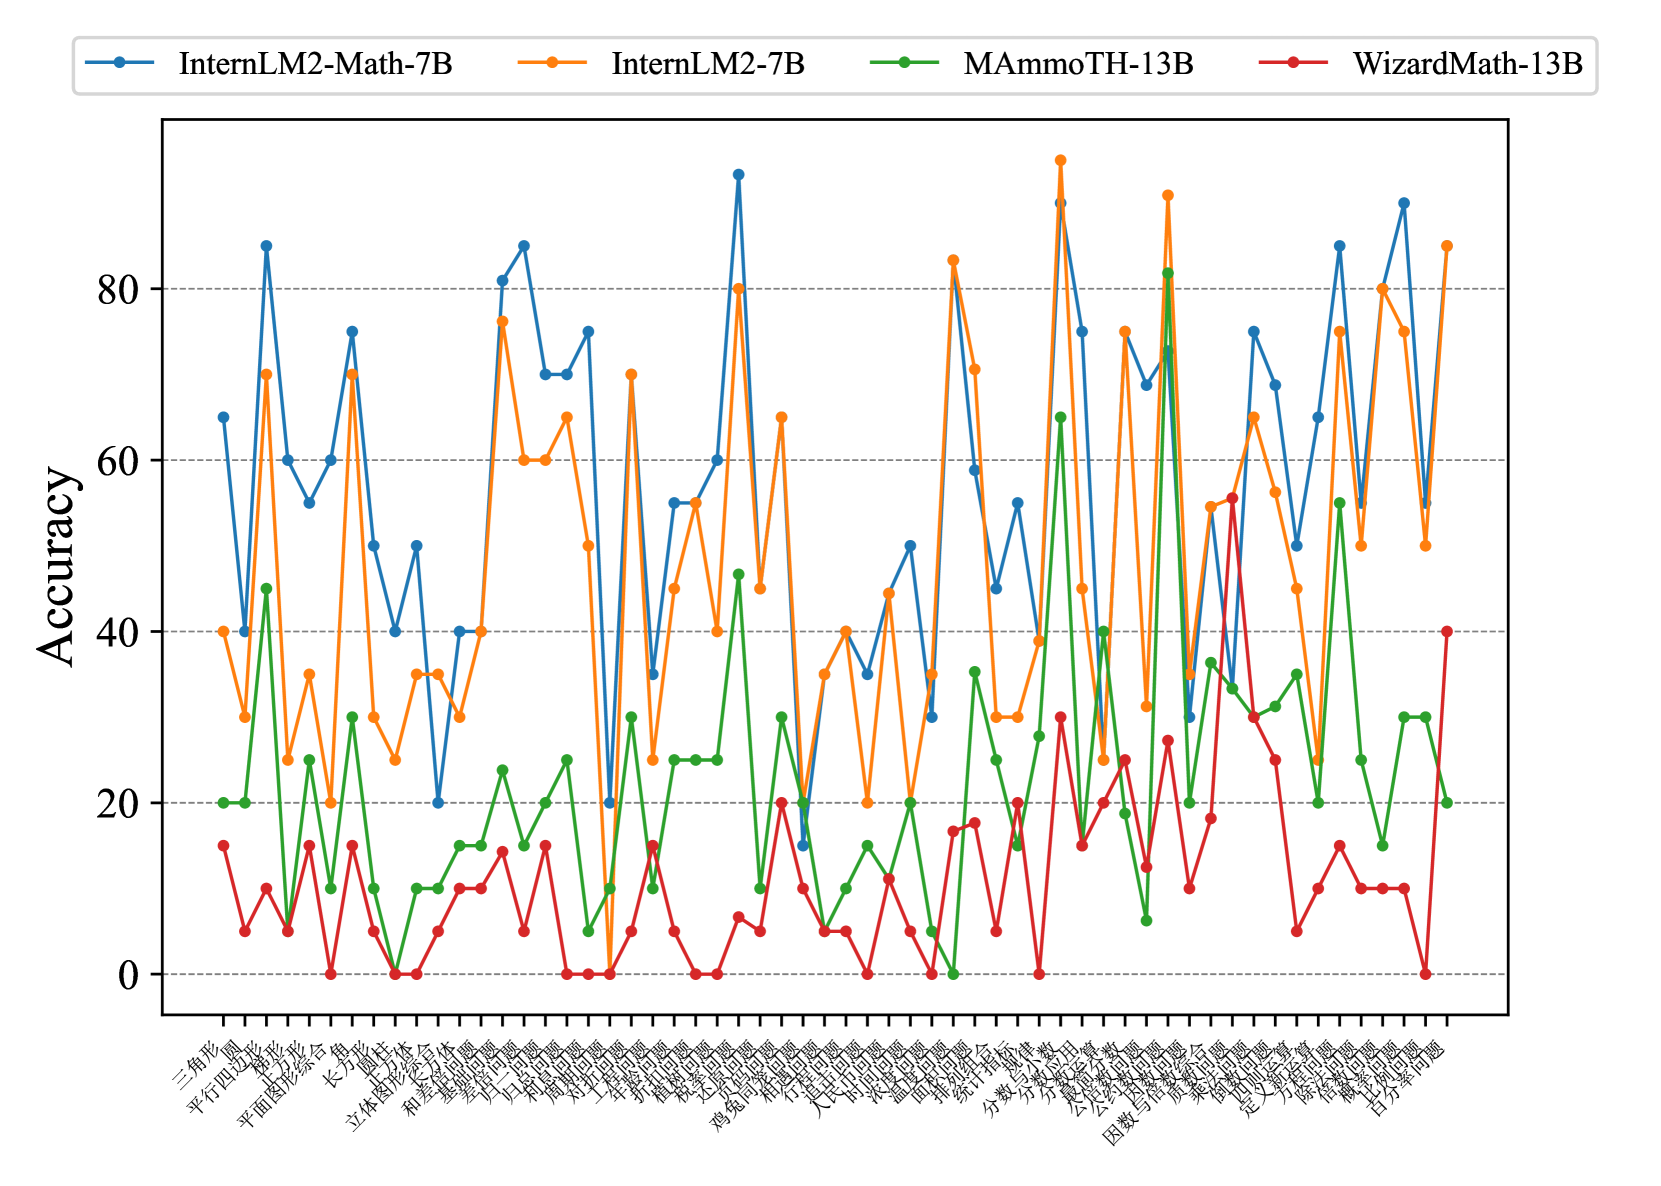
### Visual Description
## Line Chart: Math Problem Accuracy by Model
### Overview
This image presents a line chart comparing the accuracy of four different language models – InternLM2-Math-7B, InternLM2-7B, MAmmoTH-13B, and WizardMath-13B – across a series of math problems. The x-axis represents the math problems (in Chinese characters), and the y-axis represents the accuracy, ranging from 0 to 80.
### Components/Axes
* **Y-axis Title:** Accuracy
* **X-axis Title:** (Chinese characters representing math problem types - see "Detailed Analysis" for approximate translations)
* **Legend:** Located at the top-center of the chart.
* InternLM2-Math-7B (Blue line with circle markers)
* InternLM2-7B (Orange line with circle markers)
* MAmmoTH-13B (Green line with circle markers)
* WizardMath-13B (Red line with circle markers)
* **Scale:** Y-axis is scaled from 0 to 80, with increments of 10.
* **X-axis Markers:** Numerous Chinese characters representing different math problem types.
### Detailed Analysis
The chart displays accuracy scores for each model across a range of math problems. Due to the Chinese characters on the x-axis, precise problem names are difficult to determine without translation. However, based on visual grouping and common math topics, approximate translations are:
1. 三角函数 (Trigonometric Functions)
2. 平均问题 (Average Problems)
3. 平面向量 (Plane Vectors)
4. 立体几何 (Solid Geometry)
5. 长方体 (Rectangular Prism)
6. 和差倍问题 (Sum-Difference-Multiple Problems)
7. 方程组 (System of Equations)
8. 不等式 (Inequalities)
9. 数列 (Sequences)
10. 极限 (Limits)
11. 导数 (Derivatives)
12. 函数 (Functions)
13. 概率 (Probability)
14. 统计 (Statistics)
15. 组合 (Combinations)
16. 计数 (Counting)
17. 逻辑 (Logic)
18. 几何 (Geometry)
19. 面积 (Area)
20. 体积 (Volume)
21. 角度 (Angles)
22. 比例 (Proportions)
23. 百分数 (Percentages)
24. 混合 (Mixed)
Here's a breakdown of the trends and approximate accuracy values for each model:
* **InternLM2-Math-7B (Blue):** Starts around 65, dips to ~40, rises to a peak of ~85, fluctuates between 50-80 for the majority of the problems, and ends around 70.
* **InternLM2-7B (Orange):** Starts around 40, generally stays between 20-50, with a peak around 85 at problem 16 (计数/Counting). Ends around 30.
* **MAmmoTH-13B (Green):** Starts around 20, fluctuates between 10-30, with occasional spikes up to ~40. Ends around 20.
* **WizardMath-13B (Red):** Starts around 0, generally stays between 0-20, with a few peaks around 30-40. Ends around 10.
### Key Observations
* InternLM2-Math-7B consistently outperforms the other models across most problem types, achieving the highest accuracy scores.
* InternLM2-7B shows a significant peak in accuracy for the "Counting" problem (problem 16).
* MAmmoTH-13B and WizardMath-13B exhibit relatively low and stable accuracy scores throughout the chart.
* There is considerable fluctuation in accuracy for all models, suggesting sensitivity to the specific problem type.
### Interpretation
The data suggests that InternLM2-Math-7B is the most capable model for solving a diverse range of math problems, as indicated by its consistently higher accuracy scores. The peak in InternLM2-7B's accuracy for "Counting" problems might indicate a specific strength in combinatorial reasoning. The lower performance of MAmmoTH-13B and WizardMath-13B could be due to their architecture or training data. The fluctuations in accuracy across all models highlight the challenges of math problem-solving and the importance of model robustness. The chart provides a comparative performance assessment of these models, which can inform model selection for specific math-related tasks. The use of Chinese characters for the problem types suggests the models were likely evaluated on a dataset tailored to a Chinese-speaking audience or focused on mathematical concepts commonly taught in Chinese education systems.
</details>
<details>
<summary>x26.png Details</summary>
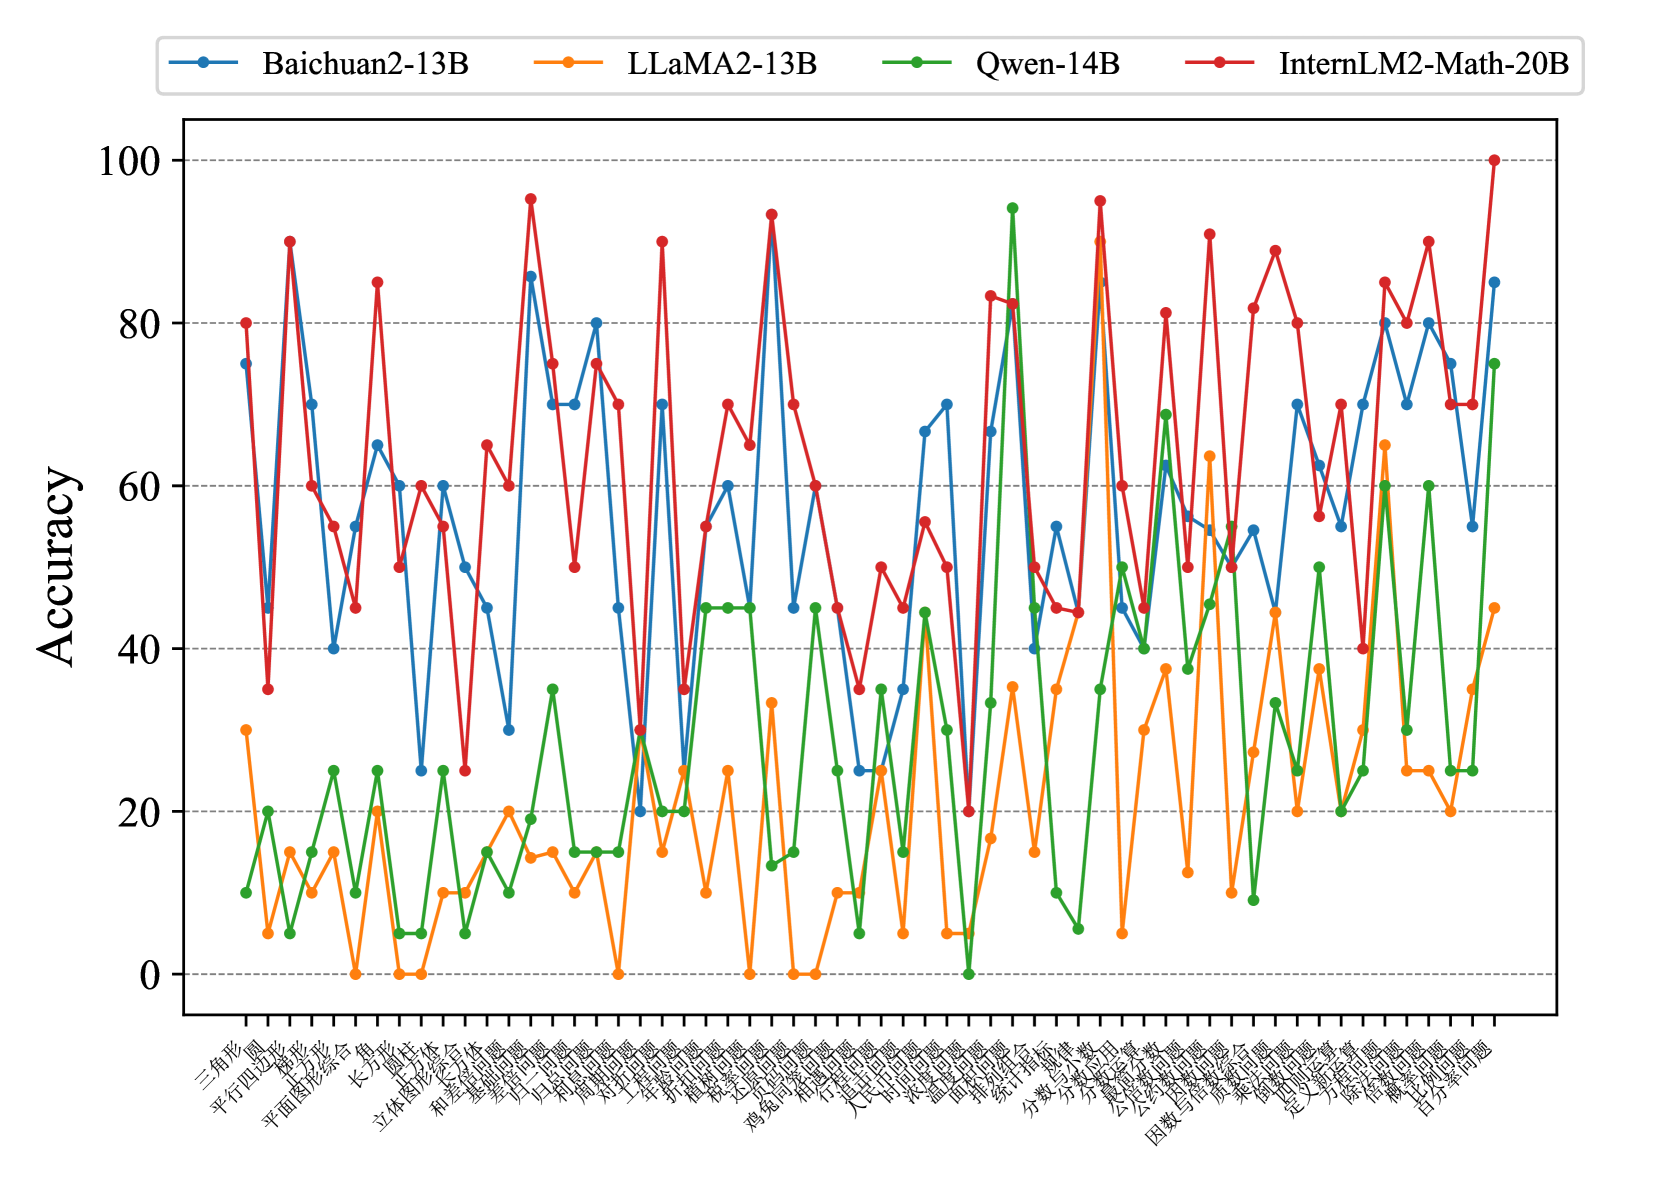
### Visual Description
\n
## Line Chart: Model Accuracy on Various Tasks
### Overview
The image presents a line chart comparing the accuracy of four large language models – Baichuan2-13B, LLaMA2-13B, Qwen-14B, and InternLM2-Math-20B – across a series of tasks. The x-axis represents the tasks, labeled in Chinese characters, and the y-axis represents the accuracy, ranging from 0 to 100.
### Components/Axes
* **X-axis Title:** (Not explicitly labeled, but represents) Tasks (in Chinese)
* **Y-axis Title:** Accuracy
* **Y-axis Scale:** Linear, from 0 to 100, with increments of 20.
* **Legend:** Located at the top-center of the chart.
* **Blue Line:** Baichuan2-13B
* **Orange Line:** LLaMA2-13B
* **Green Line:** Qwen-14B
* **Red Line:** InternLM2-Math-20B
* **Tasks (X-axis Labels):** The tasks are labeled in Chinese characters. A partial translation (best effort) is provided in the Detailed Analysis section.
### Detailed Analysis
The chart displays accuracy scores for each model on each task. Due to the Chinese labels, precise task identification is difficult, but a best-effort attempt is made below. The x-axis has approximately 40 tasks.
* **Baichuan2-13B (Blue Line):** The line fluctuates significantly. It starts around 10, rises to a peak of approximately 90 around task 10, then dips and rises again, ending around 80.
* **LLaMA2-13B (Orange Line):** This line generally stays lower than the others, fluctuating between 10 and 30 for the first 20 tasks. It shows a peak around 60 at task 25, then declines to around 20-30 for the remaining tasks.
* **Qwen-14B (Green Line):** This line exhibits high variability. It starts around 15, peaks at approximately 95 around task 8, then fluctuates between 20 and 80 for the rest of the tasks.
* **InternLM2-Math-20B (Red Line):** This line shows the highest overall accuracy, with frequent peaks around 80-95. It starts around 40, rises quickly, and maintains high accuracy throughout most of the tasks, with some dips to around 60.
Here's a rough attempt at translating some of the x-axis labels (using online translation tools, accuracy not guaranteed):
* Task 1: 三种漫画 (Three Comics)
* Task 2: 平行四边形 (Parallelogram)
* Task 3: 立方体 (Cube)
* Task 4: 长方形 (Rectangle)
* Task 5: 和谐 (Harmony)
* Task 6: 立方体 (Cube)
* Task 7: 汉字 (Chinese Characters)
* Task 8: 海 (Sea)
* Task 9: 分数 (Fractions)
* Task 10: 勾股 (Pythagorean Theorem)
* Task 11: 国家 (Country)
* Task 12: 股票 (Stocks)
* Task 13: 经济 (Economy)
* Task 14: 股票 (Stocks)
* Task 15: 股票 (Stocks)
* Task 16: 股票 (Stocks)
* Task 17: 股票 (Stocks)
* Task 18: 股票 (Stocks)
* Task 19: 股票 (Stocks)
* Task 20: 股票 (Stocks)
### Key Observations
* InternLM2-Math-20B consistently outperforms the other models, particularly on tasks where high accuracy is required.
* Qwen-14B shows significant variability, with both high peaks and low troughs in accuracy.
* LLaMA2-13B generally exhibits the lowest accuracy among the four models.
* Baichuan2-13B shows a moderate level of accuracy, with fluctuations throughout the tasks.
* The tasks appear to cover a diverse range of topics, including geometry, mathematics, language, and economics.
### Interpretation
The data suggests that InternLM2-Math-20B is the most capable model across the tested tasks, likely due to its specialized training in mathematical reasoning. The high variability of Qwen-14B could indicate sensitivity to task formulation or data distribution. LLaMA2-13B's lower performance might be attributed to its smaller model size or different training data. The presence of tasks related to Chinese characters and cultural concepts (e.g., "和谐" - Harmony) suggests the models are being evaluated on their ability to handle the Chinese language and context. The repeated "股票" (Stocks) tasks suggest a focus on financial reasoning. The chart highlights the importance of model selection based on the specific task requirements and the need for further investigation into the factors influencing model performance on diverse tasks. The large fluctuations in accuracy across tasks for all models suggest that performance is highly task-dependent.
</details>
<details>
<summary>x27.png Details</summary>
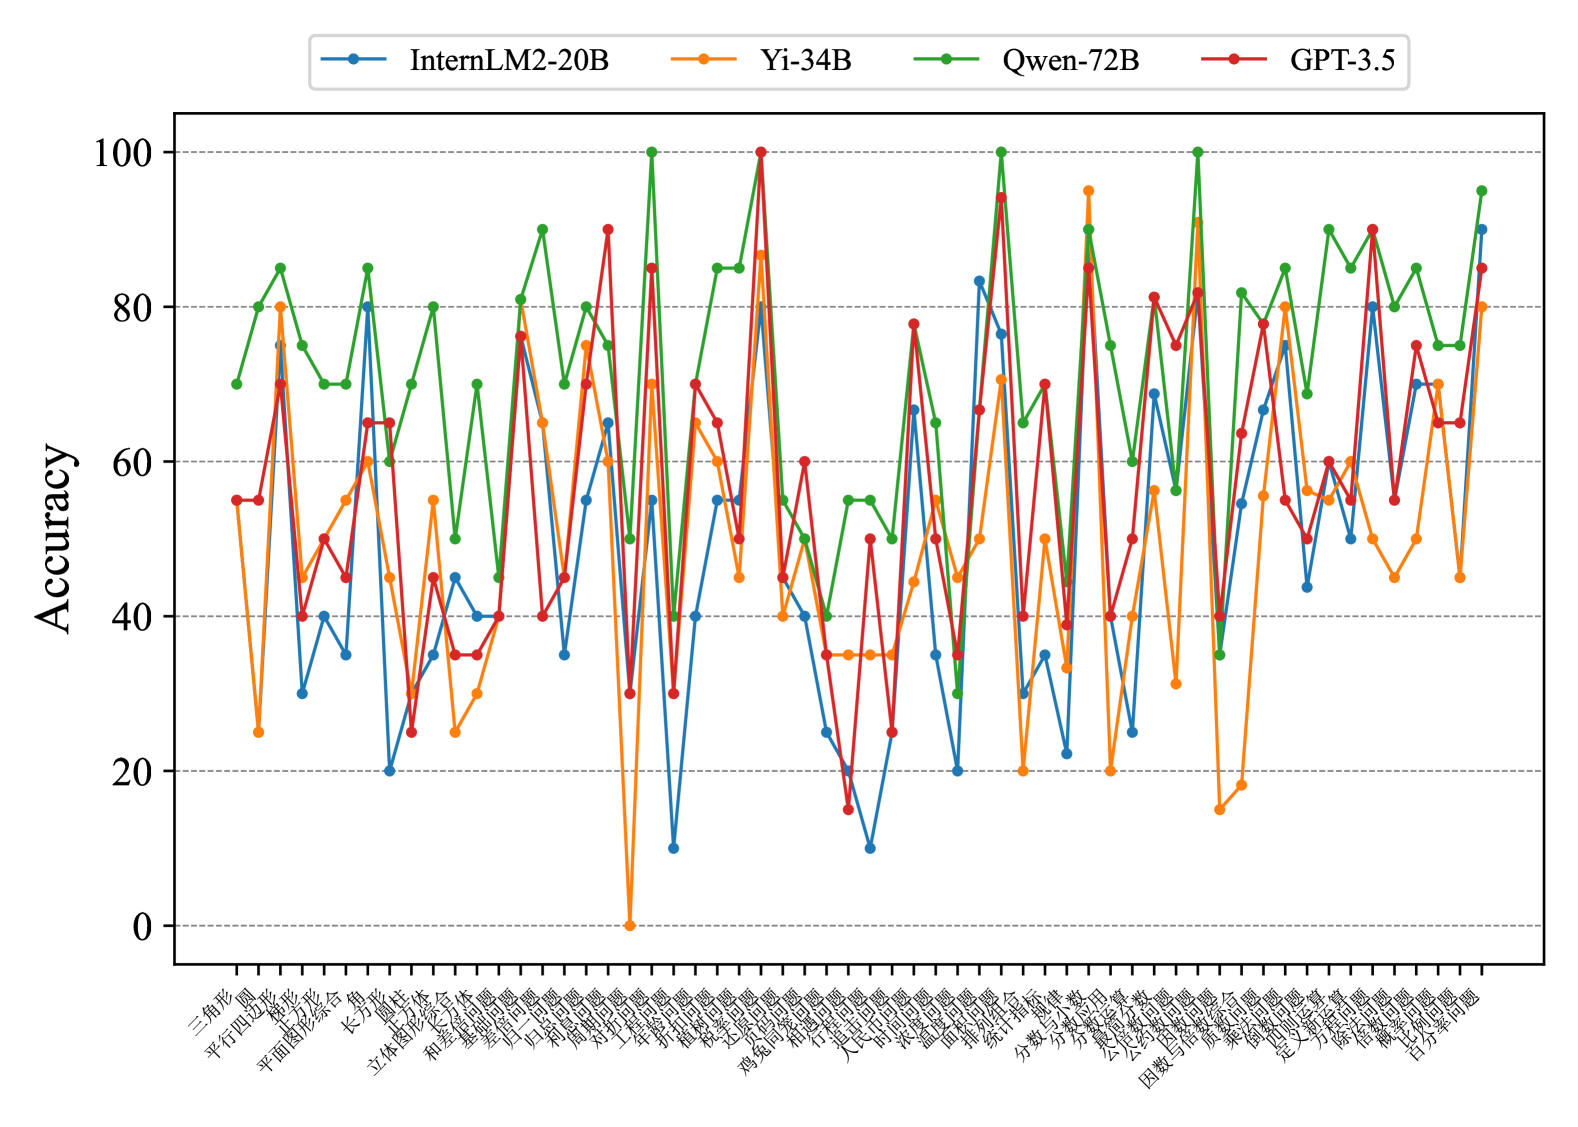
### Visual Description
## Line Chart: Model Accuracy Across Various Tasks
### Overview
This image presents a line chart comparing the accuracy of four different language models – InternLM2-20B, Yi-34B, Qwen-72B, and GPT-3.5 – across a series of tasks. The x-axis represents the tasks, labeled in Chinese characters, and the y-axis represents the accuracy, ranging from 0 to 100.
### Components/Axes
* **X-axis:** Task names, labeled in Chinese. The labels are densely packed and appear to represent different evaluation tasks.
* **Y-axis:** Accuracy, ranging from 0 to 100, with increments of 10. The axis is labeled "Accuracy".
* **Legend:** Located at the top of the chart, identifying each line with a color and model name:
* Blue: InternLM2-20B
* Green: Yi-34B
* Black: Qwen-72B
* Orange: GPT-3.5
### Detailed Analysis
The chart displays accuracy scores for each model across approximately 30 tasks. The task names are in Chinese, making precise identification difficult without translation. Here's a breakdown of the trends and approximate data points, noting the uncertainty due to the density of the chart and the difficulty in reading the x-axis labels:
* **InternLM2-20B (Blue Line):** This line exhibits significant fluctuations, ranging from approximately 15 to 85. It generally starts around 60, dips to around 20, then rises to a peak of approximately 85 before fluctuating again.
* **Yi-34B (Green Line):** This line consistently shows the highest accuracy scores, generally staying above 70 and peaking around 95. It has fewer dips than the other models.
* **Qwen-72B (Black Line):** This line fluctuates between approximately 40 and 80. It starts around 70, dips to around 40, and then rises and falls several times.
* **GPT-3.5 (Orange Line):** This line shows the most variability, with accuracy scores ranging from approximately 10 to 90. It starts around 50, drops to a low of around 10, and then experiences several peaks and valleys.
Here's a more detailed, though approximate, extraction of data points for a few selected tasks (assuming the tasks are numbered 1-30 from left to right):
| Task | InternLM2-20B | Yi-34B | Qwen-72B | GPT-3.5 |
|---|---|---|---|---|
| 1 | ~60 | ~80 | ~70 | ~50 |
| 5 | ~20 | ~90 | ~40 | ~10 |
| 10 | ~85 | ~95 | ~80 | ~60 |
| 15 | ~50 | ~75 | ~60 | ~40 |
| 20 | ~70 | ~85 | ~75 | ~70 |
| 25 | ~30 | ~90 | ~50 | ~20 |
| 30 | ~65 | ~80 | ~65 | ~55 |
**Note:** These values are approximate due to the chart's resolution and the difficulty in reading the x-axis labels.
### Key Observations
* Yi-34B consistently outperforms the other models across all tasks.
* GPT-3.5 exhibits the highest degree of variability in accuracy.
* InternLM2-20B and Qwen-72B show similar levels of performance, with moderate fluctuations.
* There are several tasks where GPT-3.5's accuracy drops significantly, indicating potential weaknesses in specific areas.
### Interpretation
The chart demonstrates a clear hierarchy in model performance, with Yi-34B being the most robust and consistent performer. The significant fluctuations in GPT-3.5's accuracy suggest that its performance is highly task-dependent. The Chinese task labels indicate that the evaluation was conducted on a dataset tailored to the Chinese language or specific Chinese cultural contexts. The wide range of accuracy scores across different tasks highlights the challenges in building general-purpose language models that perform well on all types of tasks. The data suggests that Yi-34B is a strong contender for applications requiring high accuracy and consistency, while GPT-3.5 may be more suitable for tasks where some variability is acceptable. Further investigation into the specific tasks represented on the x-axis would be necessary to understand the strengths and weaknesses of each model in more detail. The consistent high performance of Yi-34B could be attributed to its architecture, training data, or optimization techniques.
</details>
Figure 15: Concept accuracies on Elementary-ZH of more models.
<details>
<summary>x28.png Details</summary>
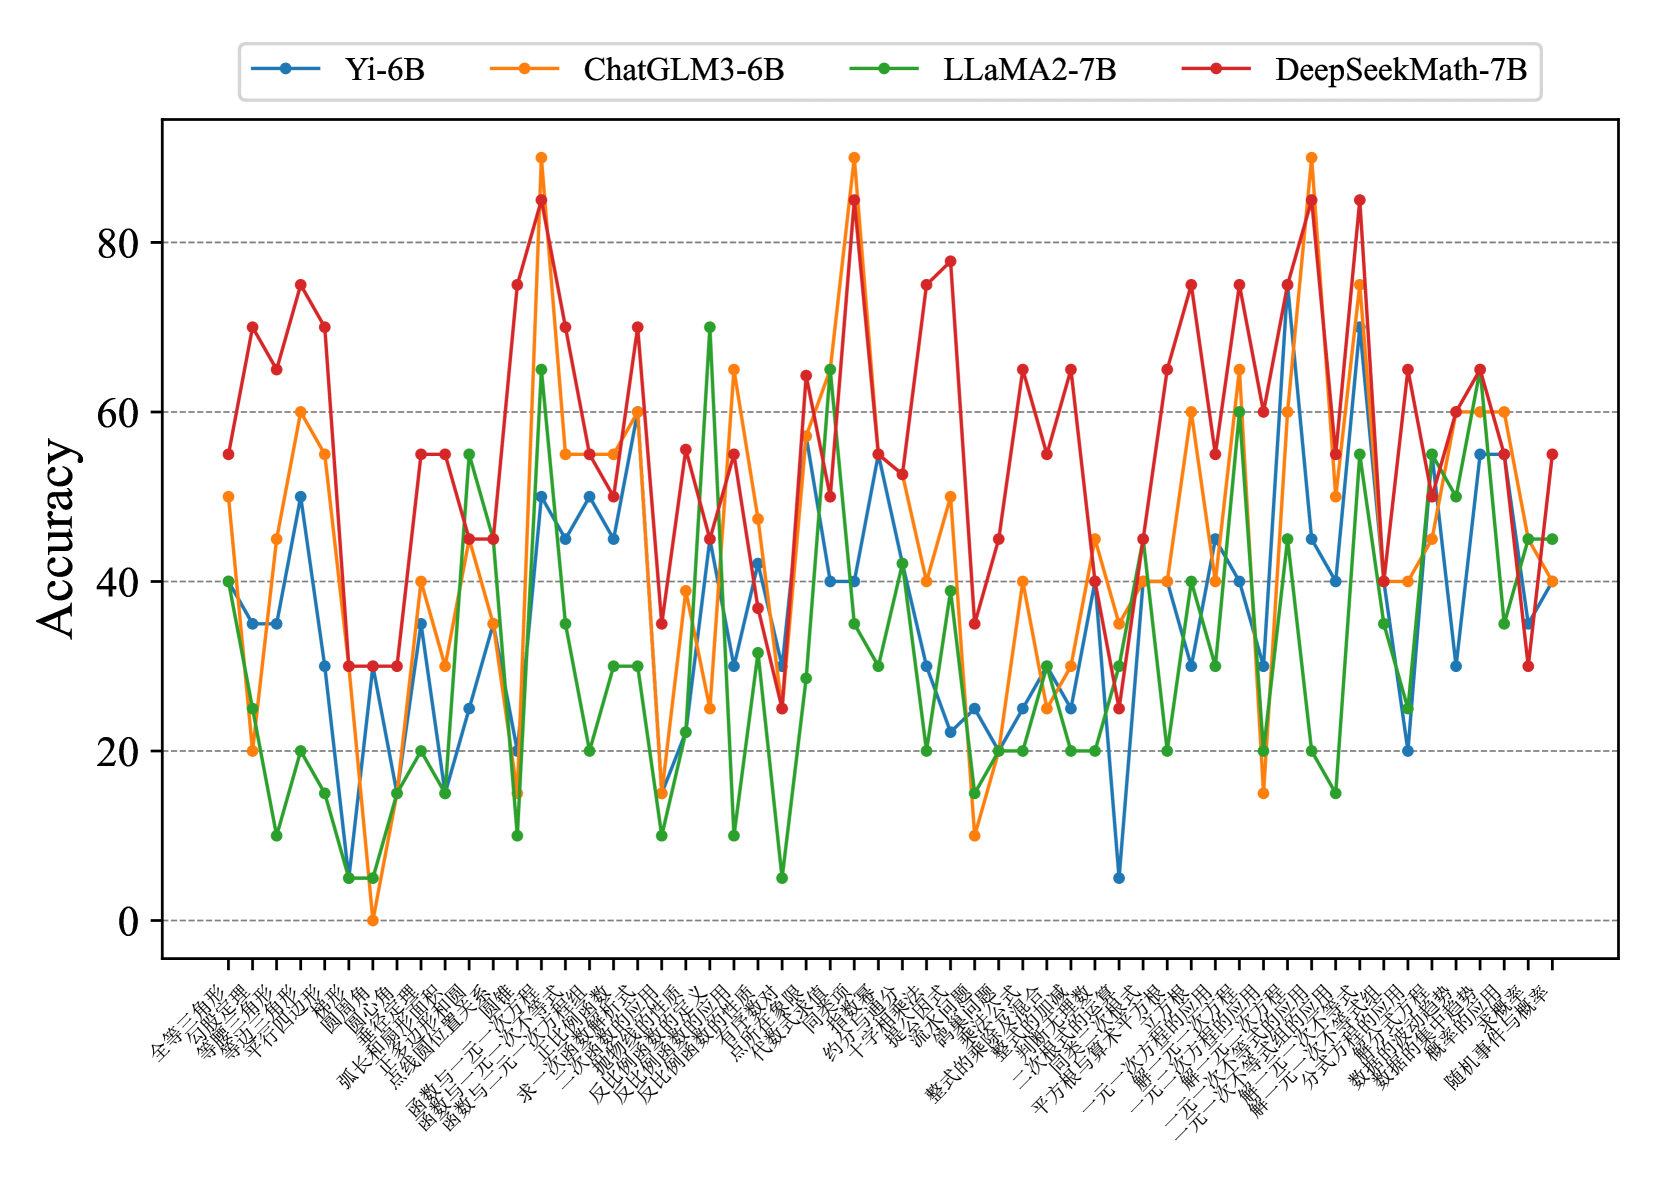
### Visual Description
## Line Chart: Model Accuracy on Math Problems
### Overview
This line chart compares the accuracy of four different language models (Yi-6B, ChatGLM3-6B, LLaMA2-7B, and DeepSeekMath-7B) across a series of math problems. The x-axis represents the math problem categories, and the y-axis represents the accuracy score, ranging from 0 to 80.
### Components/Axes
* **Y-axis Title:** Accuracy
* **X-axis Labels:** The x-axis labels are in Chinese characters. A rough translation (using online tools) suggests they represent different categories of math problems, including:
* 全面提升 (Comprehensive Improvement)
* 数学应用 (Math Application)
* 初中数学 (Junior High Math)
* 高等数学 (Higher Math)
* 微积分 (Calculus)
* 线性代数 (Linear Algebra)
* 概率统计 (Probability and Statistics)
* 复分析 (Complex Analysis)
* 多元微积分 (Multivariable Calculus)
* 一元微积分 (Single Variable Calculus)
* 几何 (Geometry)
* 微积分应用 (Calculus Application)
* 因果推理 (Causal Reasoning)
* 随机过程 (Stochastic Processes)
* 随机事件概率 (Probability of Random Events)
* **Legend:** Located at the top of the chart, the legend identifies each line by model name and color:
* Yi-6B (Light Blue)
* ChatGLM3-6B (Orange)
* LLaMA2-7B (Green)
* DeepSeekMath-7B (Red)
### Detailed Analysis
The chart displays accuracy as a function of problem category. I will describe each line's trend and then extract approximate data points.
* **Yi-6B (Light Blue):** This line fluctuates significantly, starting around 40, peaking around 70, and then dropping to around 20 before rising again.
* 全面提升: ~42
* 数学应用: ~50
* 初中数学: ~65
* 高等数学: ~55
* 微积分: ~45
* 线性代数: ~30
* 概率统计: ~25
* 复分析: ~35
* 多元微积分: ~40
* 一元微积分: ~50
* 几何: ~45
* 微积分应用: ~60
* 因果推理: ~50
* 随机过程: ~30
* 随机事件概率: ~40
* **ChatGLM3-6B (Orange):** This line generally shows higher accuracy than Yi-6B, with peaks around 85 and a more stable performance.
* 全面提升: ~60
* 数学应用: ~70
* 初中数学: ~85
* 高等数学: ~75
* 微积分: ~65
* 线性代数: ~50
* 概率统计: ~40
* 复分析: ~55
* 多元微积分: ~60
* 一元微积分: ~70
* 几何: ~65
* 微积分应用: ~80
* 因果推理: ~70
* 随机过程: ~50
* 随机事件概率: ~60
* **LLaMA2-7B (Green):** This line consistently shows the lowest accuracy, generally below 30, with minimal fluctuation.
* 全面提升: ~10
* 数学应用: ~15
* 初中数学: ~20
* 高等数学: ~15
* 微积分: ~10
* 线性代数: ~10
* 概率统计: ~15
* 复分析: ~20
* 多元微积分: ~15
* 一元微积分: ~20
* 几何: ~15
* 微积分应用: ~25
* 因果推理: ~15
* 随机过程: ~10
* 随机事件概率: ~15
* **DeepSeekMath-7B (Red):** This line exhibits the highest accuracy overall, with peaks exceeding 80 and generally stable performance.
* 全面提升: ~50
* 数学应用: ~75
* 初中数学: ~85
* 高等数学: ~80
* 微积分: ~70
* 线性代数: ~60
* 概率统计: ~50
* 复分析: ~65
* 多元微积分: ~70
* 一元微积分: ~75
* 几何: ~70
* 微积分应用: ~85
* 因果推理: ~75
* 随机过程: ~60
* 随机事件概率: ~70
### Key Observations
* DeepSeekMath-7B consistently outperforms the other models across all problem categories.
* LLaMA2-7B consistently performs the worst.
* ChatGLM3-6B generally performs better than Yi-6B, but with more variability.
* The accuracy scores vary significantly depending on the problem category. "初中数学" (Junior High Math) and "微积分应用" (Calculus Application) seem to be categories where the models achieve higher accuracy.
### Interpretation
The data suggests that DeepSeekMath-7B is the most capable model for solving the presented math problems, while LLaMA2-7B struggles significantly. The varying accuracy across different problem categories indicates that the models' strengths and weaknesses are problem-specific. The higher accuracy on "初中数学" and "微积分应用" might be due to these problems being more common in the training data or being inherently simpler. The chart highlights the importance of model selection based on the specific task and the need for further research to improve the performance of language models on complex math problems. The Chinese labels suggest the evaluation dataset is tailored towards a Chinese-speaking audience or curriculum. The large differences in performance between the models suggest that the architecture and training data play a significant role in mathematical reasoning capabilities.
</details>
<details>
<summary>x29.png Details</summary>
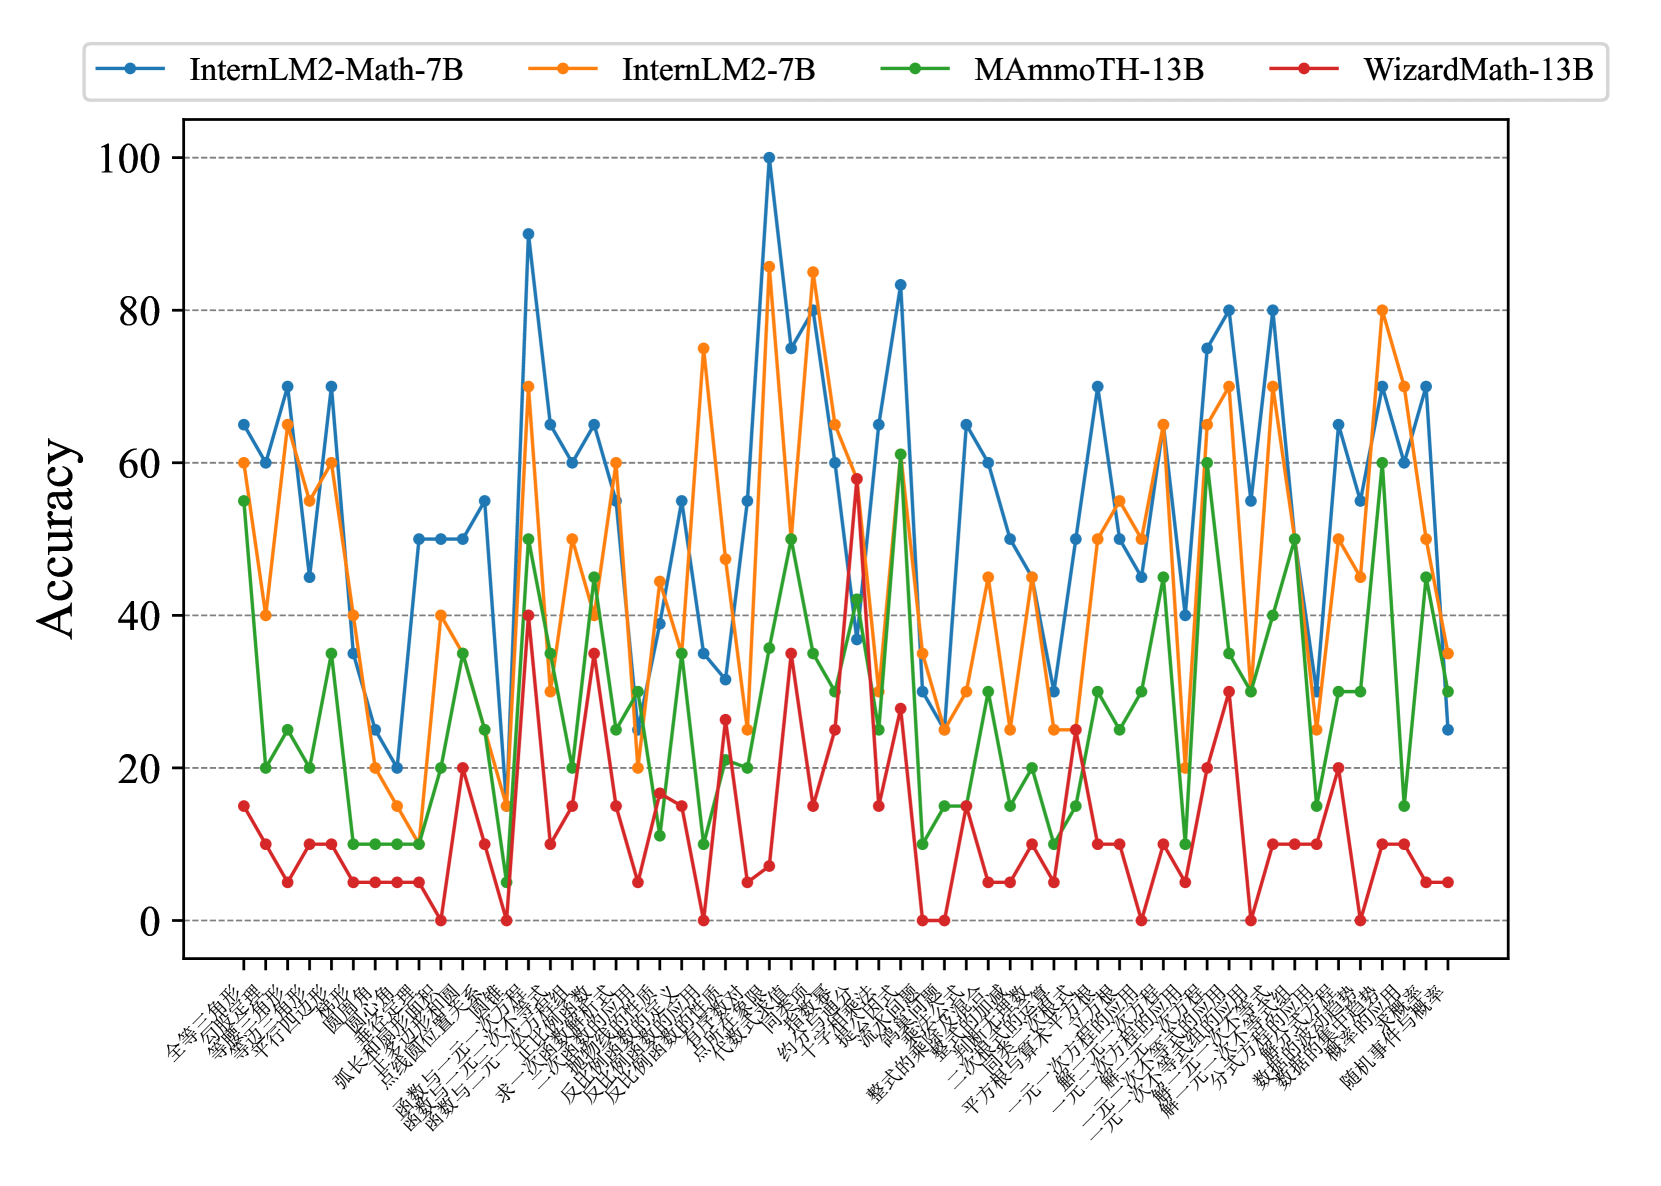
### Visual Description
## Line Chart: Model Accuracy on Math Problems
### Overview
This image presents a line chart comparing the accuracy of four different language models – InternLM2-Math-7B, InternLM2-7B, MAmmoTH-13B, and WizardMath-13B – across a series of math problems. The x-axis represents the math problems (in Chinese), and the y-axis represents the accuracy, ranging from 0 to 100.
### Components/Axes
* **Y-axis Title:** Accuracy
* **X-axis Title:** (Chinese characters representing math problems - see "Detailed Analysis" for approximate translations)
* **Legend:** Located at the top-left of the chart.
* InternLM2-Math-7B (Blue Line)
* InternLM2-7B (Orange Line)
* MAmmoTH-13B (Green Line)
* WizardMath-13B (Red Line)
* **Gridlines:** Horizontal gridlines are present, spaced at 20-unit intervals on the y-axis.
* **Data Range:** Y-axis ranges from approximately 0 to 100.
### Detailed Analysis
The x-axis labels are in Chinese. Approximate translations (based on online resources) are provided below, but may not be perfectly accurate:
1. 全身滑轮组 (Pulley System)
2. 复式杠杆 (Compound Lever)
3. 减速 (Deceleration)
4. 滑轮组 (Pulley System)
5. 功 (Work)
6. 机械效率 (Mechanical Efficiency)
7. 功率 (Power)
8. 简单机械 (Simple Machines)
9. 杠杆原理 (Lever Principle)
10. 浮力 (Buoyancy)
11. 压强 (Pressure)
12. 液体压强 (Liquid Pressure)
13. 密度 (Density)
14. 质量 (Mass)
15. 重力 (Gravity)
16. 速度 (Velocity)
17. 匀速直线运动 (Uniform Linear Motion)
18. 运动和力 (Motion and Force)
19. 牛顿第一定律 (Newton's First Law)
20. 牛顿第二定律 (Newton's Second Law)
21. 牛顿第三定律 (Newton's Third Law)
22. 力的分解 (Force Decomposition)
23. 摩擦力 (Friction)
24. 能量守恒 (Conservation of Energy)
25. 热量 (Heat)
26. 热传递 (Heat Transfer)
27. 蒸发 (Evaporation)
28. 凝固 (Solidification)
29. 熔化 (Melting)
30. 电流 (Current)
31. 电压 (Voltage)
32. 电阻 (Resistance)
33. 电功率 (Electrical Power)
34. 电流的热效应 (Heating Effect of Current)
35. 电磁感应 (Electromagnetic Induction)
36. 电动机 (Electric Motor)
37. 发电机 (Generator)
38. 磁场 (Magnetic Field)
39. 磁铁 (Magnet)
40. 光的反射 (Reflection of Light)
41. 光的折射 (Refraction of Light)
42. 透镜 (Lens)
43. 人眼 (Human Eye)
44. 声音 (Sound)
45. 声音的传播 (Sound Propagation)
46. 振动和波 (Vibration and Waves)
47. 能量转换 (Energy Conversion)
**Data Trends and Values (Approximate):**
* **InternLM2-Math-7B (Blue):** Starts around 65, fluctuates significantly, peaking around 90 at problem 10 (浮力), then generally declines to around 60-70, with some dips below 50. Ends around 70.
* **InternLM2-7B (Orange):** Starts around 40, shows moderate fluctuations, peaking around 60-65 at several points (problems 6, 10, 12, 21), and generally stays between 20 and 60. Ends around 50.
* **MAmmoTH-13B (Green):** Starts around 30, exhibits substantial fluctuations, with a peak around 50-60 at problem 10 (浮力), and generally stays between 20 and 40. Ends around 30.
* **WizardMath-13B (Red):** Starts around 10, shows the most erratic fluctuations, with peaks around 30-40 at several points (problems 6, 10, 12, 21), and frequently dips close to 0. Ends around 10.
### Key Observations
* InternLM2-Math-7B consistently outperforms the other models across most problems.
* WizardMath-13B has the lowest accuracy and the most volatile performance.
* All models show a peak in accuracy around problem 10 (浮力 - Buoyancy), suggesting this type of problem is relatively easier for all models.
* The accuracy of all models fluctuates considerably across different problem types, indicating varying levels of difficulty.
### Interpretation
The chart demonstrates the varying capabilities of different language models in solving math problems. InternLM2-Math-7B appears to be the most proficient, likely due to its specialized training on mathematical tasks. The significant fluctuations in accuracy suggest that the models struggle with certain types of problems, and their performance is highly dependent on the specific mathematical concept being tested. The peak in accuracy for all models on buoyancy problems could indicate that this concept is well-represented in their training data or is inherently simpler to solve. The low and erratic performance of WizardMath-13B suggests it may not be well-suited for mathematical reasoning tasks. The Chinese labels on the x-axis indicate the problems cover a broad range of physics and math topics, from mechanics and thermodynamics to electricity and optics. This data could be used to identify areas where these models need improvement and to guide future research in mathematical reasoning for language models.
</details>
<details>
<summary>x30.png Details</summary>
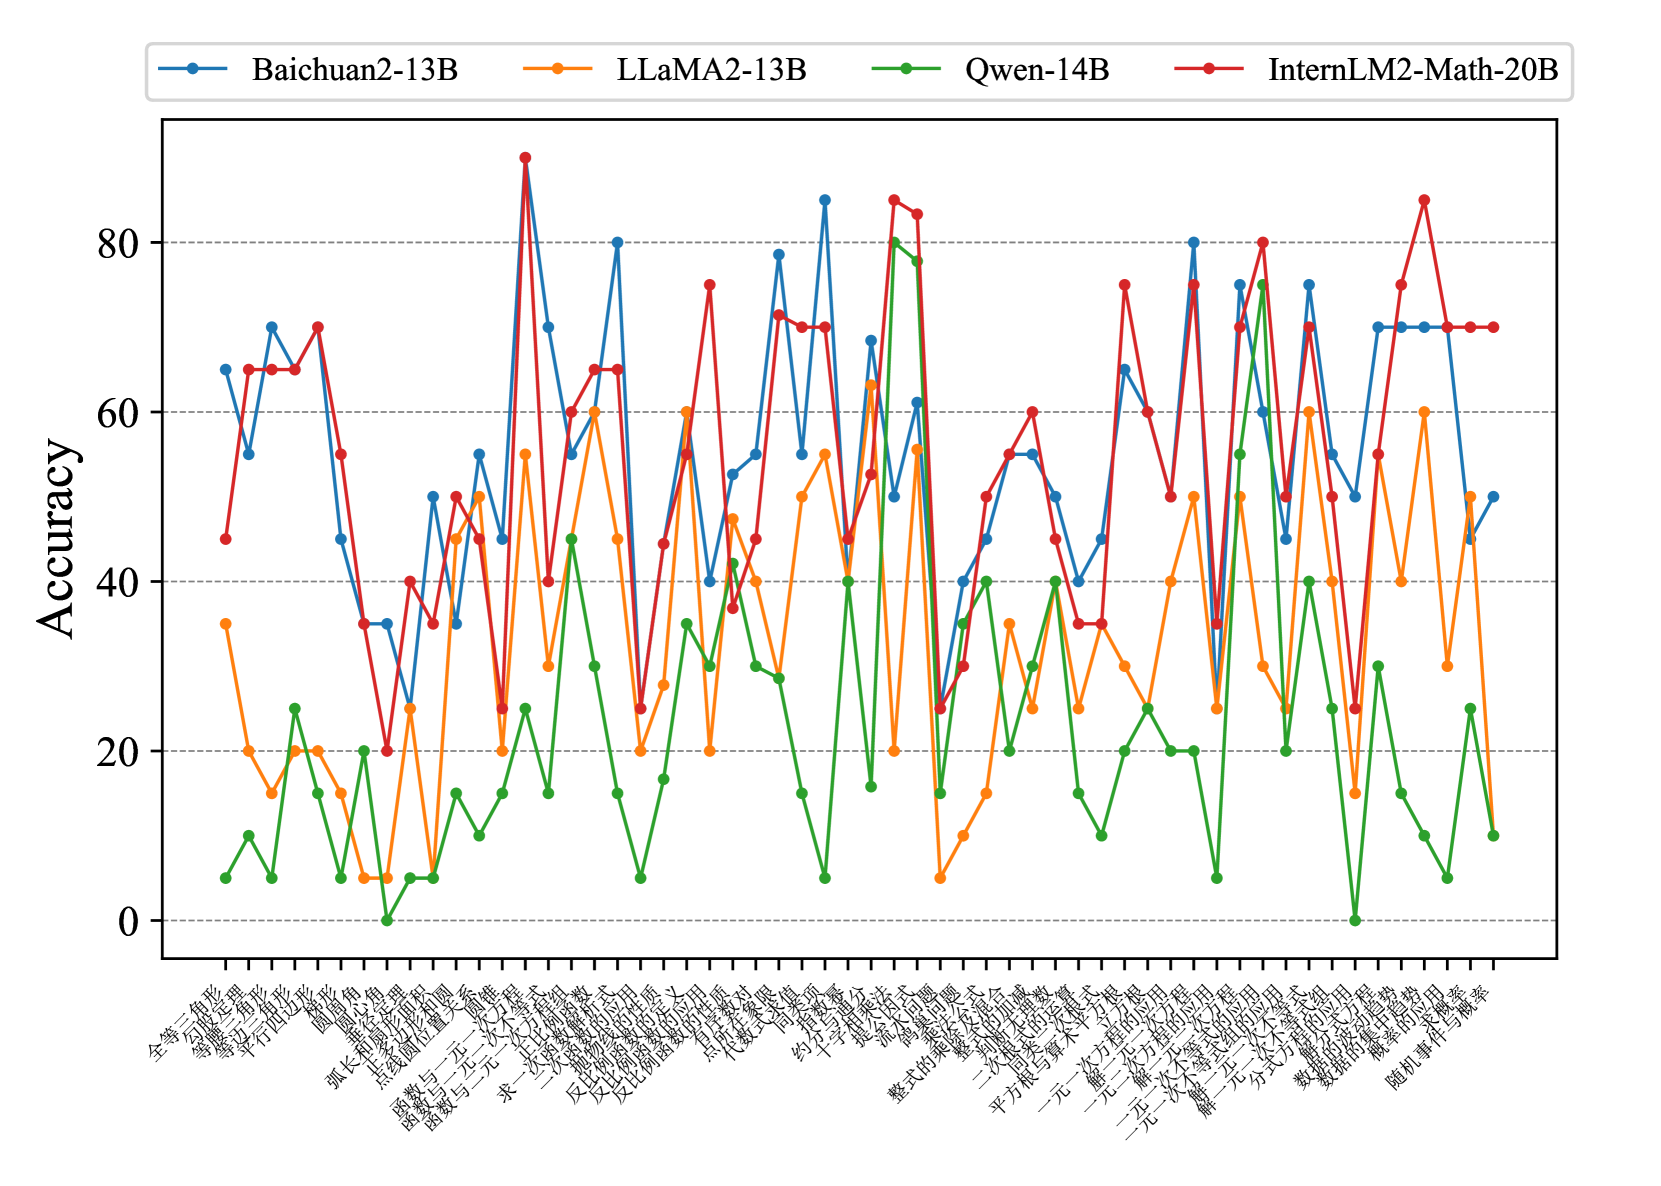
### Visual Description
## Line Chart: Model Accuracy on Various Tasks
### Overview
This image presents a line chart comparing the accuracy of four large language models – Baichuan2-13B, LLaMA2-13B, Qwen-14B, and InternLM2-Math-20B – across a series of tasks. The x-axis represents different tasks, and the y-axis represents the accuracy score, ranging from 0 to 80.
### Components/Axes
* **Y-axis Title:** Accuracy
* **X-axis Title:** (Chinese characters - see Content Details for translation)
* **Legend:** Located at the top of the chart, identifying each line with a color and model name.
* Baichuan2-13B (Blue)
* LLaMA2-13B (Orange)
* Qwen-14B (Green)
* InternLM2-Math-20B (Red)
* **Gridlines:** Vertical gridlines are present to aid in reading values.
### Detailed Analysis
The x-axis labels are in Chinese. Here's a translation of the task names, to the best of my ability:
1. 全部 (All)
2. 写作 (Writing)
3. 翻译 (Translation)
4. 摘要 (Summary)
5. 问答 (Question Answering)
6. 头脑风暴 (Brainstorming)
7. 代码 (Code)
8. 文本分类 (Text Classification)
9. 情感分析 (Sentiment Analysis)
10. 命名实体识别 (Named Entity Recognition)
11. 文本匹配 (Text Matching)
12. 逻辑推理 (Logical Reasoning)
13. 知识问答 (Knowledge Question Answering)
14. 开放域问答 (Open Domain Question Answering)
15. 数学计算 (Mathematical Calculation)
16. 三元组抽取 (Triple Extraction)
17. 文本生成 (Text Generation)
18. 一元多项式求根 (Solving Univariate Polynomials)
19. 几何证明 (Geometric Proof)
20. 数学问题 (Math Problems)
21. 图形推理 (Graphical Reasoning)
22. 物理问答 (Physics Question Answering)
Here's a breakdown of each model's performance, with approximate values:
* **Baichuan2-13B (Blue):** Starts around 68% accuracy, dips to ~30% for 摘要, rises to ~82% for 文本分类, fluctuates between 40-80% for most tasks, and ends around 60% for 图形推理. Generally performs well, with several peaks above 70%.
* **LLaMA2-13B (Orange):** Starts around 65%, dips to ~25% for 摘要, peaks at ~85% for 文本分类, and generally stays between 30-60% for most tasks. Ends around 20% for 图形推理. Shows a strong peak for 文本分类 but is generally lower than Baichuan2-13B.
* **Qwen-14B (Green):** Starts very low at ~5%, rises to ~30% for 写作, fluctuates significantly between 10-40% for most tasks, and ends around 15% for 图形推理. Consistently the lowest performing model.
* **InternLM2-Math-20B (Red):** Starts around 65%, dips to ~30% for 写作, peaks at ~82% for 知识问答, and fluctuates between 40-80% for most tasks. Ends around 80% for 图形推理. Strong performance on mathematical and reasoning tasks.
### Key Observations
* **文本分类** consistently shows the highest accuracy for Baichuan2-13B and LLaMA2-13B, exceeding 80% for both.
* **Qwen-14B** consistently underperforms compared to the other three models across all tasks.
* **InternLM2-Math-20B** excels in tasks related to mathematical reasoning (数学计算, 一元多项式求根, 几何证明, 数学问题, 图形推理).
* The accuracy scores fluctuate considerably across different tasks for all models, indicating varying strengths and weaknesses.
* The "摘要" (Summary) task consistently results in lower accuracy for all models.
### Interpretation
The chart demonstrates a clear performance difference between the four language models. Baichuan2-13B and LLaMA2-13B are generally strong performers, while Qwen-14B lags behind. InternLM2-Math-20B stands out in mathematical and reasoning tasks, suggesting a specialized training focus. The variability in accuracy across tasks highlights the challenges of achieving consistent performance in diverse NLP applications. The low scores on the "摘要" task suggest that summarization remains a difficult problem for these models. The data suggests that model architecture and training data significantly impact performance on specific tasks. The high accuracy on "文本分类" for Baichuan2-13B and LLaMA2-13B could indicate a strong ability to discern patterns in text, while InternLM2-Math-20B's success in mathematical tasks points to a specialized mathematical reasoning capability.
</details>
<details>
<summary>x31.png Details</summary>
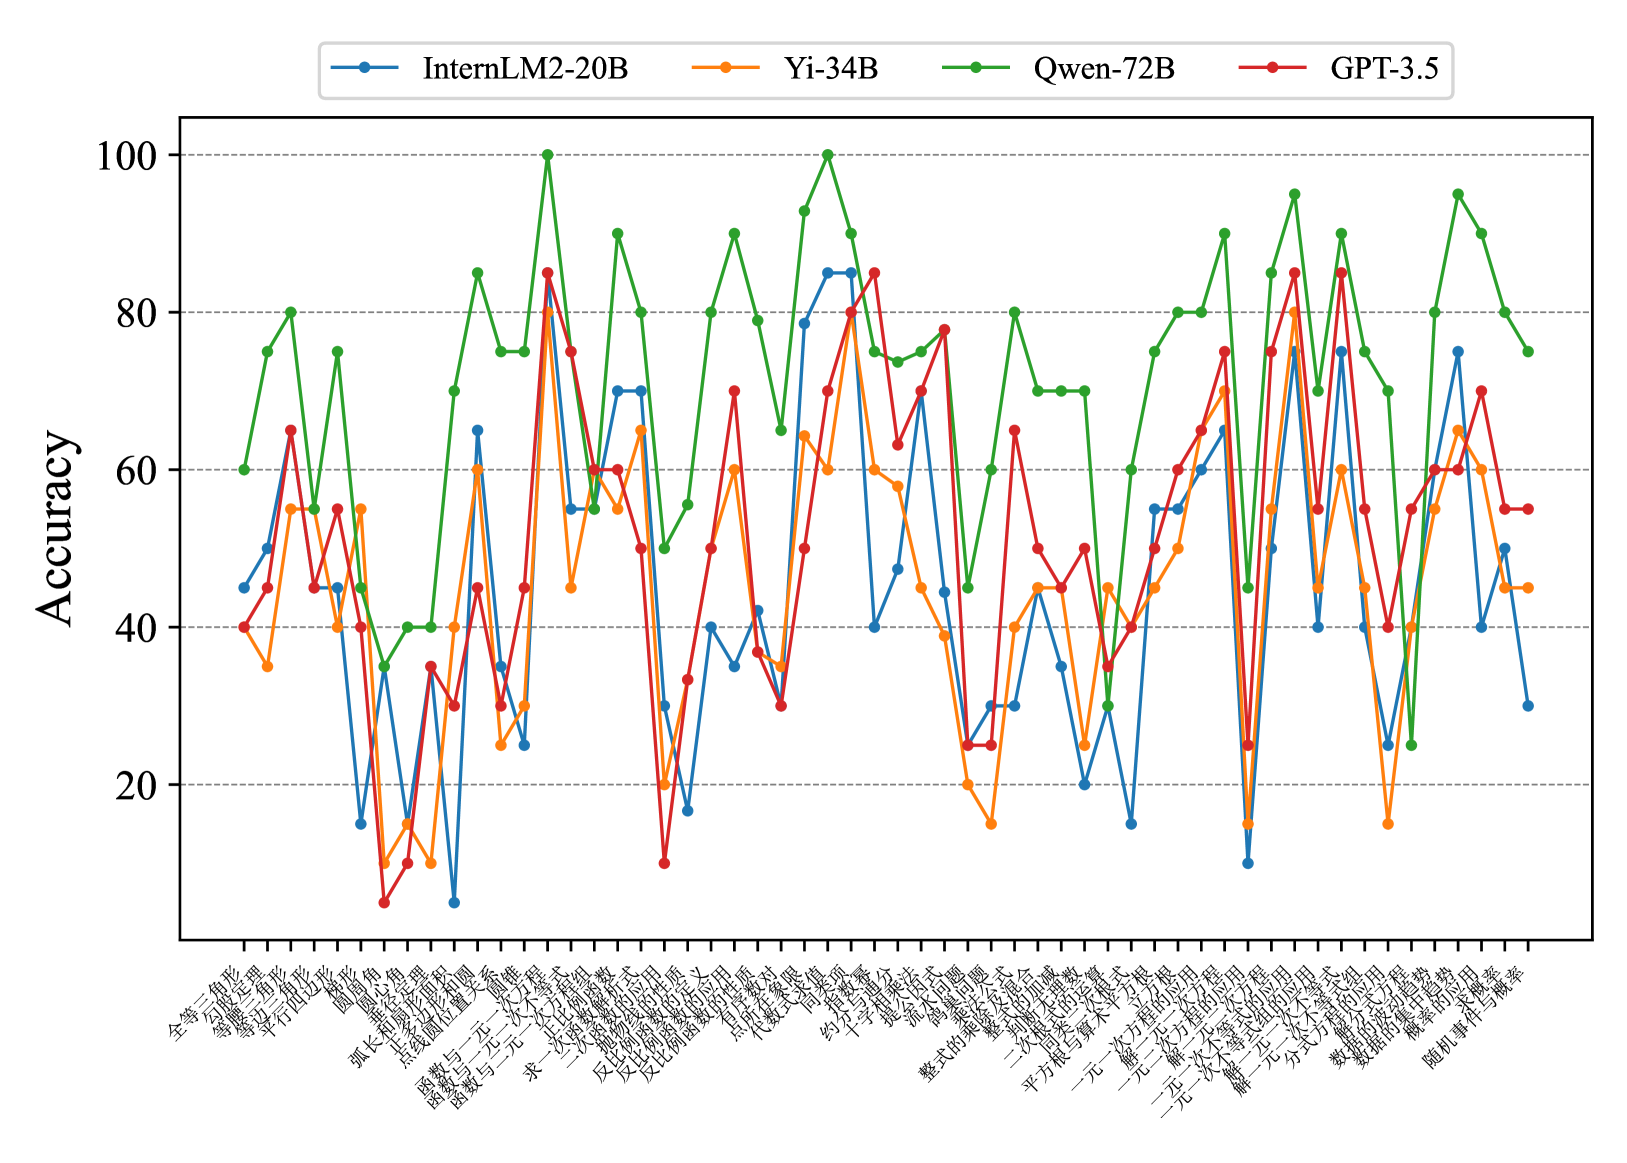
### Visual Description
## Line Chart: Accuracy Comparison of Language Models
### Overview
This line chart compares the accuracy of four language models – InternLM2-20B, Yi-34B, Qwen-72B, and GPT-3.5 – across a series of 35 different tasks or datasets. The y-axis represents accuracy, ranging from 0 to 100, while the x-axis lists the tasks in Chinese characters.
### Components/Axes
* **Y-axis:** "Accuracy" (labeled on the left side, scale from 0 to 100, increments of 10).
* **X-axis:** A series of 35 tasks/datasets labeled in Chinese characters. The labels are densely packed along the bottom of the chart.
* **Legend:** Located at the top-right of the chart, identifying each line with a color and model name:
* Blue: InternLM2-20B
* Yellow: Yi-34B
* Green: Qwen-72B
* Red: GPT-3.5
### Detailed Analysis
The chart displays accuracy as a function of the task. Each line represents a language model's performance across the 35 tasks. I will describe the trends and extract approximate data points for each model.
**InternLM2-20B (Blue Line):** This line exhibits significant fluctuations. It starts at approximately 60, dips to around 10, then rises to a peak of approximately 90 before declining again. The line generally oscillates between 30 and 80.
* Task 1: ~60
* Task 5: ~10
* Task 10: ~40
* Task 15: ~70
* Task 20: ~85
* Task 25: ~60
* Task 30: ~30
* Task 35: ~30
**Yi-34B (Yellow Line):** This line shows a more moderate range of variation. It begins around 40, dips to approximately 20, and reaches a peak of around 85. It generally stays between 30 and 80.
* Task 1: ~40
* Task 5: ~20
* Task 10: ~50
* Task 15: ~65
* Task 20: ~85
* Task 25: ~70
* Task 30: ~40
* Task 35: ~50
**Qwen-72B (Green Line):** This line demonstrates the highest overall accuracy and the most pronounced peaks. It starts around 50, rises to a maximum of approximately 95, and dips to around 30. It generally stays between 40 and 90.
* Task 1: ~50
* Task 5: ~60
* Task 10: ~80
* Task 15: ~90
* Task 20: ~95
* Task 25: ~80
* Task 30: ~60
* Task 35: ~30
**GPT-3.5 (Red Line):** This line exhibits a relatively stable performance, generally staying between 40 and 60. It starts around 45, dips to approximately 25, and reaches a peak of around 65.
* Task 1: ~45
* Task 5: ~25
* Task 10: ~40
* Task 15: ~55
* Task 20: ~65
* Task 25: ~50
* Task 30: ~45
* Task 35: ~55
### Key Observations
* Qwen-72B consistently outperforms the other models, achieving the highest accuracy across most tasks.
* InternLM2-20B shows the most variability in performance, with large swings in accuracy.
* GPT-3.5 exhibits the most stable, but also the lowest, performance.
* Yi-34B falls between InternLM2-20B and Qwen-72B in terms of both average accuracy and variability.
* There are several tasks where all models perform poorly (accuracy below 30).
### Interpretation
The chart suggests that Qwen-72B is the most capable language model among those tested, demonstrating superior performance across a diverse set of tasks. The significant fluctuations in InternLM2-20B's accuracy may indicate sensitivity to specific task characteristics or data distributions. GPT-3.5's stable but lower performance suggests it may be more robust but less adaptable than the other models. The tasks where all models struggle could represent particularly challenging areas for current language models, or areas where the evaluation metrics are not well-aligned with model capabilities. The Chinese labels on the x-axis indicate that the tasks are likely related to Chinese language processing, such as text classification, question answering, or machine translation. Further investigation would be needed to understand the specific nature of each task and the reasons for the observed performance differences. The data suggests a clear hierarchy of performance, with Qwen-72B leading, followed by Yi-34B, then InternLM2-20B, and finally GPT-3.5.
</details>
Figure 16: Concept accuracies on Middle-ZH of more models.
Appendix B Details on the Efficient Fine-Tuning
In this section, we provide the details on the efficient fine-tuning to enhance mathematical reasoning abilities towards specific concepts by first training a concept classifier and then curating a set of samples from a large open-sourced math dataset. Specifically, first, by additionally collecting extra 10 problems per concept, we construct a classifier capable of identifying the concept class of a given question. The backbone of this classifier is a pretrained bilingual LLM (i.e., Baichuan2-13B), where the classification head is operated on its last hidden output feature. Note that the concept classification accuracies in English and Chinese are 92.5 and 86.9, respectively, which indicates that it is reasonable to use an additional classifier for curating an extra concept-related dataset from large-scale math-related data. Note that in our work, we crawl from the OpenWebMath Paster et al. (2023) to produce the concept-related training dataset.
Appendix C Details on the Evaluated Models
In this section, we offer a detailed overview of the Large Language Models (LLMs) and present the corresponding model links in Table 6.
- GPT-3.5/GPT-4 OpenAI (2023): The most powerful closed-model from OpenAI. We utilize its API: gpt-3.5-turbo and gpt-4.
- LLaMa2-7B/13B/70B Touvron et al. (2023b): A set of open-source models developed by Meta.
- Qwen-14B/72B Bai et al. (2023b): This model pre-trained on multilingual data, concentrates on Chinese and English languages. We employ both the Qwen-Base-14B, and the Qwen-Base-72B.
- Baichuan2-13B Baichuan (2023): This model demonstrates impressive performance in both Chinese and English benchmarks.
- MetaMath-13B Megill and Wheeler (2019): A domain-specific language model for mathematical reasoning, fine-tuned from the LLaMA-2 model using the MetaMathQA https://huggingface.co/datasets/meta-math/MetaMathQA dataset.
- WizardMath-13B Luo et al. (2023): Another domain-specific language model for mathematical reasoning, fine-tuned from the LLaMA-2 model using reinforcement learning.
- MAmmoTH-13B Yue et al. (2023): This model is specifically designed for general math problem-solving and has been fine-tuned from the LLaMA model using the MathInstruct https://huggingface.co/datasets/TIGER-Lab/MathInstruct dataset. This dataset features training data that includes both chain-of-thought (CoT) and program-of-thought (PoT) rationales.
- Yi-6B/34B Team (2023b): This model released by 01 shows promising performance results in both Chinese and English.
- ChatGLM3-6B Zeng et al. (2022): a lightweight and high-performance pre-trained dialogue model released by Zhipu AI in both Chinese and English.
- InternLM-7B/20B Team (2023a): A Multilingual Language Model with Progressively Enhanced Capabilities released by InternLM team.
- InternLM-Math-7B/20B Ying et al. (2024): Well-performed math reasoning language models.
- DeepSeekMath-7B Shao et al. (2024): One powerful mathematical language model released by DeepSeek.
| Models | HuggingFace Link / OpenAI Model | |
| --- | --- | --- |
| ChatGLM3 | ChatGLM3-6B | https://huggingface.co/THUDM/chatglm3-6b |
| DeepSeekMath | DeepSeekMath-7B | https://huggingface.co/deepseek-ai/deepseek-math-7b-instruct |
| Baichuan2 | Baichuan2-13B | https://huggingface.co/baichuan-inc/Baichuan2-13B-Chat |
| MetaMath | MetaMath-13B | https://huggingface.co/meta-math/MetaMath-13B-V1.0 |
| WizardMath | WizardMath-13B | https://huggingface.co/WizardLM/WizardMath-13B-V1.0 |
| MAmmoTH | MAmmoTH-13B | https://huggingface.co/TIGER-Lab/MAmmoTH-13B |
| InternLM | InternLM-7B | https://huggingface.co/internlm/internlm2-chat-7b |
| InternLM-20B | https://huggingface.co/internlm/internlm2-chat-20b | |
| InternLM-Math-7B | https://huggingface.co/internlm/internlm2-math-7b | |
| InternLM-Math-20B | https://huggingface.co/internlm/internlm2-math-20b | |
| Yi | Yi-6B | https://huggingface.co/01-ai/Yi-6B-Chat |
| Yi-34B | https://huggingface.co/01-ai/Yi-34B-Chat | |
| LLaMA2 | LLaMA2-7B | https://huggingface.co/meta-llama/Llama-2-7b-chat-hf |
| LLaMA2-13B | https://huggingface.co/meta-llama/Llama-2-13b-chat-hf | |
| LLaMA2-70B | https://huggingface.co/meta-llama/Llama-2-70b-chat | |
| Qwen | Qwen-14B | https://huggingface.co/Qwen/Qwen-14B-Chat |
| Qwen-72B | https://huggingface.co/Qwen/Qwen-72B-Chat | |
| GPT | GPT-3.5 | gpt-3.5-turbo |
| GPT-4 | gpt-4 | |
Table 6: Model links.
Appendix D More Results
As shown in Fig. 9 and Fig. 10, we provide the mean concept accuracies of Elementary-EN and Elementary-ZH of the evaluated models across different concepts.
As shown in Fig. 11 and Fig. 12, we illustrate the concept accuracies on Elementary-EN and Elementary-ZH for different selected models. For the results of all models, please refer to Fig. 13, Fig. 14, Fig. 15 and Fig. 16.
Appendix E Details on 5-shot Prompts
We provide the 5-shot prompts for our ConceptMath in Pages 17-20.
Q: For a party, Oscar gets 4 different kinds of soda. He buys a 6-pack of each kind. At home, he divides the sodas evenly among 3 coolers. How many sodas are in each cooler? A: Oscar buys 4 different kinds of soda, and he gets a 6-pack of each kind. This means that he has 4 * 6 = 24. sodas in total. He divides these 24 sodas evenly among 3 coolers. So number of sodas per cooler is 24 / 3 = 8. Therefore, the answer is 8. Q: Amazing Animals Zoo is building a new home for its 8 zebras. Each zebra will get 2 acres of grassy land to roam around in. The zebras will have a pond that covers 1 acre. How big will the zebras’ new home be? A: The total required grassland area for the zebras is: 8 zebras * 2 acres per zebra = 16 acres. Then, we need to add the extra 1 acre for the pond: 16 acres (for the zebras) + 1 acre (for the pond) = 17 acres. Therefore, the answer is 17. Q: The state taxes personal income exceeding 3500 yuan (this portion not to exceed 3500 yuan) at a rate of 3%. If Xiaoming’s father’s monthly salary is 4700 yuan, how much personal income tax should Xiaoming’s father pay each month? A: To calculate the amount of personal income tax Xiaoming’s father should pay, we can follow this simple process:Subtract the tax-free threshold from the monthly salary. Taxable income = Monthly salary - Tax-free threshold = 4700 - 3500 = 1200 yuan. Apply the tax rate to the amount that exceeds the threshold. Tax owed = Taxable income $*$ Tax rate = 1200 * 3% = 36 yuan. Therefore, the answer is 36. Q: Find the 10th term in the arithmetic sequence where the first term is 3 and the common difference is 4. A: To find the nth term in an arithmetic sequence, we can use the formula: $a_{n}=a_{1}+(n-1)*d$ , where: $a_{n}$ is the $n$ th term, $a_{1}$ is the first term, d is the common difference, n is the term number. Given that the first term ( $a_{1}$ ) is 3 and the common difference (d) is 4, we can find the $10$ th term ( $a_{10}$ ) by plugging these values into the formula: $a_{10}=a_{1}+(10-1)*d=3+9*4=3+36=39$ . Therefore, the answer is 39. Q: A regular polygon has an interior angle of 156 degrees. How many sides does the polygon have? A: To find the number of sides of a regular polygon with a given interior angle, we can use the formula: Interior Angle = [(n - 2) * 180] / n, where n is the number of sides. Given that interior angle is 156: 156 = [(n - 2) * 180] / n. Solve for n, so we get n = 15. Therefore, the answer is 15.
Q: $g(x)=x^{2}$ , $f(x)=3(x-2)^{2}$ , $h(x)=g(x)-f(x)$ , $y=h(23)$ , give me the value of $y$ . A: First, calculate $g(23)$ and $f(23)$ : $g(23)=23^{2}=529$ . Next, calculate $f(23)$ : $f(23)=3*(23-2)^{2}=3*(21)^{2}=3*441=1323$ . Now, we calculate $h(23)$ : $h(23)=g(23)-f(23)=529-1323=-794$ . Therefore, the answer is -794. Q: What is the slope of the line segment between the two points: (3,1), (5,2)? A: The slope of a line between two points $(x_{1},y_{1})$ and $(x_{2},y_{2})$ can be found using the formula: $slope(m)=(y_{2}-y_{1})/(x_{2}-x_{1})$ . Given the two points (3, 1) and (5, 2), we can substitute these values into the formula: $slope(m)=(2-1)/(5-3)=1/2=0.5$ . Therefore, the answer is 1/2. Q: In a party, there are 5 cupcakes remaining and 10 children. A mother inserts 10 pieces of paper into a hat, 5 with a cupcake image and 5 without. The children who draw the cupcake paper will receive a cupcake. If the first child draws a paper with a cupcake image, what is the probability that the second child will also draw a cupcake paper? A: Initially, there are 5 cupcake papers and 5 non-cupcake papers in the hat, making a total of 10 papers. After the first child draws a cupcake paper, there are 4 cupcake papers and 5 non-cupcake papers left in the hat, with a total of 9 papers. The probability that the second child will draw a cupcake paper is then the number of cupcake papers left divided by the total number of papers left: Probability = Number of cupcake papers left / Total number of papers left = 4/9. Therefore, the answer is 4/9. Q: What is the total area of an irregular polygon that consists of two squares and two rectangles where the sides of the squares are 12 cm and 16 cm respectively, and the dimensions of the rectangles are 13 cm by 20 cm and 10 cm by 7 cm respectively? A: To find the total area of an irregular polygon consisting of two squares and two rectangles, you would sum up the individual areas of each shape. The area of a square is given by the formula $A=s^{2}$ , where s is the length of a side of the square. For the first square with a side of 12 cm: $A_{1}=12^{2}=144cm^{2}$ . For the second square with a side of 16 cm: $A_{2}=16^{2}=256cm^{2}$ . The area of a rectangle is given by the formula ( $A=l*w$ ), where $l$ is the length and $w$ is the width of the rectangle. For the first rectangle with dimensions 13 cm by 20 cm: $A_{3}=13*20=260cm^{2}$ For the second rectangle with dimensions 10 cm by 7 cm: $A_{4}=10*7=70cm^{2}$ $TotaArea=A_{1}+A_{2}+A_{3}+A_{4}=144+256+260+70=730cm^{2}$ Therefore, the answer is 730. Q: Susie is making invitations to her party this coming weekend. It takes her about 5 minutes to make each invitation. It took her 2 hours to finish all the invitations. How many people is Susie inviting? A: First, convert the 2 hours into minutes to match the unit of time used for the invitation-making process. 2 hours = 120 minutes. Then, divide the total time spent by the time it takes to make one invitation to find out how many invitations she made: 120 minutes total / 5 minutes per invitation = 24 invitations Therefore, the answer is 24.
Q: 小文用量角器测量一个角的度数时,误把外圈刻度看成了内圈刻度,量出的角是 $65°$ ,这 个角实际是多少度? A: 量角器一般有两个圈的刻度,内圈刻度通常是顺时针方向从0度到180度,外圈刻度通常是逆 时针方向从0度到180度。如果小文误把外圈刻度看成了内圈刻度,那么测量出的角度其实是 从180°减去错误读数。因此,实际的角度应该是:180° - 65° = 115°。 因此,答案是115。 Q: 小明以每小时2千米的速度上山,到了山顶后立即以每小时3千米的速度按原路返回。求小明 上下山的平均速度是多少千米? A: 要计算小明上下山的平均速度,我们需要知道他上山和下山所走的总距离以及总时间。 首先,总距离 = 上山距离+下山距离=d+d= 2d千米。 然后,计算总时间:上山时间 = 上山距离/上山速度 = d/2小时,下山时间 = 下山距离/下山速度 = d/3小时,因此,总时间=上山时间+下山时间 = d/2 + d/3小时。 最后,计算平均速度:平均速度=总距离 / 总时间 = 2d/(d/2+d/3)=2d/(5d/6) = 12/5 = 2.4千米/小时。 因此,答案是2.4千米/小时。 Q: 一个礼盒长20cm、宽15cm、高10cm,用彩带捆扎这样的一个礼盒,至少需要多长的彩带?(接头处12厘米) A: 要捆扎这样一个礼盒,通常情况下我们会沿着礼盒的长和宽方向各绕一圈,即绕过礼盒的长和宽两次,然后再留一些长度作为接头。 首先,计算沿着礼盒的长方向绕一圈的长度:绕长方向长度 = (礼盒的长 + 礼盒的高)* 2 = (20 + 10)* 2 = 30 * 2 = 60 cm 然后,计算沿着礼盒的宽方向绕一圈的长度:绕宽方向长度 = (礼盒的宽 + 礼盒的高)* 2 = (15 + 10)* 2 = 25 * 2 = 50 cm 最后,计算总需要彩带长度:总长度 = 绕长方向长度 + 绕宽方向长度 + 接头长度 = 60 + 50 + 12 = 122 cm 因此,答案是122厘米。 Q: 千岛湖大桥的一侧每隔10米安装1盏灯,共需91盏(两端都装),现在改装61盏(两端都装),平均每相邻两盏灯之间的距离是多少米? A: 原来每隔10米安装1盏灯,共需91盏,这意味着桥的总长度覆盖了90个10米的间隔,所以桥的总长度 = 90间隔 * 10米/间隔 = 900米。 现在改装61盏灯(两端都装),也就是说将这900米分成60个间隔(因为61个灯包含了两端的灯,所以间隔数比灯的数量少一个),每个间隔的长度 = 900米 / 60间隔 = 15米/间隔。 因此,答案是115米。 Q: a是b的3/4,则a比b少( ),b比a多( ),b与a的比是( ),如果a、b两数的和是210,则a=( ),b=( ),括号处分别为多少? A: 已知a是b的3/4,则a = 3/4 * b。因此,a比b少 (1-3/4)/1 = 1/4,b比a多(1-3/4)/(3/4) = 1/3,b与a的比为b : (3/4 * b) = 4:3 若已知a、b两数的和是210,则a+b = 210,将a = (3/4) * b 代入方程得到:3/4 * b + b = 210,解得b = 120,a = 3/4 * b = 3/4 * 120 = 90 因此,答案分别是 1/4,1/3,4:3,90,120。
Q: 求不等式 $-x^{2}-2x+8>0$ 的解集? A: $-x^{2}-2x+8>0$ , 通过分解因式方式,得到 $-(x-2)(x+4)>0$ 因此,答案是 (-4, 2)。 Q: 已知函数 $y=2x+3$ 与的图象 $y=-1/2x+m$ 交y轴于点A、B,两函数图象的交点为P(n,-2),求m和n的值? A: 两函数图像交点为P(n,-2),意味着这个点同时满足上述两个函数方程: 将P点的坐标(n,-2)代入函数 $y=3x+3$ ,即 $-2=3n+3$ ,解得 $n=-5/2$ 。 将P点坐标(-5/2,-2)代入函数 $y=-1/2x+m$ ,即 $-2=-1/2*(-5/2)+m$ ,解得m=-13/4。 因此,答案是m为-13/4,n为-5/2。 Q: 已知PA是圆O的切线,A为切点,PC与圆O相交于B、C两点,PB=2cm,BC=8cm,则PA的长是多少厘米? A: 由于PA是圆O的切线,根据切割线定理,我们知道从圆外一点引圆的两条割线,这一点到每条割线与圆的交点的两条线段长的积相等,即 $PA^{2}=PC*PB$ , 已知PB=2cm、BC=8cm,则 $PC=PB+BC=2cm+8cm=10cm$ 。 $PA^{2}=PC*PB=10*2=20$ ,解得PA = 2 $\sqrt{5}$ cm。 因此,答案是2 $\sqrt{5}$ 厘米。 Q: 南宋著名数学家杨辉精研数学,著有《详解九章算法》,对数的运算进行了深入研究与总结,类比其中的思想方法,可以解决很多数与式的计算问题已知a,b为实数,且 $a+b=3,ab=1$ ,计算可得: $a^{2}+b^{2}=7$ , $a^{3}+b^{3}=18$ , $a^{4}+b^{4}=47$ ,由此求 $a^{5}+b^{5}$ 得多少? A: 已知 $a+b=3$ 和 $ab=1$ ,可得: $a^{2}+b^{2}=(a+b)^{2}-2ab=3^{2}-2*1=9-2=7a^{3}+b^{3}=(a+b)(a^{2}-ab+b^{2})=3(7%
-1)=3*6=18a^{4}+b^{4}=(a^{2}+b^{2})^{2}-2a^{2}b^{2}=7^{2}-2*1^{2}=49-2=47a^{5}%
+b^{5}=(a+b)(a^{4}-a^{3}b+a^{2}b^{2}-ab^{3}+b^{4})=3(a^{4}+b^{4}-a^{2}b^{2})=3%
(47-1)=3*46=138$ 。 因此,答案是138。 Q: 某单位要招聘1名英语翻译,甲、乙两人报名参加了听、说、读、写等项素质测试,甲的成绩分别为:90分、80分、85分、78分;乙的成绩分别为:78分、82分、85分、88分.如果把听、说、读、写的成绩按 $2:2:3:3$ 计算素质测试平均成绩,那么甲和乙的平均成绩分别是多少? A: 甲的平均成绩为 $(90*2+80*2+85*3+78*3)/(2+2+3+3)=(180+160+255+234)/10=829/10=82.9$ 分,乙的平均成绩为 $(78*2+82*2+85*3+88*3)/(2+2+3+3)=(156+164+255+264)/10=839/10=83.9$ 分。 因此,答案是甲的平均成绩是82.9分,乙的平均成绩是83.9分。
| LEVEL1 | LEVEL2 | LEVEL3 | # Samples |
| --- | --- | --- | --- |
| Calculation & Properties | Calculation | Add | 19 |
| Decimals | 20 | | |
| Division | 19 | | |
| Equations | 18 | | |
| Fractions | 16 | | |
| Mixed Operations | 18 | | |
| Multiple | 18 | | |
| Numerical Expressions | 20 | | |
| Place Value | 16 | | |
| Powers | 20 | | |
| Rational Number | 17 | | |
| Subtraction | 19 | | |
| Variable Expressions | 19 | | |
| Properties | Compare | 20 | |
| Count | 18 | | |
| Estimation & Rounding | 20 | | |
| Patterns | 19 | | |
| Geometry | Angles | 17 | |
| Coordinate Plane | Coordinate Plane | 18 | |
| Three-dimensional Shapes | Cones | 17 | |
| Cubes | 20 | | |
| Cylinders | 17 | | |
| Spheres | 17 | | |
| Volume of 3D shapes | 18 | | |
| Two-dimensional Shapes | Circles | 17 | |
| Perimeter | 19 | | |
| Polygons | 18 | | |
| Quadrilaterals | 17 | | |
| Triangles | 18 | | |
| Measurement | Basic Knowledge | Temperature | 19 |
| Time | 20 | | |
| Money | Coin Names & Value | 17 | |
| Exchanging Money | 17 | | |
| Ratio | Percent | 17 | |
| Proportion | 18 | | |
| Ratio | 19 | | |
| Size | Area | 19 | |
| Length | 20 | | |
| Volume | 20 | | |
| Weight | Light & Heavy | 20 | |
| Statistics | Classifying & Sorting | Classifying & Sorting | 17 |
| Data | Mode/Mean/Median/Range | 19 | |
| Probability | Probability | 16 | |
Table 7: Details of the hierarchical concepts in Elementary-EN.
| LEVEL1 | LEVEL2 | LEVEL3 | # Samples |
| --- | --- | --- | --- |
| Calculation | Basic Calculation | Add & Subtract | 20 |
| Decimals | 19 | | |
| Divide | 19 | | |
| Exponents & Scientific Notation | 16 | | |
| Fractions & Decimals | 18 | | |
| Multiply | 18 | | |
| Square Roots & Cube Roots | 20 | | |
| Consumer Math | Consumer Math | 18 | |
| Financial Literacy | Financial Literacy | 19 | |
| Integers | Absolute Value | 18 | |
| Opposite Integers | 20 | | |
| Measurement | Measurement Metric | 19 | |
| Number Theory | Factors | 20 | |
| Prime Factorization | 19 | | |
| Prime or Composite | 18 | | |
| Percents | Percents | 20 | |
| Rational & Irrational Numbers | Rational & Irrational Numbers | 18 | |
| Ratios & Rates | Proportional Relationships | 18 | |
| Sequences | Arithmetic Sequences | 19 | |
| Geometric Sequences | 18 | | |
| Expressions, equations, and functions | Equations | Linear Equations | 20 |
| Systems of Equations | 18 | | |
| Expressions | Equivalent Expressions | 20 | |
| Radical | 17 | | |
| Variable | 18 | | |
| Function | Domain & Range of Functions | 18 | |
| Interpret Functions | 19 | | |
| Linear Functions | 20 | | |
| Nonlinear Functions | 18 | | |
| Inequalities | Inequalities | 19 | |
| Geometry | Congruence & Similarity | Congruence & Similarity | 19 |
| Coordinate Plane | Axes | 17 | |
| Distance Between Two Points | 19 | | |
| Quadrants | 16 | | |
| Scale Drawings | Scale Drawings | 16 | |
| Slope | Slope | 20 | |
| Three-dimensional Figures | Polyhedra | 19 | |
| Surface Area & Volume | 17 | | |
| Transformations | Transformations | 18 | |
| Two-dimensional Figures | Circle | 20 | |
| Lines & Angles | 18 | | |
| Perimeter & Area | 20 | | |
| Polygons | 18 | | |
| Square | 18 | | |
| Trapezoids | 16 | | |
| Triangle | 18 | | |
| Statistic and Probability | Data | Center & Variability | 18 |
| Mean, Median, Mode & Range | 19 | | |
| Outlier | 20 | | |
| One-variable Statistics | One-variable Statistics | 19 | |
| Probability | Counting Principle | 16 | |
| Independent & Dependent Events | 16 | | |
| Make Predictions | 17 | | |
| Probability of Compound Events | 16 | | |
| Probability of One Event | 17 | | |
| Probability of Simple and Opposite Events | 19 | | |
| Two-variable Statistics | Two-variable Statistics | 18 | |
Table 8: Details of the hierarchical concepts in Middle-EN.
<details>
<summary>x32.png Details</summary>

### Visual Description
## Table: Mathematics Problem Categorization
### Overview
The image presents a table categorizing mathematics problems across three levels of difficulty (Level 1, Level 2, Level 3) and four main areas of mathematics: Geometry, Application, Measurement and Statistics, and Number and Algebra. Each category lists specific problem types, along with the number of problems associated with that type ("# Samples"). The table is primarily in Chinese, with some mathematical terms appearing in English.
### Components/Axes
The table has a hierarchical structure:
* **Columns:** Level 1, Level 2, Level 3, # Samples
* **Rows:** Represent the main mathematical areas (Geometry, Application, Measurement and Statistics, Number and Algebra) and their sub-categories.
* **Language:** Primarily Chinese, with some English terms (e.g., "Triangles", "Circle", "Statistics").
### Detailed Analysis or Content Details
Here's a transcription and translation of the table content, organized by the main mathematical areas:
**1. 几何 (Jǐhé) - Geometry**
| Level 1 | Level 2 | Level 3 | # Samples |
|---|---|---|---|
| 平面图形 (Píngmiàn túxíng) - Two-dimensional shapes | 三角形 (Sānjiǎoxíng) - Triangles | 平行四边形 (Píngxíng sìbiānxíng) - Parallelogram | 20 |
| | 圆 (Yuán) - Circle | 正方形 (Zhèngfāngxíng) - Square | 20 |
| | | 平面图形综合 (Píngmiàn túxíng zònghé) - Synthesis Problem | 20 |
| | | 角 (Jiǎo) - Angle | 20 |
| | | 长方形 (Chángfāngxíng) - Rectangle | 20 |
| 立体图形 (Lìtǐ túxíng) - Three-dimensional shapes | 圆柱 (Yuánzhù) - Cylinder | 正方体 (Zhèngfāngtǐ) - Cube | 20 |
| | | 立体图形综合问题 (Lìtǐ túxíng zònghé wèntí) - Synthesis Problem | 20 |
| | | 长方体 (Chángfāngtǐ) - Cuboid | 20 |
**2. 应用 (Yìngyòng) - Application**
| Level 1 | Level 2 | Level 3 | # Samples |
|---|---|---|---|
| 基础 (Jīchǔ) - Fundamental Problem | 利息问题 (Lìxì wèntí) - Interest | | 20 |
| | 周期问题 (Zhōuqí wèntí) - Period | | 10 |
| | 对折问题 (Duìzhé wèntí) - Folding | | 20 |
| | 工程问题 (Gōngchéng wèntí) - Engineering | | 20 |
| | 年龄问题 (Niánlíng wèntí) - Age | | 20 |
| 经典问题 (Jīngdiǎn wèntí) - Classical Problem | 折算问题 (Zhésuàn wèntí) - Discount | | 20 |
| | 植树问题 (Zhíshù wèntí) - Planting | | 15 |
| | 税率问题 (Shuìlǜ wèntí) - Tax | | 20 |
| | 还原问题 (Huányuán wèntí) - Reduction | | 20 |
| | 鸡兔同笼问题 (Jī tù tóng lóng wèntí) - Chickens & Rabbits in the Same Cage | | 20 |
| 路程问题 (Lùchéng wèntí) - Distance Problem | 相遇问题 (Xiāngyù wèntí) - Encounter | | 20 |
| | 行程问题 (Xíngchéng wèntí) - Travel | | 20 |
| | 追击问题 (Zhuījī wèntí) - Pursuit | | 20 |
**3. 测量与统计 (Cèliáng yǔ tǒngjì) - Measurement and Statistics**
| Level 1 | Level 2 | Level 3 | # Samples |
|---|---|---|---|
| 度量 (Dùliàng) - Measurement | 人民币问题 (Rénmínbì wèntí) - RMB | | 9 |
| | 时间问题 (Shíjiān wèntí) - Time | | 20 |
| | 浓度问题 (Nóngdù wèntí) - Concentration | | 17 |
| | 温度问题 (Wēndù wèntí) - Temperature | | 6 |
| | 面积问题 (Miànjī wèntí) - Area | | 20 |
| 统计 (Tǒngjì) - Statistics | 排列组合 (Páiliè zǔhé) - Permutation | | 20 |
| | 统计指标 (Tǒngjì zhǐbiāo) - Statistical Metrics | | 18 |
| | 规律 (Guīlǜ) - Law | | 20 |
**4. 数与代数 (Shù yǔ dàishù) - Number and Algebra**
| Level 1 | Level 2 | Level 3 | # Samples |
|---|---|---|---|
| 分数运算 (Fēnshù yùnsuàn) - Fractional Operation | 分数与小数 (Fēnshù yǔ xiǎoshù) - Fraction & Decimal | | 20 |
| | 分数应用 (Fēnshù yìngyòng) - Fractional Application | | 16 |
| | 整数运算 (Zhěngshù yùnsuàn) - Integer Operation | | 17 |
| 整数与倍数 (Zhěngshù yǔ bèishù) - Integer & Multiples | 公约数与公倍数 (Gōngyuēshù yǔ gōngbèishù) - Common Divisor & Multiple | | 20 |
| | 质数与合数 (Zhìshù yǔ héshù) - Prime & Composite | | 20 |
| 比例 (Bǐlì) - Ratio | 比例应用 (Bǐlì yìngyòng) - Ratio Application | | 20 |
| | 黄金分割 (Huángjīn fēngē) - Golden Section | | 15 |
| 方程 (Fāngchéng) - Equation | 一元一次方程 (Yī yuán yīcì fāngchéng) - Linear Equation | | 21 |
| | 二元一次方程 (Èr yuán yīcì fāngchéng) - Two Variable Linear Equation | | 20 |
| | 比例方程 (Bǐlì fāngchéng) - Proportion Equation | | 20 |
### Key Observations
* The number of problems ("# Samples") varies significantly across categories, ranging from 6 to 21.
* Level 3 problems generally have fewer specific sub-categories listed, suggesting they are more complex or encompass a broader range of problem types.
* The table provides a structured overview of common math problem types, potentially useful for curriculum design or test preparation.
* The distribution of problems across levels appears relatively even within each main mathematical area.
### Interpretation
This table serves as a categorization scheme for mathematics problems, likely intended for educational purposes. It demonstrates a hierarchical organization, breaking down mathematics into four core areas and then further classifying problems by difficulty level. The "# Samples" column suggests the relative frequency or importance of each problem type within the curriculum. The inclusion of both Chinese and English terms indicates a potential bilingual context or an effort to standardize terminology. The table's structure allows for a clear understanding of the scope and depth of mathematical concepts covered, and could be used to assess student learning or identify areas for curriculum improvement. The varying number of samples per category might reflect the complexity of the topic or the emphasis placed on it within the educational system.
</details>
Figure 17: Details of the hierarchical concepts in Elementary-ZH.
| LEVEL1 | LEVEL2 | LEVEL3 | # Samples |
| --- | --- | --- | --- |
| 几何 (Geometry) | 三角形(Triangle) | 全等三角形(Congruent Triangle) | 20 |
| 勾股定理(Pythagorean Theorem) | 20 | | |
| 等腰三角形(Isosceles Triangle) | 20 | | |
| 等边三角形(Equilateral Triangle) | 20 | | |
| 四边形(Quadrilateral) | 平行四边形(Parallelogram) | 20 | |
| 梯形(Trapezium) | 20 | | |
| 圆(Circle) | 圆周角(Angle of Circumference) | 20 | |
| 圆心角(Angle of Center) | 20 | | |
| 垂径定理(Vertical Path Theorem) | 20 | | |
| 弧长和扇形面积(Arc length & Sector Area) | 20 | | |
| 正多边形和圆(Regular Polygons & Circles) | 20 | | |
| 点线圆位置关系(Relations of Point, Line & Circle) | 20 | | |
| 立体图形 (Three-dimensional Shapes) | 圆锥(Cone) | 20 | |
| 函数 (Function) | 一次函数(Linear Function) | 函数与一元一次方程 (Univariate Function & Equation) | 20 |
| 函数与一元一次不等式 (Linear Functions & Univariate Linear Inequalities) | 20 | | |
| 一次函数与二元一次方程组 (Linear Functions & System of Binary Linear Equations) | 20 | | |
| 正比例函数(Proportional Function) | 20 | | |
| 一次函数解析式 (Analytical Formula of Linear Functions ) | 20 | | |
| 二次函数(Quadratic Function) | 二次函数的应用 (Applications of Quadratic Functions) | 20 | |
| 抛物线的性质 (Properties of Parabolas) | 18 | | |
| 反比例函数 (Inverse Proportional Function) | 定义(Definition) | 20 | |
| 应用(Applications) | 20 | | |
| 性质(Properties) | 19 | | |
| 平面直角坐标系 (Rectangular Coordinate System) | 有序数对(Ordered Pair) | 20 | |
| 象限中的点(Points of Quadrant) | 14 | | |
| 数与式 (Number and Expression) | 代数式(Algebra Expression) | 代数式求值(Algebraic Expression Evaluation) | 20 |
| 同类项(Similar Items) | 20 | | |
| 分式(Fraction) | 指数幂(Exponential Power) | 20 | |
| 约分(Fraction Reduction) | 19 | | |
| 因式(Factor) | 十字相乘法(Cross Multiplication) | 20 | |
| 公因式提取(Common Factor Extraction) | 18 | | |
| 应用(Application) | 流水问题(Flow Problem) | 20 | |
| 鸽巢问题(Pigeon Nest Problem) | 20 | | |
| 整式(Integral Expression) | 乘法公式(Multiplication) | 20 | |
| 整式的乘除及混合(Multiplication, Division & Mixing) | 20 | | |
| 整式的加减(Addition & Subtraction) | 20 | | |
| 无理数(Irrational Number) | 无理数识别(Irrational Number Recognition) | 20 | |
| 根式(Radical Expression) | 二次根式的运算(Operation of Quadratic Radicals) | 20 | |
| 同类二次根式(Similar Quadratic Radicals) | 20 | | |
| 平方根与算术平方根(Square Root & Arithmetic Square Root) | 20 | | |
| 立方根(Cube Root) | 20 | | |
| 方程与不等式 (Equations & Inequalities) | 一元一次方程 (Linear Equation in One Variable) | 一元一次方程的应用(Applications) | 20 |
| 解一元一次方程(Solutions) | 20 | | |
| 一元二次方程 (Quadratic Equation in One Variable) | 一元二次方程的应用(Applications) | 20 | |
| 解一元二次方程(Solutions) | 20 | | |
| 不等式与不等式组 (Inequalities & Groups of Inequalities) | 一元一次不等式的应用 (Applications of Unary First Order Inequality) | 20 | |
| 一元一次不等式组的应用(Applications of Unary First Order Groups of Inequalities) | 20 | | |
| 解一元一次不等式(Solve the First Inequality of One Variable) | 20 | | |
| 解一元一次不等式组(Solve Unary First Order Groups of Inequalities) | 20 | | |
| 分式方程(Fractional Equation) | 分式方程的应用(Application of Fractional Equation) | 20 | |
| 解分式方程(Solve Fractional Equation) | 20 | | |
| 统计与概率 (Statistics and Probability) | 数据分析(Data Analysis) | 数据的波动趋势(Fluctuating Trend of Data) | 20 |
| 数据的集中趋势(Central Tendency of Data) | 20 | | |
| 概率(Probability) | 概率的应用(Applications of Probability) | 20 | |
| 求概率(Find Probability) | 20 | | |
| 随机事件与概率(Random Events & Probabilities) | 20 | | |
Table 9: Details of the hierarchical concepts in Middle-ZH.