# Enhancing Chain of Thought Prompting in Large Language Models via Reasoning Patterns
**Authors**: Yufeng Zhang, Xuepeng Wang, Lingxiang Wu1, Jinqiao Wang
> Corresponding authors.
## Abstract
Chain of Thought (CoT) prompting can encourage language models to engage in multi-step logical reasoning. The quality of the provided demonstrations significantly influences the success of downstream inference tasks. Current unsupervised CoT methods primarily select examples based on the semantics of the questions, which can introduce noise and lack interpretability. In this paper, we propose leveraging reasoning patterns to enhance CoT prompting effectiveness. Reasoning patterns represent the process by which language models arrive at their final results. By utilizing prior knowledge and prompt-based methods from large models, we first construct task-specific pattern sets. We then select diverse demonstrations based on different reasoning patterns. This approach not only mitigates the impact of noise but also provides explicit interpretability to help us understand the mechanisms of CoT. Extensive experiments demonstrate that our method is more robust and consistently leads to improvements across various reasoning tasks.
## Introduction
Large Language Models (LLMs) have demonstrated exceptional performance across a wide range of language tasks. In general question-answering tasks (Kwiatkowski et al. 2019), LLMs hold a distinct advantage over other language models due to their robust writing capabilities. However, when it comes to more advanced tasks such as logical reasoning, mathematical computation, and symbolic reasoning, LLMs often fall short (Qiao et al. 2023; Huang and Chang 2023).
<details>
<summary>extracted/6276112/figures/pcot_ver1.png Details</summary>
### Visual Description
## Diagram: Mathematical Problem-Solving Flowchart with Examples
### Overview
The image is an educational diagram illustrating a step-by-step reasoning process for solving mathematical word problems. It uses two example prompts to demonstrate a method, applies that method to a new question, and then shows both an incorrect and a correct solution path. The diagram is structured with colored borders, arrows, and icons to guide the viewer through the logical flow.
### Components/Axes
The diagram is organized into four main rectangular boxes, connected by arrows.
1. **Top-Left Box (Prompt 1):**
* **Border:** Blue dashed line.
* **Label:** A blue button labeled "prompt 1" in the bottom-right corner.
* **Content:** A question and answer pair about Mark's money.
2. **Top-Right Box (Prompt 2):**
* **Border:** Blue dashed line.
* **Label:** A blue button labeled "prompt 2" in the bottom-right corner.
* **Content:** A question and answer pair about Nancy's savings.
3. **Central Box (Question):**
* **Border:** Purple dashed line.
* **Label:** A purple button labeled "question" in the bottom-right corner.
* **Content:** A new word problem about the value of a sport utility vehicle (SUV).
* **Arrows:** A red arrow points down from Prompt 1 to this box. A green arrow points down from Prompt 2 to this box.
4. **Bottom-Left Box (Incorrect Answer):**
* **Border:** Orange dashed line.
* **Icon:** A robot head icon in the top-left corner.
* **Symbol:** A red "X" in the top-right corner.
* **Content:** An incorrect step-by-step solution to the SUV problem.
* **Arrow:** A red arrow points down from the central Question box to this box.
5. **Bottom-Right Box (Correct Answer):**
* **Border:** Green dashed line.
* **Icon:** A robot head icon in the top-left corner.
* **Symbol:** A green checkmark in the top-right corner.
* **Content:** The correct step-by-step solution to the SUV problem.
* **Arrow:** A green arrow points down from the central Question box to this box.
### Detailed Analysis / Content Details
**Prompt 1 (Top-Left):**
* **Q:** Mark's father gave him $85. Mark bought 10 books, each of which cost $5. How much money does Mark have left?
* **A:** Let's think step by step. If Mark has $85 and he buys 10 books at $5 each, then he will spend a total of **$50 (10 x $5)**. So, after buying the books, Mark will have **$35 ($85 - $50)** left. The answer is 35.
* *Note: The calculation "$50 (10 x $5)" is highlighted in yellow.*
**Prompt 2 (Top-Right):**
* **Q:** Nancy has saved 4900 cents from selling lemonade. How many dollars does Nancy have?
* **A:** Let's think step by step. Nancy saved 4900 cents, which means she saved **4900 / 100 = 49** dollars. The answer is 49.
* *Note: The calculation "4900 / 100 = 49" is highlighted in yellow.*
**Central Question:**
* **Q:** The value of a sport utility vehicle this year is 16,000 dollars, which is 0.8 of what its value was last year. How much is the value of the vehicle last year?
* **A:** Let's think step by step.
**Incorrect Answer (Bottom-Left):**
* The problem tells us that the value of the sport utility vehicle this year is 16,000 dollars, which is 0.8 of what it was last year. So, if we multiply the value of the vehicle this year by 0.8, we get the value of the vehicle last year = **16,000 x 0.8 = 12,800** dollars. The answer is 12,800.
* *Note: The calculation "16,000 x 0.8 = 12,800" is highlighted in yellow.*
**Correct Answer (Bottom-Right):**
* The problem tells us that the value of the sport utility vehicle this year is $16,000, which is 0.8 times its value last year. This means that the value last year is **$16,000 / 0.8 = $20,000**. The answer is $20,000.
* *Note: The calculation "$16,000 / 0.8 = $20,000" is highlighted in yellow.*
### Key Observations
1. **Visual Coding:** The diagram uses color consistently to indicate correctness and flow. Red (borders, arrows, "X") is associated with the incorrect path. Green (borders, arrows, checkmark) is associated with the correct path. Blue is used for the initial example prompts.
2. **Structural Flow:** The arrows create a clear visual narrative: two example methods (Prompts 1 & 2) inform the approach to a new problem (Question), which then branches into two possible outcomes (Incorrect vs. Correct Answer).
3. **Highlighting:** Key mathematical operations within the solutions are highlighted in yellow to draw attention to the core calculation step.
4. **Iconography:** Robot head icons are placed on the answer boxes, personifying the "solver" or AI agent performing the reasoning.
### Interpretation
This diagram serves as a pedagogical tool to teach or demonstrate a specific problem-solving strategy, likely for training AI models or teaching students. The core lesson is about correctly interpreting the phrase "is 0.8 of what its value was last year."
* **The Error:** The incorrect solution misinterprets the relationship. It treats "0.8 of last year's value" as a multiplier to apply to this year's value to find last year's value, leading to the erroneous operation `16,000 * 0.8`.
* **The Correction:** The correct solution properly sets up the equation: `This Year's Value = 0.8 * Last Year's Value`. To find the unknown (Last Year's Value), it correctly performs the inverse operation: `Last Year's Value = This Year's Value / 0.8`.
* **Underlying Principle:** The diagram emphasizes the importance of translating word problems into correct mathematical equations before performing calculations. It visually contrasts a common mistake (applying the multiplier directly) with the correct algebraic approach (using division to isolate the unknown variable). The inclusion of two simpler, correct prompts at the top establishes a pattern of "step-by-step" reasoning that the final question is meant to follow, making the incorrect answer's deviation from that pattern more salient.
</details>
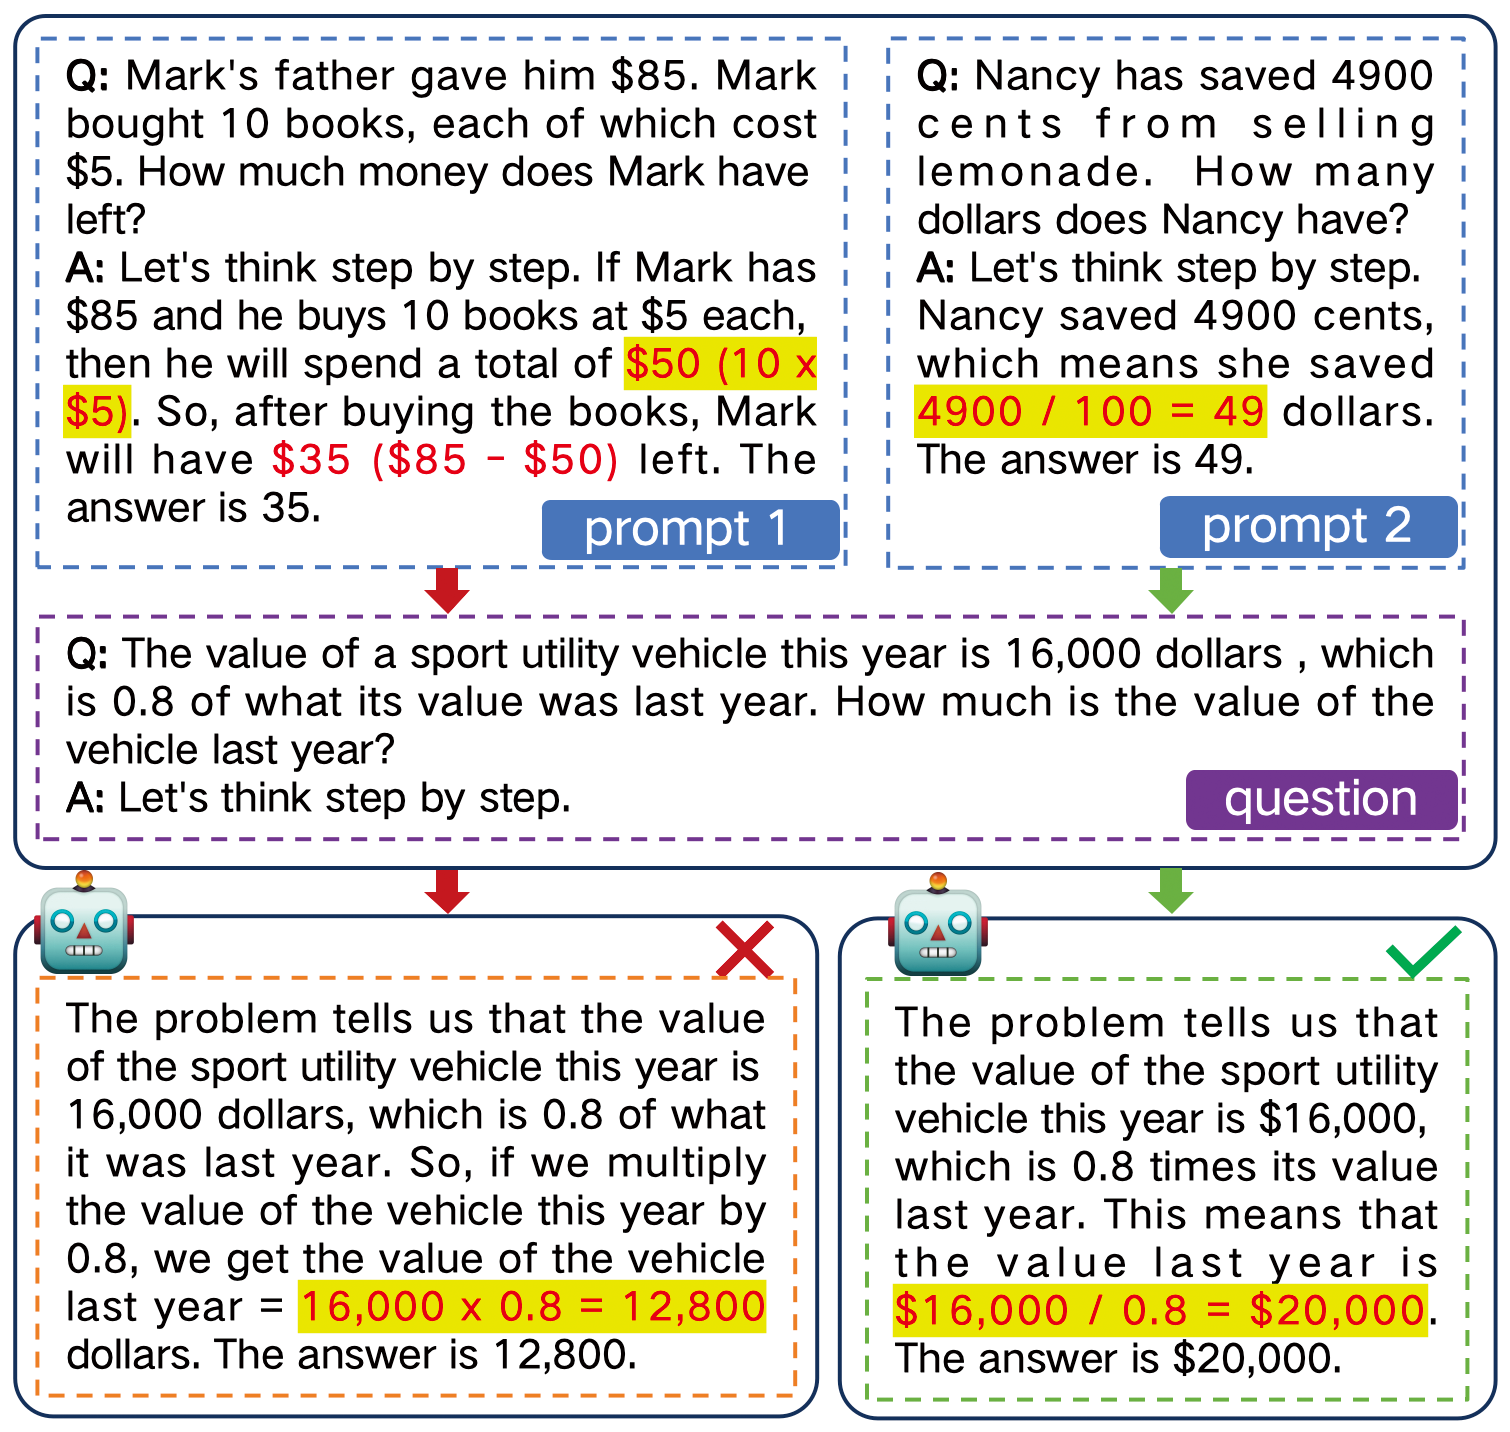
Figure 1: Example of the chain-of-thought prompting. The prompt influences how LLMs arrive at the final answer.
One effective approach to addressing these challenges is Chain of Thought (CoT) prompting (Wei et al. 2022b). By providing several demonstration examples that include a problem, intermediate reasoning steps, and an answer, CoT prompting serves as a contextual guide for downstream tasks. This approach encourages LLMs to generate multi-step logical reasoning, thereby maximizing the likelihood of producing more plausible answers. The advantage of this method lies in its simplicity and efficiency; unlike fine-tuning, it does not require extensive gradient updates or alter the model’s inherent capabilities. Instead, it acts as an external augmentation of knowledge. For different reasoning tasks, we can route the model to the appropriate context, and then easily switch the demonstration sets to activate the relevant knowledge and abilities in the corresponding domain.
However, we argue that existing unsupervised CoT prompting methods have two major shortcomings. First, there remains a significant gap between the selected demonstration sets and the reasoning targets. Although extensive research (Zhang et al. 2023; Levy, Bogin, and Berant 2023; Yang et al. 2023; Shum, Diao, and Zhang 2023a) has explored ways to provide CoT demonstrations to enhance LLMs’ reasoning capabilities, these methods largely rely on the semantic features of the problem or the answer. Such features introduce irrelevant noise on a global scale, which can obscure the logical information needed for reasoning. Consequently, the constructed demonstration sets do not effectively represent the domain-specific logical knowledge, and struggle to adequately trigger correct reasoning in LLMs. Second, some demonstration selection methods lack interpretability and scalability. These methods are primarily based on heuristic design (Wang et al. 2022; Zheng et al. 2023) or leverage the model itself to generate additional demonstrations (Zhong et al. 2024; Yasunaga et al. 2024). The demonstration sets chosen through these means inherently lack clear explanations, making it challenging to assess their effectiveness or determine the direction for further optimization. This limitation can be particularly problematic in scenarios where interpretability is crucial.
To better select a demonstration subset for a reasoning task, we believe that considering the logical patterns of reasoning is essential. Inspired by the work of (Min et al. 2022) and (Madaan, Hermann, and Yazdanbakhsh 2023), we observe that LLMs are more influenced by the templates and patterns in the context than by the correctness of the demonstrations themselves. Building on this insight, we investigate the selection of demonstrations based on Reasoning Patterns. This approach offers a dual benefit. First, it helps to eliminate bias introduced by irrelevant information, thereby reducing the gap between the demonstration set and the reasoning task. Second, it provides explicit interpretability, allowing us to gain a deeper understanding of how CoT prompting functions. This interpretability can also serve as a clue for attribution analysis and visualization.
In this work, we propose Pattern-CoT https://github.com/Magicat128/Pattern-CoT., a CoT demonstration selection method based on reasoning patterns. Unlike previous approaches that focus on overall semantics, our method targets finer-grained logical reasoning operations. For instance, in mathematical reasoning, addition and multiplication represent distinct operations, while multiple sequential operators may indicate more complex operational patterns, as shown in Figure 1. Inspired by recent studies (Yang et al. 2023), a diverse range of these patterns should be incorporated into CoT. Specifically, for a given reasoning task, we first obtain a set of seed demonstrations with rationale (intermediate reasoning steps). These examples can be sourced from the training set or generated using a zero-shot approach. We then obtain specific operation tokens tailored to different task types, which help us extract reasoning patterns from the rationales. Here, we incorporate prior knowledge and guide the LLMs in generating these operation tokens. Based on the extracted reasoning patterns, we apply clustering techniques to merge similar patterns and design metrics to automatically assess the number of demonstration categories. Finally, we select representative demonstrations from each category to enrich the diversity and construct context prompts for LLMs. Notably, by incorporating task-specific knowledge, our method improves interpretability and facilitates further scalability.
Our contributions can be summarized as follows:
- We introduce the use of diverse reasoning patterns to enhance CoT prompting and design a demonstration selection method to reduce the gap between the demonstration set and the task.
- Our method strengthens the interpretability of CoT in unsupervised scenarios, and can be utilized for further attribution analysis.
- Extensive experiments demonstrate that our method consistently enhances performance across multiple reasoning tasks and various models.
## Related Work
### Chain-of-Thought Prompting
Large language models have demonstrated significant ability in comprehending context and responding to prompts (Brown et al. 2020; Ouyang et al. 2022). Recent studies highlight that LLMs can achieve improved task completion without fine-tuning, particularly on reasoning tasks, when provided with few-shot demonstrations (Wei et al. 2022b). For instance, when presented with an example like Q: Mary has 9 yellow marbles. John has 3 yellow marbles. How many yellow marbles do they have in all? A: They have 9 + 3 = 12 yellow marbles. The answer is 12, LLMs are expected to emulate such a format, deconstruct the question, engage in multi-step reasoning, and refrain from generating random answers in subsequent tasks. This process is commonly referred to as chain-of-thought prompting or in-context learning (Wei et al. 2022a; Xie et al. 2022). However, implementing this practice often involves the manual design of prompts at a labour cost. Consequently, researchers are exploring more efficient example selection strategies to streamline this process.
### Demonstration Selection and Refinement
Several CoT studies are directed towards automating the generation of demonstrations, such as retrieval-based (Rubin, Herzig, and Berant 2022), zero-shot (Kojima et al. 2022), clustering-based (Zhang et al. 2023), and self-prompt (Shao et al. 2023; Yasunaga et al. 2024). However, many of these approaches encounter challenges in achieving performance comparable to Manual-CoT, primarily due to the absence of supervision in example selection. In another branch of research, efforts are focused on enhancing the quality of CoT demonstrations. They incorporate elements such as knowledge-infusion (Zhao et al. 2023; Weng et al. 2023; Li et al. 2024), self-consistency (Wang et al. 2023a), complexity-based (Fu et al. 2022), contrastive-based (Chia et al. 2023), and progressive-hint (Zheng et al. 2023). The primary goal of these strategies is to ensure that LLMs adhere to the correct prompt and avoid being misled.
<details>
<summary>extracted/6276112/figures/main.png Details</summary>
### Visual Description
## Diagram: LLM-Based Math Word Problem Solving Pipeline
### Overview
This image is a technical flowchart illustrating a pipeline for solving math word problems using a Large Language Model (LLM) enhanced with pattern recognition and clustering. The process flows from left to right, starting with a dataset of problems, extracting reasoning patterns, and applying them to solve a new downstream task. The diagram uses color-coded boxes and arrows to denote different stages and data flow.
### Components/Axes
The diagram is segmented into several key components, arranged spatially as follows:
1. **Left Column (Input & Demonstration):**
* **Top-Left (Blue Box):** `Dataset`. Contains example questions (Q₁, Q₂, ... Qₙ).
* **Bottom-Left (Orange Box):** `Seed Demonstrations`. Contains a detailed worked example (Q₁ and A₁) showing step-by-step reasoning.
* **Icon & Text:** An LLM robot icon with the text `Let's think step by step` points from the Dataset to the Seed Demonstrations.
2. **Center Column (Pattern Processing):**
* **Top-Center (Orange Box):** `Pattern Wise Context`. Contains multiple question-answer pairs (Q₁/A₁, Q₂/A₂, ... Qₖ/Aₖ), each labeled with a `(Reasoning Pattern X)`.
* **Middle-Center (Green Boxes):**
* `K-Clustering` (with a cluster icon).
* `Adaptive K` (with a square root of x icon).
* `Embeddings` (with a row of colored squares labeled: `twice`, `x`, `-`, `divide`, `÷`, `=`, `+`).
* **Bottom-Center (Purple & Teal Boxes):**
* `Pattern Discovery` containing `Prior Knowledge` (globe icon) and `LLM Prompting` (robot icon).
* `Task Patterns` containing example phrases: `twice the age of`, `divide both sides`, `7+2=9 years old`.
3. **Right Column (Application & Output):**
* **Top-Right (Green Box):** `Downstream Task`. Contains a `Pattern Wise Context` section (Q₁, A₁) and a new `Question` about a sport utility vehicle's value.
* **Bottom-Right (Green Box):** `Final Answer`. Contains the LLM's step-by-step solution to the downstream task question, culminating in the answer `$20,000` with a green checkmark.
* **Icons:** An LLM robot icon and a lightbulb icon are positioned between the Downstream Task and Final Answer boxes.
**Flow Arrows:** Orange arrows connect the major stages: Dataset -> Seed Demonstrations -> Pattern Wise Context -> Downstream Task -> Final Answer. Green arrows connect the pattern processing components (K-Clustering, Embeddings, Pattern Discovery) to the main flow.
### Detailed Analysis
**Textual Content Extraction:**
* **Dataset Box:**
* `Q₁: Liam is 16 years old now. Two years ago, ...`
* `Q₂: Melanie, Sally, and Jessica each have ...`
* `...`
* `Qₙ: There were a total of 6 soccer games this ...`
* **Seed Demonstrations Box:**
* `Q₁: Liam is 16 years old now. Two years ago, Liam's age was twice the age of Vince. How old is Vince now?`
* `A₁: Let's think step by step. 2 years ago, Liam's age was twice the age of Vince. So, we can write an equation based on this information: Liam's age 2 years ago = 2 x Vince's age 2 years ago. We know that Liam's current age is 16, so his age 2 years ago would have been 16 - 2 = 14. Now, we can substitute this value into our equation: 14 = 2 x Vince's age 2 years ago To solve for Vince's age, we can divide both sides of the equation by 2: 7 = Vince's age 2 years ago So, Vince is currently 7 + 2 = 9 years old.`
* `...`
* `Qₙ: ...`
* **Pattern Wise Context Box:**
* `Q₁: Nancy has saved 4900 cents ... (Reasoning Pattern 1) ↓`
* `A₁: ... saved 4900 / 100 = 49 dollars ...`
* `Q₂: Tom was at the beach for 5 days ... (Reasoning Pattern 2) ↓`
* `A₂: ... a total of 7 x 5 = 35 seashells ...`
* `...`
* `Qₖ: Tim's cat had kittens ... (Reasoning Pattern k) ↓`
* `Aₖ: ... hem away is 9 - 3 = 6 ...`
* **Embeddings Box:** Labels under colored squares: `twice`, `x`, `-`, `divide`, `÷`, `=`, `+`.
* **Task Patterns Box:** Phrases in dashed boxes: `twice the age of`, `divide both sides`, `7+2=9 years old`.
* **Downstream Task Box:**
* `Pattern Wise Context`
* `Q₁: ...`
* `A₁: (Reasoning Pattern 1)`
* `...`
* `Question:`
* `The value of a sport utility vehicle this year is 16,000 dollars , which is 0.8 of what its value was last year. How much is the value of the vehicle last year?`
* **Final Answer Box:**
* `The problem tells us that the value of the sport utility vehicle this year is $16,000, which is 0.8 times its value last year. This means that the value last year is $16,000 / 0.8 = $20,000. The answer is $20,000.`
### Key Observations
1. **Pattern-Centric Approach:** The core of the pipeline is the extraction and reuse of "Reasoning Patterns" (e.g., unit conversion, multiplication, subtraction) from solved examples.
2. **Adaptive Clustering:** The system uses `K-Clustering` and `Adaptive K` on problem `Embeddings` to group similar problems, suggesting it dynamically determines the number of relevant patterns to apply.
3. **Hierarchical Pattern Application:** Patterns are discovered from `Prior Knowledge` and `LLM Prompting`, stored as `Task Patterns`, and then injected as `Pattern Wise Context` into the prompt for the downstream task.
4. **Chain-of-Thought Emphasis:** The `Seed Demonstrations` and `Final Answer` explicitly show step-by-step reasoning, highlighted with red text for key operations and numbers.
5. **Visual Flow:** The process is linear for a single problem (left to right) but involves a feedback loop where pattern discovery (center-bottom) informs the context provided to the main solving pipeline.
### Interpretation
This diagram represents a sophisticated method for improving an LLM's mathematical reasoning. Instead of relying solely on its parametric knowledge, the system:
1. **Decomposes** problems into reusable reasoning patterns.
2. **Organizes** these patterns via clustering based on semantic embeddings.
3. **Contextualizes** the LLM by providing relevant patterns (`Pattern Wise Context`) alongside the new problem.
The **key innovation** is the structured, adaptive retrieval of reasoning strategies. The `Adaptive K` component is particularly notable, as it implies the system can decide how many and which patterns are relevant for a given new problem, moving beyond a static few-shot prompt. The red-highlighted text in the examples serves as a training signal, explicitly marking the mathematical operations and results the model should learn to replicate.
The pipeline demonstrates a move towards more **modular and interpretable AI problem-solving**. By isolating "Task Patterns," the system's reasoning steps become more transparent and potentially editable. The final answer is not just a number but a justified solution that mirrors the structure of the seed demonstrations, indicating successful pattern transfer.
</details>
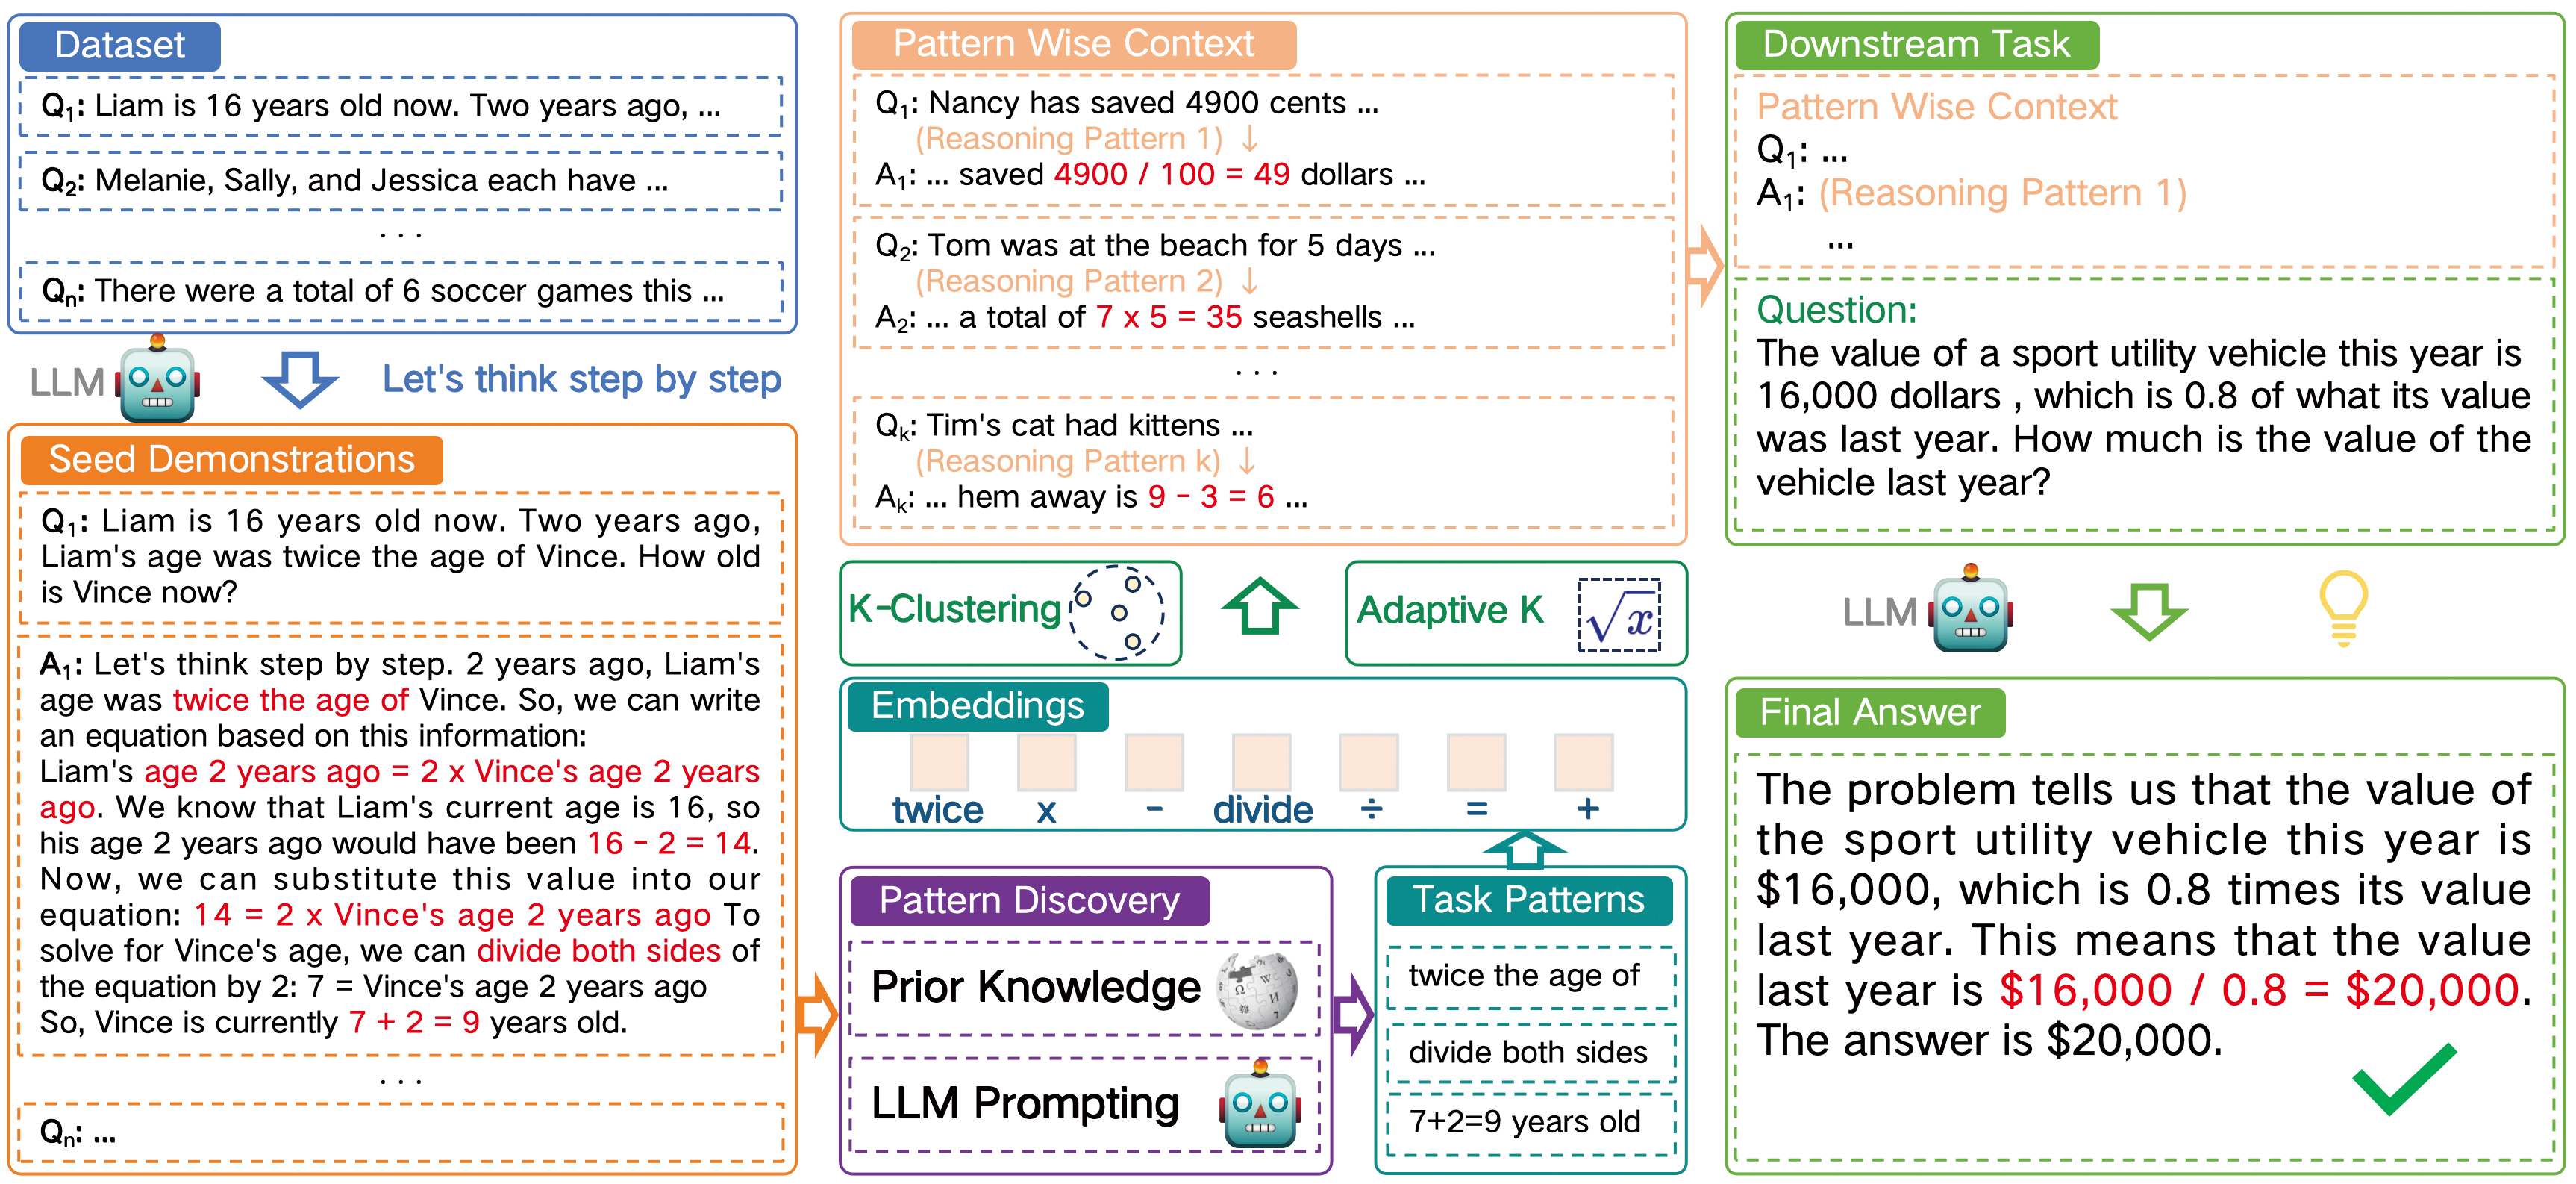
Figure 2: Illustration of our proposed framework. We first extract different patterns from the original rationales. Then clustering is used to produce a group of demonstrations. This enables LLMs to perceive diverse reasoning patterns and to select a proper solution path. It avoids LLMs being biased by monotonous reasoning mode.
### Role of In-Context Patterns
To understand the underlying mechanism of ICL, (Min et al. 2022) and (Madaan, Hermann, and Yazdanbakhsh 2023) employ counterfactual prompting methods. These methods involve substituting question-answer mapping, token distributions, answer patterns, and many other factors. Their findings consistently show that the correctness of examples is not the most crucial factor, but rather the distribution or pattern (e.g. equations, templates, sentence structure) of the examples. In this paper, we continue to uncover the power of CoT patterns and show how they can improve the reasoning process.
## Methodology
We now explore the impact of diverse demonstration reasoning patterns on chain-of-thought prompting. According to (Min et al. 2022), the precision of demonstrations is not crucial when LLMs engage in ICL. Even if all the demonstrations provided are incorrect, it would only marginally impede performance. This aligns with the insight derived from Auto-CoT (Zhang et al. 2023): clustering zero-shot question-answer pairs without emphasizing accuracy can still yield valuable examples. Consequently, our focus shifts to a more nuanced factor - the underlying reasoning pattern that harbours more informative content (Madaan, Hermann, and Yazdanbakhsh 2023) - to evaluate its potential benefits for the CoT process. The entire process is summarized in Figure 2 and Algorithm 1.
### Seed Demonstration Collection
For a given task $Q=\{q_1,q_2,...,q_N\}$ with $N$ questions, we first need to obtain their rationales and answers $\{q_i,r_i,a_i\}$ that can be used as context for CoT prompting. For data from existing training sets, we can directly use the training data. However, in practical applications, complete training sets may not always be available. In such cases, we refer to methods like (Zhang et al. 2023; Shum, Diao, and Zhang 2023b) and leverage the zero-shot (Kojima et al. 2022) capabilities of LLMs to generate the corresponding rationales. It is important to note that we do not require the answers to be correct or labelled; our focus is on whether the generated rationales contain meaningful reasoning patterns.
### Pattern Discovery
Based on the rationale set $Ra=\{r_1,r_2,...,r_N\}$ that we have obtained, we next identify the reasoning operations $T$ associated with the task. For tasks with a relatively limited action space, we can define reasoning operations using prior knowledge, as these operations represent the fundamental units of reasoning tasks. For example, in arithmetic problems, we refer to a glossary of possible operators from sources like Wikipedia The glossary of arithmetic operators refers to the Wikipedia: https://en.wikipedia.org/wiki/Glossary_of_mathematical_symbols, including basic arithmetic operations, square roots, comparison symbols, etc. For tasks with less clearly defined operations, we adapt definitions from arithmetic problems to guide LLMs in generating the corresponding reasoning operations. We design the prompt as: ‘Similar to operators used in arithmetic such as (+, -, *, /), which operators do you think best represent the [TASK]? Example of [TASK]: …’
For each rationale $r_i∈ Ra$ , we extract the reasoning operation tokens or phrases $t_j∈ T$ to form its reasoning pattern:
$$
p_i=f(r_i,T)=\{t_i1,t_i2,...,t_ij\} \tag{1}
$$
where $f$ denotes the function used to extract the reasoning path. In this context, $p_i$ represents how LLMs apply these operations step-by-step to reach the final result, and $t_ij$ can repeated.
Algorithm 1 Pattern-CoT Demonstration Selection
0: A set of task questions $Q$
0: Demonstration list $d=[d_1,d_2,...,d_k]$
1: Acquire operation token set $T$ with LLMs prompting or domain knowledge based on $Q$
2: for $q_i∈ Q$ do
3: Generate rationale $r_i$ with Zero-Shot-CoT
4: $p_i=[]$
5: for each token $t_ij∈ r_i$ do
6: if $t_ij∈ T$ then
7: Update $p_i$ with $t_ij$
8: end if
9: end for
10: $\widetilde{p}_i=encode(p_i)$
11: end for
12: Select proper $k$
13: Cluster all $[\widetilde{p}_1,\widetilde{p}_2,...,\widetilde{p}_i]$ into $k$ clusters
14: Sample $d=[d_1,d_2,...,d_k]$ from each cluster
15: return $d$
### Pattern Wise Demonstration Selection
Once we have identified the task-relevant patterns, we use them to select better demonstration sets. Following (Zhang et al. 2023), we cluster all the $p_i$ patterns while preserving diversity. Although $p_i$ is a simplified sequence of tokens, it still contains substantial semantic information that can be used to uncover underlying similarities. For instance, a sequence of addition operations is likely to be closer to a single addition operation than to a single multiplication operation. To leverage this, we use a language model to encode these patterns. We then apply the $k$ -means clustering algorithm to generate $k$ clusters and sample from each cluster:
$$
\widetilde{p}_i=encode(p_i) \tag{2}
$$
$$
c_1,c_2,...,c_k=cluster(\widetilde{p}_1,\widetilde{p}_2,...
,\widetilde{p}_i) \tag{3}
$$
$$
d=\{{q_m,r_m,a_m}|\widetilde{p}_m∈ c_m,m=1,2,...,k\} \tag{4}
$$
where $d$ denotes the demonstration set, $c_k$ denotes the $k$ -th cluster. Specifically, we use patterns primarily to select demonstrations rather than directly as context for downstream tasks. We utilize the original problem $q_k$ and rationale $r_k$ corresponding to the $p_k$ patterns as the CoT input.
### Number of Demonstrations
Since previous methods lack knowledge-based guidance, the choice of $k$ is often based on heuristic values. However, having too many demonstrations does not proportionally enhance the performance (Wei et al. 2022b; Agarwal et al. 2024), while too few may fail to adequately capture the task’s characteristics. By incorporating reasoning operations, we can use the number of these operations to inform a more reasonable choice for $k$ :
$$
k=\lceil\frac{1}{2}× n×(1+log(N))\rceil \tag{5}
$$
where $n$ denotes the number of identified operations, and $\lceil\rceil$ represents the ceiling function that rounds up to the nearest integer. This formula empirically takes into account the impact of the number of operation types on the number of demonstrations and further adjusts based on the sample size.
## Experiments
In this section, our objective is to evaluate the effectiveness of our proposed method and answer the following research questions:
- RQ1: Does incorporating reasoning patterns enhance the effectiveness of CoT prompting?
- RQ2: How do the reasoning patterns influence the outputs of LLMs?
- RQ3: Is our method robust and scalable to other models?
| Dataset | Samples | Operation Tokens |
| --- | --- | --- |
| GSM8K | 1319 | $+,-,×,/$ |
| ‘more’, ‘less’, ‘twice’, ‘half’ | | |
| AQuA | 254 | $+,-,×,/,π,√{x},x^n,x^∘,log$ |
| MultiArith | 600 | $+,-,×,/$ |
| AddSub | 395 | |
| SingleEq | 508 | |
| SVAMP | 1000 | |
| Coin | 500 | ‘heads up’, ‘tails up’ |
| Date | 369 | ‘day’, ‘week’, |
| ‘month’, ‘year’ | | |
| ‘yesterday’, ‘tomorrow’ | | |
Table 1: The number of samples and operation tokens.
### Experimental Setup
#### Datasets.
We adopt eight representative datasets for our reasoning tasks: MultiArith (Roy and Roth 2015), GSM8K (Cobbe et al. 2021), AddSub (Hosseini et al. 2014), AQUA-RAT (Ling et al. 2017), SingleEq (Koncel-Kedziorski et al. 2015), SVAMP (Patel, Bhattamishra, and Goyal 2021), Coin-Flip (Wei et al. 2022b), and BIG-bench Date Understanding (Srivastava et al. 2023). They require certain reasoning steps and are commonly used for CoT method comparisons (Wei et al. 2022b; Kojima et al. 2022; Zhang et al. 2023; Wang et al. 2023b; Fu et al. 2022).
For tasks MultiArith, AddSub, SingleEq, and SVAMP, we define the set of operation tokens based on a glossary from Wikipedia, as the operations involved are relatively straightforward. For tasks GSM8K and AQUA, we expand the operation token vocabulary manually based on data distribution. For tasks Coin-Flip and BIG-bench Date Understanding, we prompt GPT-4 to generate the corresponding operation tokens. The specific details of the datasets can be found in Table 1.
| LLaMA-2 Model 7b-chat-hf (+ SC) | MultiArith Zero-Shot-CoT 79.83 | GSM8K 72.33 27.14 | AddSub 21.00 62.78 | AQuA 57.97 21.65 | SingleEq 24.01 68.11 | SVAMP 57.67 47.60 | Coin 41.90 52.80 | Date 44.60 40.37 | 39.29 |
| --- | --- | --- | --- | --- | --- | --- | --- | --- | --- |
| Random-CoT | 76.16 | 24.41 | 65.59 | 22.44 | 66.14 | 46.59 | 48.00 | 44.44 | |
| Auto-CoT | 76.00 | 26.99 | 58.48 | 24.01 | 64.96 | 43.80 | 51.20 | 44.71 | |
| Auto-CoT-RA | 74.83 | 26.76 | 63.29 | 23.80 | 66.92 | 45.19 | 48.00 | 43.08 | |
| Ours | 79.66 | 27.45 | 65.06 | 28.34 | 71.85 | 48.50 | 59.40 | 45.79 | |
| Ours (Adaptive $k$ ) | 79.66* | 28.05 | 67.08 | 29.13 | 71.85* | 48.50* | 58.40 | 46.34 | |
| 13b-chat-hf | Zero-Shot-CoT | 77.50 | 34.49 | 60.75 | 15.74 | 69.29 | 49.40 | 47.40 | 46.07 |
| Auto-CoT | 82.16 | 36.77 | 63.03 | 25.19 | 70.67 | 55.50 | 54.20 | 53.93 | |
| Auto-CoT-RA | 82.16 | 37.04 | 62.08 | 27.74 | 66.14 | 52.10 | 62.80 | 54.47 | |
| Ours | 83.16 | 37.68 | 65.82 | 26.37 | 74.80 | 56.39 | 57.40 | 56.91 | |
| Ours (Adaptive $k$ ) | 83.16* | 38.44 | 64.81 | 31.49 | 74.80* | 56.39* | 67.80 | 60.97 | |
Table 2: Accuracy (%) on eight reasoning datasets. We present the mean value obtained from five runs. * denotes the situation where $k$ does not change, and results are copied from above. For the Random-CoT method, we report the best result since we are concerned about the potential of CoT. For the self-consistency method, we set the number of paths as 5 (Wang et al. 2023a).
#### Language Models.
To facilitate subsequent interpretability analysis, we select open-source models as our reasoning engine. Specifically, we use models from the LLaMA-2 family due to their foundational logical reasoning capabilities and support for CoT prompting. These models are deployed on our local server, which is equipped with 8 RTX 3090 GPUs, each with 24GB of memory. Due to hardware constraints, we test only the 7B and 13B models. Experiments with larger models or those from other families are discussed in subsequent sections.
We use the inference functions of these models, and the process does not involve training or fine-tuning. Additionally, we set the hyperparameters with a temperature of 0.4 and top_p of 0.9 to manage the model’s randomness (Xu et al. 2022). To maintain consistency with (Zhang et al. 2023), we use Sentence-BERT (Reimers and Gurevych 2019) as our encoder and select the ‘all-MiniLM-L6-v2’ model for semantic vector representation. This model has also been proven effective in our experiments.
#### Baselines.
We primarily compare our methods with unsupervised methods including Zero-Shot-CoT (Kojima et al. 2022), Random-CoT, Auto-CoT (Zhang et al. 2023), and Self-Consistency (Wang et al. 2023a). Building on Auto-CoT, we introduce an additional variant, Auto-CoT-RA, which replaces the original question embedding with the rationale embedding for clustering. The purpose of this modification is to investigate whether this subtle shift can implicitly uncover the underlying patterns in reasoning. Unless otherwise specified, our method uses the same $k$ value as the baseline in experiments. Additionally, we conduct experiments using our method with the adaptive $k$ value that we designed.
### Main Results (RQ1)
Table 2 presents the overall performance of various methods on the 7B and 13B models. Since our primary goal is to evaluate whether focusing on diverse patterns provides more benefit to reasoning than semantic information, we are not concerned with identifying which model achieves state-of-the-art performance. Based on these results, we make the following observations:
- Overall, our method consistently outperforms the baseline approaches. This stable improvement indicates that by introducing diverse reasoning patterns, we can identify more representative demonstration sets, where each example embodies a different reasoning strategy. Using these diverse examples as context for LLMs can further enhance their ability to solve downstream tasks.
- We observe that for arithmetic problems with a limited set of operation tokens, such as MultiArith, AddSub, SingleEq, and SVAMP, our method achieves more significant improvements compared to methods based on semantic information. This suggests that the demonstration sets we construct can effectively cover the majority of reasoning paths, thereby providing comprehensive guidance for LLMs to select appropriate reasoning patterns.
- For datasets with a relatively broader action space, like GSM8K and AQuA, the improvements are less significant. This implies that a limited number of examples do not fully capture the diversity of reasoning patterns. However, when we recalculate the number of clusters using adaptive $k$ and expand the demonstration set, we observe additional gains on these two datasets.
- Surprisingly, we find that for datasets like Coin and Date, where the operation patterns are not explicitly defined, our method actually lead to greater improvements. We hypothesize that this is because the questions in these datasets are quite similar, making it difficult to distinguish them based on semantic features alone. In contrast, leveraging reasoning patterns allows us to identify representative examples from a different dimension. Additionally, both of these datasets show further performance improvements when using adaptive $k$ .
<details>
<summary>extracted/6276112/figures/subset.png Details</summary>
### Visual Description
## Grouped Bar Chart: The Accuracy of Different Operation Sets
### Overview
The image displays a grouped bar chart comparing the accuracy of three different operation subsets ("basic operation subset," "supplemental subset," and "full set") across two distinct datasets ("GSM8K" and "AQuA"). The chart is designed to show how the inclusion of more operations impacts model accuracy on these two benchmarks.
### Components/Axes
* **Chart Title:** "The Accuracy of Different Operation Sets" (centered at the top).
* **Y-Axis:**
* **Label:** "Accuracy" (rotated vertically on the left side).
* **Scale:** Linear scale ranging from 23 to 30, with major tick marks at every integer value (23, 24, 25, 26, 27, 28, 29, 30).
* **X-Axis:**
* **Label:** "Dataset" (centered at the bottom).
* **Categories:** Two primary categories are labeled: "GSM8K" (left group) and "AQuA" (right group).
* **Legend:**
* **Position:** Top-left corner of the chart area.
* **Items:**
1. A gray square labeled "basic operation subset".
2. A light blue square labeled "supplemental subset".
3. A light red (salmon) square labeled "full set".
* **Data Series (Bars):** For each dataset category on the X-axis, there are three adjacent bars corresponding to the three operation subsets defined in the legend.
### Detailed Analysis
**Data Values (Approximate, read from chart):**
* **Dataset: GSM8K**
* **basic operation subset (Gray bar):** Height corresponds to an accuracy of approximately **25.4**.
* **supplemental subset (Light blue bar):** Height corresponds to an accuracy of approximately **25.6**.
* **full set (Light red bar):** Height corresponds to an accuracy of approximately **27.5**.
* **Dataset: AQuA**
* **basic operation subset (Gray bar):** Height corresponds to an accuracy of approximately **25.2**.
* **supplemental subset (Light blue bar):** Height corresponds to an accuracy of approximately **27.7**.
* **full set (Light red bar):** Height corresponds to an accuracy of approximately **28.3**.
**Trend Verification:**
* For the **GSM8K** dataset, the trend is a stepwise increase: the basic subset has the lowest accuracy, the supplemental subset is slightly higher, and the full set shows a significant jump.
* For the **AQuA** dataset, the trend is also increasing: the basic subset is the lowest, the supplemental subset shows a very large increase, and the full set is the highest, though the increment from supplemental to full is smaller than the jump from basic to supplemental.
### Key Observations
1. **Consistent Hierarchy:** In both datasets, the "full set" achieves the highest accuracy, followed by the "supplemental subset," with the "basic operation subset" performing the worst.
2. **Dataset-Dependent Gains:** The performance gain from adding operations is more pronounced for the **AQuA** dataset. The jump from the "basic" to "supplemental" subset is much larger for AQuA (~2.5 points) than for GSM8K (~0.2 points).
3. **Baseline Similarity:** The accuracy of the "basic operation subset" is very similar across both datasets (25.4 vs. 25.2), suggesting a consistent baseline performance.
4. **Peak Performance:** The highest accuracy shown on the chart is achieved by the "full set" on the AQuA dataset (~28.3).
### Interpretation
This chart demonstrates the value of expanding an operation set for improving model accuracy on reasoning or mathematical datasets (as suggested by the names GSM8K and AQuA, which are known benchmarks in this domain).
* **Core Finding:** More comprehensive operation sets ("full set") lead to better performance. This suggests that the model benefits from having access to a wider repertoire of reasoning tools or steps.
* **Nuanced Insight:** The benefit is not uniform. The **AQuA** dataset appears to be more sensitive to the inclusion of the "supplemental" operations, as evidenced by the large performance leap. This could indicate that AQuA problems require specific types of reasoning or operations that are absent in the basic set but present in the supplemental one. Conversely, the GSM8K dataset shows a more gradual improvement, suggesting its problems are either less dependent on those supplemental operations or that the basic set already covers a significant portion of its needs.
* **Implication:** The data argues against a one-size-fits-all approach. The optimal operation set may depend on the specific characteristics of the target dataset. The "full set" is universally best here, but the cost-benefit of implementing it versus the "supplemental subset" might be different for each task domain. The chart provides empirical evidence for tailoring a model's operational toolkit to the problem at hand.
</details>
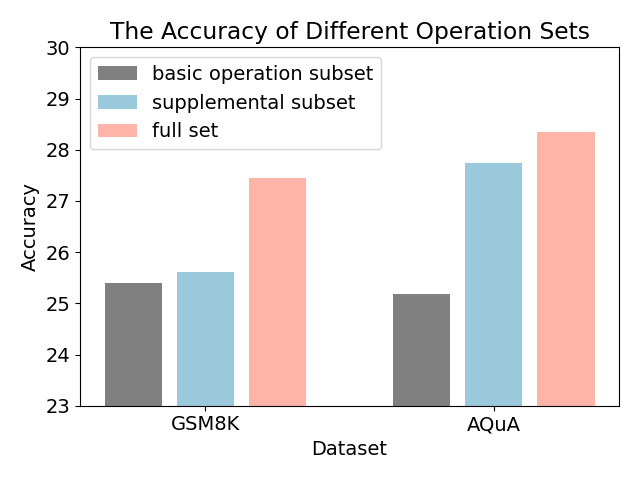
Figure 3: Comparison of different operation sets.
| Q: Mark’s father gave him $85. Mark bought 10 books, each of which cost $5. How much money does Mark have left? A: Let’s think step by step. If Mark has $85 and he buys 10 books at $5 each, then he will spend a total of $50 (10 x $5). So, after buying the books, Mark will have $35 ($85 - $50) left. The answer is 35. | Q: Tom was at the beach for 5 days and found 7 seashells every day. How many seashells did Tom find during the beach trip? A: Let’s think step by step. If Tom found 7 seashells every day, then he found a total of 7 x 5 = 35 seashells during his entire beach trip. The answer is 35. |
| --- | --- |
| Q: Mike has 48 books. Alyssa has 8 times more books than Mike. How many dozen books does Alyssa have? A: Let’s think step by step. If Mike has 48 books, then Alyssa has 8 times that number = 8 x 48 = 384 books. So Alyssa has 384 books. The answer is 384. | Q: Nancy has saved 4900 cents from selling lemonade. How many dollars does Nancy have? A: Let’s think step by step. Nancy saved 4900 cents, which means she saved 4900 / 100 = 49 dollars. The answer is 49. |
| Q: The value of a sport utility vehicle this year is 16,000 dollars , which is 0.8 of what its value was last year. How much is the value of the vehicle last year? | Q: The value of a sport utility vehicle this year is 16,000 dollars , which is 0.8 of what its value was last year. How much is the value of the vehicle last year? |
| A: Let’s think step by step. The problem tells us that the value of the sport utility vehicle this year is 16,000 dollars, which is 0.8 of what it was last year. So, if we multiply the value of the vehicle this year by 0.8, we get the value of the vehicle last year = 16,000 x 0.8 = 12,800 dollars. The answer is 12,800. | A: Let’s think step by step. The problem tells us that the value of the sport utility vehicle this year is $16,000, which is 0.8 times its value last year. This means that the value last year is $16,000 / 0.8 = $20,000. The answer is $20,000. |
Table 3: Case study of Auto-CoT and our method for demonstration selection and downstream inference. The upper questions and answers are demonstrations constructed by two methods, and the lower part contains how LLMs solve the inference task.
| MultiArith | 8 | 2 | 25.0% |
| --- | --- | --- | --- |
| GSM8K | 8 | 5 | 62.5% |
| AddSub | 8 | 3 | 37.5% |
| AQuA | 4 | 4 | 100% |
| SingleEq | 8 | 2 | 25.0% |
| SVAMP | 8 | 6 | 75% |
| Coin | 8 | 3 | 37.5% |
| Date | 8 | 1 | 12.5% |
Table 4: The number of demonstrations and their error rate for each dataset.
There are several additional observations. For instance, in some cases, Auto-CoT-RA outperforms Auto-CoT, while in others it does not. This suggests that simply shifting from question semantics to rationale semantics does not necessarily narrow the gap between demonstrations and the reasoning task. Deeper reasoning patterns can still be obscured by irrelevant information. Moreover, in certain situations, using a random demonstration set can also surpass Auto-CoT, although this improvement is inconsistent. This indirectly highlights that other factors, such as underlying reasoning patterns, can influence the effectiveness of examples. Our method, in most cases, demonstrates a more stable ability to uncover these factors.
### Impact of Operation Tokens (RQ1)
To further assess the impact of reasoning patterns, we conduct additional experiments. Given that GSM8K and AQuA datasets utilize additional operation tokens, we removed some of these tokens to determine their influence. Specifically, we categorize the expanded operation tokens into a basic operation subset, such as $\{+,-,×,/\}$ , similar to other arithmetic tasks, and the remaining tokens as supplementary subsets. These subsets represent only a portion of the reasoning patterns within these two datasets.
Figure 3 shows the results of using different subsets on the 7B model. The experimental results demonstrate that using operation subsets as reasoning pattern tokens can degrade overall performance. The primary reason for this is that these subsets do not sufficiently cover the task’s logical scope. It leads to a lack of diversity. However, when the full set of operations is utilized, a broader range of scenarios can be activated, allowing the model to better adapt to the task.
### Case Study (RQ2)
To gain a deeper understanding of CoT prompting, we perform a case study. Table 3 presents a typical instance analysis. We observe that Auto-CoT, due to its introduction of numerous irrelevant patterns, tends to distort the reasoning results of LLMs. In contrast, our method, which includes a diverse set of reasoning pattern templates, enables the model to generate correct responses.
<details>
<summary>extracted/6276112/figures/Figure_case1.png Details</summary>
### Visual Description
## Heatmap: Token Attribution for Mathematical Expressions
### Overview
The image is a heatmap visualization displaying "Token Attribution" scores. It maps the attribution (importance or contribution) of individual tokens (rows) to specific mathematical expressions (columns). The color intensity represents the magnitude and direction of attribution, with a scale ranging from -1.0 (dark red) to 1.0 (dark green). The grid contains 13 rows and 5 columns of numerical data.
### Components/Axes
* **Column Headers (Top):** Five mathematical expressions serve as categories:
1. `8 x 48 = 384`
2. `3 x 4 = 12`
3. `6 - 4 = 2`
4. `50(10x5)`
5. `$35 ($85 - $50)`
* **Row Labels (Left):** Thirteen individual tokens or symbols, listed from top to bottom:
`—`, `1`, `6`, `,`, `0`, `0`, `0`, `x`, `—`, `0`, `.`, `8`, `_=`
* **Color Scale/Legend (Right):** A vertical bar labeled "Token Attribution" with a gradient from dark red (-1.0) through yellow (0.0) to dark green (1.0). Tick marks are at -1.0, -0.5, 0.0, 0.5, and 1.0.
### Detailed Analysis
The following table reconstructs the heatmap's data. Values are approximate, read to four decimal places. The color description is based on the legend.
| Row Token | `8 x 48 = 384` | `3 x 4 = 12` | `6 - 4 = 2` | `50(10x5)` | `$35 ($85 - $50)` |
| :--- | :--- | :--- | :--- | :--- | :--- |
| **`—`** | 0.3452 (Light Green) | 0.2580 (Light Green) | **0.5823 (Medium Green)** | 0.0161 (Very Light Yellow) | -0.0472 (Very Light Orange) |
| **`1`** | 0.0811 (Very Light Green) | -0.0066 (Very Light Yellow) | -0.0037 (Very Light Yellow) | **0.3934 (Light Green)** | -0.0356 (Very Light Orange) |
| **`6`** | 0.0234 (Very Light Green) | 0.0145 (Very Light Green) | 0.0512 (Very Light Green) | 0.0243 (Very Light Green) | 0.0135 (Very Light Green) |
| **`,`** | 0.0049 (Very Light Yellow) | -0.0019 (Very Light Yellow) | -0.0196 (Very Light Orange) | -0.0211 (Very Light Orange) | -0.0011 (Very Light Yellow) |
| **`0`** | -0.0009 (Very Light Yellow) | 0.0008 (Very Light Yellow) | -0.0015 (Very Light Yellow) | -0.0010 (Very Light Yellow) | -0.0000 (Yellow) |
| **`0`** | 0.0000 (Yellow) | 0.0000 (Yellow) | -0.0000 (Yellow) | 0.0000 (Yellow) | -0.0001 (Very Light Yellow) |
| **`0`** | 0.0001 (Very Light Yellow) | 0.0002 (Very Light Yellow) | 0.0002 (Very Light Yellow) | -0.0001 (Very Light Yellow) | -0.0002 (Very Light Yellow) |
| **`x`** | **1.3714 (Dark Green, >1.0)** | **0.6865 (Green)** | 0.1771 (Light Green) | **0.6837 (Green)** | **-0.3675 (Orange)** |
| **`—`** | 0.0089 (Very Light Yellow) | 0.0134 (Very Light Yellow) | 0.0232 (Very Light Yellow) | -0.0061 (Very Light Yellow) | -0.0099 (Very Light Yellow) |
| **`0`** | -0.0054 (Very Light Yellow) | 0.0008 (Very Light Yellow) | 0.0012 (Very Light Yellow) | 0.0025 (Very Light Yellow) | 0.0016 (Very Light Yellow) |
| **`.`** | 0.0020 (Very Light Yellow) | 0.0006 (Very Light Yellow) | 0.0026 (Very Light Yellow) | 0.0026 (Very Light Yellow) | -0.0011 (Very Light Yellow) |
| **`8`** | -0.0007 (Very Light Yellow) | 0.0015 (Very Light Yellow) | 0.0007 (Very Light Yellow) | -0.0036 (Very Light Yellow) | 0.0009 (Very Light Yellow) |
| **`_=`** | 0.0081 (Very Light Yellow) | 0.0104 (Very Light Yellow) | 0.0097 (Very Light Yellow) | -0.0127 (Very Light Yellow) | 0.0004 (Very Light Yellow) |
### Key Observations
1. **Dominant Row:** The token **`x`** (8th row) shows the highest absolute attribution values across the board. It has a strongly positive attribution for `8 x 48 = 384` (1.3714, exceeding the scale), `3 x 4 = 12` (0.6865), and `50(10x5)` (0.6837), but a notably negative attribution for `$35 ($85 - $50)` (-0.3675).
2. **Significant Column Patterns:**
* The expression `8 x 48 = 384` receives its highest positive attribution from the `x` token and a moderately high one from the first `—` token.
* The expression `50(10x5)` has its highest positive attribution from the `x` token and a significant one from the `1` token.
* The expression `$35 ($85 - $50)` is unique in having its most significant attribution be *negative*, coming from the `x` token.
3. **Low-Attribution Tokens:** Most tokens (especially the repeated `0`s, `,`, `.`, `8`, `_=`, and the second `—`) have attribution scores very close to zero (|value| < 0.03) for all expressions, indicating minimal influence.
4. **Color-Value Consistency:** The color of each cell aligns with the legend. High positive values are green, high negative values are orange/red, and values near zero are pale yellow.
### Interpretation
This heatmap likely visualizes the output of an interpretability technique (like attention or integrated gradients) applied to a model processing mathematical expressions. It answers: "How important was each input token for the model's final representation or prediction for each expression?"
* **The `x` Token is Pivotal:** The token `x` is critically important for expressions involving multiplication (`8 x 48`, `3 x 4`, `10x5`). Its high positive attribution suggests the model heavily relies on this symbol to identify and process multiplicative relationships. Conversely, its negative attribution for the purely subtractive/monetary expression `$35 ($85 - $50)` suggests the presence of `x` might be a distracting or counter-indicative feature for that specific context.
* **Context-Specific Importance:** The attribution of the `1` token is high only for `50(10x5)`, likely because the digit '1' is a key component of the number '10' within that expression. Similarly, the first `—` token (which could represent a dash or minus sign) has its highest attribution for `6 - 4 = 2`, aligning with its syntactic role.
* **Noise vs. Signal:** The vast majority of tokens have near-zero attribution, demonstrating that the model's focus is highly selective. It assigns importance to a small, semantically relevant subset of the input for each task.
* **Anomaly:** The value 1.3714 for (`x`, `8 x 48 = 384`) exceeds the defined color scale maximum of 1.0, resulting in a saturated dark green. This indicates an exceptionally strong positive attribution, possibly the most significant single data point in the analysis.
In summary, the heatmap provides a granular, quantitative view of how a model "attends to" or "attributes importance" to different parts of mathematical statements, revealing that its understanding is heavily anchored on operational symbols like `x` and contextually relevant digits and signs.
</details>
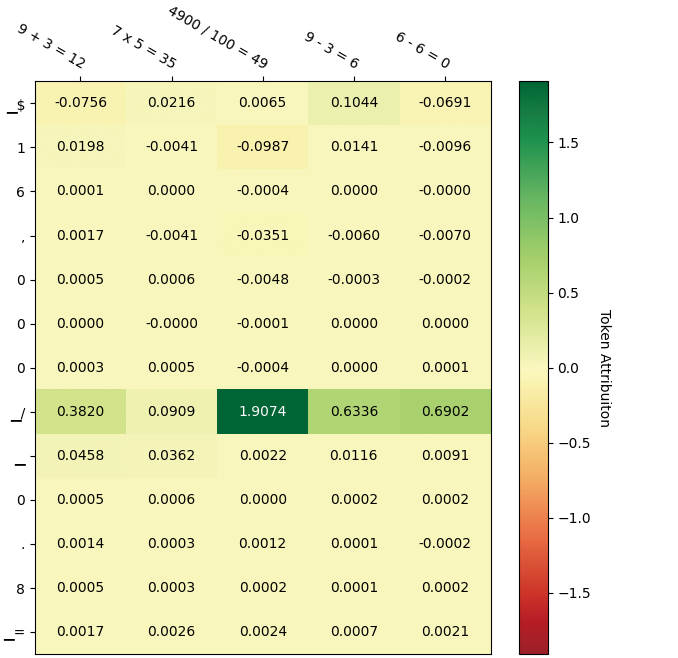
<details>
<summary>extracted/6276112/figures/Figure_case2.png Details</summary>
### Visual Description
\n
## Heatmap: Token Attribution for Arithmetic Operations
### Overview
The image displays a heatmap visualizing "Token Attribution" scores for various arithmetic operations. The heatmap is a grid where rows represent individual tokens (symbols or characters) and columns represent five distinct arithmetic expressions. Each cell's color and numerical value indicate the attribution score of that token for the corresponding operation, with a color scale ranging from red (negative attribution) to green (positive attribution).
### Components/Axes
* **Column Headers (Top, angled):** Five arithmetic expressions:
1. `9 + 3 = 12`
2. `7 x 5 = 35`
3. `4900 / 100 = 49`
4. `9 - 3 = 6`
5. `6 - 6 = 0`
* **Row Labels (Left side, vertical):** A sequence of 13 tokens/symbols:
`$`, `1`, `6`, `,`, `0`, `0`, `0`, `_/`, `-`, `0`, `.`, `8`, `_=`
* **Color Scale/Legend (Right side, vertical):** A vertical bar labeled "Token Attribution". The scale runs from approximately -1.5 (dark red) at the bottom, through 0 (light yellow) in the middle, to +1.5 (dark green) at the top. Major tick marks are at -1.5, -1.0, -0.5, 0.0, 0.5, 1.0, 1.5.
* **Data Grid:** A 13-row by 5-column grid of cells. Each cell contains a numerical attribution score and is colored according to the scale.
### Detailed Analysis
**Attribution Scores by Row (Token):**
* **Row 1 (`$`):** -0.0756, 0.0216, 0.0065, 0.1044, -0.0691
* **Row 2 (`1`):** 0.0198, -0.0041, -0.0987, 0.0141, -0.0096
* **Row 3 (`6`):** 0.0001, 0.0000, -0.0004, 0.0000, -0.0000
* **Row 4 (`,`):** 0.0017, -0.0041, -0.0351, -0.0060, -0.0070
* **Row 5 (`0`):** 0.0005, 0.0006, -0.0048, -0.0003, -0.0002
* **Row 6 (`0`):** 0.0000, -0.0000, -0.0001, 0.0000, 0.0000
* **Row 7 (`0`):** 0.0003, 0.0005, -0.0004, 0.0000, 0.0001
* **Row 8 (`_/`):** **0.3820, 0.0909, 1.9074, 0.6336, 0.6902** (This row has the highest magnitude values, colored in shades of green).
* **Row 9 (`-`):** 0.0458, 0.0362, 0.0022, 0.0116, 0.0091
* **Row 10 (`0`):** 0.0005, 0.0006, 0.0000, 0.0002, 0.0002
* **Row 11 (`.`):** 0.0014, 0.0003, 0.0012, 0.0001, -0.0002
* **Row 12 (`8`):** 0.0005, 0.0003, 0.0002, 0.0001, 0.0002
* **Row 13 (`_=`):** 0.0017, 0.0026, 0.0024, 0.0007, 0.0021
**Attribution Scores by Column (Operation):**
* **Column 1 (`9 + 3 = 12`):** Values range from -0.0756 to 0.3820. The token `_/` has the highest positive attribution (0.3820).
* **Column 2 (`7 x 5 = 35`):** Values are generally low, ranging from -0.0041 to 0.0909. The token `_/` has the highest attribution (0.0909).
* **Column 3 (`4900 / 100 = 49`):** Contains the single highest value in the entire heatmap: **1.9074** for the token `_/`. Other values are mostly near zero or slightly negative.
* **Column 4 (`9 - 3 = 6`):** Values range from -0.0060 to 0.6336. The token `_/` has the highest attribution (0.6336).
* **Column 5 (`6 - 6 = 0`):** Values range from -0.0691 to 0.6902. The token `_/` has the highest attribution (0.6902).
### Key Observations
1. **Dominant Token:** The token represented by `_/` (row 8) has overwhelmingly the highest attribution scores across all five arithmetic operations, peaking at 1.9074 for the division problem. Its cells are distinctly green.
2. **Low Attribution for Most Tokens:** The vast majority of tokens (rows 1-7, 9-13) have attribution scores very close to zero (e.g., 0.0001, -0.0004). Their cells are a uniform light yellow, indicating minimal contribution.
3. **Operation-Specific Patterns:** While `_/` is dominant everywhere, its relative strength varies. It is most critical for the division operation (`4900 / 100 = 49`). The subtraction operations (`9-3=6` and `6-6=0`) also show moderately high attribution for this token.
4. **Negative Attributions:** A few tokens show small negative attributions (e.g., `$` for `9+3=12` at -0.0756, `1` for `4900/100=49` at -0.0987), suggesting a slight negative influence on the model's output for those specific problems.
### Interpretation
This heatmap is likely the output of an interpretability technique (like integrated gradients or attention rollout) applied to a neural network (e.g., a language model) that solves arithmetic problems. It reveals which input tokens the model "attends to" or relies on most when computing each result.
* **The `_/` Token is Key:** The symbol `_/` is almost certainly a tokenizer's representation for the division operator (`/`). Its massive attribution score for the division problem (`4900 / 100 = 49`) is logically consistent: the model correctly identifies the division operator as the most critical component for solving that specific calculation. Its high attribution for other operations is more puzzling and could indicate that this token carries a general "operator" or "computation" signal in the model's internal representation, or it might be an artifact of the tokenization scheme.
* **Model Focus:** The model appears to focus sharply on the core operator token and largely ignores the numerical digits and punctuation (commas, decimal points, equals signs) for these particular problems. This suggests the model may have learned a strategy where identifying the operation type is the primary step, with the specific numbers being processed in a more distributed, less token-attributable way.
* **Anomaly/Insight:** The near-zero attribution for most number tokens (`0`, `1`, `6`, `8`) is striking. It implies that for these clean, single-step equations, the model's reasoning is not strongly tied to individual digit tokens in the input, but rather to a higher-level understanding encapsulated by the operator token. This could be a sign of efficient abstraction or, conversely, a limitation in how the model processes numerical values.
</details>
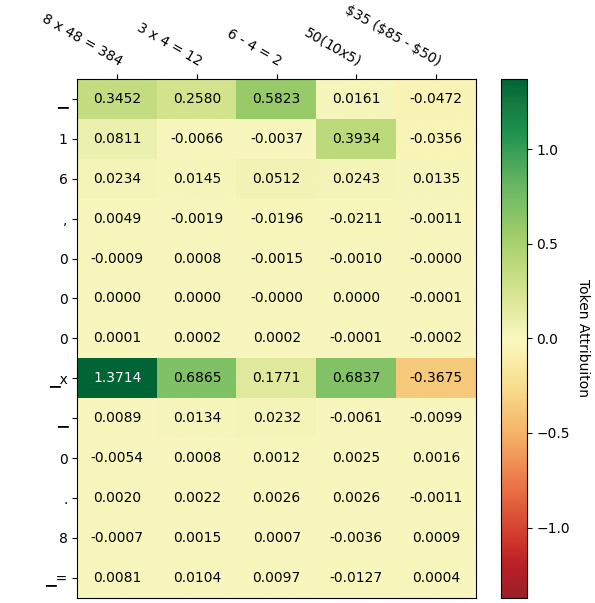
Figure 4: Visualization of token attribution for the case study. The left part stands for the score matrix of patterns from Auto-CoT, and the right part stands for the score matrix from our method. The upper column denotes each individual prompt, and the row denotes the generated token sequence. Higher scores (positive) indicate that the input has a greater impact on the output.
### Feature Attribution (RQ2)
Following the previous case study, we seek to understand why different contextual reasoning patterns alter the output of LLMs. Specifically, we employ a perturbation-based feature attribution analysis method (Winter 2002) to aid in this understanding. Traditional attention-based analysis methods have been criticized for their inability to identify the most significant features (Wiegreffe and Pinter 2019; Zhao et al. 2024), which is why we turned to this perturbation-based approach. By masking portions of the input tokens, we recompute the generation probabilities for each output token to assess the input’s attribution impact on these output tokens. We use Captum (Miglani et al. 2023) to achieve this visualization. Figure 4 presents the attribution analysis matrix for the case study. According to the visualization results, we find that when a particular pattern is overly dense in the examples, the model tends to activate related knowledge, which can lead to biased reasoning processes. Conversely, when these patterns are more diverse, the model is more likely to activate the correct reasoning pathways. Our method, by enhancing the diversity of patterns in the demonstrations, effectively reduces the distance to the reasoning task objectives.
| GPT-3.5 Auto-CoT Ours | Zero-Shot 81.26 83.54 | 83.29 58.66 62.38 | 59.44 91.53 93.11 | 90.55 |
| --- | --- | --- | --- | --- |
| Qwen | Zero-Shot | 54.93 | 35.03 | 69.07 |
| Auto-CoT | 62.53 | 30.31 | 80.31 | |
| Ours | 67.59 | 33.46 | 82.08 | |
Table 5: Result of GPT-3.5-turbo-0125 and Qwen-7b-chat model on different datasets.
### Error Robustness (RQ3)
It is worth mentioning that we do not impose supervision on the labels of the demonstrations. Therefore, we proceed to count the number of incorrect instances within the selected set, as shown in Table 4. It is intriguing to notice that the majority of our provided demonstrations are imperfect, with AQuA even exhibiting a 100% error rate. This phenomenon suggests that LLMs struggle to discern incorrect instances from correct ones. Instead, they learn from how the example approaches problem-solving, which we refer to as ‘pattern’. Our method encourages LLMs to follow the most probable reasoning chain towards the final answer and thus leads to a significant improvement.
### Results on Other Models (RQ3)
To determine whether our method is applicable to different models, we test it on various LLM branches. Specifically, we select the GPT series to represent larger and more advanced models, and Qwen to represent multilingual models. For the sake of hardware resources and budget constraints, we experiment with the GPT-3.5-turbo and Qwen-7B models. Table 5 presents the performance of several methods on these models. Notably, the experiments show that Auto-CoT, in some cases, underperforms compared to direct answering on these models. We attribute this to the inherent noise in semantics-based methods. Our approach mitigates this noise, resulting in more consistent performance improvements.
## Conclusion
This paper aims to address the noise issue inherent in unsupervised semantic-based CoT methods and proposes a reasoning pattern-based approach for CoT demonstration selection. Our method explicitly enhances the interpretability of reasoning processes and illustrates how LLMs can be guided toward generating accurate answers. Extensive experiments validate the effectiveness, robustness, and compatibility of our approach.
## Acknowledgements
This work was supported by the National Key R&D Program of China (Grant No.2023ZD0120400), Beijing Natural Science Foundation (L247028), National Natural Science Foundation of China (No. 62276260, 62076235), Beijing Municipal Science and Technology Project (Z231100007423004). We sincerely thank all reviewers and ACs for their insightful comments, time and efforts.
## References
- Agarwal et al. (2024) Agarwal, R.; Singh, A.; Zhang, L. M.; Bohnet, B.; Rosias, L.; Chan, S.; Zhang, B.; Anand, A.; Abbas, Z.; Nova, A.; Co-Reyes, J. D.; Chu, E.; Behbahani, F.; Faust, A.; and Larochelle, H. 2024. Many-Shot In-Context Learning. arXiv:2404.11018.
- Brown et al. (2020) Brown, T.; Mann, B.; Ryder, N.; Subbiah, M.; Kaplan, J. D.; Dhariwal, P.; Neelakantan, A.; Shyam, P.; Sastry, G.; Askell, A.; et al. 2020. Language models are few-shot learners. Advances in Neural Information Processing Systems, 33: 1877–1901.
- Chia et al. (2023) Chia, Y. K.; Chen, G.; Tuan, L. A.; Poria, S.; and Bing, L. 2023. Contrastive Chain-of-Thought Prompting. arXiv:2311.09277.
- Cobbe et al. (2021) Cobbe, K.; Kosaraju, V.; Bavarian, M.; Chen, M.; Jun, H.; Kaiser, L.; Plappert, M.; Tworek, J.; Hilton, J.; Nakano, R.; Hesse, C.; and Schulman, J. 2021. Training Verifiers to Solve Math Word Problems. arXiv:2110.14168.
- Fu et al. (2022) Fu, Y.; Peng, H.; Sabharwal, A.; Clark, P.; and Khot, T. 2022. Complexity-based prompting for multi-step reasoning. arXiv preprint arXiv:2210.00720.
- Hosseini et al. (2014) Hosseini, M. J.; Hajishirzi, H.; Etzioni, O.; and Kushman, N. 2014. Learning to Solve Arithmetic Word Problems with Verb Categorization. In Moschitti, A.; Pang, B.; and Daelemans, W., eds., Proceedings of the 2014 Conference on Empirical Methods in Natural Language Processing (EMNLP), 523–533. Doha, Qatar: Association for Computational Linguistics.
- Huang and Chang (2023) Huang, J.; and Chang, K. C.-C. 2023. Towards Reasoning in Large Language Models: A Survey. In Rogers, A.; Boyd-Graber, J.; and Okazaki, N., eds., Findings of the Association for Computational Linguistics: ACL 2023, 1049–1065. Toronto, Canada: Association for Computational Linguistics.
- Kojima et al. (2022) Kojima, T.; Gu, S. S.; Reid, M.; Matsuo, Y.; and Iwasawa, Y. 2022. Large language models are zero-shot reasoners. Advances in Neural Information Processing Systems, 35: 22199–22213.
- Koncel-Kedziorski et al. (2015) Koncel-Kedziorski, R.; Hajishirzi, H.; Sabharwal, A.; Etzioni, O.; and Ang, S. D. 2015. Parsing Algebraic Word Problems into Equations. Transactions of the Association for Computational Linguistics, 3: 585–597.
- Kwiatkowski et al. (2019) Kwiatkowski, T.; Palomaki, J.; Redfield, O.; Collins, M.; Parikh, A.; Alberti, C.; Epstein, D.; Polosukhin, I.; Devlin, J.; Lee, K.; et al. 2019. Natural questions: a benchmark for question answering research. Transactions of the Association for Computational Linguistics, 7: 453–466.
- Levy, Bogin, and Berant (2023) Levy, I.; Bogin, B.; and Berant, J. 2023. Diverse Demonstrations Improve In-context Compositional Generalization. In Rogers, A.; Boyd-Graber, J.; and Okazaki, N., eds., Proceedings of the 61st Annual Meeting of the Association for Computational Linguistics (Volume 1: Long Papers), 1401–1422. Toronto, Canada: Association for Computational Linguistics.
- Li et al. (2024) Li, X.; Zhao, R.; Chia, Y. K.; Ding, B.; Joty, S.; Poria, S.; and Bing, L. 2024. Chain-of-Knowledge: Grounding Large Language Models via Dynamic Knowledge Adapting over Heterogeneous Sources. In International Conference on Learning Representations ICLR 2024.
- Ling et al. (2017) Ling, W.; Yogatama, D.; Dyer, C.; and Blunsom, P. 2017. Program Induction by Rationale Generation: Learning to Solve and Explain Algebraic Word Problems. In Barzilay, R.; and Kan, M.-Y., eds., Proceedings of the 55th Annual Meeting of the Association for Computational Linguistics (ACL), 158–167. Vancouver, Canada: Association for Computational Linguistics.
- Madaan, Hermann, and Yazdanbakhsh (2023) Madaan, A.; Hermann, K.; and Yazdanbakhsh, A. 2023. What Makes Chain-of-Thought Prompting Effective? A Counterfactual Study. In Findings of the Association for Computational Linguistics: EMNLP 2023, 1448–1535.
- Miglani et al. (2023) Miglani, V.; Yang, A.; Markosyan, A. H.; Garcia-Olano, D.; and Kokhlikyan, N. 2023. Using Captum to Explain Generative Language Models. arXiv:2312.05491.
- Min et al. (2022) Min, S.; Lyu, X.; Holtzman, A.; Artetxe, M.; Lewis, M.; Hajishirzi, H.; and Zettlemoyer, L. 2022. Rethinking the Role of Demonstrations: What Makes In-Context Learning Work? In Goldberg, Y.; Kozareva, Z.; and Zhang, Y., eds., Proceedings of the 2022 Conference on Empirical Methods in Natural Language Processing, 11048–11064. Abu Dhabi, United Arab Emirates: Association for Computational Linguistics.
- Ouyang et al. (2022) Ouyang, L.; Wu, J.; Jiang, X.; Almeida, D.; Wainwright, C.; Mishkin, P.; Zhang, C.; Agarwal, S.; Slama, K.; Ray, A.; et al. 2022. Training language models to follow instructions with human feedback. Advances in Neural Information Processing Systems, 35: 27730–27744.
- Patel, Bhattamishra, and Goyal (2021) Patel, A.; Bhattamishra, S.; and Goyal, N. 2021. Are NLP Models really able to Solve Simple Math Word Problems? In Proceedings of the 2021 Conference of the North American Chapter of the Association for Computational Linguistics: Human Language Technologies, 2080–2094. Online: Association for Computational Linguistics.
- Qiao et al. (2023) Qiao, S.; Ou, Y.; Zhang, N.; Chen, X.; Yao, Y.; Deng, S.; Tan, C.; Huang, F.; and Chen, H. 2023. Reasoning with Language Model Prompting: A Survey. In Rogers, A.; Boyd-Graber, J.; and Okazaki, N., eds., Proceedings of the 61st Annual Meeting of the Association for Computational Linguistics (Volume 1: Long Papers), 5368–5393. Toronto, Canada: Association for Computational Linguistics.
- Reimers and Gurevych (2019) Reimers, N.; and Gurevych, I. 2019. Sentence-BERT: Sentence Embeddings using Siamese BERT-Networks. In Proceedings of the 2019 Conference on Empirical Methods in Natural Language Processing (EMNLP). Association for Computational Linguistics.
- Roy and Roth (2015) Roy, S.; and Roth, D. 2015. Solving General Arithmetic Word Problems. In Màrquez, L.; Callison-Burch, C.; and Su, J., eds., Proceedings of the 2015 Conference on Empirical Methods in Natural Language Processing (EMNLP), 1743–1752. Lisbon, Portugal: Association for Computational Linguistics.
- Rubin, Herzig, and Berant (2022) Rubin, O.; Herzig, J.; and Berant, J. 2022. Learning To Retrieve Prompts for In-Context Learning. In Carpuat, M.; de Marneffe, M.-C.; and Meza Ruiz, I. V., eds., Proceedings of the 2022 Conference of the North American Chapter of the Association for Computational Linguistics: Human Language Technologies, 2655–2671. Seattle, United States: Association for Computational Linguistics.
- Shao et al. (2023) Shao, Z.; Gong, Y.; Shen, Y.; Huang, M.; Duan, N.; and Chen, W. 2023. Synthetic prompting: Generating chain-of-thought demonstrations for large language models. arXiv preprint arXiv:2302.00618.
- Shum, Diao, and Zhang (2023a) Shum, K.; Diao, S.; and Zhang, T. 2023a. Automatic Prompt Augmentation and Selection with Chain-of-Thought from Labeled Data. In Bouamor, H.; Pino, J.; and Bali, K., eds., Findings of the Association for Computational Linguistics: EMNLP 2023, 12113–12139. Singapore: Association for Computational Linguistics.
- Shum, Diao, and Zhang (2023b) Shum, K.; Diao, S.; and Zhang, T. 2023b. Automatic Prompt Augmentation and Selection with Chain-of-Thought from Labeled Data. In Bouamor, H.; Pino, J.; and Bali, K., eds., Findings of the Association for Computational Linguistics: EMNLP 2023, 12113–12139. Singapore: Association for Computational Linguistics.
- Srivastava et al. (2023) Srivastava, A.; Rastogi, A.; Rao, A.; Shoeb, A. A. M.; Abid, A.; Fisch, A.; Brown, A. R.; Santoro, A.; Gupta, A.; Garriga-Alonso, A.; et al. 2023. Beyond the Imitation Game: Quantifying and extrapolating the capabilities of language models. Transactions on Machine Learning Research.
- Wang et al. (2023a) Wang, X.; Wei, J.; Schuurmans, D.; Le, Q.; Chi, E.; Narang, S.; Chowdhery, A.; and Zhou, D. 2023a. Self-Consistency Improves Chain of Thought Reasoning in Language Models. In The Eleventh International Conference on Learning Representations ICLR 2023.
- Wang et al. (2022) Wang, X.; Wei, J.; Schuurmans, D.; Le, Q.; Chi, E.; and Zhou, D. 2022. Rationale-Augmented Ensembles in Language Models. arXiv:2207.00747.
- Wang et al. (2023b) Wang, X.; Zhu, W.; Saxon, M.; Steyvers, M.; and Wang, W. Y. 2023b. Large language models are latent variable models: Explaining and finding good demonstrations for in-context learning. In Thirty-seventh Conference on Neural Information Processing Systems.
- Wei et al. (2022a) Wei, J.; Tay, Y.; Bommasani, R.; Raffel, C.; Zoph, B.; Borgeaud, S.; Yogatama, D.; Bosma, M.; Zhou, D.; Metzler, D.; Chi, E. H.; Hashimoto, T.; Vinyals, O.; Liang, P.; Dean, J.; and Fedus, W. 2022a. Emergent Abilities of Large Language Models. Transactions on Machine Learning Research. Survey Certification.
- Wei et al. (2022b) Wei, J.; Wang, X.; Schuurmans, D.; Bosma, M.; Xia, F.; Chi, E.; Le, Q. V.; Zhou, D.; et al. 2022b. Chain-of-thought prompting elicits reasoning in large language models. Advances in Neural Information Processing Systems, 35: 24824–24837.
- Weng et al. (2023) Weng, Y.; Zhu, M.; Xia, F.; Li, B.; He, S.; Liu, S.; Sun, B.; Liu, K.; and Zhao, J. 2023. Large Language Models are Better Reasoners with Self-Verification. In Bouamor, H.; Pino, J.; and Bali, K., eds., Findings of the Association for Computational Linguistics: EMNLP 2023, 2550–2575. Singapore: Association for Computational Linguistics.
- Wiegreffe and Pinter (2019) Wiegreffe, S.; and Pinter, Y. 2019. Attention is not not Explanation. In Inui, K.; Jiang, J.; Ng, V.; and Wan, X., eds., Proceedings of the 2019 Conference on Empirical Methods in Natural Language Processing and the 9th International Joint Conference on Natural Language Processing (EMNLP-IJCNLP), 11–20. Hong Kong, China: Association for Computational Linguistics.
- Winter (2002) Winter, E. 2002. The shapley value. Handbook of game theory with economic applications, 3: 2025–2054.
- Xie et al. (2022) Xie, S. M.; Raghunathan, A.; Liang, P.; and Ma, T. 2022. An Explanation of In-context Learning as Implicit Bayesian Inference. In International Conference on Learning Representations ICLR 2022.
- Xu et al. (2022) Xu, F. F.; Alon, U.; Neubig, G.; and Hellendoorn, V. J. 2022. A systematic evaluation of large language models of code. In Proceedings of the 6th ACM SIGPLAN International Symposium on Machine Programming, 1–10.
- Yang et al. (2023) Yang, Z.; Zhang, Y.; Sui, D.; Liu, C.; Zhao, J.; and Liu, K. 2023. Representative Demonstration Selection for In-Context Learning with Two-Stage Determinantal Point Process. In Proceedings of the 2023 Conference on Empirical Methods in Natural Language Processing, 5443–5456.
- Yasunaga et al. (2024) Yasunaga, M.; Chen, X.; Li, Y.; Pasupat, P.; Leskovec, J.; Liang, P.; Chi, E. H.; and Zhou, D. 2024. Large Language Models as Analogical Reasoners. In International Conference on Learning Representations ICLR 2024.
- Zhang et al. (2023) Zhang, Z.; Zhang, A.; Li, M.; and Smola, A. 2023. Automatic Chain of Thought Prompting in Large Language Models. In The Eleventh International Conference on Learning Representations ICLR 2023.
- Zhao et al. (2024) Zhao, H.; Chen, H.; Yang, F.; Liu, N.; Deng, H.; Cai, H.; Wang, S.; Yin, D.; and Du, M. 2024. Explainability for large language models: A survey. ACM Transactions on Intelligent Systems and Technology, 15(2): 1–38.
- Zhao et al. (2023) Zhao, R.; Li, X.; Joty, S.; Qin, C.; and Bing, L. 2023. Verify-and-Edit: A Knowledge-Enhanced Chain-of-Thought Framework. In Rogers, A.; Boyd-Graber, J.; and Okazaki, N., eds., Proceedings of the 61st Annual Meeting of the Association for Computational Linguistics (ACL), 5823–5840. Toronto, Canada: Association for Computational Linguistics.
- Zheng et al. (2023) Zheng, C.; Liu, Z.; Xie, E.; Li, Z.; and Li, Y. 2023. Progressive-Hint Prompting Improves Reasoning in Large Language Models. arXiv:2304.09797.
- Zhong et al. (2024) Zhong, Q.; Wang, K.; Xu, Z.; Liu, J.; Ding, L.; Du, B.; and Tao, D. 2024. Achieving 97% on GSM8K: Deeply Understanding the Problems Makes LLMs Better Solvers for Math Word Problems. arXiv:2404.14963.