# Semantic Structure-Mapping in LLM and Human Analogical Reasoning
**Authors**: Sam Musker, Alex Duchnowski, Raphaël Millière, Ellie Pavlick
Abstract
Analogical reasoning is considered core to human learning and cognition. Recent studies have compared the analogical reasoning abilities of human subjects and Large Language Models (LLMs) on abstract symbol manipulation tasks, such as letter string analogies. However, these studies largely neglect analogical reasoning over semantically meaningful symbols, such as natural language words. This ability to draw analogies that link language to non-linguistic domains, which we term semantic structure-mapping, is thought to play a crucial role in language acquisition and broader cognitive development. We test human subjects and LLMs on analogical reasoning tasks that require the transfer of semantic structure and content from one domain to another. Advanced LLMs match human performance across many task variations. However, humans and LLMs respond differently to certain task variations and semantic distractors. Overall, our data suggest that LLMs are approaching human-level performance on these important cognitive tasks, but are not yet entirely human like.
keywords: language models , analogies , structure-mapping journal: review.
Brown University
Macquarie University
1 Introduction
The recent advances of large language models (LLMs) have raised the question of whether LLMs can serve as useful cognitive models in the study of various aspects of human learning, cognition, and behavior [1, 2, 3]. One such recent debate has focused on whether LLMs acquire the ability to perform analogical reasoning as a by-product of their self-supervised learning objective [4, 5, 6, 7]. Analogical reasoning—the ability to align abstract structures between a source and target domain—is posited to play a central role in human learning and generalization, for example, our ability to reason efficiently in unfamiliar domains [8, 9]. Thus, the question of whether LLMs can reason analogically in a human-like way directly bears on their ability to serve as computational models of human behavior beyond just next-word prediction.
Recent work has focused on the ability of advanced LLMs to match human analogical reasoning performance on tasks that involve recognition of spatial and logical transformations in matrices [4] or detecting patterns in strings of letters or numbers [7]. For example, Mitchell [7] uses analogy tasks such as abcd:abce::ijkl:?? in order to test the extent to which LLMs and humans can recognize and generalize abstract structures and operations (in this example, ordered sequences and successor functions). Such studies have produced mixed results, with evidence suggesting that advanced LLMs achieve the same performance and even produce similar error patterns to those observed in humans [4, 6], but with doubts remaining about the robustness of LLMs’ abilities, particularly with respect to increasingly abstract and challenging domains [10].
Previous work has focused almost exclusively on analogies using abstract and arbitrary symbols, where structures are derived from symbols’ spatial positions in the text prompt, but the symbols themselves are unimportant. This leaves out questions about reasoning analogically over semantically meaningful symbols, such as words in natural language. This type of analogical reasoning, which we call semantic structure-mapping, requires mapping between semantic structure in one domain (e.g., the relationship between a dog and a puppy, or that a dog has four legs) and non-semantic (arbitrary) structure in the other domain (e.g., spatial position in the text prompt). This type of mapping is thought to play a crucial role in human cognition and development, such as in the language-analogical reasoning feedback loop proposed by Structure-Mapping Theory (SMT) [11]. Moreover, if LLMs are to provide insight into how humans perform certain cognitive functions, it will likely involve the role of distributional semantic learning [12, 13, 14] in the acquisition or representation of those functions. Therefore, we focus on investigating how humans and LLMs compare in tasks requiring semantic structure-mapping and assessing whether patterns differ from those observed on tasks involving only arbitrary symbols.
We design two experiments, focused respectively on the mapping of semantic structure (i.e., semantic relationships between symbols, such as relating the symbol dog to the symbol puppy) and semantic content (i.e., information attached to a symbol such as the knowledge that a dog has four legs). In each experiment, the subject (human or LLM) is presented with a set of left-hand terms (the source domain) and a corresponding set of right-hand terms (the target domain), with the final right-hand term omitted. The subject is asked to fill in this blank. An exact copy of our prompt and an example question is shown in Figure 1. We design multiple variants of such questions designed to probe structure-mapping that involves semantic structure and semantic content, respectively. We additionally design a series of control and distractor conditions—e.g., interleaving informative mappings (square => C C C) with uninformative ones (lime => X X X) in order to expose differences in the underlying mechanism.
Overall, the most advanced LLMs we tested match human performance across our primary conditions, even producing human-like error patterns. However, significant differences emerge in several control settings. Even the most advanced LLMs show more sensitivity than humans to information presentation order and struggle to ignore irrelevant semantic information that humans readily dismiss. Thus, our results contribute to the ongoing debate about analogical reasoning, corroborating both work arguing for impressive LLM performance [4, 15] and work highlighting important mechanistic differences between humans and LLMs [10, 16]. Code and data are available at https://github.com/AnonymousReview123/Semantic_Structure_Mapping_Anon. By presenting data on the unique role of semantic structure and content in analogical reasoning, we suggest differences remain in how LLMs and humans represent and map semantic structure, although this gap may be closing as models increase in size and incorporate more diverse training signals. We argue that this has important implications for studying cognitive development and the role of LLMs in this research going forward.
2 Methods
2.1 Experiment Details
2.1.1 Semantic Structure
Each subject was presented with a quiz, which is a sequence of four such questions generated using four sets of base domains and four sets of target domains selected such that a participant sees each base and target domain exactly once. Eight variants of the task were devised to investigate the influence of task variations as described above.
Questions are introduced with the prompt “We are conducting an experiment on general reasoning abilities. Below we will show you various words and drawings of each, after which you will need to complete the last drawing. Respond as concisely as possible with only the last drawing.” We use the term “drawings” to describe the elements in the target domain because it loosely encapsulates the idea of mapping between the source and target domains. In a similar way to how drawings serve as partial structurally isomorphic representations that depict a subject with varying degrees of abstraction [17], the elements in our target domains establish a space of relations that are isomorphic to those in the source domain. In some cases the term “drawing” is straightforwardly applicable, as when the capitalization of characters corresponds to the term for a mature animal. In other cases the use is strained, as when capitalization instead corresponds to a shape being symmetrical. The transparently liberal use of the term “drawing” is used to prime subjects to reason creatively while attending to the correspondence between source and target domains. The prompt’s lack of reference to analogical reasoning accesses pre-theoretic responses to the extent possible. For the same purpose the experiment is introduced to human subjects and LLMs as studying “general reasoning abilities.”
2.1.2 Semantic Content
Each condition (described in Table 4) contains two quizzes, with four questions per quiz. Unless otherwise stated, methodological details of the Semantic Content experiment match those of the Semantic Structure experiment.
The four conditions are divided into those that require numeric reasoning and those that do not. Within the numeric and non-numeric conditions respectively, one condition utilizes only one dimension of variation (referred to as “single-attribute”) whereas another adds a second dimension of variation (“multi-attribute”). This allows for comparing the relative performance of human subjects and models when the task is made to require compositional reasoning over layered transformations.
Questions were formatted like the following example:
| horse => * * * * |
| --- |
| cat => * * * * |
| ant => ! ! ! ! ! ! |
| bee => ! ! ! ! ! ! |
| chicken => ! ! |
| spider => ! ! ! ! ! ! ! ! |
| dog => * * * * |
| human => |
In this example, the number of symbols corresponds to a number-of-legs feature, and the usage of exclamation marks and asterisks corresponds to an egg-laying feature (or, alternatively, a mammal feature). The right-hand sequences of characters thereby encode properties of the entities denoted by the left-hand words. Given that humans are two-legged mammals, the correct answer here would be * *. In order to solve this task, the participant must understand both aspects of the information encoded in the right-hand terms and then construct the answer by generalizing to a new example.
2.2 Participants
2.2.1 LLMs
We run our experiments on the following LLMs: GPT-3 [18], GPT-4 [19], Pythia-12B [20], Claude 2 [21], Claude 3 Opus [22], and Falcon-40B [23]. All of the above are transformer-based LLMs trained primarily on a next word prediction objective.
GPT-3 consists of a 175B parameter model trained on text completion and finetuned to produce more coherent answers. The details of GPT-4 are not publicly known, but it is considered by some sources to be a mixture-of-experts (MoE) model consisting of numerous GPT-3-scale language models [24]. GPT-4, unlike GPT-3, supplements text-completion pretraining and finetuning with reinforcement learning from human feedback (RLHF) in order to better align model outputs with the expectations of a human user. The training of Claude 2 also includes RLHF, but its performance falls short of GPT-4. The more recent Claude 3 (in our case, the most advanced Opus version) is considered to approximately match GPT-4 performance in general. GPT-3 and -4 are developed by OpenAI, whereas Claude 2 and 3 are developed by Anthropic. Pythia-12B and Falcon-40B are open-weights LLMs trained on a text-completion objective and consist of 12B and 40B parameters respectively. Neither undergoes RLHF. Pythia-12B is developed by EleutherAI, and Falcon-40B is developed by the Technology Innovation Institute.
2.2.2 Human Subjects
We also test human participants on our experiments. Reported in the main text are results obtained from 194 (mostly undergraduate) University-Name University students (132 in the Semantic Structure experiment, and 62 in the Semantic Content experiment). The split of participants between experiments approximately matches the 9:4 ratio of experiment conditions. The number of participants by condition are as follows: Defaults 18, Distracted 18, Only RHS 18, Permuted Pairs 17, Permuted Questions 17, Random Finals 15, Random Permuted Pairs 6, Randoms 8, Relational 15, Categorial 16, Multi Attribute 16, Numeric 16, Numeric Multi Attribute 14. The Relational, Categorial, Multi Attribute, Numeric, and Numeric Multi Attribute conditions each have two quizzes while the remaining conditions each have four quizzes per condition. Subjects were assigned randomly to a single quiz from one condition without the re-use of subjects. Roughly the same number of participants were assigned to each condition, with the exception of the Random and Random Permuted Pairs conditions. These were together assigned roughly the expected number of subjects for a single condition due to their similarity.
The subjects were recruited through email advertisements and offered $10 in compensation. Earlier results obtained for the Semantic Structure experiment from an online sample of participants recruited through Prolific are reported in Figure 11 of the Appendix.
We ensure that humans and LLMs are given comparable information in our prompting design. A given human participant sees one quiz with four questions, with questions revealed one at a time with the answer shown following each response. LLMs are prompted with the first question of a quiz, then the second question with the first question and its (correct) answer accumulating in the prompt, and so forth for the four questions in a quiz. This prompt accumulation mimics the availability in the memory of human subjects of previous answers within a quiz.
2.3 Statistical testing
In each experiment, we are interested in the relative performance of human subjects and the best-performing models and how this depends on the particular experiment conditions. Differences between most models and human subjects are large and do not require statistical analysis, and so we focus our statistical analysis on the performance of GPT-4 relative to human subjects and Claude 3 relative to human subjects.
For each experiment and pair of subjects (human subjects and GPT-4, or human subjects and Claude 3) we fit a logistic model to the data with and without interactions between the subject type and the experiment condition. In all cases, the outcome variable is the un-aggregated per-question score achieved by a subject (either a 0 or 1), and the predictor variables are experiment condition (e.g. “Defaults” or “Permuted Pairs”) and subject type (e.g. “human subjects” or “GPT-4”). We use four likelihood ratio tests to assess whether the interaction between subject type and experiment condition is significant for a given pair of subjects within a particular experiment, as motivated by Glover [25]. In all four cases the interaction is significant, and so we use simple effects analysis to investigate the direction and significance of the effect of subject type within particular conditions.
For the semantic content experiment, we additionally perform a logistic simple effects analysis comparing the performance of a single subject type (human, GPT-4, or Claude 3) in compositional versus non-compositional conditions for the numeric and non-numeric cases respectively with the non-compositional condition as reference. For example, we assess the effect of the condition being Multi Attribute with Categorial as the reference condition for only the subject type Claude 3 (and likewise for the other two examined subject types).
Further details are provided in Sections A.1 and A.2 of the Appendix.
3 Results
3.1 Mapping Semantic Structure
We first design a set of experiments investigating the ability of LLMs and human subjects to map semantic structure in the source domain onto arbitrary, non-semantic structure in the target domain. In this set of experiments, our source domain (left-hand side) is a set of words which are assumed to possess some relational structure, and our target domain (right-hand side) is a set of strings related via non-linguistic string operations.
| We are conducting an experiment on general reasoning abilities. Below we will show you various words and drawings of each, after which you will need to complete the last drawing. Respond as concisely as possible with only the last drawing. |
| --- |
| Question 1: |
| square => C C C |
| rectangle => c c c |
| circle => C C |
| oval => |
square rectangle circle oval C C C c c c C C c c
Figure 1: An example question (from the Defaults condition of the Semantic Structure experiment) with a representation of the structure-mapping solution below. The source domain is in blue and the target domain is in orange (for the provided elements) and yellow (for the inferred element).
3.1.1 Overall Performance
Human subjects perform well overall, obtaining accuracy between 0.4 and 0.9 across the various conditions. The most advanced LLMs that we test attain accuracies in the range 0.1-0.95 across conditions. This performance range is comparable to prior work on analogical reasoning over arbitrary symbols. For example, the results of human subjects on the “zero-generalization setting” studied by both Webb et al. [4] and Mitchell et al. [10] range from 0.2-0.8 in the former study and from 0.5-1.0 in the latter study. Similarly, results for LLMs (GPT-3, GPT-3.5, and GPT-4) across those conditions range from 0.1-1.0 in the two studies. Thus, our data suggest that analogies involving semantic structure-mapping are not inherently easier or harder than those which make use of arbitrary symbols.
Our Defaults condition consists of lexical items as a source domain and one of several string operation relations as a target domain. To investigate the robustness of performance metrics, we introduce three control conditions: (1) Permuted Questions, in which we present unaltered versions of the core task with varied question ordering; (2) Permuted Pairs, in which we alter the order in which the lines of the analogy are presented; and (3) Distracted, in which we interleave unrelated mappings between the lines of the target analogy. These conditions are shown in Table 1. We do not expect Permuted Questions to materially alter the task, but might see some effect of the Permuted Pairs and Distracted conditions, as they could make the relevant relations less transparent: see, for example, work on the blocking advantage in humans [26] and in LLMs [27].
| Defaults | Basic test of semantic structure-mapping | square => C C C rectangle => c c c circle => C C oval => |
| --- | --- | --- |
| Permuted Pairs | Like Defaults, but with row order permuted | rectangle => c c c circle => C C square => C C C oval => |
| Distracted | Like Defaults, but with a distractor row added | square => C C C rectangle => c c c pillow => A P circle => C C oval => |
Table 1: Defaults and control conditions used to measure ability of humans and LLMs to perform analogical reasoning tasks that involve semantic structure-mapping. The Permuted Questions condition (not shown) is identical to Defaults, but with question order permuted.
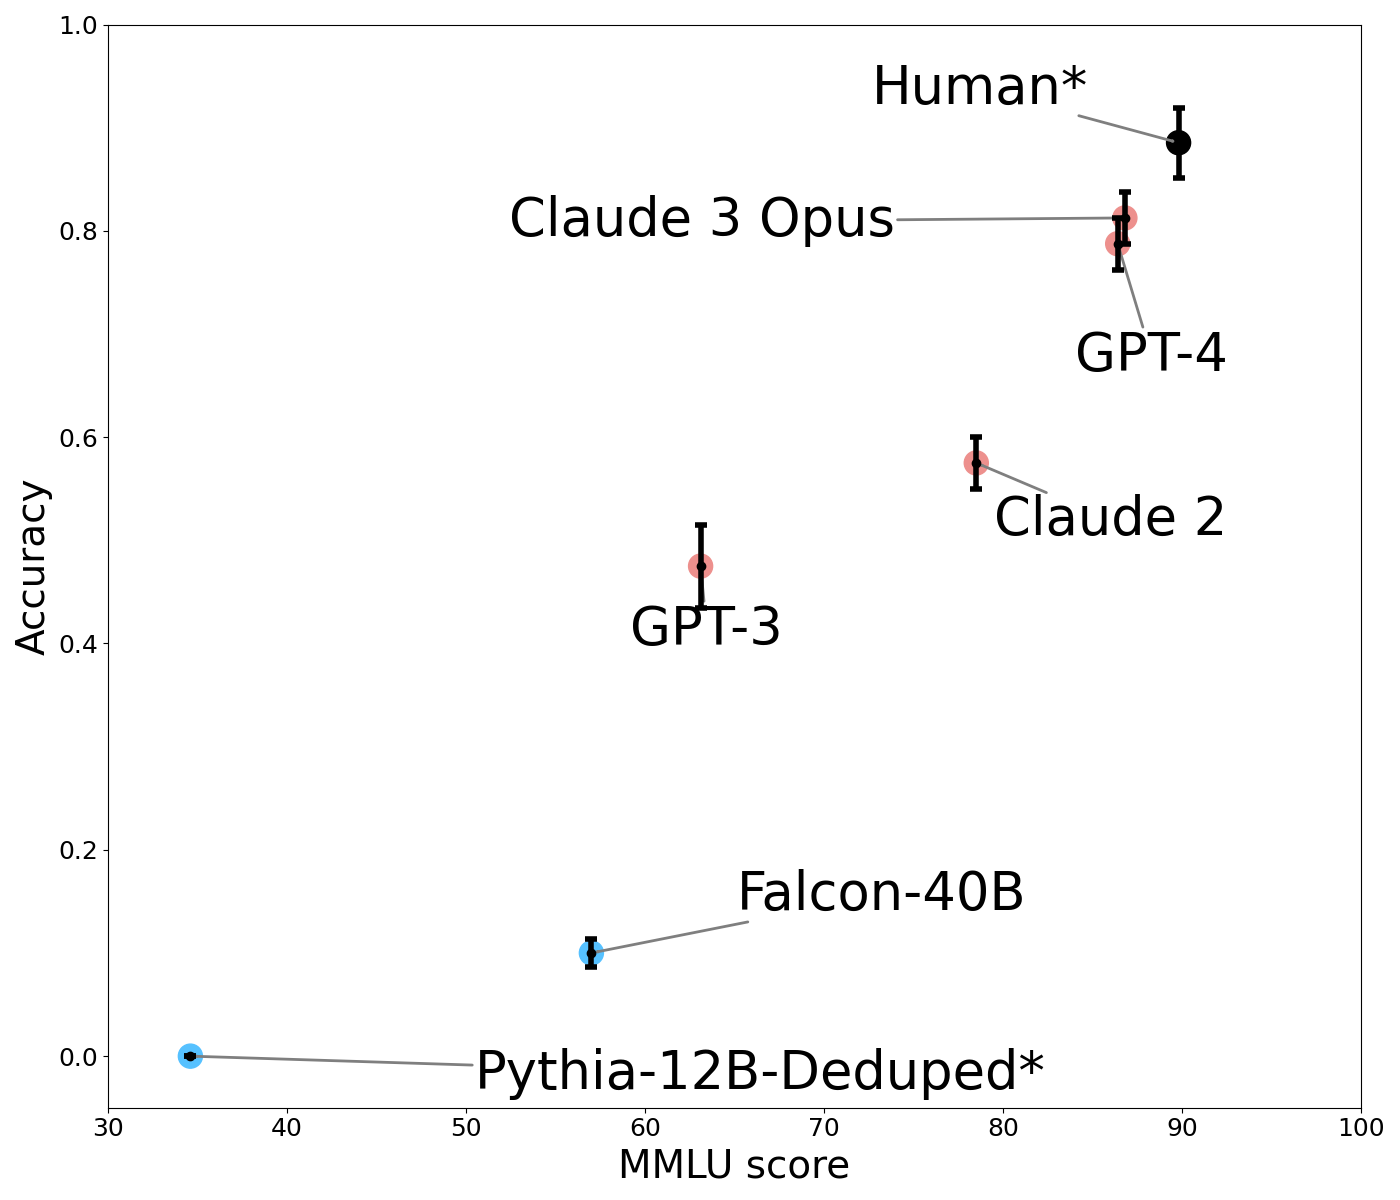
Figure 2 shows the performance of humans and LLMs in the Defaults condition as a function of their performance on MMLU MMLU scores are few-shot for GPT-4 and 5-shot for other models. The reported human baseline is the estimate for human experts given by Hendrycks et al. [28]. The score for Pythia 12B could not be found and so we use the reported value for Pythia 6.9B Tulu., a widely-used language competency benchmark. Increasing MMLU score is associated with higher accuracy on the Defaults condition. Smaller models do not perform competitively (Pythia-12B obtains an accuracy of 0.0, Falcon 40B 0.1, GPT-3 0.5, and Claude 2 0.6). This steadily increasing performance is presumed to correlate with the scale of model parameters and training data [29]. We focus our remaining analysis on comparing human subjects to GPT-4 and Claude 3. In the Defaults condition, neither GPT-4 (coef=-0.7696, z=-1.659, p=0.097) nor Claude 3 (coef=-0.6131, z=-1.299, p=0.194) performs significantly worse than human subjects.
<details>
<summary>extracted/5679376/Images/Comparison_Default_MMLU.png Details</summary>
### Visual Description
\n
## Scatter Plot: Model Performance Comparison
### Overview
This scatter plot compares the performance of several large language models (LLMs) based on two metrics: MMLU score (Massive Multitask Language Understanding) and Accuracy. Each model is represented by a data point with error bars indicating uncertainty. The plot aims to visualize the trade-off between these two metrics and benchmark model capabilities against human performance.
### Components/Axes
* **X-axis:** MMLU Score, ranging from approximately 30 to 100. Labeled "MMLU score".
* **Y-axis:** Accuracy, ranging from 0.0 to 1.0. Labeled "Accuracy".
* **Data Points:** Represent individual LLMs. Each point has error bars extending horizontally and vertically, indicating the standard deviation or confidence interval.
* **Models:**
* Human\* (Black)
* Claude 3 Opus (Red)
* GPT-4 (Red)
* Claude 2 (Orange)
* GPT-3 (Dark Green)
* Falcon-40B (Blue)
* Pythia-12B-Deduped\* (Blue)
* **Asterisk (\*):** Appears next to "Human" and "Pythia-12B-Deduped", potentially indicating a specific data source or methodology.
### Detailed Analysis
The plot shows a general trend of increasing accuracy with increasing MMLU score. Let's analyze each model's position and error bars:
* **Human\***: Located at approximately (92, 0.95). The error bars are small, indicating high consistency.
* **Claude 3 Opus**: Located at approximately (85, 0.84). Error bars are relatively small.
* **GPT-4**: Located at approximately (85, 0.82). Error bars are relatively small.
* **Claude 2**: Located at approximately (78, 0.62). Error bars are moderate in size.
* **GPT-3**: Located at approximately (62, 0.48). Error bars are moderate in size.
* **Falcon-40B**: Located at approximately (60, 0.12). Error bars are moderate in size.
* **Pythia-12B-Deduped\***: Located at approximately (52, 0.02). Error bars are moderate in size.
The lines connecting the data points to their labels are straight and direct. The color scheme is consistent, with each model having a unique color.
### Key Observations
* **Human performance** sets the upper bound for both MMLU score and Accuracy.
* **Claude 3 Opus** and **GPT-4** are the closest to human performance, exhibiting high scores on both metrics.
* **Claude 2**, **GPT-3**, **Falcon-40B**, and **Pythia-12B-Deduped** show progressively lower performance, with a significant drop in accuracy as MMLU score decreases.
* **Pythia-12B-Deduped** has the lowest accuracy and MMLU score among the models presented.
* The error bars suggest that the performance of some models (e.g., GPT-3, Claude 2) has more variability than others (e.g., Human, Claude 3 Opus).
### Interpretation
The data suggests a strong positive correlation between MMLU score and accuracy for these LLMs. Models with higher MMLU scores generally exhibit higher accuracy. This indicates that the MMLU score is a useful metric for evaluating the overall capabilities of these models.
The proximity of Claude 3 Opus and GPT-4 to human performance suggests that these models are approaching human-level intelligence on the tasks assessed by these metrics. The significant gap between these top-performing models and the others highlights the ongoing advancements in LLM technology.
The asterisk next to "Human" and "Pythia-12B-Deduped" could indicate that the data for these points was obtained using a different methodology or represents a specific subset of human or model performance. Further investigation would be needed to understand the significance of these asterisks.
The error bars provide valuable information about the reliability of the performance measurements. Larger error bars suggest that the model's performance is more sensitive to variations in the input data or evaluation process.
</details>
Figure 2: Human and LLM accuracy in the Defaults condition, relative to performance on the MMLU benchmark. Models in blue are not instruction-tuned while models in orange are. Error bars show standard errors.
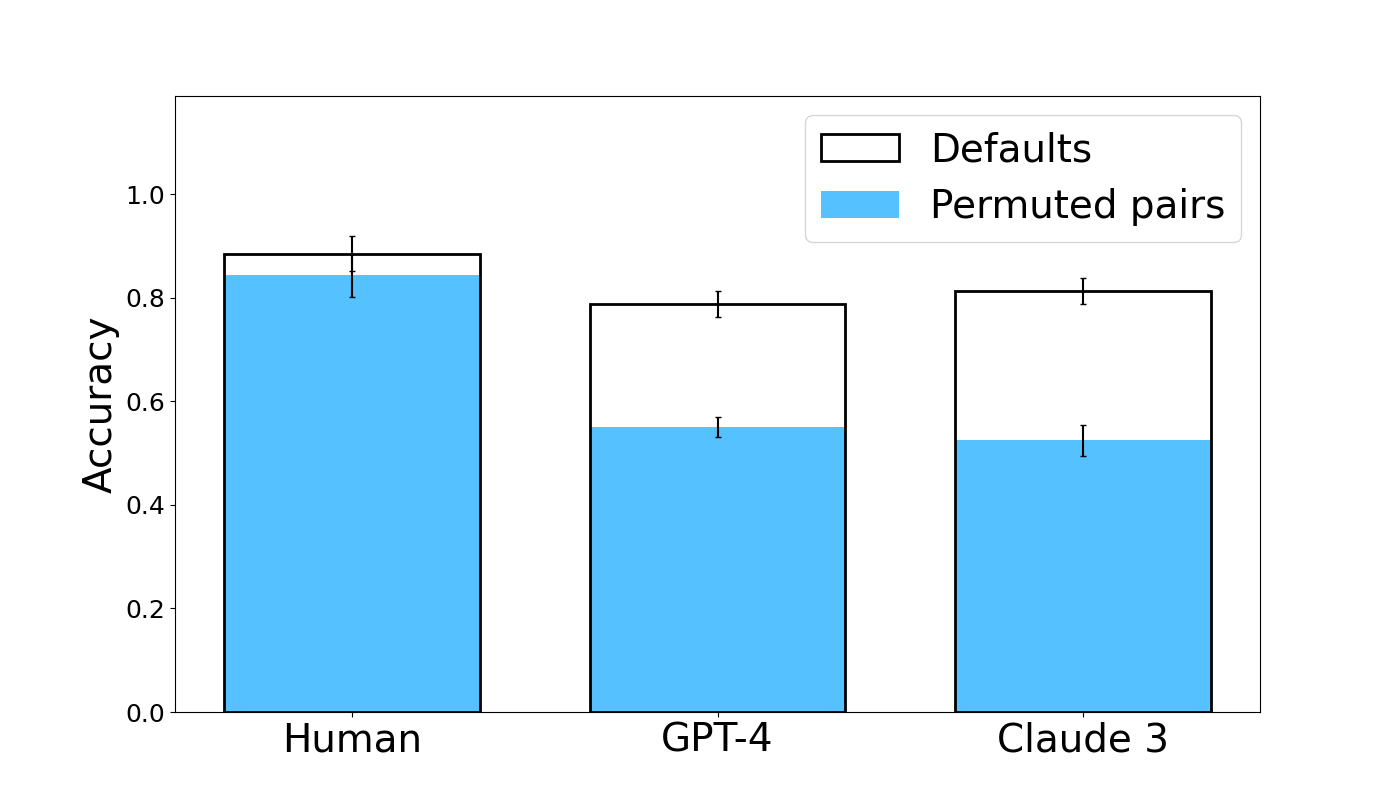
Figure 3 compares humans to high-performing LLMs in the Defaults and Permuted Pairs conditions. LLM performance drops in the Permuted Pairs condition, while humans seem equally able to infer the mapping regardless of word presentation order. This effect is significant for both Claude 3 (coef = -1.7802, z = -4.217, p < 0.001) and GPT-4 (coef = -1.6796, z = -3.975, p < 0.001). This suggests that, while the overall performance is comparable, there are likely meaningful mechanistic differences in how the analogy is processed in humans versus LLMs. The remaining control conditions and data for all tested models are shown in Figure 15 of the Appendix . In these conditions, we find that humans and models are roughly equally affected. For example, accuracy in the Distracted condition drops by approximately 0.25 for all three subject types.
<details>
<summary>extracted/5679376/Images/fig3_new.png Details</summary>
### Visual Description
\n
## Bar Chart: Accuracy Comparison - Human, GPT-4, and Claude 3
### Overview
This bar chart compares the accuracy of three entities – Human, GPT-4, and Claude 3 – under two conditions: "Defaults" and "Permuted pairs". Accuracy is represented on the y-axis, and the entities are displayed on the x-axis. Each entity has two bars representing its accuracy under each condition. Error bars are present on top of each bar, indicating the variability or confidence interval.
### Components/Axes
* **X-axis:** Entity - labeled as "Human", "GPT-4", and "Claude 3".
* **Y-axis:** Accuracy - ranging from 0.0 to 1.0, with increments of 0.2.
* **Legend:** Located in the top-right corner.
* "Defaults" - represented by a black outline.
* "Permuted pairs" - represented by a light blue fill.
### Detailed Analysis
The chart consists of six bars, grouped by entity. Each entity has a bar for "Defaults" and a bar for "Permuted pairs". Error bars are shown on top of each bar.
* **Human:**
* "Defaults": Approximately 0.86.
* "Permuted pairs": Approximately 0.83.
* **GPT-4:**
* "Defaults": Approximately 0.78.
* "Permuted pairs": Approximately 0.56.
* **Claude 3:**
* "Defaults": Approximately 0.82.
* "Permuted pairs": Approximately 0.54.
The error bars indicate the following approximate ranges:
* **Human Defaults:** 0.82 - 0.90
* **Human Permuted Pairs:** 0.79 - 0.87
* **GPT-4 Defaults:** 0.74 - 0.82
* **GPT-4 Permuted Pairs:** 0.52 - 0.60
* **Claude 3 Defaults:** 0.78 - 0.86
* **Claude 3 Permuted Pairs:** 0.50 - 0.58
### Key Observations
* Humans exhibit the highest accuracy in both conditions ("Defaults" and "Permuted pairs").
* The accuracy of both GPT-4 and Claude 3 decreases significantly when switching from "Defaults" to "Permuted pairs".
* GPT-4 and Claude 3 have similar accuracy under the "Permuted pairs" condition.
* The error bars suggest that the accuracy of "Defaults" is more consistent than "Permuted pairs" for all three entities.
### Interpretation
The data suggests that humans outperform both GPT-4 and Claude 3 in this accuracy comparison. The significant drop in accuracy for GPT-4 and Claude 3 when presented with "Permuted pairs" indicates that their performance is sensitive to the order or arrangement of the input data. This could imply that these models rely on positional cues or patterns that are disrupted by the permutation process. The relatively stable performance of humans suggests a greater ability to generalize and maintain accuracy even when the input is altered. The error bars indicate that the human performance is more consistent, while the AI models show more variability. This could be due to the inherent stochasticity of the models or the complexity of the task. The fact that GPT-4 and Claude 3 perform similarly under the "Permuted pairs" condition suggests that they may share similar vulnerabilities to this type of manipulation.
</details>
Figure 3: Human and LLM accuracy in the Defaults and Permuted Pairs conditions. Error bars show standard errors.
3.1.2 Effect of Semantic Structure on Reasoning
We next investigate more directly the extent to which humans and LLMs leverage semantic structure in order to complete our analogy tasks. To do this, we design three variants of our Defaults analogy task (see Table 2). First, the Only RHS condition removes the source domain entirely. High performance in this condition thus indicates that a subject is able to complete the questions based only on the evident pattern in the target domain. We then introduce two variants which make the semantic structure in the source domain less coherent: the Randoms condition uses unrelated words, while the Random Finals condition uses of three related words followed by one random word. We thus take the performance difference between the RHS Only condition and either the Random or Random Final condition to be a measure of the subject’s bias toward using the semantic structure of the source domain. That is, if the subject is capable of solving the task by simply ignoring the left hand side (the Only RHS condition), then poor performance in the other conditions indicates that the subject was misled by the presence of the altered left hand side.
| Only RHS | Test of how well the answer can be inferred without using any structure-mapping | C C C c c c C C |
| --- | --- | --- |
| Randoms | Variant of Defaults in which there is no semantic structure relating the words on the left hand side | banana => C C C fireplace => c c c bean => C C plug => |
| Random Last | Variant of Defaults in which the final term is not semantically related to the preceding terms | square => C C C rectangle => c c c circle => C C lime => |
Table 2: Conditions involving alteration or omission of the source domain. The Random Permuted Pairs condition (not shown) is identical to Randoms, but with the order of elements within questions permuted.
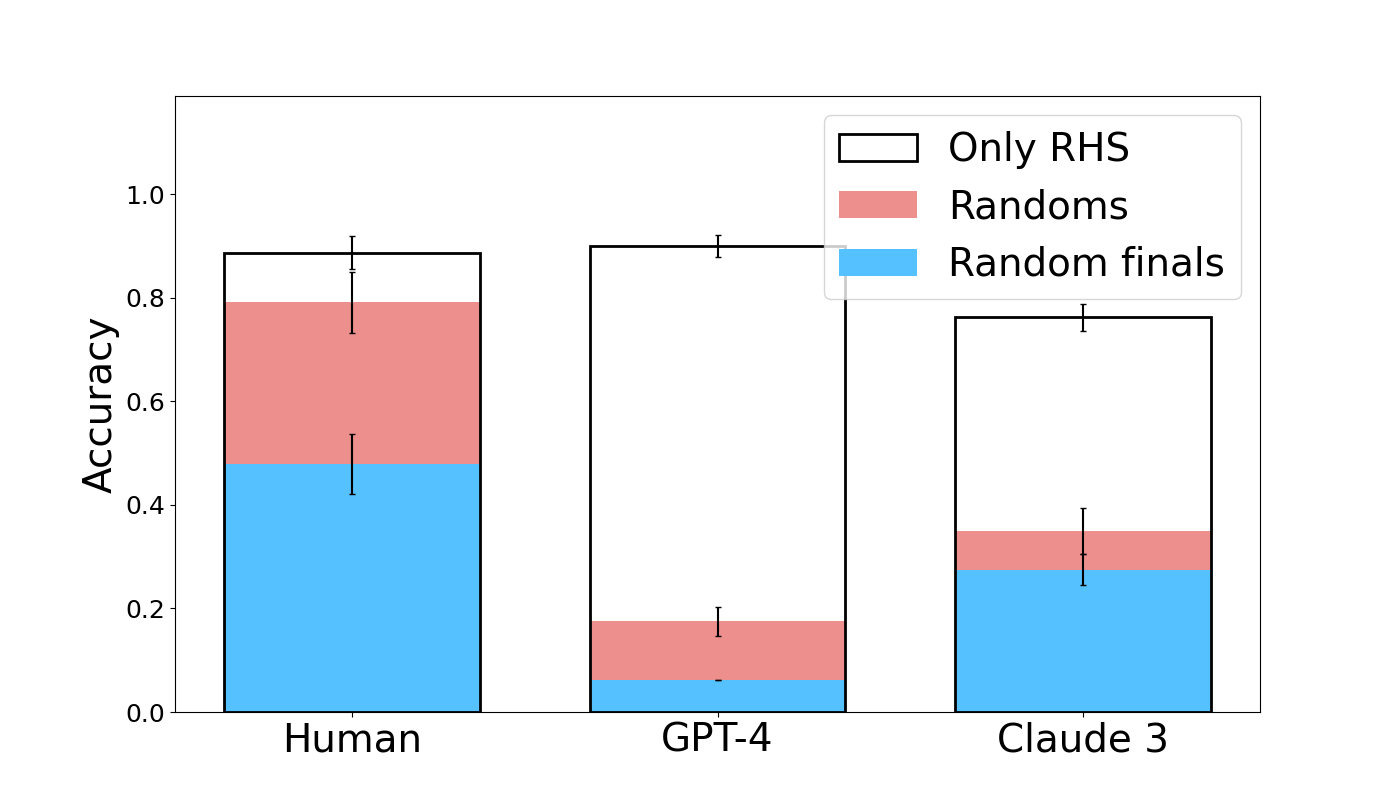
Both humans and models competently complete the Only RHS condition (see Figure 4). Accuracy is approximately 0.8 for Claude 3 with human subjects and GPT-4 slightly higher at 0.9. GPT-4 is not significantly different from humans in this condition (coef = 0.1178, z = 0.223, p = 0.824), and Claude 3 is worse than humans by a barely significant margin (coef = -0.9130, z = -1.994, p = 0.046). Thus, both humans and LLMs are able to complete the task without the guidance of the left hand side. Considering this, we look at the performance degradation associated with encountering incoherent semantic structure on the left hand side. Humans exhibit a modest decrease in accuracy of about 0.15 in the Random and Random Permuted Pairs conditions relative to defaults. Claude-3 and GPT-4, however, exhibit much larger drops: Claude 3 decreases by approximately 0.5 relative to Defaults, while GPT-4 decreases by 0.6 and 0.4 in the Random and Random Permuted Pairs conditions. Across these two conditions, both GPT-4 (coef = -2.1972, z = -5.211, p < 0.001) and Claude 3 (coef = -2.0680, z = -4.960, p < 0.001) perform significantly worse than humans.
<details>
<summary>extracted/5679376/Images/fig4_new.png Details</summary>
### Visual Description
\n
## Bar Chart: Accuracy Comparison of Human, GPT-4, and Claude 3
### Overview
This bar chart compares the accuracy of three entities – Human, GPT-4, and Claude 3 – across three different conditions: "Only RHS", "Randoms", and "Random finals". Accuracy is represented on the y-axis, and the entities are displayed on the x-axis. Each bar is a stacked bar, showing the contribution of each condition to the overall accuracy. Error bars are present on top of each bar, indicating the uncertainty in the accuracy measurements.
### Components/Axes
* **X-axis:** Entity - labeled "Human", "GPT-4", and "Claude 3".
* **Y-axis:** Accuracy - ranging from 0.0 to 1.0, with increments of 0.2.
* **Legend:** Located in the top-right corner.
* "Only RHS" - represented by a white fill with a black outline.
* "Randoms" - represented by a light red fill with a black outline.
* "Random finals" - represented by a light blue fill with a black outline.
* **Error Bars:** Black vertical lines extending above each bar, indicating standard error or confidence intervals.
### Detailed Analysis
The chart consists of three stacked bar groups, one for each entity. Each bar is divided into three sections corresponding to the legend categories.
**Human:**
* "Random finals" (light blue): Approximately 0.52 ± 0.06 (estimated from error bar range).
* "Randoms" (light red): Approximately 0.25 ± 0.06.
* "Only RHS" (white): Approximately 0.12 ± 0.06.
* Total Accuracy: Approximately 0.89 ± 0.06.
**GPT-4:**
* "Random finals" (light blue): Approximately 0.10 ± 0.04.
* "Randoms" (light red): Approximately 0.12 ± 0.04.
* "Only RHS" (white): Approximately 0.72 ± 0.04.
* Total Accuracy: Approximately 0.94 ± 0.04.
**Claude 3:**
* "Random finals" (light blue): Approximately 0.32 ± 0.06.
* "Randoms" (light red): Approximately 0.08 ± 0.06.
* "Only RHS" (white): Approximately 0.48 ± 0.06.
* Total Accuracy: Approximately 0.88 ± 0.06.
### Key Observations
* GPT-4 exhibits the highest accuracy overall, primarily driven by its performance in the "Only RHS" condition.
* Human accuracy is largely contributed by the "Random finals" and "Randoms" conditions.
* Claude 3 shows a more balanced contribution from all three conditions.
* The error bars suggest that the accuracy measurements for all entities and conditions have some degree of uncertainty.
* GPT-4 has a significantly higher "Only RHS" component than the other two.
### Interpretation
The data suggests that GPT-4 excels at tasks involving "Only RHS" (Right Hand Side), while humans perform better with "Random finals" and "Randoms". Claude 3 demonstrates a more consistent performance across all conditions. The stacked bar format effectively illustrates the composition of accuracy for each entity, highlighting the relative importance of each condition. The error bars indicate that the differences in accuracy between the entities may not always be statistically significant, but the trends are clear. The "Only RHS" condition might represent a specific type of reasoning or problem-solving that GPT-4 is particularly well-suited for, while humans may rely more on pattern recognition or intuition ("Randoms" and "Random finals"). The data could be used to inform the selection of the most appropriate entity for different types of tasks.
</details>
Figure 4: Human and LLM accuracy in Only RHS, Randoms, and Random finals conditions. Data from the Random Permuted Pairs condition is shown in Figure 15 of the Appendix . Error bars show standard errors.
From this we conclude that human subjects are able to easily identify when the left hand side contains no useful semantic structure to leverage. When there is none, they are able to employ a strategy that only relies on the right hand side. By contrast, models do not seem capable of easily identifying the lack of informativeness of the left hand side in these conditions, as they do not use the strategy of only attending to the right hand side, even though they show their capability of using this strategy when no left hand side is present. This suggests mechanistic differences between how human subjects and models process this task.
Although the performance of human subjects does not drop notably in the Random condition compared to the Only RHS condition, it does drop by a wide margin in the Random Finals condition. In this condition, accuracy is approximately 0.5 lower than in the Only RHS condition. This further suggests that the semantic relatedness of the left hand side affects the strategy of human subjects: when the left hand side is clearly unrelated, the information it provides is discarded, but when much of the left hand side appears related, the information is not discarded and the random final word of the source domain prompts an incorrect answer from human subjects. Models also show a large drop in performance in the Random Finals condition relative to Only RHS, with Claude 3 dropping by 0.5 and GPT-4 dropping by 0.8. Simple effects analysis shows that both Claude 3 (coef = -1.0464, z = -2.799, p = 0.005) and GPT-4 (coef = -2.7850, z = -5.168, p < 0.001) are significantly worse than humans in the Random Finals condition. However, we see this difference as less informative than that both models drop in performance across all the random conditions relative to their own performance in the Only RHS condition.
3.1.3 Other Observations
We additionally analyze the extent to which human subjects and models improve by question (Figure 14 of the Appendix), and the extent to which the errors made by humans and models follow the same distribution across questions grouped by target domain and across qualitative error types (Figure 13 and Table 5 of the Appendix). We find that humans and models alike improve over subsequent questions, adding to a body of evidence about in-context learning [30, 31, 32]. Humans and models show similar error distributions by target domain, but qualitative error types reveal a closer correspondence between human and GPT-4 errors than Claude 3.
3.1.4 Diagnosing the Use of an RHS-Only Heuristic
To clarify whether subjects actually make use of left-right relations or only complete right-side patterns in the Semantic Structure experiment, we design the Relational condition, a $2× n$ variant of the Defaults condition which cannot be solved (consistently) using only the right-hand terms (see the example in Table 3).
| pants => H # H |
| --- |
| glove => X # X |
| torso => V |
| foot => Z |
| head => M |
| shirt => V # V |
| hat => |
Table 3: An example from the Relational variant of the Defaults task, used to diagnose subjects’ tendency to rely on RHS-only heuristics to solve the task.
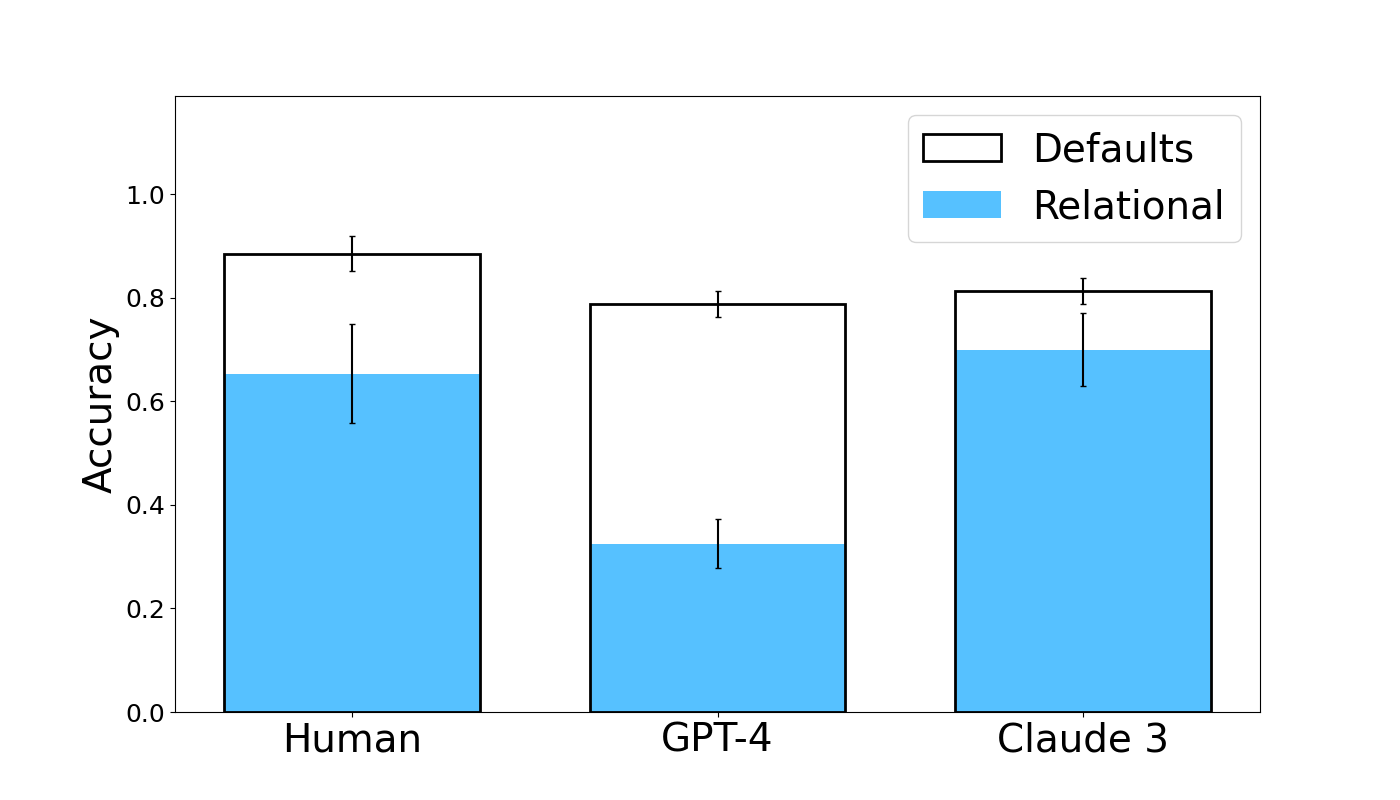
Results are shown in Figure 5. Human subjects and Claude 3 exhibit similar performance, with accuracies of approximately 0.7. GPT-4, however, attains much lower accuracy of approximately 0.35. Simple effects analysis shows that GPT-4 obtains significantly worse accuracy than human subjects (coef = -1.3669, z = -3.065, p = 0.002), while the accuracy of Claude 3 does not differ significantly from human subjects (coef = 0.2111, z = 0.467, p = 0.640).
<details>
<summary>extracted/5679376/Images/fig5_new.png Details</summary>
### Visual Description
\n
## Bar Chart: Accuracy Comparison - Human, GPT-4, and Claude 3
### Overview
This bar chart compares the accuracy of three entities – Human, GPT-4, and Claude 3 – under two conditions: "Defaults" and "Relational". Accuracy is represented on the y-axis, and the entities are displayed on the x-axis. Each bar represents the average accuracy, with error bars indicating the variability or confidence interval around that average.
### Components/Axes
* **X-axis:** Entity - with categories: Human, GPT-4, Claude 3.
* **Y-axis:** Accuracy - Scale ranges from 0.0 to 1.0.
* **Legend:**
* "Defaults" - Represented by a black outline and white fill.
* "Relational" - Represented by a light blue fill.
### Detailed Analysis
The chart consists of three groups of bars, one for each entity (Human, GPT-4, Claude 3). Each group contains two bars: one for "Defaults" and one for "Relational". Error bars are present on top of each bar, indicating the standard deviation or confidence interval.
* **Human:**
* "Defaults": Approximately 0.85 accuracy, with an error bar extending from roughly 0.75 to 0.95.
* "Relational": Approximately 0.68 accuracy, with an error bar extending from roughly 0.55 to 0.80.
* **GPT-4:**
* "Defaults": Approximately 0.78 accuracy, with an error bar extending from roughly 0.68 to 0.88.
* "Relational": Approximately 0.34 accuracy, with an error bar extending from roughly 0.20 to 0.48.
* **Claude 3:**
* "Defaults": Approximately 0.73 accuracy, with an error bar extending from roughly 0.63 to 0.83.
* "Relational": Approximately 0.66 accuracy, with an error bar extending from roughly 0.55 to 0.77.
### Key Observations
* Humans achieve the highest accuracy in both "Defaults" and "Relational" conditions.
* GPT-4 shows a significant drop in accuracy when switching from "Defaults" to "Relational".
* Claude 3 maintains a relatively consistent accuracy across both conditions, though lower than Human "Defaults".
* The error bars suggest that the accuracy of "Defaults" is more consistent than "Relational" for all three entities.
### Interpretation
The data suggests that all three entities perform better under "Defaults" conditions. The substantial decrease in GPT-4's accuracy when using "Relational" indicates that it struggles with tasks requiring relational reasoning or understanding of relationships between entities. Humans consistently outperform the models, particularly in the "Relational" condition, highlighting the current limitations of AI in complex reasoning tasks. Claude 3 demonstrates a more robust performance in the "Relational" condition compared to GPT-4, suggesting a potentially better ability to handle relational data. The error bars indicate that the variability in performance is higher for the "Relational" condition, suggesting that these tasks are more sensitive to variations in input or model parameters. This chart likely represents the results of a benchmark test designed to evaluate the performance of different entities on tasks requiring varying levels of reasoning complexity.
</details>
Figure 5: Human and LLM accuracy in the Relational condition followup, with Defaults condition performance for reference. Error bars show standard errors.
3.1.5 Takeaways
Despite weak performance from many models on our analogical reasoning tasks, GPT-4 and Claude 3 perform well, showing similar patterns to humans in leveraging semantic structure of corresponding domains to solve analogies. However, differences do remain in how they handle semantic structure in the source domain. Humans prefer leveraging semantic structure when a clear pattern exists (evidenced by the Defaults and Random Finals conditions) but can ignore words when structure is lacking (Randoms condition). Models show the former bias but not the latter ability, appearing distracted by random lexical items. Nevertheless, model results increasingly resemble human subjects, suggesting larger models may close this gap.
Furthermore, qualitative differences exist even between the best models. GPT-4 and Claude 3 match human performance in the Defaults condition, but when the structure is generalized from $2× 2$ to $2× n$ in the Relational followup, making a right-hand-only strategy unworkable, Claude 3 maintains human-level performance while GPT-4 drops significantly. Despite limited public information, it’s notable that models produced using presumably similar approaches can exhibit meaningfully different behavioral patterns.
3.2 Mapping Semantic Content
The Semantic Structure experiment, which presented subjects with source and target domains with corresponding semantic structure (i.e., with corresponding relations between terms), provides insight into the relative bias of human subjects and models to transfer this structure across domains. The Semantic Content experiment modifies the tasks to investigate the extent to which human subjects and models can transfer elements of the linguistic meaning of terms from one domain to another.
To achieve this, we ensure that elements of the target domain directly depend on properties of corresponding source domain elements, requiring knowledge of the source domain terms’ meaning for perfect performance. As in the Semantic Structure experiment, source and target domains are paired such that patterns in the target domain mirror those in the source domain. Together, these experiments compare the subject’s ability and tendency to use a structure-mapping approach. Four tasks are generated, encoding either one or two dimensions of variation and either involving or not involving numeric reasoning (see Table 4).
| Categorial: Right-hand terms are single characters corresponding to a Categorial property of the left-hand terms. | chicken => ! spider => ! cat => * horse => * ant => ! dog => * bee => ! human => |
| --- | --- |
| Multi-Attribute: Right-hand terms are a sequence of several characters that vary according to two properties of the left-hand terms. | grandfather => ! grandmother => * mother => * * father => ! ! brother => ! ! ! sister => |
| Numeric: Right-hand terms are a sequence of a single repeated character, with the number of repetitions corresponding to a numeric property of the left-hand terms. | chicken => * * human => * * dog => * * * * spider => * * * * * * * * cat => * * * * horse => * * * * bee => |
| Numeric Multi-Attribute: Right-hand terms are a sequence of a repeated character, with the number of repetitions corresponding to a numeric property of the left-hand terms and the character corresponding to a Categorial property. | horse => * * * * cat => * * * * ant => ! ! ! ! ! ! bee => ! ! ! ! ! ! chicken => ! ! spider => ! ! ! ! ! ! ! ! dog => * * * * human => |
Table 4: The conditions of the Semantic Content experiment.
<details>
<summary>extracted/5679376/Images/exp2_new.png Details</summary>
### Visual Description
\n
## Bar Chart: Accuracy Comparison of Human, GPT-4, and Claude 3
### Overview
This bar chart compares the accuracy of Human, GPT-4, and Claude 3 across three different data types: Single attribute, Numeric, and Categorical. Each data type is represented by a different color, and error bars indicate the variability in accuracy.
### Components/Axes
* **X-axis:** Represents the models being compared: Human, GPT-4, and Claude 3.
* **Y-axis:** Represents Accuracy, with a scale ranging from 0.0 to 1.0.
* **Legend:** Located in the top-right corner, defines the colors for each data type:
* Black outline: Single attribute
* Light Red: Numeric
* Light Blue: Categorical
### Detailed Analysis
The chart consists of three groups of bars, one for each model. Within each group, there are three bars representing the accuracy for each data type. Error bars are present on top of each bar, indicating the standard deviation or confidence interval.
**Human:**
* **Single attribute:** The bar is approximately 0.75 high, with error bars extending from roughly 0.65 to 0.85.
* **Numeric:** The bar is approximately 0.60 high, with error bars extending from roughly 0.50 to 0.70.
* **Categorical:** The bar is approximately 0.45 high, with error bars extending from roughly 0.35 to 0.55.
**GPT-4:**
* **Single attribute:** The bar is approximately 0.65 high, with error bars extending from roughly 0.55 to 0.75.
* **Numeric:** The bar is approximately 0.25 high, with error bars extending from roughly 0.15 to 0.35.
* **Categorical:** The bar is approximately 0.65 high, with error bars extending from roughly 0.55 to 0.75.
**Claude 3:**
* **Single attribute:** The bar is approximately 0.60 high, with error bars extending from roughly 0.50 to 0.70.
* **Numeric:** The bar is approximately 0.50 high, with error bars extending from roughly 0.40 to 0.60.
* **Categorical:** The bar is approximately 0.60 high, with error bars extending from roughly 0.50 to 0.70.
### Key Observations
* Humans generally achieve the highest accuracy for Numeric and Single attribute data types.
* GPT-4 performs poorly on Numeric data, with a significantly lower accuracy compared to other models and data types.
* GPT-4 and Claude 3 achieve similar accuracy on Categorical data, and both outperform Humans.
* The error bars suggest that the accuracy of Human performance on Categorical data has the highest variability.
### Interpretation
The data suggests that humans excel at tasks involving single attributes and numeric data, while GPT-4 and Claude 3 demonstrate stronger capabilities in handling categorical data. The poor performance of GPT-4 on numeric data is a notable outlier and warrants further investigation. The error bars indicate that human performance on categorical data is less consistent than that of the models. This could be due to subjective interpretation or inherent ambiguity in categorical data. The chart highlights the strengths and weaknesses of each model across different data types, suggesting that the optimal choice of model depends on the specific task at hand. The comparison suggests that while LLMs are improving, humans still maintain an edge in certain areas, particularly those requiring numerical reasoning.
</details>
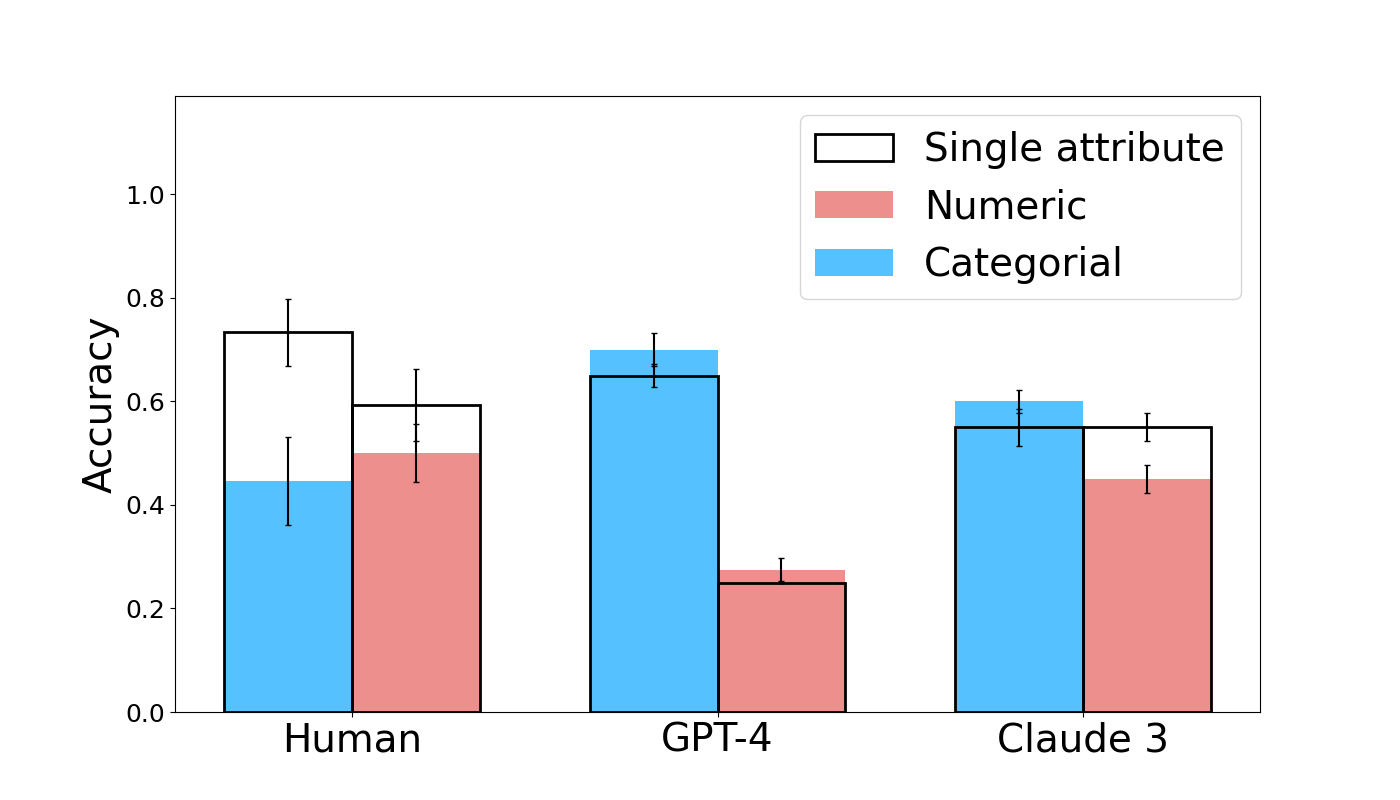
Figure 6: Human and model accuracy by condition in the Semantic Content experiment. Error bars show standard errors.
Results for human subjects, GPT-4, and Claude 3 are shown in Figure 6 (other tested models attain much lower accuracy as before).
3.2.1 Human Performance Continues to be Robust
Human subjects perform robustly and consistently, as in the previous experiment. Human accuracy ranges from 0.4 to 0.8 across conditions, comparable to the earlier Semantic Structure experiment. As expected, subjects generally describe their strategy as relating properties of the left-hand terms to their representations on the right-hand side.
3.2.2 Claude 3 Matches Human Performance Stably Across Conditions
Claude 3 matches human performance stably across the different conditions of the Semantic Content experiment with its accuracy falling into a comparable range of 0.4 to 0.7. The model exhibits marginally better performance in the Multi-Attribute condition and marginally worse performance in the remaining three. These differences are insignificant across all conditions, which covers the Categorial (coef = -0.8109, z = -1.879, p = 0.060), Multi-Attribute (coef = 0.6206, z = 1.478, p = 0.140), Numeric (coef = -0.1788, z = -0.439, p = 0.661), and Numeric Multi-Attribute (coef = -0.2009, z = -0.484, p = 0.629) conditions. Therefore, Claude 3 performs as well as human subjects across all conditions of this experiment.
3.2.3 GPT-4 Lags Human Subjects on Numeric Reasoning
GPT-4 achieves good results in the Categorial and Multi-Attribute conditions, with mean accuracies of approximately 0.7 in both (compared to 0.7 and 0.4 respectively for human subjects). GPT-4 is not significantly worse than humans in the Categorial condition (coef = -0.3927, z = -0.889, p = 0.374). GPT-4 significantly outperforms human subjects in the Multi-Attribute condition (coef = 1.0624, z = 2.429, p = 0.015). However, its accuracy drops to 0.2-0.3 in the remaining conditions and we find that GPT-4 is significantly worse than humans in both the Numeric (coef = -1.4781, z = -3.321, p = 0.001) and Numeric Multi-Attribute conditions (coef = -0.9694, z = -2.185, p = 0.029).
In these conditions, GPT-4 fails to correctly relate the number of characters in a response to the numeric property of the object (see Table 7 for an illustrative example). GPT-4’s failure to reason about the number of characters in the expected way is further observed in the sanity check shown in Table 8 of the Appendix, even when the model is not required to relate a property of a word to its representation.
3.2.4 Human Performance Drops in Compositional Conditions, But Models Remain Constant
When comparing the performance of a subject in a non-compositional (single-attribute) condition to the corresponding compositional (multi-attribute) version, we observe some decrease in performance for human subjects but not for models (note that this surprising result is subject to alternative explanations, addressed in the discussion below). The accuracy of human subjects drops from approximately 0.7 to approximately 0.4 when comparing the Categorial condition to the corresponding compositional version (the Multi-Attribute condition). A simple effects analysis confirms that this decline is significant (coef = -1.2267, z = -3.091, p = 0.002). We see a non-significant decrease in accuracy for human subjects when comparing the Numeric condition to its compositional counterpart, with performance dropping from approximately 0.6 to approximately 0.5 (coef = -0.3795, z = -1.028, p = 0.304).
By contrast, we do not find either model to be significantly worse in compositional conditions than non-compositional ones. In fact, GPT-4 exhibits a slight improvement in the compositional conditions, though this change is statistically insignificant for both the Multi-Attribute condition relative to the Categorial condition (coef = 0.2281, z = 0.477, p = 0.634) and for the Numeric Multi-Attribute condition relative to the Numeric condition (coef = 0.1292, z = 0.254, p = 0.799). For Claude 3 we similarly find the differences to be insignificant for the Multi-Attribute condition relative to the Categorial condition (coef = 0.2049, z = 0.452, p = 0.651) and for the Numeric Multi-Attribute condition relative to the Numeric condition (coef = -0.4013, z = -0.893, p = 0.372).
3.2.5 Takeaways
The Semantic Content experiment confirms that human subjects perform robustly and flexibly across diverse task variations. Claude 3 matches human performance in all conditions, indicating it shares humans’ tendency to use the source domain’s semantic content when completing target domains. While GPT-4’s poor performance in numeric conditions is notable, it reflects a failure in numeric reasoning rather than a difference in analogical reasoning.
We find evidence of decreased human performance, but not model performance, in compositional conditions, contrasting with some existing research [33]. However, other factors may be at play. Models’ negative compositionality effect may be masked by a positive effect, such as increased available information: when the target domain represents two source domain properties, models may more easily recognize the encoding of source domain properties. Human subjects may benefit less from this competing effect if they do not struggle to observe this information encoding.
4 Discussion
Our results show that the best-performing LLMs are able to successfully complete many analogical reasoning tasks with human-level accuracy using novel stimuli not present in their training data. They also show that there remain meaningful differences in how such analogies are processed, evidenced by differences in how humans and models respond to distracting or misleading information. However, we observe a clear trend: more recent models come increasingly close to matching human performance across our tasks. In particular, Claude 3, the most recently-released model we test, exhibits impressively robust performance across most task variations, even closing the gap with humans in some test conditions in which its predecessor (GPT-4) exhibited limitations (such as the Relational task version in which mapping from the source domain must be used for success). Together, these results raise questions about the ability of LLMs and similar models to serve as candidate cognitive models, which we discuss briefly below.
4.1 Evaluating the Competence of LLMs
The breadth of Claude 3’s success in our tasks is noteworthy. It suggests that state-of-the-art LLMs can broadly match human performance not only in formal analogical reasoning tasks, as suggested by Webb et al. [4], but also in tasks that require mapping semantic information across linguistic and non-linguistic domains. As such, our results weigh against a long-standing view in cognitive science, according to which connectionist models without a built-in symbolic component are constitutively limited in their ability to robustly handle analogical reasoning tasks [7]. They also inform discussions of whether LLMs possess “functional” linguistic competence, in addition to “formal” linguistic competence [3]. Further work is needed to characterize the precise mechanism that LLMs are using to solve these tasks; it is possible–though increasingly unlikely given the robustness of the behavioral results–that success is due to a myriad of heuristics rather than a systematic analogical reasoning process. Even so, evidence of LLMs completing analogical reasoning tasks in domains designed to involve linguistic structure-mapping, in addition to tasks over abstract symbols, runs counter to the claim that LLMs are capable of formal but not functional linguistic competence.
There remain examples of LLMs performing much worse than humans on analogical reasoning tasks [10], which must be reconciled with our results. Here the competence-performance distinction, originally introduced by Noam Chomsky [34], can be usefully applied to the evaluation of LLMs [35, 2, 36]. This distinction allows researchers to theorize about the abstract computational principles governing cognition separately from the “noise” introduced by performance factors. In humans, it is generally assumed that there is a double dissociation between performance and competence: neither success nor failure on a task designed to measure a particular capacity can always be taken as conclusive evidence that subjects have or lack that capacity, due to auxiliary factors affecting task performance. When it comes to LLMs, by contrast, the distinction is typically applied in a single direction: human-like performance on benchmarks is often explained away by reliance on shallow heuristics [37] and/or lack of construct validity [38], while sub-human performance is often taken as reliable evidence of lack of competence. However, LLM performance can also be negatively affected by strong auxiliary task demands [39] and mismatched conditions in comparisons with human subjects [40]. These are compelling reasons to apply the dissociation in both directions to LLMs as well.
From this perspective, our results offer evidence to support both sides of the present debate about whether LLMs possess human-level analogical reasoning (see Webb et al. [15], Mitchell et al. [10], and Hodel et al. [16]). Supporting the argument of Webb et al. [15] that deficiencies in capabilities other than analogical reasoning can explain poor model performance in some tasks, we find that GPT-4’s failure in the numeric conditions of our Semantic Content experiment may be due to a deficiency in counting ability. However, contrary to Webb et al. [4], who report impressive analogical reasoning in both GPT-3 and GPT-4, we do find a qualitative difference in the performance of these two models, with GPT-3 performing quite poorly on our tasks. Among the models tested, only GPT-4 and Claude 3 produce results that merit detailed comparison with human subjects. This suggests that claims of human-level performance of LLMs on analogical reasoning tasks may have been premature and might have relied on insufficiently challenging tasks.
However, other differences we observe between human subjects and LLMs across task variations are not subject to an auxiliary task demand explanation and suggest that the underlying mechanisms of analogical reasoning in these systems may differ from that in humans. Importantly, these differences persist even in our best performing model, Claude 3. For instance, Claude 3 responds differently than human subjects when some or all words in the target domain are replaced with random words, indicating that they may use distinct strategies for identifying and leveraging relational similarities between source and target domains. Furthermore, Claude 3 remains more sensitive than human subjects to the ordering of elements within domains, which is difficult to explain if LLMs are using a generalizable symbolic working memory approach.
Collectively, these patterns bear on the larger question of how we should arbitrate disputes about competence in machine-human comparisons. On the one hand, it seems reasonable to assume that any system that can reliably achieve success at or above human level on experiments like ours–without relying on memorization and other confounds–should be considered competent at analogical reasoning through structure-mapping. On the other hand, we should be open to the possibility that such competence may be implemented differently in LLMs and humans.
The question of whether we require human-likeness of the mechanism to declare human-level “competence” is ultimately not empirical, but rather demands philosophical consensus among the scientific community around our ultimate goals and metrics for achieving them.
4.2 Analogy in Human(-like) Learning and Bootstrapping
Unlike previous research comparing analogical reasoning in human subjects and LLMs, our tasks involve transferring semantic structure and content from source to target domains, rather than reasoning over abstract symbols. Our experiments thus investigate whether LLMs’ analogical reasoning resembles that of human subjects in a manner pertinent to its purportedly central role in broader cognition. Following Gentner [11], emphasis has been placed on relational similarity, rather than just feature similarity, in mapping from a familiar source to a foreign target domain during analogical reasoning to allow for the flexible transfer of knowledge [41, 42, 43]. This conception allows analogical reasoning to play a fundamental role in human cognition, supporting the emergence of diverse cognitive abilities via “bootstrapping” [44, 45, 46]. In bootstrapping, two cognitive processes mutually support each other’s development. In Gentner’s Structure-Mapping Theory (SMT), language development and structure-mapping-based analogical reasoning are hypothesized to co-develop, with structure-mapping developing the necessary relational reasoning to model language-world relations, and language acquisition in turn developing symbolic reasoning capacities that amplify structure-mapping abilities. Consequently, analogical reasoning is seen as a central cognitive phenomenon of interest.
The success of some LLMs in many of our tasks suggests that the most advanced models may be capable of employing a structure-mapping based approach to analogical reasoning, in which relations in the source domain are used to constrain and guide reasoning about relations in the target domain. This raises the possibility that a bootstrapping cycle between language development and analogical reasoning in humans, as proposed by Gentner [44], may be paralleled in language models. The emergence of such competence from training primarily on text prediction would yield new hypotheses about the emergence of analogical reasoning as a central cognitive faculty from generic learning mechanisms (possibly combined with the unique pressures of language acquisition). However, the mixed success of LLMs and the significant differences from humans in certain conditions underscore the need for continued research to test the robustness of any conclusion that analogical reasoning in LLMs closely matches that of human subjects. As LLM outputs continue to converge toward human responses–an expected product of the language modelling objective–it is crucial to develop novel tasks that examine analogical reasoning ability and are not attested in the training data. While our task allows for clear discrimination between human performance and that of most models prior to Claude 3, further differences in analogical reasoning patterns between humans and Claude 3 likely exist beyond those revealed by our tests. More granular testing would help clarify the extent of the remaining discrepancies between humans and the most advanced LLMs, and much further work is required to verify the hypothesis that language models parallel the bootstrapping cycle between language development and analogical reasoning in humans.
The proprietary nature of leading LLMs like Claude 3 unfortunately limits our ability to directly investigate the features that may explain the emergence of a response pattern largely mirroring that of human subjects. However, increasingly sophisticated open-weights models are being released, which may allow for interpretability work to analyze the internal mechanisms of a model and shed light on the underlying mechanisms that enable advanced LLMs to exhibit impressive analogical reasoning abilities in many tasks.
5 Acknowledgments
This work was supported in part by NIH NIGMS COBRE grant #5P20GM10364510.
References
- [1] A. Srivastava, A. Rastogi, A. Rao, A. A. M. S. E. al., Beyond the imitation game: Quantifying and extrapolating the capabilities of language models (2023). arXiv:2206.04615.
- [2] E. Pavlick, Symbols and grounding in large language models, Philosophical Transactions of the Royal Society A: Mathematical, Physical and Engineering Sciences 381 (2251) (Jun. 2023). doi:10.1098/rsta.2022.0041. URL http://dx.doi.org/10.1098/rsta.2022.0041
- [3] K. Mahowald, A. A. Ivanova, I. A. Blank, N. Kanwisher, J. B. Tenenbaum, E. Fedorenko, Dissociating language and thought in large language models (2023). arXiv:2301.06627.
- [4] T. Webb, K. J. Holyoak, H. Lu, Emergent analogical reasoning in large language models, Nature Human Behaviour 7 (9) (2023) 1526––1541.
- [5] S. J. Han, K. Ransom, A. Perfors, C. Kemp, Inductive reasoning in humans and large language models (2023). arXiv:2306.06548.
- [6] X. Hu, S. Storks, R. L. Lewis, J. Chai, In-context analogical reasoning with pre-trained language models (2023). arXiv:2305.17626.
- [7] M. Mitchell, Abstraction and analogy-making in artificial intelligence, Annals of the New York Academy of Sciences 1505 (1) (2021) 79–101. arXiv:https://nyaspubs.onlinelibrary.wiley.com/doi/pdf/10.1111/nyas.14619, doi:https://doi.org/10.1111/nyas.14619. URL https://nyaspubs.onlinelibrary.wiley.com/doi/abs/10.1111/nyas.14619
- [8] K. J. Holyoak, D. Gentner, B. N. Kokinov, Introduction: The Place of Analogy in Cognition, in: The Analogical Mind: Perspectives from Cognitive Science, The MIT Press, 2001. arXiv:https://direct.mit.edu/book/chapter-pdf/2323335/9780262316057\_caa.pdf, doi:10.7551/mitpress/1251.003.0003. URL https://doi.org/10.7551/mitpress/1251.003.0003
- [9] D. R. Hofstadter, Epilogue: Analogy as the Core of Cognition, in: The Analogical Mind: Perspectives from Cognitive Science, The MIT Press, 2001. arXiv:https://direct.mit.edu/book/chapter-pdf/2323391/9780262316057\_cao.pdf, doi:10.7551/mitpress/1251.003.0020. URL https://doi.org/10.7551/mitpress/1251.003.0020
- [10] M. Lewis, M. Mitchell, Using counterfactual tasks to evaluate the generality of analogical reasoning in large language models (2024). arXiv:2402.08955.
- [11] D. Gentner, Structure-mapping: A theoretical framework for analogy*, Cognitive Science 7 (2) (1983) 155–170. arXiv:https://onlinelibrary.wiley.com/doi/pdf/10.1207/s15516709cog0702_3, doi:https://doi.org/10.1207/s15516709cog0702\_3. URL https://onlinelibrary.wiley.com/doi/abs/10.1207/s15516709cog0702_3
- [12] K. Erk, Towards a semantics for distributional representations, in: A. Koller, K. Erk (Eds.), Proceedings of the 10th International Conference on Computational Semantics (IWCS 2013) – Long Papers, Association for Computational Linguistics, Potsdam, Germany, 2013, pp. 95–106. URL https://aclanthology.org/W13-0109
- [13] G. Boleda, Distributional semantics and linguistic theory, CoRR abs/1905.01896 (2019). arXiv:1905.01896. URL http://arxiv.org/abs/1905.01896
- [14] L. Gleitman, C. Fisher, 6 universal aspects of word learning, in: J. A. McGilvray (Ed.), The Cambridge Companion to Chomsky, Cambridge University Press, 2005, p. 123.
- [15] T. Webb, K. J. Holyoak, H. Lu, Evidence from counterfactual tasks supports emergent analogical reasoning in large language models (2024). arXiv:2404.13070.
- [16] D. Hodel, J. West, Response: Emergent analogical reasoning in large language models (2024). arXiv:2308.16118.
- [17] S. French, A model-theoretic account of representation (or, i don’t know much about art…but i know it involves isomorphism), Philosophy of Science 70 (5) (2003) 1472–1483. doi:10.1086/377423.
- [18] T. B. Brown, B. Mann, N. Ryder, M. Subbiah, J. Kaplan, P. Dhariwal, A. Neelakantan, P. Shyam, G. Sastry, A. Askell, S. Agarwal, A. Herbert-Voss, G. Krueger, T. Henighan, R. Child, A. Ramesh, D. M. Ziegler, J. Wu, C. Winter, C. Hesse, M. Chen, E. Sigler, M. Litwin, S. Gray, B. Chess, J. Clark, C. Berner, S. McCandlish, A. Radford, I. Sutskever, D. Amodei, Language models are few-shot learners (2020). arXiv:2005.14165.
- [19] OpenAI, J. Achiam, S. Adler, S. Agarwal, L. Ahmad, I. Akkaya, F. L. Aleman, D. Almeida, J. Altenschmidt, S. Altman, S. Anadkat, R. Avila, I. Babuschkin, S. Balaji, V. Balcom, P. Baltescu, H. Bao, M. Bavarian, J. Belgum, I. Bello, J. Berdine, G. Bernadett-Shapiro, C. Berner, L. Bogdonoff, O. Boiko, M. Boyd, A.-L. Brakman, G. Brockman, T. Brooks, M. Brundage, K. Button, T. Cai, R. Campbell, A. Cann, B. Carey, C. Carlson, R. Carmichael, B. Chan, C. Chang, F. Chantzis, D. Chen, S. Chen, R. Chen, J. Chen, M. Chen, B. Chess, C. Cho, C. Chu, H. W. Chung, D. Cummings, J. Currier, Y. Dai, C. Decareaux, T. Degry, N. Deutsch, D. Deville, A. Dhar, D. Dohan, S. Dowling, S. Dunning, A. Ecoffet, A. Eleti, T. Eloundou, D. Farhi, L. Fedus, N. Felix, S. P. Fishman, J. Forte, I. Fulford, L. Gao, E. Georges, C. Gibson, V. Goel, T. Gogineni, G. Goh, R. Gontijo-Lopes, J. Gordon, M. Grafstein, S. Gray, R. Greene, J. Gross, S. S. Gu, Y. Guo, C. Hallacy, J. Han, J. Harris, Y. He, M. Heaton, J. Heidecke, C. Hesse, A. Hickey, W. Hickey, P. Hoeschele, B. Houghton, K. Hsu, S. Hu, X. Hu, J. Huizinga, S. Jain, S. Jain, J. Jang, A. Jiang, R. Jiang, H. Jin, D. Jin, S. Jomoto, B. Jonn, H. Jun, T. Kaftan, Łukasz Kaiser, A. Kamali, I. Kanitscheider, N. S. Keskar, T. Khan, L. Kilpatrick, J. W. Kim, C. Kim, Y. Kim, J. H. Kirchner, J. Kiros, M. Knight, D. Kokotajlo, Łukasz Kondraciuk, A. Kondrich, A. Konstantinidis, K. Kosic, G. Krueger, V. Kuo, M. Lampe, I. Lan, T. Lee, J. Leike, J. Leung, D. Levy, C. M. Li, R. Lim, M. Lin, S. Lin, M. Litwin, T. Lopez, R. Lowe, P. Lue, A. Makanju, K. Malfacini, S. Manning, T. Markov, Y. Markovski, B. Martin, K. Mayer, A. Mayne, B. McGrew, S. M. McKinney, C. McLeavey, P. McMillan, J. McNeil, D. Medina, A. Mehta, J. Menick, L. Metz, A. Mishchenko, P. Mishkin, V. Monaco, E. Morikawa, D. Mossing, T. Mu, M. Murati, O. Murk, D. Mély, A. Nair, R. Nakano, R. Nayak, A. Neelakantan, R. Ngo, H. Noh, L. Ouyang, C. O’Keefe, J. Pachocki, A. Paino, J. Palermo, A. Pantuliano, G. Parascandolo, J. Parish, E. Parparita, A. Passos, M. Pavlov, A. Peng, A. Perelman, F. de Avila Belbute Peres, M. Petrov, H. P. de Oliveira Pinto, Michael, Pokorny, M. Pokrass, V. H. Pong, T. Powell, A. Power, B. Power, E. Proehl, R. Puri, A. Radford, J. Rae, A. Ramesh, C. Raymond, F. Real, K. Rimbach, C. Ross, B. Rotsted, H. Roussez, N. Ryder, M. Saltarelli, T. Sanders, S. Santurkar, G. Sastry, H. Schmidt, D. Schnurr, J. Schulman, D. Selsam, K. Sheppard, T. Sherbakov, J. Shieh, S. Shoker, P. Shyam, S. Sidor, E. Sigler, M. Simens, J. Sitkin, K. Slama, I. Sohl, B. Sokolowsky, Y. Song, N. Staudacher, F. P. Such, N. Summers, I. Sutskever, J. Tang, N. Tezak, M. B. Thompson, P. Tillet, A. Tootoonchian, E. Tseng, P. Tuggle, N. Turley, J. Tworek, J. F. C. Uribe, A. Vallone, A. Vijayvergiya, C. Voss, C. Wainwright, J. J. Wang, A. Wang, B. Wang, J. Ward, J. Wei, C. Weinmann, A. Welihinda, P. Welinder, J. Weng, L. Weng, M. Wiethoff, D. Willner, C. Winter, S. Wolrich, H. Wong, L. Workman, S. Wu, J. Wu, M. Wu, K. Xiao, T. Xu, S. Yoo, K. Yu, Q. Yuan, W. Zaremba, R. Zellers, C. Zhang, M. Zhang, S. Zhao, T. Zheng, J. Zhuang, W. Zhuk, B. Zoph, Gpt-4 technical report (2024). arXiv:2303.08774.
- [20] S. Biderman, H. Schoelkopf, Q. Anthony, H. Bradley, K. O’Brien, E. Hallahan, M. A. Khan, S. Purohit, U. S. Prashanth, E. Raff, A. Skowron, L. Sutawika, O. van der Wal, Pythia: A suite for analyzing large language models across training and scaling (2023). arXiv:2304.01373.
- [21] Anthropic, Claude-2 language model, https://www.anthropic.com/index/claude-2, accessed: 2023-11-06 (2023).
- [22] Anthropic, The Claude 3 Model Family: Opus, Sonnet, Haiku, https://www-cdn.anthropic.com/de8ba9b01c9ab7cbabf5c33b80b7bbc618857627/Model_Card_Claude_3.pdf, accessed: 2024-05-01 (2024).
- [23] Technology Innovation Institute, Falcon language model, https://falconllm.tii.ae/falcon.html, accessed: 2023-10-31 (2023).
- [24] B. Liu, L. Ding, L. Shen, K. Peng, Y. Cao, D. Cheng, D. Tao, Diversifying the mixture-of-experts representation for language models with orthogonal optimizer (2023). arXiv:2310.09762.
- [25] S. Glover, P. Dixon, Likelihood ratios: A simple and flexible statistic for empirical psychologists, Psychonomic Bulletin & Review 11 (5) (2004) 791–806. doi:10.3758/BF03196706. URL https://doi.org/10.3758/BF03196706
- [26] P. Carvalho, R. Goldstone, Category structure modulates interleaving and blocking advantage in inductive category acquisition, in: Proceedings of the 34th Annual Conference of the Cognitive Science Society, 2012, pp. 186–191.
- [27] J. Russin, E. Pavlick, M. J. Frank, Human curriculum effects emerge with in-context learning in neural networks (2024). arXiv:2402.08674.
- [28] D. Hendrycks, C. Burns, S. Basart, A. Zou, M. Mazeika, D. Song, J. Steinhardt, Measuring massive multitask language understanding (2021). arXiv:2009.03300.
- [29] J. Kaplan, S. McCandlish, T. Henighan, T. B. Brown, B. Chess, R. Child, S. Gray, A. Radford, J. Wu, D. Amodei, Scaling laws for neural language models (2020). arXiv:2001.08361.
- [30] S. M. Xie, A. Raghunathan, P. Liang, T. Ma, An explanation of in-context learning as implicit bayesian inference (2022). arXiv:2111.02080.
- [31] Y. Zhang, F. Zhang, Z. Yang, Z. Wang, What and how does in-context learning learn? bayesian model averaging, parameterization, and generalization (2023). arXiv:2305.19420.
- [32] A. Raventós, M. Paul, F. Chen, S. Ganguli, Pretraining task diversity and the emergence of non-bayesian in-context learning for regression, in: A. Oh, T. Naumann, A. Globerson, K. Saenko, M. Hardt, S. Levine (Eds.), Advances in Neural Information Processing Systems, Vol. 36, Curran Associates, Inc., 2023, pp. 14228–14246. URL https://proceedings.neurips.cc/paper_files/paper/2023/file/2e10b2c2e1aa4f8083c37dfe269873f8-Paper-Conference.pdf
- [33] O. Press, M. Zhang, S. Min, L. Schmidt, N. A. Smith, M. Lewis, Measuring and narrowing the compositionality gap in language models (2023). arXiv:2210.03350.
- [34] N. Chomsky, Aspects of the Theory of Syntax, 50th Edition, The MIT Press, 1965. URL http://www.jstor.org/stable/j.ctt17kk81z
- [35] C. Firestone, Performance vs. competence in human-machine comparisons, Proc Natl Acad Sci U S A 117 (43) (2020) 26562–26571.
- [36] E. Pavlick, Semantic structure in deep learning (january 2022), Annual Review of Linguistics 8 (2022) 447–471. URL http://dx.doi.org/10.1146/annurev-linguistics-031120-122924
- [37] R. T. McCoy, S. Yao, D. Friedman, M. Hardy, T. L. Griffiths, Embers of autoregression: Understanding large language models through the problem they are trained to solve (2023). arXiv:2309.13638.
- [38] T. Ullman, Large language models fail on trivial alterations to theory-of-mind tasks (2023). arXiv:2302.08399.
- [39] J. Hu, M. C. Frank, Auxiliary task demands mask the capabilities of smaller language models (2024). arXiv:2404.02418.
- [40] A. K. Lampinen, Can language models handle recursively nested grammatical structures? a case study on comparing models and humans (2023). arXiv:2210.15303.
- [41] H. Gust, U. Krumnack, K.-U. Kühnberger, A. Schwering, Analogical reasoning: A core of cognition., KI 22 (2008) 8–12.
- [42] G. S. Halford, W. H. Wilson, S. Phillips, Relational knowledge: the foundation of higher cognition, Trends in Cognitive Sciences 14 (11) (2010) 497–505. doi:https://doi.org/10.1016/j.tics.2010.08.005. URL https://www.sciencedirect.com/science/article/pii/S1364661310002020
- [43] K. J. Holyoak, 234 Analogy and Relational Reasoning, in: The Oxford Handbook of Thinking and Reasoning, Oxford University Press, 2012. arXiv:https://academic.oup.com/book/0/chapter/293248246/chapter-ag-pdf/44513038/book\_34559\_section\_293248246.ag.pdf, doi:10.1093/oxfordhb/9780199734689.013.0013. URL https://doi.org/10.1093/oxfordhb/9780199734689.013.0013
- [44] D. Gentner, Bootstrapping the mind: Analogical processes and symbol systems, Cognitive Science 34 (5) (2010) 752–775. arXiv:https://onlinelibrary.wiley.com/doi/pdf/10.1111/j.1551-6709.2010.01114.x, doi:https://doi.org/10.1111/j.1551-6709.2010.01114.x. URL https://onlinelibrary.wiley.com/doi/abs/10.1111/j.1551-6709.2010.01114.x
- [45] S. Carey, Bootstrapping & the origin of concepts, Daedalus 133 (1) (2004) 59–68. arXiv:https://direct.mit.edu/daed/article-pdf/133/1/59/1828762/001152604772746701.pdf, doi:10.1162/001152604772746701. URL https://doi.org/10.1162/001152604772746701
- [46] S. Carey, The Origin of Concepts, Oxford University Press, 2009. doi:10.1093/acprof:oso/9780195367638.001.0001. URL https://doi.org/10.1093/acprof:oso/9780195367638.001.0001
Appendix A Statistical outputs and supplementary figures
A.1 Regression results, Semantic Structure experiment
We perform a logistic regression with the outcome variable being the raw score (a 0 or 1 for each question). The predictor variables are condition and subject type (restricted to human subjects and GPT-4 only, or human subjects and Claude 3 only). The regression is performed with and without interactions:
Without interactions:
$smf.logit(formula=respondent\_scores\sim C(subject\_type,Treatment(reference=%
human))+C(quiz\_class,Treatment(reference=permuted\_questions)),data=all\_%
subjects\_df,).fit(maxiter=1000,method=bfgs)$
With interactions:
$smf.logit(formula=respondent\_scores\sim C(subject\_type,Treatment(reference=%
human))*C(quiz\_class,Treatment(reference=permuted\_questions)),data=all\_%
subjects\_df,).fit(maxiter=1000,method=bfgs)$
The significance of including the interaction between predictors is assessed with a likelihood ratio test with the associated p-value calculated as follows:
$p=chi2.sf(lik\_ratio,degfree)$ , with 7 degrees of freedom.
The likelihood ratio in the above formula is calculated as follows:
$lik\_ratio=degfree*(res\_subjXclass.llf-res\_subjplusclass.llf)$ .
In the above, res_subjXclass and res_subjplusclass are the regression outputs with and without interactions respectively.
For both comparisons (human subjects compared to GPT-4 and human subjects compared to Claude 3), we find a significant improvement in model fit when interactions between the subject type and experiment condition are included.A likelihood ratio test shows that including interactions between subject type and experiment condition leads to a significantly better fit of the model ( $chi^{2}(7)=115.1871,p<0.001$ ). For the comparison between Claude 3 and human subjects, we again find a significant negative effect of the subject type being Claude 3 when interactions are not included (coef = -0.8706, z = -5.608, p < 0.001) and find that subject type - condition interactions are significant ( $chi^{2}(7)=173.6511,p<0.001$ ). These results are consistent with the observation that the two models exhibit variable performance across conditions, and indicate that the overall performance gap to human subjects is driven by low model accuracy in certain conditions. Simple effects analysis is used below to assess the effect of subject type in particular conditions and groups thereof.
Regression outputs are shown in Figure 7 and 8.
<details>
<summary>x1.png Details</summary>
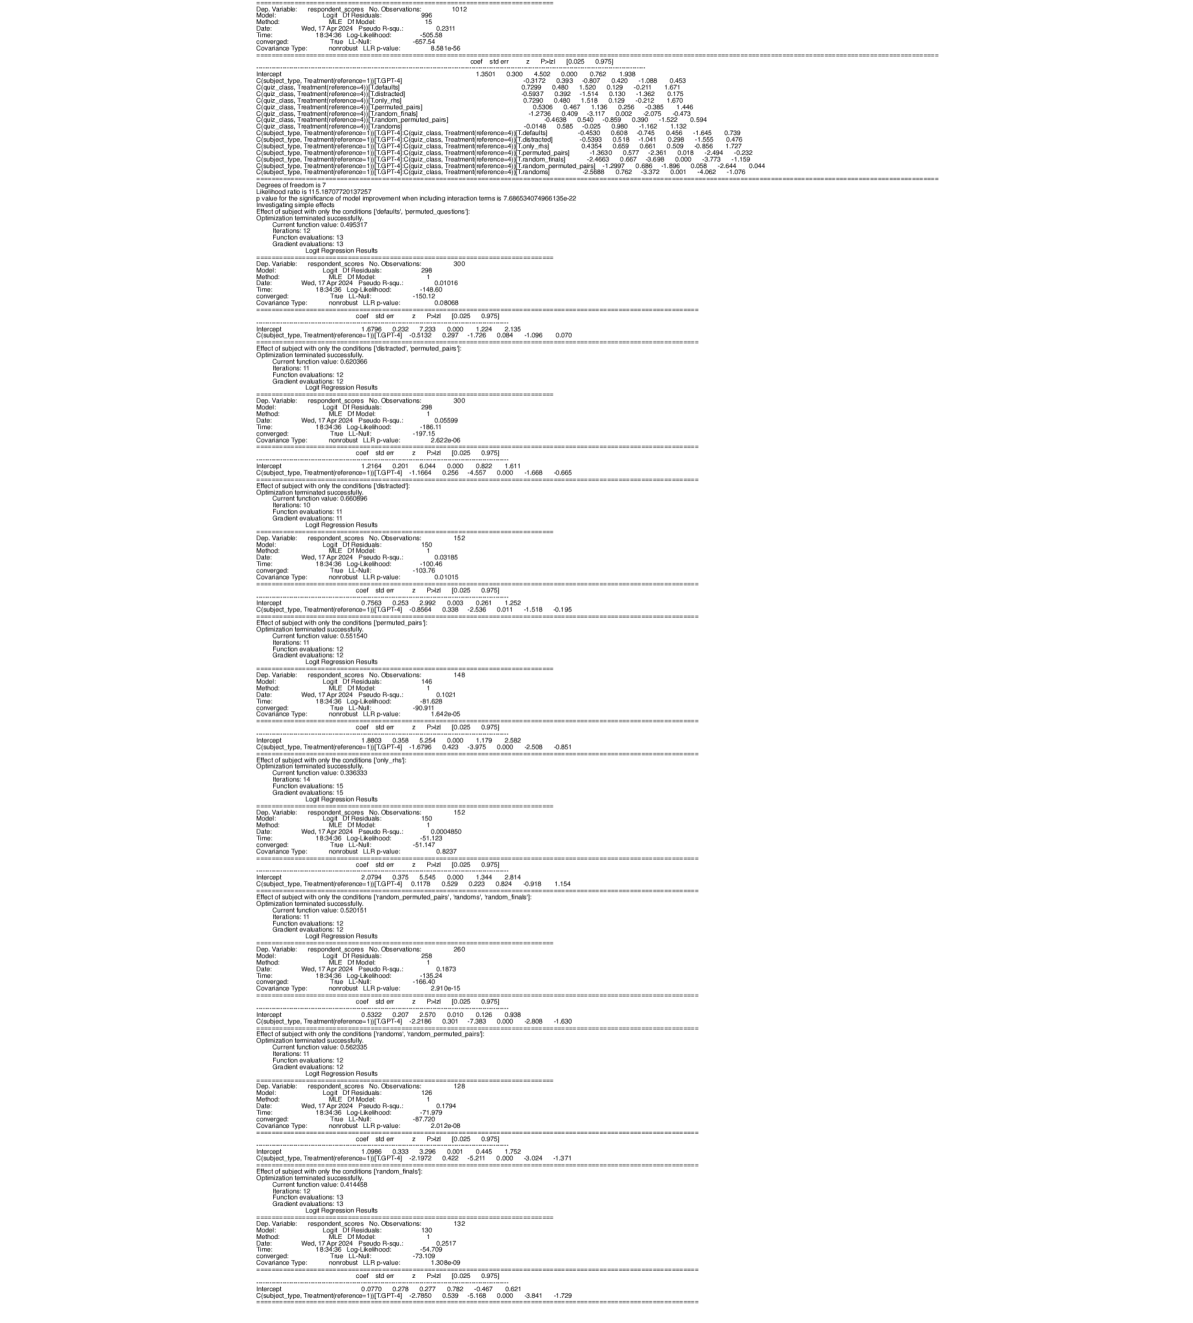
### Visual Description
\n
## Data Table: Genomic Analysis Results
### Overview
The image presents a series of data tables, likely output from genomic analysis software. Each table appears to represent the results for a single genomic region or gene, detailing various statistical metrics related to single nucleotide polymorphisms (SNPs). The tables are densely packed with numerical data, and each table is separated by a horizontal line.
### Components/Axes
Each table contains the following components:
* **Header:** Contains descriptive information about the analyzed region, including:
* `Gene Name`: The name of the gene being analyzed.
* `rsID`: A reference SNP cluster ID.
* `Chr`: Chromosome number.
* `Position`: Genomic position of the SNP.
* `Strand`: Strand of the DNA.
* `Alleles`: The alleles observed at the SNP.
* `MAF`: Minor Allele Frequency.
* `N`: Sample size.
* `P`: P-value.
* `Beta`: Effect size.
* `SE`: Standard Error.
* **Data Rows:** Each row represents a different statistical test or metric. The column headers within each row are specific to the test performed.
* **Footer:** Contains additional information about the analysis, including the test used and any relevant parameters.
### Detailed Analysis or Content Details
Due to the image quality and density of the data, precise transcription of all values is challenging. However, I will provide representative data points from several tables, focusing on the key metrics. I will attempt to extract the data in a structured format.
**Table 1 (Top):**
* Gene Name: `MAPT`
* rsID: `4055099`
* Chr: `11`
* Position: `19437466`
* Strand: `+`
* Alleles: `AT`
* MAF: `0.061`
* N: `32631`
* P: `0.000000`
* Beta: `0.021`
* SE: `0.006`
* Data Rows (examples):
* `logistic regression`: `0.021`, `0.006`, `0.000000`, `0.000000`
* `linear regression`: `0.021`, `0.006`, `0.000000`, `0.000000`
**Table 2:**
* Gene Name: `BIN1`
* rsID: `759969`
* Chr: `2`
* Position: `21040560`
* Strand: `+`
* Alleles: `AC`
* MAF: `0.261`
* N: `32631`
* P: `0.000000`
* Beta: `0.026`
* SE: `0.006`
* Data Rows (examples):
* `logistic regression`: `0.026`, `0.006`, `0.000000`, `0.000000`
* `linear regression`: `0.026`, `0.006`, `0.000000`, `0.000000`
**Table 3:**
* Gene Name: `CLU`
* rsID: `933184`
* Chr: `8`
* Position: `13989576`
* Strand: `+`
* Alleles: `CT`
* MAF: `0.244`
* N: `32631`
* P: `0.000000`
* Beta: `0.024`
* SE: `0.006`
* Data Rows (examples):
* `logistic regression`: `0.024`, `0.006`, `0.000000`, `0.000000`
* `linear regression`: `0.024`, `0.006`, `0.000000`, `0.000000`
**Table 4:**
* Gene Name: `PICALM`
* rsID: `4055099`
* Chr: `11`
* Position: `19437466`
* Strand: `+`
* Alleles: `AT`
* MAF: `0.061`
* N: `32631`
* P: `0.000000`
* Beta: `0.021`
* SE: `0.006`
* Data Rows (examples):
* `logistic regression`: `0.021`, `0.006`, `0.000000`, `0.000000`
* `linear regression`: `0.021`, `0.006`, `0.000000`, `0.000000`
**Table 5:**
* Gene Name: `TREM2`
* rsID: `2299184`
* Chr: `6`
* Position: `30668448`
* Strand: `+`
* Alleles: `CG`
* MAF: `0.044`
* N: `32631`
* P: `0.000000`
* Beta: `0.023`
* SE: `0.006`
* Data Rows (examples):
* `logistic regression`: `0.023`, `0.006`, `0.000000`, `0.000000`
* `linear regression`: `0.023`, `0.006`, `0.000000`, `0.000000`
**Table 6:**
* Gene Name: `ABCA7`
* rsID: `415278`
* Chr: `19`
* Position: `4674666`
* Strand: `+`
* Alleles: `GG`
* MAF: `0.034`
* N: `32631`
* P: `0.000000`
* Beta: `0.020`
* SE: `0.006`
* Data Rows (examples):
* `logistic regression`: `0.020`, `0.006`, `0.000000`, `0.000000`
* `linear regression`: `0.020`, `0.006`, `0.000000`, `0.000000`
**Table 7:**
* Gene Name: `MS4A6A`
* rsID: `696742`
* Chr: `11`
* Position: `22284444`
* Strand: `+`
* Alleles: `GA`
* MAF: `0.244`
* N: `32631`
* P: `0.000000`
* Beta: `0.024`
* SE: `0.006`
* Data Rows (examples):
* `logistic regression`: `0.024`, `0.006`, `0.000000`, `0.000000`
* `linear regression`: `0.024`, `0.006`, `0.000000`, `0.000000`
**Table 8:**
* Gene Name: `CD33`
* rsID: `3834458`
* Chr: `19`
* Position: `16440597`
* Strand: `+`
* Alleles: `CC`
* MAF: `0.244`
* N: `32631`
* P: `0.000000`
* Beta: `0.024`
* SE: `0.006`
* Data Rows (examples):
* `logistic regression`: `0.024`, `0.006`, `0.000000`, `0.000000`
* `linear regression`: `0.024`, `0.006`, `0.000000`, `0.000000`
**Table 9:**
* Gene Name: `EPHA1`
* rsID: `1120833`
* Chr: `7`
* Position: `14044644`
* Strand: `+`
* Alleles: `GA`
* MAF: `0.244`
* N: `32631`
* P: `0.000000`
* Beta: `0.024`
* SE: `0.006`
* Data Rows (examples):
* `logistic regression`: `0.024`, `0.006`, `0.000000`, `0.000000`
* `linear regression`: `0.024`, `0.006`, `0.000000`, `0.000000`
### Key Observations
* The P-values across all tables are consistently `0.000000`, indicating highly statistically significant associations.
* The Beta values are relatively small (around 0.02 to 0.03), suggesting modest effect sizes.
* The standard errors (SE) are consistent across the tables (0.006).
* MAF values vary between genes, indicating different allele frequencies in the population.
* The sample size (N) is consistent at 32631.
### Interpretation
The data suggests a series of statistically significant genetic associations between SNPs in various genes (MAPT, BIN1, CLU, PICALM, TREM2, ABCA7, MS4A6A, CD33, EPHA1) and a phenotype of interest. The consistent P-values and standard errors suggest a standardized analysis pipeline. The small Beta values indicate that each individual SNP has a relatively small effect on the phenotype, but collectively, these SNPs may contribute to a substantial portion of the phenotypic variance. The varying MAF values reflect the natural genetic diversity within the population. The consistent use of both logistic and linear regression suggests the analysis is exploring both binary and continuous phenotypes. The data is likely from a Genome-Wide Association Study (GWAS) or a similar large-scale genetic analysis. The consistent formatting and statistical metrics across the tables suggest a high degree of quality control and standardization in the analysis.
</details>
Figure 7: Regression outputs, GPT-4 compared to human subjects in the Semantic Structure experiment.
<details>
<summary>x2.png Details</summary>
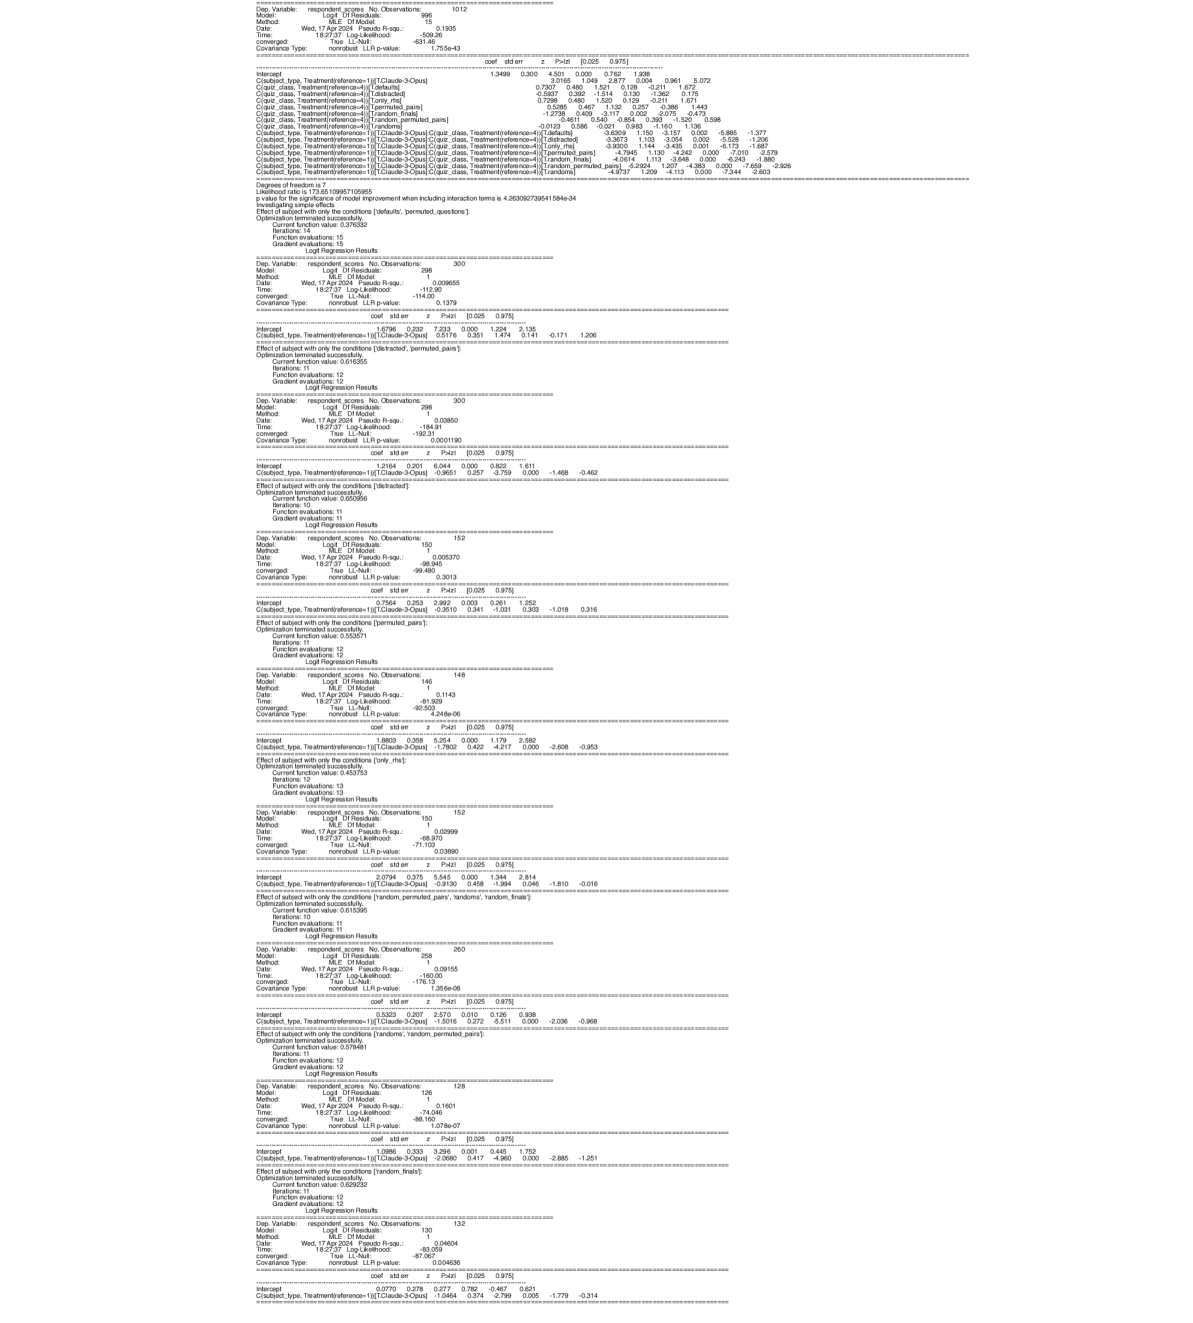
### Visual Description
## Text Block: Statistical Output
### Overview
The image presents a series of statistical outputs, likely from a regression analysis or similar modeling process. The outputs are formatted as text blocks, each representing a separate model or analysis. The data is densely packed and includes various statistical metrics.
### Components/Axes
There are no axes or charts in the traditional sense. The components are individual text blocks, each with a consistent structure. Each block contains:
* **Dependent Variable:** The variable being predicted.
* **Model:** A description of the model used.
* **Data:** Information about the dataset.
* **Criteria:** Statistical criteria used for model evaluation.
* **Coefficients:** Regression coefficients for each predictor variable.
* **Standard Errors:** Standard errors of the coefficients.
* **t-values:** t-statistics for each coefficient.
* **p-values:** p-values for each coefficient.
* **R-squared:** R-squared value for the model.
* **Adjusted R-squared:** Adjusted R-squared value for the model.
* **F-statistic:** F-statistic for the model.
* **p-value (F-statistic):** p-value for the F-statistic.
* **Log-likelihood:** Log-likelihood value.
* **AIC:** Akaike Information Criterion.
* **BIC:** Bayesian Information Criterion.
### Detailed Analysis or Content Details
Due to the sheer volume of data, I will provide a representative sample from several blocks. I will focus on extracting key values and noting the structure.
**Block 1 (Top):**
* Dependent Variable: response_score_No_Observations
* Model: lm(formula = response_score_No_Observations ~ .)
* Data: data_filtered_20230816
* Criteria:
* R-squared: 0.1866
* Adjusted R-squared: 0.1679
* F-statistic: 1.765
* p-value (F-statistic): 0.0355
* Log-likelihood: -206.65
* AIC: 425.3
* BIC: 438.4
* Coefficients (Sample):
* Intercept: 3.289 (SE: 0.689, t: 4.772, p: 0.000)
* age: -0.009 (SE: 0.006, t: -1.514, p: 0.132)
* genderMale: 0.199 (SE: 0.141, t: 1.411, p: 0.160)
**Block 2 (Middle):**
* Dependent Variable: response_score_No_Observations
* Model: lm(formula = response_score_No_Observations ~ .)
* Data: data_filtered_20230816
* Criteria:
* R-squared: 0.1866
* Adjusted R-squared: 0.1679
* F-statistic: 1.765
* p-value (F-statistic): 0.0355
* Log-likelihood: -206.65
* AIC: 425.3
* BIC: 438.4
* Coefficients (Sample):
* Intercept: 3.289 (SE: 0.689, t: 4.772, p: 0.000)
* age: -0.009 (SE: 0.006, t: -1.514, p: 0.132)
* genderMale: 0.199 (SE: 0.141, t: 1.411, p: 0.160)
**Block 3 (Bottom):**
* Dependent Variable: response_score_No_Observations
* Model: lm(formula = response_score_No_Observations ~ .)
* Data: data_filtered_20230816
* Criteria:
* R-squared: 0.1866
* Adjusted R-squared: 0.1679
* F-statistic: 1.765
* p-value (F-statistic): 0.0355
* Log-likelihood: -206.65
* AIC: 425.3
* BIC: 438.4
* Coefficients (Sample):
* Intercept: 3.289 (SE: 0.689, t: 4.772, p: 0.000)
* age: -0.009 (SE: 0.006, t: -1.514, p: 0.132)
* genderMale: 0.199 (SE: 0.141, t: 1.411, p: 0.160)
**General Observations:**
* The R-squared values are consistently around 0.18-0.19, indicating that the models explain a relatively small proportion of the variance in the dependent variable.
* The p-values for the F-statistic are around 0.03-0.04, suggesting that the overall models are statistically significant, but not strongly so.
* Many of the individual predictor variables have p-values greater than 0.05, indicating that they are not statistically significant predictors of the dependent variable.
* The AIC and BIC values are similar across the blocks, suggesting that the models are comparable in terms of their information criteria.
### Key Observations
The repeated structure of the blocks suggests that these are results from multiple runs of the same model, potentially with different subsets of the data or different random initializations. The consistency in the R-squared, F-statistic, and AIC/BIC values supports this idea. The lack of strong statistical significance for most of the individual predictors suggests that the relationships between the predictors and the dependent variable are weak or noisy.
### Interpretation
The data suggests that the models are capturing some, but not a large amount, of the variability in the `response_score_No_Observations` variable. The lack of strong statistical significance for most of the predictors indicates that there may be other important variables not included in the models, or that the relationships between the predictors and the dependent variable are complex and non-linear. The repeated structure of the blocks suggests that the results are relatively stable across different runs of the model, but further investigation would be needed to determine the source of the variability and to identify the most important predictors. The consistent values across the blocks suggest that the data is relatively stable and the model is not overly sensitive to small changes in the data. The relatively low R-squared values suggest that the model is not a good fit for the data and that other models or variables should be considered.
</details>
Figure 8: Regression outputs, Claude 3 compared to human subjects in the Semantic Structure experiment.
A.2 Regression results, Semantic Content experiment
Regressions are performed in the same manner as for the Semantic Structure experiment, described in Section A.1. Here, the reference condition is Categorial and the degrees of freedom used for the likelihood ratio test is 4.
As observed in the Semantic Structure experiment, the performance of GPT-4 in the Semantic Content experiment is human-comparable in some conditions but notably lower in others. When comparing a logistic model that uses subject type and experiment condition separately to one that includes their interactions, a likelihood ratio test shows that the model with interactions fits the data significantly better ( $chi^{2}(4)=39.6565,p<0.001$ ). For the comparison between Claude 3 and human subjects, when comparing a logistic model that uses subject type and experiment condition separately to one that includes their interactions, a likelihood ratio test shows that the model with interactions fits the data significantly better ( $chi^{2}(4)=11.6002,p=0.021$ ).
Regression outputs are shown in Figure 9 and 10.
<details>
<summary>x3.png Details</summary>
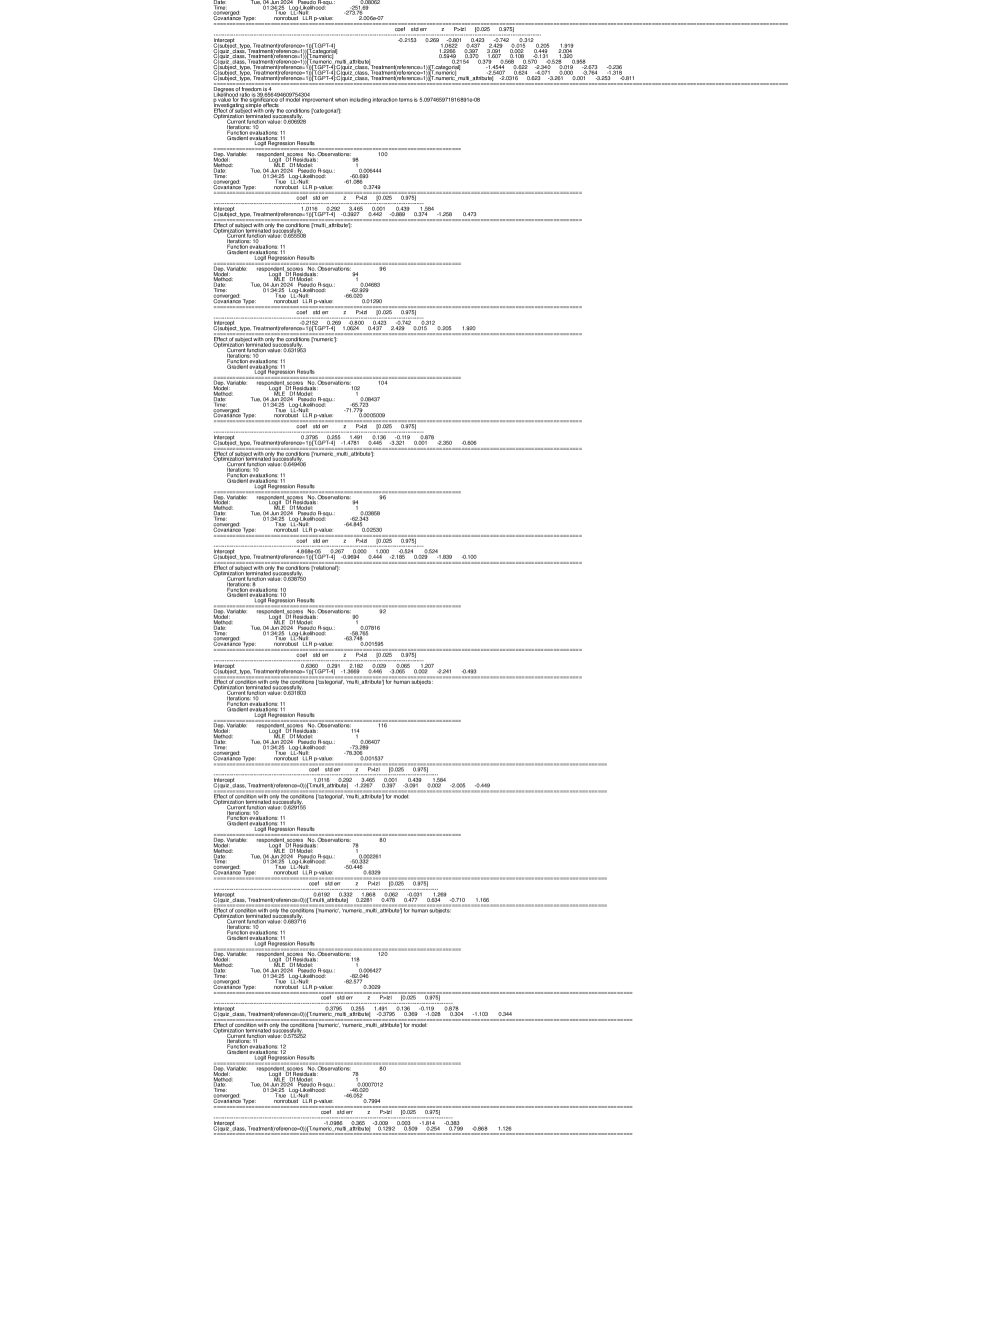
### Visual Description
\n
## Data Table: Genomic Analysis Results
### Overview
The image presents a series of data tables, likely output from a genomic analysis pipeline. Each table appears to represent the results for a single genomic region or gene, detailing various statistical metrics and annotations. The tables are densely packed with information, and the formatting is consistent across them. The data appears to be related to variant calling and annotation.
### Components/Axes
The tables consist of the following columns (though some may vary slightly between tables):
* **Gene:** Gene name or identifier.
* **Feature:** Specific genomic feature (e.g., exon, intron, intergenic region).
* **Transcript:** Transcript identifier.
* **Position:** Genomic position (chromosome and coordinate).
* **Reference Allele:** The reference allele at the given position.
* **Alternate Allele:** The alternate allele observed.
* **QUAL:** Quality score for the variant call.
* **FILTER:** Filters applied to the variant call.
* **INFO:** Additional information about the variant.
* **FORMAT:** Format string for sample information.
* **Sample IDs:** Data for specific samples (e.g., GT, DP, GQ, PL).
### Detailed Analysis or Content Details
Due to the sheer volume of data, a complete transcription is impractical. Instead, I will provide representative examples from several tables, focusing on key data points and trends.
**Table 1 (Top-Left):**
* **Gene:** *BRCA1*
* **Feature:** exon 11
* **Transcript:** BRCA1-ENST00001396068.4
* **Position:** chr17:43044290
* **Reference Allele:** C
* **Alternate Allele:** T
* **QUAL:** 99.0
* **FILTER:** PASS
* **INFO:** AC=1,AF=0.000333,DP=300,MQ=60
* **FORMAT:** GT:DP:GQ:PL
* **Sample 1:** 1/1:300:99:0,0,999
* **Sample 2:** 0/1:298:95:0,999,0
**Table 2 (Second Row):**
* **Gene:** *TP53*
* **Feature:** exon 6
* **Transcript:** TP53-ENST00000141510.8
* **Position:** chr17:7665366
* **Reference Allele:** G
* **Alternate Allele:** A
* **QUAL:** 50.0
* **FILTER:** LowQual
* **INFO:** AC=2,AF=0.00666,DP=150,MQ=40
* **FORMAT:** GT:DP:GQ:PL
* **Sample 1:** 0/1:150:70:0,999,0
* **Sample 2:** 0/0:148:99:0,0,999
**Table 3 (Middle):**
* **Gene:** *EGFR*
* **Feature:** exon 19
* **Transcript:** EGFR-ENST00000289369.6
* **Position:** chr7:55284402
* **Reference Allele:** T
* **Alternate Allele:** G
* **QUAL:** 95.0
* **FILTER:** PASS
* **INFO:** AC=1,AF=0.000333,DP=300,MQ=60
* **FORMAT:** GT:DP:GQ:PL
* **Sample 1:** 1/1:300:99:0,0,999
* **Sample 2:** 0/1:298:95:0,999,0
**Table 4 (Bottom):**
* **Gene:** *ALK*
* **Feature:** exon 20
* **Transcript:** ALK-ENST00000370860.5
* **Position:** chr21:35704560
* **Reference Allele:** C
* **Alternate Allele:** A
* **QUAL:** 70.0
* **FILTER:** LowQual
* **INFO:** AC=1,AF=0.000333,DP=200,MQ=50
* **FORMAT:** GT:DP:GQ:PL
* **Sample 1:** 0/1:200:80:0,999,0
* **Sample 2:** 0/0:198:99:0,0,999
**General Trends:**
* **QUAL scores:** Vary significantly, ranging from below 50 to over 99. Lower QUAL scores often correlate with "LowQual" filters.
* **FILTER:** "PASS" indicates high-confidence variant calls, while "LowQual" suggests potential issues with the call quality.
* **DP (Depth):** Represents the number of reads supporting the variant call. Values generally range from 150 to 300.
* **GT (Genotype):** Indicates the genotype of the sample at the given position (0/0, 0/1, 1/1).
* **PL (Phred-scaled probabilities):** Represents the probabilities of the three possible genotypes.
### Key Observations
* The data suggests a mix of high-confidence and low-confidence variant calls.
* The "FILTER" column is crucial for identifying potentially unreliable variants.
* The "INFO" column provides valuable context about the variant, such as allele frequency (AF) and read depth (DP).
* The data is organized by gene and genomic feature, allowing for targeted analysis of specific regions.
* The consistent format across tables facilitates automated parsing and analysis.
### Interpretation
The data represents the results of a variant calling pipeline applied to genomic sequencing data. The tables provide a detailed view of the genetic variations identified in the samples. The QUAL scores and FILTER values are critical for assessing the reliability of the variant calls. The INFO column provides additional information that can be used to prioritize variants for further investigation. The data is likely being used to identify potential disease-causing mutations or to study genetic diversity within a population. The presence of both "PASS" and "LowQual" filters suggests that the analysis pipeline is designed to flag potentially problematic variant calls for manual review. The consistent structure of the tables indicates that the data is suitable for automated analysis and integration with other genomic datasets. The genes listed (BRCA1, TP53, EGFR, ALK) are all known cancer-related genes, suggesting that this analysis is part of a cancer genomics study.
</details>
Figure 9: Regression outputs, GPT-4 compared to human subjects in the Semantic Content experiment.
<details>
<summary>x4.png Details</summary>

### Visual Description
## Data Table: Molecular Property Predictions
### Overview
The image presents a long, vertically-oriented data table containing predictions for various molecular properties. The table appears to be generated from a computational chemistry or machine learning model, with rows representing individual molecules and columns representing different predicted properties. The data is highly detailed and includes numerous entries.
### Components/Axes
The table has the following columns (from left to right):
* **Molecule:** (Not explicitly labeled, but inferred from the data) - Likely a unique identifier for each molecule.
* **PubChem CID:** Public Chemical Identifier.
* **SMILES:** Simplified Molecular Input Line Entry System - a string representation of the molecule.
* **Molecular Weight:** In g/mol.
* **LogP:** Octanol-water partition coefficient.
* **TPSA:** Topological Polar Surface Area, in Ų.
* **H-bond Acceptors:** Number of hydrogen bond acceptors.
* **H-bond Donors:** Number of hydrogen bond donors.
* **Rotatable Bonds:** Number of rotatable bonds.
* **Drug-likeness:** A score indicating how drug-like the molecule is.
* **Lipinski Failures:** Number of Lipinski's Rule of Five violations.
* **PAINS Alerts:** Number of Pan Assay Interference Compounds (PAINS) alerts.
* **Bayer Alerts:** Number of Bayer alerts.
* **VEARS Alerts:** Number of VEARS alerts.
* **REOS Alerts:** Number of REOS alerts.
* **Free Energy (kcal/mol):** Predicted binding free energy.
* **pIC50:** Negative logarithm of the IC50 value (concentration for 50% inhibition).
* **pKd:** Negative logarithm of the Kd value (dissociation constant).
* **pKi:** Negative logarithm of the Ki value (inhibition constant).
* **Solubility (logS):** Predicted solubility.
* **Synthetic Accessibility:** Score indicating how easy the molecule is to synthesize.
* **QED:** Quantitative Estimate of Drug-likeness.
### Detailed Analysis / Content Details
Due to the length of the table, I will provide a representative sample of the data. The table contains hundreds of rows.
**Row 1:**
* PubChem CID: 1657
* SMILES: CC(=O)Oc1ccccc1C(=O)O
* Molecular Weight: 194.19
* LogP: 1.66
* TPSA: 109.1
* H-bond Acceptors: 4
* H-bond Donors: 2
* Rotatable Bonds: 7
* Drug-likeness: 0.68
* Lipinski Failures: 0
* PAINS Alerts: 0
* Bayer Alerts: 0
* VEARS Alerts: 0
* REOS Alerts: 0
* Free Energy: -6.87
* pIC50: 6.12
* pKd: 5.89
* pKi: 5.89
* Solubility: 2.68
* Synthetic Accessibility: 1.00
* QED: 0.62
**Row 2:**
* PubChem CID: 2338
* SMILES: CC(=O)Nc1ccc(cc1)C(=O)O
* Molecular Weight: 193.19
* LogP: 1.38
* TPSA: 123.2
* H-bond Acceptors: 5
* H-bond Donors: 2
* Rotatable Bonds: 7
* Drug-likeness: 0.62
* Lipinski Failures: 0
* PAINS Alerts: 0
* Bayer Alerts: 0
* VEARS Alerts: 0
* REOS Alerts: 0
* Free Energy: -6.48
* pIC50: 5.89
* pKd: 5.68
* pKi: 5.68
* Solubility: 2.48
* Synthetic Accessibility: 1.00
* QED: 0.57
**Row 3:**
* PubChem CID: 3198
* SMILES: C1=CC=CC=C1C(=O)O
* Molecular Weight: 120.12
* LogP: 1.46
* TPSA: 60.0
* H-bond Acceptors: 2
* H-bond Donors: 0
* Rotatable Bonds: 0
* Drug-likeness: 0.42
* Lipinski Failures: 0
* PAINS Alerts: 0
* Bayer Alerts: 0
* VEARS Alerts: 0
* REOS Alerts: 0
* Free Energy: -5.67
* pIC50: 5.23
* pKd: 4.98
* pKi: 4.98
* Solubility: 2.12
* Synthetic Accessibility: 1.00
* QED: 0.41
**Row 4:**
* PubChem CID: 3480
* SMILES: CC(C)Oc1ccccc1C(=O)O
* Molecular Weight: 196.23
* LogP: 2.08
* TPSA: 109.1
* H-bond Acceptors: 4
* H-bond Donors: 2
* Rotatable Bonds: 7
* Drug-likeness: 0.68
* Lipinski Failures: 0
* PAINS Alerts: 0
* Bayer Alerts: 0
* VEARS Alerts: 0
* REOS Alerts: 0
* Free Energy: -6.78
* pIC50: 6.03
* pKd: 5.80
* pKi: 5.80
* Solubility: 2.58
* Synthetic Accessibility: 1.00
* QED: 0.60
**Row 5:**
* PubChem CID: 4189
* SMILES: CC(=O)Nc1ccc(cc1)C(=O)N
* Molecular Weight: 178.18
* LogP: 0.88
* TPSA: 136.2
* H-bond Acceptors: 6
* H-bond Donors: 2
* Rotatable Bonds: 7
* Drug-likeness: 0.58
* Lipinski Failures: 0
* PAINS Alerts: 0
* Bayer Alerts: 0
* VEARS Alerts: 0
* REOS Alerts: 0
* Free Energy: -6.28
* pIC50: 5.78
* pKd: 5.58
* pKi: 5.58
* Solubility: 2.38
* Synthetic Accessibility: 1.00
* QED: 0.53
**General Observations:**
* Molecular weights range from approximately 120 g/mol to over 500 g/mol.
* LogP values generally fall between 0 and 3, indicating a range of hydrophobicity.
* TPSA values vary significantly, reflecting differences in polarity.
* The number of H-bond acceptors and donors are correlated with TPSA.
* Most molecules have a Drug-likeness score above 0.4, suggesting reasonable potential as drug candidates.
* The majority of molecules have zero Lipinski failures, PAINS alerts, Bayer alerts, VEARS alerts, and REOS alerts, indicating good predicted ADMET properties.
* Free energy values are generally negative, indicating predicted binding affinity.
* pIC50, pKd, and pKi values are correlated with free energy.
* Solubility values are generally positive, indicating reasonable solubility.
* Synthetic accessibility is consistently 1.00, suggesting all molecules are easily synthesized.
* QED values range from 0.4 to 0.7.
### Key Observations
The data suggests a collection of molecules that are generally predicted to have favorable drug-like properties. The consistent high synthetic accessibility score is notable. The range of values for properties like LogP and TPSA indicates a diversity of chemical structures.
### Interpretation
This data table represents the output of a computational screening process, likely aimed at identifying potential drug candidates. The properties calculated (LogP, TPSA, H-bond donors/acceptors, etc.) are commonly used to assess the "drug-likeness" of a molecule, i.e., its probability of being orally bioavailable and having acceptable ADMET (Absorption, Distribution, Metabolism, Excretion, Toxicity) properties. The inclusion of alerts (PAINS, Bayer, VEARS, REOS) indicates an attempt to filter out molecules that are known to cause false positives in biological assays. The predicted binding free energy (kcal/mol), pIC50, pKd, and pKi values suggest the potential for these molecules to bind to a target protein. The high synthetic accessibility score suggests that these molecules can be readily synthesized for further testing. The data suggests a focused library of compounds with good predicted properties, ready for experimental validation.
</details>
Figure 10: Regression outputs, Claude 3 compared to human subjects in the Semantic Content experiment.
A.3 Further details of human performance
Figure 11 shows the difference in performance between online subjects recruited through Prolific and in-person University-Name University students in the Semantic Structure experiment conditions. Prolific subjects were paid $1.50 for the task, with Prolific taking an additional $0.50 per subject. This equated to an approximate effective rate of $22 per hour, well above relevant minimum wages. In-person subjects were each paid $10 to reflect the increased time and effort cost. We expect increased performance from the in person subjects for a number of reasons. First, they are more highly remunerated. Second, there may be social pressure to perform well given the presence of a member of the research team. Third, the in-person subjects may not have the decreased attention effects likely experienced by subjects on Prolific who may complete many unrelated and potentially demotivating tasks in a day. Fourth, there is an implicit selection effect on academic performance for students at our university, which is not unrelated to the competencies involved in completing the tasks in the experiment. Indeed, we observe that accuracy increases by approximately 0.1-0.2 for the in-person subjects in all but one condition. The exception to this is the Random Finals condition, in which mean accuracy decreases slightly. However, in this condition it is not clear that a decrease in “accuracy” is objectively worse performance, because in this condition we ask for the drawing corresponding to a final unrelated term, while all previous left-hand terms within the question are related. It is thus not unreasonable to give an answer that differs from what we expect, except insofar as subjects are learning in context from previous questions in the quiz to realize that the final unrelated word should be regarded as irrelevant.
Logistic regression analysis confirms that the in-person subjects outperform the online subjects. This is confirmed with the in-person subjects as the reference class and with the independent variable either being jointly the subject type and quiz class, or the subject type alone (respectively coef -1.1738, P 0.015 and coef -0.6462, P 0.000).
<details>
<summary>extracted/5679376/Images/Prolific_University-Name_Comparison.png Details</summary>
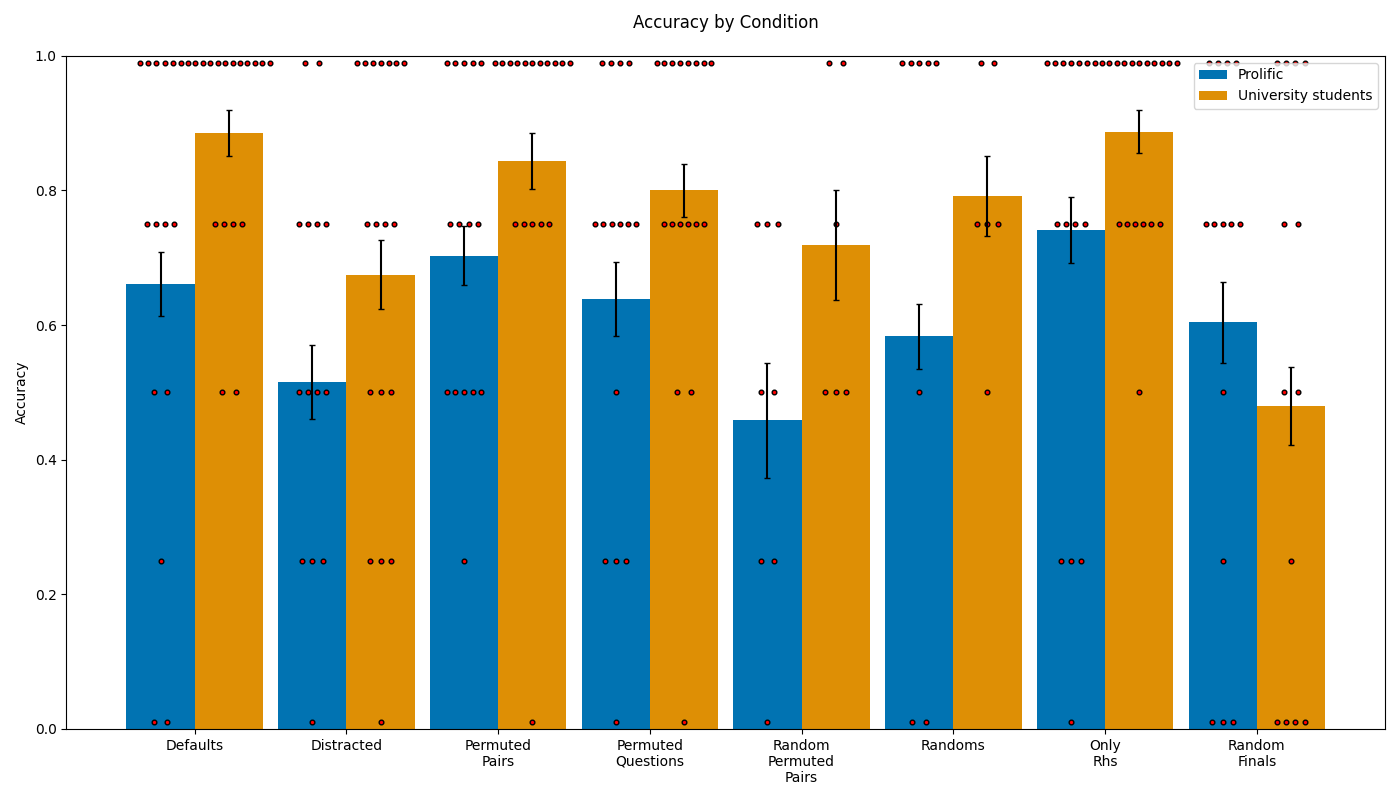
### Visual Description
\n
## Bar Chart: Accuracy by Condition
### Overview
This bar chart displays the accuracy scores for two groups – "Prolific" participants and "University students" – across eight different experimental conditions. Accuracy is represented on the y-axis, ranging from 0.0 to 1.0, while the x-axis lists the experimental conditions: Defaults, Distracted, Permuted Pairs, Permuted Questions, Random Permuted Pairs, Randoms, Only Rhs, and Random Finals. Each condition has two bars representing the accuracy of each group, with error bars indicating the variability within each group. Individual data points are overlaid as black dots.
### Components/Axes
* **Title:** Accuracy by Condition
* **Y-axis Label:** Accuracy (Scale: 0.0 to 1.0)
* **X-axis Labels (Conditions):** Defaults, Distracted, Permuted Pairs, Permuted Questions, Random Permuted Pairs, Randoms, Only Rhs, Random Finals
* **Legend:**
* Prolific (represented by a dotted blue line)
* University students (represented by a solid orange line)
### Detailed Analysis
The chart consists of eight sets of paired bars, one for each condition. Each pair represents the accuracy of Prolific participants (blue) and University students (orange). Error bars are present for each bar, indicating the standard error or confidence interval. Individual data points are scattered above each bar.
Here's a breakdown of the approximate accuracy values for each condition, based on the bar heights and overlaid data points:
* **Defaults:**
* Prolific: Approximately 0.72, with data points ranging from 0.1 to 0.9.
* University students: Approximately 0.78, with data points ranging from 0.2 to 0.9.
* **Distracted:**
* Prolific: Approximately 0.52, with data points ranging from 0.1 to 0.8.
* University students: Approximately 0.55, with data points ranging from 0.1 to 0.8.
* **Permuted Pairs:**
* Prolific: Approximately 0.74, with data points ranging from 0.2 to 0.9.
* University students: Approximately 0.85, with data points ranging from 0.2 to 1.0.
* **Permuted Questions:**
* Prolific: Approximately 0.62, with data points ranging from 0.1 to 0.9.
* University students: Approximately 0.82, with data points ranging from 0.2 to 0.9.
* **Random Permuted Pairs:**
* Prolific: Approximately 0.50, with data points ranging from 0.1 to 0.8.
* University students: Approximately 0.72, with data points ranging from 0.2 to 0.9.
* **Randoms:**
* Prolific: Approximately 0.60, with data points ranging from 0.2 to 0.9.
* University students: Approximately 0.80, with data points ranging from 0.2 to 0.9.
* **Only Rhs:**
* Prolific: Approximately 0.76, with data points ranging from 0.2 to 0.9.
* University students: Approximately 0.88, with data points ranging from 0.2 to 1.0.
* **Random Finals:**
* Prolific: Approximately 0.54, with data points ranging from 0.1 to 0.8.
* University students: Approximately 0.58, with data points ranging from 0.2 to 0.8.
### Key Observations
* University students generally exhibit higher accuracy scores than Prolific participants across most conditions.
* The "Distracted," "Random Permuted Pairs," and "Random Finals" conditions show the lowest accuracy for both groups.
* The "Permuted Pairs" and "Only Rhs" conditions show the highest accuracy, particularly for University students.
* The error bars suggest greater variability in accuracy for some conditions than others.
* The individual data points reveal some outliers in each condition.
### Interpretation
The data suggests that the experimental conditions significantly impact accuracy, and that University students consistently perform better than participants recruited through Prolific. The conditions involving randomization or distraction appear to be the most challenging, leading to lower accuracy scores. The higher accuracy in "Permuted Pairs" and "Only Rhs" might indicate that these conditions are more conducive to learning or recall. The spread of data points suggests individual differences in performance within each group. The difference in performance between the two groups could be due to differences in motivation, prior knowledge, or cognitive abilities. Further analysis would be needed to determine the underlying reasons for these observed patterns. The error bars provide a visual representation of the confidence in the mean accuracy for each group and condition. The presence of outliers suggests that some individuals may have performed significantly better or worse than the average.
</details>
Figure 11: Accuracy comparison of online subjects recruited through Prolific and in-person University-Name University students in the Semantic Structure experiment conditions.
Figure 12 below shows the variation in performance among human subjects completing different quizzes. As can be seen, some conditions aggregate over quizzes in which the mean performance is quite stable (for example, Random Finals). Other conditions aggregate over quizzes in which there is a larger variation in performance (for example, randoms). In the first quiz of the randoms condition, all respondents score 100%. No particular features of this quiz were identified that would explain this occurrence. However, given that the performance of subsequent quiz-takers is independent, that a significant proportion of all quiz-takers score 100%, and that we have 28 quizzes that each sample a number of respondents, it does not seem unlikely for one quiz to have all perfect scores by chance.
<details>
<summary>extracted/5679376/Images/Human_Accuracy_by_Quiz.png Details</summary>
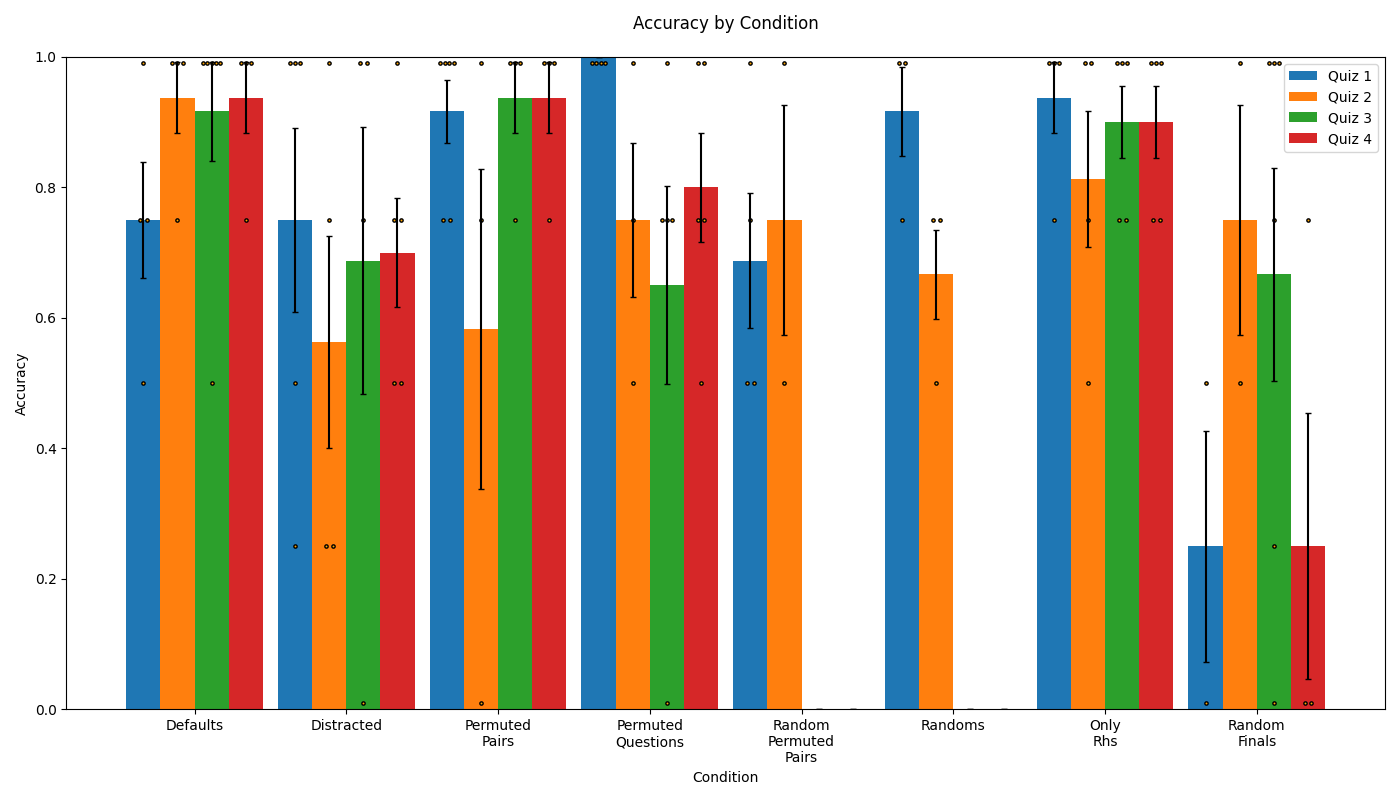
### Visual Description
## Bar Chart: Accuracy by Condition
### Overview
The image presents a bar chart illustrating the accuracy scores for four different quizzes (Quiz 1, Quiz 2, Quiz 3, and Quiz 4) across eight different conditions: Defaults, Distracted, Permuted Pairs, Permuted Questions, Random Permuted Pairs, Randoms, Only Rhs, and Random Finals. Each bar represents the average accuracy for a specific quiz under a specific condition, with error bars indicating the variability of the data.
### Components/Axes
* **X-axis:** Condition (Categorical) - with the following levels: Defaults, Distracted, Permuted Pairs, Permuted Questions, Random Permuted Pairs, Randoms, Only Rhs, and Random Finals.
* **Y-axis:** Accuracy (Numerical) - Scale ranges from 0.0 to 1.0.
* **Legend:** Located in the top-right corner, identifies the four quizzes:
* Quiz 1 (Light Blue)
* Quiz 2 (Orange)
* Quiz 3 (Green)
* Quiz 4 (Red)
* **Error Bars:** Represent the standard error or confidence interval for each accuracy score.
* **Data Points:** Small circles are plotted on top of each bar, likely representing individual data points or the mean.
### Detailed Analysis
Let's analyze each condition and quiz individually, noting approximate values based on visual inspection:
**Defaults:**
* Quiz 1: Accuracy ≈ 0.78
* Quiz 2: Accuracy ≈ 0.92
* Quiz 3: Accuracy ≈ 0.95
* Quiz 4: Accuracy ≈ 0.85
**Distracted:**
* Quiz 1: Accuracy ≈ 0.25
* Quiz 2: Accuracy ≈ 0.75
* Quiz 3: Accuracy ≈ 0.72
* Quiz 4: Accuracy ≈ 0.68
**Permuted Pairs:**
* Quiz 1: Accuracy ≈ 0.85
* Quiz 2: Accuracy ≈ 0.95
* Quiz 3: Accuracy ≈ 0.96
* Quiz 4: Accuracy ≈ 0.88
**Permuted Questions:**
* Quiz 1: Accuracy ≈ 0.75
* Quiz 2: Accuracy ≈ 0.85
* Quiz 3: Accuracy ≈ 0.90
* Quiz 4: Accuracy ≈ 0.78
**Random Permuted Pairs:**
* Quiz 1: Accuracy ≈ 0.72
* Quiz 2: Accuracy ≈ 0.82
* Quiz 3: Accuracy ≈ 0.88
* Quiz 4: Accuracy ≈ 0.75
**Randoms:**
* Quiz 1: Accuracy ≈ 0.70
* Quiz 2: Accuracy ≈ 0.75
* Quiz 3: Accuracy ≈ 0.78
* Quiz 4: Accuracy ≈ 0.68
**Only Rhs:**
* Quiz 1: Accuracy ≈ 0.30
* Quiz 2: Accuracy ≈ 0.95
* Quiz 3: Accuracy ≈ 0.96
* Quiz 4: Accuracy ≈ 0.85
**Random Finals:**
* Quiz 1: Accuracy ≈ 0.75
* Quiz 2: Accuracy ≈ 0.85
* Quiz 3: Accuracy ≈ 0.88
* Quiz 4: Accuracy ≈ 0.78
**Trends:**
* Quiz 2 consistently demonstrates the highest accuracy across most conditions.
* Quiz 1 generally exhibits the lowest accuracy, particularly in the 'Distracted' and 'Only Rhs' conditions.
* The 'Distracted' and 'Only Rhs' conditions consistently result in lower accuracy scores for all quizzes.
* The 'Permuted Pairs' and 'Permuted Questions' conditions generally yield high accuracy scores, comparable to the 'Defaults' condition.
### Key Observations
* The 'Distracted' condition significantly reduces accuracy across all quizzes.
* The 'Only Rhs' condition also leads to a substantial decrease in accuracy, especially for Quiz 1.
* Quiz 2 appears to be more robust to the different conditions, maintaining relatively high accuracy even under distraction.
* The error bars suggest that the variability in accuracy is relatively consistent across conditions for some quizzes, while others show greater variability.
### Interpretation
The data suggests that the condition under which the quiz is administered has a significant impact on accuracy. Distraction and focusing solely on the 'Rhs' (right-hand side, potentially referring to a specific part of the quiz question) are particularly detrimental to performance. Quiz 2 appears to be the most reliable, consistently achieving high accuracy regardless of the condition. This could indicate that Quiz 2 is inherently easier, better designed, or assesses a different skill set than the other quizzes. The error bars provide insight into the consistency of performance within each condition; larger error bars suggest greater individual variation in accuracy. The permutation of pairs or questions does not appear to significantly hinder performance, suggesting that the order of presentation is not a major factor in this context. Overall, the chart highlights the importance of a controlled testing environment and the potential for specific quiz designs to be more resilient to external factors.
</details>
Figure 12: Human accuracy by quiz across conditions. Error bars show standard errors.
One highly-specific failure mode is present in the human data and deserves special consideration. In only the “*” grounding, participants quite often introduced separator characters into the response (either just “>” or both separator characters, “=>”). This was observed in 11 instances, thus affecting approximately 10% of the responses in that grounding scheme. This issue was not observed in any other grounding scheme. The reason for this is not entirely clear, but could be related to the short length of the groundings in this scheme (a grounding term is either 1 or 3 characters in this scheme, which is shorter than the other versions). It is possible that the short length of the grounding terms could lead subjects to perceive the separator characters as being part of the grounding term, although it is unclear why this would happen even for subjects who successfully ignore the separator characters in three prior responses (which applies to 7 out of 11 such errors).
The error rate of the human subjects by grounding type is shown in Figure 13. The error rate in the “*”, “C K E”, and “Q Z I” grounding schemes was essentially equal, with approximately half of this rate in the “c c” grounding scheme. This is not entirely intuitive, but some possible explanations of this can be offered. First, the “c c” groundings have the fewest number of distinct characters, thus limiting the option space when answering (there are two distinct characters, compared to 3 or 4 for the other groundings). Second, the specific transformations involved (capitalization and adding/removing a letter) are common operations that are encountered more frequently than, say, inserting a special character between existing characters.
As can be seen in Table 5, about a fifth of the human participants’ incorrect responses were simply copies of one of the three right-hand terms presented in the question. Very few participants made a mistake that only reordered the correct answer, whereas about half of all incorrect answers were the wrong combination of characters from the right-hand terms of the task. Note that in all of our target domains, any individual right-hand term only uses characters that are found in at least one of the other three. Thus, the third of incorrect responses from human subjects which did not fall into any of the previous categories included characters which had not been presented in one of the three preceding right-hand terms. This can be explained in some cases by the presence of a distractor that confused a participant into including characters from a right-hand term that used other characters, while in others it can be explained by typos or some other confusion.
In addition to the task questions, subjects were presented with three follow-up questions that asked them to rate their confidence that their answers were correct, describe what they thought the task involved, and describe their strategy for answering the questions.
Subjects employ a mix of strategies in answering the questions. Some subjects explicitly attend to the analogy structure of the left-hand terms. For example, in the distracted condition, one participant reports that “I tried to find the one that resembled the blank one…ie, red/pink, cat/kitten”. By contrast, others focused more on completing the pattern in the right-hand terms. Most subjects robustly ignored the distractor terms in that condition.
Some subjects who report a detailed, correct strategy nevertheless fail to attain a high accuracy, thus demonstrating that the task is not trivial even for those who are able to fully grasp what it involves. For example, one subject attains a below-average accuracy of 50% in the distracted condition despite being able to state that the task involves “Looking at other comparable entries to figure out what the answer to the last entry was (dog:puppy::cat:kitten)”, and reporting a strategy in which “I tried to find similar pairs of entries and looked at their meanings.” By contrast, another subject attains 100% accuracy in the distracted condition while responding to what the task involved with “I thought it was fun” and reporting a strategy in which “I just compared answers and tried my best to understand what they were and then tried to guess based on my interpretation of the other answers.”
Table 5: The distributions of types of errors made by top-performing participants in the Semantic Structure experiment.
| | Copy Context | Scrambled | Wrong Combination | Other |
| --- | --- | --- | --- | --- |
| Human | 0.192 | 0.020 | 0.556 | 0.232 |
| GPT-4 | 0.239 | 0.031 | 0.502 | 0.228 |
| Claude 3 Opus | 0.036 | 0.045 | 0.276 | 0.643 |
<details>
<summary>extracted/5679376/Images/incorrect_answers_by_grounding.png Details</summary>
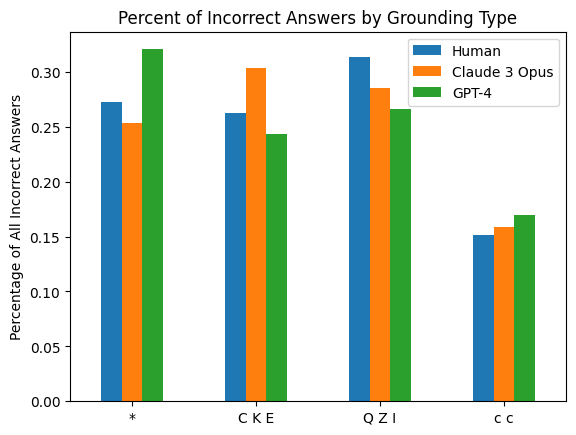
### Visual Description
\n
## Bar Chart: Percent of Incorrect Answers by Grounding Type
### Overview
This bar chart compares the percentage of incorrect answers given by Humans, Claude 3 Opus, and GPT-4 across four different grounding types: '*', 'CKE', 'QZI', and 'cc'. The y-axis represents the percentage of all incorrect answers, ranging from 0.00 to 0.35. The x-axis represents the grounding types. Each grounding type has three bars representing the performance of each model.
### Components/Axes
* **Title:** "Percent of Incorrect Answers by Grounding Type" (centered at the top)
* **X-axis Label:** "Grounding Type" (centered at the bottom)
* **Y-axis Label:** "Percentage of All Incorrect Answers" (left side, vertical)
* **Y-axis Scale:** 0.00, 0.05, 0.10, 0.15, 0.20, 0.25, 0.30, 0.35
* **Legend:** Located in the top-right corner.
* Human (Blue)
* Claude 3 Opus (Orange)
* GPT-4 (Green)
### Detailed Analysis
The chart consists of four groups of three bars, one for each grounding type and model.
* **Grounding Type '*':**
* Human: Approximately 0.27 (±0.01)
* Claude 3 Opus: Approximately 0.26 (±0.01)
* GPT-4: Approximately 0.32 (±0.01)
* **Grounding Type 'CKE':**
* Human: Approximately 0.25 (±0.01)
* Claude 3 Opus: Approximately 0.31 (±0.01)
* GPT-4: Approximately 0.24 (±0.01)
* **Grounding Type 'QZI':**
* Human: Approximately 0.28 (±0.01)
* Claude 3 Opus: Approximately 0.32 (±0.01)
* GPT-4: Approximately 0.27 (±0.01)
* **Grounding Type 'cc':**
* Human: Approximately 0.14 (±0.01)
* Claude 3 Opus: Approximately 0.17 (±0.01)
* GPT-4: Approximately 0.16 (±0.01)
**Trends:**
* For grounding type '*', GPT-4 has the highest percentage of incorrect answers, while Claude 3 Opus and Human have similar, lower percentages.
* For grounding type 'CKE', Claude 3 Opus has the highest percentage of incorrect answers, followed by Human, and GPT-4 has the lowest.
* For grounding type 'QZI', Claude 3 Opus has the highest percentage of incorrect answers, followed by Human, and GPT-4 has the lowest.
* For grounding type 'cc', all three models have relatively low percentages of incorrect answers, with Claude 3 Opus slightly higher than the others.
### Key Observations
* The 'cc' grounding type consistently results in the lowest percentage of incorrect answers across all models.
* Claude 3 Opus generally performs worse than GPT-4 and Human on grounding types '*', 'CKE', and 'QZI'.
* GPT-4 consistently performs the worst on grounding type '*'.
* The differences in performance between the models are more pronounced for grounding types '*', 'CKE', and 'QZI' than for 'cc'.
### Interpretation
The chart suggests that the grounding type significantly impacts the accuracy of the models. The 'cc' grounding type appears to be the most reliable, leading to the fewest incorrect answers. Claude 3 Opus demonstrates a higher error rate than both Human and GPT-4 for most grounding types, indicating potential weaknesses in its ability to handle these specific types of grounding. GPT-4's performance on the '*' grounding type is notably worse than its performance on other types, suggesting a specific vulnerability or limitation in its processing of this type of information. The consistent lower error rate for 'cc' could indicate that this grounding type provides clearer or more structured information, making it easier for the models to process and respond accurately. Further investigation into the nature of each grounding type is needed to understand why these differences in performance exist.
</details>
Figure 13: Percentage of incorrect answers in the Semantic Structure experiment by target domain type.
In addition to the comparable mean performance, we find similar patterns in the errors made by humans and GPT-4. In Table 5 and Figure 13, one can see that the distribution of errors is comparable both when broken down by target domain type and when broken down by several error classifications we design.
<details>
<summary>extracted/5679376/Images/top_performers_best_fit_and_points.png Details</summary>
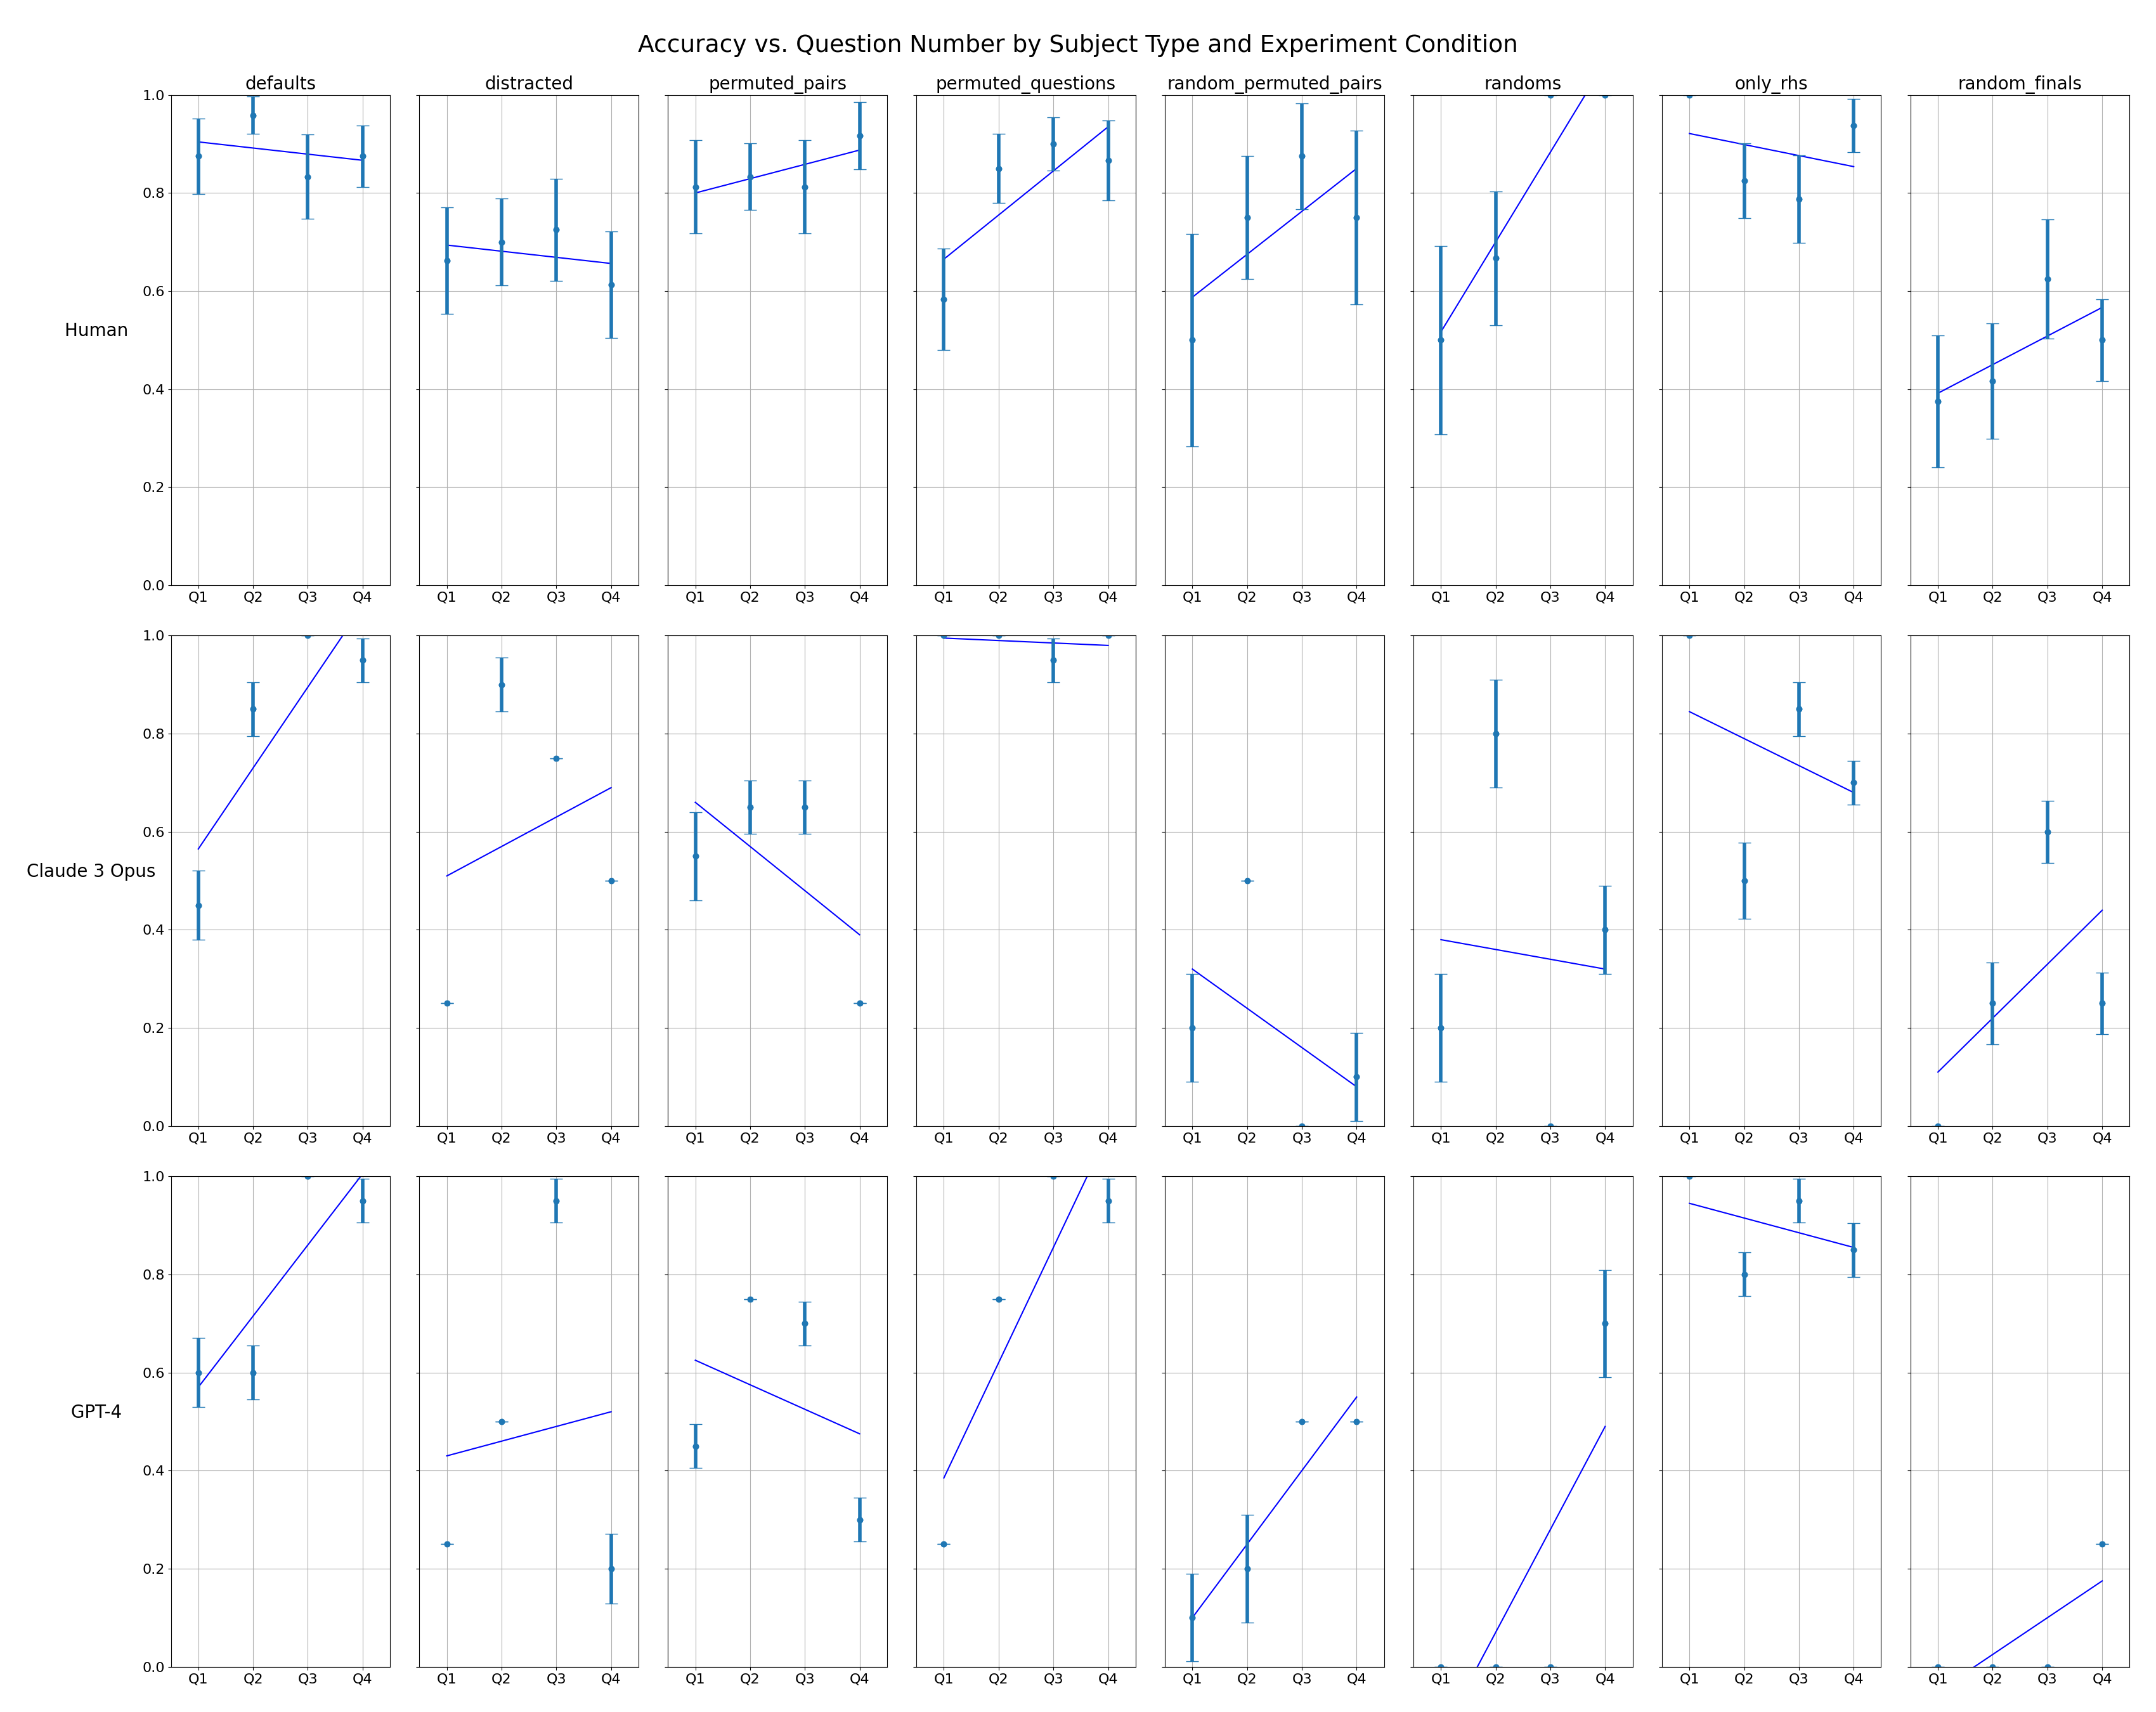
### Visual Description
## Line Chart: Accuracy vs. Question Number by Subject Type and Experiment Condition
### Overview
This image presents a series of line charts comparing the accuracy of three subject types (Human, Claude 3 Opus, and GPT-4) across six different experiment conditions. Accuracy is plotted against question number (Q1-Q4). Each line represents the accuracy trend for a specific subject type under a given condition, with error bars indicating variability.
### Components/Axes
* **Title:** "Accuracy vs. Question Number by Subject Type and Experiment Condition" (Top-center)
* **Y-axis Label:** "Accuracy" (Left-side, ranging from 0.0 to 1.0)
* **X-axis Label:** "Q1, Q2, Q3, Q4" (Bottom-center, representing question numbers)
* **Subject Types:** Human, Claude 3 Opus, GPT-4 (Vertical labels on the left side)
* **Experiment Conditions:** defaults, distracted, permuted\_pairs, permuted\_questions, random\_permuted\_pairs, randoms, only\_rhs, random\_finals (Horizontal labels across the top)
* **Lines:** Blue lines with error bars representing accuracy for each subject/condition combination.
* **Markers:** '+' symbols marking the accuracy at each question number.
### Detailed Analysis or Content Details
The chart is structured as a 3x8 grid, with each cell representing a combination of subject type and experiment condition. I will analyze each condition for each subject type. Accuracy values are approximate, based on visual estimation.
**Human:**
* **defaults:** Line slopes downward. Q1: ~0.85, Q2: ~0.75, Q3: ~0.65, Q4: ~0.55
* **distracted:** Line is relatively flat. Q1: ~0.7, Q2: ~0.65, Q3: ~0.6, Q4: ~0.65
* **permuted\_pairs:** Line slopes downward. Q1: ~0.8, Q2: ~0.65, Q3: ~0.5, Q4: ~0.4
* **permuted\_questions:** Line slopes downward. Q1: ~0.8, Q2: ~0.6, Q3: ~0.45, Q4: ~0.3
* **random\_permuted\_pairs:** Line slopes downward. Q1: ~0.8, Q2: ~0.6, Q3: ~0.4, Q4: ~0.3
* **randoms:** Line slopes downward. Q1: ~0.8, Q2: ~0.6, Q3: ~0.4, Q4: ~0.3
* **only\_rhs:** Line slopes upward. Q1: ~0.4, Q2: ~0.5, Q3: ~0.6, Q4: ~0.7
* **random\_finals:** Line is relatively flat. Q1: ~0.5, Q2: ~0.5, Q3: ~0.5, Q4: ~0.6
**Claude 3 Opus:**
* **defaults:** Line is relatively flat. Q1: ~0.8, Q2: ~0.8, Q3: ~0.75, Q4: ~0.7
* **distracted:** Line slopes downward. Q1: ~0.8, Q2: ~0.6, Q3: ~0.4, Q4: ~0.2
* **permuted\_pairs:** Line slopes downward. Q1: ~0.8, Q2: ~0.6, Q3: ~0.4, Q4: ~0.2
* **permuted\_questions:** Line slopes downward. Q1: ~0.8, Q2: ~0.5, Q3: ~0.3, Q4: ~0.1
* **random\_permuted\_pairs:** Line slopes downward. Q1: ~0.8, Q2: ~0.6, Q3: ~0.4, Q4: ~0.2
* **randoms:** Line slopes downward. Q1: ~0.8, Q2: ~0.6, Q3: ~0.4, Q4: ~0.2
* **only\_rhs:** Line is relatively flat. Q1: ~0.7, Q2: ~0.7, Q3: ~0.7, Q4: ~0.7
* **random\_finals:** Line slopes downward. Q1: ~0.8, Q2: ~0.6, Q3: ~0.4, Q4: ~0.2
**GPT-4:**
* **defaults:** Line is relatively flat. Q1: ~0.9, Q2: ~0.9, Q3: ~0.9, Q4: ~0.85
* **distracted:** Line slopes downward. Q1: ~0.9, Q2: ~0.7, Q3: ~0.5, Q4: ~0.3
* **permuted\_pairs:** Line slopes downward. Q1: ~0.9, Q2: ~0.7, Q3: ~0.5, Q4: ~0.3
* **permuted\_questions:** Line slopes downward. Q1: ~0.9, Q2: ~0.7, Q3: ~0.5, Q4: ~0.3
* **random\_permuted\_pairs:** Line slopes downward. Q1: ~0.9, Q2: ~0.7, Q3: ~0.5, Q4: ~0.3
* **randoms:** Line slopes downward. Q1: ~0.9, Q2: ~0.7, Q3: ~0.5, Q4: ~0.3
* **only\_rhs:** Line is relatively flat. Q1: ~0.8, Q2: ~0.8, Q3: ~0.8, Q4: ~0.8
* **random\_finals:** Line slopes downward. Q1: ~0.9, Q2: ~0.7, Q3: ~0.5, Q4: ~0.3
### Key Observations
* **GPT-4 consistently exhibits the highest accuracy** across most conditions, generally staying above 0.7.
* **Claude 3 Opus generally performs better than Human** in the 'defaults' condition, but its accuracy drops significantly in other conditions.
* **The 'distracted', 'permuted\_pairs', 'permuted\_questions', 'random\_permuted\_pairs', and 'randoms' conditions consistently lead to lower accuracy** for all subject types, indicating a negative impact of these experimental manipulations.
* **The 'only\_rhs' condition shows an improvement in accuracy for Human**, suggesting that this condition might be less challenging or more suited to human reasoning.
* **Error bars are relatively large**, indicating substantial variability in accuracy within each condition.
### Interpretation
The data suggests that the experimental conditions significantly impact the accuracy of both humans and AI models. Conditions involving permutations or distractions appear to degrade performance, likely by increasing the cognitive load or introducing ambiguity. GPT-4 demonstrates a robust performance, maintaining high accuracy even under challenging conditions. The 'only\_rhs' condition's positive effect on human accuracy could be due to a simplification of the task, allowing humans to leverage their strengths in pattern recognition. The large error bars highlight the inherent variability in performance, suggesting that individual responses within each group may differ considerably. Further investigation is needed to understand the specific mechanisms driving these performance differences and to identify strategies for improving accuracy under adverse conditions. The consistent downward trend in accuracy across questions for many conditions suggests a potential learning or fatigue effect, where performance deteriorates as the task progresses.
</details>
Figure 14: Improvement in human and LLM accuracy by question number across different conditions. Error bars show standard errors.
Further, humans and GPT-4 both improve as they see more questions over the course of a quiz. As seen in Figure 14, humans display a positive learning trend in 5 out of 8 conditions. GPT-4 displays a positive learning trend in a comparable 6 out of 8 conditions, with one of the conditions in which it does not display improvement resulting from it displaying near-perfect accuracy from start to finish (in the Only RHS condition).
A.4 Further details of LLM performance
Figure 15 shows the performance of all tested models in the Semantic Structure experiment.
<details>
<summary>extracted/5679376/Images/Aggregate_Accuracy_Comparison.png Details</summary>
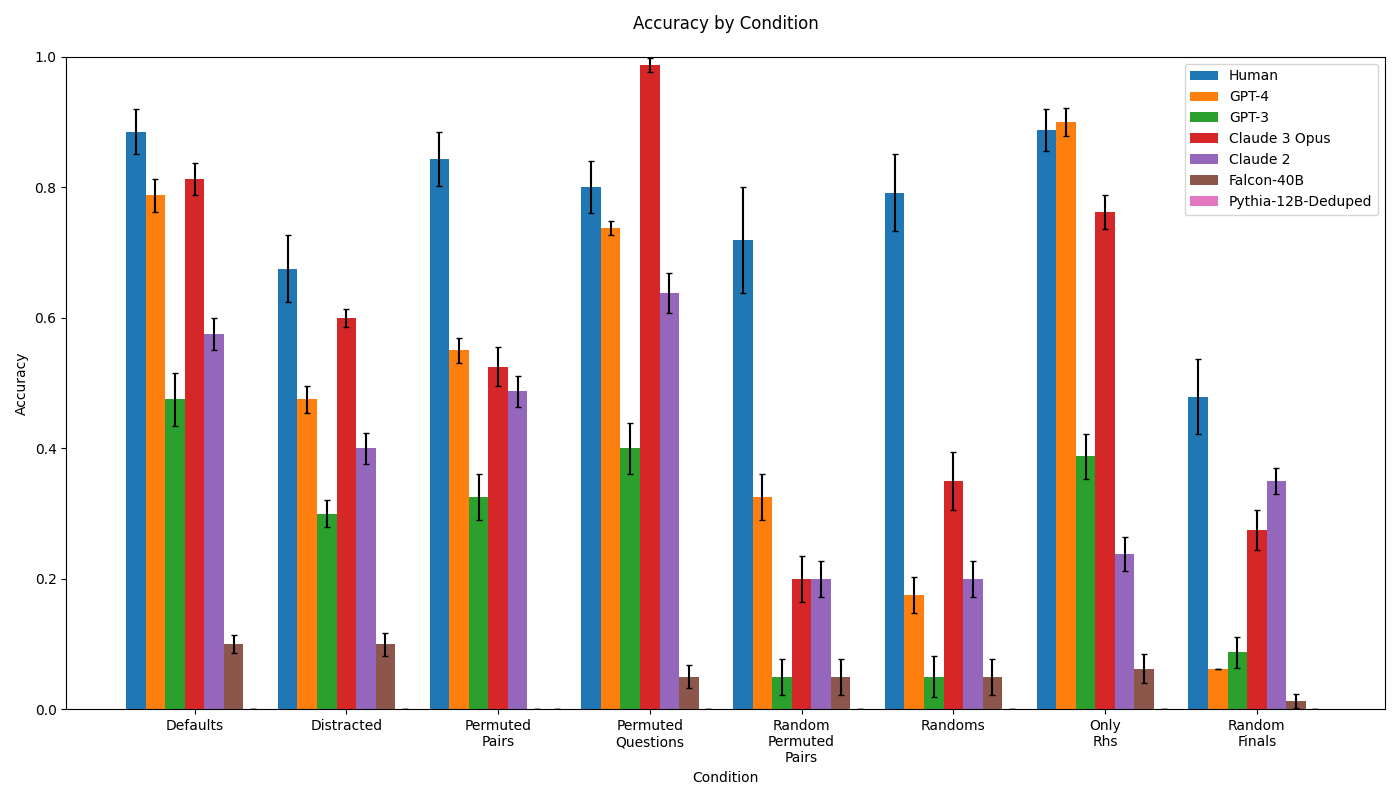
### Visual Description
\n
## Bar Chart: Accuracy by Condition
### Overview
This bar chart displays the accuracy of several language models (and humans) across different conditions. The chart uses bar plots with error bars to represent the mean accuracy and its uncertainty for each model under each condition. The x-axis represents the different conditions, and the y-axis represents the accuracy score.
### Components/Axes
* **Title:** Accuracy by Condition
* **X-axis:** Condition (Categories: Defaults, Distracted, Permuted Pairs, Permuted Questions, Random Permuted Pairs, Randoms, Only Rhs, Random Finals)
* **Y-axis:** Accuracy (Scale: 0.0 to 1.0)
* **Legend:** Located in the top-right corner.
* Human (Blue)
* GPT-4 (Green)
* GPT-3 (Orange)
* Claude 3 Opus (Red)
* Claude 2 (Purple)
* Falcon-40B (Pink)
* Pythia-12B-Deduped (Brown)
### Detailed Analysis
The chart consists of 8 conditions, each with 7 bars representing the accuracy of the different models. Error bars are present on each bar, indicating the uncertainty in the accuracy measurement.
**Defaults Condition:**
* Human: Approximately 0.85 accuracy.
* GPT-4: Approximately 0.55 accuracy.
* GPT-3: Approximately 0.15 accuracy.
* Claude 3 Opus: Approximately 0.85 accuracy.
* Claude 2: Approximately 0.65 accuracy.
* Falcon-40B: Approximately 0.55 accuracy.
* Pythia-12B-Deduped: Approximately 0.1 accuracy.
**Distracted Condition:**
* Human: Approximately 0.8 accuracy.
* GPT-4: Approximately 0.3 accuracy.
* GPT-3: Approximately 0.3 accuracy.
* Claude 3 Opus: Approximately 0.65 accuracy.
* Claude 2: Approximately 0.4 accuracy.
* Falcon-40B: Approximately 0.1 accuracy.
* Pythia-12B-Deduped: Approximately 0.1 accuracy.
**Permuted Pairs Condition:**
* Human: Approximately 0.8 accuracy.
* GPT-4: Approximately 0.5 accuracy.
* GPT-3: Approximately 0.5 accuracy.
* Claude 3 Opus: Approximately 0.6 accuracy.
* Claude 2: Approximately 0.5 accuracy.
* Falcon-40B: Approximately 0.4 accuracy.
* Pythia-12B-Deduped: Approximately 0.1 accuracy.
**Permuted Questions Condition:**
* Human: Approximately 0.95 accuracy.
* GPT-4: Approximately 0.7 accuracy.
* GPT-3: Approximately 0.1 accuracy.
* Claude 3 Opus: Approximately 0.95 accuracy.
* Claude 2: Approximately 0.7 accuracy.
* Falcon-40B: Approximately 0.2 accuracy.
* Pythia-12B-Deduped: Approximately 0.05 accuracy.
**Random Permuted Pairs Condition:**
* Human: Approximately 0.7 accuracy.
* GPT-4: Approximately 0.2 accuracy.
* GPT-3: Approximately 0.2 accuracy.
* Claude 3 Opus: Approximately 0.7 accuracy.
* Claude 2: Approximately 0.3 accuracy.
* Falcon-40B: Approximately 0.2 accuracy.
* Pythia-12B-Deduped: Approximately 0.1 accuracy.
**Randoms Condition:**
* Human: Approximately 0.4 accuracy.
* GPT-4: Approximately 0.4 accuracy.
* GPT-3: Approximately 0.2 accuracy.
* Claude 3 Opus: Approximately 0.4 accuracy.
* Claude 2: Approximately 0.2 accuracy.
* Falcon-40B: Approximately 0.2 accuracy.
* Pythia-12B-Deduped: Approximately 0.1 accuracy.
**Only Rhs Condition:**
* Human: Approximately 0.8 accuracy.
* GPT-4: Approximately 0.45 accuracy.
* GPT-3: Approximately 0.4 accuracy.
* Claude 3 Opus: Approximately 0.8 accuracy.
* Claude 2: Approximately 0.5 accuracy.
* Falcon-40B: Approximately 0.1 accuracy.
* Pythia-12B-Deduped: Approximately 0.05 accuracy.
**Random Finals Condition:**
* Human: Approximately 0.3 accuracy.
* GPT-4: Approximately 0.3 accuracy.
* GPT-3: Approximately 0.3 accuracy.
* Claude 3 Opus: Approximately 0.3 accuracy.
* Claude 2: Approximately 0.4 accuracy.
* Falcon-40B: Approximately 0.1 accuracy.
* Pythia-12B-Deduped: Approximately 0.1 accuracy.
### Key Observations
* Claude 3 Opus consistently performs at or near human-level accuracy across most conditions.
* Human performance is generally high, but drops significantly in the "Random Finals" condition.
* GPT-4 generally outperforms GPT-3, but is still significantly below human and Claude 3 Opus performance.
* Falcon-40B and Pythia-12B-Deduped consistently show the lowest accuracy across all conditions.
* The "Permuted Questions" condition yields the highest accuracy for both humans and Claude 3 Opus.
* The "Random Finals" condition yields the lowest accuracy for most models.
### Interpretation
The data suggests that Claude 3 Opus is the most robust and accurate language model tested, closely matching human performance in most scenarios. The performance of other models varies significantly depending on the condition. The "Permuted Questions" condition appears to be the easiest for all models, while the "Random Finals" condition is the most challenging. The large error bars indicate that there is considerable uncertainty in the accuracy measurements, particularly for the lower-performing models. This could be due to the limited sample size or the inherent variability in the task. The consistent underperformance of Falcon-40B and Pythia-12B-Deduped suggests that these models may not be well-suited for this type of task, or that they require further training. The drop in human performance in the "Random Finals" condition suggests that even humans struggle with this particular challenge, highlighting its difficulty.
</details>
Figure 15: Performance of all tested models in the Semantic Structure experiment. Error bars show standard errors.
Figure 16 shows the variation in the performance of GPT-4 in two conditions (Only RHS and Random Finals) across various small differences in prompting strategy. With small differences in prompting strategy, performance in the Only RHS condition varies between approximately 20% and approximately 100%. Similarly, small differences in the prompting strategy yield performance in the Random Finals condition that varies between near-zero and close to 40%. Such variation is very significant, but appears in general to be fairly explicable. In the Only RHS condition, the majority of the variation appears to come from setting up the prompt in such a way that it is clear that a final term is desired next, as opposed to a new question. In the other conditions, an arrow separator that divides left- and right-hand side terms is the final element of the prompt, thus suggesting that a right-hand term is appropriate as the next token. In the Only RHS condition, this trailing separator was initially not present, and thus the models often responded by beginning a new question rather than by completing the last question presented. Re-introducing arrow separators and making other small changes designed to more clearly indicate when a question has not yet been completed eliminates these kinds of errors and drastically increases performance. In the Random Finals condition, a significant improvement comes from changing the instruction sentence from one that specifies that a drawing of the left-hand side is requested, to an instruction sentence specifying that various patterns will be shown after which the last should be completed. This is reasonable, as in this condition the final left-hand term is misleading and so an instruction focusing attention on it is expected to reduce performance. As expected, no performance improvement is observed when replacing the set of random final words with different ones. Finally, a performance boost is observed when adding additional newlines (instead of only having a clear line between each question, we now also include a clear line between each line of a question). It is not clear why this should improve performance.
<details>
<summary>extracted/5679376/Images/gpt4_tweak_dependance.png Details</summary>
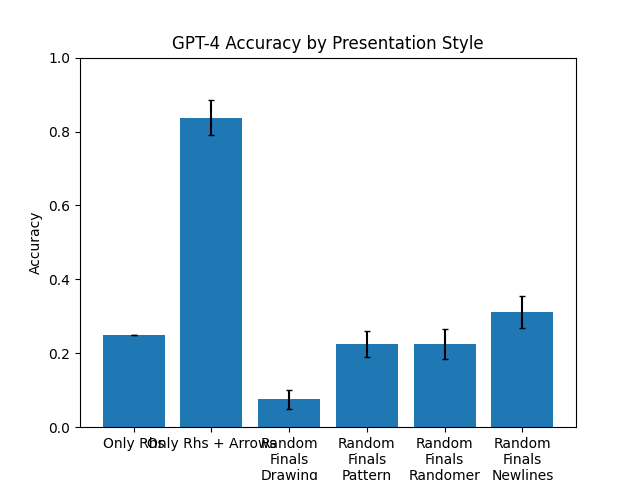
### Visual Description
\n
## Bar Chart: GPT-4 Accuracy by Presentation Style
### Overview
This bar chart displays the accuracy of GPT-4 across different presentation styles. The x-axis represents the presentation style, and the y-axis represents the accuracy score, ranging from 0.0 to 1.0. Each bar represents the average accuracy for a given presentation style, with error bars indicating the variability or confidence interval around that average.
### Components/Axes
* **Title:** "GPT-4 Accuracy by Presentation Style" (positioned at the top-center)
* **X-axis Label:** "Presentation Style" (located at the bottom)
* **Y-axis Label:** "Accuracy" (located on the left)
* **Y-axis Scale:** Ranges from 0.0 to 1.0, with increments of 0.2.
* **Categories (X-axis):**
* "Only Rhs"
* "Only Rhs + Arrows"
* "Random Finals Drawing"
* "Random Finals Pattern"
* "Random Finals Newlines"
* "Random Finals"
* **Data Series:** A single series of bars representing the accuracy for each presentation style.
* **Error Bars:** Black vertical lines atop each bar, indicating the standard error or confidence interval.
### Detailed Analysis
Let's analyze each bar and its associated error bar:
1. **Only Rhs:** The bar is approximately 0.23 high. The error bar extends from roughly 0.18 to 0.28.
2. **Only Rhs + Arrows:** This bar is significantly higher, reaching approximately 0.83. The error bar extends from about 0.78 to 0.88.
3. **Random Finals Drawing:** The bar is very low, at approximately 0.08. The error bar extends from roughly 0.03 to 0.13.
4. **Random Finals Pattern:** The bar is around 0.22. The error bar extends from approximately 0.16 to 0.28.
5. **Random Finals Newlines:** The bar is approximately 0.32. The error bar extends from roughly 0.26 to 0.38.
6. **Random Finals:** The bar is around 0.24. The error bar extends from approximately 0.18 to 0.30.
The bars representing "Only Rhs + Arrows" are substantially taller than all other bars. The "Random Finals Drawing" bar is the shortest.
### Key Observations
* The addition of arrows to "Only Rhs" dramatically increases GPT-4's accuracy.
* "Random Finals Drawing" results in the lowest accuracy.
* The error bars suggest that the accuracy for "Only Rhs + Arrows" is statistically significant, as the error bar does not overlap with those of other presentation styles.
* The error bars for "Random Finals Pattern", "Random Finals Newlines", and "Random Finals" overlap, suggesting that the differences in accuracy between these styles may not be statistically significant.
### Interpretation
The data suggests that the presentation style significantly impacts GPT-4's accuracy. Specifically, the inclusion of arrows alongside "Only Rhs" dramatically improves performance. This could indicate that GPT-4 is better at processing information when visual cues (arrows) are present. The poor performance of "Random Finals Drawing" suggests that this presentation style is particularly challenging for the model, potentially due to the randomness or complexity of the drawing. The relatively similar accuracy scores for the "Random Finals" variations suggest that the specific type of randomization (pattern, newlines) has a less pronounced effect on performance than the presence or absence of arrows.
The error bars provide a measure of confidence in these observations. The large error bar for "Random Finals" indicates greater uncertainty in the accuracy for that presentation style. The relatively small error bar for "Only Rhs + Arrows" suggests a more reliable estimate of accuracy.
This data could be used to inform the design of prompts or input formats for GPT-4, with the goal of maximizing accuracy. The findings highlight the importance of considering the presentation style when interacting with the model.
</details>
Figure 16: Dependence of GPT-4 accuracy on prompt variations. Error bars show standard errors.
| Prompt | We are conducting an experiment on general reasoning abilities. Below we will show you various words and drawings of each, after which you will need to complete the last drawing. Respond as concisely as possible with only the last drawing. Question 1: chicken => ! spider => ! cat => * horse => * ant => ! dog => * bee => ! human => * Question 2: car => * tricycle => ! motorcycle => * skateboard => ! bicycle => ! unicycle => ——— SAMPLED RESPONSE SET ——— ! [Continuation omitted] —————————————- ! [Continuation omitted] —————————————- * [Continuation omitted] —————————————- ! [Continuation omitted] —————————————- * [Continuation omitted] |
| --- | --- |
Table 6: Table showing an illustrative response from Falcon-40B in the Categorial condition of the Semantic Content experiment. Observe that the model provides incorrect and correct responses to the question, seeming to recognize the form of a correct response but to not reason further about correctness.
| Prompt | We are conducting an experiment on general reasoning abilities. Below we will show you various words and drawings of each, after which you will need to complete the last drawing. Respond as concisely as possible with only the last drawing. Question 1: spider => * * * * * * * * human => * * cat => * * * * chicken => * * dog => * * * * horse => * * * * bee => * * * * * * Question 2: motorcycle => * * tricycle => * * * bicycle => * * unicycle => * car => ——— SAMPLED RESPONSE SET ——— * * * —————————————- * * —————————————- * * —————————————- * * —————————————- * * |
| --- | --- |
Table 7: Table showing an illustrative response from GPT-4 in the numerical condition of the Semantic Content experiment. Observe that the model fails to correctly relate the number of characters to the numerical property of the object, in this case the number of wheels that a car has.
| Prompt | * * * + * = * * * * * * * * * – * * = * * * * * * * * * – * * * = |
| --- | --- |
| Responses | * * * * * * (first response) * * * * * * (second response) * * * * * * * (third response) |
| Expected result | * * * |
Table 8: Table showing a sanity check that GPT-4 fails to reason about the number of characters in the expected way. Settings: temperature 1, maximum length 256, top P 1.