# LogicVista: Multimodal LLM Logical Reasoning Benchmark in Visual Contexts
## Abstract
We propose LogicVista, an evaluation benchmark that assesses the integrated logical reasoning capabilities of multimodal large language models (MLLMs) in Vis ual contexts. Recent advancements in MLLMs have demonstrated various fascinating abilities, from crafting poetry based on an image to performing mathematical reasoning. However, there is still a lack of systematic evaluation of MLLMs’ proficiency in logical reasoning tasks, which are essential for activities like navigation and puzzle-solving. Thus we evaluate general logical cognition abilities across 5 logical reasoning tasks encompassing 9 different capabilities, using a sample of 448 multiple-choice questions. Each question is annotated with the correct answer and the human-written reasoning behind the selection, enabling both open-ended and multiple-choice evaluation. A total of 8 MLLMs are comprehensively evaluated using LogicVista. Code and Data Available at https://github.com/Yijia-Xiao/LogicVista.
∗ Both authors contributed equally.
## 1 Introduction
Recent advancements in Large Language Models (LLMs) are gradually turning the vision of a generalist AI agent into reality. These models exhibit near-human expert-level performance across a variety of tasks and have recently been augmented with visual understanding capabilities, enabling them to tackle even more complex visual challenges. This branch of work, led by proprietary projects such as GPT-4 [1] and Flamingo [2], as well as open-source efforts like LLaVA [3], Mini-GPT4 [4], enhances existing LLMs by incorporating visual comprehension. These models, known as Multimodal Large Language Models (MLLMs), use LLMs as the foundation for processing information and generating reasoned outcomes [5], thereby bridging the gap between language and vision.
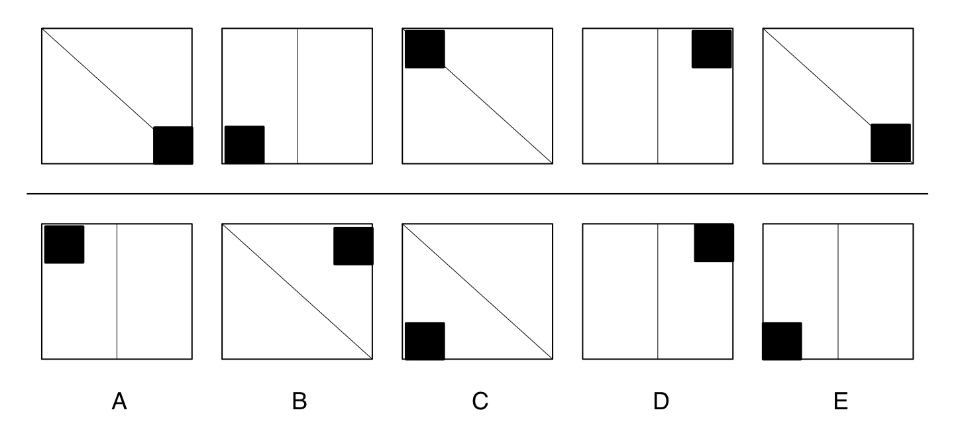
Recent MLLMs have demonstrated a range of impressive abilities, such as writing poems based on an image [6], engaging in mathematical reasoning [2], and even aiding in medical diagnosis [7]. To evaluate the performance of these models, various benchmarks have been proposed, as shown in Figure. 1 targeting the performance on common tasks such as objects recognition [8], text understanding in images [9], or mathematical problem solving [10]. However, as seen in Figure. 1, there is a notable shortage of benchmarks for MLLMs’ abilities in critical logical reasoning tasks that underlie most tasks. Perception and reasoning are two representative abilities of high-level intelligence that are used in unison during human problem-solving processes.
Many current MLLM datasets have focused solely on perception tasks, which require fact retrieval where the MLLM identifies and retrieve relevant information from a scene. However, complex multimodal reasoning, such as interpreting graphs [11], everyday reasoning, critical thinking, and problem-solving [12, 13] requires a combination of perception and logical reasoning. Proficiency in these reasoning skills is a reliable indicator of cognitive capabilities required for performing specialized or routine tasks across different domains. To our knowledge, MathVista [14] is the only benchmark that attempts to evaluate multimodal logical reasoning, but its scope is limited to mathematical-related reasoning. For a better understanding of how MLLMs perform on general reasoning tasks, there is a need for a comprehensive and general visual reasoning benchmark.
| LogicVista (Ours) | | | | | | | | | VQAv2, TextVQA and MM-vet |
| --- | --- | --- | --- | --- | --- | --- | --- | --- | --- |
|
<details>
<summary>extracted/5714025/figures/ours1.png Details</summary>
### Visual Description
## Logic Puzzle: Sequence Completion
### Overview
The image presents a visual logic puzzle consisting of two rows. The top row contains a sequence of five squares, each containing a geometric pattern. The bottom row contains five options, labeled A through E, which are potential candidates to continue the sequence established in the top row.
### Components/Axes
* **Top Row:** A sequence of five squares (1 through 5, from left to right).
* **Bottom Row:** Five distinct options labeled **A**, **B**, **C**, **D**, and **E**.
* **Geometric Elements:**
* **Lines:** Each square contains either a diagonal line (running from top-left to bottom-right) or a vertical line (bisecting the square into two equal rectangles).
* **Black Squares:** Each square contains a single solid black square positioned in one of the four corners (top-left, top-right, bottom-left, or bottom-right).
### Detailed Analysis
#### Top Row (The Sequence)
1. **Square 1:** Diagonal line; black square in the **bottom-right** corner.
2. **Square 2:** Vertical line; black square in the **bottom-left** corner.
3. **Square 3:** Diagonal line; black square in the **top-left** corner.
4. **Square 4:** Vertical line; black square in the **top-right** corner.
5. **Square 5:** Diagonal line; black square in the **bottom-right** corner.
#### Bottom Row (The Options)
* **Option A:** Vertical line; black square in the **top-left** corner.
* **Option B:** Diagonal line; black square in the **top-right** corner.
* **Option C:** Diagonal line; black square in the **bottom-left** corner.
* **Option D:** Vertical line; black square in the **top-right** corner.
* **Option E:** Vertical line; black square in the **bottom-left** corner.
### Key Observations
There are two distinct patterns operating simultaneously within the sequence:
1. **Line Pattern:** The line type alternates between a diagonal line and a vertical line.
* Sequence: Diagonal -> Vertical -> Diagonal -> Vertical -> Diagonal.
* **Prediction:** The next item must contain a **vertical line**.
2. **Black Square Position Pattern:** The black square moves in a counter-clockwise direction around the corners of the square.
* Sequence: Bottom-Right -> Bottom-Left -> Top-Left -> Top-Right -> Bottom-Right.
* **Prediction:** Following the counter-clockwise rotation, the next position after Bottom-Right is **Bottom-Left**.
### Interpretation
The data demonstrates a predictable, cyclical logic puzzle. By isolating the two variables (line type and square position), we can determine the next logical step in the sequence.
* **Line Logic:** The sequence requires a vertical line. This eliminates options B and C.
* **Position Logic:** The sequence requires the black square to be in the bottom-left corner.
* **Conclusion:** Comparing the remaining options (A, D, E) against the requirements (Vertical line + Bottom-Left square), **Option E** is the correct continuation of the sequence.
</details>
| Q: Which of the boxes comes next? A: E Reasoning Skill: Inductive Capability: Diagram |
<details>
<summary>extracted/5714025/figures/vqav2.jpg Details</summary>

### Visual Description
## Photograph: Tennis Action Shot
### Overview
This is a high-resolution, full-color action photograph capturing a young female tennis player in the middle of a forehand stroke on a hard-surface tennis court. The image is taken from a side-on perspective, emphasizing the player's athletic motion and the mechanics of the tennis swing. The background consists of a chain-link fence, suggesting an outdoor training or match environment.
### Components/Axes
* **Subject:** A young female tennis player.
* **Apparel:**
* **Headwear:** A white visor with the brand name "adidas" printed in black on the front center.
* **Top:** A red short-sleeved t-shirt featuring a circular logo on the chest.
* **Bottom:** A white tennis skirt.
* **Footwear:** White athletic tennis shoes.
* **Equipment:**
* **Racket:** A tennis racket with a blue, black, and white frame, held in the player's right hand.
* **Ball:** A standard yellow tennis ball, captured in mid-air to the left of the player.
* **Environment:**
* **Surface:** A green hard court with white boundary lines visible in the foreground.
* **Background:** A green chain-link fence spanning the entire width of the background.
### Detailed Analysis
* **Textual Information:**
* **Visor:** The text "adidas" is clearly visible on the front of the white visor.
* **Shirt Logo:** Located on the center of the chest is a circular logo. The logo contains a stylized graphic of a tennis ball and a tennis racket. The word "Tennis" is printed in a curved font along the bottom arc of the circle.
* **Spatial Positioning:**
* **Player:** The player is positioned in the right-center of the frame, captured in a dynamic, airborne state.
* **Ball:** The tennis ball is positioned in the left-center of the frame, approximately 1.5 to 2 feet away from the racket head, indicating the follow-through phase of the stroke.
* **Shadows:** A distinct shadow is cast on the court surface directly beneath the player, indicating a light source coming from above and slightly behind the player (consistent with daylight).
### Key Observations
* **Motion:** The player is captured in a "jump" or "split-step" follow-through, with both feet off the ground. This indicates a high-intensity, aggressive forehand swing.
* **Focus:** The camera focus is sharp on the player and the ball, while the background fence is slightly blurred, creating a shallow depth of field that isolates the subject.
* **Lighting:** The lighting is bright and direct, typical of a sunny day, which creates high contrast between the red shirt and the green court surface.
### Interpretation
This image serves as a documentation of athletic technique. The body positioning—specifically the rotation of the torso and the extension of the arm—demonstrates a textbook forehand follow-through. The presence of the "adidas" branding and the specific club or team logo on the shirt suggests this is likely a competitive or organized training setting rather than casual play. The capture of the ball in mid-air, combined with the player's airborne posture, emphasizes the kinetic energy and physical exertion required in competitive tennis. The image effectively freezes a moment of high-speed movement, allowing for the analysis of the player's form and equipment usage.
</details>
| Q: Is the girl touching the ground? A: No Reasoning Skill: None Capability: Recognition |
| --- | --- | --- | --- |
|
<details>
<summary>extracted/5714025/figures/ours2.png Details</summary>
### Visual Description
## Diagram: 3D Isometric Projection and 2D Planar Views
### Overview
The image presents a spatial reasoning puzzle. The top section displays a 3D isometric view of a composite block structure. The bottom section presents four 2D options (labeled A, B, C, and D), which are potential top-down (plan) views of the 3D object. The objective is to identify the correct 2D projection.
### Components/Axes
* **Top Section (3D Object):** A composite block structure based on a 2x2 grid.
* **Raised Component:** A smaller square block is positioned on the top-right quadrant of the base.
* **Cutout Component:** A square section is removed from the bottom-left quadrant of the base.
* **Base:** The remaining structure consists of the top-left and bottom-right quadrants, which are at the base level.
* **Bottom Section (Options):** Four 2D diagrams representing potential top-down views.
* **A:** A square divided into a grid with unequal rectangular sections.
* **B:** A square with a square cutout in the bottom-left corner.
* **C:** A square with a rectangular cutout in the bottom-left corner.
* **D:** A square divided into four equal quadrants.
### Detailed Analysis
* **3D Object Analysis:**
* The object is constructed from a 2x2 grid of squares.
</details>
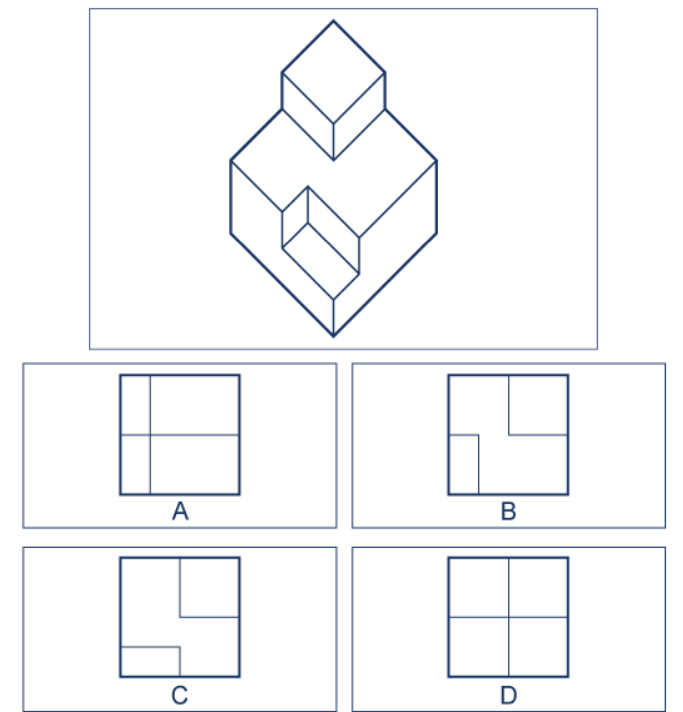
| Q: Which of these are the top view? A: B Reasoning Skill: Spatial Capability: 3D Shape |
<details>
<summary>extracted/5714025/figures/textvqa.jpg Details</summary>

### Visual Description
## [Display/Signage]: Digital Transit Information Board
### Overview
The image depicts a digital, dot-matrix style information display board, commonly found on public transportation vehicles such as trains or buses. The display uses high-contrast, yellow-green pixelated text against a black background to convey route status information to passengers. The display is organized into three distinct rows, each indicating a specific phase of the journey.
### Components/Axes
The display is structured as a vertical list of three data pairs. Each pair consists of a static label (in a smaller, standard font) and a dynamic value (in a larger, dot-matrix font).
* **Language:** English.
* **Layout:**
* **Top Section:** Origin information.
* **Middle Section:** Immediate next stop information.
* **Bottom Section:** Final destination information.
### Detailed Analysis
The display is segmented into three horizontal regions. The text is rendered in a bright yellow-green color.
**1. Top Region (Origin)**
* **Label:** "ORIGIN:" (positioned at the top-left).
* **Value:** "WASHINGTON" (positioned directly below the label).
**2. Middle Region (Next Stop)**
* **Label:** "NEXT STOP:" (positioned in the center-left).
* **Value:** "BWI AIRPORT" (positioned directly below the label).
**3. Bottom Region (Destination)**
* **Label:** "DESTINATION:" (positioned at the bottom-left).
* **Value:** "NEW YORK" (positioned directly below the label).
### Key Observations
* **Typography:** The values ("WASHINGTON", "BWI AIRPORT", "NEW YORK") are rendered in a blocky, pixelated font characteristic of LED or Vacuum Fluorescent Display (VFD) technology.
* **Contrast:** The high-contrast yellow-green text against the black background ensures high legibility in various lighting conditions.
* **Formatting:** The labels are left-aligned, and the values are also left-aligned, creating a clean, vertical column structure.
### Interpretation
* **Context:** This display is providing real-time transit status. Based on the locations provided (Washington, BWI Airport, New York), this is almost certainly a display inside an Amtrak train or a similar intercity rail service operating along the Northeast Corridor in the United States.
* **Route Logic:** The data indicates the current state of the vehicle's journey:
* The vehicle originated in **Washington** (likely Washington Union Station).
* The vehicle is currently en route to, or approaching, **BWI Airport** (Baltimore/Washington International Thurgood Marshall Airport).
* The final destination of the service is **New York** (likely New York Penn Station).
* **Utility:** This information is critical for passengers to confirm they are on the correct train and to prepare for their upcoming stop or arrival at their final destination. The separation of "Next Stop" and "Destination" helps passengers distinguish between an intermediate stop and the end of the line.
</details>
| Q: What is the final destination? A: New York Reasoning Skill: None Capability: OCR |
|
<details>
<summary>extracted/5714025/figures/ours3.png Details</summary>
### Visual Description
## Physics Diagram: Lever Torque Balance Problem
### Overview
The image displays a static physics diagram representing a lever system balanced on a central fulcrum. The diagram illustrates a classic torque problem where two known weights on the left side of the fulcrum must be balanced by a single unknown weight on the right side.
### Components/Axes
* **Fulcrum:** An orange triangle located at the center, serving as the pivot point for the lever.
* **Lever:** A horizontal black bar resting on the fulcrum.
* **Left Side Weights:**
* **Weight 1:** A blue trapezoidal weight labeled "20 lb". It is positioned at a distance of 6 ft from the fulcrum.
* **Weight 2:** A blue trapezoidal weight labeled "30 lb". It is positioned at a distance of 3 ft from the fulcrum.
* **Right Side Weight:**
* **Weight 3:** A blue trapezoidal weight labeled with a question mark "?". It is positioned at a distance of 6 ft from the fulcrum.
* **Dimension Lines:**
* **Top-left:** A double-headed arrow spanning from the 20 lb weight to the vertical dotted line above the fulcrum, labeled "6 ft".
* **Top-middle-left:** A double-headed arrow spanning from the 30 lb weight to the vertical dotted line above the fulcrum, labeled "3 ft".
* **Top-right:** A double-headed arrow spanning from the vertical dotted line above the fulcrum to the unknown weight, labeled "6 ft".
### Detailed Analysis
To determine the value of the unknown weight, we must calculate the torque (moment) on both sides of the fulcrum. The system is assumed to be in static equilibrium (balanced).
**1. Left Side Torque Calculation:**
* **Torque 1 (20 lb weight):** Force × Distance = 20 lb × 6 ft = **120 lb-ft**
* **Torque 2 (30 lb weight):** Force × Distance = 30 lb × 3 ft = **90 lb-ft**
* **Total Left Torque:** 120 lb-ft + 90 lb-ft = **210 lb-ft**
**2. Right Side Torque Calculation:**
* **Torque 3 (Unknown weight):** Force × Distance = ? lb × 6 ft = **6? lb-ft**
**3. Solving for the Unknown:**
* Since the lever is balanced, Left Torque = Right Torque.
* 210 lb-ft = 6? lb-ft
* ? = 210 / 6
* **? = 35 lb**
### Key Observations
* **Symmetry:** The distance of the outermost weight on the left (6 ft) matches the distance of the unknown weight on the right (6 ft).
* **Weight Distribution:** The left side contains two weights, while the right side contains only one.
* **Torque Contribution:** The 20 lb weight contributes more to the total torque on the left side (120 lb-ft) than the 30 lb weight (90 lb-ft), despite the 30 lb weight being heavier, because the 20 lb weight is placed further from the fulcrum.
### Interpretation
This diagram demonstrates the principle of moments (torque). It illustrates that the rotational force exerted on a lever is the product of the force applied and the perpendicular distance from the pivot point.
The data demonstrates that to balance the combined torque of 210 lb-ft generated by the two weights on the left, the single weight on the right must exert an equal amount of torque. Because the unknown weight is placed at a distance of 6 ft, it must weigh 35 lb to achieve equilibrium. This highlights how distance from the fulcrum acts as a multiplier for force; a lighter weight further away can balance a heavier weight closer to the pivot.
</details>
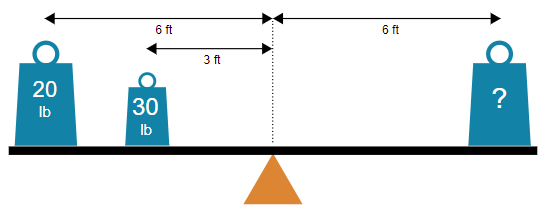
| Q: What is the weight if balanced? A: C: 35 lb Reasoning Skill: Mechanical Capability: Physics |
<details>
<summary>extracted/5714025/figures/mmvet1.png Details</summary>

### Visual Description
## Photograph: Students Writing Math Problems on Chalkboard
### Overview
This image is a medium-shot photograph depicting three children, viewed from behind, standing in a row before a large, green chalkboard. Each child is actively writing a mathematical equation on the board using white chalk. The children are dressed in identical school uniforms, suggesting a formal educational setting.
### Components/Axes
As this is a photograph rather than a chart or diagram, there are no numerical axes or legends. The "components" are the three students and the text written on the chalkboard.
* **Spatial Layout:** The students are positioned horizontally across the frame.
* **Left:** A female student with a ponytail.
* **Center:** A female student with hair clips.
* **Right:** A male student with short hair.
* **Textual Content:** Three distinct mathematical expressions are written in white chalk, corresponding to the position of each student.
### Detailed Analysis
The textual information on the chalkboard is transcribed below, mapped to the student writing it (from left to right):
1. **Left Region:**
* **Text:** "3 x 3 ="
* **Position:** Written at approximately eye level for the student on the left.
* **Context:** The student is a girl with a ponytail secured by a red hair tie. She is holding a piece of chalk in her right hand.
2. **Center Region:**
* **Text:** "7 x 2 ="
* **Position:** Written at approximately eye level for the student in the center.
* **Context:** The student is a girl with hair pulled back using clips. She is holding a piece of chalk in her right hand.
3. **Right Region:**
* **Text:** "11 - 2 ="
* **Position:** Written at approximately eye level for the student on the right.
* **Context:** The student is a boy with short, dark hair. He is holding a piece of chalk in his right hand.
### Key Observations
* **Uniformity:** All three students are wearing identical uniforms consisting of a dark-colored vest with red trim over a light-colored, long-sleeved shirt.
* **Action:** All three students have their right arms raised, actively writing on the board.
* **Incompleteness:** None of the mathematical equations have been solved; the "answer" portion of each equation is left blank after the equals sign.
* **Composition:** The image is staged to show a balanced, symmetrical view of students engaged in classroom work.
### Interpretation
This image serves as a symbolic representation of primary education. The deliberate staging—uniforms, identical posture, and the act of writing—emphasizes the process of learning and academic discipline rather than the specific mathematical content.
The fact that the equations are incomplete ("3 x 3 =", "7 x 2 =", "11 - 2 =") suggests that the focus of the image is on the *activity* of solving problems rather than the results. It portrays a controlled, orderly environment where students are expected to participate in the learning process. The composition, with the students facing away from the viewer, directs the viewer's attention entirely to the chalkboard and the task at hand, reinforcing the theme of academic focus.
</details>
| Q: What will girl on right write? A: 14 Reasoning Skill: Numerical Capability: OCR |
Figure 1: Capabilities and reasoning skills of various existing benchmarks. Traditional benchmarks seldom assess reasoning skills, whereas LogicVista emphasizes the fundamental capacities necessary for solving specific problems, going beyond simple recognition or math tasks.
We argue that a universal comprehensive evaluation benchmark should have the following characteristics: (1) cover a wide range of logical reasoning tasks, including deductive, inductive, numeric, spatial, and mechanical reasoning; (2) present information in both graphical and Optical Character Recognition (OCR) formats to accommodate different types of data inputs; and (3) facilitate convenient quantitative analysis for rigorous assessment and comparison of model performance.
To this end, we present a comprehensive MLLM evaluation benchmark, named LogicVista, which meets all these criteria:
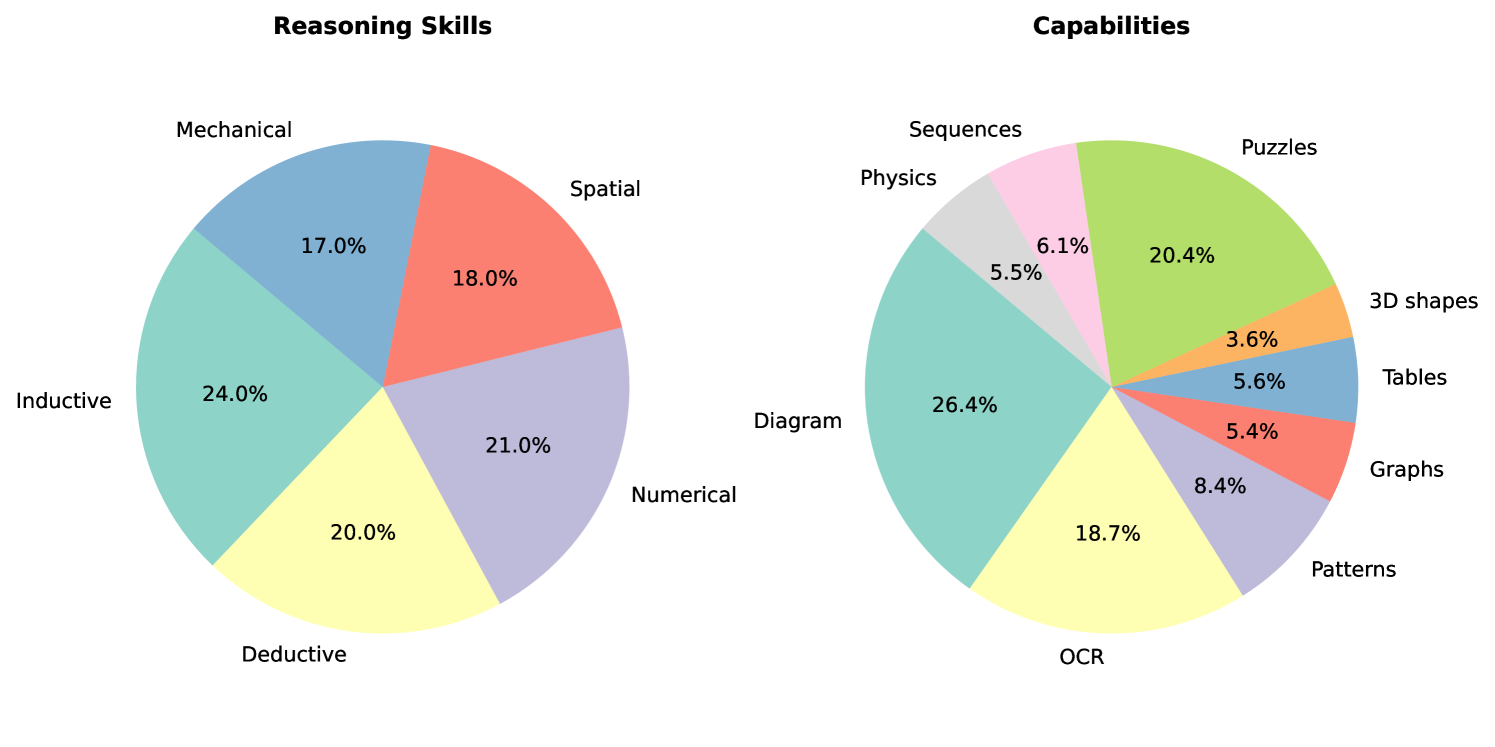
- LogicVista covers 5 representative categories of logical reasoning tasks: inductive ( $sample=107$ ), deductive ( $sample=93$ ), numerical ( $sample=95$ ), spatial ( $sample=79$ ), and mechanical ( $sample=74$ ).
- LogicVista includes a variety of capabilities, ranging from diagrams ( $sample=330$ ), OCR, ( $sample=234$ ), patterns ( $sample=105$ ), graphs ( $sample=67$ ), tables ( $sample=70$ ), 3D shapes ( $samples=45$ ), puzzles ( $samples=256$ ), sequences ( $samples=76$ ), and physics ( $samples=69$ ).
- All images, instructions, solution, and reasoning are manually annotated and validated.
- With our instruction design “please select from A, B, C, D, and E." and our LLM answer evaluator, we can assess different reasoning skills and capabilities and easily perform quantitative statistical analysis based on the natural language output of MLLMs. Additionally, We provide more in-depth human-written explanations for why each answer is correct, allowing for thorough open-ended evaluation.
As shown in Figure. 1, LogicVista covers a wide range of reasoning capabilities and evaluates them comprehensively. For instance, answering the question “Which of these images is the top view of the given object" in Figure 1 (b) requires not only recognizing the objects’ orientation but also the ability to spatially reason over the object from a different perspective. Since these questions and diagrams are presented without context, they effectively probe the MLLM’s underlying ability rather than relying on contextual cues from the surrounding real-life environment.
Furthermore, we provide two evaluation strategies with our annotations: multiple-choice question (MCQ) evaluation and open-ended evaluation. Our annotation of MCQ choices along with our LLM evaluator allows quick evaluations of answers provided by MLLMs. Additionally, our annotation of the reasoning and thought process behind each MCQ enables open-ended evaluation, capturing the nuances of the MLLM responses and identifying which reasoning steps were correct or incorrect.
We comprehensively evaluate the performance of 8 representative open and closed source MLLMs on 448 tasks across 5 main logical reasoning categories. LogicVista’s evaluation strategy allows users to see a detailed breakdown of an MLLM’s performance on each reasoning skill and capability. This approach provides more insights than a single overall score, enabling users to better understand the specific skills in which a model excels or needs improvement.
## 2 Related Works
| | VQAv2 [8, 15] | COCO [16] | TextCaps [17] | Contextual [18] | MM-vet [10] | MathVista [14] | VisIT-Bench [19] | LogicVista |
| --- | --- | --- | --- | --- | --- | --- | --- | --- |
| Number of Logical Reasoning Skills Tested | 0 | 0 | 1 | 1 | 1 | 2 | 1 | 5 |
| Number of Multimodal Capabilities Tested | 1 | 1 | 2 | 2 | 6 | 12 | 2 | 9 |
| Dataset Size | 204,721 | 330,000 | 28,000 | 506 | 217 | 6,141 | 592 | 448 |
| Scene and Object Recognition | ✓ | ✓ | ✓ | ✓ | ✓ | ✓ | ✓ | ✓ |
| Inductive Reasoning | ✗ | ✗ | ✗ | ✗ | ✗ | ✓ | ✗ | ✓ |
| Deductive Reasoning | ✗ | ✗ | ✗ | ✗ | ✗ | ✗ | ✗ | ✓ |
| Numerical Reasoning | ✗ | ✗ | ✓ | ✓ | ✓ | ✓ | ✓ | ✓ |
| Spatial Reasoning | ✗ | ✗ | ✗ | ✗ | ✗ | ✗ | ✗ | ✓ |
| Mechanical Reasoning | ✗ | ✗ | ✗ | ✗ | ✗ | ✗ | ✗ | ✓ |
| Answer Choice Explanations | ✗ | ✗ | ✗ | ✗ | ✗ | ✓ | ✗ | ✓ |
| Human Annotation | ✓ | ✓ | ✓ | ✓ | ✓ | ✓ | ✓ | ✓ |
| Human Evaluation | ✗ | ✓ | ✓ | ✓ | ✗ | ✓ | ✓ | ✗ |
| Auto/GPT-4 Evaluation | ✓ | ✓ | ✓ | ✓ | ✓ | ✓ | ✓ | ✓ |
| Open-ended Evaluation | ✗ | ✓ | ✓ | ✓ | ✓ | ✓ | ✓ | ✓ |
Table 1: Comparision with related vision-language benchmarks.
Multimodal Language Models The field of vision-language models [20, 21, 22, 23, 24, 25, 26, 27, 28, 29] has made significant progress towards achieving a cohesive understanding and generation of both visual and linguistic information. This progress is largely driven by the remarkable generalization and quality capabilities of recent large language models (LLMs) [30, 1, 31, 32]. As a result, there has been a surge in the development of MLLMs that aim to integrate the diverse capabilities of vision and language for complex multimodal tasks.
Efforts to create these multimodal generalist systems include enhancing LLMs with multi-sensory processing abilities, as demonstrated by innovative projects like Frozen [33], Flamingo [2], PaLM-E [34], and GPT-4 [1]. Recent releases of open-source LLMs [35, 32, 36] have further propelled research in this field, leading to the development of OpenFlamingo [37], LLaVA [38], MiniGPT-4 [4], Otter [39], InstructBLIP [40], among others [41, 38, 42]. Additionally, multimodal agents [43, 44, 45] have been explored for their ability to link various vision tools with LLMs [30, 1], aiming to enhance integrated vision-language capabilities
Vision-Language Benchmarks Traditional vision-language benchmarks have focused on assessing specific capabilities, including visual recognition [21], generating image descriptions [20, 46], and other specialized functions such as understanding scene text [47, 17, 48], commonsense reasoning [49], mathematical reasoning [14], instruction following [19], and external knowledge incorporation [50]. While some benchmarks incorporate reasoning [18], they are often presented in real-life contexts, which may reduce the task to mere recognition based on contextual cues.
The emergence of general MLLMs has highlighted the need for updated vision-language benchmarks that encompass complex multimodal tasks requiring comprehensive vision-language skills. Our benchmark, LogicVista, aligns closely with recent evaluation studies like MM-Vet and MMBench [10, 51], which aim to provide thorough evaluations of MLLMs through well-designed evaluation samples. A key distinction of LogicVista lies in its focus on integrated vision-language capabilities, offering deeper insights beyond mere model rankings.
LLM-Based Evaluation. LogicVista adopts an open-ended LLM-based evaluation approach, which facilitates the generation and assessment of diverse answer styles and question types beyond the limitations of binary or multiple-choice responses. This innovative method leverages the capabilities of large language models (LLMs) for comprehensive model evaluation, a technique that has been effectively applied in natural language processing (NLP) tasks [52, 53, 54, 55]. Our findings indicate that this LLM-based evaluation framework is not only versatile but also robust, enabling a unified and flexible assessment across various modalities. By accommodating a wide range of answer styles and question types, this approach enhances evaluation depth and breadth, which contributes to a more thorough understanding of model performance.
## 3 Data annotation and organization
<details>
<summary>x1.png Details</summary>
### Visual Description
## Conceptual Diagram: Inputs to Closed-Source Testing
### Overview
The image is a conceptual diagram illustrating the dependencies and inputs required to conduct "Closed-Source Tests." It utilizes a bottom-up flow, where three distinct resource categories (communication, capital, and human resources) converge to support a restricted, proprietary testing environment.
### Components/Axes
* **Header (Top):** A rectangular container labeled "Closed-Source Tests." Inside are six clipboard icons, each featuring a small grid or chart graphic.
* **Central Hub (Middle):** A blue, closed padlock icon. This acts as a central node, connected to the "Closed-Source Tests" box above via radiating lines, symbolizing security, restriction, or proprietary control.
* **Inputs (Bottom):** Three distinct icons arranged horizontally, representing the resources feeding into the central hub:
* **Left:** An envelope icon with an "@" symbol.
* **Center:** A stack of gold coins and a green dollar bill.
* **Right:** An icon depicting two human figures with a "+" sign.
* **Flow:** A central arrow points upward from the bottom inputs toward the padlock, indicating that these three elements are the drivers or requirements for the testing process.
### Detailed Analysis
* **Closed-Source Tests (Top):** The box contains six identical clipboard icons. The presence of these icons suggests a structured, perhaps bureaucratic, testing phase. The "Closed-Source" label implies that the methodology, results, or the software itself is proprietary and not accessible to the public.
* **The Padlock (Center):** The blue padlock is the focal point of the diagram. It serves as a gatekeeper. The radiating lines connecting it to the clipboard box suggest that the testing process is "locked" or protected.
* **Input Icons (Bottom):**
* **Communication/Outreach (Left):** The envelope with the "@" symbol represents the need for communication, email outreach, or perhaps user feedback loops within a closed environment.
* **Financial Capital (Center):** The stack of coins and dollar bill represents the necessity of funding, budget, or financial investment to sustain the testing process.
* **Human Resources (Right):** The two figures with a "+" sign represent the need for team expansion, hiring, or the involvement of specific personnel to conduct the tests.
### Key Observations
* **Resource Dependency:** The diagram explicitly links the "Closed-Source" nature of the tests to three specific, tangible inputs: communication, money, and people.
* **Centralization:** The padlock acts as the central point of convergence, emphasizing that the testing process is a controlled, restricted activity.
* **Symmetry:** The three bottom icons are presented with equal visual weight, suggesting that these three pillars are equally critical to the operation of the closed-source testing model.
### Interpretation
This diagram serves as a critique or a structural breakdown of the closed-source development model. It suggests that proprietary testing is not an organic or decentralized process; rather, it is a resource-intensive operation that requires specific, traditional corporate inputs.
By placing the "Closed-Source Tests" behind a padlock, the diagram implies a "black box" approach. The inputs (money, people, communication) are consumed by the process, but the output or the internal workings of the tests remain restricted. This contrasts with open-source models, which typically rely on community contribution rather than the specific combination of capital and hiring depicted here. The diagram effectively communicates that closed-source testing is a gated, managed, and funded endeavor.
</details>
(a)
<details>
<summary>x2.png Details</summary>
### Visual Description
## Diagram: Manual Curation Workflow
### Overview
The image is a process flow diagram illustrating a "Manual Curation" pipeline. It depicts human annotators processing data through a secure environment to generate a structured, annotated dataset and corresponding JSON metadata.
### Components/Flow
The diagram is organized from left to right, representing the progression of data:
* **Left Region (Input):** A vertical stack of three human icons, with an ellipsis below, indicating a larger group of human annotators.
* **Center Region (Processing):** A square box containing six clipboard icons (representing tasks or data items). At the bottom of this box is a blue padlock icon with branching nodes, signifying a secure or private processing environment.
* **Right Region (Output):**
* **Top-Right:** A vertical rectangle containing two image icons with an ellipsis below, labeled "annotated dataset".
* **Bottom-Right:** A document icon labeled "JSON".
* **Flow Indicators:** Dashed arrows indicate the movement of data from the human annotators into the secure processing box, and then branching out to the two output formats (the dataset and the JSON file).
### Detailed Analysis
* **Textual Content:**
* "annotated dataset": Located above the image stack on the right.
* "JSON": Located below the document icon on the right.
* "Manual Curation of images, answers, and reasoning": Located at the bottom center, serving as the caption for the entire process.
* **Visual Symbols:**
* **Human Icons:** Represent the human-in-the-loop (HITL) aspect of the workflow.
* **Clipboard Icons:** Represent the individual data points or tasks being curated.
* **Padlock Icon:** A blue lock with nodes extending from it, suggesting that the curation process is encrypted, secure, or involves privacy-preserving measures.
* **Image Icons:** Represent the visual component of the dataset.
* **Document Icon:** Represents the structured text/metadata component of the dataset.
### Key Observations
* **Bifurcated Output:** The process clearly separates the visual data (images) from the structured data (JSON). This is a standard architecture for multimodal machine learning tasks, such as Visual Question Answering (VQA), where an image is paired with text-based reasoning or answers.
* **Security Emphasis:** The prominent placement of the padlock icon within the processing block suggests that the security of the curation environment is a critical feature of this workflow.
* **Scalability:** The use of ellipses under the human icons and the image icons suggests that the system is designed to handle large-scale datasets.
### Interpretation
This diagram outlines a secure, human-in-the-loop data preparation pipeline. The "Manual Curation" caption indicates that the quality of the data relies on human intelligence rather than automated labeling.
The inclusion of both an "annotated dataset" (images) and a "JSON" file suggests that the output is intended for training AI models that require paired visual and textual information. The "reasoning" mentioned in the caption implies that the JSON file likely contains not just simple labels, but complex explanations or chain-of-thought data associated with the images. The padlock icon suggests this pipeline is likely used for sensitive data, such as medical imaging, private user content, or proprietary corporate data, where data privacy and secure handling are paramount during the annotation phase.
</details>
(b)
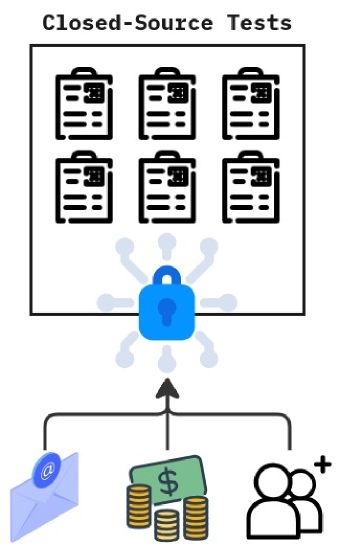
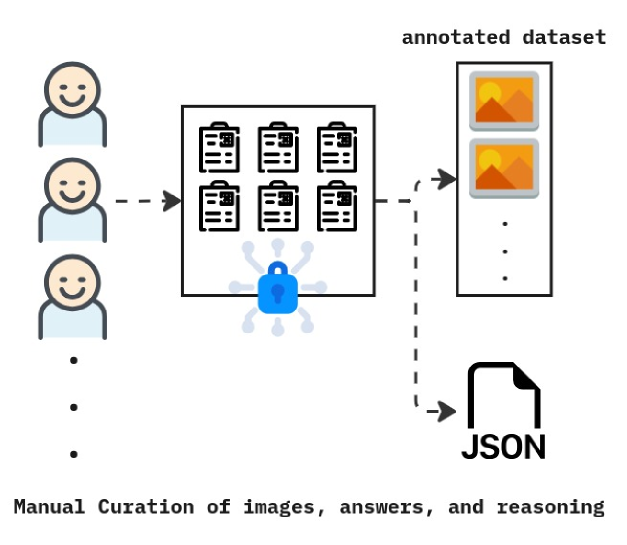
Figure 2: a) Data collected for LogicVista were gathered from closed sources to avoid data leakage. b) Manual annotators used the gathered tests, gathered the correct answers, and came up with reasonings on why the selected answers were correct. All these annotations were then stored in JSON format.
### 3.1 Data Sources
To ensure the integrity and quality of LogicVista’s evaluations, we have implemented a stringent data collection and curation process specifically designed to prevent data leakage detailed in Figure. 2. Our approach involves sourcing and annotating our samples from proprietary sources that require licenses, registration, payment, or a combination of these barriers to access. This methodology is critical to minimizing the risk that our benchmark data has been previously seen or utilized in the training of other multi-modal models. We prioritized sourcing data from closed sources to further reduce the potential of data leakage.
- Licensed Access: We obtain data from sources that require formal licensing, ensuring the data is used solely for research purposes and not freely available for general use or scraping on the internet.
- Registration Requirements: Some of our data sources mandate user registration and account verification, adding an additional layer of access control to ensure that the data remain restricted and not easily accessible.
- Paid Content: We utilize paid sources where content is accessible only through purchase or subscription, further restricting the data from being freely available on the internet.
Additionally, we obtained permission from the creators of IQ tests and other evaluation materials included in our dataset. This permission specifically allows the use of their content for research purposes, ensuring the data’s legitimacy and accuracy.
### 3.2 Annotation and Data Collection
LogicVista consists of images designed to assess the underlying reasoning capacities of MLLMs. Using real-life scenes as explicit tests of logical reasoning can be challenging, as they often contain context clues that AI agent can use to deduce answers without directly reasoning through the scene. Therefore, LogicVista presents multiple-choice questions across 9 explicit capabilities that specify the type of reasoning required, without the additional context of real-life scenes typically found in intelligence and reasoning tests. The dataset is manually collected and annotated from various licensed intelligence test sources. Over a period of 3 months, 5 annotators extracted images, correct answers, and explanations when available. The explanations detailing the reasoning behind answer choices were extensively annotated and cross-validated among annotators, ensuring data integrity through multiple rounds of quality checks. The data is structured in JSON format to facilitate easy retrieval and processing in our evaluation pipeline. For our evaluation, we focused on summarizing five reasoning skills spanning two multimodal capabilities. For detailed examples of these reasoning skills and capabilities, please refer to Appendix. A and Appendix. B.
<details>
<summary>x3.png Details</summary>
### Visual Description
## Pie Charts: Reasoning Skills and Capabilities
### Overview
This image displays two side-by-side pie charts representing data distributions. The left chart is titled "Reasoning Skills" and contains five categories. The right chart is titled "Capabilities" and contains nine categories. Both charts use percentage values to indicate the proportion of each category relative to the whole.
### Components/Axes
* **Left Chart (Reasoning Skills):** A circular chart divided into five distinct slices, each labeled with a category name and a percentage value.
* **Right Chart (Capabilities):** A circular chart divided into nine distinct slices, each labeled with a category name and a percentage value.
* **Legend:** There is no separate legend; labels are placed directly adjacent to their corresponding slices.
### Detailed Analysis
#### Left Chart: Reasoning Skills
The chart is divided into five segments. Moving clockwise starting from the top:
1. **Mechanical:** 17.0% (Blue slice, top-left quadrant)
2. **Spatial:** 18.0% (Red-orange slice, top-right quadrant)
3. **Numerical:** 21.0% (Purple slice, bottom-right quadrant)
4. **Deductive:** 20.0% (Yellow slice, bottom-center)
5. **Inductive:** 24.0% (Teal slice, left-center)
*Trend Verification:* The distribution is relatively balanced, with "Inductive" being the largest segment (24.0%) and "Mechanical" being the smallest (17.0%). The difference between the largest and smallest segment is 7.0 percentage points.
#### Right Chart: Capabilities
The chart is divided into nine segments. Moving clockwise starting from the top:
1. **Puzzles:** 20.4% (Light green slice, top-right)
2. **3D shapes:** 3.6% (Orange slice, right-center)
3. **Tables:** 5.6% (Blue slice, right-center)
4. **Graphs:** 5.4% (Red-orange slice, right-center)
5. **Patterns:** 8.4% (Purple slice, bottom-right)
6. **OCR:** 18.7% (Yellow slice, bottom-center)
7. **Diagram:** 26.4% (Teal slice, left-center)
8. **Physics:** 5.5% (Grey slice, top-left)
9. **Sequences:** 6.1% (Pink slice, top-left)
*Trend Verification:* This chart shows a high variance in distribution. "Diagram" is the dominant category (26.4%), followed closely by "Puzzles" (20.4%) and "OCR" (18.7%). The remaining six categories are significantly smaller, ranging from 3.6% to 8.4%.
### Key Observations
* **Color Consistency:** There appears to be a deliberate color-coding scheme shared between the two charts. For example, the "Teal" slice represents the largest category in both charts ("Inductive" at 24.0% and "Diagram" at 26.4%). Similarly, the "Yellow" slice represents the second-largest category in both charts ("Deductive" at 20.0% and "OCR" at 18.7%).
* **Granularity:** The "Capabilities" chart is significantly more granular than the "Reasoning Skills" chart, suggesting that "Capabilities" may be a breakdown of specific task types, whereas "Reasoning Skills" represents broader cognitive domains.
* **Outliers:** In the "Capabilities" chart, "3D shapes" is the smallest category at 3.6%, which is roughly 7.3 times smaller than the largest category ("Diagram").
### Interpretation
The data likely represents the performance or task distribution of an Artificial Intelligence model across different benchmarks.
* **Cognitive Mapping:** The shared color scheme suggests a mapping between the "Reasoning Skills" and "Capabilities." For instance, the "Teal" category (Inductive/Diagram) and "Yellow" category (Deductive/OCR) are the most prominent in both charts, implying that the model is most heavily tested or most proficient in these areas.
* **Task Complexity:** The "Capabilities" chart suggests that the model handles a wide variety of specific input types (e.g., Tables, Graphs, Physics, Sequences), but the majority of its "capability" is concentrated in visual/spatial processing (Diagrams, Puzzles, OCR).
* **Peircean Investigative Note:** The grouping of "Diagram," "Puzzles," and "OCR" as the top three categories (totaling 65.5% of the "Capabilities" chart) indicates that this model is likely optimized for multimodal or visual-reasoning tasks rather than purely textual or mathematical ones. The "Reasoning Skills" chart acts as a high-level summary of the cognitive faculties required to perform the tasks detailed in the "Capabilities" chart.
</details>
Figure 3: Proportion of reasoning skills and capabilities. On the left is the proportion of questions belonging to each reasoning skill. These proportions add up to $100\$ as each skill is independent of another. On the right is the proportion of questions belonging to each multi-modal capability. These do not add up to $100\$ due to the use of mixed capabilities.
#### 3.2.1 Capabilities
We distinguish multimodal capabilities from reasoning skills, considering these capabilities fundamental to understanding a multimodal scene and extracting information. Capabilities refer to the modalities through which logical reasoning questions are delivered. To ensure comprehensive coverage in LogicVista, we have defined a diverse array of 9 capabilities for evaluation. This diversity guarantees that LogicVista thoroughly assess various logical situations that an MLLM may encounter in everyday reasoning. Figure 3 demonstrates how LogicVista contains a balanced mix of capabilities, including samples that utilize multiple capabilities to solve a problem.
- Diagrams: Simple flow diagrams and logical diagrams (e.g., Markov diagrams).
- OCR: Text embedded within an image (e.g., “gas station” in an image of a gas station).
- Patterns: Repeated sequences such as a series of diagrams, numbers, shapes, and objects (e.g., identifying patterns in how a box moves through repeated images of boxes).
- Graphs: Mathematical graphs with axes (e.g., graphs of $y=2x$ and $y=x^2$ ).
- Tables: Data tables (e.g., pie charts and T-tables).
- 3D Shapes: The ability to understand and differentiate 3D objects from 2D ones (e.g., recognizing a 3D shape in different rotations).
- Puzzles: Puzzles with logical implications embedded within the shapes (e.g., chess puzzles).
- Sequences: Sequences of related items or objects (e.g., predicting the next item in a sequence).
- Physics: Situations involving physics (e.g., diagrams of projectile motion).
#### 3.2.2 Reasoning Skills
The reasoning skills of interest for this benchmark are based on common critical thinking and problem-solving skills used by humans in various contexts. For our evaluation, we summarize these into the following five skills. For our evaluation, we summarize these to include the following 5 skills. As seen in Figure 3, LogicVista encompasses a wide range of all these reasoning skills:
- Inductive Reasoning: The ability to infer the next entry in a pattern given a set of observations. This involves making generalizations based on specific observations to form an educated guess. It moves from many specific observations to a generalization. For example, observing that John gets a stomach ache when he eats dairy products leads to the inductive conclusion that he is likely lactose intolerant.
- Deductive Reasoning: The ability to conclude a specific case from a general principle or pattern. This involves moving from the general to the specific. For example, from the statement “all men are mortal,” one can deduce that “John is mortal” because John is a man.
- Numerical Reasoning: The ability to read arithmetic problems in an image and solve the math equations. For example, given the equation “10 + 10 = ?,” the answer would be “20.”
- Spatial Reasoning: The ability to understand the spatial relationships between objects and patterns and reason with those relationships. For example, seeing an unfolded box and understanding what the box would look like when folded.
- Mechanical Reasoning: The ability to recognize a physical system and solve equations based on that system or answer questions about it. For example, seeing a set of three gears and understanding which gears will turn clockwise and which will turn counterclockwise.
### 3.3 LLM-based Multiple Choice Answer Extractor
<details>
<summary>x4.png Details</summary>
### Visual Description
## Diagram: Workflow for Automated Evaluation of Multimodal Models
### Overview
This diagram illustrates a multi-stage pipeline designed to evaluate the performance of various AI models (referred to as "evaluation models"). The process involves taking raw, open-ended text responses generated by these models based on an annotated dataset and converting them into structured, standardized Multiple Choice Question (MCQ) answers using a secondary extraction model (ChatGPT).
### Components/Axes
**1. Input/Source (Left Column)**
* **Evaluation Models:** Represented by a vertical stack of icons:
* A Llama icon (representing Llama models).
* A ChatGPT logo.
* A Volcano icon (representing LLaVA, a vision-language model).
* Ellipses (...) indicating additional models.
* **Label:** "evaluation models" (positioned at the bottom left).
**2. Data Source (Middle-Left)**
* **Annotated Dataset:** A vertical rectangle containing two image icons, representing the input data.
* **JSON File:** A document icon labeled "JSON" positioned below the annotated dataset.
* **Label:** "annotated dataset" (positioned above the dataset box).
**3. Processing Stage 1 (Center)**
* **Raw Outputs:** A large rounded rectangle containing examples of verbose, open-ended text responses:
* "The answer is 76 because..."
* "Tom would win the race..."
* "The pie chart shows..."
* "The next element in the sequence is..."
* "..."
* **Label:** "raw open-ended outputs" (positioned below the rectangle).
**4. Processing Stage 2 (Center-Right)**
* **Extraction Model:** A ChatGPT logo acting as the processor.
**5. Output Stage (Right)**
* **Extracted Answers:** A vertical rounded rectangle containing standardized categorical labels:
* "A"
* "B"
* "D"
* "E"
* "..."
* **Label:** "extracted MCQ answers" (positioned below the rectangle).
**6. Final Visualization (Far Right)**
* **Icons:** A checklist icon and a bar chart icon, representing the final evaluation metrics.
### Detailed Analysis
The workflow follows a specific logical sequence indicated by dashed arrows:
1. **Generation:** The "evaluation models" (Llama, ChatGPT, Volcano) process the "annotated dataset" (images + JSON metadata).
2. **Raw Output:** This interaction produces "raw open-ended outputs" (verbose text).
3. **Extraction:** The "raw open-ended outputs" are fed into a ChatGPT instance. Simultaneously, the "JSON" file provides structural context to this ChatGPT instance.
4. **Standardization:** ChatGPT parses the verbose text and the JSON data to produce "extracted MCQ answers" (A, B, D, E).
5. **Finalization:** These extracted answers are then converted into final evaluation formats, represented by the checklist and bar chart icons.
### Key Observations
* **Two-Step Evaluation:** The process explicitly separates the *generation* of answers (by the evaluation models) from the *extraction/grading* of answers (by ChatGPT).
* **Data Enrichment:** The JSON file is used as a secondary input to the extraction model, likely providing the ground truth or the specific question format required to map the raw text to an MCQ option.
* **Standardization:** The primary purpose of the pipeline is to transform unstructured, natural language responses into structured, quantifiable data (MCQs).
### Interpretation
This diagram depicts a common methodology in the evaluation of Large Multimodal Models (LMMs).
Because LMMs often produce verbose, conversational, or inconsistent text responses, it is difficult to automatically grade them against a standard answer key. This pipeline solves that problem by using a "grader" model (ChatGPT) to act as an intermediary. The grader reads the verbose output from the evaluation model and maps it to a specific, standardized choice (A, B, D, E).
This allows researchers to convert qualitative, open-ended model behavior into quantitative metrics (represented by the bar chart and checklist at the end), enabling objective performance comparisons between different models. The inclusion of the JSON file suggests that the extraction process is guided by metadata, ensuring the grader knows exactly what the "correct" answer format should be for any given input.
</details>
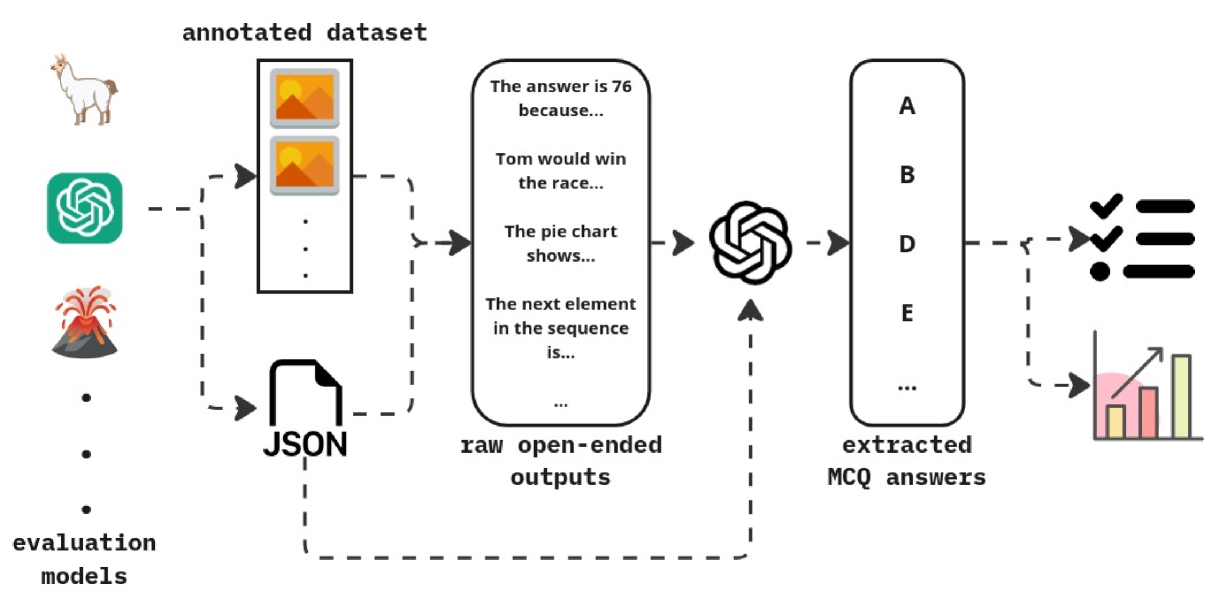
Figure 4: Pipeline of evaluating open-ended LMM outputs using MCQ answer choice extraction.
LLMs generate non-deterministic and open-ended responses [56, 57], making direct evaluation challenging. To address this, we use an LLM evaluator to compare these open-ended responses to our annotations as detailed in 4. This evaluator can assess both MCQ answer choices and the MLLM’s reasoning behind those selections, as both elements are included in our annotations. This step is achieved by feeding various contexts such as the question, and the available choices, along with the LLM-generated answers to an extraction LLM (GPT, LLaMA, etc.). Based on the provided rich context, the LLM can generate the selected letter answer choice. The final output is also repeatedly validated and if the validation fails, the extraction repeats with the provided feedback to obtain correct results.
## 4 Evaluation Setup
| Model | Size | Language Model | Vision Model |
| --- | --- | --- | --- |
| LLaVA-Vicuna-7B | 7B | Vicuna-7B | CLIP ViT-L/14 |
| LLaVA-Vicuna-13B | 13B | Vicuna-13B | CLIP ViT-L/336px |
| LLaVA-NeXT-Mistral-7B | 7B | Mistral-7B | CLIP ViT-L/14 |
| LLaVA-NeXT-Vicuna-7B | 7B | Vicuna-7B | CLIP ViT-L/14 |
| LLaVA-NeXT-Vicuna-13B | 13B | Vicuna-13B | CLIP ViT-L/336px |
| LLaVA-NeXT-Nous-Hermes-Yi-34B | 34B | Nous Hermes 2-Yi-34B | CLIP ViT-L/336px |
| MiniGPT-4-7B | 7B | Vicuna-7B | BLIP-2 Q-Former |
| MiniGPT-4-13B | 13B | Vicuna-13B | BLIP-2 Q-Former |
| Otter-9B | 9B | MPT-7B | CLIP ViT-L/14 |
| GPT-4 Vision | N/A N/A: Not disclosed | N/A | N/A |
| BLIP-2 | 2.7B | OPT-2.7B | EVA-ViT-G |
| Pix2Struct | 1.3B | ViT | ViT |
| InstructBLIP-Vicuna-7B | 7B | Vicuna-7B | BLIP-2 Q-Former |
| InstructBLIP-Vicuna-13B | 13B | Vicuna-13B | BLIP-2 Q-Former |
| InstructBLIP-FLAN-T5-xl | 3B | FLAN-T5 XL | BLIP-2 Q-Former |
| InstructBLIP-FLAN-T5-xxl | 11B | FLAN-T5 XXL | BLIP-2 Q-Former |
Table 2: Summary of the MLLMs used for evaluations in this study.
To evaluate the performance of MLLMs on LogicVista, we selected a range of representative models detailed in Table. 2. Specifically, we chose8 models for evaluation, including LLaVA [3, 58], MiniGPT4 [4], Otter [39], GPT-4 Vision [1], BLIP-2 [59], and InstructBLIP [40] We also included pix2struct [60] which has been fine-tuned to understand chart and diagram data.
Each model generated outputs using the LogicVista dataset. Our LLM-based multiple-choice extractor was then employed to isolate the multiple-choice selections from the MLLMs’ outputs (which often appear as full-sentence responses rather than single letters) and compare them to the ground truth answers. The overall logical reasoning score is calculated as follows:
$$
S=\frac{∑_n=1^Ns_i}{N}*100\ \tag{1}
$$
Here, $S$ represents the overall score, $s_i$ indicate whether a sample $i$ is evaluated as correct or not (regardless of category), and $N$ is the total number of samples. The score for each reasoning skill subcategory is calculated as:
$$
S_LR=\frac{∑_n=1^N_LRs_i}{N_LR}*100\ \tag{2}
$$
where $S_LR$ represents the score for a specific reasoning skill category, $N_LR$ is the total number of samples in that reasoning skill category, and $s_i$ indicate whether a sample $i$ from that category was evaluated as correct. Similarly, the score for each multi-modal capability is calculated as:
$$
S_c=\frac{∑_n=1^N_cs_i}{N_c}*100\ \tag{3}
$$
where $S_c$ represents the score for a specific capability, $N_c$ is the total number of samples in that capability, and $s_i$ indicates whether a sample $i$ in the capability category is evaluated correctly.
## 5 LogicVista Benchmarking and Performance Interpretation
### 5.1 Logical Reasoning Skills
We present the performance results of various multimodal LLMs on LogicVista. Table 3 outlines the outcome for these models across five logical reasoning categories. We analyzed models of different architectures and sizes, benchmarking them against a random baseline that assumes an average of five choices per question in the LogicVista dataset. Our findings indicate that many models perform below expectations, often yielding results that are worse than random guessing. This outcome is somewhat anticipated, given that most training data for multimodal LLMs and LLMs are derived from classical computer vision datasets such as COCO, which focus on recognition tasks rather than complex reasoning.
Traditional benchmarks typically emphasize recognition tasks, resulting in a lack of emphasis on reasoning tasks during both training and evaluation phases. This is evident from the observation that while many models excel on recognition-based benchmarks like COCO, TextVQA, and MM-vet, they often struggle to outperform a random baseline on logical reasoning tasks.
| Model | Inductive | Deductive | Numerical | Spatial | Mechanical |
| --- | --- | --- | --- | --- | --- |
| LLAVA7B | 29.91% | 29.03% | 26.32% | 25.32% | 36.49% |
| LLAVA13B | 18.69% | 31.18% | 20.00% | 27.85% | 24.32% |
| otter9B | 31.78% | 24.73% | 18.95% | 18.99% | 21.62% |
| GPT4 | 23.36% | 54.84% | 24.21% | 21.52% | 41.89% |
| BLIP2 | 17.76% | 23.66% | 23.16% | 24.05% | 18.92% |
| LLAVANEXT-7B-mistral | 16.82% | 34.41% | 23.16% | 21.52% | 22.97% |
| miniGPTvicuna7B | 10.28% | 9.68% | 7.37% | 3.80% | 27.03% |
| miniGPTvicuna13B | 13.08% | 23.66% | 10.53% | 10.13% | 17.57% |
| pix2struct | 12.15% | 6.45% | 2.11% | 7.59% | 17.57% |
| instructBLIP-vicuna-7B | 4.67% | 21.51% | 24.21% | 2.53% | 22.97% |
| instructBLIP-vicuna-13B | 3.74% | 10.75% | 18.95% | 5.06% | 17.57% |
| instructBLIP-flan-t5-xl | 23.36% | 22.58% | 22.11% | 7.59% | 33.78% |
| instructBLIP-flan-t5-xxl | 17.76% | 30.11% | 24.21% | 20.25% | 22.97% |
| LLAVANEXT-7B-vicuna | 26.17% | 21.51% | 25.26% | 27.85% | 29.73% |
| LLAVANEXT-13B-vicuna | 22.43% | 22.58% | 26.32% | 26.58% | 25.68% |
| LLAVANEXT-34B-NH | 20.56% | 52.69% | 30.53% | 24.05% | 40.54% |
Table 3: LogicVista evaluation results for various multimodal LLMs on each logical reasoning skill are presented as $\$ , with the highest possible accuracy being $100\$ . The highest-scoring models are highlighted in green and the lower-scoring models are highlighted in yellow.
Upon closer examination, we find that models perform best on deductive, numerical, and mechanical reasoning tasks. These types of reasoning are more prevalent in real-life scenarios, which makes models more adept at handling them. For example, deductive reasoning can be applied in predicting a character’s actions based on a scene, while numerical reasoning is crucial in solving arithmetic visual tasks. Mechanical reasoning involves understanding physical principles and interactions.
In contrast, induction and spatial reasoning are less frequently encountered in standard training data, potentially explaining the lower performance of models in these areas. These insights underscore the necessity for enhanced training and evaluation methodologies that prioritize reasoning tasks to bolster the logical reasoning capabilities of multimodal LLMs.
### 5.2 Visual Capabilities
In Table 4, we present the results of multimodal LLMs on logical reasoning tasks across diagrammatic and OCR mediums. Generally, we observe that OCR tasks tend to perform better than diagrammatic tasks. This difference stems from the nature of traditional computer vision tasks, which often prioritize recognizing prominent objects (“landmarks”) in a scene, such as distinct cars, planes, people, or balls. Diagrams, in contrast, lack such prominent features and mainly consist of lines and shapes, making it challenging for models to extract intricate relationships between objects.
In OCR tasks, once the text is accurately extracted from the image, the remainder of the reasoning task relies on the underlying LLM’s ability to process and interpret the content. This process typically bypasses the complexities of multimodal reasoning, leading to better performance on OCR tasks compared to diagrammatic tasks. These findings highlight the necessity for enhanced evaluation methodologies tailored to diagrammatic reasoning in multimodal LLMs, as current approaches may overlook critical details inherent in these types of tasks.
| Model | Diagram | OCR | Patterns | Graphs | Tables | 3D Shapes | Puzzles | Sequences | Physics |
| --- | --- | --- | --- | --- | --- | --- | --- | --- | --- |
| LLAVA7B | 29.70% | 28.21% | 30.47% | 25.37% | 25.71% | 22.22% | 28.52% | 25.00% | 43.48% |
| LLAVA13B | 21.52% | 22.65% | 16.19% | 16.42% | 20.00% | 31.11% | 26.17% | 15.79% | 26.09% |
| otter9B | 23.64% | 20.51% | 30.48% | 14.93% | 22.86% | 13.33% | 26.17% | 26.32% | 24.64% |
| GPT4 | 26.06% | 39.74% | 20.95% | 20.90% | 22.86% | 31.11% | 31.25% | 28.95% | 47.83% |
| BLIP2 | 20.30% | 21.79% | 20.00% | 17.91% | 24.29% | 17.78% | 22.27% | 15.79% | 20.29% |
| LLAVANEXT-7B-mistral | 20.30% | 26.92% | 21.90% | 23.88% | 22.86% | 13.33% | 22.27% | 23.68% | 30.43% |
| miniGPTvicuna7B | 10.91% | 11.54% | 12.38% | 7.46% | 8.57% | 11.11% | 9.77% | 7.89% | 23.19% |
| miniGPTvicuna13B | 12.73% | 17.52% | 12.38% | 10.45% | 11.43% | 11.11% | 14.84% | 6.58% | 20.29% |
| pix2struct | 9.39% | 8.55% | 10.48% | 0.00% | 4.29% | 11.11% | 10.55% | 11.84% | 14.49% |
| instructBLIP-vicuna-7B | 11.82% | 21.37% | 7.62% | 22.39% | 22.86% | 6.67% | 10.55% | 0.00% | 24.64% |
| instructBLIP-vicuna-13B | 10.91% | 13.68% | 5.71% | 19.40% | 15.71% | 11.11% | 6.25% | 2.63% | 18.84% |
| instructBLIP-flan-t5-xl | 20.30% | 22.22% | 20.00% | 17.91% | 22.86% | 13.33% | 18.36% | 15.79% | 33.33% |
| instructBLIP-flan-t5-xxl | 20.91% | 24.36% | 22.86% | 20.90% | 25.71% | 20.00% | 21.09% | 14.47% | 21.74% |
| LLAVANEXT-7B-vicuna | 26.67% | 23.08% | 26.67% | 20.90% | 27.14% | 33.33% | 26.56% | 19.74% | 30.43% |
| LLAVANEXT-13B-vicuna | 25.15% | 22.65% | 23.81% | 20.90% | 27.14% | 26.67% | 24.61% | 15.79% | 27.54% |
| LLAVANEXT-34B-NH | 27.58% | 39.32% | 25.71% | 28.36% | 32.86% | 26.67% | 30.86% | 21.05% | 46.37% |
Table 4: LogicVista evaluation results on various multimodal LLMs across each multi-modal capability. Accuracy results are presented as $\$ , with a maximum possible accuracy of $100\$ . Models achieving the highest scores are highlighted green, while lower-scoring models are highlighted yellow.
### 5.3 Relationship between Model Size and Performance
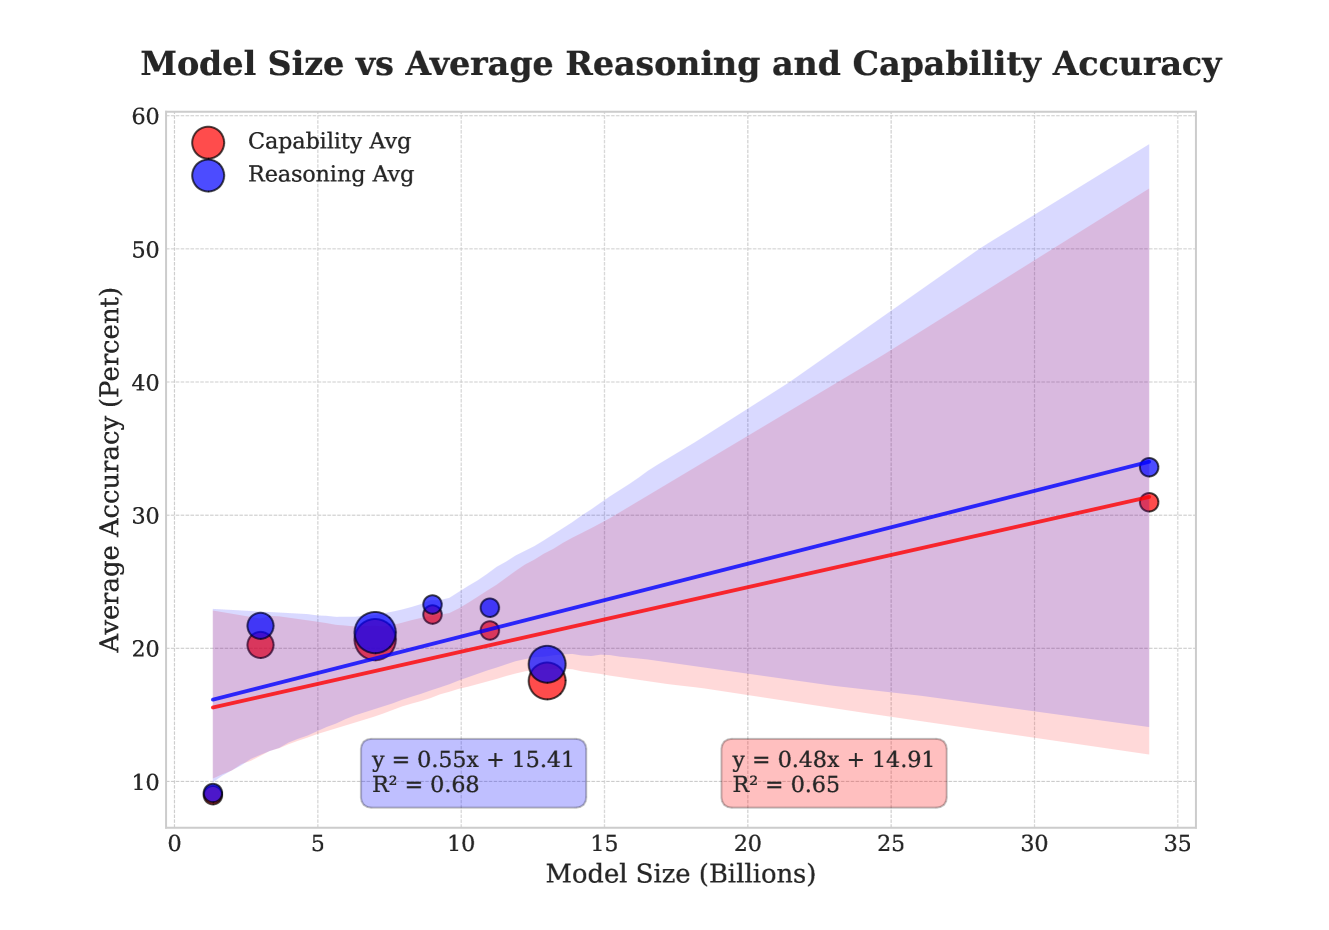
Figure 5 presents a comparative analysis of the model size and the average score achieved across all logical reasoning tasks and capabilities. Each plot includes a shaded region denoting the 95% confidence interval for the regression estimate, visually representing the uncertainty associated with the regression line. Dot sizes in the scatter plot indicate the number of models with identical parameter counts, illustrating the distribution density. This visual evidence strongly suggests a positive correlation between larger model sizes and improved performance in LogicVista. Specifically, as model size increases, performance tends to improve, indicating that larger models may have greater capacity to handle complex patterns and reasoning tasks.
## 6 Conclusion
Reasoning skills are critical for solving complex tasks and serve as the foundation for many challenges that humans expect AI agents to tackle. However, the exploration of reasoning abilities in multimodal LLM agents remains limited, with most benchmarks and training datasets predominantly focused on traditional computer vision tasks like recognition. For multimodal LLMs to excel in critical thinking and complex tasks, they must comprehend the underlying logical relationships inherent in these challenges.
<details>
<summary>x5.png Details</summary>
### Visual Description
## Scatter Plot: Model Size vs Average Reasoning and Capability Accuracy
### Overview
The image displays a scatter plot illustrating the relationship between "Model Size (Billions)" and "Average Accuracy (Percent)" for two distinct metrics: "Capability Avg" and "Reasoning Avg." The chart includes regression lines and shaded confidence intervals for both metrics to visualize the trend and uncertainty as model size increases.
### Components/Axes
* **X-Axis:** Labeled "Model Size (Billions)". The scale ranges from 0 to 35, with major grid lines at intervals of 5.
* **Y-Axis:** Labeled "Average Accuracy (Percent)". The scale ranges from 0 to 60, with major grid lines at intervals of 10.
* **Legend (Top-Left):**
* **Red Circle:** Represents "Capability Avg".
* **Blue Circle:** Represents "Reasoning Avg".
* **Regression Equations (Bottom-Center/Right):**
* **Blue Box (Reasoning):** $y = 0.55x + 15.41$, $R^2 = 0.68$
* **Red Box (Capability):** $y = 0.48x + 14.91$, $R^2 = 0.65$
### Detailed Analysis
* **Trend Verification:** Both data series exhibit a positive linear correlation. As the model size (X-axis) increases, the average accuracy (Y-axis) generally increases.
* **Data Series - Reasoning (Blue):**
* **Trend:** The blue regression line slopes upward, starting at approximately 16% accuracy at 0B parameters and reaching approximately 34% accuracy at 34B parameters.
* **Confidence Interval:** The blue shaded region represents the confidence interval for the Reasoning metric. It is relatively narrow at the lower end (0B–5B) and expands significantly as the model size increases, indicating higher uncertainty at larger scales.
* **Data Series - Capability (Red):**
* **Trend:** The red regression line slopes upward, starting at approximately 15% accuracy at 0B parameters and reaching approximately 31% accuracy at 34B parameters.
* **Confidence Interval:** The red shaded region represents the confidence interval for the Capability metric. Similar to the blue interval, it widens as model size increases, though it remains slightly narrower than the blue interval at the high end.
* **Data Point Distribution:**
* There are seven distinct clusters of data points along the X-axis (approx. 1.5B, 3B, 7B, 9B, 11B, 13B, and 34B).
* The points at 13B represent a notable deviation, where both Reasoning and Capability accuracy drop compared to the trend lines.
### Key Observations
* **Performance Gap:** The blue regression line (Reasoning) is consistently positioned above the red regression line (Capability) across the entire X-axis range, suggesting that Reasoning accuracy is generally higher than Capability accuracy for models of similar sizes.
* **Scaling Efficiency:** The slope of the Reasoning line (0.55) is steeper than the slope of the Capability line (0.48), indicating that Reasoning accuracy improves at a slightly faster rate relative to model size increases.
* **Correlation Strength:** The $R^2$ values (0.68 for Reasoning, 0.65 for Capability) indicate a moderate positive correlation. This suggests that while model size is a significant predictor of accuracy, it is not the sole determinant; other factors (e.g., training data quality, architecture) likely influence the results.
* **Uncertainty:** The widening confidence intervals (the "fan" shape) indicate that as models grow larger, the variance in performance becomes more pronounced, or there is less data available at the higher end of the parameter scale to constrain the prediction.
### Interpretation
The data demonstrates a clear, positive relationship between model size and performance in both Reasoning and Capability metrics. However, the moderate $R^2$ values suggest that "bigger is better" is a general rule rather than an absolute guarantee, as evidenced by the performance dip at the 13B parameter mark.
The widening confidence intervals at higher parameter counts suggest that as models scale, performance becomes less predictable. This could imply that larger models are more sensitive to training variations or that the dataset used for this chart has fewer samples at the high end, leading to less statistical certainty. The fact that Reasoning scales slightly better than Capability suggests that the architectural or training improvements applied to these models may be disproportionately benefiting reasoning tasks.
</details>
Figure 5: correlation between model size and average accuracy. The scatter plot uses varying dot sizes to represent the density of models with identical sizes.
To address this gap, we introduce LogicVista, a novel benchmark designed to evaluate multimodal LLMs through a comprehensive assessment of logical reasoning capabilities. This benchmark features a dataset of 448 samples covering five distinct reasoning skills, providing a robust platform for evaluating cutting-edge multimodal models. Our evaluation aims to shed light on the current state of logical reasoning in multimodal LLMs.
To facilitate straightforward evaluation, we employ an LLM-based multiple-choice question-answer extractor, which helps mitigate the non-deterministic nature often associated with multimodal LLM outputs. While LogicVista primarily focuses on explicit logical reasoning tasks isolated from real-life contexts, this approach represents a crucial step toward understanding fundamental reasoning skills. However, it is equally important to explore how AI agents perform tasks that blend abstract reasoning with real-world scenarios, a direction that will guide our future research endeavors.
## Acknowledgements
We extend our sincere appreciation to the student researchers at the University of California, Los Angeles, for their diligent efforts in the manual annotation and validation of our dataset: Evan Li, Srinath Saikrishnan, Lawrence Li, and Oscar Cooper Stern.
## References
- [1] OpenAI, Josh Achiam, Steven Adler, Sandhini Agarwal, Lama Ahmad, Ilge Akkaya, Florencia Leoni Aleman, Diogo Almeida, Janko Altenschmidt, Sam Altman, Shyamal Anadkat, Red Avila, Igor Babuschkin, Suchir Balaji, Valerie Balcom, Paul Baltescu, Haiming Bao, Mohammad Bavarian, Jeff Belgum, Irwan Bello, Jake Berdine, Gabriel Bernadett-Shapiro, Christopher Berner, Lenny Bogdonoff, Oleg Boiko, Madelaine Boyd, Anna-Luisa Brakman, Greg Brockman, Tim Brooks, Miles Brundage, Kevin Button, Trevor Cai, Rosie Campbell, Andrew Cann, Brittany Carey, Chelsea Carlson, Rory Carmichael, Brooke Chan, Che Chang, Fotis Chantzis, Derek Chen, Sully Chen, Ruby Chen, Jason Chen, Mark Chen, Ben Chess, Chester Cho, Casey Chu, Hyung Won Chung, Dave Cummings, Jeremiah Currier, Yunxing Dai, Cory Decareaux, Thomas Degry, Noah Deutsch, Damien Deville, Arka Dhar, David Dohan, Steve Dowling, Sheila Dunning, Adrien Ecoffet, Atty Eleti, Tyna Eloundou, David Farhi, Liam Fedus, Niko Felix, Simón Posada Fishman, Juston Forte, Isabella Fulford, Leo Gao, Elie Georges, Christian Gibson, Vik Goel, Tarun Gogineni, Gabriel Goh, Rapha Gontijo-Lopes, Jonathan Gordon, Morgan Grafstein, Scott Gray, Ryan Greene, Joshua Gross, Shixiang Shane Gu, Yufei Guo, Chris Hallacy, Jesse Han, Jeff Harris, Yuchen He, Mike Heaton, Johannes Heidecke, Chris Hesse, Alan Hickey, Wade Hickey, Peter Hoeschele, Brandon Houghton, Kenny Hsu, Shengli Hu, Xin Hu, Joost Huizinga, Shantanu Jain, Shawn Jain, Joanne Jang, Angela Jiang, Roger Jiang, Haozhun Jin, Denny Jin, Shino Jomoto, Billie Jonn, Heewoo Jun, Tomer Kaftan, Łukasz Kaiser, Ali Kamali, Ingmar Kanitscheider, Nitish Shirish Keskar, Tabarak Khan, Logan Kilpatrick, Jong Wook Kim, Christina Kim, Yongjik Kim, Jan Hendrik Kirchner, Jamie Kiros, Matt Knight, Daniel Kokotajlo, Łukasz Kondraciuk, Andrew Kondrich, Aris Konstantinidis, Kyle Kosic, Gretchen Krueger, Vishal Kuo, Michael Lampe, Ikai Lan, Teddy Lee, Jan Leike, Jade Leung, Daniel Levy, Chak Ming Li, Rachel Lim, Molly Lin, Stephanie Lin, Mateusz Litwin, Theresa Lopez, Ryan Lowe, Patricia Lue, Anna Makanju, Kim Malfacini, Sam Manning, Todor Markov, Yaniv Markovski, Bianca Martin, Katie Mayer, Andrew Mayne, Bob McGrew, Scott Mayer McKinney, Christine McLeavey, Paul McMillan, Jake McNeil, David Medina, Aalok Mehta, Jacob Menick, Luke Metz, Andrey Mishchenko, Pamela Mishkin, Vinnie Monaco, Evan Morikawa, Daniel Mossing, Tong Mu, Mira Murati, Oleg Murk, David Mély, Ashvin Nair, Reiichiro Nakano, Rajeev Nayak, Arvind Neelakantan, Richard Ngo, Hyeonwoo Noh, Long Ouyang, Cullen O’Keefe, Jakub Pachocki, Alex Paino, Joe Palermo, Ashley Pantuliano, Giambattista Parascandolo, Joel Parish, Emy Parparita, Alex Passos, Mikhail Pavlov, Andrew Peng, Adam Perelman, Filipe de Avila Belbute Peres, Michael Petrov, Henrique Ponde de Oliveira Pinto, Michael, Pokorny, Michelle Pokrass, Vitchyr H. Pong, Tolly Powell, Alethea Power, Boris Power, Elizabeth Proehl, Raul Puri, Alec Radford, Jack Rae, Aditya Ramesh, Cameron Raymond, Francis Real, Kendra Rimbach, Carl Ross, Bob Rotsted, Henri Roussez, Nick Ryder, Mario Saltarelli, Ted Sanders, Shibani Santurkar, Girish Sastry, Heather Schmidt, David Schnurr, John Schulman, Daniel Selsam, Kyla Sheppard, Toki Sherbakov, Jessica Shieh, Sarah Shoker, Pranav Shyam, Szymon Sidor, Eric Sigler, Maddie Simens, Jordan Sitkin, Katarina Slama, Ian Sohl, Benjamin Sokolowsky, Yang Song, Natalie Staudacher, Felipe Petroski Such, Natalie Summers, Ilya Sutskever, Jie Tang, Nikolas Tezak, Madeleine B. Thompson, Phil Tillet, Amin Tootoonchian, Elizabeth Tseng, Preston Tuggle, Nick Turley, Jerry Tworek, Juan Felipe Cerón Uribe, Andrea Vallone, Arun Vijayvergiya, Chelsea Voss, Carroll Wainwright, Justin Jay Wang, Alvin Wang, Ben Wang, Jonathan Ward, Jason Wei, CJ Weinmann, Akila Welihinda, Peter Welinder, Jiayi Weng, Lilian Weng, Matt Wiethoff, Dave Willner, Clemens Winter, Samuel Wolrich, Hannah Wong, Lauren Workman, Sherwin Wu, Jeff Wu, Michael Wu, Kai Xiao, Tao Xu, Sarah Yoo, Kevin Yu, Qiming Yuan, Wojciech Zaremba, Rowan Zellers, Chong Zhang, Marvin Zhang, Shengjia Zhao, Tianhao Zheng, Juntang Zhuang, William Zhuk, and Barret Zoph. Gpt-4 technical report, 2024.
- [2] Jean-Baptiste Alayrac, Jeff Donahue, Pauline Luc, Antoine Miech, Iain Barr, Yana Hasson, Karel Lenc, Arthur Mensch, Katie Millican, Malcolm Reynolds, Roman Ring, Eliza Rutherford, Serkan Cabi, Tengda Han, Zhitao Gong, Sina Samangooei, Marianne Monteiro, Jacob Menick, Sebastian Borgeaud, Andrew Brock, Aida Nematzadeh, Sahand Sharifzadeh, Mikolaj Binkowski, Ricardo Barreira, Oriol Vinyals, Andrew Zisserman, and Karen Simonyan. Flamingo: a visual language model for few-shot learning, 2022.
- [3] Haotian Liu, Chunyuan Li, Qingyang Wu, and Yong Jae Lee. Visual instruction tuning, 2023.
- [4] Deyao Zhu, Jun Chen, Xiaoqian Shen, Xiang Li, and Mohamed Elhoseiny. Minigpt-4: Enhancing vision-language understanding with advanced large language models, 2023.
- [5] Shukang Yin, Chaoyou Fu, Sirui Zhao, Ke Li, Xing Sun, Tong Xu, and Enhong Chen. A survey on multimodal large language models, 2023.
- [6] Chaoyou Fu, Peixian Chen, Yunhang Shen, Yulei Qin, Mengdan Zhang, Xu Lin, Jinrui Yang, Xiawu Zheng, Ke Li, Xing Sun, Yunsheng Wu, and Rongrong Ji. Mme: A comprehensive evaluation benchmark for multimodal large language models, 2023.
- [7] Xiaoman Zhang, Chaoyi Wu, Ziheng Zhao, Weixiong Lin, Ya Zhang, Yanfeng Wang, and Weidi Xie. Pmc-vqa: Visual instruction tuning for medical visual question answering, 2023.
- [8] Stanislaw Antol, Aishwarya Agrawal, Jiasen Lu, Margaret Mitchell, Dhruv Batra, C. Lawrence Zitnick, and Devi Parikh. Vqa: Visual question answering. In Proceedings of the IEEE International Conference on Computer Vision (ICCV), December 2015.
- [9] Amanpreet Singh, Vivek Natarajan, Meet Shah, Yu Jiang, Xinlei Chen, Dhruv Batra, Devi Parikh, and Marcus Rohrbach. Towards vqa models that can read, 2019.
- [10] Weihao Yu, Zhengyuan Yang, Linjie Li, Jianfeng Wang, Kevin Lin, Zicheng Liu, Xinchao Wang, and Lijuan Wang. Mm-vet: Evaluating large multimodal models for integrated capabilities, 2023.
- [11] Michael J. Wavering. Logical reasoning necessary to make line graphs. Journal of Research in Science Teaching, 26(5):373–379, May 1989.
- [12] Catherine Sophian and Susan C. Somerville. Early developments in logical reasoning: Considering alternative possibilities. Cognitive Development, 3(2):183–222, 1988.
- [13] Hugo Bronkhorst, Gerrit Roorda, Cor Suhre, and Martin Goedhart. Logical reasoning in formal and everyday reasoning tasks - international journal of science and mathematics education, Dec 2019.
- [14] Pan Lu, Hritik Bansal, Tony Xia, Jiacheng Liu, Chunyuan Li, Hannaneh Hajishirzi, Hao Cheng, Kai-Wei Chang, Michel Galley, and Jianfeng Gao. Mathvista: Evaluating mathematical reasoning of foundation models in visual contexts, 2024.
- [15] Yash Goyal, Tejas Khot, Douglas Summers-Stay, Dhruv Batra, and Devi Parikh. Making the V in VQA matter: Elevating the role of image understanding in Visual Question Answering. In Conference on Computer Vision and Pattern Recognition (CVPR), 2017.
- [16] Tsung-Yi Lin, Michael Maire, Serge Belongie, James Hays, Pietro Perona, Deva Ramanan, Piotr Dollár, and C. Lawrence Zitnick. Microsoft COCO: Common Objects in Context, page 740–755. Springer International Publishing, 2014.
- [17] Oleksii Sidorov, Ronghang Hu, Marcus Rohrbach, and Amanpreet Singh. Textcaps: a dataset for image captioning with reading comprehension, 2020.
- [18] Rohan Wadhawan, Hritik Bansal, Kai-Wei Chang, and Nanyun Peng. Contextual: Evaluating context-sensitive text-rich visual reasoning in large multimodal models, 2024.
- [19] Yonatan Bitton, Hritik Bansal, Jack Hessel, Rulin Shao, Wanrong Zhu, Anas Awadalla, Josh Gardner, Rohan Taori, and Ludwig Schmidt. Visit-bench: A benchmark for vision-language instruction following inspired by real-world use, 2023.
- [20] Xinlei Chen, Hao Fang, Tsung-Yi Lin, Ramakrishna Vedantam, Saurabh Gupta, Piotr Dollar, and C. Lawrence Zitnick. Microsoft coco captions: Data collection and evaluation server, 2015.
- [21] Yash Goyal, Tejas Khot, Douglas Summers-Stay, Dhruv Batra, and Devi Parikh. Making the v in vqa matter: Elevating the role of image understanding in visual question answering, 2017.
- [22] Jiasen Lu, Dhruv Batra, Devi Parikh, and Stefan Lee. Vilbert: Pretraining task-agnostic visiolinguistic representations for vision-and-language tasks, 2019.
- [23] Yen-Chun Chen, Linjie Li, Licheng Yu, Ahmed El Kholy, Faisal Ahmed, Zhe Gan, Yu Cheng, and Jingjing Liu. Uniter: Universal image-text representation learning, 2020.
- [24] Xiujun Li, Xi Yin, Chunyuan Li, Pengchuan Zhang, Xiaowei Hu, Lei Zhang, Lijuan Wang, Houdong Hu, Li Dong, Furu Wei, Yejin Choi, and Jianfeng Gao. Oscar: Object-semantics aligned pre-training for vision-language tasks, 2020.
- [25] Wonjae Kim, Bokyung Son, and Ildoo Kim. Vilt: Vision-and-language transformer without convolution or region supervision, 2021.
- [26] Zirui Wang, Jiahui Yu, Adams Wei Yu, Zihang Dai, Yulia Tsvetkov, and Yuan Cao. Simvlm: Simple visual language model pretraining with weak supervision, 2022.
- [27] Jianfeng Wang, Zhengyuan Yang, Xiaowei Hu, Linjie Li, Kevin Lin, Zhe Gan, Zicheng Liu, Ce Liu, and Lijuan Wang. Git: A generative image-to-text transformer for vision and language, 2022.
- [28] Zhengyuan Yang, Zhe Gan, Jianfeng Wang, Xiaowei Hu, Faisal Ahmed, Zicheng Liu, Yumao Lu, and Lijuan Wang. Unitab: Unifying text and box outputs for grounded vision-language modeling, 2022.
- [29] Zhe Gan, Linjie Li, Chunyuan Li, Lijuan Wang, Zicheng Liu, and Jianfeng Gao. Vision-language pre-training: Basics, recent advances, and future trends, 2022.
- [30] Tom B. Brown, Benjamin Mann, Nick Ryder, Melanie Subbiah, Jared Kaplan, Prafulla Dhariwal, Arvind Neelakantan, Pranav Shyam, Girish Sastry, Amanda Askell, Sandhini Agarwal, Ariel Herbert-Voss, Gretchen Krueger, Tom Henighan, Rewon Child, Aditya Ramesh, Daniel M. Ziegler, Jeffrey Wu, Clemens Winter, Christopher Hesse, Mark Chen, Eric Sigler, Mateusz Litwin, Scott Gray, Benjamin Chess, Jack Clark, Christopher Berner, Sam McCandlish, Alec Radford, Ilya Sutskever, and Dario Amodei. Language models are few-shot learners, 2020.
- [31] Aakanksha Chowdhery, Sharan Narang, Jacob Devlin, Maarten Bosma, Gaurav Mishra, Adam Roberts, Paul Barham, Hyung Won Chung, Charles Sutton, Sebastian Gehrmann, Parker Schuh, Kensen Shi, Sasha Tsvyashchenko, Joshua Maynez, Abhishek Rao, Parker Barnes, Yi Tay, Noam Shazeer, Vinodkumar Prabhakaran, Emily Reif, Nan Du, Ben Hutchinson, Reiner Pope, James Bradbury, Jacob Austin, Michael Isard, Guy Gur-Ari, Pengcheng Yin, Toju Duke, Anselm Levskaya, Sanjay Ghemawat, Sunipa Dev, Henryk Michalewski, Xavier Garcia, Vedant Misra, Kevin Robinson, Liam Fedus, Denny Zhou, Daphne Ippolito, David Luan, Hyeontaek Lim, Barret Zoph, Alexander Spiridonov, Ryan Sepassi, David Dohan, Shivani Agrawal, Mark Omernick, Andrew M. Dai, Thanumalayan Sankaranarayana Pillai, Marie Pellat, Aitor Lewkowycz, Erica Moreira, Rewon Child, Oleksandr Polozov, Katherine Lee, Zongwei Zhou, Xuezhi Wang, Brennan Saeta, Mark Diaz, Orhan Firat, Michele Catasta, Jason Wei, Kathy Meier-Hellstern, Douglas Eck, Jeff Dean, Slav Petrov, and Noah Fiedel. Palm: Scaling language modeling with pathways, 2022.
- [32] Hugo Touvron, Thibaut Lavril, Gautier Izacard, Xavier Martinet, Marie-Anne Lachaux, Timothée Lacroix, Baptiste Rozière, Naman Goyal, Eric Hambro, Faisal Azhar, Aurelien Rodriguez, Armand Joulin, Edouard Grave, and Guillaume Lample. Llama: Open and efficient foundation language models, 2023.
- [33] Maria Tsimpoukelli, Jacob Menick, Serkan Cabi, S. M. Ali Eslami, Oriol Vinyals, and Felix Hill. Multimodal few-shot learning with frozen language models, 2021.
- [34] Danny Driess, Fei Xia, Mehdi S. M. Sajjadi, Corey Lynch, Aakanksha Chowdhery, Brian Ichter, Ayzaan Wahid, Jonathan Tompson, Quan Vuong, Tianhe Yu, Wenlong Huang, Yevgen Chebotar, Pierre Sermanet, Daniel Duckworth, Sergey Levine, Vincent Vanhoucke, Karol Hausman, Marc Toussaint, Klaus Greff, Andy Zeng, Igor Mordatch, and Pete Florence. Palm-e: An embodied multimodal language model, 2023.
- [35] Susan Zhang, Stephen Roller, Naman Goyal, Mikel Artetxe, Moya Chen, Shuohui Chen, Christopher Dewan, Mona Diab, Xian Li, Xi Victoria Lin, Todor Mihaylov, Myle Ott, Sam Shleifer, Kurt Shuster, Daniel Simig, Punit Singh Koura, Anjali Sridhar, Tianlu Wang, and Luke Zettlemoyer. Opt: Open pre-trained transformer language models, 2022.
- [36] Baolin Peng, Chunyuan Li, Pengcheng He, Michel Galley, and Jianfeng Gao. Instruction tuning with gpt-4, 2023.
- [37] Anas Awadalla, Irena Gao, Josh Gardner, Jack Hessel, Yusuf Hanafy, Wanrong Zhu, Kalyani Marathe, Yonatan Bitton, Samir Gadre, Shiori Sagawa, Jenia Jitsev, Simon Kornblith, Pang Wei Koh, Gabriel Ilharco, Mitchell Wortsman, and Ludwig Schmidt. Openflamingo: An open-source framework for training large autoregressive vision-language models, 2023.
- [38] Haotian Liu, Chunyuan Li, Qingyang Wu, and Yong Jae Lee. Visual instruction tuning, 2023.
- [39] Bo Li, Yuanhan Zhang, Liangyu Chen, Jinghao Wang, Jingkang Yang, and Ziwei Liu. Otter: A multi-modal model with in-context instruction tuning, 2023.
- [40] Wenliang Dai, Junnan Li, Dongxu Li, Anthony Meng Huat Tiong, Junqi Zhao, Weisheng Wang, Boyang Li, Pascale Fung, and Steven Hoi. Instructblip: Towards general-purpose vision-language models with instruction tuning, 2023.
- [41] Tao Gong, Chengqi Lyu, Shilong Zhang, Yudong Wang, Miao Zheng, Qian Zhao, Kuikun Liu, Wenwei Zhang, Ping Luo, and Kai Chen. Multimodal-gpt: A vision and language model for dialogue with humans, 2023.
- [42] Qinghao Ye, Haiyang Xu, Guohai Xu, Jiabo Ye, Ming Yan, Yiyang Zhou, Junyang Wang, Anwen Hu, Pengcheng Shi, Yaya Shi, Chenliang Li, Yuanhong Xu, Hehong Chen, Junfeng Tian, Qian Qi, Ji Zhang, and Fei Huang. mplug-owl: Modularization empowers large language models with multimodality, 2023.
- [43] Zhengyuan Yang, Linjie Li, Jianfeng Wang, Kevin Lin, Ehsan Azarnasab, Faisal Ahmed, Zicheng Liu, Ce Liu, Michael Zeng, and Lijuan Wang. Mm-react: Prompting chatgpt for multimodal reasoning and action, 2023.
- [44] Yongliang Shen, Kaitao Song, Xu Tan, Dongsheng Li, Weiming Lu, and Yueting Zhuang. Hugginggpt: Solving ai tasks with chatgpt and its friends in hugging face, 2023.
- [45] Difei Gao, Lei Ji, Luowei Zhou, Kevin Qinghong Lin, Joya Chen, Zihan Fan, and Mike Zheng Shou. Assistgpt: A general multi-modal assistant that can plan, execute, inspect, and learn, 2023.
- [46] Harsh Agrawal, Karan Desai, Yufei Wang, Xinlei Chen, Rishabh Jain, Mark Johnson, Dhruv Batra, Devi Parikh, Stefan Lee, and Peter Anderson. nocaps: novel object captioning at scale. In 2019 IEEE/CVF International Conference on Computer Vision (ICCV). IEEE, October 2019.
- [47] Amanpreet Singh, Vivek Natarajan, Meet Shah, Yu Jiang, Xinlei Chen, Dhruv Batra, Devi Parikh, and Marcus Rohrbach. Towards vqa models that can read, 2019.
- [48] Zhengyuan Yang, Yijuan Lu, Jianfeng Wang, Xi Yin, Dinei Florencio, Lijuan Wang, Cha Zhang, Lei Zhang, and Jiebo Luo. Tap: Text-aware pre-training for text-vqa and text-caption, 2020.
- [49] Rowan Zellers, Yonatan Bisk, Ali Farhadi, and Yejin Choi. From recognition to cognition: Visual commonsense reasoning, 2019.
- [50] Kenneth Marino, Mohammad Rastegari, Ali Farhadi, and Roozbeh Mottaghi. Ok-vqa: A visual question answering benchmark requiring external knowledge, 2019.
- [51] Yuan Liu, Haodong Duan, Yuanhan Zhang, Bo Li, Songyang Zhang, Wangbo Zhao, Yike Yuan, Jiaqi Wang, Conghui He, Ziwei Liu, Kai Chen, and Dahua Lin. Mmbench: Is your multi-modal model an all-around player?, 2023.
- [52] Cheng-Han Chiang and Hung yi Lee. Can large language models be an alternative to human evaluations?, 2023.
- [53] Yang Liu, Dan Iter, Yichong Xu, Shuohang Wang, Ruochen Xu, and Chenguang Zhu. G-eval: Nlg evaluation using gpt-4 with better human alignment, 2023.
- [54] Jinlan Fu, See-Kiong Ng, Zhengbao Jiang, and Pengfei Liu. Gptscore: Evaluate as you desire, 2023.
- [55] Yiqiao Jin, Minje Choi, Gaurav Verma, Jindong Wang, and Srijan Kumar. Mm-soc: Benchmarking multimodal large language models in social media platforms. In ACL, 2024.
- [56] Mina Lee, Percy Liang, and Qian Yang. Coauthor: Designing a human-ai collaborative writing dataset for exploring language model capabilities. In CHI Conference on Human Factors in Computing Systems, CHI ’22. ACM, April 2022.
- [57] Shuyin Ouyang, Jie M. Zhang, Mark Harman, and Meng Wang. Llm is like a box of chocolates: the non-determinism of chatgpt in code generation, 2023.
- [58] Haotian Liu, Chunyuan Li, Yuheng Li, Bo Li, Yuanhan Zhang, Sheng Shen, and Yong Jae Lee. Llava-next: Improved reasoning, ocr, and world knowledge, January 2024.
- [59] Junnan Li, Dongxu Li, Silvio Savarese, and Steven Hoi. Blip-2: Bootstrapping language-image pre-training with frozen image encoders and large language models, 2023.
- [60] Kenton Lee, Mandar Joshi, Iulia Turc, Hexiang Hu, Fangyu Liu, Julian Eisenschlos, Urvashi Khandelwal, Peter Shaw, Ming-Wei Chang, and Kristina Toutanova. Pix2struct: Screenshot parsing as pretraining for visual language understanding, 2023.
Appendix: LogicVista: Multimodal LLM Logical Reasoning Benchmark in Visual Contexts
## Appendix A Examples of LogicVista Logical Reasoning Data
Table 5: Three samples requiring inductive logical reasoning skills.
| (Case A) | |
| --- | --- |
|
<details>
<summary>extracted/5714025/figures/Appendix/ind1.png Details</summary>
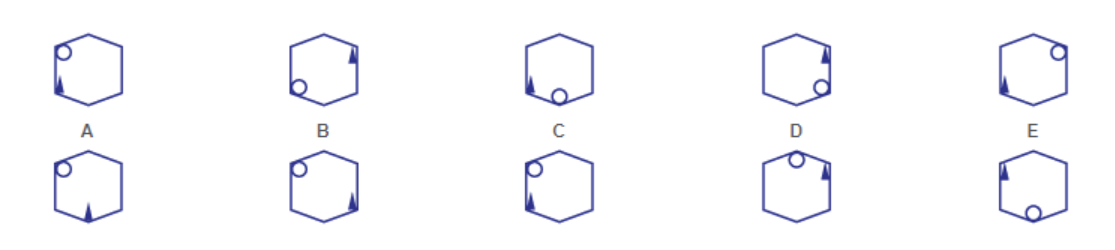
### Visual Description
## [Diagram]: Hexagonal Pattern Logic Sequence
### Overview
The image presents a series of five columns, labeled A through E. Each column contains two identical regular hexagonal diagrams stacked vertically. Inside each hexagon, there are two distinct geometric elements: a small open circle and an arrow. The position and orientation of these elements vary across each hexagon, suggesting a visual logic puzzle or pattern recognition sequence.
### Components/Axes
* **Labels:** A, B, C, D, E (positioned between the top and bottom hexagons of each column).
* **Shapes:** Regular hexagons.
* **Internal Elements:**
* **Circle:** An open, unfilled circle.
* **Arrow:** A directional indicator (pointing either up or down).
* **Spatial Orientation:** Elements are placed at vertices (corners) or along the edges of the hexagons.
### Detailed Analysis
The following is a breakdown of the elements within each hexagon, described from top to bottom for each column:
**Column A**
* **Top Hexagon:** Circle is located at the top-left vertex. The arrow is positioned along the left edge, pointing downward.
* **Bottom Hexagon:** Circle is located at the top-left vertex. The arrow is positioned at the bottom edge (center), pointing upward.
**Column B**
* **Top Hexagon:** Circle is located at the bottom-left vertex. The arrow is positioned along the right edge, pointing upward.
* **Bottom Hexagon:** Circle is located at the top-left vertex. The arrow is positioned along the right edge, pointing downward.
**Column C**
* **Top Hexagon:** The arrow is positioned at the bottom edge (center), pointing upward. The circle is located at the bottom-right vertex.
* **Bottom Hexagon:** Circle is located at the top-left vertex. The arrow is positioned along the left edge, pointing downward.
**Column D**
* **Top Hexagon:** The arrow is positioned along the right edge, pointing upward. The circle is located at the bottom-right vertex.
* **Bottom Hexagon:** The circle is located at the top edge (center). The arrow is positioned along the right edge, pointing upward.
**Column E**
* **Top Hexagon:** The circle is located at the top-right vertex. The arrow is positioned along the left edge, pointing downward.
* **Bottom Hexagon:** The arrow is positioned along the left edge, pointing upward. The circle is located at the bottom edge (center).
### Key Observations
* **Non-Uniformity:** There is no consistent, singular rule (such as simple clockwise rotation) that applies to all columns simultaneously.
* **Element Variation:** The circle and arrow change positions independently of one another between the top and bottom hexagons in each column.
* **Positional Logic:** The elements occupy specific "slots" (vertices or edge centers). The circle appears to move between vertices and edge centers, while the arrow appears to move between edge positions and changes orientation (up/down).
### Interpretation
This image is characteristic of a non-verbal reasoning test or an IQ assessment matrix. The data demonstrates a set of rules governing the movement and orientation of the circle and arrow.
* **Relationship:** The relationship between the top and bottom hexagon in each column is likely the key to solving the puzzle. For example, in Column A, the circle remains static while the arrow changes position and orientation. In other columns, both elements move.
* **Pattern Recognition:** To interpret the "meaning" of this data, one would need to determine the transformation rule that converts the top hexagon into the bottom hexagon for each column. The lack of a uniform pattern across all columns (A-E) suggests that each column may represent a separate logical operation or a step in a larger, complex sequence.
</details>
| |
| Q: | Which choice (A, B, C, or D) completes the series? |
| Answer: | D |
| Reasoning: | In this example, there are two rules to be applied. The first is that the circle moves counter-clockwise in the hexagon. It follows that, in the following diagram, the circle will be in the upper corner of the hexagon, pointing to D as the answer. To confirm this, the second rule can be applied, according to which the position of the black triangle alternates between the bottom left and the top right. Thus, in the following diagram, the black triangle will need to be in the upper right corner of the hex. The answer is therefore definitely D. |
| Logical Reasoning Skill: | Inductive |
| Required capability | Diagram |
Table 6: Three samples requiring inductive logical reasoning skills (Case B).
| (Case B) | |
| --- | --- |
|
<details>
<summary>extracted/5714025/figures/Appendix/ind2.png Details</summary>
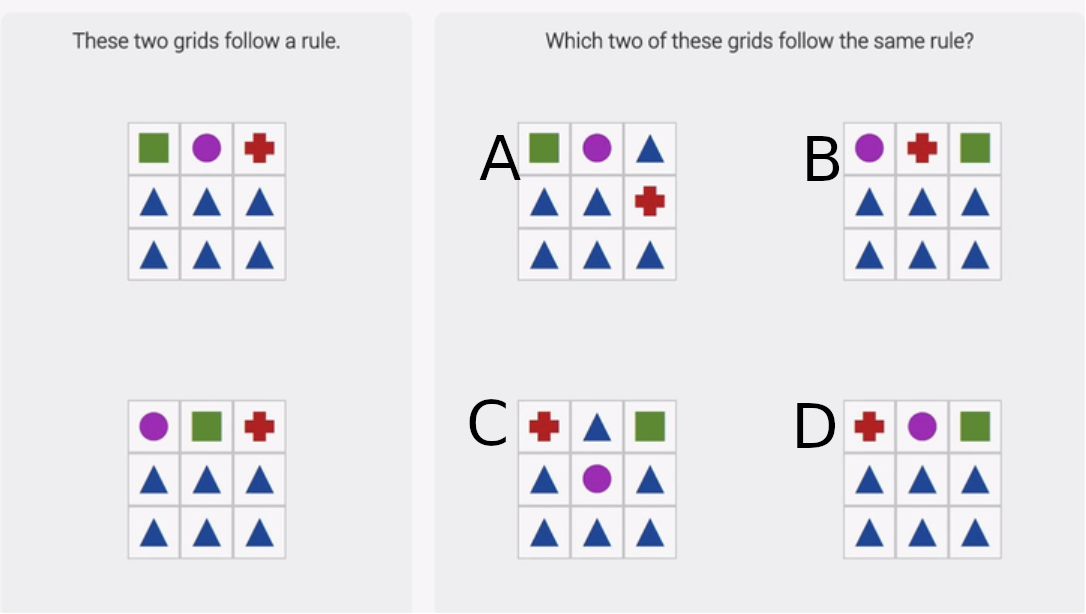
### Visual Description
## Logic Puzzle: Pattern Recognition
### Overview
The image is a visual logic puzzle consisting of two sections. The left section displays two example 3x3 grids that adhere to a specific, consistent rule. The right section presents four potential 3x3 grid options (labeled A, B, C, and D) and asks the viewer to identify which two of these options follow the same rule established by the examples.
### Components/Axes
The image is divided into two primary regions:
* **Left Region (Examples):** Contains two 3x3 grids stacked vertically.
* Text: "These two grids follow a rule."
* **Right Region (Options):** Contains four 3x3 grids arranged in a 2x2 layout, labeled A, B, C, and D.
* Text: "Which two of these grids follow the same rule?"
**Grid Elements:**
The grids are composed of four distinct shapes/colors:
1. **Green Square**
2. **Purple Circle**
3. **Red Plus Sign**
4. **Blue Triangle**
### Detailed Analysis
#### Left Region (The Rule Examples)
* **Top Grid:**
* Row 1: [Green Square] [Purple Circle] [Red Plus]
* Row 2: [Blue Triangle] [Blue Triangle] [Blue Triangle]
* Row 3: [Blue Triangle] [Blue Triangle] [Blue Triangle]
* **Bottom Grid:**
* Row 1: [Purple Circle] [Green Square] [Red Plus]
* Row 2: [Blue Triangle] [Blue Triangle] [Blue Triangle]
* Row 3: [Blue Triangle] [Blue Triangle] [Blue Triangle]
#### Right Region (The Options)
* **Grid A (Top-Left):**
* Row 1: [Green Square] [Purple Circle] [Blue Triangle]
* Row 2: [Blue Triangle] [Blue Triangle] [Red Plus]
* Row 3: [Blue Triangle] [Blue Triangle] [Blue Triangle]
* **Grid B (Top-Right):**
* Row 1: [Purple Circle] [Red Plus] [Green Square]
* Row 2: [Blue Triangle] [Blue Triangle] [Blue Triangle]
* Row 3: [Blue Triangle] [Blue Triangle] [Blue Triangle]
* **Grid C (Bottom-Left):**
* Row 1: [Red Plus] [Blue Triangle] [Green Square]
* Row 2: [Blue Triangle] [Purple Circle] [Blue Triangle]
* Row 3: [Blue Triangle] [Blue Triangle] [Blue Triangle]
* **Grid D (Bottom-Right):**
* Row 1: [Red Plus] [Purple Circle] [Green Square]
* Row 2: [Blue Triangle] [Blue Triangle] [Blue Triangle]
* Row 3: [Blue Triangle] [Blue Triangle] [Blue Triangle]
### Key Observations
* **Rule Consistency:** In both example grids, Rows 2 and 3 are entirely filled with Blue Triangles. Row 1 contains exactly one Green Square, one Purple Circle, and one Red Plus.
* **Grid A Analysis:** Fails the rule. Row 1 contains a Blue Triangle instead of the required set. Row 2 contains a Red Plus.
* **Grid B Analysis:** Follows the rule. Rows 2 and 3 are all Blue Triangles. Row 1 contains the required set (Purple Circle, Red Plus, Green Square).
* **Grid C Analysis:** Fails the rule. Row 1 contains a Blue Triangle. Row 2 contains a Purple Circle.
* **Grid D Analysis:** Follows the rule. Rows 2 and 3 are all Blue Triangles. Row 1 contains the required set (Red Plus, Purple Circle, Green Square).
### Interpretation
The data demonstrates a pattern based on two strict constraints:
1. **Spatial Constraint:** Rows 2 and 3 must be populated exclusively by Blue Triangles.
2. **Compositional Constraint:** Row 1 must contain exactly one instance of each of the three non-triangle shapes (Green Square, Purple Circle, Red Plus).
By applying these constraints, we can determine that **Grids B and D** are the correct answers, as they are the only options that satisfy both the spatial and compositional requirements established by the example grids.
</details>
| |
| Q: | Two grids containing colored symbols and following a common rule are presented. In the block on the right, four additional grids are presented. The candidate must find the two grids that follow the same rule out of these four options. What options (A, B, C, or D) follow this same rule? |
| Answer: | B, D |
| Reasoning: | In this example, it is easy to see that the rule governing the two grids on the left is: that blue triangles are present in each of the two bottom lines. This rule is followed in the two grids on the right. |
| Logical Reasoning Skill: | Inductive |
| Required capability | Diagram, OCR |
Table 7: Three samples requiring inductive logical reasoning skills (Case C).
| (Case C) | |
| --- | --- |
|
<details>
<summary>extracted/5714025/figures/Appendix/ind3.png Details</summary>

### Visual Description
## Diagram: Sequence of Geometric Shapes
### Overview
The image presents a horizontal sequence of nine distinct square frames, labeled sequentially from A to I. Each frame contains a geometric shape centered within it. The sequence primarily consists of diamonds (rotated squares) that alternate between being filled (black) and empty (outline), with one notable anomaly in the seventh position.
### Components/Axes
* **Labels:** A, B, C, D, E, F, G, H, I (positioned directly above each respective square frame).
* **Frames:** Nine identical square borders arranged in a single horizontal row.
* **Shapes:**
* **Filled Diamond:** A solid black diamond shape.
* **Empty Diamond:** A diamond shape defined only by its outline.
* **Filled Square:** A solid black square shape (non-rotated).
### Detailed Analysis
The sequence follows a specific pattern of shape type and fill state:
| Label | Shape Type | Fill State |
| :--- | :--- | :--- |
| **A** | Diamond | Filled |
| **B** | Diamond | Empty |
| **C** | Diamond | Filled |
| **D** | Diamond | Empty |
| **E** | Diamond | Filled |
| **F** | Diamond | Empty |
| **G** | Square | Filled |
| **H** | Diamond | Empty |
| **I** | Diamond | Filled |
### Key Observations
* **Primary Pattern:** From A through F, the sequence strictly alternates between a filled diamond and an empty diamond.
* **Anomaly:** The pattern is disrupted at position **G**. While it maintains the "filled" state, the shape changes from a diamond to a standard square.
* **Resumption:** Following the anomaly at G, the sequence returns to the established pattern at H (Empty Diamond) and I (Filled Diamond), effectively continuing the alternating fill sequence established in the first six frames.
### Interpretation
This image functions as a visual logic puzzle, likely designed to test pattern recognition or identify an "odd one out."
The data demonstrates a rule-based sequence:
1. **Rule 1 (Fill):** The fill state alternates consistently throughout the entire sequence (Filled, Empty, Filled, Empty, Filled, Empty, Filled, Empty, Filled).
2. **Rule 2 (Shape):** The shape is consistent (Diamond) for all entries except for G.
The anomaly at **G** is the focal point of the diagram. It violates the "Diamond" shape rule while adhering to the "Filled" fill rule. This suggests that G is the outlier in the set. The sequence resumes its original form immediately after G, indicating that the disruption was isolated to that specific position.
</details>
| |
| Q: | Who is the odd-one-out? Select answers from A-I. |
| Answer: | G |
| Reasoning: | Element G constitutes the exception and is therefore the correct answer. |
| Logical Reasoning Skill: | Inductive |
| Required capability | Diagram |
Table 8: Three samples requiring deductive logical reasoning skills (Case A).
| (Case A) | |
| --- | --- |
|
<details>
<summary>extracted/5714025/figures/Appendix/ded1.png Details</summary>
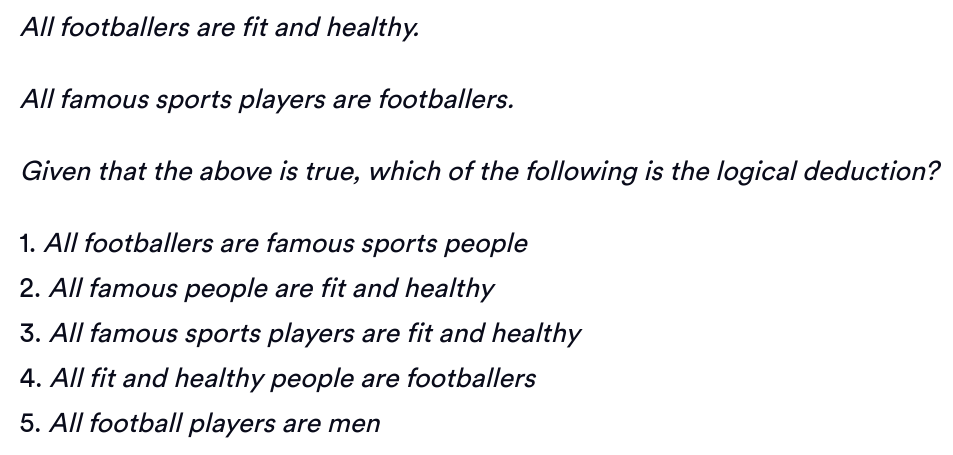
### Visual Description
## Logic Puzzle: Syllogistic Deduction
### Overview
The image contains a text-based logic puzzle (a syllogism). It presents two premises and asks the reader to identify the correct logical deduction from a list of five provided options.
### Components
The content is structured as follows:
* **Premise 1:** "All footballers are fit and healthy."
* **Premise 2:** "All famous sports players are footballers."
* **Question:** "Given that the above is true, which of the following is the logical deduction?"
* **Options:** A list of five potential conclusions.
### Detailed Analysis
The text in the image is transcribed below:
"All footballers are fit and healthy."
"All famous sports players are footballers."
"Given that the above is true, which of the following is the logical deduction?"
"1. All footballers are famous sports people"
"2. All famous people are fit and healthy"
"3. All famous sports players are fit and healthy"
"4. All fit and healthy people are footballers"
"5. All football players are men"
### Key Observations
* **Logical Structure:** The puzzle uses the transitive property of sets.
* Let **F** = Footballers
* Let **H** = Fit and healthy people
* Let **S** = Famous sports players
* **Premise 1:** All F are H ($F \subseteq H$)
* **Premise 2:** All S are F ($S \subseteq F$)
* **Chain:** Since all S are F, and all F are H, it follows that all S are H.
### Interpretation
The correct logical deduction is **Option 3: "All famous sports players are fit and healthy."**
**Reasoning:**
* **Option 1** is incorrect because it assumes the converse of Premise 2 (that all footballers are famous sports players), which is not supported by the premises.
* **Option 2** is incorrect because "famous people" is a category not introduced in the premises; we only know about "famous sports players."
* **Option 3** is correct because it follows the transitive property: If $S \subseteq F$ and $F \subseteq H$, then $S \subseteq H$.
* **Option 4** is incorrect because it assumes the converse of Premise 1 (that all fit and healthy people are footballers), which is a logical fallacy.
* **Option 5** is incorrect because the gender of football players is not mentioned in the premises.
</details>
| |
| Q: | Which is the correct answer according to the image? Select from 1-5? |
| Answer: | 3 |
| Reasoning: | Using deductive reasoning, the only logical answer is 3. To get to this answer, you need to simplify the given facts. All famous sports players are footballers, and all footballers are fit and healthy. We can not deduce that all footballers are famous sports people, as we have not got that information. We can not deduce that all famous people are fit and healthy, because the fact is about famous sports people. This is the logical answer. This information is not given; all footballers are fit and healthy but we can not logically link that all fit and healthy people are footballers. This is obviously incorrect, as gender is not mentioned at all in the question. |
| Logical Reasoning Skill: | Deductive |
| Required capability: | OCR |
Table 9: Three samples requiring deductive logical reasoning skills (Case B).
| (Case B) | |
| --- | --- |
|
<details>
<summary>extracted/5714025/figures/Appendix/ded2.png Details</summary>
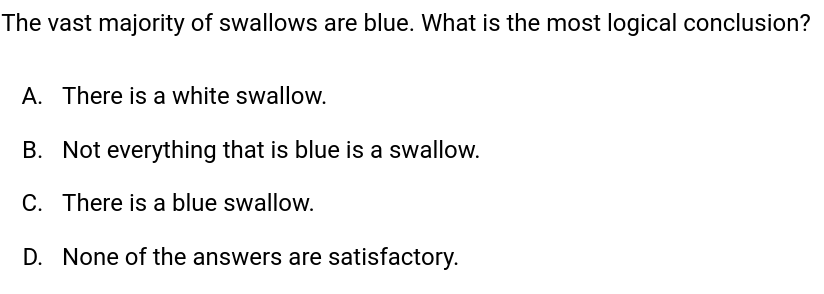
### Visual Description
## Textual Logic Puzzle: Logical Conclusion Question
### Overview
The image contains a multiple-choice logic question presented in plain text. The content focuses on deductive reasoning based on a statistical premise regarding the color of swallows.
### Components
* **Question Stem:** A single sentence establishing the premise and asking for a conclusion.
* **Options:** Four distinct choices labeled A, B, C, and D.
### Detailed Analysis
The text is presented in English. The content is transcribed below:
* **Question Stem:** "The vast majority of swallows are blue. What is the most logical conclusion?"
* **Option A:** "There is a white swallow."
* **Option B:** "Not everything that is blue is a swallow."
* **Option C:** "There is a blue swallow."
* **Option D:** "None of the answers are satisfactory."
### Key Observations
* The premise uses the quantifier "vast majority," which implies a statistical distribution where the color blue is dominant among the set of "swallows."
* The options test the ability to distinguish between a *possibility* (A), a *general truth* (B), a *logical necessity* (C), and a *null result* (D).
### Interpretation
This is a test of formal logic and deductive reasoning.
* **Logical Deduction:**
* **Premise:** "The vast majority of swallows are blue."
* **Analysis of Option A:** "There is a white swallow." This is a possibility, but it is not a logical necessity. The premise does not exclude the existence of other colors, but it does not confirm them either.
* **Analysis of Option B:** "Not everything that is blue is a swallow." While this is a true statement in the real world, it is a *non-sequitur* in the context of this specific logic puzzle. It does not follow from the premise provided.
* **Analysis of Option C:** "There is a blue swallow." This is the only logically necessary conclusion. If a "vast majority" of a group possesses a specific trait, then at least one member of that group must possess that trait. Therefore, the existence of at least one blue swallow is guaranteed by the premise.
* **Analysis of Option D:** Since Option C is a valid logical conclusion, Option D is incorrect.
**Conclusion:** Option C is the correct answer because it is the only statement that is necessarily true based strictly on the provided premise.
</details>
| |
| Q: | What is the correct answer to the question in the image? Select from A-D. |
| Answer: | C |
| Reasoning: | The vast majority of swallows are blue so the answer must be C: there is a blue swallow. |
| Logical Reasoning Skill: | Deductive |
| Required capability: | OCR |
Table 10: Three samples requiring deductive logical reasoning skills (Case C).
| (Case C) | |
| --- | --- |
|
<details>
<summary>extracted/5714025/figures/Appendix/ded3.png Details</summary>

### Visual Description
## Textual Diagram: Logical Propositions on Governance and Economics
### Overview
The image consists of a single rectangular frame with a yellow border containing five distinct, declarative sentences. These sentences function as a series of logical premises or assertions regarding the interconnected relationships between four entities: "the people," "the government," "production," and "the free-market."
### Components
* **Container:** A simple rectangular box with a yellow border.
* **Content:** Five lines of text, centered within the box.
* **Language:** English.
### Content Details
The text is transcribed exactly as follows:
1. "The people determine what is produced."
2. "The government is made up of the people."
3. "Production is determined by the free-market."
4. "The free-market is made up of production."
5. "Government is determined by the free-market."
### Key Observations
* **Circular Logic:** The statements create a recursive loop of definitions. For example, "The free-market is made up of production," while "Production is determined by the free-market."
* **Causal Chain:** The text attempts to establish a hierarchy of influence. It moves from the individual ("The people") to the system ("The government") and the economic engine ("The free-market").
* **Structural Symmetry:** The statements are balanced in their syntax, using "is made up of" and "is determined by" to define the relationships between the entities.
### Interpretation
This text presents a cynical or realist critique of political economy, likely intended to illustrate the concept of **economic determinism** or **corporatocracy**.
* **The Democratic Ideal vs. Reality:** The first two lines establish a standard democratic premise: the people determine production, and the government is composed of the people. This sets up an expectation of popular sovereignty.
* **The Economic Interruption:** Lines 3 and 4 shift the focus to the "free-market," defining it as the primary driver of production and vice versa. This creates a closed loop where the market dictates its own output.
* **The Conclusion:** The final line, "Government is determined by the free-market," acts as the synthesis of the argument. It effectively negates the democratic ideal established in the first two lines. By placing the "free-market" as the ultimate determinant of the government, the text argues that while the government is *composed* of people, it is *controlled* or *determined* by economic forces rather than the will of the populace.
In a Peircean sense, this is an argument by abduction: it observes the state of the world (government actions) and posits the most likely cause (the free-market) rather than the stated cause (the people). It is a diagrammatic representation of the belief that economic power supersedes political power.
</details>
| |
| Q: | What is produced is determined by the people. Select from A, B, and C. (A) True (B)False (C)Insufficient Information? |
| Answer: | A |
| Reasoning: | Line 1 states that the people determine what is produced. Line 2 states that the government is made up of the people. Therefore, the people determine what is produced. This is a syllogism. Thus, this statement is true. |
| Logical Reasoning Skill: | Deductive |
| Required capability: | OCR |
Table 11: Three samples requiring numerical logical reasoning skills (Case A).
| (Case A) | |
| --- | --- |
|
<details>
<summary>extracted/5714025/figures/Appendix/num1.png Details</summary>
### Visual Description
## Data Table: Share Price and Dividend Index
### Overview
The image displays two financial data tables stacked vertically. The top table, titled "Share Price Index," provides current market data for five companies, including share prices, daily percentage changes, and 12-month price ranges. The bottom table, titled "Dividend Index," details the interim and final dividend payments per share for the same five companies. A note at the bottom clarifies the calculation method for total annual dividends.
### Components/Axes
**Table 1: Share Price Index**
* **Columns:**
* **Company:** The name of the entity.
* **Today's Price (€):** The current share price in Euros.
* **Change from previous day (%):** The percentage fluctuation in share price.
* **Past 12 months:** A sub-header containing two columns:
* **Max price (€):** The highest price reached in the last year.
* **Min price (€):** The lowest price reached in the last year.
* **Rows:** Huver Co., Drebs Ltd, Fevs Plc, Fauvers, Steapars.
**Table 2: Dividend Index**
* **Columns:**
* **Dividend paid per share (€):** The row header.
* **Company Names:** Huver Co., Drebs Ltd, Fevs Plc, Fauvers, Steapars.
* **Rows:**
* **Interim Dividend:** The dividend paid mid-year.
* **Final Dividend:** The dividend paid at the end of the year.
**Footer:**
* **Note:** "the total annual dividend paid per share is the sum of the interim dividend and the final dividend."
---
### Detailed Analysis
#### Table 1: Share Price Index
| Company | Today's Price (€) | Change from previous day (%) | Max price (€) | Min price (€) |
| :--- | :--- | :--- | :--- | :--- |
| **Huver Co.** | 1,150 | 1.10 | 1,360 | 860 |
| **Drebs Ltd** | 18 | 0.50 | 22 | 11 |
| **Fevs Plc** | 1,586 | -9.00 (Red text) | 1,955 | 1,242 |
| **Fauvers** | 507 | -1.00 (Red text) | 724 | 464 |
| **Steapars** | 2,537 | 1.00 | 2,630 | 2,216 |
#### Table 2: Dividend Index
| Dividend paid per share (€) | Huver Co. | Drebs Ltd | Fevs Plc | Fauvers | Steapars |
| :--- | :--- | :--- | :--- | :--- | :--- |
| **Interim Dividend** | 0.83 | 0.44 | 0.34 | 0.09 | 0.48 |
| **Final Dividend** | 1.75 | 1.12 | 1.25 | 0.32 | 0.96 |
---
### Key Observations
* **Market Volatility:** Fevs Plc shows a significant negative change of -9.00% in its share price, which is the most substantial movement among the listed companies.
* **Price Range:** Steapars has the highest share price (2,537) and also the highest minimum price (2,216) over the past 12 months, suggesting high stability or a high-value stock. Drebs Ltd has the lowest share price (18).
* **Dividend Consistency:** Across all five companies, the "Final Dividend" is consistently higher than the "Interim Dividend."
* **Formatting:** Negative percentage changes in the "Share Price Index" table are indicated in red text to highlight the decline.
### Interpretation
* **Corporate Financial Strategy:** The data suggests a uniform corporate policy across these entities where the majority of dividend distribution occurs at the end of the fiscal year (Final Dividend) rather than mid-year (Interim Dividend).
* **Market Sentiment:** The sharp -9.00% drop for Fevs Plc is an outlier compared to the other companies, which show either positive growth or minor declines. This suggests a specific negative event or market reaction affecting Fevs Plc.
* **Dividend Yield Potential:** While the total annual dividend can be calculated (e.g., Huver Co. pays 2.58 total, while Fauvers pays 0.41 total), the data does not explicitly state the dividend yield percentage. However, the disparity between the high share price of Steapars and its relatively modest dividend suggests it may be a growth-oriented stock rather than a high-yield income stock.
</details>
| |
| Q: | Which share had the largest difference between the highest and lowest price over the last 12 months? Select from A, B, C, D and E. (A) Huver Co. (B) Drebs Ltd (C) Fevs Plc (D) Fauvers (E) Steapars |
| Answer: | C |
| Reasoning: | Step 1- Calculate the difference between the maximum and the minimum prices. Huver Co. = 1,360 - 860 = 500 Drebs Ltd = 22 - 11 = 11 Fevs Plc = 1,955 - 1,242 = 713 Fauvers = 724 - 464 = 260 Steapars = 2,630 - 2,216 = 414. Tip: Notice the wording of the question is asking for the share with the largest absolute change in price, NOT the largest percentage change, which would have been Drebs Ltd. If the question had wanted the percentage change it would have used the word percentage. Thus the correct answer is (C) Fevs Plc |
| Logical Reasoning Skill: | Numerical |
| Required capability: | OCR |
Table 12: Three samples requiring numerical logical reasoning skills (Case B).
| (Case B) | |
| --- | --- |
|
<details>
<summary>extracted/5714025/figures/Appendix/num2.png Details</summary>
### Visual Description
## Stacked Bar Chart: Reyes Heslop Consulting Profits
### Overview
The image displays a stacked bar chart illustrating the profit distribution for "Reyes Heslop Consulting" across five distinct industry sectors. The data is segmented by three geographic regions: Pacific Rim, American, and European. The values are expressed in millions of pounds (£).
### Components/Axes
* **Title:** "Reyes Heslop Consulting Profits (£ millions)" located at the top left.
* **X-Axis (Categories):** Five industry sectors listed horizontally: Leisure, Manufacturing, Retail, Government, Utilities.
* **Legend:** Located at the top right, defining the color-coding for the stacked segments:
* **Green:** Pacific Rim
* **Blue:** American
* **Dark Grey:** European
* **Y-Axis:** Implicitly represents profit in £ millions. The values are embedded directly within each colored segment of the bars.
### Detailed Analysis
The following data points are extracted from the chart, organized by sector. The segments are stacked from top to bottom as Pacific Rim (Green), American (Blue), and European (Dark Grey).
| Sector | Pacific Rim (Green) | American (Blue) | European (Dark Grey) | Total Profit (£m) |
| :--- | :--- | :--- | :--- | :--- |
| **Leisure** | 4.6 | 7.4 | 5.2 | 17.2 |
| **Manufacturing** | 6.3 | 7.2 | 5.0 | 18.5 |
| **Retail** | 3.8 | 5.8 | 4.4 | 14.0 |
| **Government** | 3.6 | 5.9 | 4.5 | 14.0 |
| **Utilities** | 6.2 | 5.1 | 3.5 | 14.8 |
**Trend Verification:**
* **Pacific Rim (Green):** Shows high volatility. It peaks in Manufacturing (6.3) and Utilities (6.2), but drops significantly in Government (3.6) and Retail (3.8).
* **American (Blue):** Generally the highest contributor across most sectors. It shows a downward trend from Leisure (7.4) and Manufacturing (7.2) down to Utilities (5.1).
* **European (Dark Grey):** Shows the most stability, generally hovering between 3.5 and 5.2. It is consistently the lowest contributor in three out of five categories (Leisure, Manufacturing, Utilities).
### Key Observations
* **Highest Profit Sector:** Manufacturing is the most profitable sector overall (£18.5m), driven largely by strong performance in the Pacific Rim and American regions.
* **Lowest Profit Sectors:** Retail and Government are tied for the lowest overall profit (£14.0m each).
* **Regional Dominance:**
* The **American** region is the primary profit driver for Leisure, Manufacturing, Retail, and Government.
* The **Pacific Rim** region is the primary profit driver only in the Utilities sector.
* The **European** region never holds the top profit position in any sector.
### Interpretation
The data suggests that Reyes Heslop Consulting is heavily reliant on the American market for the majority of its revenue streams. The American region provides the most consistent performance across all sectors.
The Pacific Rim region exhibits a "bimodal" performance: it is highly successful in industrial/infrastructure-heavy sectors (Manufacturing and Utilities) but underperforms in service/public-sector-heavy areas (Retail and Government). This could indicate a specialization or a specific competitive advantage in the Pacific Rim for industrial consulting.
Conversely, the European region appears to be a steady, secondary contributor. It acts as a "floor" for the company's profits, rarely reaching the highs of the American or Pacific Rim segments, but maintaining a consistent presence. The company might consider investigating why the Pacific Rim underperforms in the Government and Retail sectors compared to the other regions, as this represents a significant gap in their portfolio.
</details>
| |
| Q: | Reyes Heslop had a target for Leisure profits to be a quarter of their total profits. Assuming profits in other areas remain the same, by how much did the Leisure profits miss this target? Select from A, B, C, D and E. (A) 31.8 million (B) 32.4 million (C) 32.7 million (D) 33.2 million (E) 33.4 million |
| Answer: | D |
| Reasoning: | Step 1- Calculate the total Reyes Heslop profits across all areas other than Leisure. (6.3 + 7.2 + 5.0) + (3.8 + 5.8 + 4.4) + (3.6 + 5.9 + 4.5) + (6.2 + 5.1 + 3.5) = 61.3 million. Step 2- This needs to be 1/4 of all profits for the condition to be met. Therefore all profits, across all sectors, would be 61.3 / 75% = 81.7333 million. Step 3- Now we look at the difference between actual and target Leisure profits. Actual = (4.6 + 7.4 + 5.2) = 17.2 Target = (81.7333 - 61.3) = 20.4333 Shortfall = 3.2333 (millions) Thus the correct answer is (D) 33.2 million |
| Logical Reasoning Skill: | Numerical |
| Required capability: | Diagram, OCR |
Table 13: Three samples requiring numerical logical reasoning skills (Case C).
| (Case C) | |
| --- | --- |
|
<details>
<summary>extracted/5714025/figures/Appendix/num3.png Details</summary>
### Visual Description
## Pie Charts: Building Energy Use Comparison (1990 vs. 2000)
### Overview
This image displays two side-by-side pie charts comparing the distribution of building energy consumption in 1990 and 2000. The charts illustrate the percentage breakdown of energy usage across five specific categories: Kitchen, Meeting Rooms, PC Room, Print Room, and Office Space. The total energy consumption for the building decreased over the ten-year period.
### Components/Axes
* **Left Chart Title:** Building Energy Use 1990
* **Total Energy:** 17,000 kWh
* **Right Chart Title:** Building Energy Use 2000
* **Total Energy:** 15,000 kWh
* **Categories (Legend/Labels):**
* Kitchen
* Meeting Rooms
* PC Room
* Print Room
* Office Space
* **Branding:** "AssessmentDay Practice Test Experts" logo located in the bottom right corner.
### Detailed Analysis
The following data represents the percentage share and calculated approximate energy usage (in kWh) for each category.
**1990 Data (Total: 17,000 kWh)**
* **Office Space:** 41% (~6,970 kWh) — Largest segment, positioned at the bottom right of the pie.
* **PC Room:** 20% (~3,400 kWh) — Positioned at the top left.
* **Print Room:** 15% (~2,550 kWh) — Positioned at the bottom left.
* **Kitchen:** 12% (~2,040 kWh) — Positioned at the top center.
* **Meeting Rooms:** 12% (~2,040 kWh) — Positioned at the top right.
**2000 Data (Total: 15,000 kWh)**
* **Office Space:** 39% (~5,850 kWh) — Largest segment, positioned at the bottom right.
* **PC Room:** 21% (~3,150 kWh) — Positioned at the top left.
* **Kitchen:** 14% (~2,100 kWh) — Positioned at the top center.
* **Meeting Rooms:** 14% (~2,100 kWh) — Positioned at the top right.
* **Print Room:** 12% (~1,800 kWh) — Positioned at the bottom left.
### Key Observations
* **Overall Reduction:** The total energy consumption dropped from 17,000 kWh in 1990 to 15,000 kWh in 2000, representing an approximate 11.8% decrease in total energy usage.
* **Office Space Dominance:** While "Office Space" remains the single largest consumer of energy in both years, its share of the total energy pie decreased from 41% to 39%.
* **Shift in Usage:**
* **PC Room:** Increased slightly in percentage share (20% to 21%).
* **Kitchen & Meeting Rooms:** Both categories saw an increase in percentage share (from 12% to 14% each).
* **Print Room:** Saw a notable decrease in percentage share (from 15% to 12%).
### Interpretation
The data demonstrates a clear trend toward increased energy efficiency, as the building's total energy consumption dropped by 2,000 kWh over the decade.
Beyond the raw efficiency gains, the shift in the distribution of energy usage suggests a change in the building's operational nature:
* **Digital Transformation:** The decrease in "Print Room" energy usage (both in percentage and absolute terms) combined with the slight increase in "PC Room" usage suggests a transition toward more digital workflows and less reliance on physical paper documentation.
* **Collaborative/Social Focus:** The increased percentage share for "Kitchen" and "Meeting Rooms" suggests that the building may have been repurposed or utilized more heavily for collaborative work or social interaction, rather than just individual desk-based tasks.
* **Efficiency Gains:** The reduction in "Office Space" energy usage, despite it remaining the largest category, likely points to improvements in lighting, HVAC, or office equipment efficiency over the decade.
</details>
| |
| Q: | Which space experienced the smallest reduction in kWh used between 1990 and 2000? Select from A, B, C, and D. (A) Office Space (B) Print Room (C) Meeting Rooms (D) PC Room |
| Answer: | D |
| Reasoning: | Step 1- Calculate the value of kWh for 1990 and 2000 for each of the rooms. Room 1990 per kWh 2000 per kWh Meeting Rooms 2.04 2.10 Office Space 6.97 5.85 Print Room 2.55 1.80 PC Room 3.40 3.15 Kitchen 2.04 2.10 Step 2- Subtract the kWh for 2000 from that of 1990 for each of the rooms. Room change (1990 - 2000) kWh Meeting Rooms -0.06 Office Space 1.12 Print Room 0.75 PC Room 0.25 Kitchen -0.06 Step 3- Look for the smallest positive value. Negative values represent an increase between 1990 and 2000. Tip- You only need to perform 4 calculations, as two of the rooms have the same values. Thus, the correct answer is (D) PC Room. |
| Logical Reasoning Skill: | Deductive |
| Required capability: | Diagram, OCR |
Table 14: Three samples requiring spatial logical reasoning skills (Case A).
| (Case A) | |
| --- | --- |
|
<details>
<summary>extracted/5714025/figures/Appendix/spat1.png Details</summary>
### Visual Description
## Diagram: Spatial Reasoning Test
### Overview
The image is a spatial reasoning assessment item. It displays a reference 3D object at the top and four potential variations (labeled A, B, C, and D) at the bottom. The task requires the viewer to identify which of the four options represents the reference object after a rotation in 3D space.
### Components
* **Reference Object (Top):** A 3D "T" block, oriented upright.
* **Options (Bottom):** Four distinct panels, labeled "A", "B", "C", and "D", each containing a rotated version of the "T" block.
* **Visual Style:** The diagrams are rendered as simple 3D wireframes with a single shaded face (dark blue) on each object.
### Detailed Analysis
**Reference Object (Top Center)**
* **Structure:** A horizontal rectangular prism (crossbar) sits atop a vertical rectangular prism (stem).
* **Shading:** The top-left corner of the horizontal crossbar is shaded dark blue.
**Option A (Bottom Left)**
* **Orientation:** The "T" is rotated.
* **Shading Position:** The shaded face is located on the "inner" corner where the horizontal crossbar meets the vertical stem.
**Option B (Bottom Right)**
* **Orientation:** The "T" is rotated.
* **Shading Position:** The shaded face is located at the bottom of the vertical stem.
**Option C (Bottom Left, below A)**
* **Orientation:** The "T" is rotated.
* **Shading Position:** The shaded face is located at the bottom-right corner of the horizontal crossbar.
**Option D (Bottom Right, below B)**
* **Orientation:** The "T" is rotated 90 degrees clockwise.
* **Shading Position:** The horizontal crossbar is now positioned on the right side of the stem. The shaded face is located at the top of this crossbar.
### Key Observations
* **Object Constancy:** The geometry of the "T" shape remains constant across all five instances; only the orientation and the position of the shaded face change.
* **Shading Consistency:** The shaded face is always a single square unit of the 3D object.
* **Visual Logic:** The test relies on the viewer's ability to perform mental rotation. For example, if the reference object is rotated 90 degrees clockwise, the top-left corner of the crossbar would move to the top-right corner of the crossbar (which is now vertical).
### Interpretation
This image is a standard psychometric test item designed to evaluate **spatial visualization ability**.
* **The Challenge:** The viewer must mentally manipulate the 3D object to determine which of the four options (A, B, C, or D) is a valid rotation of the reference object.
* **Peircean/Analytical Perspective:** The diagram functions as a signifier of spatial logic. The "T" shape acts as the *representamen*, and the shaded corner acts as a *marker* or *index* to track the object's orientation. By tracking the position of the shaded marker relative to the stem and crossbar, one can deduce the correct rotation.
* **Conclusion:** Based on mental rotation, Option D is the correct transformation of the reference object. When the reference object is rotated 90 degrees clockwise, the crossbar moves to the right, and the shaded top-left corner of the crossbar moves to the top of the now-vertical crossbar, matching the configuration in Option D.
</details>
| |
| Q: | Which figure is a rotation of the object? Select from A, B, C, and D. (A) (B) (C) (D) |
| Answer: | B |
| Reasoning: | The answer is B. |
| Logical Reasoning Skill: | Spatial |
| Required capability: | Diagram |
Table 15: Three samples requiring spatial logical reasoning skills (Case B).
| (Case B) | |
| --- | --- |
|
<details>
<summary>extracted/5714025/figures/Appendix/spat2.png Details</summary>
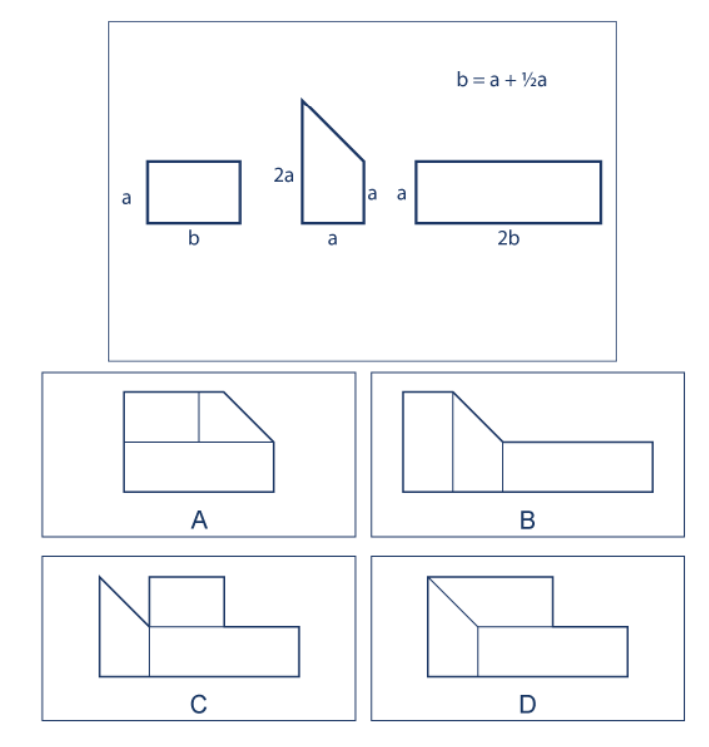
### Visual Description
## Diagram: Geometric Shape Composition Puzzle
### Overview
The image is a geometric logic puzzle consisting of two distinct sections. The top section displays three individual geometric shapes defined by algebraic variables ('a' and 'b') and an equation relating them. The bottom section presents four multiple-choice options (labeled A, B, C, and D), each containing a composite shape formed by combining various geometric elements. The objective is likely to identify which composite shape in the bottom section corresponds to a specific combination or transformation of the shapes provided in the top section.
### Components/Axes
**Top Section (The "Given" Shapes):**
* **Shape 1 (Left):** A rectangle.
* Vertical side labeled: **a**
* Horizontal side labeled: **b**
* **Shape 2 (Middle):** A right trapezoid.
* Left vertical side labeled: **2a**
* Right vertical side labeled: **a**
* Bottom horizontal base labeled: **a**
* **Shape 3 (Right):** A rectangle.
* Vertical side labeled: **a**
* Horizontal side labeled: **2b**
* **Equation (Top Right):** **b = a + ½a** (This indicates that the variable 'b' is equal to 1.5 times 'a').
**Bottom Section (The Options):**
* **Option A:** A composite shape consisting of a rectangular base with a square and a right triangle on top.
* **Option B:** A composite shape consisting of a tall rectangle on the left, a right trapezoid in the middle, and a long rectangle on the right.
* **Option C:** A composite shape consisting of a right triangle on the far left, a square in the middle, and a long rectangle on the right.
* **Option D:** A composite shape consisting of a right trapezoid on the left, a square in the middle, and a long rectangle on the right.
### Detailed Analysis
**Top Section Analysis:**
* The shapes are presented in a horizontal row.
* The equation **b = a + ½a** is positioned in the top-right corner of the top box.
* The trapezoid (Shape 2) can be geometrically decomposed into a square of size **a x a** and a right triangle with a base of **a** and a height of **a** (since the left side is **2a** and the right side is **a**, the difference is **a**).
**Bottom Section Analysis (Options):**
* **Option A:** Features a base rectangle. On top of the base, there is a vertical line dividing the upper section into a square (left) and a right triangle (right).
* **Option B:** Features a tall rectangle on the far left (height **2a**), followed by a right trapezoid, and a long rectangle on the right.
* **Option C:** Features a right triangle on the far left, a square in the middle, and a long rectangle on the right.
* **Option D:** Features a right trapezoid on the far left, a square in the middle, and a long rectangle on the right.
### Key Observations
* **Variable Relationship:** The equation **b = a + ½a** is the key to solving the puzzle. It implies that any length labeled 'b' is 1.5 times the length of 'a'.
* **Visual Consistency:** All shapes in the options (A, B, C, D) are constructed using the same geometric primitives (rectangles, squares, and right triangles) found in the top section.
* **Structural Differences:** The options differ primarily in the arrangement and sequence of these primitives. For example, Option B places the tall rectangle on the far left, whereas Option D places the trapezoid on the far left.
### Interpretation
This image is a standard geometric reasoning test item. The data demonstrates the concept of **geometric decomposition and synthesis**.
* **Mathematical Logic:** The puzzle requires the viewer to understand that complex shapes can be broken down into simpler, fundamental units (rectangles and triangles). By defining the dimensions of these units using variables 'a' and 'b', the puzzle forces the viewer to consider the proportional relationships between the parts.
* **Peircean Investigative Perspective:** The diagram functions as an icon (the shapes look like the objects they represent) and a symbol (the variables 'a' and 'b' represent abstract quantities). The "truth" of the puzzle lies in the spatial arrangement. The viewer must mentally manipulate the top shapes—perhaps rotating, flipping, or aligning them—to match the composite structures in the options. The presence of the equation **b = a + ½a** suggests that the solution may also require verifying that the total width or area of the composite shape matches the sum of the individual parts defined by the variables.
</details>
| |
| Q: | Which figure can be formed with the given piece? Select from A, B, C, and D. (A) (B) (C) (D) |
| Answer: | C |
| Reasoning: | The answer is C. |
| Logical Reasoning Skill: | Spatial |
| Required capability: | Diagram |
Table 16: Three samples requiring spatial logical reasoning skills (Case C).
| (Case C) | |
| --- | --- |
|
<details>
<summary>extracted/5714025/figures/Appendix/spat3.png Details</summary>
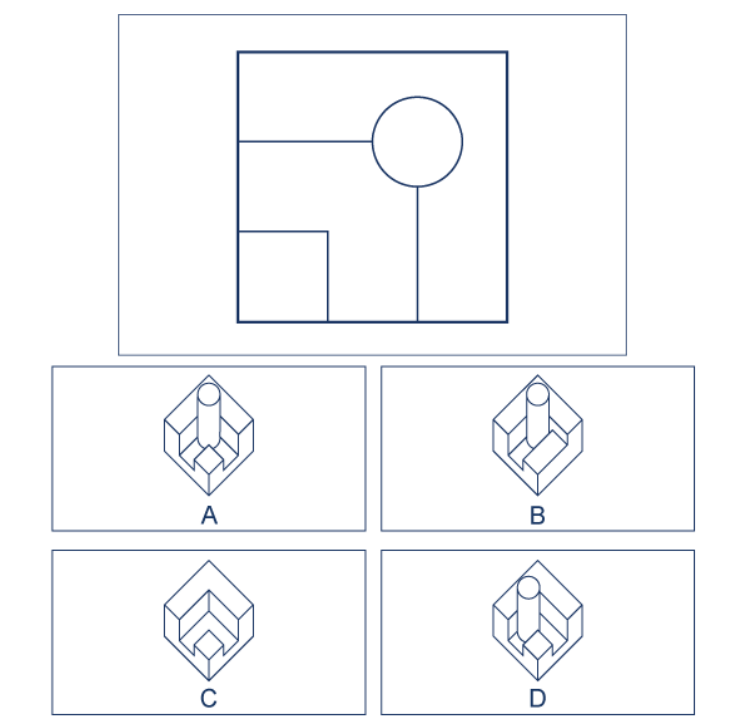
### Visual Description
## Diagram: Spatial Reasoning Test
### Overview
The image presents a spatial reasoning problem, commonly found in psychometric or engineering aptitude tests. The top panel displays a 2D orthographic top-down view of a 3D object. The bottom panel provides four isometric perspective options (labeled A, B, C, and D) to identify the correct 3D representation of the top-down view.
### Components
* **Top View (Reference):** A square outline representing the base of the object.
* **Bottom-left:** A square cutout.
* **Top-right:** A circle.
* **Isometric Views (Options):** Four distinct 3D renderings of a square block.
* **A:** Isometric block with a square cutout at the front corner and a cylinder on the back corner.
* **B:** Isometric block with a square cutout at the front corner and a cylinder inside the cutout.
* **C:** Isometric block with a square cutout at the front corner, with no cylinder.
* **D:** Isometric block with a square cutout at the front corner and a cylinder on the back corner.
### Detailed Analysis
The task requires mapping the 2D top-down view to the correct 3D isometric projection.
* **Top View Analysis:**
* The square boundary defines the footprint.
* The square cutout is located in the bottom-left corner of the 2D view.
* The circle is located in the top-right corner of the 2D view.
* **Isometric Orientation:**
* In the provided isometric views, the "front" corner of the block corresponds to the "bottom" of the top-down view.
* The "back" corner of the block corresponds to the "top" of the top-down view.
* Therefore, the cylinder must be positioned on the back corner of the block, and the cutout must be at the front corner.
* **Option Comparison:**
* **Option A:** Shows the cylinder on the back corner.
* **Option B:** Shows the cylinder inside the front cutout. This contradicts the top-down view where the circle is in the opposite corner from the cutout.
* **Option C:** Shows no cylinder, which contradicts the presence of the circle in the top-down view.
* **Option D:** Shows the cylinder on the back corner.
### Key Observations
* **Ambiguity:** Options A and D appear to be identical in their geometric representation. Both depict a square block with a front-facing square cutout and a cylinder positioned on the back corner.
* **Spatial Logic:** The correct answer must be either A or D, as they are the only options that correctly place the cylinder in the corner opposite the cutout (the back corner), matching the top-down reference.
### Interpretation
This diagram is designed to test **spatial visualization ability**, specifically the capacity to mentally rotate a 2D orthographic projection into a 3D isometric view.
* **The Logic:** By identifying that the "bottom-left" of the 2D view corresponds to the "front" of the 3D view, one can eliminate options B and C immediately.
* **The Anomaly:** The presence of two identical options (A and D) suggests either a printing error in the source material or a test of the observer's ability to identify that multiple options might satisfy the geometric constraints provided. If this were a strict test, the observer would look for minute differences in line weight, perspective, or cylinder height, though none are visually apparent here.
</details>
| |
| Q: | To which object does the given top view correspond? Select from A, B, C, and D. (A) (B) (C) (D) |
| Answer: | A |
| Reasoning: | The answer is A. |
| Logical Reasoning Skill: | Spatial |
| Required capability: | Diagram |
Table 17: Three samples requiring mechanical logical reasoning skills (Case A).
| (Case A) | |
| --- | --- |
|
<details>
<summary>extracted/5714025/figures/Appendix/mech1.png Details</summary>
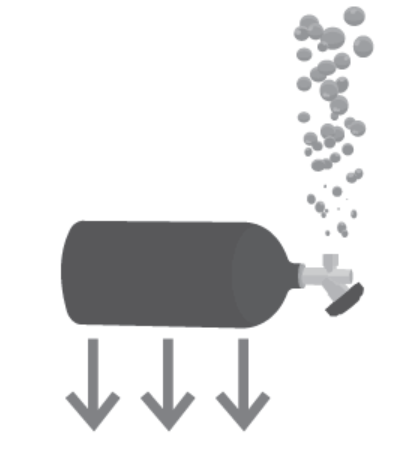
### Visual Description
## Diagram: Schematic Representation of a Pressurized Cylinder
### Overview
The image is a minimalist, monochromatic vector-style diagram depicting a horizontal, dark grey cylindrical tank. The diagram illustrates two distinct physical phenomena simultaneously: the release of gas (represented by rising bubbles) and the application of a downward force (represented by downward-pointing arrows). There is no text or numerical data present in the image.
### Components
* **Cylinder Body:** A solid, dark grey horizontal cylinder representing a pressurized vessel or tank.
* **Valve Assembly:** A stylized nozzle located at the right-hand end of the cylinder, angled slightly downwards.
* **Bubbles:** A cluster of grey, circular shapes of varying sizes, originating from the valve and extending vertically upwards.
* **Force Vectors:** Three identical, grey, downward-pointing arrows positioned directly beneath the main body of the cylinder.
### Detailed Analysis
* **Cylinder Positioning:** The cylinder is the central element, oriented horizontally.
* **Bubble Dynamics (Top-Right):** A stream of bubbles rises vertically from the valve assembly. The bubbles are circular, with sizes ranging from approximately 5% to 15% of the cylinder's diameter. The density of the bubbles is higher near the valve and becomes more sparse as they rise, suggesting a continuous venting or leakage process.
* **Force Vectors (Bottom):** Three arrows are positioned below the cylinder body. They are evenly spaced along the length of the cylinder. These arrows point straight down, indicating a downward force vector, such as gravity or weight.
* **Spatial Relationship:** The diagram creates a visual contrast between the upward movement of the gas (bubbles) and the downward force (arrows) acting upon the object.
### Key Observations
* **Lack of Text:** The diagram relies entirely on visual symbolism; no labels, units, or legends are provided.
* **Visual Contrast:** The diagram juxtaposes an upward-moving phenomenon (gas release) with a downward-moving force (gravity/weight).
* **Stylization:** The image uses a flat, iconographic style, typical of technical manuals or safety signage.
### Interpretation
This diagram likely serves as a conceptual illustration for a technical or safety context involving pressurized gas cylinders.
* **Gas Release/Leakage:** The bubbles clearly indicate that the cylinder is venting gas or leaking. This could represent a decompression event, a safety relief valve opening, or a damaged container.
* **Downward Force:** The arrows pointing downward likely represent the weight of the cylinder (gravity) or a downward force being applied to the object.
* **Synthesis:** The combination of these elements suggests a scenario where a heavy, pressurized object is being acted upon by external forces while simultaneously losing internal pressure. In a practical engineering or safety context, this could be an icon representing "Heavy Pressurized Cylinder" or a warning diagram illustrating the dangers of a leaking tank under load. Without further context, it is a schematic representation of a pressurized vessel undergoing both mass-related force and gas discharge.
</details>
| |
| Q: | A non-pressurised cylindrical metal tank filled with air is submerged underwater. As the air escapes, the tank gradually moves deeper underwater. Which statement provides the best reason for this motion? Select from A, B, C, D, and E. (A) The bubbles provide a downward thrust on the tank (B) The metal increases in density so it gets heavier (C) The bubbles lower the density of the water which lowers its buoyancy (D) Water replaces the air in the tank which makes it heavier (E) Impossible to tell |
| Answer: | D |
| Reasoning: | As air escapes the available space is quickly replaced with water, so the tank’s density becomes the same as that of the water and with the added weight and density of the tank itself continues to sink. |
| Logical Reasoning Skill: | Mechanical |
| Required capability: | Diagram |
Table 18: Three samples requiring mechanical logical reasoning skills (Case B).
| (Case B) | |
| --- | --- |
|
<details>
<summary>extracted/5714025/figures/Appendix/mech2.png Details</summary>
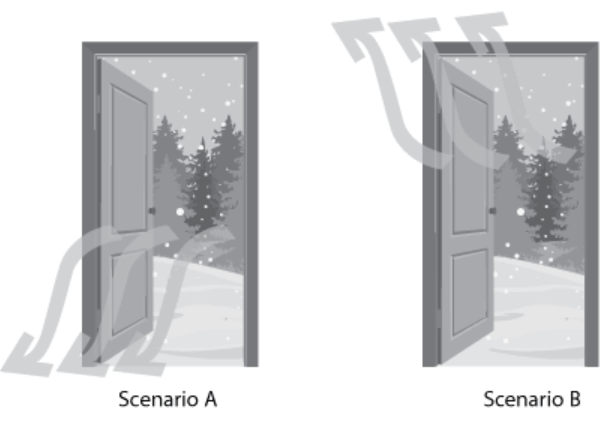
### Visual Description
## Diagram: Airflow Dynamics (Stack Effect)
### Overview
The image consists of two side-by-side illustrations, labeled "Scenario A" and "Scenario B." Both panels depict an identical doorway opening into a cold, snowy, forested environment. The primary purpose of the diagram is to illustrate vector-based airflow patterns (fluid dynamics) through an opening under different pressure or thermal conditions.
### Components
* **Scenario A (Left Panel):**
* **Subject:** A doorway opening into a snowy forest.
* **Visual Indicators:** Three translucent, curved arrows originating from the bottom threshold of the door, pointing downward and outward.
* **Label:** "Scenario A" positioned directly below the doorway.
* **Scenario B (Right Panel):**
* **Subject:** An identical doorway opening into the same snowy forest.
* **Visual Indicators:** Three translucent, curved arrows originating from the top frame of the door, pointing upward and outward.
* **Label:** "Scenario B" positioned directly below the doorway.
### Detailed Analysis
* **Scenario A (Bottom Flow):** The visual data indicates a flow of air exiting the building at the lower portion of the door frame. The arrows are curved, suggesting a laminar or semi-laminar flow pattern moving from the interior threshold toward the exterior.
* **Scenario B (Top Flow):** The visual data indicates a flow of air exiting the building at the upper portion of the door frame. Similar to Scenario A, the arrows are curved, suggesting a flow pattern moving from the interior header toward the exterior.
### Key Observations
* **Symmetry:** The background environment (snowy forest) and the door structure are identical in both scenarios, isolating the airflow vectors as the only variable.
* **Vector Directionality:** The diagrams are mutually exclusive in their flow direction; Scenario A focuses on the bottom of the aperture, while Scenario B focuses on the top.
* **Qualitative Data:** There are no numerical values (e.g., pressure in Pascals, temperature in degrees, or velocity in m/s). The data is purely qualitative, representing directional flow.
### Interpretation
This diagram is a classic representation of the **Stack Effect** (or chimney effect) in building science and thermodynamics.
* **The Physics:** The stack effect is driven by the density difference between warm indoor air and cold outdoor air. Warm air is less dense and rises, while cold air is denser and sinks.
* **Scenario B (The Standard Stack Effect):** This illustrates the typical behavior of a heated building in winter. Warm, buoyant air rises to the top of the building and escapes through upper openings (the top of the door). This creates a negative pressure at the bottom of the building, which draws cold air in.
* **Scenario A (Pressure Differential/Counter-flow):** This illustrates a scenario where air is being forced out at the bottom. This could represent a building under positive pressure (e.g., mechanical ventilation pushing air out) or a specific localized pressure differential where the interior pressure at the floor level exceeds the exterior pressure.
* **Conclusion:** The diagram serves as a comparative tool to demonstrate how air pressure and thermal buoyancy dictate the direction of air movement through building envelopes. It highlights that an opening in a building is rarely neutral; it acts as either an intake or an exhaust depending on the vertical position and the internal/external pressure relationship.
</details>
| |
| Q: | It is a cold winter outside and a well-insulated house has its heater turned on. The front door is opened and cold air rushes in. If the wind speed outside is very low, how would the cold air enter the house? Select from A, B, C, D, and E. (A) Scenario A, the cold air will flow towards the floor (B) Scenario B, the cold air will flow towards the ceiling (C) A combination of A and B (D) The cold air will not enter the house (E) Impossible to tell |
| Answer: | A |
| Reasoning: | Cold air sinks, whereas hot air rises. The house and the air inside it are warmer than the outside air temperature, so if these two systems (house and outside) were to be suddenly connected (door opening) the cold air would sink and the hot air would sit above the cold air until the heat transferred between the two. |
| Logical Reasoning Skill: | Mechanical |
| Required capability: | Diagram |
Table 19: Three samples requiring mechanical logical reasoning skills (Case C).
| (Case C) | |
| --- | --- |
|
<details>
<summary>extracted/5714025/figures/Appendix/mech3.png Details</summary>
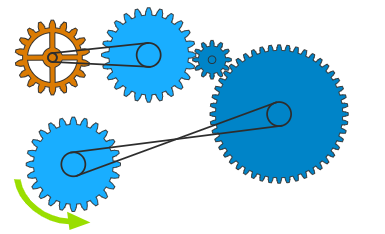
### Visual Description
## [Diagram Type]: Mechanical Gear and Belt Transmission System
### Overview
This image is a technical diagram illustrating a mechanical power transmission system. It consists of five distinct gears (toothed wheels) of varying sizes and colors, interconnected by two belt drives and two direct gear meshes. A green arrow at the bottom-left indicates the input direction of rotation.
### Components/Axes
The system is composed of the following elements, identified by their spatial position and visual characteristics:
* **Gear 1 (Top-Left):** An orange, medium-sized gear with a central pulley.
* **Gear 2 (Top-Middle):** A large, light-blue gear with a central pulley.
* **Gear 3 (Top-Right):** A small, light-blue gear.
* **Gear 4 (Bottom-Right):** A large, dark-blue gear with a central pulley.
* **Gear 5 (Bottom-Left):** A medium-sized, light-blue gear with a central pulley.
* **Belt 1 (Top):** An open belt connecting the central pulley of Gear 1 to the central pulley of Gear 2.
* **Belt 2 (Bottom):** A crossed belt connecting the central pulley of Gear 5 to the central pulley of Gear 4.
* **Rotation Indicator:** A green, curved arrow located at the bottom-left, adjacent to Gear 5.
### Detailed Analysis
The system functions as a kinematic chain. The flow of motion can be traced as follows:
1. **Input:** The system is driven by **Gear 5** (bottom-left). The green arrow indicates a **counter-clockwise (CCW)** rotation.
2. **Belt 2 (Crossed):** Gear 5 is connected to **Gear 4** (bottom-right) via a crossed belt. Because the belt is crossed, the direction of rotation is reversed between the two pulleys.
* *Result:* Gear 4 rotates **clockwise (CW)**.
3. **Mesh 1:** Gear 4 is meshed directly with **Gear 3** (top-right). Meshed gears rotate in opposite directions.
* *Result:* Gear 3 rotates **counter-clockwise (CCW)**.
4. **Mesh 2:** Gear 3 is meshed directly with **Gear 2** (top-middle).
* *Result:* Gear 2 rotates **clockwise (CW)**.
5. **Belt 1 (Open):** Gear 2 is connected to **Gear 1** (top-left) via an open belt. An open belt maintains the direction of rotation between the two pulleys.
* *Result:* Gear 1 rotates **clockwise (CW)**.
### Key Observations
* **Directional Logic:** The system demonstrates how to manipulate rotational direction using different coupling methods. The crossed belt (Belt 2) acts as a direction inverter, while the open belt (Belt 1) acts as a direction transmitter.
* **Mechanical Advantage:** The system utilizes gears of different diameters (e.g., the large Gear 2 vs. the small Gear 3), which implies changes in torque and rotational speed (RPM) throughout the chain.
* **Color Coding:** The color coding (Orange vs. Light Blue vs. Dark Blue) appears to distinguish between different sub-assemblies or perhaps different stages of the transmission, though it does not explicitly denote material properties.
### Interpretation
This diagram serves as a fundamental lesson in mechanical engineering kinematics. It demonstrates the relationship between input and output motion in a complex train.
* **The Crossed Belt Effect:** The most critical component for directional control is the crossed belt between Gear 5 and Gear 4. Without this crossing, the entire system's rotational direction would be inverted.
* **The Meshing Effect:** The two points of contact between Gear 4/3 and Gear 3/2 create a "gear train" that transmits motion across a vertical gap.
* **System Integrity:** The diagram illustrates a closed-loop logic where the input at the bottom-left (Gear 5) dictates the final output at the top-left (Gear 1). If the input (Gear 5) were to stop, the entire chain would lock due to the rigid connections of the meshes and the tension of the belts. This is a classic example of a compound transmission system used to relocate power from one spatial coordinate to another while simultaneously adjusting rotational speed and direction.
</details>
| |
| Q: | In which direction does the orange gear rotate? Select from A, B, and C. (A) Clockwise (B) Counterclockwise (C) No rotation |
| Answer: | A |
| Reasoning: | The correct answer is clockwise. |
| Logical Reasoning Skill: | Mechanical |
| Required capability: | Diagram |
## Appendix B Examples of Different LogicVista Capabilities Data
Table 20: Three samples of diagram, OCR, and mixed LogicVista data (Case A).
| (Case A) | |
| --- | --- |
|
<details>
<summary>extracted/5714025/figures/Appendix/diagramex.png Details</summary>
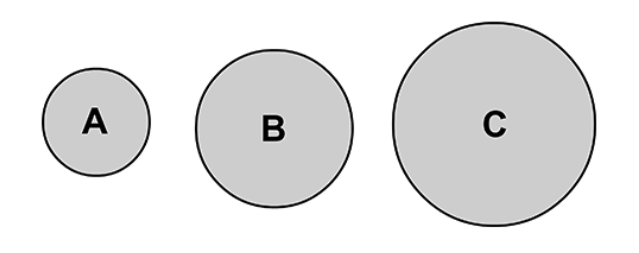
### Visual Description
## Diagram: Relative Magnitude Comparison
### Overview
The image displays three circular shapes arranged horizontally, representing a progression in size. The circles are labeled "A", "B", and "C" respectively, indicating an ordered sequence of increasing magnitude.
### Components
* **Shapes:** Three circles of varying diameters.
* **Labels:** Single uppercase letters ("A", "B", "C") centered within each circle.
* **Styling:** All circles share a uniform light gray fill and a black outline. The labels are rendered in a black, sans-serif typeface.
### Detailed Analysis
The diagram is organized linearly from left to right. There are no numerical axes or legends provided; therefore, the data is qualitative rather than quantitative.
* **Circle A (Left):** This is the smallest circle in the set. It contains the label "A".
* **Circle B (Center):** This circle is larger than Circle A but smaller than Circle C. It contains the label "B".
* **Circle C (Right):** This is the largest circle in the set. It contains the label "C".
**Visual Trend:**
The diameter of the circles increases consistently from left to right. The visual weight and surface area of the shapes grow as the alphabetical label progresses (A < B < C).
### Key Observations
* **Ordered Sequence:** The arrangement implies a hierarchy or a progression (e.g., Small, Medium, Large).
* **Uniformity:** Despite the difference in size, the design elements (color, stroke weight, font style) are consistent across all three components, emphasizing that the only variable being communicated is the size/magnitude.
### Interpretation
This diagram serves as a visual metaphor for relative scale.
* **Data Representation:** It demonstrates a qualitative relationship where "C" represents the highest magnitude and "A" represents the lowest.
* **Contextual Usage:** Such diagrams are commonly used in technical documentation, UI/UX design, or educational materials to illustrate concepts like "Small/Medium/Large" sizing, increasing levels of complexity, or hierarchical importance.
* **Peircean Investigative:** The use of the letters A, B, and C acts as an indexical signifier, mapping the alphabetical order to the physical size. The viewer is conditioned to interpret the left-to-right progression as a logical sequence, suggesting that the diagram is not merely a collection of shapes, but a structured set where the properties of the objects are defined by their position and size relative to one another.
</details>
| |
| Q: | Which ball is the heaviest? Select from A, B, C, and D. (A) A (B) B (C) C (D) CAN NOT SAY |
| Answer: | D |
| Reasoning: | The correct answer is D. |
| Logical Reasoning Skill: | Mechanical |
| Required capability: | Diagram |
Table 21: Three samples of diagram, OCR, and mixed LogicVista data (Case B).
| (Case B) | |
| --- | --- |
|
<details>
<summary>extracted/5714025/figures/Appendix/ocrex.png Details</summary>
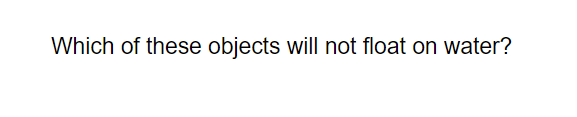
### Visual Description
## Textual Prompt: Educational Question
### Overview
The image consists of a single line of black text centered on a plain white background. It presents an interrogative sentence regarding the physical properties of objects in relation to water.
### Components
* **Text Content:** A single sentence.
* **Visual Elements:** None (no charts, diagrams, or data tables are present).
### Detailed Analysis
The text is transcribed exactly as follows:
"Which of these objects will not float on water?"
### Key Observations
* **Nature of Content:** The image is a standalone question, likely derived from an educational quiz, worksheet, or textbook.
* **Missing Context:** The image is incomplete. It references "these objects," implying that a list, set of images, or a diagram of specific items was intended to accompany this text, but that information is absent from the provided file.
### Interpretation
This text poses a fundamental question regarding **buoyancy** and **density** (Archimedes' principle).
* **Scientific Context:** An object will not float on water (i.e., it will sink) if its average density is greater than the density of water (approximately 1 g/cm³).
* **Analytical Limitation:** Because the specific objects referenced by the word "these" are not provided in the image, it is impossible to determine the answer to the question. To answer this, one would need to evaluate the density of the specific objects in question relative to water.
</details>
| |
| Q: | Select from A, B, C, and D. (A) banana (B) scissors (C) empty plastic soda bottle (D) wooden pencil |
| Answer: | B |
| Reasoning: | The correct answer is B because scissors have metal and are most likely to sink. |
| Logical Reasoning Skill: | Deductive |
| Required capability: | OCR |
Table 22: Three samples of diagram, OCR, and mixed LogicVista data (Case C).
| (Case C) | |
| --- | --- |
|
<details>
<summary>extracted/5714025/figures/Appendix/mixedex.png Details</summary>
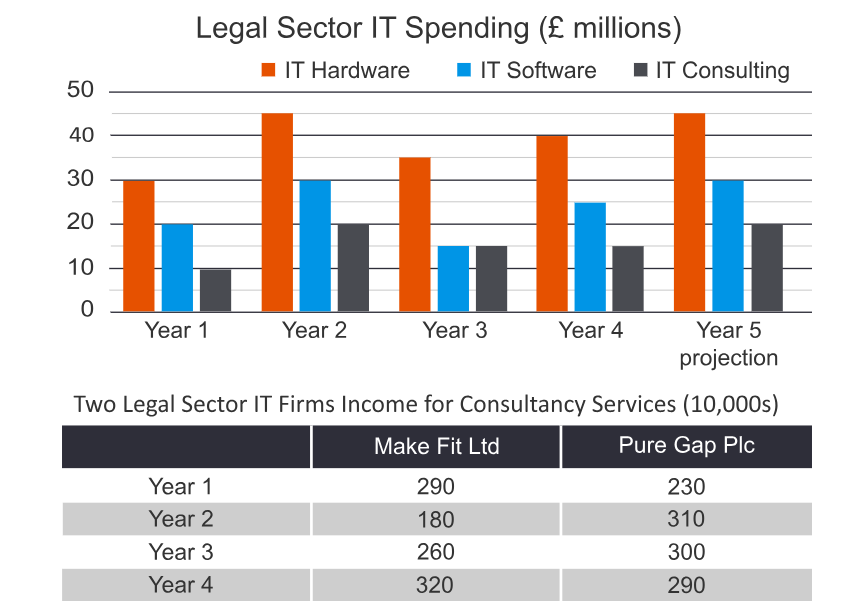
### Visual Description
## Bar Chart and Data Table: Legal Sector IT Spending and Income
### Overview
The image presents two distinct data visualizations regarding the legal sector. The top section is a grouped bar chart illustrating IT spending across three categories (Hardware, Software, Consulting) over a five-year period. The bottom section is a data table comparing the consultancy income of two specific firms, "Make Fit Ltd" and "Pure Gap Plc," over a four-year period.
### Components/Axes
**Top Chart: Legal Sector IT Spending**
* **Title:** Legal Sector IT Spending (£ millions)
* **Y-Axis:** Represents spending in millions of pounds (£), scaled from 0 to 50 in increments of 10.
* **X-Axis:** Represents time, labeled "Year 1" through "Year 5 projection."
* **Legend (Top-Center):**
* **Orange:** IT Hardware
* **Blue:** IT Software
* **Dark Grey:** IT Consulting
**Bottom Table: Two Legal Sector IT Firms Income**
* **Title:** Two Legal Sector IT Firms Income for Consultancy Services (10,000s)
* **Columns:** "Make Fit Ltd" and "Pure Gap Plc"
* **Rows:** Year 1, Year 2, Year 3, Year 4
* **Unit:** The values are in 10,000s.
---
### Detailed Analysis
#### 1. Legal Sector IT Spending (Bar Chart)
*Trend Verification:* Across all categories, spending generally follows a pattern of peaking in Year 2, dipping in Year 3, and recovering toward Year 5.
* **Year 1:**
* IT Hardware (Orange): ~30
* IT Software (Blue): ~20
* IT Consulting (Dark Grey): ~10
* **Year 2:**
* IT Hardware (Orange): ~45
* IT Software (Blue): ~30
* IT Consulting (Dark Grey): ~20
* **Year 3:**
* IT Hardware (Orange): ~35
* IT Software (Blue): ~15
* IT Consulting (Dark Grey): ~15
* **Year 4:**
* IT Hardware (Orange): ~40
* IT Software (Blue): ~25
* IT Consulting (Dark Grey): ~15
* **Year 5 (Projection):**
* IT Hardware (Orange): ~45
* IT Software (Blue): ~30
* IT Consulting (Dark Grey): ~20
#### 2. Consultancy Income Table
| Year | Make Fit Ltd (10,000s) | Make Fit Ltd (Actual) | Pure Gap Plc (10,000s) | Pure Gap Plc (Actual) |
| :--- | :--- | :--- | :--- | :--- |
| Year 1 | 290 | 2,900,000 | 230 | 2,300,000 |
| Year 2 | 180 | 1,800,000 | 310 | 3,100,000 |
| Year 3 | 260 | 2,600,000 | 300 | 3,000,000 |
| Year 4 | 320 | 3,200,000 | 290 | 2,900,000 |
---
### Key Observations
* **Chart Symmetry:** The spending profile for Year 5 (projection) is identical to the actual spending in Year 2.
* **Sector Volatility:** Year 3 represents a local minimum for all three IT spending categories, suggesting a potential market contraction or a cycle of hardware/software refresh that hit a lull.
* **Table Divergence:** The two firms show inverse performance trends. Make Fit Ltd experienced a sharp decline in Year 2, followed by a strong recovery. Conversely, Pure Gap Plc peaked in Year 2 and has experienced a steady, slight decline since.
### Interpretation
The data suggests a cyclical nature to IT spending within the legal sector, with significant fluctuations in hardware and software investment. The "Year 5 projection" indicates an expectation of returning to the high-spending levels seen in Year 2.
Regarding the firm-specific income, there is a clear competitive shift. Make Fit Ltd appears to have recovered from a significant operational or market setback in Year 2, ending Year 4 as the higher-earning firm (320 vs 290). Pure Gap Plc, while initially outperforming Make Fit Ltd in Years 2 and 3, shows a trend of diminishing returns, potentially indicating a loss of market share to competitors like Make Fit Ltd or a general saturation in their specific service niche.
</details>
| |
| Q: | Which of the following statements is false regarding legal sector spending between Year 4 and projected Year 5? Select from A, B, C, D, and E. (A) IT consulting will increase by 35 million. (B) IT consulting will match that of year 2. (C) IT software will exceed IT consulting. (D) Spending on IT hardware will decline. (E) None of these. |
| Answer: | D |
| Reasoning: | Step 1- Check in turn whether each statement is true or false: a) The projected spend on IT consulting is projected to increase by 35 million. Option A is true. b) The projected spend on IT consulting is 320 million, which matches year 2. Option B is true. c) The projected spend on IT software is 330 million and for IT consulting it is 320 million. Option C is true. d) There are increases projected for IT hardware, IT software, and consulting, therefore “spending on IT hardware will decline” is not true. The option for D is false. e) We see that option D is false, so E cannot be the correct answer. Thus the correct answer is (D) Spending on IT hardware, software, and consulting is projected to decline. |
| Logical Reasoning Skill: | Numerical |
| Required capability: | Diagram, OCR |