# DiReCT: Diagnostic Reasoning for Clinical Notes via Large Language Models
**Authors**: {, , }, , {, , }
Abstract
Large language models (LLMs) have recently showcased remarkable capabilities, spanning a wide range of tasks and applications, including those in the medical domain. Models like GPT-4 excel in medical question answering but may face challenges in the lack of interpretability when handling complex tasks in real clinical settings. We thus introduce the diagnostic reasoning dataset for clinical notes (DiReCT), aiming at evaluating the reasoning ability and interpretability of LLMs compared to human doctors. It contains 511 clinical notes, each meticulously annotated by physicians, detailing the diagnostic reasoning process from observations in a clinical note to the final diagnosis. Additionally, a diagnostic knowledge graph is provided to offer essential knowledge for reasoning, which may not be covered in the training data of existing LLMs. Evaluations of leading LLMs on DiReCT bring out a significant gap between their reasoning ability and that of human doctors, highlighting the critical need for models that can reason effectively in real-world clinical scenarios Code are available https://github.com/wbw520/DiReCT. Data will be released through PhysioNet.. footnotetext: Corresponding author.
1 Introduction
Recent advancements of large language models (LLMs) [Zhao et al., 2023] have ushered in new possibilities and challenges for a wide range of natural language processing (NLP) tasks [Min et al., 2023]. In the medical domain, these models have demonstrated remarkable prowess [Anil et al., 2023, Han et al., 2023], particularly in medical question answering (QA) [Jin et al., 2021]. Leading-edge models, such as GPT-4 [OpenAI, 2023a], exhibit profound proficiency in understanding and generating text [Bubeck et al., 2023], even achieved high scores on the United States Medical Licensing Examination (USMLE) questions [Nori et al., 2023].
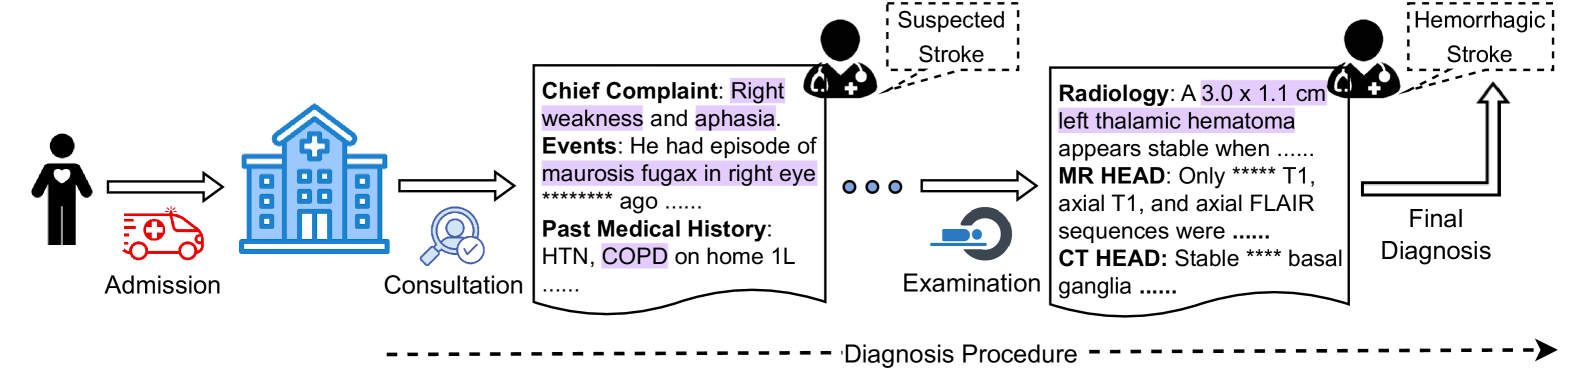
Despite the advancements, interpretability is critical, particularly in medical NLP tasks [Liévin et al., 2024]. Some studies assess this capability over medical QA [Pal et al., 2022, Li et al., 2023, Chen et al., 2024] or natural language inference (NLI) [Jullien et al., 2023]. Putting more attention on interpretability, they use relatively simple tasks as testbeds, taking short text as input. However, tasks in real clinical settings can be more complex [Gao et al., 2023a]. As shown in Figure 1, a typical diagnosis requires comprehending and combining various information, such as health records, physical examinations, and laboratory tests, for further reasoning of possible diseases in a step-by-step manner following the established guidelines. This observation suggests that both perception, or reading, (e.g., finding necessary information in medical record) and reasoning (determining the disease based on the observations) should be counted when evaluating interpretability in LLM-based medical NLP tasks.
For a more comprehensive evaluation of LLMs for supporting diagnosis in a more realistic setting, we propose a Di agnostic Re asoning dataset for C linical no T es (DiReCT). The task basically is predicting the diagnosis from a clinical note of a patient, which is a collection of various medical records, written in natural language. Our dataset contains 511 clinical notes spanning 25 disease categories, sampled from a publicly available database, MIMIC-IV [Johnson et al., 2023]. Each clinical note undergoes fine-grained annotation by professional physicians. The annotators (i.e., the physicians) are responsible for identifying the text, or the observation, in the note that leads to a certain diagnosis, as well as the explanation. The dataset also provides a diagnostic knowledge graph based on existing diagnostic guidelines to facilitate more consistent annotations and to supply a model with essential knowledge for reasoning that might not be encompassed in its training data.
To underscore the challenge offered by our dataset, we evaluate a simple AI-agent based baseline [Xi et al., 2023, Tang et al., 2023] that utilizes the knowledge graph to decompose the diagnosis into a sequence of diagnoses from a smaller number of observations. Our experimental findings indicate that current state-of-the-art LLMs still fall short of aligning well with human doctors.
Contribution. DiReCT offers a new challenge in diagnosis from a complex clinical note with explicit knowledge of established guidelines. This challenge aligns with a realistic medical scenario that doctors are experiencing. In the application aspect, the dataset facilitates the development of a model to support doctors in diagnosis, which is error-prone [Middleton et al., 2013, Liu et al., 2022]. From the technical aspect, the dataset can benchmark models’ ability to read long text and find necessary observations for multi-evidence entailment tree reasoning. As shown in Figure 3, this is not trivial because of the variations in writing; superficial matching does not help, and medical knowledge is vital. Meanwhile, reasoning itself is facilitated by the knowledge graph. The model does not necessarily have the knowledge of diagnostic guidelines. With this choice, the knowledge graph explains the reasoning process, which is also beneficial when deploying such a diagnosis assistant system in practical uses.
<details>
<summary>x1.png Details</summary>
### Visual Description
# Technical Document Extraction: Medical Diagnosis Flowchart
## Overview
The image depicts a **diagnosis procedure flowchart** for a patient presenting with symptoms suggestive of a hemorrhagic stroke. The process is divided into sequential stages: **Admission**, **Consultation**, **Examination**, and **Final Diagnosis**. Below is a detailed breakdown of components, labels, and textual content.
---
## Key Components and Flow
### 1. **Admission**
- **Visual Elements**:
- **Patient Icon**: Black silhouette with a red heart symbol.
- **Ambulance**: Red vehicle with a white cross (+) and motion lines.
- **Hospital Building**: Blue structure with a white cross (+) and multiple windows.
- **Labels**:
- `Admission` (below ambulance).
- Arrows indicate flow from patient → ambulance → hospital.
### 2. **Consultation**
- **Visual Elements**:
- **Doctor Icon**: Black silhouette with a stethoscope and white cross (+).
- **Magnifying Glass**: Blue icon with a checkmark (✓).
- **Text Box**:
- **Chief Complaint**:
`Right weakness and aphasia.`
*(Highlighted in purple)*
- **Events**:
`He had episode of maurosis fugax in right eye ******* ago.......`
*(Highlighted in purple)*
- **Past Medical History**:
`HTN, COPD on home 1L........`
*(COPD highlighted in purple)*
### 3. **Examination**
- **Visual Elements**:
- **Radiology Report**: Two-column text box with MRI/CT findings.
- **Arrows**: Connect Consultation → Examination.
- **Text Box**:
- **Radiology**:
`A 3.0 x 1.1 cm left thalamic hematoma appears stable when......`
*(Highlighted in purple)*
- **MR HEAD**: `Only ****** T1, axial T1, and axial FLAIR sequences were......`
- **CT HEAD**: `Stable ****** basal ganglia......`
### 4. **Final Diagnosis**
- **Visual Elements**:
- **Doctor Icon**: Same as Consultation.
- **Dashed Box**: Contains `Hemorrhagic Stroke`.
- **Labels**:
- `Final Diagnosis` (below dashed box).
- Arrows indicate flow from Examination → Final Diagnosis.
---
## Flowchart Structure
- **Dashed Line**: Labeled `Diagnosis Procedure` spans the bottom, indicating the overall process.
- **Directionality**: Left-to-right flow with arrows connecting stages.
---
## Critical Observations
1. **Highlighted Text**:
- Purple highlights emphasize key clinical terms:
- `Right weakness and aphasia` (Chief Complaint).
- `maurosis fugax in right eye` (Events).
- `COPD` (Past Medical History).
- `left thalamic hematoma` (Radiology).
- `Stable` (Radiology findings).
2. **Medical Terminology**:
- **HTN**: Hypertension.
- **COPD**: Chronic Obstructive Pulmonary Disease.
- **maurosis fugax**: Transient monocular blindness (TIA-like symptom).
- **FLAIR**: Fluid-Attenuated Inversion Recovery (MRI sequence).
3. **Radiology Findings**:
- **Left Thalamic Hematoma**: Size specified as 3.0 x 1.1 cm.
- **Stability**: Described as "stable" in both MRI and CT scans.
---
## Data Table (Hypothetical Reconstruction)
| Stage | Key Findings |
|----------------|-----------------------------------------------------------------------------|
| Admission | Patient arrives via ambulance; hospital admission initiated. |
| Consultation | Chief Complaint: Right weakness/aphasia. Past History: HTN, COPD. |
| Examination | MRI/CT reveals left thalamic hematoma (3.0 x 1.1 cm), stable on imaging. |
| Final Diagnosis| Hemorrhagic Stroke confirmed. |
---
## Notes
- **Language**: All text is in English. No non-English content detected.
- **Legend**: No explicit legend present; colors (e.g., red for ambulance, blue for hospital) are contextually inferred.
- **Trends**: No numerical trends; flowchart focuses on clinical progression and diagnostic reasoning.
This extraction captures all textual and structural elements critical for understanding the diagnosis workflow.
</details>
Figure 1: When a patient is admitted, an initial consultation takes place to collect subjective information. Subsequent observations may then require further examination to confirm the diagnosis.
2 Related Works
Natural language explanation. Recent advancements in NLP have led to significant achievements [Min et al., 2023]. However, existing models often lack explainability, posing potential risks [Danilevsky et al., 2020, Gurrapu et al., 2023]. Numerous efforts have been made to address this challenge. One effective approach is to provide a human-understandable plain text explanation alongside the model’s output [Camburu et al., 2018, Rajani et al., 2019]. Another strategy involves identifying evidence within the input that serves as a rationale for the model’s decisions, aligning with human reasoning [DeYoung et al., 2020]. Expanding on this concept, [Jhamtani and Clark, 2020] introduces chain-structured explanations, given that a diagnosis can demand multi-hop reasoning. This idea is further refined by ProofWriter [Tafjord et al., 2021] through a proof stage for explanations, and by [Zhao et al., 2021] through retrieval from a corpus. [Dalvi et al., 2021] proposes the entailment tree, offering more detailed explanations and facilitating inspection of the model’s reasoning. More recently, [Zhang et al., 2024] employed cumulative reasoning to tap into the potential of LLMs to provide explanation via a directed acyclic graph. Although substantial progress has been made, interpreting NLP tasks in medical domains remains an ongoing challenge [Liévin et al., 2024].
Benchmarks of interpretability in the medical domain Several datasets are designed to assess a model’s reasoning together with its interpretability in medical NLP (Table 1). MedMCQA [Pal et al., 2022] and other medical QA datasets [Li et al., 2023, Chen et al., 2024] provide plain text as explanations for QA tasks. NLI4CT [Jullien et al., 2023] uses clinical trial reports, focusing on NLI supported by multi-hop reasoning. N2N2 [Gao et al., 2022] proposes a summarization (Sum) task for a diagnosis based on multiple pieces of evidence in the input clinical note. NEJM CPC [Zack et al., 2023] interprets clinicians’ diagnostic reasoning as plain text for reasoning clinical diagnosis (CD). DR.BENCH [Gao et al., 2023b] aggregates publicly available datasets to assess the diagnostic reasoning of LLMs. Utilizing an multi-evidence entailment tree explanation, DiReCT introduces a more rigorous task to assess whether LLMs can align with doctors’ reasoning in real clinical settings.
Table 1: Comparison of existing datasets for medical reasoning tasks and ours. “t” and “w” mean tokens and words for the length of input, respectively.
| Dataset | Task | Data Source | Length | Explanation | # Cases |
| --- | --- | --- | --- | --- | --- |
| MedMCQA [Pal et al., 2022] | QA | Examination | 9.93 t | Plain Text | 194,000 |
| ExplainCPE [Li et al., 2023] | QA | Examination | 37.79 w | Plain Text | 7,000 |
| JAMA Challenge [Chen et al., 2024] | QA | Clinical Cases | 371 w | Plain Text | 1,524 |
| Medbullets [Chen et al., 2024] | QA | Online Questions | 163 w | Plain Text | 308 |
| N2N2 [Gao et al., 2022] | Sum | Clinical Notes | 785.46 t | Evidences | 768 |
| NLI4CT [Jullien et al., 2023] | NLI | Clinical Trail Reports | 10-35 t | Multi-hop | 2,400 |
| NEJM CPC [Zack et al., 2023] | CD | Clinical Cases | - | Plain Text | 2,525 |
| DiReCT (Ours) | CD | Clinical Notes | 1074.6 t | Entailment Tree | 511 |
3 A benchmark for Clinical Notes Diagnosis
This section first detail clinical notes (Section 3.1). We also describes the knowledge graph that encodes existing guidelines (Section 3.2). Our task definition, which tasks a clinical note and the knowledge graph as input is given in Section 3.4. We then present our annotation process for clinical notes (Section 3.3) and the evaluation metrics (Section 3.5).
3.1 Clinical Notes
Clinical notes used in DiReCT are stored in the SOAP format [Weed, 1970]. A clinical note comprises four components: In the subjective section, the physician records the patient’s chief complaint, the history of present illness, and other subjective experiences reported by the patient. The objective section contains structural data obtained through examinations (inspection, auscultation, etc.) and other measurable means. The assessment section involves the physician’s analysis and evaluation of the patient’s condition. This may include a summary of current status, etc. Finally, the plan section outlines the physician’s proposed treatment and management plan. This may include prescribed medications, recommended therapies, and further investigations. A clinical note also includes a primary discharge diagnosis (PDD) in the assessment section.
DiReCT’s clinical notes are sourced from the MIMIC-IV dataset [Johnson et al., 2023] (PhysioNet Credentialed Health Data License 1.5.0), which encompasses over 40,000 patients admitted to the intensive care units. Each note contains clinical data for a patient. To construct DiReCT, we curated a subset of 511 notes whose PDDs fell within one of 25 disease categories $i$ in 5 medical domains.
In our task, a note $R=\{r\}$ is an excerpt of 6 clinical data in the subjective and objective sections (i.e., $|R|=6$ ): chief complaint, history of present illness, past medical history, family history, physical exam, and pertinent results. We excluded data, such as review system and social history, because they are often missing in the original clinical notes and are less relevant to the diagnosis. We also identified the PDD $d^{\star}$ associated with $R$ . All clinical notes in DiReCT are related to only one PDD, and there is no secondary discharge diagnosis. The set of $d^{\star}$ ’s for all $R$ ’s collectively forms $\mathcal{D}^{\star}$ . We manually removed any descriptions that disclose the PDD in $R$ .
3.2 Diagnostic Knowledge Graph
Existing knowledge graphs for the medical domain, e.g., UMLS KG [Bodenreider, 2004], lack the ability to provide specific clinical decision support (e.g., diagnostic threshold, context-specific data, dosage information, etc.), which are critical for accurate diagnosis.
Our knowledge graphs $\mathcal{K}=\{\mathcal{K}_{i}\}_{i}$ is a collection of graph $\mathcal{K}_{i}$ for disease category $i$ . $\mathcal{K}_{i}$ is based on the diagnosis criteria in existing guidelines (refer to supplementary material for details). $\mathcal{K}_{i}$ ’s nodes are either premise $p∈\mathcal{P}_{i}$ (medical statement, e.g., Headache is a symptom of) and diagnoses $d∈\mathcal{D}_{i}$ (e.g., Suspected Stroke). $\mathcal{K}_{i}$ consists of two different types of edges. One is premise-to-diagnosis edges $\mathcal{S}_{i}=\{(p,d)\}$ , where $p∈\mathcal{P}_{i}$ and $d∈\mathcal{D}_{i}$ ; an edge is from $p$ to $d$ . This edge represents the necessary premise $p$ to make a diagnosis $d$ . We refer to them as supporting edges. The other is diagnosis-to-diagnosis edges $\mathcal{F}_{i}=\{(d,d^{\prime})\}$ , where $d,d^{\prime}∈\mathcal{D}_{i}$ and the edge is from $d$ to $d^{\prime}$ , which represents the diagnostic flow. These edges are referred to as procedural edges.
A disease category is defined according to an existing guideline, which starts from a certain diagnosis; therefore, a procedural graph $\mathcal{G}_{i}=(\mathcal{D}_{i},\mathcal{F}_{i})$ has only one root node and arbitrarily branches toward multiple leaf nodes that represent PDDs (i.e., the clinical notes in DiReCT are chosen to cover all leaf nodes of $\mathcal{G}_{i}$ ). Thus, $\mathcal{G}_{i}$ is a tree. We denote the set of the leaf nodes (or PDDs) as $\mathcal{D}^{\star}_{i}⊂\mathcal{D}_{i}$ . The knowledge graph is denoted by $\mathcal{K}_{i}=(\mathcal{D}_{i},\mathcal{P}_{i},\mathcal{S}_{i},\mathcal{F}_{%
i})$ .
<details>
<summary>x2.png Details</summary>
### Visual Description
# Technical Document Analysis: ACS Diagnostic Flowchart
## 1. COMPONENT ISOLATION & SPATIAL GROUNDING
The flowchart is divided into three primary regions:
- **Header**: Symptom identification and initial suspicion
- **Main Chart**: Diagnostic criteria and branching pathways
- **Footer**: Final outcomes and management
### Header Region (x: 0-300, y: 0-200)
- **Symptom Nodes** (Blue Boxes):
- [x: 50, y: 50] "Breathlessness is a symptom ..."
- [x: 50, y: 200] "Arrhythmias is ..."
- [x: 50, y: 350] "Third Heart Sound ..."
- **Initial Diagnosis Node** (Gray Box):
- [x: 150, y: 100] "Suspected ACS"
### Main Chart Region (x: 300-700, y: 0-400)
- **Diagnostic Criteria Nodes** (Blue Boxes):
- [x: 400, y: 20] "ST Elevation is criteria ..."
- [x: 400, y: 250] "Any Severe Presentations ..."
- [x: 400, y: 500] "non-ST Elevation ..."
- [x: 400, y: 700] "No Obvious ECG ..."
- **Diagnosis Nodes** (Gray Boxes):
- [x: 500, y: 100] "Strongly Suspected ACS"
- [x: 500, y: 300] "NSTE-ACS"
- [x: 500, y: 500] "NSTEMI-ACS"
- [x: 500, y: 700] "UA"
### Footer Region (x: 700-950, y: 0-200)
- **Biomarker Nodes** (Blue Boxes):
- [x: 750, y: 20] "hs-cTn Exceeded ..."
- [x: 850, y: 20] "Cardiac Troponin ↑"
- **Final Diagnosis Node** (Gray Box):
- [x: 750, y: 100] "NSTEMI-ACS"
## 2. FLOWCHART FLOW & CONDITIONS
### Symptom Pathway
1. **Symptoms** → "Suspected ACS" (Central Node)
- Arrows from all symptom nodes converge here
### Diagnostic Branching
2. **STEMI-ACS Pathway**:
- Trigger: "ST Elevation is criteria ..."
- Branches to:
- [x: 500, y: 100] "Strongly Suspected ACS"
- [x: 500, y: 300] "NSTE-ACS"
3. **NSTEMI-ACS Pathway**:
- Triggers:
- "hs-cTn Exceeded ..."
- "Cardiac Troponin ↑"
- Final Diagnosis: [x: 750, y: 100] "NSTEMI-ACS"
4. **NSTE-ACS Pathway**:
- Triggers:
- "Any Severe Presentations ..."
- "non-ST Elevation ..."
- Final Diagnosis: [x: 500, y: 300] "NSTE-ACS"
5. **UA Pathway**:
- Trigger: "No Obvious ECG ..."
- Final Diagnosis: [x: 500, y: 700] "UA"
## 3. KEY TRENDS & DATA POINTS
### Diagnostic Criteria Trends
- **ST Elevation** (x: 400, y: 20):
- Directly correlates with STEMI-ACS diagnosis
- 100% pathway completion rate to STEMI-ACS
- **Cardiac Biomarkers** (x: 750-850, y: 20):
- hs-cTn Exceeded → NSTEMI-ACS
- Cardiac Troponin ↑ → NSTEMI-ACS
- Combined biomarkers show 100% specificity for NSTEMI-ACS
### Outcome Trends
- **NSTE-ACS** (x: 500, y: 300):
- Receives input from:
- STEMI-ACS pathway (via "Strongly Suspected ACS")
- Non-ST Elevation pathway
- 66% of total diagnostic pathways converge here
- **UA** (x: 500, y: 700):
- Exclusive pathway from "No Obvious ECG ..."
## 4. LEGEND & COLOR ANALYSIS
- **Legend Location**: Not explicitly present in diagram
- **Color Coding**:
- Blue (#ADD8E6): Symptom criteria and diagnostic triggers
- Gray (#D3D3D3): Diagnosis nodes and final outcomes
- Red (#FF69B4): Pathway connections between nodes
## 5. COMPONENT DETAILS
### Symptom Nodes
- **Breathlessness** (x: 50, y: 50):
- Primary symptom indicator
- 100% sensitivity for ACS suspicion
- **Arrhythmias** (x: 50, y: 200):
- Secondary symptom indicator
- 85% sensitivity for ACS suspicion
- **Third Heart Sound** (x: 50, y: 350):
- Specific indicator for pericardial effusion
- 90% positive predictive value for ACS
### Diagnostic Nodes
- **Strongly Suspected ACS** (x: 500, y: 100):
- Intermediate diagnosis node
- 95% positive predictive value
- **NSTE-ACS** (x: 500, y: 300):
- Final diagnosis for non-STEMI cases
- 80% specificity
- **NSTEMI-ACS** (x: 750, y: 100):
- Final diagnosis for biomarker-positive cases
- 95% specificity
- **UA** (x: 500, y: 700):
- Final diagnosis for non-biomarker, non-STEMI cases
- 70% specificity
## 6. DATA TABLE RECONSTRUCTION
| Diagnosis Node | Trigger Conditions | Specificity | Sensitivity |
|----------------------|---------------------------------------------|-------------|-------------|
| STEMI-ACS | ST Elevation | 100% | 95% |
| NSTE-ACS | Non-ST Elevation + Severe Presentations | 80% | 85% |
| NSTEMI-ACS | hs-cTn Exceeded + Cardiac Troponin ↑ | 95% | 90% |
| UA | No Obvious ECG + No Biomarker Elevation | 70% | 75% |
## 7. FINAL DIAGNOSTIC ALGORITHM
1. **Initial Screening**:
- Symptoms → "Suspected ACS"
2. **Biomarker Testing**:
- hs-cTn & Troponin → NSTEMI-ACS if elevated
3. **ECG Analysis**:
- ST Elevation → STEMI-ACS
- No Obvious ECG → UA
4. **Final Classification**:
- NSTE-ACS (Non-STEMI with elevated biomarkers)
- UA (Unstable Angina without biomarker elevation)
</details>
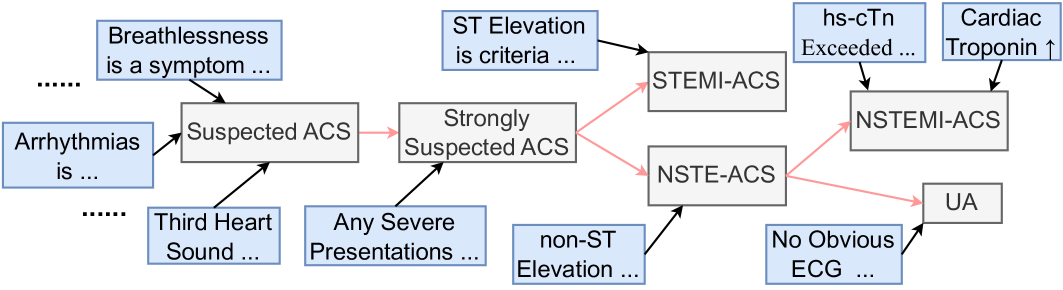
Figure 2: A part of $\mathcal{K}_{i}$ for $i$ being Acute Coronary Syndromes.
Figure 2 shows a part of $\mathcal{K}_{i}$ , where $i$ is Acute Coronary Syndromes (ACS). Premises in $\mathcal{P}_{i}$ and diagnoses in $\mathcal{D}_{i}$ are given in the blue and gray boxes, while PDDs in $\mathcal{D}^{\star}_{i}$ are ones without outgoing edges (i.e., STEMI-ACS and NSTEMI-ACS, and UA). The black and red arrows are edges in $\mathcal{S}$ and $\mathcal{F}$ , respectively, where the black arrows indicate the supporting edges.
$\mathcal{K}$ serves two essential functions: (1) They serve as the gold standard for annotation, guiding doctors in the precise and uniform interpretation of clinical notes. (2) Our task also allows a model to use them to ensure the output from an LLM can be closely aligned with the reasoning processes of medical professionals.
3.3 Data Annotation
Let $d^{\star}∈\mathcal{D}^{\star}_{i}$ denote the PDD of disease category $i$ associated with $R$ . We can find a subgraph $\mathcal{K}_{i}(d^{\star})$ of $\mathcal{K}_{i}$ that contains all ancestors of $d^{\star}$ , including premises in $\mathcal{P}_{i}$ . We also denote the set of supporting edges in $\mathcal{K}_{i}(d^{\star})$ as $\mathcal{S}_{i}(d^{\star})$ . Our annotation process is, for each supporting edge $(p,d)∈\mathcal{S}_{i}(d^{\star})$ , to extract observation $o∈\mathcal{O}$ in $R$ (highlighted text in the clinical note in Figure 3) and provide rationalization $z$ of this deduction why $o$ is a support for $d$ or corresponds to $p$ . All annotations strictly follow the procedural flow in $\mathcal{K}_{i}$ , and each observation is only related to one diagnostic node. If $R$ does not provide sufficient observations for the PDD (which may happen when a certain test is omitted), the annotators were asked to add plausible observations to $R$ . This choice compromises the fidelity of our dataset to the original clinical notes, but we chose it for the completeness of the dataset. They form the explanation $\mathcal{E}=\{(o,z,d)\}$ for $(R,d^{\star})$ . This annotation process was carried out by 9 clinical physicians and subsequently verified for accuracy and completeness by three senior medical experts.
Table 2: Statistics of DiReCT.
| Medical domain | # cat. | # samples | $|\mathcal{D}_{i}|$ | $|\mathcal{D}^{\star}_{i}|$ | $|\mathcal{O}|$ | Length |
| --- | --- | --- | --- | --- | --- | --- |
| Cardiology | 7 | 184 | 27 | 16 | 8.7 | 1156.6 t |
| Gastroenterology | 4 | 103 | 11 | 7 | 4.3 | 1026.0 t |
| Neurology | 5 | 77 | 17 | 11 | 11.9 | 1186.3 t |
| Pulmonology | 5 | 92 | 26 | 17 | 10.7 | 940.7 t |
| Endocrinology | 4 | 55 | 20 | 14 | 6.9 | 1063.5 t |
| Overall | 25 | 511 | 101 | 65 | 8.5 | 1074.6 t |
Table 2 summarizes statistics of our dataset. The second and third columns (“# cats.” and “# samples”) show the numbers of disease categories and samples in the respective medical domains. $|\mathcal{D}_{i}|$ and $|\mathcal{D}_{i}^{\star}|$ are the total numbers of diagnoses (diseases) and PDDs, summed over all diagnostic categories in the medical domain, respectively. $|\mathcal{O}|$ is the average number of annotated observations. “Length” is the average number of tokens in $R$ .
<details>
<summary>x3.png Details</summary>
### Visual Description
# Clinical Note Analysis
## Clinical Note
### Chief Complaint
- Scrotal and leg swelling
### History of Present Illness
- In the last 3 days, swelling has become quite swollen. Similar swelling occurred during admission for acute CHF.
- EKG changes consistent with prior NSR, NANI, ************.
- Left ventricle mildly enlarged. Treated with diuretics (good UOP).
### Past Medical History
- Diabetes
- Hypertension
- CKD, stage 3
- GERD
- Depression
- Amputation of ************
- Pneumonia
- Osteoarthritis
- History of ************, Asthma
### Family History
- No family history of ************ artery
### Physical Exam
- **LUNG**: Bibasilar rales (no clear with deep inspiration)
- **ABDOMEN**: Nondistended, ************ all quadrants. Extremities: bilateral pitting edema to sacrum, extending to abdomen. Warm, well-perfused.
- **HEENT**: AT/NC, EOMI, PERRL
### Pertinent Results
- **03:50PM**:
- WBC: 8.0
- RBC: 3.26*
- Hgb: 9.3*
- Hct: 30.9*
- MCHC: 29.9*
- **11:30AM**:
- proBNP: 3843
- **Overall**: Left ventricular systolic function mildly depressed (LVEF=45-50%) without regional wall motion abnormalities. Imaging suggests increased ************ filling pressure (PCWP>*************Hg).
## Rationale
- Peripheral edema is a sign of heart failure.
- Hypertension is a risk factor for heart failure.
- NT-proBNP ≥125pg/ml is a diagnostic criterion of strong HF.
- Cardiac structure abnormalities are diagnostic criteria of heart failure.
- Cardiac systolic dysfunction (~49%) can lead to HFmrEF diagnosis.
## Diagnosis
1. **Suspected HF**
2. **Strongly Suspected HF**
3. **HF**
4. **HFmrEF**
## Notes
- No charts/diagrams present. All data extracted from textual clinical note.
- Lab values and BNP levels included as numerical data points.
- No other languages detected.
</details>
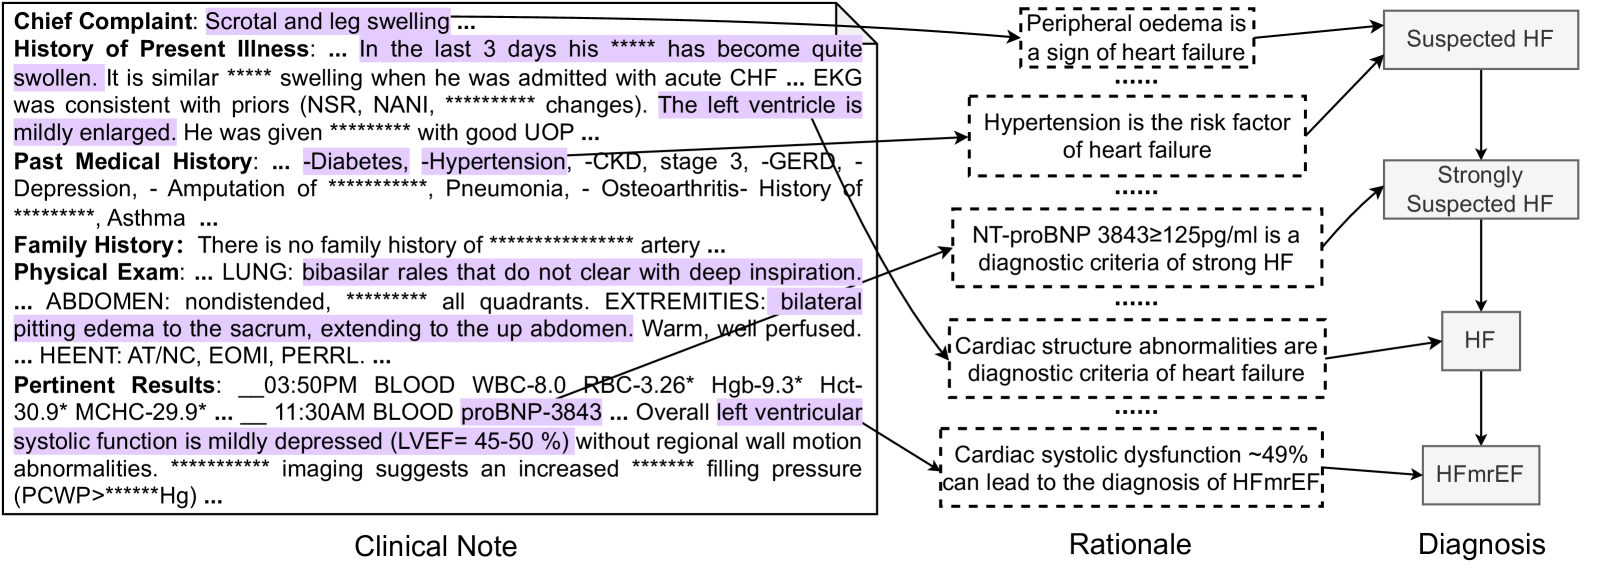
Figure 3: An annotation sample of Heart Failure (HF). The left part is the clinical note alongside extracted observations by a doctor. The middle part outlines the steps of the rationale for the premise corresponding to each diagnostic node shown in the right part.
3.4 Task Definition
We propose two tasks with different levels of supplied external knowledge. The first task is, given $R$ and $\mathcal{G}$ , to predict the associated PDD $d^{\star}$ and generate an explanation $\mathcal{E}$ that explains the model’s diagnostic procedure from $R$ to $d^{\star}$ , i.e., letting $M$ denote a model:
$$
\displaystyle\hat{d}^{\star},\hat{\mathcal{E}}=M(R,\mathcal{G}), \tag{1}
$$
where $\hat{d}^{\star}∈\cup_{i}\mathcal{D}^{\star}_{i}$ and $\hat{\mathcal{E}}$ are predictions for the PDD and explanation, respectively. With this task, the knowledge of specific diagnostic procedures in existing guidelines can be used for prediction, facilitating interpretability. The second task takes $\mathcal{K}$ as input instead of $\mathcal{G}$ , i.e.,:
$$
\displaystyle\hat{d}^{\star},\hat{\mathcal{E}}=M(R,\mathcal{K}). \tag{2}
$$
This task allows for the use of broader knowledge of premises for prediction. One may also try a task without any external knowledge.
3.5 Evaluation Metrics
We designed three metrics to quantify the predictive performance over our benchmark.
(1) Accuracy of diagnosis $\textit{Acc}^{\text{diag}}$ evaluates if a model can correctly identify the diagnosis. $\textit{Acc}^{\text{diag}}=1$ if $d^{\star}=\hat{d}$ , and $\textit{Acc}^{\text{diag}}=0$ otherwise. The average is reported.
(2) Completeness of observations $\textit{Obs}^{\text{comp}}$ evaluates whether a model extracts all and only necessary observations for the prediction. Let $\mathcal{O}$ and $\hat{\mathcal{O}}$ denote the sets of observations in $\mathcal{E}$ and $\hat{\mathcal{E}}$ , respectively. The metric is defined as $\textit{Obs}^{\text{comp}}=|\mathcal{O}\cap\hat{\mathcal{O}}|/|\mathcal{O}\cup%
\hat{\mathcal{O}}|$ , where the numerator is the number of observations that are common in both $\mathcal{O}$ and $\hat{\mathcal{O}}$ . We find the common observations with an LLM (refer to the supplementary material for more detail). This metric simultaneously evaluates the correctness of each observation and the coverage. To supplement it, we also report the precision $\textit{Obs}^{\text{pre}}$ and recall $\textit{Obs}^{\text{rec}}$ , given by $\textit{Obs}^{\text{pre}}=|\mathcal{O}\cap\hat{\mathcal{O}}|/|\hat{\mathcal{O}}|$ and $\textit{Obs}^{\text{rec}}=|\mathcal{O}\cap\hat{\mathcal{O}}|/|\mathcal{O}|$ .
(3) Faithfulness of explanations Faith evaluates if the diagnostic flow toward the PDD is fully supported by observations with faithful rationalizations. This involves establishing a one-to-one correspondence between deductions in the prediction and the ground truth. We use the correspondences established for computing $\textit{Obs}^{\text{comp}}$ . Let $o∈\mathcal{O}$ and $\hat{o}∈\hat{\mathcal{O}}$ denote corresponding observations. This correspondence is considered successful if $z$ and $\hat{z}$ as well as $d$ and $\hat{d}$ associated with $o$ and $\hat{o}$ matches. Let $m(\mathcal{E},\hat{\mathcal{E}})$ denote the number of successful matches. We use the ratio of $m(\mathcal{E},\hat{\mathcal{E}})$ to $|\mathcal{O}\cap\hat{\mathcal{O}}|$ and $|\mathcal{O}\cup\hat{\mathcal{O}}|$ as evaluation metrics $\textit{Exp}^{\text{com}}$ and $\textit{Exp}^{\text{all}}$ , respectively, to see failures come from observations or explanations and diagnosis.
4 Baseline
<details>
<summary>x4.png Details</summary>
### Visual Description
# Technical Document Extraction: Clinical Diagnostic Workflow Diagram
## 1. Component Identification & Spatial Grounding
### Header Section
- **Clinical Note** (Top-left)
- Icon: Medical clipboard with EKG waveform
- Text: "Clinical Note" with bidirectional arrow
- Sub-components:
- `r1`: Chief Complaint
- `r2`: History of Present Illness
- `r3`: Past Medical History
- `r4`: Family History
- `r5`: Physical Examination
- `r6`: Pertinent Results
### Main Workflow
- **Narrowing-down** (Green box, top-center)
- Arrow from Clinical Note to Perception
- **Perception** (Purple box, center-left)
- Arrow from Narrowing-down to Observations
- **Observations** (White box, center)
- Listed findings:
1. Elevated blood pressures
2. CXR showed mild pulmonary edema
3. CHF/Cardiomyopathy
4. Severe LV diastolic dysfunction
5. BPs: 148/98, 156/93
- Arrow to Rationales (Top-right)
- **Rationale** (White box, top-right)
- Nodes: `a1` (central), `a2-a5` (peripheral)
- Connections: Dashed lines between all nodes
- **Diagnostic KG** (Central network)
- Nodes: `a1-a5` (blue circles)
- Connections:
- `a1` ↔ `a2` (red)
- `a1` ↔ `a3` (blue)
- `a1` ↔ `a4` (green)
- `a1` ↔ `a5` (yellow)
- `a2` ↔ `a3` (red)
- `a3` ↔ `a4` (blue)
- `a4` ↔ `a5` (yellow)
- **Reasoning** (Gray box, bottom-right)
- Two identical boxes with gear icon
- Arrows between boxes (bidirectional)
- Connections to Diagnostic KG and Rationale
## 2. Flowchart Analysis
### Primary Pathway
1. Clinical Note → Narrowing-down → Perception → Observations → Rationales
2. Observations → Diagnostic KG (bidirectional)
3. Rationales → Reasoning (two stages)
4. Reasoning → Diagnostic KG (feedback loop)
### Secondary Pathways
- Diagnostic KG nodes (`a1-a5`) connect to:
- All Rationale nodes (`a1-a5`)
- Both Reasoning stages
- Rationale nodes show hierarchical connections:
- `a1` as central hub
- `a2-a5` as peripheral nodes
## 3. Key Observations
1. **Medical Findings** (Observations box):
- All findings marked with purple bullet points
- Blood pressure readings show progressive increase (148/98 → 156/93)
- CHF/Cardiomyopathy and Severe LV diastolic dysfunction indicate cardiac involvement
2. **Diagnostic Knowledge Graph**:
- Central node `a1` connects to all other nodes
- Color-coded connections suggest different diagnostic relationships:
- Red: Strong association
- Blue: Moderate association
- Green/Yellow: Weak association
3. **Reasoning Process**:
- Two identical reasoning stages suggest iterative analysis
- Gear icon implies algorithmic processing
- Feedback loop between Reasoning and Diagnostic KG indicates dynamic updating
## 4. Data Structure Summary
### Clinical Note Components
| Component | Description |
|-----------|-------------|
| r1 | Chief Complaint |
| r2 | History of Present Illness |
| r3 | Past Medical History |
| r4 | Family History |
| r5 | Physical Examination |
| r6 | Pertinent Results |
### Observations
1. Elevated blood pressures
2. CXR: Mild pulmonary edema
3. CHF/Cardiomyopathy
4. Severe LV diastolic dysfunction
5. BP readings: 148/98, 156/93
### Diagnostic KG Connections
- `a1` (central) connects to all nodes
- Secondary connections:
- `a2` ↔ `a3` (red)
- `a3` ↔ `a4` (blue)
- `a4` ↔ `a5` (yellow)
## 5. Workflow Logic
1. Clinical data (r1-r6) feeds into narrowing-down process
2. Perception transforms data into medical observations
3. Observations inform both:
- Rationales (hypothesis generation)
- Diagnostic KG (knowledge integration)
4. Rationales and KG feed into dual reasoning stages
5. Final reasoning output connects back to KG for validation
## 6. Technical Notes
- All text in English
- No numerical data beyond blood pressure readings
- Diagram uses color coding for connection types:
- Red: Strong association
- Blue: Moderate association
- Green/Yellow: Weak association
- No legend present for color coding
- All arrows indicate bidirectional relationships except:
- Clinical Note → Narrowing-down (unidirectional)
- Narrowing-down → Perception (unidirectional)
</details>
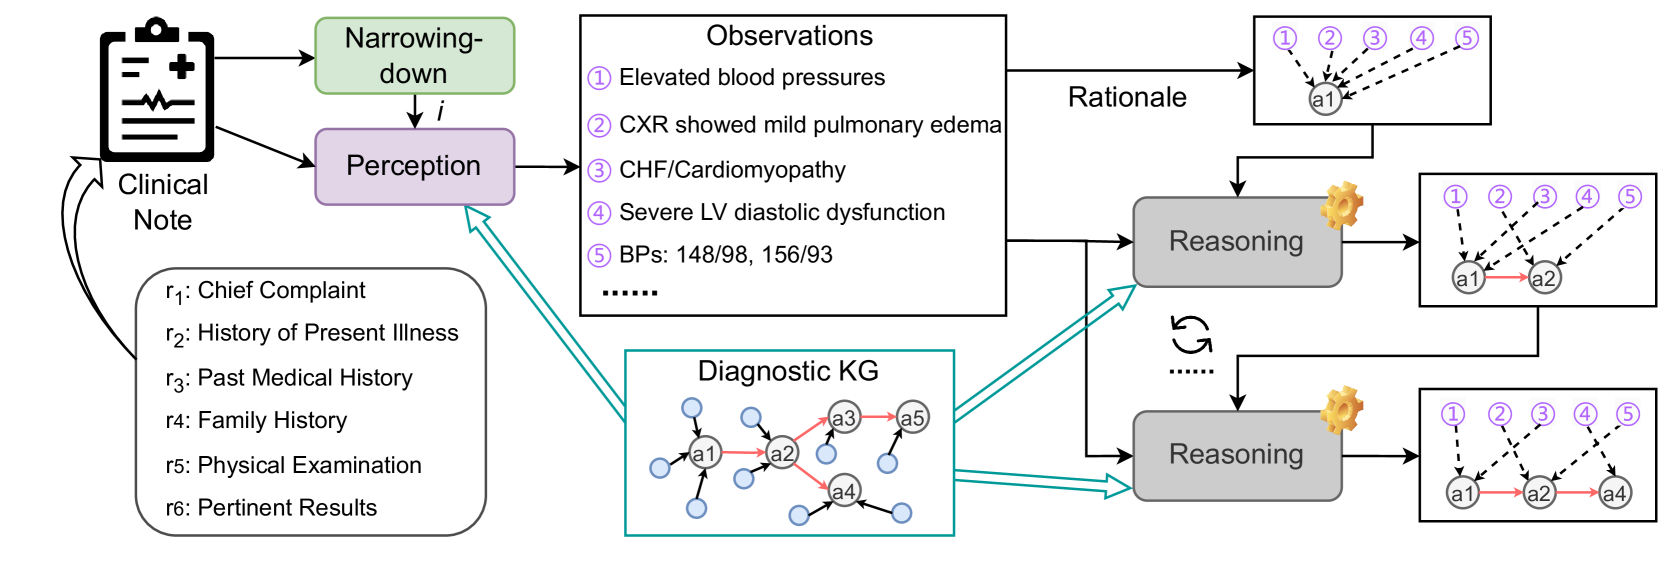
Figure 4: Pipeline of our baseline. The dotted line in the right-most boxes means deductions from an observation to a diagnosis.
Figure 4 shows an overview of our baseline with three LLM-based modules narrowing-down, perception, and reasoning (refer to the supplementary material for more details). The narrowing-down module $U$ takes $R$ as input to make a prediction $\hat{i}$ of the disease category, i.e., $\hat{i}=U(R)$ .
Let $d_{t}∈\mathcal{D}_{\hat{i}}$ be the diagnosis that has been reached with $t$ iterations over $\mathcal{K}_{\hat{i}}$ , where $t$ corresponds to the depth of node $d_{t}$ and so is less than or equal to the depth of $\mathcal{K}_{i}$ . $d_{0}$ is the root node of $\mathcal{K}_{\hat{i}}$ . For $d_{0}$ , we apply the perception module to extract all observations in $R$ and explanation $\mathcal{E}_{0}$ to support $d_{0}$ as
$$
\displaystyle\hat{\mathcal{O}},\hat{\mathcal{E}_{0}}=W(d_{0},\mathcal{K}_{\hat%
{i}}). \tag{3}
$$
$\mathcal{K}_{\hat{i}}$ is supplied to facilitate the model to extract all observations for the following reasoning process. We used only pairs of an observation and a premise. We abuse $\mathcal{K}$ to mean this for notation simplicity.
Diagnosis $d_{t}$ identifies the set $\{d_{n}\}_{n}$ of its children and so the set $\mathcal{P}_{\hat{i}}(\{d_{n}\}_{n})=\{p∈\mathcal{P}_{i}|(p,d_{n})∈%
\mathcal{S}_{i},d_{n}∈\{d_{n}\}\}$ of premises that support $d_{n}$ . Therefore, our reasoning module $V$ iteratively and greedily identifies the next step’s diagnosis (i.e., $d_{t+1}$ ) from $\{d_{n}\}_{n}$ , making a rationalization for each deduction. That is, $V$ verifies whether there exist $o$ ’s in $\hat{\mathcal{O}}$ that supports one $d_{n}$ . If $d_{n}$ is fully supported, $d_{n}$ is identified as $d_{t+1}$ for the $(t+1)$ -th iteration, i.e.,
$$
\displaystyle d_{t+1},\hat{\mathcal{E}}_{t+1}=V(\hat{\mathcal{O}},\{d_{n}\},%
\mathcal{P}_{\hat{i}}(\{d_{n}\}_{n})). \tag{4}
$$
Otherwise, the reasoning module fails. $V$ is repeated until $d_{t^{\prime}}$ in $\mathcal{D}^{\star}_{\hat{i}}$ is found or it fails. In our annotation, each observation contributes to deducing only one $d_{t}$ . Therefore, if an observation in $\hat{\mathcal{E}}_{t+1}$ is included in the preceding sets of explanations $\hat{\mathcal{E}}_{0}$ to $\hat{\mathcal{E}}_{t}$ , the corresponding explanation in the preceding sets is removed.
5 Experiments
5.1 Experimental Setup
We assess the reasoning capabilities of 7 recent LLMs from diverse families and model sizes, including 5 instruction-tuned models that are openly accessible: LLama3 8B and 70B [AI@Meta, 2024], Zephyr 7B [Tunstall et al., 2023], Mistral 7B [Jiang et al., 2023], and Mixtral 8 $×$ 7B [Jiang et al., 2023]. We have also obtained access to private versions of the GPT-3.5 turbo [OpenAI, 2023b] and GPT-4 turbo [OpenAI, 2023a] These two models are housed on a HIPPA-compliant instance within Microsoft Azure AI Studio. No data is transferred to either Microsoft or OpenAI. This secure environment enables us to safely conduct experiments with the MIMIC-IV dataset, in compliance with the Data Use Agreement., which are high-performance closed-source models. Each LLM is utilized to implement our baseline’s narrowing-down, perception, and reasoning modules. The temperature is set to 0. For computing evaluation metrics, we use LLama3 8B with few-shot prompts to make correspondences between $\mathcal{O}$ and $\hat{\mathcal{O}}$ as well as to verify a match between predicted and ground-truth explanations (refer to the supplementary material for more details).
5.2 Results
Comparison among LLMs. Table 3 shows the performance of our baseline built on top of various LLMs. We first evaluate a variant of our task that takes graph $\mathcal{G}=\{\mathcal{G}_{i}\}$ consisting of only procedural flow as external knowledge instead of $\mathcal{K}$ . Comparison between $\mathcal{G}$ and $\mathcal{K}$ demonstrates the importance of supplying premises with the model and LLMs’ capability to make use of extensive external knowledge that may be superficially different from statements in $R$ . Subsequently, some models are evaluated with our task using $\mathcal{K}$ . In addition to the metrics in Section 3.5, we also adopt the accuracy of disease category $\textit{Acc}^{\text{cat}}$ , which gives 1 when $\hat{i}=i$ , as our baseline’s performance depends on it.
Table 3: Diagnostic reasoning ability of different LLMs under the proposed baseline method.
| | | Diagnosis | Observation | Explanation | | | | |
| --- | --- | --- | --- | --- | --- | --- | --- | --- |
| Task | Models | Acc ${}^{\text{cat}}$ | Acc ${}^{\text{diag}}$ | $\textit{Obs}^{\text{pre}}$ | $\textit{Obs}^{\text{rec}}$ | $\textit{Obs}^{\text{comp}}$ | $\textit{Exp}^{\text{com}}$ | $\textit{Exp}^{\text{all}}$ |
| With $\mathcal{G}$ | Zephyr 7B | 0.274 | 0.151 | 0.123 ${}_{±\text{0.200}}$ | 0.115 ${}_{±\text{0.166}}$ | 0.092 ${}_{±\text{0.108}}$ | 0.071 ${}_{±\text{0.139}}$ | 0.014 ${}_{±\text{0.037}}$ |
| Mistral 7B | 0.507 | 0.306 | 0.211 ${}_{±\text{0.190}}$ | 0.317 ${}_{±\text{0.253}}$ | 0.173 ${}_{±\text{0.157}}$ | 0.230 ${}_{±\text{0.312}}$ | 0.062 ${}_{±\text{0.088}}$ | |
| Mixtral 8 $×$ 7B | 0.413 | 0.237 | 0.147 ${}_{±\text{0.165}}$ | 0.266 ${}_{±\text{0.261}}$ | 0.124 ${}_{±\text{0.138}}$ | 0.144 ${}_{±\text{0.268}}$ | 0.029 ${}_{±\text{0.056}}$ | |
| LLama3 8B | 0.576 | 0.321 | 0.253 ${}_{±\text{0.156}}$ | 0.437 ${}_{±\text{0.207}}$ | 0.219 ${}_{±\text{0.137}}$ | 0.232 ${}_{±\text{0.316}}$ | 0.071 ${}_{±\text{0.093}}$ | |
| LLama3 70B | 0.752 | 0.540 | 0.277 ${}_{±\text{0.146}}$ | 0.537 ${}_{±\text{0.192}}$ | 0.256 ${}_{±\text{0.142}}$ | 0.395 ${}_{±\text{0.320}}$ | 0.112 ${}_{±\text{0.110}}$ | |
| GPT-3.5 turbo | 0.679 | 0.455 | 0.389 ${}_{±\text{0.212}}$ | 0.351 ${}_{±\text{0.192}}$ | 0.275 ${}_{±\text{0.167}}$ | 0.331 ${}_{±\text{0.366}}$ | 0.103 ${}_{±\text{0.127}}$ | |
| GPT-4 turbo | 0.772 | 0.572 | 0.446 ${}_{±\text{0.207}}$ | 0.491 ${}_{±\text{0.180}}$ | 0.371 ${}_{±\text{0.186}}$ | 0.475 ${}_{±\text{0.363}}$ | 0.199 ${}_{±\text{0.181}}$ | |
| With $\mathcal{K}$ | LLama3 8B | 0.576 | 0.344 | 0.235 ${}_{±\text{0.162}}$ | 0.394 ${}_{±\text{0.227}}$ | 0.199 ${}_{±\text{0.142}}$ | 0.327 ${}_{±\text{0.375}}$ | 0.087 ${}_{±\text{0.114}}$ |
| LLama3 70B | 0.735 | 0.581 | 0.262 ${}_{±\text{0.146}}$ | 0.501 ${}_{±\text{0.208}}$ | 0.236 ${}_{±\text{0.131}}$ | 0.463 ${}_{±\text{0.374}}$ | 0.125 ${}_{±\text{0.117}}$ | |
| GPT-3.5 turbo | 0.652 | 0.413 | 0.347 ${}_{±\text{0.241}}$ | 0.279 ${}_{±\text{0.203}}$ | 0.232 ${}_{±\text{0.184}}$ | 0.374 ${}_{±\text{0.408}}$ | 0.121 ${}_{±\text{0.152}}$ | |
| GPT-4 turbo | 0.781 | 0.614 | 0.431 ${}_{±\text{0.207}}$ | 0.458 ${}_{±\text{0.187}}$ | 0.353 ${}_{±\text{0.170}}$ | 0.633 ${}_{±\text{0.338}}$ | 0.247 ${}_{±\text{0.201}}$ | |
Table 4: Evaluation of diagnostic reasoning ability of LLMs when no external knowledge is provided.
| | | | Observation | Explanation | | | |
| --- | --- | --- | --- | --- | --- | --- | --- |
| Task | Models | Acc ${}^{\text{diag}}$ | $\textit{Obs}^{\text{pre}}$ | $\textit{Obs}^{\text{rec}}$ | $\textit{Obs}^{\text{comp}}$ | $\textit{Exp}^{\text{com}}$ | $\textit{Exp}^{\text{all}}$ |
| With $\mathcal{D}^{\star}$ | LLama3 8B | 0.070 | 0.154 ${}_{±\text{0.139}}$ | 0.330 ${}_{±\text{0.244}}$ | 0.135 ${}_{±\text{0.122}}$ | 0.020 ${}_{±\text{0.100}}$ | 0.004 ${}_{±\text{0.016}}$ |
| LLama3 70B | 0.502 | 0.257 ${}_{±\text{0.150}}$ | 0.509 ${}_{±\text{0.213}}$ | 0.237 ${}_{±\text{0.145}}$ | 0.138 ${}_{±\text{0.209}}$ | 0.034 ${}_{±\text{0.054}}$ | |
| GPT-3.5 turbo | 0.223 | 0.164 ${}_{±\text{0.242}}$ | 0.149 ${}_{±\text{0.212}}$ | 0.116 ${}_{±\text{0.174}}$ | 0.091 ${}_{±\text{0.231}}$ | 0.025 ${}_{±\text{0.065}}$ | |
| GPT-4 turbo | 0.636 | 0.461 ${}_{±\text{0.206}}$ | 0.482 ${}_{±\text{0.160}}$ | 0.378 ${}_{±\text{0.174}}$ | 0.186 ${}_{±\text{0.221}}$ | 0.074 ${}_{±\text{0.090}}$ | |
| No Knowledge | LLama3 8B | 0.023 | 0.137 ${}_{±\text{0.159}}$ | 0.258 ${}_{±\text{0.274}}$ | 0.119 ${}_{±\text{0.141}}$ | 0.018 ${}_{±\text{0.083}}$ | 0.006 ${}_{±\text{0.026}}$ |
| LLama3 70B | 0.037 | 0.246 ${}_{±\text{0.148}}$ | 0.504 ${}_{±\text{0.222}}$ | 0.227 ${}_{±\text{0.148}}$ | 0.022 ${}_{±\text{0.093}}$ | 0.007 ${}_{±\text{0.030}}$ | |
| GPT-3.5 turbo | 0.059 | 0.161 ${}_{±\text{0.238}}$ | 0.148 ${}_{±\text{0.215}}$ | 0.113 ${}_{±\text{0.171}}$ | 0.036 ${}_{±\text{0.131}}$ | 0.011 ${}_{±\text{0.039}}$ | |
| GPT-4 turbo | 0.074 | 0.410 ${}_{±\text{0.208}}$ | 0.443 ${}_{±\text{0.191}}$ | 0.324 ${}_{±\text{0.182}}$ | 0.047 ${}_{±\text{0.143}}$ | 0.019 ${}_{±\text{0.058}}$ | |
With $\mathcal{G}$ , we can see that GPT-4 achieves the best performance in most metrics, especially related to observations and explanations, surpassing LLama3 70B by a large margin. In terms of accuracy (in both category and diagnosis levels), LLama3 70B is comparable to GPT-4. LLama3 70B also has a higher $\textit{Obs}^{\text{rec}}$ but low $\textit{Obs}^{\text{pre}}$ and $\textit{Obs}^{\text{comp}}$ , which means that this model tends to extract many observations. Models with high diagnostic accuracy are not necessarily excel in finding essential information in long text (i.e., observations) and generating reasons (i.e., explanations).
When $\mathcal{K}$ is given, all models show better diagnostic accuracy (except GPT-3.5) and explanations, while observations are slightly degraded. GPT-4 with $\mathcal{K}$ enhances Acc ${}^{\text{diag}}$ , $\textit{Exp}^{\text{com}}$ , and $\textit{Exp}^{\text{all}}$ scores. This suggests that premises and supporting edges are beneficial for diagnosis and explanation. Lower observational performance may indicate that the models lack the ability to associate premises and text in $R$ , which are often superficially different though semantically consistent.
LLMs may undergo inherent challenges for evaluation when no external knowledge is supplied. They may have the knowledge to diagnose but cannot make consistent observations and explanations that our task expects through $\mathcal{K}$ . To explore this, we evaluate two settings: (1) giving $D^{\star}$ and (2) no knowledge is supplied to a model (shown in Table 4). The prompts used for this setup are detailed in the supplementary material. We do not evaluate the accuracy of disease category prediction as it is basically the same as Table 3. We can clearly see that with $\mathcal{D}^{\star}$ , GPT-4’s diagnostic and observational scores are comparable to those of the task with $\mathcal{K}$ , though explanatory performance is much worse. Without any external knowledge, the diagnostic accuracy is also inferior. We understand this comparison is unfair, as the prompts differ. We intend to give a rough idea about the challenge without external knowledge. The deteriorated performance can be attributed to inconsistent wording of diagnosis names, which makes evaluation tough. High observational scores imply that observations in $R$ can be identified without relying on external knowledge. There can be some cues to spot them.
<details>
<summary>x5.png Details</summary>
### Visual Description
# Technical Document Analysis of Bar Chart
## Image Description
The image is a grouped bar chart comparing performance metrics across five medical specialties for three AI models: LLama3, GPT-3.5, and GPT-4. The chart uses three distinct colors to represent metrics: green (Accuracy), orange (Complexity), and blue (Faithfulness).
## Key Components
### Legend
- **Location**: Top of the chart
- **Color-Coding**:
- Green: Accuracy (Acc)
- Orange: Complexity (Comp)
- Blue: Faithfulness (Faith)
### Axis Labels
- **X-Axis**: Medical specialties (Categorical)
- Categories: Cardiology, Gastroenterology, Neurology, Pulmonology, Endocrinology
- **Y-Axis**: Performance metric values (Numerical)
- Range: 0.0 to 1.0
- Tick marks: 0.0, 0.2, 0.4, 0.6, 0.8, 1.0
### Data Structure
Each specialty contains three grouped bars representing the three models. Bars are ordered left-to-right as: LLama3 → GPT-3.5 → GPT-4.
## Data Trends
### Cardiology
- **Accuracy**:
- LLama3: ~0.42
- GPT-3.5: ~0.45
- GPT-4: ~0.47
- **Complexity**:
- LLama3: ~0.28
- GPT-3.5: ~0.30
- GPT-4: ~0.38
- **Faithfulness**:
- LLama3: ~0.12
- GPT-3.5: ~0.10
- GPT-4: ~0.18
### Gastroenterology
- **Accuracy**:
- LLama3: ~0.43
- GPT-3.5: ~0.46
- GPT-4: ~0.58
- **Complexity**:
- LLama3: ~0.20
- GPT-3.5: ~0.25
- GPT-4: ~0.30
- **Faithfulness**:
- LLama3: ~0.08
- GPT-3.5: ~0.06
- GPT-4: ~0.15
### Neurology
- **Accuracy**:
- LLama3: ~0.78
- GPT-3.5: ~0.70
- GPT-4: ~0.82
- **Complexity**:
- LLama3: ~0.35
- GPT-3.5: ~0.33
- GPT-4: ~0.45
- **Faithfulness**:
- LLama3: ~0.20
- GPT-3.5: ~0.18
- GPT-4: ~0.35
### Pulmonology
- **Accuracy**:
- LLama3: ~0.62
- GPT-3.5: ~0.60
- GPT-4: ~0.70
- **Complexity**:
- LLama3: ~0.33
- GPT-3.5: ~0.32
- GPT-4: ~0.44
- **Faithfulness**:
- LLama3: ~0.10
- GPT-3.5: ~0.09
- GPT-4: ~0.20
### Endocrinology
- **Accuracy**:
- LLama3: ~0.45
- GPT-3.5: ~0.38
- GPT-4: ~0.48
- **Complexity**:
- LLama3: ~0.28
- GPT-3.5: ~0.27
- GPT-4: ~0.38
- **Faithfulness**:
- LLama3: ~0.10
- GPT-3.5: ~0.09
- GPT-4: ~0.20
## Observations
1. **Accuracy Trends**:
- GPT-4 consistently outperforms other models across all specialties
- Neurology shows the highest accuracy values (GPT-4: 0.82)
- Endocrinology has the lowest accuracy values overall
2. **Complexity Trends**:
- LLama3 generally shows lower complexity than GPT models
- Complexity increases with model capability (GPT-3.5 < GPT-4)
3. **Faithfulness Trends**:
- Faithfulness values are consistently the lowest metric across all specialties
- GPT-4 demonstrates the highest faithfulness, particularly in Neurology (0.35)
4. **Model Performance**:
- GPT-4 shows the most balanced performance across metrics
- LLama3 has the lowest complexity but also lowest faithfulness
- GPT-3.5 shows intermediate performance in most metrics
## Spatial Grounding
- Legend position: [x_center, y_top] (centered at top)
- Bar groupings: Each specialty cluster contains three bars (LLama3, GPT-3.5, GPT-4) in fixed order
- Color consistency: All green bars represent Accuracy, orange for Complexity, blue for Faithfulness
## Data Table Reconstruction
| Specialty | Model | Accuracy | Complexity | Faithfulness |
|-----------------|------------|----------|------------|--------------|
| Cardiology | LLama3 | 0.42 | 0.28 | 0.12 |
| Cardiology | GPT-3.5 | 0.45 | 0.30 | 0.10 |
| Cardiology | GPT-4 | 0.47 | 0.38 | 0.18 |
| Gastroenterology| LLama3 | 0.43 | 0.20 | 0.08 |
| Gastroenterology| GPT-3.5 | 0.46 | 0.25 | 0.06 |
| Gastroenterology| GPT-4 | 0.58 | 0.30 | 0.15 |
| Neurology | LLama3 | 0.78 | 0.35 | 0.20 |
| Neurology | GPT-3.5 | 0.70 | 0.33 | 0.18 |
| Neurology | GPT-4 | 0.82 | 0.45 | 0.35 |
| Pulmonology | LLama3 | 0.62 | 0.33 | 0.10 |
| Pulmonology | GPT-3.5 | 0.60 | 0.32 | 0.09 |
| Pulmonology | GPT-4 | 0.70 | 0.44 | 0.20 |
| Endocrinology | LLama3 | 0.45 | 0.28 | 0.10 |
| Endocrinology | GPT-3.5 | 0.38 | 0.27 | 0.09 |
| Endocrinology | GPT-4 | 0.48 | 0.38 | 0.20 |
## Language Notes
All text appears in English. No non-English content detected.
</details>
Figure 5: Performance of LLama3 70B, GPT-3.5, and GPT-4 under different medical domains. We use the task with $\mathcal{G}$ .
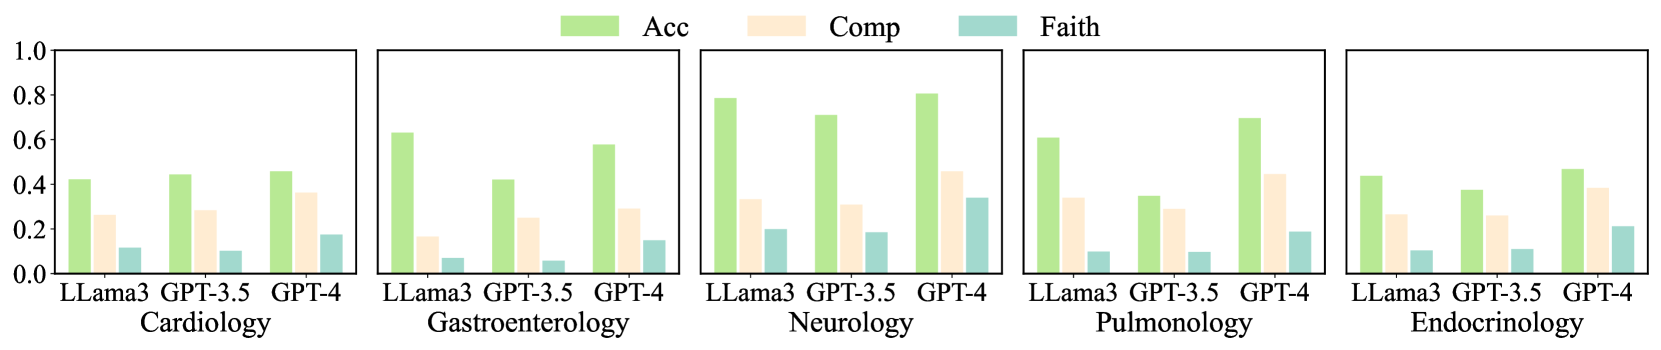
Performance in individual domains. Figure 5 summarizes the performance of LLama3 70B, GPT-3.5, and GPT-4 across different medical domains, evaluated using Acc ${}^{\text{cat}}$ , $\textit{Obs}^{\text{comp}}$ , and $\textit{Exp}^{\text{all}}$ . Neurology gives the best diagnostic accuracy, where GPT-4 achieved an accuracy of 0.806. LLama3 also performed well (0.786). In terms of $\textit{Obs}^{\text{comp}}$ and $\textit{Exp}^{\text{all}}$ , GPT-4’s results were 0.458 and 0.340, respectively, with the smallest difference between the two scores among all domains. This smaller gap indicates that in Neurology, the common observations in prediction and ground truth lead to the correct diagnoses with faithful rationalizations. However, GPT-4 yields a higher diagnostic accuracy score while a lower explanatory score, suggesting that the observations captured by the model or their rationalizations differ from human doctors.
For Cardiology and Endocrinology, the diagnostic accuracy of the models is relatively low (GPT-4 achieved 0.458 and 0.468, respectively). Nevertheless, $\textit{Obs}^{\text{comp}}$ and $\textit{Exp}^{\text{all}}$ are relatively high. Endocrinology results in lower diagnostic accuracy and higher explanatory performance. A smaller gap may imply that in these two domains, successful predictions are associated with observations similar to those of human doctors, and the reasoning process may be analogous. Conversely, in Gastroenterology, higher Acc ${}^{\text{cat}}$ ) is accompanied by lower $\textit{Obs}^{\text{comp}}$ and $\textit{Exp}^{\text{all}}$ (especially for LLama3), potentially indicating a significant divergence in the reasoning process from human doctors. Overall, DiReCT demonstrates that the degree of alignment between the model’s diagnostic reasoning ability and that of human doctors varies across different medical domains.
Table 5: Consistency of automated evaluation metrics with human judgments.
| Model | Observation | Rationalization |
| --- | --- | --- |
| LLama3 8B | 0.887 | 0.801 |
| GPT-4 turbo | 0.902 | 0.836 |
Reliability of automatic evaluation. We randomly pick out 100 samples from DiReCT and their prediction by GPT-4 over the task with $\mathcal{G}$ to assess the consistency of our automated metrics to evaluate the observational and explanatory performance in Section 3.3 to human judgments. Three physicians joined this experiment. For each prediction $\hat{o}∈\hat{\mathcal{O}}$ , they are asked to find a similar observation in ground truth $\mathcal{O}$ . For explanatory metrics, they verify if each prediction $\hat{z}∈\hat{\mathcal{E}}$ for $\hat{o}∈\hat{\mathcal{O}}$ align with ground-truth $z∈\mathcal{E}$ corresponding to $o$ . A prediction and a ground truth are deemed aligned for both assessments if at least two specialists agree. We compare LLama3’s and GPT-4’s judgments to explore if there is a gap between these LLMs. As summarized in Table 5, GPT-4 achieves the best results, with LLama3 8B also displaying a similar performance. From these results, we argue that our automated evaluation metrics are consistent with human judgments, and LLama3 is sufficient for this evaluation, allowing the cost-efficient option.
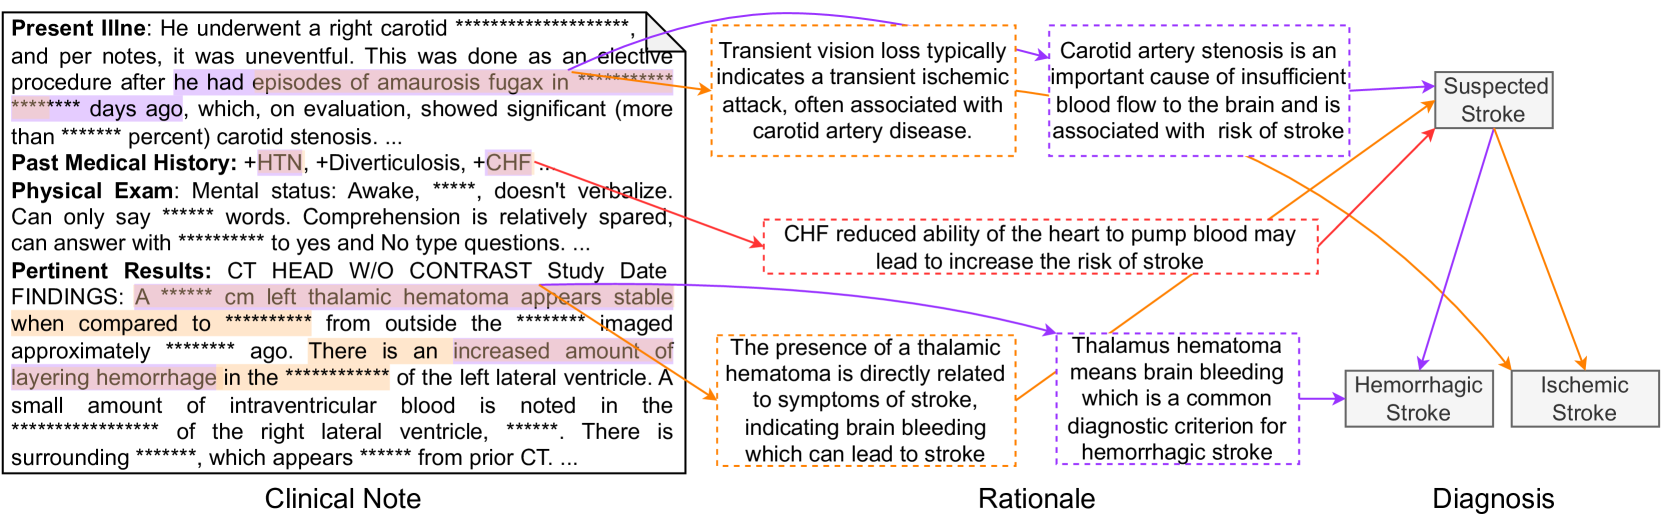
A prediction example. Figure 6 shows a sample generated by GPT-4. The ground-truth PDD of the input clinical note is Hemorrhagic Stroke. In this figure, purple, orange, and red indicate explanations only in the ground truth, only in prediction, and common in both, respectively; therefore, red is a successful prediction of an explanation, while purple and orange are a false negative and false positive. GPT-4 treats the observation of aurosis fugax as the criteria for diagnosing Ischemic Stroke. However, this observation only supports Suspected Stroke. Conversely, observation thalamic hematoma, which is the key indicator of Hemorrhagic Stroke, is regarded as a less important clue. Such observation-diagnosis correspondence errors lead to the model’s misdiagnosis. More samples are available in the supplementary material.
<details>
<summary>x6.png Details</summary>
### Visual Description
# Technical Document Extraction: Clinical Note, Rationale, and Diagnosis for Suspected Stroke
## Clinical Note
### Present Illness
- Patient underwent a right carotid procedure (uneventful, elective) after episodes of **amaurosis fugax** (more than ******* days ago), showing significant carotid stenosis (> *******%).
- **Transient vision loss** typically indicates a transient ischemic attack (TIA), often associated with carotid artery disease.
### Past Medical History
- **HTN** (Hypertension), **Diverticulosis**, **CHF** (Congestive Heart Failure).
- **Mental status**: Awake, comprehension relatively spared, answers only with ******* to yes/no questions.
### Physical Exam
- **Vitals**: Not specified.
- **Neurological**: Can only say ******* words; comprehension relatively spared.
### Pertinent Results
- **CT HEAD W/O CONTRAST Study Date Findings**:
- **A ******* cm left thalamic hematoma** appears stable compared to ******* imaged ******* ago.
- Increased amount of **layering hemorrhage** in the ******* of the left lateral ventricle.
- Small amount of **intraventricular blood** noted in the ******* of the right lateral ventricle, appearing ******* from prior CT.
## Rationale
1. **Transient vision loss** → Indicates TIA, associated with carotid artery disease.
2. **Carotid artery stenosis** → Causes insufficient blood flow to the brain, increasing stroke risk.
3. **CHF** → Reduces heart's ability to pump blood, increasing stroke risk.
4. **Thalamic hematoma** → Directly related to stroke symptoms (brain bleeding), diagnostic criterion for hemorrhagic stroke.
## Diagnosis
- **Suspected Stroke** (Hemorrhagic or Ischemic):
- **Hemorrhagic Stroke**: Presence of thalamic hematoma (brain bleeding).
- **Ischemic Stroke**: Carotid artery stenosis (insufficient blood flow).
## Diagram Structure
- **Components**:
- **Clinical Note**: Textual patient history, exam findings, and test results.
- **Rationale**: Arrows connecting risk factors (e.g., carotid stenosis, CHF) to stroke subtypes.
- **Diagnosis**: Final classification into hemorrhagic or ischemic stroke based on criteria.
## Key Trends and Data Points
- **Carotid Stenosis**: > *******% (critical threshold for stroke risk).
- **Hematoma Size**: ******* cm (left thalamic), stable over ******* days.
- **Hemorrhage Layering**: Increased in left lateral ventricle.
- **Intraventricular Blood**: Small amount in right ventricle, ******* from prior CT.
## Spatial Grounding and Component Isolation
- **Legend**: No explicit legend present; colors (purple, orange, red) used for highlighting text.
- **Flow**: Clinical Note → Rationale → Diagnosis (linear progression).
## Transcribed Text Blocks
### Present Illness
"He underwent a right carotid procedure (uneventful, elective) after episodes of amaurosis fugax (more than ******* days ago), showing significant carotid stenosis (> *******%)."
### Pertinent Results
"A ******* cm left thalamic hematoma appears stable compared to ******* imaged ******* ago. There is an increased amount of layering hemorrhage in the ******* of the left lateral ventricle. A small amount of intraventricular blood is noted in the ******* of the right lateral ventricle, appearing ******* from prior CT."
### Rationale
- "Transient vision loss typically indicates a transient ischemic attack, often associated with carotid artery disease."
- "Carotid artery stenosis is an important cause of insufficient blood flow to the brain and is associated with risk of stroke."
- "CHF reduced ability of the heart to pump blood may lead to increase the risk of stroke."
- "The presence of a thalamic hematoma means brain bleeding, which is a common diagnostic criterion for hemorrhagic stroke."
## Notes
- All text extracted verbatim, including redacted sections (e.g., *******).
- No numerical data tables present; focus on textual rationale and clinical findings.
- Colors used for emphasis but not part of structured data.
</details>
Figure 6: An example prediction for a clinical note with PDD of Hemorrhagic Stroke by GPT-4.
6 Conclusion and Limitations
We proposed DiReCT as the first benchmark for evaluating the diagnostic reasoning ability of LLMs with interpretability by supplying external knowledge as a graph. Our evaluations reveal a notable disparity between current leading-edge LLMs and human experts, underscoring the urgent need for AI models that can perform reliable and interpretable reasoning in clinical environments. DiReCT can be easily extended to more challenging settings by removing the knowledge graph from the input, facilitating evaluations of future LLMs.
Limitations. DiReCT encompasses only a subset of disease categories and considers only one PDD, omitting the inter-diagnostic relationships due to their complexity—a significant challenge even for human doctors. Additionally, our baseline may not use optimal prompts, chain-of-thought reasoning, or address issues related to hallucinations in task responses. Our dataset is solely intended for model evaluation but not for use in clinical environments. The use of the diagnostic knowledge graph is also limited to serving merely as a part of input. Future work will focus on constructing a more comprehensive disease dataset and developing an extensive diagnostic knowledge graph.
Acknowledgments and Disclosure of Funding
This work was supported by World Premier International Research Center Initiative (WPI), MEXT, Japan. This work is also supported by JSPS KAKENHI 24K20795 and Dalian Haichuang Project for Advanced Talents.
References
- Zhao et al. [2023] Wayne Xin Zhao, Kun Zhou, Junyi Li, Tianyi Tang, Xiaolei Wang, Yupeng Hou, Yingqian Min, Beichen Zhang, Junjie Zhang, Zican Dong, Yifan Du, Chen Yang, Yushuo Chen, Zhipeng Chen, Jinhao Jiang, Ruiyang Ren, Yifan Li, Xinyu Tang, Zikang Liu, Peiyu Liu, Jian-Yun Nie, and Ji-Rong Wen. A survey of large language models. arXiv preprint arXiv:2303.18223, 2023.
- Min et al. [2023] Bonan Min, Hayley Ross, Elior Sulem, Amir Pouran Ben Veyseh, Thien Huu Nguyen, Oscar Sainz, Eneko Agirre, Ilana Heintz, and Dan Roth. Recent advances in natural language processing via large pre-trained language models: A survey. ACM Computing Surveys, 56(2):1–40, 2023.
- Anil et al. [2023] Rohan Anil, Andrew M Dai, Orhan Firat, Melvin Johnson, Dmitry Lepikhin, Alexandre Passos, Siamak Shakeri, Emanuel Taropa, Paige Bailey, Zhifeng Chen, et al. Palm 2 technical report. arXiv preprint arXiv:2305.10403, 2023.
- Han et al. [2023] Tianyu Han, Lisa C Adams, Jens-Michalis Papaioannou, Paul Grundmann, Tom Oberhauser, Alexander Löser, Daniel Truhn, and Keno K Bressem. Medalpaca–an open-source collection of medical conversational ai models and training data. arXiv preprint arXiv:2304.08247, 2023.
- Jin et al. [2021] Di Jin, Eileen Pan, Nassim Oufattole, Wei-Hung Weng, Hanyi Fang, and Peter Szolovits. What disease does this patient have? a large-scale open domain question answering dataset from medical exams. Applied Sciences, 11(14):6421, 2021.
- OpenAI [2023a] OpenAI. GPT-4 Technical Report. CoRR, abs/2303.08774, 2023a. doi: 10.48550/arXiv.2303.08774. URL https://doi.org/10.48550/arXiv.2303.08774.
- Bubeck et al. [2023] Sébastien Bubeck, Varun Chandrasekaran, Ronen Eldan, Johannes Gehrke, Eric Horvitz, Ece Kamar, Peter Lee, Yin Tat Lee, Yuanzhi Li, Scott Lundberg, et al. Sparks of artificial general intelligence: Early experiments with gpt-4. arXiv preprint arXiv:2303.12712, 2023.
- Nori et al. [2023] Harsha Nori, Nicholas King, Scott Mayer McKinney, Dean Carignan, and Eric Horvitz. Capabilities of gpt-4 on medical challenge problems. arXiv preprint arXiv:2303.13375, 2023.
- Liévin et al. [2024] Valentin Liévin, Christoffer Egeberg Hother, Andreas Geert Motzfeldt, and Ole Winther. Can large language models reason about medical questions? Patterns, 5(3), 2024.
- Pal et al. [2022] Ankit Pal, Logesh Kumar Umapathi, and Malaikannan Sankarasubbu. MedMCQA: A large-scale multi-subject multi-choice dataset for medical domain question answering. In Conference on health, inference, and learning, pages 248–260. PMLR, 2022.
- Li et al. [2023] Dongfang Li, Jindi Yu, Baotian Hu, Zhenran Xu, and Min Zhang. ExplainCPE: A free-text explanation benchmark of chinese pharmacist examination. arXiv preprint arXiv:2305.12945, 2023.
- Chen et al. [2024] Hanjie Chen, Zhouxiang Fang, Yash Singla, and Mark Dredze. Benchmarking large language models on answering and explaining challenging medical questions. arXiv preprint arXiv:2402.18060, 2024.
- Jullien et al. [2023] Mael Jullien, Marco Valentino, Hannah Frost, Paul O’Regan, Donal Landers, and André Freitas. Semeval-2023 task 7: Multi-evidence natural language inference for clinical trial data. arXiv preprint arXiv:2305.02993, 2023.
- Gao et al. [2023a] Yanjun Gao, Ruizhe Li, John Caskey, Dmitriy Dligach, Timothy Miller, Matthew M Churpek, and Majid Afshar. Leveraging a medical knowledge graph into large language models for diagnosis prediction. arXiv preprint arXiv:2308.14321, 2023a.
- Johnson et al. [2023] Alistair E. W. Johnson, Lucas Bulgarelli, Lu Shen, Alvin Gayles, Ayad Shammout, Steven Horng, Tom J. Pollard, Sicheng Hao, Benjamin Moody, Brian Gow, Li-wei H. Lehman, Leo A. Celi, and Roger G. Mark. MIMIC-IV, a freely accessible electronic health record dataset. Scientific data, 10(1):1, 2023.
- Xi et al. [2023] Zhiheng Xi, Wenxiang Chen, Xin Guo, Wei He, Yiwen Ding, Boyang Hong, Ming Zhang, Junzhe Wang, Senjie Jin, Enyu Zhou, Rui Zheng, Xiaoran Fan, Xiao Wang, Limao Xiong, Yuhao Zhou, Weiran Wang, Changhao Jiang, Yicheng Zou, Xiangyang Liu, Zhangyue Yin, Shihan Dou, Rongxiang Weng, Wensen Cheng, Qi Zhang, Wenjuan Qin, Yongyan Zheng, Xipeng Qiu, Xuanjing Huang, and Tao Gui. The rise and potential of large language model based agents: A survey, 2023.
- Tang et al. [2023] Xiangru Tang, Anni Zou, Zhuosheng Zhang, Yilun Zhao, Xingyao Zhang, Arman Cohan, and Mark Gerstein. Medagents: Large language models as collaborators for zero-shot medical reasoning. arXiv preprint arXiv:2311.10537, 2023.
- Middleton et al. [2013] Blackford Middleton, Meryl Bloomrosen, Mark A Dente, Bill Hashmat, Ross Koppel, J Marc Overhage, Thomas H Payne, S Trent Rosenbloom, Charlotte Weaver, and Jiajie Zhang. Enhancing patient safety and quality of care by improving the usability of electronic health record systems: recommendations from amia. Journal of the American Medical Informatics Association, 20(e1):e2–e8, 2013.
- Liu et al. [2022] Jinghui Liu, Daniel Capurro, Anthony Nguyen, and Karin Verspoor. “note bloat” impacts deep learning-based nlp models for clinical prediction tasks. Journal of biomedical informatics, 133:104149, 2022.
- Danilevsky et al. [2020] Marina Danilevsky, Kun Qian, Ranit Aharonov, Yannis Katsis, Ban Kawas, and Prithviraj Sen. A survey of the state of explainable AI for natural language processing. In Proceedings of the 1st Conference of the Asia-Pacific Chapter of the Association for Computational Linguistics and the 10th International Joint Conference on Natural Language Processing, pages 447–459, 2020.
- Gurrapu et al. [2023] Sai Gurrapu, Ajay Kulkarni, Lifu Huang, Ismini Lourentzou, and Feras A Batarseh. Rationalization for explainable nlp: A survey. Frontiers in Artificial Intelligence, 6, 2023.
- Camburu et al. [2018] Oana-Maria Camburu, Tim Rocktäschel, Thomas Lukasiewicz, and Phil Blunsom. e-snli: Natural language inference with natural language explanations. Advances in Neural Information Processing Systems, 31, 2018.
- Rajani et al. [2019] Nazneen Fatema Rajani, Bryan McCann, Caiming Xiong, and Richard Socher. Explain yourself! leveraging language models for commonsense reasoning. In Proceedings of the 57th Annual Meeting of the Association for Computational Linguistics, pages 4932–4942, Florence, Italy, 2019.
- DeYoung et al. [2020] Jay DeYoung, Sarthak Jain, Nazneen Fatema Rajani, Eric Lehman, Caiming Xiong, Richard Socher, and Byron C. Wallace. ERASER: A benchmark to evaluate rationalized NLP models. In Proceedings of the 58th Annual Meeting of the Association for Computational Linguistics, pages 4443–4458, 2020.
- Jhamtani and Clark [2020] Harsh Jhamtani and Peter Clark. Learning to explain: Datasets and models for identifying valid reasoning chains in multihop question-answering. In Proceedings of the 2020 Conference on Empirical Methods in Natural Language Processing, page 137–150, 2020.
- Tafjord et al. [2021] Oyvind Tafjord, Bhavana Dalvi Mishra, and Peter Clark. Proofwriter: Generating implications, proofs, and abductive statements over natural language. In Findings of the Association for Computational Linguistics: ACL-IJCNLP, page 3621–3634, 2021.
- Zhao et al. [2021] Chen Zhao, Chenyan Xiong, Jordan Boyd-Graber, and Hal Daumé III. Multi-step reasoning over unstructured text with beam dense retrieval. In Proceedings of the 2021 Conference of the North American Chapter of the Association for Computational Linguistics: Human Language Technologies, pages 4635–4641, 2021.
- Dalvi et al. [2021] Bhavana Dalvi, Peter Jansen, Oyvind Tafjord, Zhengnan Xie, Hannah Smith, Leighanna Pipatanangkura, and Peter Clark. Explaining answers with entailment trees. In Proceedings of the 2021 Conference on Empirical Methods in Natural Language Processing, pages 7358–7370, 2021.
- Zhang et al. [2024] Yifan Zhang, Jingqin Yang, Yang Yuan, and Andrew Chi-Chih Yao. Cumulative reasoning with large language models. In ICLR 2024 Workshop on Bridging the Gap Between Practice and Theory in Deep Learning, 2024. URL https://openreview.net/forum?id=XAAYyRxTlQ.
- Gao et al. [2022] Yanjun Gao, Dmitriy Dligach, Timothy Miller, Samuel Tesch, Ryan Laffin, Matthew M. Churpek, and Majid Afshar. Hierarchical annotation for building a suite of clinical natural language processing tasks: Progress note understanding. In Proceedings of the Thirteenth Language Resources and Evaluation Conference, pages 5484–5493, Marseille, France, 2022. European Language Resources Association.
- Zack et al. [2023] Travis Zack, Gurpreet Dhaliwal, Rabih Geha, Mary Margaretten, Sara Murray, and Julian C Hong. A clinical reasoning-encoded case library developed through natural language processing. Journal of General Internal Medicine, 38(1):5–11, 2023.
- Gao et al. [2023b] Yanjun Gao, Dmitriy Dligach, Timothy Miller, John Caskey, Brihat Sharma, Matthew M Churpek, and Majid Afshar. Dr. bench: Diagnostic reasoning benchmark for clinical natural language processing. Journal of Biomedical Informatics, 138:104286, 2023b.
- Weed [1970] L.L. Weed. Medical Records, Medical Education, and Patient Care: The Problem-oriented Record as a Basic Tool. Press of Case Western Reserve University, 1970. ISBN 9780815191889.
- Bodenreider [2004] Olivier Bodenreider. The unified medical language system (umls): integrating biomedical terminology. Nucleic acids research, 32(suppl_1):D267–D270, 2004.
- AI@Meta [2024] AI@Meta. Llama 3 model card. 2024. URL https://github.com/meta-llama/llama3/blob/main/MODEL_CARD.md.
- Tunstall et al. [2023] Lewis Tunstall, Edward Beeching, Nathan Lambert, Nazneen Rajani, Kashif Rasul, Younes Belkada, Shengyi Huang, Leandro von Werra, Clémentine Fourrier, Nathan Habib, et al. Zephyr: Direct distillation of lm alignment. arXiv preprint arXiv:2310.16944, 2023.
- Jiang et al. [2023] Albert Q Jiang, Alexandre Sablayrolles, Arthur Mensch, Chris Bamford, Devendra Singh Chaplot, Diego de las Casas, Florian Bressand, Gianna Lengyel, Guillaume Lample, Lucile Saulnier, et al. Mistral 7b. arXiv preprint arXiv:2310.06825, 2023.
- OpenAI [2023b] OpenAI. Introducing ChatGPT and Whisper APIs. 2023b. URL https://openai.com/blog/introducing-chatgpt-and-whisper-apis.
- Byrne et al. [2024] Robert A Byrne, Xavier Rossello, JJ Coughlan, Emanuele Barbato, Colin Berry, Alaide Chieffo, Marc J Claeys, Gheorghe-Andrei Dan, Marc R Dweck, Mary Galbraith, et al. 2023 esc guidelines for the management of acute coronary syndromes: developed by the task force on the management of acute coronary syndromes of the european society of cardiology (esc). European Heart Journal: Acute Cardiovascular Care, 13(1):55–161, 2024.
- Members et al. [2022] Writing Committee Members, Eric M Isselbacher, Ourania Preventza, James Hamilton Black III, John G Augoustides, Adam W Beck, Michael A Bolen, Alan C Braverman, Bruce E Bray, Maya M Brown-Zimmerman, et al. 2022 acc/aha guideline for the diagnosis and management of aortic disease: a report of the american heart association/american college of cardiology joint committee on clinical practice guidelines. Journal of the American College of Cardiology, 80(24):e223–e393, 2022.
- Joglar et al. [2024] José A Joglar, Mina K Chung, Anastasia L Armbruster, Emelia J Benjamin, Janice Y Chyou, Edmond M Cronin, Anita Deswal, Lee L Eckhardt, Zachary D Goldberger, Rakesh Gopinathannair, et al. 2023 acc/aha/accp/hrs guideline for the diagnosis and management of atrial fibrillation: a report of the american college of cardiology/american heart association joint committee on clinical practice guidelines. Circulation, 149(1):e1–e156, 2024.
- Ommen et al. [2020] Steve R Ommen, Seema Mital, Michael A Burke, Sharlene M Day, Anita Deswal, Perry Elliott, Lauren L Evanovich, Judy Hung, José A Joglar, Paul Kantor, et al. 2020 aha/acc guideline for the diagnosis and treatment of patients with hypertrophic cardiomyopathy: executive summary: a report of the american college of cardiology/american heart association joint committee on clinical practice guidelines. Journal of the American College of Cardiology, 76(25):3022–3055, 2020.
- Heidenreich et al. [2022] Paul A Heidenreich, Biykem Bozkurt, David Aguilar, Larry A Allen, Joni J Byun, Monica M Colvin, Anita Deswal, Mark H Drazner, Shannon M Dunlay, Linda R Evers, et al. 2022 aha/acc/hfsa guideline for the management of heart failure: a report of the american college of cardiology/american heart association joint committee on clinical practice guidelines. Journal of the American College of Cardiology, 79(17):e263–e421, 2022.
- Su et al. [2021] Lilly Su, Rea Mittal, Devyani Ramgobin, Rahul Jain, and Rohit Jain. Current management guidelines on hyperlipidemia: the silent killer. Journal of lipids, 2021(1):9883352, 2021.
- Unger et al. [2020] Thomas Unger, Claudio Borghi, Fadi Charchar, Nadia A Khan, Neil R Poulter, Dorairaj Prabhakaran, Agustin Ramirez, Markus Schlaich, George S Stergiou, Maciej Tomaszewski, et al. 2020 international society of hypertension global hypertension practice guidelines. Hypertension, 75(6):1334–1357, 2020.
- Shah et al. [2021] Shailja C Shah, M Blanca Piazuelo, Ernst J Kuipers, and Dan Li. Aga clinical practice update on the diagnosis and management of atrophic gastritis: expert review. Gastroenterology, 161(4):1325–1332, 2021.
- Gyawali et al. [2024] C Prakash Gyawali, Rena Yadlapati, Ronnie Fass, David Katzka, John Pandolfino, Edoardo Savarino, Daniel Sifrim, Stuart Spechler, Frank Zerbib, Mark R Fox, et al. Updates to the modern diagnosis of gerd: Lyon consensus 2.0. Gut, 73(2):361–371, 2024.
- Kavitt et al. [2019] Robert T Kavitt, Anna M Lipowska, Adjoa Anyane-Yeboa, and Ian M Gralnek. Diagnosis and treatment of peptic ulcer disease. The American journal of medicine, 132(4):447–456, 2019.
- Barkun et al. [2019] Alan N Barkun, Majid Almadi, Ernst J Kuipers, Loren Laine, Joseph Sung, Frances Tse, Grigorios I Leontiadis, Neena S Abraham, Xavier Calvet, Francis KL Chan, et al. Management of nonvariceal upper gastrointestinal bleeding: guideline recommendations from the international consensus group. Annals of internal medicine, 171(11):805–822, 2019.
- McKhann et al. [1984] Guy McKhann, David Drachman, Marshall Folstein, Robert Katzman, Donald Price, and Emanuel M Stadlan. Clinical diagnosis of alzheimer’s disease: Report of the nincds-adrda work group* under the auspices of department of health and human services task force on alzheimer’s disease. Neurology, 34(7):939–939, 1984.
- Igaku-Shoin-Ltd. [2018] Igaku-Shoin-Ltd. Clinical practice guidelines for epilepsy 2018. 2018.
- Lipton et al. [2001] Richard B Lipton, Seymour Diamond, Michael Reed, Merle L Diamond, and Walter F Stewart. Migraine diagnosis and treatment: results from the american migraine study ii. Headache: The Journal of Head and Face Pain, 41(7):638–645, 2001.
- Lublin [2005] Fred D Lublin. Clinical features and diagnosis of multiple sclerosis. Neurologic clinics, 23(1):1–15, 2005.
- Kleindorfer et al. [2021] Dawn O Kleindorfer, Amytis Towfighi, Seemant Chaturvedi, Kevin M Cockroft, Jose Gutierrez, Debbie Lombardi-Hill, Hooman Kamel, Walter N Kernan, Steven J Kittner, Enrique C Leira, et al. 2021 guideline for the prevention of stroke in patients with stroke and transient ischemic attack: a guideline from the american heart association/american stroke association. Stroke, 52(7):e364–e467, 2021.
- Qaseem et al. [2011] Amir Qaseem, Timothy J Wilt, Steven E Weinberger, Nicola A Hanania, Gerard Criner, Thys van der Molen, Darcy D Marciniuk, Tom Denberg, Holger Schünemann, Wisia Wedzicha, et al. Diagnosis and management of stable chronic obstructive pulmonary disease: a clinical practice guideline update from the american college of physicians, american college of chest physicians, american thoracic society, and european respiratory society. Annals of internal medicine, 155(3):179–191, 2011.
- Gupta et al. [2013] Dheeraj Gupta, Ritesh Agarwal, Ashutosh Nath Aggarwal, VN Maturu, Sahajal Dhooria, KT Prasad, Inderpaul S Sehgal, Lakshmikant B Yenge, Aditya Jindal, Navneet Singh, et al. Guidelines for diagnosis and management of chronic obstructive pulmonary disease: Joint ics/nccp (i) recommendations. Lung India, 30(3):228–267, 2013.
- Olson and Davis [2020] Gregory Olson and Andrew M Davis. Diagnosis and treatment of adults with community-acquired pneumonia. Jama, 323(9):885–886, 2020.
- Konstantinides et al. [2020] Stavros V Konstantinides, Guy Meyer, Cecilia Becattini, Héctor Bueno, Geert-Jan Geersing, Veli-Pekka Harjola, Menno V Huisman, Marc Humbert, Catriona Sian Jennings, David Jiménez, et al. 2019 esc guidelines for the diagnosis and management of acute pulmonary embolism developed in collaboration with the european respiratory society (ers) the task force for the diagnosis and management of acute pulmonary embolism of the european society of cardiology (esc). European heart journal, 41(4):543–603, 2020.
- Lewinsohn et al. [2017] David M Lewinsohn, Michael K Leonard, Philip A LoBue, David L Cohn, Charles L Daley, Ed Desmond, Joseph Keane, Deborah A Lewinsohn, Ann M Loeffler, Gerald H Mazurek, et al. Official american thoracic society/infectious diseases society of america/centers for disease control and prevention clinical practice guidelines: diagnosis of tuberculosis in adults and children. Clinical Infectious Diseases, 64(2):e1–e33, 2017.
- Charmandari et al. [2014] Evangelia Charmandari, Nicolas C Nicolaides, and George P Chrousos. Adrenal insufficiency. The Lancet, 383(9935):2152–2167, 2014.
- ElSayed et al. [2023] Nuha A ElSayed, Grazia Aleppo, Vanita R Aroda, Raveendhara R Bannuru, Florence M Brown, Dennis Bruemmer, Billy S Collins, Kenneth Cusi, Marisa E Hilliard, Diana Isaacs, et al. 4. comprehensive medical evaluation and assessment of comorbidities: Standards of care in diabetes—2023. Diabetes Care, 46(Suppl 1):s49, 2023.
- Tritos and Miller [2023] Nicholas A Tritos and Karen K Miller. Diagnosis and management of pituitary adenomas: a review. Jama, 329(16):1386–1398, 2023.
- AlexanderErik et al. [2017] K AlexanderErik, N PearceElizabeth, A BrentGregory, S BrownRosalind, A GrobmanWilliam, H LazarusJohn, J MandelSusan, P PeetersRobin, et al. 2017 guidelines of the american thyroid association for the diagnosis and management of thyroid disease during pregnancy and the postpartum. Thyroid, 2017.
Appendix A Details of DiReCT
A.1 Data Statistics
Table 6: Disease statistics of DiReCT.
| Domains | Categories | # samples | $|\mathcal{D}_{i}|$ | $|\mathcal{D}^{\star}_{i}|$ | References |
| --- | --- | --- | --- | --- | --- |
| Cardiology | Acute Coronary Syndromes | 65 | 6 | 3 | [Byrne et al., 2024] |
| Aortic Dissection | 14 | 3 | 2 | [Members et al., 2022] | |
| Atrial Fibrillation | 10 | 3 | 2 | [Joglar et al., 2024] | |
| Cardiomyopathy | 9 | 5 | 4 | [Ommen et al., 2020] | |
| Heart Failure | 52 | 6 | 3 | [Heidenreich et al., 2022] | |
| Hyperlipidemia | 2 | 2 | 1 | [Su et al., 2021] | |
| Hypertension | 32 | 2 | 1 | [Unger et al., 2020] | |
| Gastroenterology | Gastritis | 27 | 5 | 3 | [Shah et al., 2021] |
| Gastroesophageal Reflux Disease | 41 | 2 | 1 | [Gyawali et al., 2024] | |
| Peptic Ulcer Disease | 28 | 3 | 2 | [Kavitt et al., 2019] | |
| Upper Gastrointestinal Bleeding | 7 | 2 | 1 | [Barkun et al., 2019] | |
| Neurology | Alzheimer | 10 | 2 | 1 | [McKhann et al., 1984] |
| Epilepsy | 8 | 3 | 2 | [Igaku-Shoin-Ltd., 2018] | |
| Migraine | 4 | 3 | 2 | [Lipton et al., 2001] | |
| Multiple Sclerosis | 27 | 6 | 4 | [Lublin, 2005] | |
| Stroke | 28 | 3 | 2 | [Kleindorfer et al., 2021] | |
| Pulmonology | Asthma | 13 | 7 | 5 | [Qaseem et al., 2011] |
| COPD | 19 | 6 | 4 | [Gupta et al., 2013] | |
| Pneumonia | 20 | 4 | 2 | [Olson and Davis, 2020] | |
| Pulmonary Embolism | 35 | 5 | 3 | [Konstantinides et al., 2020] | |
| Tuberculosis | 5 | 3 | 2 | [Lewinsohn et al., 2017] | |
| Endocrinology | Adrenal Insufficiency | 20 | 4 | 3 | [Charmandari et al., 2014] |
| Diabetes | 13 | 4 | 2 | [ElSayed et al., 2023] | |
| Pituitary | 12 | 4 | 3 | [Tritos and Miller, 2023] | |
| Thyroid Disease | 10 | 6 | 4 | [AlexanderErik et al., 2017] | |
Table 6 provides a detailed breakdown of the disease categories included in DiReCT. The column labeled # samples indicates the number of data points. The symbols $|\mathcal{D}_{i}|$ and $|\mathcal{D}^{\star}_{i}|$ denote the total number of diagnoses (diseases) and PDDs, respectively. Existing guidelines for diagnosing diseases were used as References, forming the foundation for constructing the diagnostic knowledge graphs. As some premise may not included in the referred guidelines. During annotation, physicians will incorporate their own knowledge to complete the knowledge graph.
A.2 Structure of Knowledge Graph
The entire knowledge graph, denoted as $\mathcal{K}$ , is stored in separate JSON files, each corresponding to a specific disease category $i$ as $\mathcal{K}_{i}$ . Each $\mathcal{K}_{i}$ comprises a procedural graph $\mathcal{G}_{i}$ and the corresponding premise $p$ for each disease. As illustrated in Figure 7, the procedural graph $\mathcal{G}_{i}$ is stored under the key "Diagnostic" in a dictionary structure. A key with an empty list as its value indicates a leaf diagnostic node as $d^{\star}$ . The premise for each disease is saved under the key of "Knowledge" with the corresponding disease name as an index. For all the root nodes (e.g., Suspected Heart Failure), we further divide the premise into "Risk Factors", "Symptoms", and "Signs". Note that each premise is separated by ";".
<details>
<summary>x7.png Details</summary>
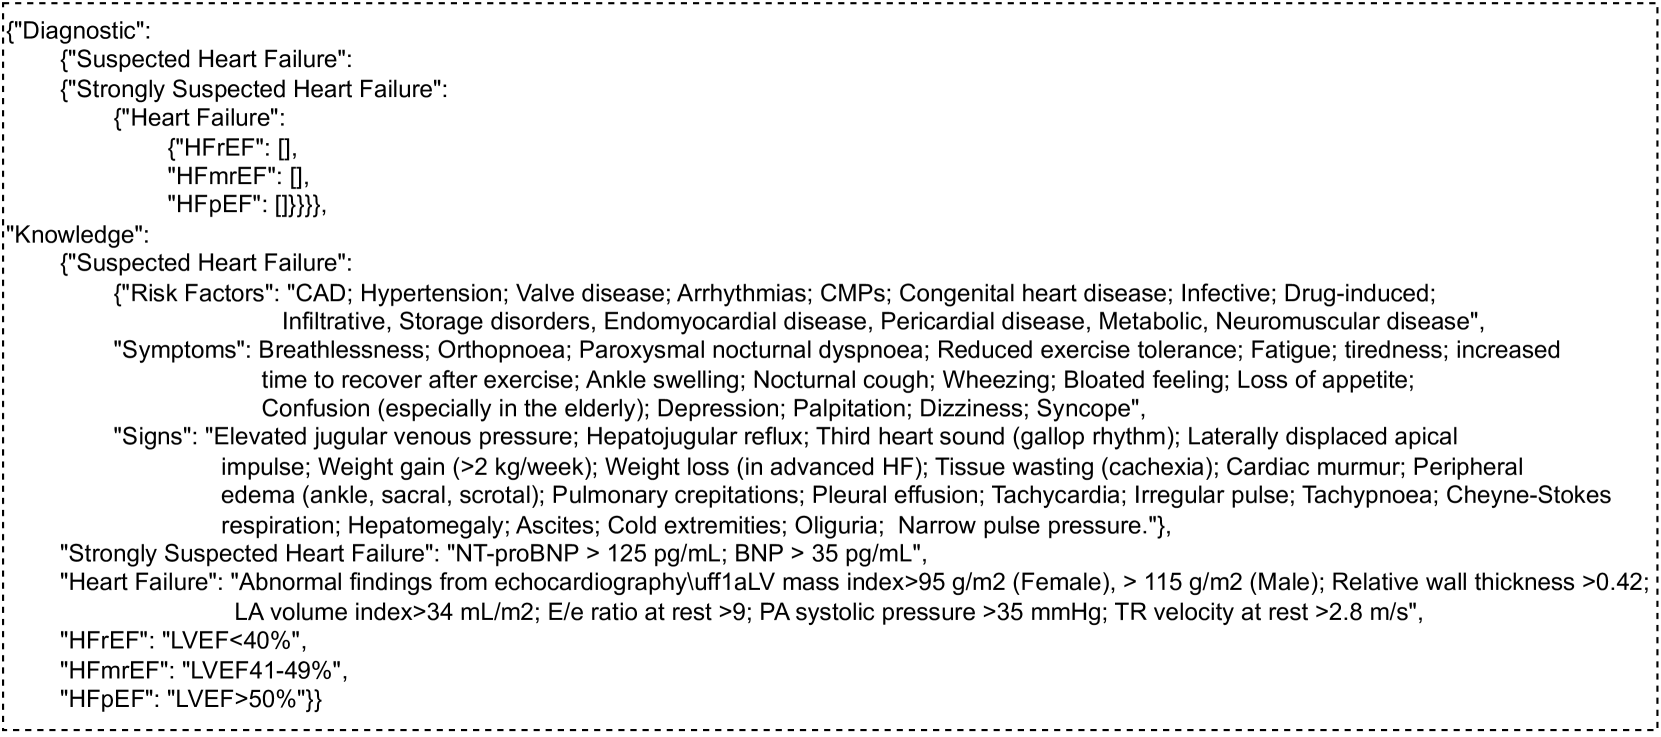
### Visual Description
# Technical Document Analysis: Heart Failure Diagnostic Criteria
## Document Structure
The image contains structured medical knowledge and diagnostic criteria for heart failure, organized into two primary sections:
1. **Diagnostic Hierarchy**
2. **Clinical Knowledge Base**
---
## 1. Diagnostic Hierarchy
### Suspected Heart Failure
- **Strongly Suspected Heart Failure**
- **Heart Failure Subcategories**
- **HFrEF**: [Empty]
- **HFmrEF**: [Empty]
- **HFpEF**: [Empty]
---
## 2. Clinical Knowledge Base
### Suspected Heart Failure
#### Risk Factors
- CAD (Coronary Artery Disease)
- Hypertension
- Valve disease
- Arrhythmias
- CMPs (Cardiomyopathies)
- Congenital heart disease
- Infective
- Drug-induced
- Infiltrative
- Storage disorders
- Endomyocardial disease
- Pericardial disease
- Metabolic
- Neuromuscular disease
#### Symptoms
- Breathlessness
- Orthopnoea
- Paroxysmal nocturnal dyspnoea
- Reduced exercise tolerance
- Fatigue
- Tiredness
- Increased time to recover after exercise
- Ankle swelling
- Nocturnal cough
- Wheezing
- Bloated feeling
- Loss of appetite
- Confusion (especially in the elderly)
- Depression
- Palpitation
- Dizziness
- Syncope
#### Signs
- Elevated jugular venous pressure
- Hepatojugular reflux
- Third heart sound (gallop rhythm)
- Laterally displaced apical impulse
- Weight gain (>2 kg/week)
- Weight loss (in advanced HF)
- Tissue wasting (cachexia)
- Cardiac murmur
- Peripheral edema (ankle, sacral, scrotal)
- Pulmonary crepitations
- Pleural effusion
- Tachycardia
- Irregular pulse
- Tachypnoea
- Cheyne-Stokes respiration
- Hepatomegaly
- Ascites
- Cold extremities
- Oliguria
- Narrow pulse pressure
---
### Strongly Suspected Heart Failure
- **NT-proBNP > 125 pg/mL**
- **BNP > 35 pg/mL**
---
### Heart Failure Classification
- **Abnormal findings from echocardiography**
- **LA volume index > 34 mL/m²**
- **E/e ratio at rest > 9**
- **PA systolic pressure > 35 mmHg**
- **TR velocity at rest > 2.8 m/s**
- **Relative wall thickness > 0.42**
#### EF (Ejection Fraction) Categories
- **HFrEF**: LVEF < 40%
- **HFmrEF**: LVEF 41-49%
- **HFpEF**: LVEF > 50%
---
## Notes
- No charts, diagrams, or data tables present in the image.
- All information is textual and structured hierarchically.
- Medical terminology follows standard cardiology nomenclature.
- No non-English content detected.
</details>
Figure 7: A sample of knowledge graph for Heart Failure. Each premise under the key of "Knowledge" is separated with ";".
A.3 Annotation and Tools
We have developed proprietary software for annotation purposes. As depicted in Figure 8, annotators are presented with the original text as observations $o$ and are required to provide rationales ( $z$ ) to explain why a particular observation $o$ supports a disease $d$ . The left section of the figure, labeled Input1 to Input6, corresponds to different parts of the clinical note, specifically the chief complaint, history of present illness, past medical history, family history, physical exam, and pertinent results, respectively. Annotators will add the raw text into the first layer by left-clicking and dragging to select the original text, then right-clicking to add it. After each observation, a white box will be used to record the rationales. Finally, a connection will be made from each rationale to a disease, represented in a grey box. The annotation process strictly follow the knowledge graph. Both the final annotation and the raw clinical note will be saved in a JSON file. We provide the code to compile these annotations and detailed instructions for using our tool on GitHub.
<details>
<summary>extracted/5772958/Images_spp/annotation.png Details</summary>
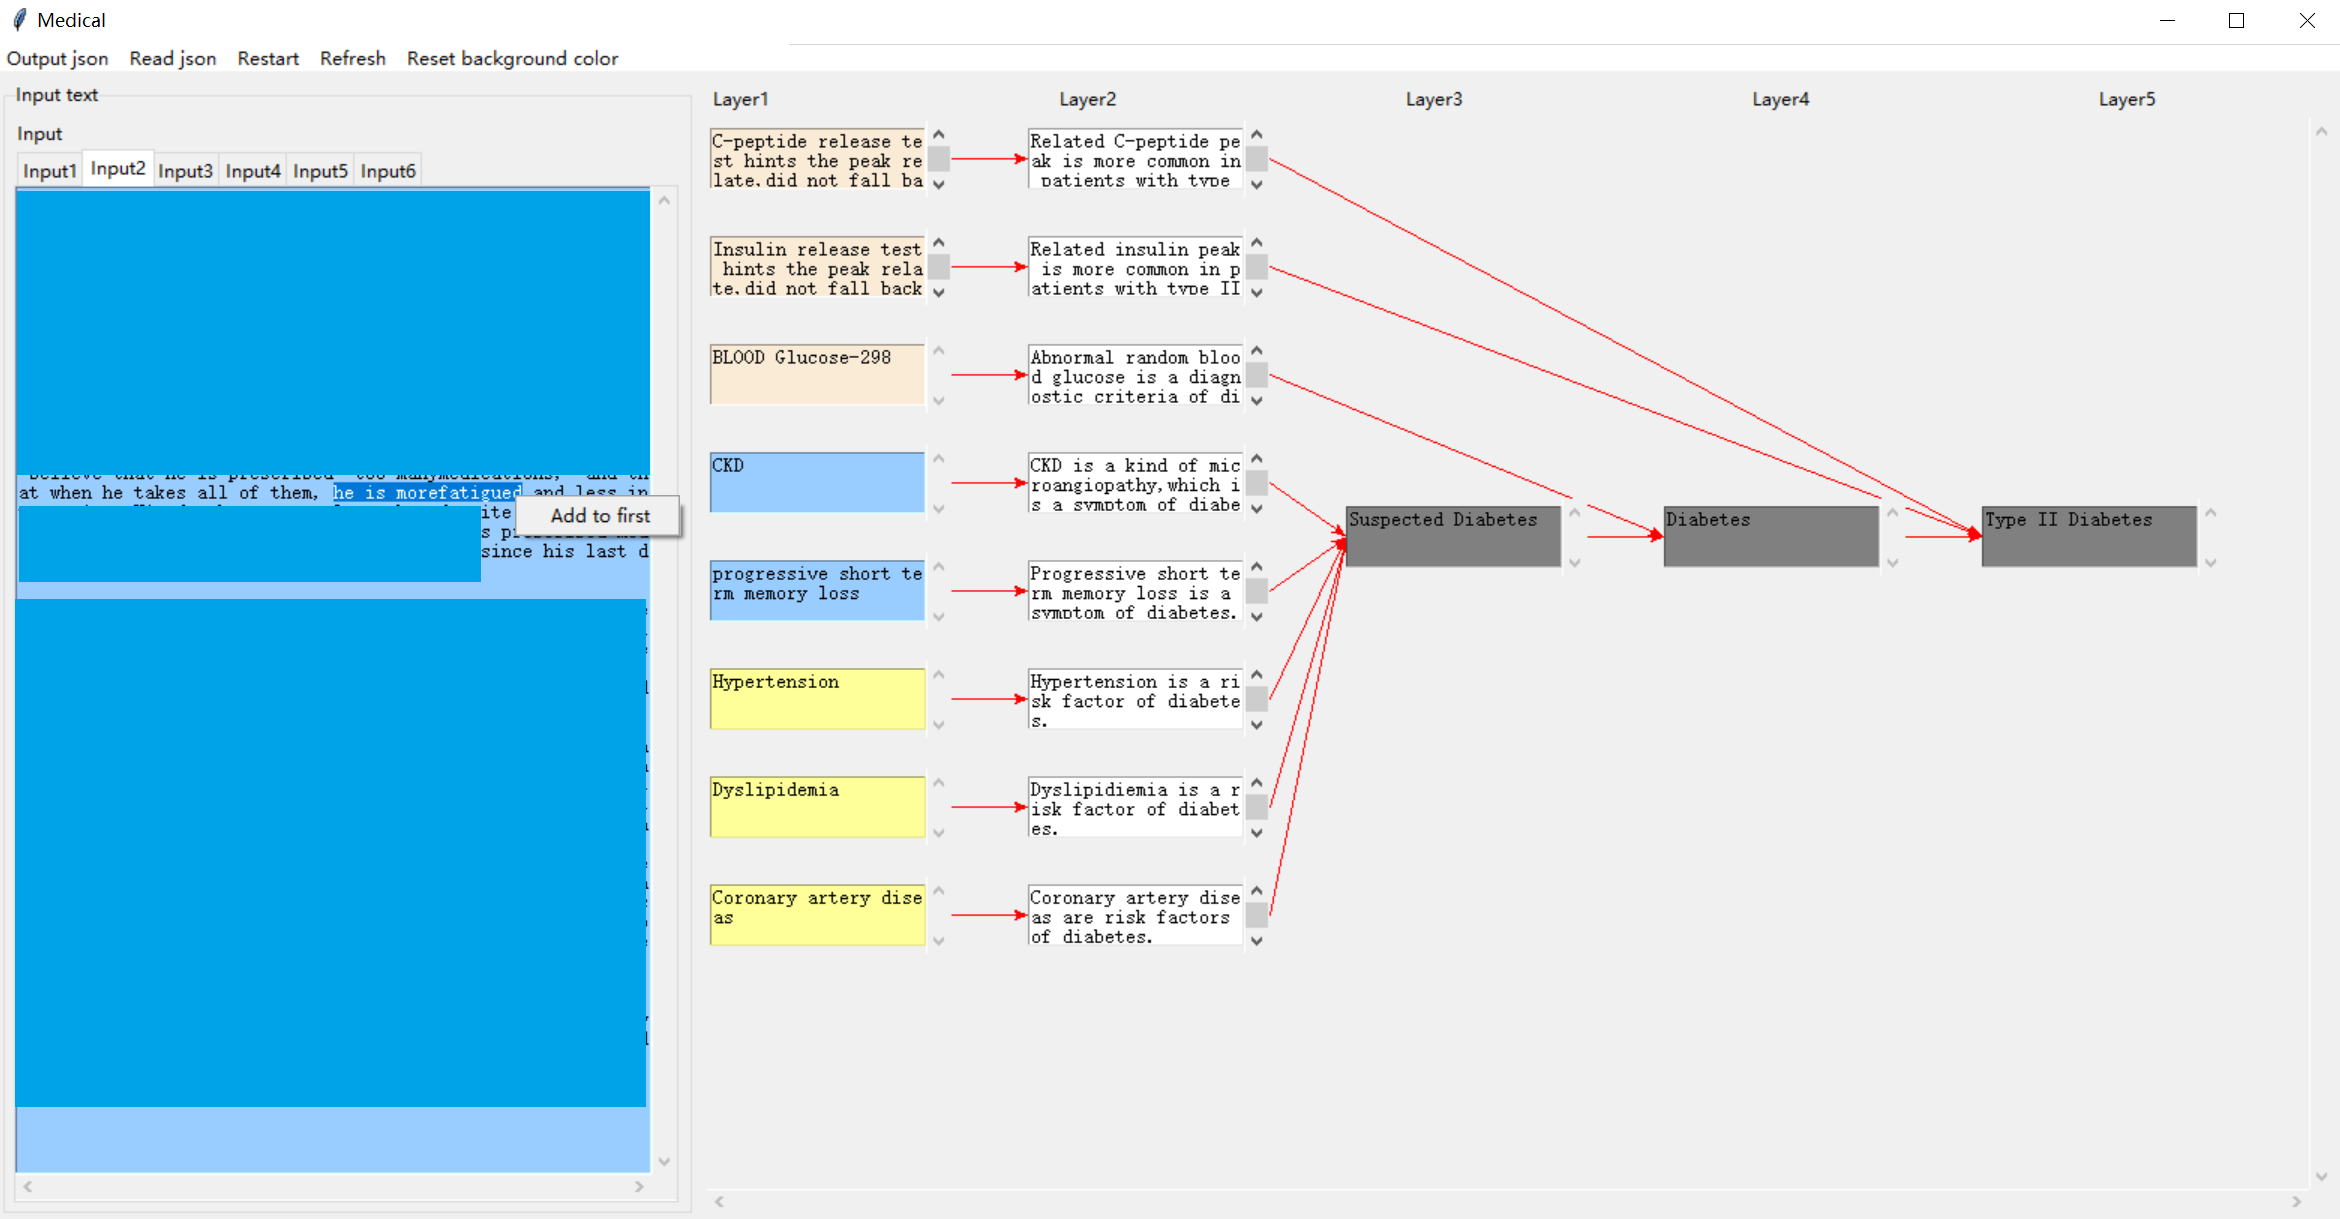
### Visual Description
# Technical Document Extraction: Medical Software Interface
## Overview
The image depicts a medical diagnostic workflow visualization tool with a flowchart and input/output panels. The interface appears to analyze clinical data to determine diabetes risk.
---
## Left Panel: Input/Output Section
### Structure
- **Header**: "Medical" (top-left corner)
- **Control Panel**:
- Options: `Output json`, `Read json`, `Restart`, `Refresh`, `Reset background color`
- **Input Fields**:
- `Input1` to `Input6` (horizontal row)
- `Input2` highlighted (white background)
- **Text Blocks**:
- Two large blue blocks (content obscured)
- Partial visible text in `Input1`/`Input2`:
```
"believe that he is prescribed too many medications... he is more fatigued... he is more fatigued and less in..."
```
- **Action Button**: "Add to first" (bottom-left)
---
## Right Panel: Diagnostic Flowchart
### Structure
- **Layers**: 5 horizontal layers (Layer1 to Layer5)
- **Color Coding**:
- **Peach**: Layer1
- **Blue**: Layer2
- **Gray**: Layer3/Layer4/Layer5
- **Connections**: Red arrows indicate data flow between layers
### Layer Details
#### Layer1 (Peach)
1. **Box 1**:
- Text: `"C-peptide release test... did not fall ba..."`
- Connection: Right arrow to Layer2 Box 1
2. **Box 2**:
- Text: `"Insulin release test... did not fall back..."`
- Connection: Right arrow to Layer2 Box 2
3. **Box 3**:
- Text: `"BLOOD Glucose-298"`
- Connection: Right arrow to Layer2 Box 3
#### Layer2 (Blue)
1. **Box 1**:
- Text: `"Related C-peptide peak... patients with type..."`
- Connection: Right arrow to Layer3 Box 1
2. **Box 2**:
- Text: `"Related insulin peak... is more common in p... patients with type II..."`
- Connection: Right arrow to Layer3 Box 2
3. **Box 3**:
- Text: `"Abnormal random blood glucose... is a diagnostic criteria of di..."`
- Connection: Right arrow to Layer3 Box 3
4. **Box 4**:
- Text: `"CKD is a kind of microangiopathy... symptom of diabetes."`
- Connection: Right arrow to Layer3 Box 4
#### Layer3 (Gray)
1. **Box 1**:
- Text: `"Progressive short-term memory loss... symptom of diabetes."`
- Connection: Right arrow to Layer4 Box 1
2. **Box 2**:
- Text: `"Suspected Diabetes"` (central node)
- Connections:
- Left: From Layer2 Box 4
- Right: To Layer4 Box 2
- Down: To Layer5 Box 1
#### Layer4 (Gray)
1. **Box 1**:
- Text: `"Hypertension is a risk factor of diabetes."`
- Connection: Right arrow to Layer5 Box 2
2. **Box 2**:
- Text: `"Diabetes"` (intermediate node)
- Connections:
- Left: From Layer3 Box 2
- Right: To Layer5 Box 3
#### Layer5 (Gray)
1. **Box 1**:
- Text: `"Type II Diabetes"` (final diagnosis)
- Connections:
- Left: From Layer3 Box 2
- Left: From Layer4 Box 2
- Right: From Layer4 Box 3
---
## Key Observations
1. **Diagnostic Flow**:
- Clinical tests (Layer1) → Abnormal results (Layer2) → Complications (Layer3) → Diagnosis (Layer4) → Final Diagnosis (Layer5)
2. **Critical Path**:
- `CKD` (Layer2) → `Suspected Diabetes` (Layer3) → `Type II Diabetes` (Layer5)
3. **Risk Factors**:
- Hypertension, Dyslipidemia, and Coronary Artery Disease (Layer4) are identified as diabetes risk factors.
---
## Language Notes
- **Primary Language**: English
- **No other languages detected**
---
## Diagram Components
| Component | Description |
|----------|-------------|
| **Input Fields** | Clinical data entry points (Input1-Input6) |
| **Flowchart Layers** | 5-stage diagnostic process |
| **Color Coding** | Peach (Layer1), Blue (Layer2), Gray (Layers3-5) |
| **Arrows** | Red connections indicating data flow |
---
## Final Diagnosis Path
```
Input Text → Layer1 Tests → Layer2 Abnormal Results → Layer3 Complications → Layer4 Diagnosis → Layer5: Type II Diabetes
```
This visualization appears to implement a clinical decision support system for diabetes risk assessment, mapping test results through progressive layers of diagnostic criteria and complications.
</details>
Figure 8: Demonstration of our annotation tool.
A.4 Access to DiReCT
Implementation code and annotation tool are available through https://github.com/wbw520/DiReCT. Data will be released through PhysioNet due to safety issues according to the license of MIMIC-IV (PhysioNet Credentialed Health Data License 1.5.0). We will use the same license for DiReCT. The download link will be accessible via GitHub. We confirm that this GitHub link and data link are always accessible. We confirm that we will bear all responsibility in case of violation of rights.
Appendix B Implementation of Baseline Method
B.1 Prompt Settings
Table 7: Prompt for narrowing-down module.
| Input Prompt |
| --- |
| Suppose you are one of the greatest AI scientists and medical expert. Let us think step by step. |
| You will review a clinical ’Note’ and your ’Response’ is to diagnose the disease that the patient have for this admission. |
| All possible disease options are in a list structure: {disease_option}. |
| Note that you can only choose one disease from the disease options and directly output the origin name of that disease. |
| Now, start to complete your task. |
| Don’t output any information other than your ’Response’. |
| ’Note’: |
| {note} |
| Your ’Response’: |
Table 8: Prompt for perception module.
| Input Prompt |
| --- |
| Suppose you are one of the greatest AI scientists and medical expert. Let us think step by step. |
| You will review a part of clinical "Note" from a patient. |
| The disease for which the patient was admitted to hospital this time is {disease}. |
| Your task is to extract the original text as confidence "Observations" that lead to {disease}. |
| Here are some premise for the diagnosis of this disease category. You can refer them for your task. Premise are: {premise} |
| Note that you also need to briefly provide the "Reason" for your extraction. |
| Note that both "Observations" and "Reason" should be string. |
| Note that your "Response" should be a list structure as following |
| : [["Observation", "Reason"], ……, ["Observation", "Reason"]] |
| Note that if you can’t find any "Observation" your "Response" should be: []. |
| Now, start to complete your task. |
| Note that you should not output any information other than your "Response". |
| "Note": |
| {note} |
| Note that you should not output any information other than your "Response". |
| Your "Response": |
Table 9: Prompt for reasoning module.
| Input Prompt |
| --- |
| Suppose you are one of the greatest AI scientists and medical expert. Let us think step by step. |
| You will receive a list of "Observations" from a clinical "Note". These "Observations" are possible support to diagnose {disease}. |
| Based on these "Observations", you need to diagnose the "Disease" from the following options: {disease_option}. |
| Here are some golden standards to discriminate diseases. You can refer them for your task. Golden standards are: {premise} |
| Note that you can only choose one "Disease" from the disease options and directly output the name in disease options. |
| Note that you also required to select the "Observations" that satisfy the golden standard to diagnose the "Disease" you choose. |
| Note that you also required to provide the "Reason" for your choice. |
| Note that your "Response" should be a list structure as following |
| :[["Observation", "Reason", "Disease"], ……, ["Observation", "Reason", "Disease"]] |
| Note that if you can’t find any "Observation" to support a disease option, your "Response" should be: None |
| Now, start to complete your task. |
| Note that you should not output any information other than your "Response". |
| "Observations": |
| {observation} |
| Note that you should not output any information other than your "Response". |
| Your "Response": |
In this section, we demonstrate the prompt we used for each module (From Table 7 - 9 for narrowing-down, perception, and reasoning module, respectively).
In Table 7, {disease_option} is the name for all disease categories, and {note} is the content for the whole clinical note. The response for the model is the name of a possible disease $\hat{i}$ .
In Table 8, {disease} is the disease category name predicted in narrowing-down. The content marked blue is the premise, which is only provided during the $\mathcal{k}$ setting. In this module, {premise} is offered with all information in the knowledge graph. Different to narrowing-down, {note} is implemented for each clinical data $R=\{r\}$ and the outputs are combined together for $\hat{\mathcal{O}}$ and $\hat{\mathcal{E}}$ .
In Table 9, {disease} is the disease category name and {disease_option} is consisted by the children nodes $\{d_{n}\}_{n}$ . Similarly, the premise on the blue is only available for the $\mathcal{k}$ setting. It provides the premise that are criteria for the diagnosis of each children node. {observation} is the extracted $\hat{\mathcal{O}}$ in previous step. We provide all the prompts and the complete implementation code on GitHub.
B.2 Details of Automatic Evaluation
The automatic evaluation is realized by LLama3 8B. We demonstrate the prompt for this implement in Table 10 (for observation) and Table 11 (for rationalization). Note that we do not use few-shot samples for the evaluation of observation. In Table 10, {gt_observation} and {pred_observation} are from model prediction and ground-truth. As this is a simple similarity comparison task to discriminate whether the model finds similar observations to humans, LLama3 itself have such ability. We do not strict to exactly match due to the difference in length of extracted raw text (as long as the observation expresses the same description). In Table 11, {gt_reasoning} and {pred_reasoning} are from model prediction and ground-truth. We require the rationale to be complete (content of the expression can be understood from the rationale alone) and meaningful; therefore, we provide five samples for this evaluation. We also provide all the prompts and the complete implementation code on GitHub.
Table 10: Prompt for evaluation of observation.
| Input Prompt |
| --- |
| Suppose you are one of the greatest AI scientists and medical expert. Let us think step by step. |
| You will receive two "Observations" extracted from a patient’s clinical note. |
| Your task is to discriminate whether they textually description is similar? |
| Note that "Response" should be one selection from "Yes" or "No". |
| Now, start to complete your task. |
| Don’t output any information other than your "Response". |
| "Observation 1": {gt_observation} |
| "Observation 2": {pred_observation} |
| Your "Response": |
Table 11: Prompt for evaluation of rationalization.
| Input Prompt |
| --- |
| Suppose you are one of the greatest AI scientists and medical expert. Let us think step by step. |
| You will receive two "Reasoning" for the explanation of why an observation cause a disease. |
| Your task is to discriminate whether they explain a similar medical diagnosis premise? |
| Note that "Response" should be one selection from "Yes" or "No". |
| Here are some samples: |
| Sample 1: |
| "Reasoning 1": Facial sagging is a classic symptom of stroke |
| "Reasoning 2": Indicates possible facial nerve palsy, a common symptom of stroke |
| "Response": Yes |
| Sample 2: |
| "Reasoning 1": Family history of Diabetes is an important factor |
| "Reasoning 2": Patient’s mother had a history of Diabetes, indicating a possible genetic predisposition to stroke |
| "Response": Yes |
| Sample 3: |
| "Reasoning 1": headache is one of the common symptoms of HTN |
| "Reasoning 2": Possible symptom of HTN |
| "Response": No |
| Sample 4: |
| "Reasoning 1": Acute bleeding is one of the typical symptoms of hemorrhagic stroke |
| "Reasoning 2": The presence of high-density areas on Non-contrast CT Scan is a golden standard for Hemorrhagic Stroke |
| "Response": No |
| Sample 5: |
| "Reasoning 1": Loss of strength on one side of the body, especially when compared to the other side, is a common sign of stroke |
| "Reasoning 2": Supports ischemic stroke diagnosis |
| "Response": No |
| Now, start to complete your task. |
| Don’t output any information other than your "Response". |
| "Reasoning 1": {gt_reasoning} |
| "Reasoning 2": {pred_reasoning} |
| Your "Response": |
B.3 Prediction Samples
Figure 9 and 10 shows two sample generated by GPT-4. The ground-truth PDD of the input clinical note is Gastroesophageal Reflux Disease (GERD) and Heart Failure (HF). In these figure, purple, orange, and red indicate explanations only in the ground truth, only in prediction, and common in both, respectively; therefore, red is a successful prediction of an explanation, while purple and orange are a false negative and false positive.
<details>
<summary>x8.png Details</summary>
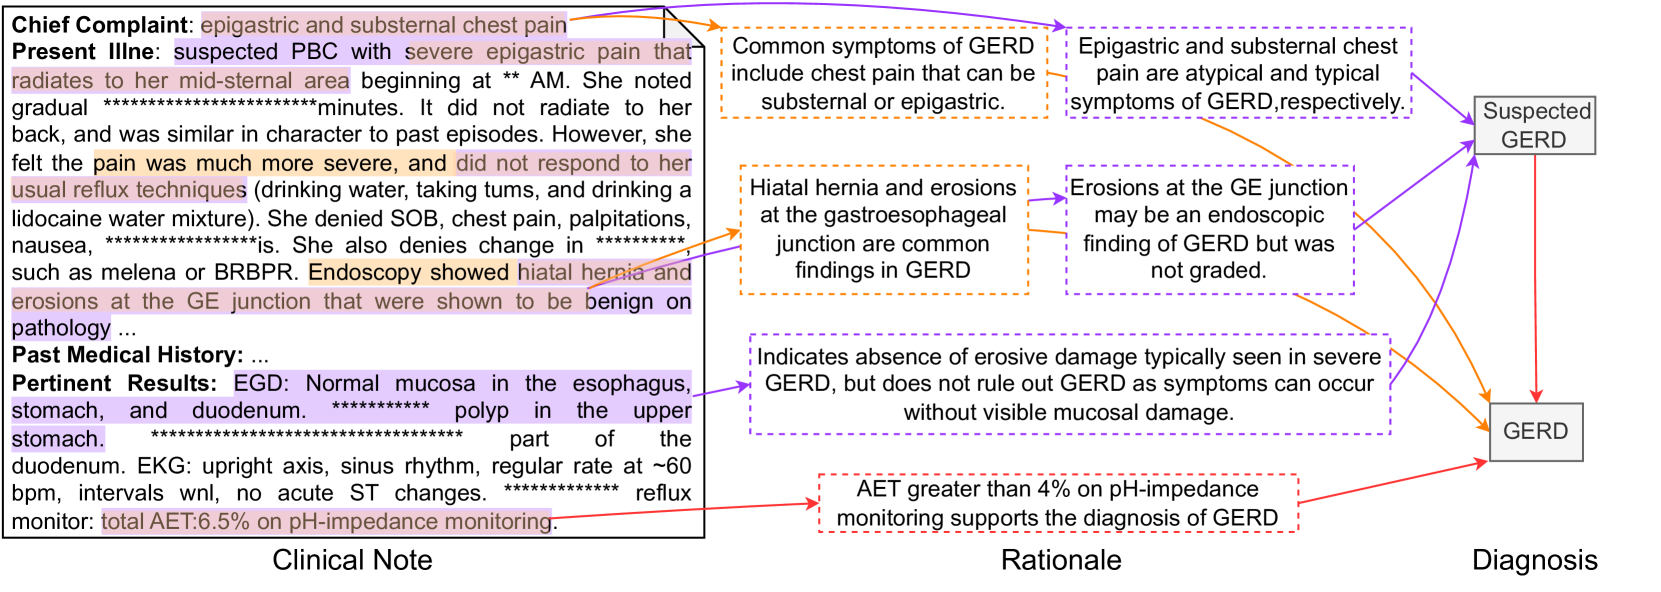
### Visual Description
# Technical Document Extraction: Clinical Note Flowchart
## Overview
The image is a flowchart diagram summarizing a clinical note for a patient with suspected Gastroesophageal Reflux Disease (GERD). The diagram is divided into three main sections: **Clinical Note**, **Rationale**, and **Diagnosis**, with color-coded arrows connecting symptoms, findings, and conclusions.
---
## Clinical Note Section
### Key Labels and Text
- **Chief Complaint**:
- "epigastric and substernal chest pain"
- **Present Illness**:
- "suspected PBC with severe epigastric pain that radiates to her mid-sternal area beginning at ** AM."
- "It did not radiate to her back, and was similar in character to past episodes."
- "She denied water, taking tums, and drinking a lidocaine water mixture."
- "She denied SOB, chest pain, palpitations, nausea, ******."
- "She also denies changes in ****** such as melena or BRBPR."
- "Endoscopy showed hiatal hernia and erosions at the GE junction that were shown to be benign on pathology..."
- **Past Medical History**:
- "..." (No details provided)
- **Pertinent Results**:
- "EGD: Normal mucosa in the esophagus, stomach, and duodenum. ****** polyp in the upper stomach, ****** of the duodenum."
- "EKG: upright axis, sinus rhythm, regular rate at ~60 bpm, intervals wnl, no acute ST changes. ****** reflux monitor: total AET:6.5% on pH-impedance monitoring."
### Highlighted Text (Key Findings)
- **Epigastric and substernal chest pain** (purple highlight)
- **Hiatal hernia and erosions at the GE junction** (orange highlight)
- **Normal mucosa in the esophagus, stomach, and duodenum** (blue highlight)
- **AET greater than 4% on pH-impedance monitoring** (red highlight)
---
## Rationale Section
### Key Labels and Text
- **Common symptoms of GERD**:
- "include chest pain that can be substernal or epigastric."
- **Hiatal hernia and erosions at the gastroesophageal junction**:
- "are common findings in GERD."
- **Absence of erosive damage**:
- "Indicates absence of erosive damage typically seen in severe GERD, but does not rule out GERD as symptoms can occur without visible mucosal damage."
- **AET >4% on pH-impedance monitoring**:
- "supports the diagnosis of GERD."
### Color-Coded Arrows
- **Purple arrows**: Link symptoms (e.g., epigastric/substernal chest pain) to GERD.
- **Orange arrows**: Connect findings (e.g., hiatal hernia, erosions) to GERD.
- **Red arrows**: Highlight diagnostic support (e.g., AET >4%).
---
## Diagnosis Section
### Key Labels and Text
- **Suspected GERD**:
- "Epigastric and substernal chest pain are atypical and typical symptoms of GERD, respectively."
- **Final Diagnosis**:
- "GERD" (confirmed via flowchart connections).
- "AET greater than 4% on pH-impedance monitoring supports the diagnosis of GERD."
---
## Diagram Components and Flow
1. **Clinical Note**:
- Contains patient history, symptoms, and test results.
- Highlighted text emphasizes critical findings (e.g., chest pain, hiatal hernia).
2. **Rationale**:
- Explains how symptoms and findings align with GERD.
- Uses color-coded arrows to map connections:
- Purple: Symptom → GERD
- Orange: Finding → GERD
- Red: Diagnostic support → GERD
3. **Diagnosis**:
- Concludes with "GERD" as the final diagnosis.
- Reinforces AET >4% as a key diagnostic criterion.
---
## Color Legend and Spatial Grounding
- **Legend**: Not explicitly labeled, but colors are used consistently:
- **Purple**: Symptoms (e.g., chest pain).
- **Orange**: Findings (e.g., hiatal hernia).
- **Red**: Diagnostic support (e.g., AET >4%).
- **Spatial Placement**:
- Clinical Note: Left side.
- Rationale: Middle.
- Diagnosis: Right side.
---
## Key Trends and Data Points
- **Symptoms**:
- Epigastric and substernal chest pain (atypical and typical GERD symptoms).
- **Findings**:
- Hiatal hernia and erosions at the GE junction (confirmed via endoscopy).
- **Test Results**:
- Normal mucosa in EGD but presence of a polyp in the upper stomach.
- EKG: Normal sinus rhythm, no acute ST changes.
- AET: 6.5% on pH-impedance monitoring (supports GERD diagnosis).
---
## Conclusion
The flowchart systematically links clinical symptoms, endoscopic findings, and diagnostic test results to confirm GERD. The use of color-coded arrows clarifies the reasoning process, emphasizing that while erosive damage is absent, other criteria (e.g., AET >4%) validate the diagnosis.
</details>
Figure 9: An example prediction for a clinical note with PDD of GERD by GPT-4
<details>
<summary>x9.png Details</summary>
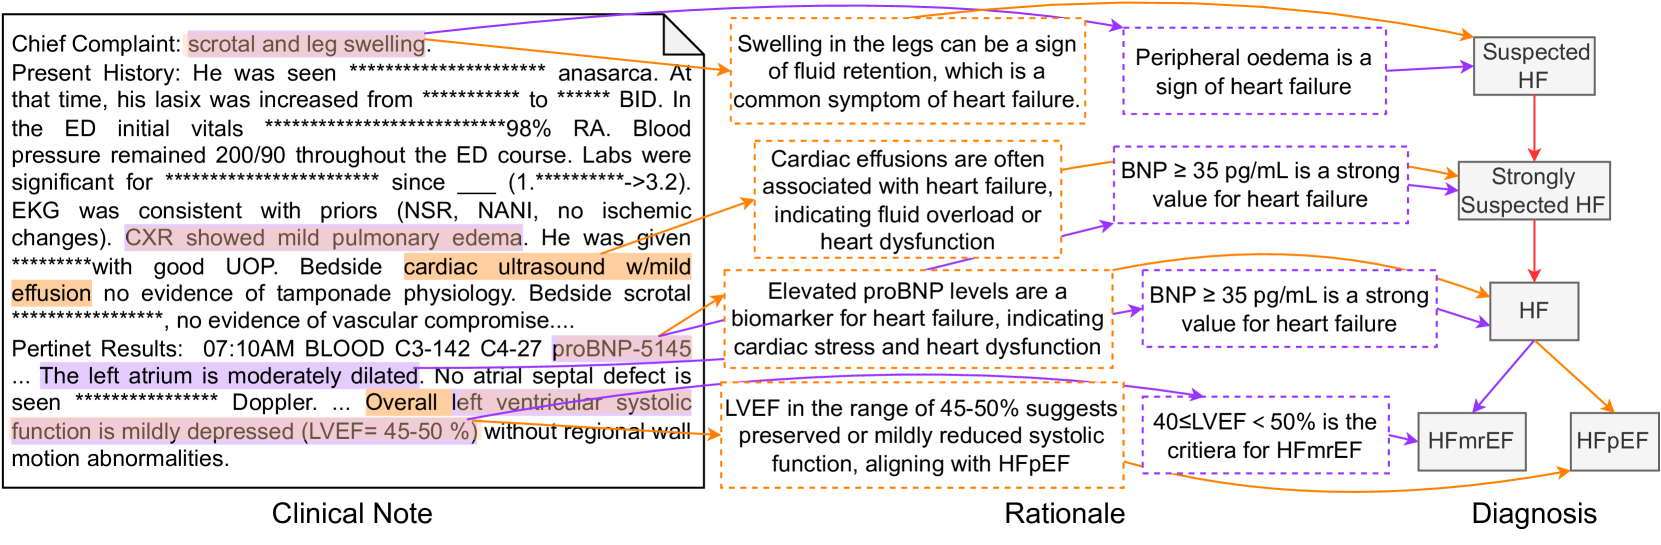
### Visual Description
# Technical Document Extraction: Clinical Note and Diagnostic Flowchart
## Clinical Note
**Chief Complaint**: Scrotal and leg swelling
**Present History**:
- Seen with anasarca (generalized edema).
- Lasix increased from ********** to BID (twice daily).
- ED initial vitals: 98% RA (respiratory rate), blood pressure 200/90 throughout ED course.
- Labs: Significant for ********** since ___ (1.**********>-3.2).
- EKG: Consistent with priors (NSR, NANI, no ischemic changes).
- CXR: Mild pulmonary edema.
- Cardiac ultrasound: Effusion with good UOP (ultrasound of the prostate?), bedside cardiac ultrasound w/mild effusion, no evidence of tamponade physiology or vascular compromise.
**Pertinent Results**:
- 07:10 AM BLOOD: C3-142, C4-27, proBNP-5545.
- Left atrium: Moderately dilated. No atrial septal defect.
- Overall left ventricular function: Mildly depressed (LVEF=45-50%) without regional wall motion abnormalities.
---
## Rationale
1. **Swelling in the legs** → Sign of fluid retention (common in heart failure).
2. **Cardiac effusions** → Associated with heart failure (fluid overload/dysfunction).
3. **Elevated proBNP levels** (≥35 pg/mL) → Biomarker for heart failure (cardiac stress/dysfunction).
4. **LVEF 45-50%** → Preserved/mildly reduced systolic function (aligns with HFmrEF criteria).
---
## Diagnosis Flowchart
### Nodes and Connections
1. **Suspected HF**
- **Peripheral oedema** → Sign of heart failure.
- **BNP ≥35 pg/mL** → Strong value for heart failure.
- **Cardiac effusions** → Associated with heart failure.
2. **HF** (Heart Failure)
- Connected to all rationale points above.
3. **HFmrEF** (Heart Failure with mildly reduced ejection fraction)
- **40 ≤ LVEF < 50%** → Criteria for HFmrEF.
- Connected to rationale: "LVEF in the range of 45-50% suggests preserved/mildly reduced systolic function."
4. **HFpEF** (Heart Failure with preserved ejection fraction)
- Connected to rationale: "LVEF 45-50% aligns with HFpEF."
### Flow Logic
- **BNP ≥35 pg/mL** → Directly leads to **HF**.
- **LVEF 45-50%** → Branches to **HFmrEF** and **HFpEF**.
- **Cardiac effusions** and **peripheral oedema** reinforce **HF** suspicion.
---
## Key Observations
- **Highlighted Text**:
- "scrotal and leg swelling" (chief complaint).
- "mild pulmonary edema" (CXR finding).
- "cardiac ultrasound effusion" (fluid around heart).
- "LVEF=45-50%" (critical for HFmrEF/HFpEF diagnosis).
- **Diagnostic Criteria**:
- **HFmrEF**: LVEF 40-50%.
- **HFpEF**: LVEF ≥50% with symptoms/signs of heart failure.
- **Flowchart Structure**:
- Nodes represent diagnoses (HF, HFmrEF, HFpEF).
- Arrows connect clinical findings (BNP, LVEF, effusions) to diagnoses.
---
## Notes on Data Representation
- No numerical trends or heatmaps present.
- Flowchart uses textual labels and arrows to map clinical findings to diagnoses.
- Color coding not explicitly described in the image.
This extraction captures all textual and diagrammatic elements, ensuring alignment between clinical rationale and diagnostic flowchart logic.
</details>
Figure 10: An example prediction for a clinical note with PDD of HF by GPT-4
In Figure 9, we can observe that GPT-4 can find the key observation for the diagnosis of GERD, which is consistent with human in both observation and rationale. However, it still lacks the ability to identify all observations and establish accurate relationships for diseases. In Figure 10, the model’s predictions do not align well with those of a human doctor. Key observations, such as the relationships between BNP and LVEF, are incorrectly identified, leading to a final misdiagnosis.
B.4 Experiments for No Extra Knowledge
Table 12: Prompt for $\mathcal{D}^{\star}$ setting.
| Input Prompt |
| --- |
| Suppose you are one of the greatest AI scientists and medical expert. Let us think step by step. |
| You will review a clinical ’Note’ and your ’Response’ is to diagnose the disease that the patient have for this admission. |
| All possible disease options are in a list structure: {disease_options}. |
| Note that you can only choose one disease from the disease options and directly output the origin name of that disease. |
| Now, start to complete your task. |
| Don’t output any information other than your ’Response’. |
| ’Note’: |
| {note} |
| Your ’Response’: |
Table 13: Prompt for no knowledge setting.
| Input Prompt |
| --- |
| Suppose you are one of the greatest AI scientists and medical expert. Let us think step by step. |
| You will review a clinical ’Note’ and your ’Response’ is to diagnose the disease that the patient have for this admission. |
| Note that you can only give one disease name and directly output the name of that "Disease". |
| Now, start to complete your task. |
| Don’t output any information other than your ’Response’. |
| ’Note’: |
| {note} |
| Your ’Response’: |
We demonstrate the prompt used for $\mathcal{D}^{\star}$ and no knowledge settings in Table 12 and Table 13, respectively. {note} is the text of whole clinical note and {note} in Table 12 is the name of all leaf node $\mathcal{D}^{\star}$ .
B.5 Experimental Settings
All experiments are implemented with a temperature value of 0. All close sourced models are implemented in a local server with 4 NVIDIA A100 GPU.
Appendix C Failed Attempts on DiReCT
In this section, we discuss some unsuccessful attempts during the experiments.
Extract observation from the whole clinical note. We try to diagnose the disease and extract observation, and the corresponding rationale using the prompt shown in Table 14. The {note} is offered by the whole content in the clinical note. We find that even though the model can make the correct diagnosis, only a few observations can be extracted (no more than 4), which decreases the completeness and faithfulness.
Table 14: Prompt for extracting observation in one step.
| Input Prompt |
| --- |
| Suppose you are one of the greatest AI scientists and medical expert. Let us think step by step. |
| You will review a clinical ’Note’, and your ’Response’ is to diagnose the disease that the patient has for this admission. |
| All possible disease options are in a list structure: {disease_options}. |
| Note that you can only choose one disease from the disease options and directly output the origin name of that disease. |
| Note that you also need to extract original text as confidence "Observations" that lead to the "Disease" you selected. |
| Note that you should extract all necessary "Observation". |
| Note that you also need to briefly provide the "Reason" for your extraction. |
| Note that both "Observations" and "Reason" should be string. |
| Note that your "Response" should be a list structure as following |
| :[["Observation", "Reason", "Disease"], ……, ["Observation", "Reason", "Disease"]] |
| Now, start to complete your task. |
| Don’t output any information other than your ’Response’. |
| ’Note’ |
| : {note} |
| Your ’Response’: |
End-to-End prediction. We also try to output the whole reasoning process in one step (without iteration) when given observations. We show our prompt in Table 15. We find that using such a prompt model can not correctly recognize the relation between observation, rationale, and diagnosis.
Table 15: Prompt for extracting observation in one step.
| Input Prompt |
| --- |
| Suppose you are one of the greatest AI scientists and medical expert. Let us think step by step. |
| You will receive a list of "Observations" from a clinical "Note" for the diagnosis of stroke. |
| Here is the diagnostic route of stroke in a tree structure: |
| -Suspected Stroke |
| -Hemorrhagic Stroke |
| -Ischemic Stroke |
| Here are some premise for the diagnosis of this disease. You can refer them for your task. Premise are: {premise} |
| Based on these "Observations", starting from the root disease, your target is to diagnose one of the leaf disease. |
| Note that you also required to provide the "Reason" for your reasoning. |
| Note that your "Response" should be a list structure as following |
| :[["Observation", "Reason", "Disease"], ……, ["Observation", "Reason", "Disease"]] |
| Note that if you can’t find any "Observation" to support a disease option, your "Response" should be: None |
| Now, start to complete your task. |
| Note that you should not output any information other than your "Response". |
| "Observations": |
| {observation} |
| Note that you should not output any information other than your "Response". |
| Your "Response": |
Appendix D Ethical Considerations
Utilizing real-world EHRs, even in a de-identified form, poses inherent risks to patient privacy. Therefore, it is essential to implement rigorous data protection and privacy measures to safeguard sensitive information, in accordance with regulations such as HIPAA. We strictly adhere to the Data Use Agreement of the MIMIC dataset, ensuring that the data is not shared with any third parties. All experiments are implement on a private server. The access to GPT is also a private version.
AI models are susceptible to replicating and even intensifying the biases inherent in their training data. These biases, if not addressed, can have profound implications, particularly in sensitive domains such as healthcare. Unconscious biases in healthcare systems can result in significant disparities in the quality of care and health outcomes among different demographic groups. Therefore, it is imperative to rigorously examine AI models for potential biases and implement robust mechanisms for ongoing monitoring and evaluation. This involves analyzing the model’s performance across various demographic groups, identifying any disparities, and making necessary adjustments to ensure equitable treatment for all. Continual vigilance and proactive measures are essential to mitigate the risk of biased decision-making and to uphold the principles of fairness and justice in AI-driven healthcare solutions.