## DOES SPATIAL COGNITION EMERGE IN FRONTIER MODELS?
Santhosh Kumar Ramakrishnan ∗ Erik Wijmans Philipp Kr¨ ahenb¨ uhl Vladlen Koltun
Apple
## ABSTRACT
Not yet. We present SPACE, a benchmark that systematically evaluates spatial cognition in frontier models. Our benchmark builds on decades of research in cognitive science. It evaluates large-scale mapping abilities that are brought to bear when an organism traverses physical environments, smaller-scale reasoning about object shapes and layouts, and cognitive infrastructure such as spatial attention and memory. For many tasks, we instantiate parallel presentations via text and images, allowing us to benchmark both large language models and large multimodal models. Results suggest that contemporary frontier models fall short of the spatial intelligence of animals, performing near chance level on a number of classic tests of animal cognition. Code and data are available: https://github.com/apple/ml-space-benchmark
## 1 INTRODUCTION
Frontier models have achieved impressive performance in mathematics, coding, general knowledge, and commonsense reasoning (Hendrycks et al., 2021a;b; Chen et al., 2021; Sakaguchi et al., 2021; Yue et al., 2024). This remarkable progress has inspired characterizations of frontier models as possessing the intelligence of a smart high schooler and predictions of the imminent arrival of superintelligence (Aschenbrenner, 2024). These characterizations are often underpinned by the premise that competence (or even mastery) in some aspects of cognition is symptomatic of broad cognitive competence. This is not self-evident. To quote Brooks's first law of artificial intelligence, 'When an AI system performs a task, human observers immediately estimate its general competence in areas that seem related. Usually that estimate is wildly overinflated.' (Brooks, 2024).
Our work focuses on spatial cognition, a foundational form of intelligence that is present in a broad spectrum of animals including humans (Marshall & Fink, 2001; Waller & Nadel, 2013; Mallot, 2024). Spatial cognition refers to the ability of animals to perceive and interact with their surroundings, build mental representations of objects and environments, and draw upon these representations to support navigation and manipulation. Decades of research in animal cognition have characterized the spatial cognition of mice, rats, bats, pigeons, corvids, dogs, wolves, elephants, marmosets, tamarins, howler monkeys, baboons, chimpanzees, and humans (Tolman, 1948; Menzel, 1973; Peters, 1974; Gillner & Mallot, 1998; Marshall & Fink, 2001; Noser & Byrne, 2007; Tommasi et al., 2012; Porter & Garber, 2013; Blaser et al., 2013; Geva-Sagiv et al., 2015; Presotto et al., 2019; de Guinea et al., 2021; Payne et al., 2021; Xu et al., 2024; Xavier et al., 2024; Welklin et al., 2024). Human infants already possess rudimentary spatial cognition, which subsequently improves along developmental schedules that have been characterized (Blades & Spencer, 1994; Newcombe, 2000; Vasilyeva & Lourenco, 2012). Spatial cognition is known to underpin more advanced cognitive abilities (Kozhevnikov et al., 2007; Newcombe, 2010; Young et al., 2018).
The emergence of spatial cognition has been linked to embodiment (Smith & Gasser, 2005; Jansen & Heil, 2010; Frick & M¨ ohring, 2016), without which the development of spatial cognition may be impaired (Foreman et al., 1990; Anderson et al., 2013). However, frontier models are typically trained in a disembodied manner on corpora of text, images, and video. Does spatial cognition emerge in disembodied frontier models? To study this question systematically, we develop SPACE,
∗ Corresponding author: s ramakrishnan@apple.com
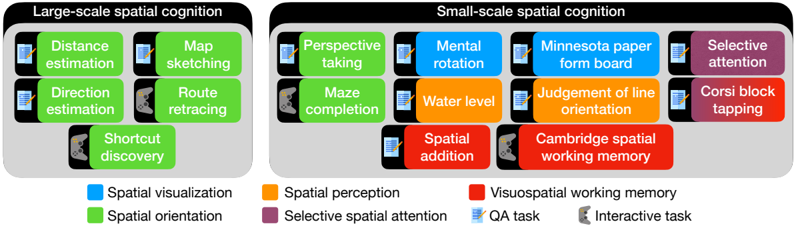
Figure 1: SPACE: Spatial Perception And Cognition Evaluation. We design a suite of spatial cognition tasks based on the cognitive science literature. These are broadly classified into large-scale and small-scale spatial cognition. Large-scale tasks require understanding space at the level of environments and evaluate spatial orientation and cognitive mapping abilities. Small-scale tasks require understanding space at the level of objects or object arrangements and evaluate skills such as spatial visualization, spatial orientation, spatial perception, selective spatial attention and visuospatial working memory. These tasks can be multiple-choice question answering, or interactive games. We develop multimodal as well as purely textual presentations, which support evaluation of both large language models (LLMs) and vision-language models (VLMs).
<details>
<summary>Image 1 Details</summary>
### Visual Description
\n
## Diagram: Spatial Cognition Tasks
### Overview
The image presents a diagram categorizing spatial cognition tasks into two main groups: Large-scale spatial cognition and Small-scale spatial cognition. Each category contains several specific tasks, visually represented as rounded rectangles with icons and labels. A legend at the bottom of the diagram explains the color-coding used to indicate the cognitive process involved in each task.
### Components/Axes
The diagram is divided into two main sections, labeled "Large-scale spatial cognition" (left) and "Small-scale spatial cognition" (right). Each section contains a grid of task labels within colored rectangles. The legend at the bottom provides a key for the colors, associating them with different cognitive processes:
* **Blue:** Spatial visualization
* **Green:** Spatial orientation
* **Orange:** Spatial perception
* **Red:** Visuospatial working memory
* **Light Blue:** Selective spatial attention
* **Black Icon:** QA task
* **Grey Icon:** Interactive task
### Detailed Analysis or Content Details
**Large-Scale Spatial Cognition (Left Side):**
* **Distance estimation:** Blue rectangle with a grey icon.
* **Map sketching:** Green rectangle with a grey icon.
* **Direction estimation:** Blue rectangle with a grey icon.
* **Route retracing:** Green rectangle with a grey icon.
* **Shortcut discovery:** Green rectangle with a grey icon.
**Small-Scale Spatial Cognition (Right Side):**
* **Perspective taking:** Blue rectangle with a grey icon.
* **Mental rotation:** Orange rectangle with a grey icon.
* **Minnesota paper form board:** Blue rectangle with a grey icon.
* **Selective attention:** Light Blue rectangle with a grey icon.
* **Maze completion:** Orange rectangle with a grey icon.
* **Water level:** Orange rectangle with a grey icon.
* **Judgement of line orientation:** Orange rectangle with a grey icon.
* **Corsi block tapping:** Red rectangle with a grey icon.
* **Spatial addition:** Orange rectangle with a grey icon.
* **Cambridge spatial working memory:** Red rectangle with a grey icon.
### Key Observations
The diagram visually separates spatial cognition into large-scale and small-scale processes. The color-coding highlights the different cognitive abilities involved in each task. Tasks involving spatial visualization and orientation (blue and green) are prominent in large-scale cognition, while spatial perception and visuospatial working memory (orange and red) are more prevalent in small-scale cognition. The presence of both QA and interactive task icons suggests a distinction in the method of assessment for these tasks.
### Interpretation
This diagram illustrates a conceptual framework for understanding the diverse range of cognitive processes involved in spatial cognition. The distinction between large-scale and small-scale cognition likely reflects differences in the spatial extent and complexity of the tasks. Large-scale tasks involve navigating and understanding environments, while small-scale tasks focus on manipulating and reasoning about objects within a limited space. The color-coding provides a valuable way to categorize tasks based on the underlying cognitive abilities they engage. The inclusion of task type icons (QA vs. Interactive) suggests that the assessment methods used for these tasks may differ, potentially influencing the cognitive processes emphasized. This diagram could be used as a basis for designing experiments or interventions aimed at improving specific aspects of spatial cognition.
</details>
a benchmark that builds on decades of research in cognitive science. Our benchmark comprises two broad classes of tasks, covering large-scale and small-scale spatial cognition (Hegarty et al., 2006; Meneghetti et al., 2022; Newcombe, 2024). See Figure 1 for an overview.
Large-scale spatial cognition has to do with a model's ability to understand its surroundings. In large-scale tasks, the model is familiarized with an environment and is then asked to estimate distances and directions to landmarks, sketch a map of the environment, retrace a known route, or discover a shortcut to a goal. Small-scale spatial cognition has to do with a model's ability to perceive, imagine, and mentally transform objects in two or three dimensions. Together, large-scale and small-scale tasks evaluate core cognitive abilities such as spatial perception, visualization, orientation, selective attention, and visuospatial memory (Lacroix et al., 2021; Meneghetti et al., 2022).
We design text-based and image-based presentations to evaluate both large language-only and vision-language models (LLMs and VLMs, respectively). Our results indicate that contemporary frontier models have not yet reached competency - let alone mastery - in spatial cognition. On key large-scale spatial cognition tasks, frontier multimodal models perform near chance level, even when presented with an allocentric (map) view of the environment. The strongest models exhibit much better performance on some small-scale tasks that evaluate selective spatial attention and visuospatial working memory, especially with purely textual presentations via character arrays, but perform near chance on other tasks such as mental rotation (Vandenberg & Kuse, 1978), perspective taking (Kozhevnikov & Hegarty, 2001), maze completion (Lacroix et al., 2021), or the classic Minnesota Paper Form Board test (Likert & Quasha, 1941; 1969).
## 2 RELATED WORK
Spatial cognition. Spatial cognition is a branch of cognitive science that seeks to understand how humans and animals perceive, interpret, represent, and interact with objects and environments (Marshall & Fink, 2001; Landau, 2002; Waller & Nadel, 2013; Mallot, 2024; Newcombe, 2024). This involves the perception of object sizes, shapes, and scales, as well as the relationships between objects and landmarks in the environment (including location, distance, direction, and orientation). Spatial cognition is broadly divided into two categories: large-scale and small-scale (Hegarty et al., 2006; Jansen, 2009; Meneghetti et al., 2022; Newcombe, 2024). Large-scale spatial cognition refers to the ability to build spatial representations of environments and use them effectively for navigation and spatial reasoning. Large-scale spatial cognition tasks typically involve egocentric spatial transformations, where the viewer's perspective changes with respect to the environment while the spatial relationships between parts of the environment remain constant (Wang et al., 2014). Smallscale spatial cognition refers to the ability to perceive, imagine, and mentally transform objects or shapes in 2D or 3D. This is typically evaluated using paper and pencil tasks that require allocentric spatial transformations of objects and shapes (Wang et al., 2014). While large-scale spatial cognition has been demonstrated in a wide range of animals (Tolman, 1948; Menzel, 1973; Peters, 1974;
O'Keefe & Nadel, 1978; Gillner & Mallot, 1998; Richardson et al., 1999; Geva-Sagiv et al., 2015; Toledo et al., 2020), the study of small-scale spatial cognition is specific to humans.
Emergent spatial representations. Several works have shown that spatial representations, a phenomenon similar to spatial cognition, can emerge in neural networks (Banino et al., 2018; Cueva & Wei, 2018; Wijmans et al., 2023; Sorscher et al., 2023). These works train a neural network from scratch for path integration or navigation tasks and analyze the model weights to identify spatial representations.
Spatial reasoning in large language models. PlanBench (Valmeekam et al., 2024) and CogEval (Momennejad et al., 2023) evaluate LLMs on text-based planning tasks such as navigation, delivery logistics and block stacking to evaluate cognitive mapping and planning. Yamada et al. (2024) evaluate spatial reasoning in LLMs by performing map traversals on different types of graphs and evaluate the model's self-localization ability. EWOK (Ivanova et al., 2024) studies spatial plausibility reasoning in LLMs. In comparison to these benchmarks, SPACE evaluates a broader array of cognitive abilities and implements multimodal presentations of classic animal cognition experiments.
Benchmarks for large multimodal models. The recent successes of multimodal models (OpenAI, 2024; Li et al., 2024a; Reid et al., 2024) have been facilitated by large-scale training on text and multimodal corpora (Rana, 2010; Together Computer, 2023; Chen et al., 2023; Laurenc ¸on et al., 2023; Gadre et al., 2023), followed by tuning on human preferences (Liu et al., 2023a; Awadalla et al., 2024; Ouyang et al., 2022; Rafailov et al., 2023). The remarkable advances in the capabilities of these models inspired a variety of benchmarks that evaluate their performance. Early multimodal benchmarks consisted of single-task datasets such as visual question answering (Antol et al., 2015; Goyal et al., 2019; Marino et al., 2019) and image captioning (Chen et al., 2015). However, due to the limited scope of early datasets and concerns regarding potential test-data leakage, newer benchmarks use diverse collections of tasks (Fu et al., 2023; Yu et al., 2024; Liu et al., 2023b; Yue et al., 2024; Lu et al., 2024; Ying et al., 2024). While these datasets primarily focus on image understanding, newer datasets that emphasize spatiotemporal reasoning have been proposed for video (Li et al., 2024b; Fu et al., 2024a; Majumdar et al., 2024).
Recent studies highlight a number of shortcomings of frontier multimodal models (Moskvichev et al., 2023; Tong et al., 2024; Chen et al., 2024a; Fu et al., 2024b). One such shortcoming is that models may not perceive the image in detail, often missing fine-grained details or ignoring the image entirely (Chen et al., 2024b; Guan et al., 2024; Tong et al., 2024). HallusionBench proposes a new dataset of image pairs, where tiny edits are made from one image to another that change the answer to the question (Guan et al., 2024). MMVP identifies issues with CLIP-based pretraining of visual encoders, which make current models blind to certain visual patterns, and proposes a benchmark of CLIP-blind image pairs where the same question has opposite answers (Tong et al., 2024). MMStar shows that many questions in multimodal benchmarks can be answered correctly without the image and proposes a new split of existing benchmarks that addresses this issue (Chen et al., 2024b).
Another shortcoming of existing models is their lack of spatial perception and reasoning (Chen et al., 2024a; Cheng et al., 2024). SpatialVLM proposes a VQA dataset that requires answering questions about relative spatial arrangements and metric relationships (Chen et al., 2024a). SpatialRGPT further includes region-level understanding (Cheng et al., 2024). MOCHI evaluates the ability of vision models to identify rotated versions of procedurally-generated objects (Bonnen et al., 2025). 'Perception test' aims to overcome shortcomings of standard video datasets by creating a diagnostic dataset where participants record videos while following complex scripts depicting interesting events (Patraucean et al., 2023). It evaluates fundamental perceptual skills (memory, abstraction, intuitive physics, and semantics) and various types of reasoning.
Another line of work considers skill acquisition (the ability to learn a skill and apply it to new scenarios). Prior work has studied this using visual analogical reasoning (Chollet, 2019; Moskvichev et al., 2023; Yiu et al., 2024). The ARC dataset contains samples consisting of a few examples of abstract grids and their transformations and one or more test inputs (Chollet, 2019). The objective is to understand the transformation performed using the examples and apply it to test inputs. The transformations have been further organized into specific concepts with varying degrees of difficulty in the ConceptARC dataset (Moskvichev et al., 2023). Inspired by ARC and developmental psy-
chology, the KiVA dataset studies visual analogies in the context of visually realistic 3D shapes with concepts like transformations in color, size, rotations, reflections, and counting (Yiu et al., 2024).
## 3 SPACE: A BENCHMARK FOR S PATIAL P ERCEPTION A ND C OGNITION E VALUATION
We develop a benchmark for evaluating the spatial cognition of frontier models. The benchmark comprises large-scale and small-scale tasks and is designed for compatibility with both text-only and multimodal models.
## 3.1 LARGE-SCALE SPATIAL COGNITION
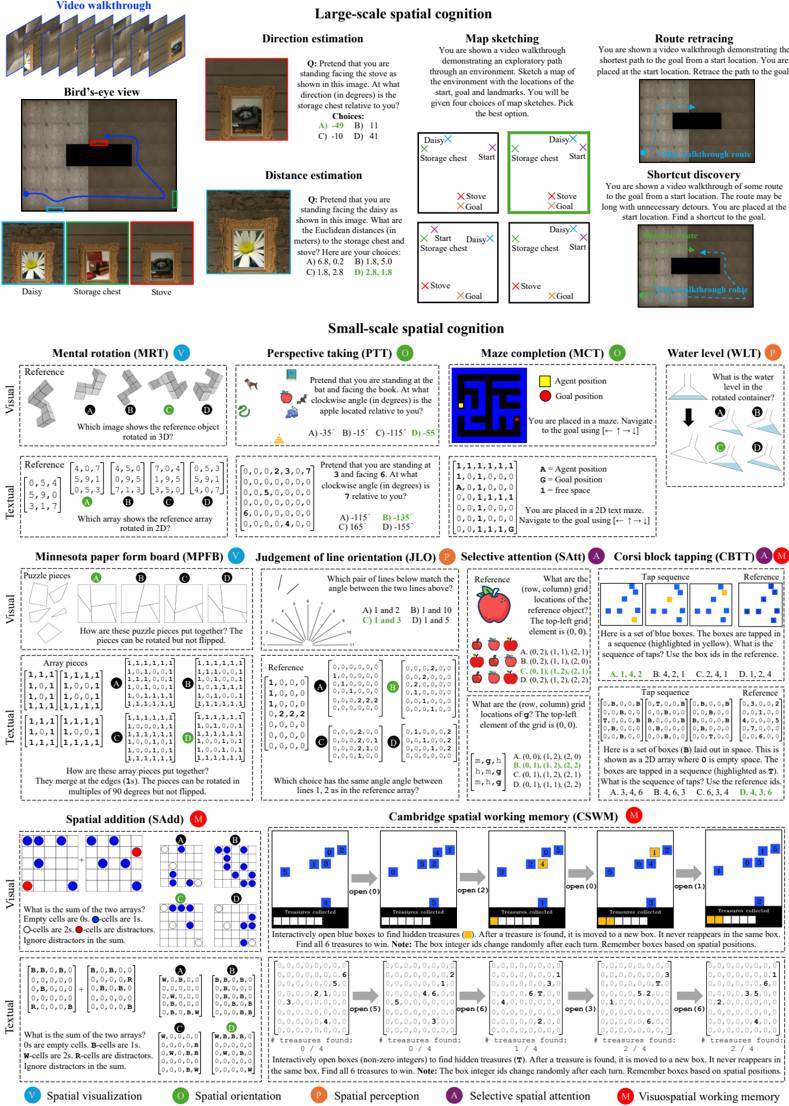
In large-scale spatial cognition tasks, we evaluate the ability of models to build spatial representations of their surrounding environment, and whether they can use these representations to reason about and navigate in the environment. There are two stages to these tasks. First, we familiarize the model with an environment by showing a video walkthrough. 1 The model must build a mental representation of the environment that captures the locations of start, goal and landmark locations, and their spatial relationships. After the model is familiarized with the environment, we evaluate the model's spatial representation using five tasks derived from the cognitive science literature (Meneghetti et al., 2022). See Figure 2(top) and Figure 3 for an overview.
- 1 . Direction estimation. The goal is to determine the directions to other landmarks from a given landmark. The participant is asked to pretend that they are facing a landmark A, and then asked to estimate the direction (in degrees) to another landmark B. This is known as a pointing trial in the cognitive science literature (Allen et al., 1996; Hegarty et al., 2006; Pazzaglia & Taylor, 2007; Weisberg et al., 2014; Meneghetti et al., 2016). We formulate this as a multiple-choice QA task with four options for the direction (only one correct option).
- 2 . Distance estimation. The goal is to determine the straight-line distances from one landmark to all other landmarks (Allen et al., 1996; Hegarty et al., 2006). The participant is asked to pretend that they are facing a landmark A, and then asked to estimate the Euclidean distance to all the other landmarks. We pose this as a multiple-choice QA with four options for the list of distances to each landmark. Since current models are not good at estimating metric measurements (Chen et al., 2024a; Cheng et al., 2024), we generate incorrect options such that the ratios of distances between landmarks are not preserved, making it easier to identify the correct option.
- 3 . Map sketching. The goal is to draw a map of the environment that contains the start, goal and landmark positions (Allen et al., 1996; Hegarty et al., 2006; Pazzaglia & Taylor, 2007; Weisberg et al., 2014; Meneghetti et al., 2016; 2021). We formulate this as multiple-choice QA with four options for the map sketches. The correct option preserves the true spatial relationships between the different map elements, while the incorrect options skew the spatial relationships randomly.
- 4 . Route retracing. The goal is to retrace the route shown in the video from the start to the goal (Allen et al., 1996; Pazzaglia & Taylor, 2007; Meneghetti et al., 2016; 2021). This task evaluates the model's ability to remember landmarks seen in the route and the actions required along the route to reach the goal. We formulate this as an interactive task where the model receives the current observation, decides which action to take, and receives updated observations based on the actions taken. We measure performance using the SPL metric (success weighted by path length), which penalizes the model for taking unnecessary detours (Anderson et al., 2018). (The demonstrated route, which the model must retrace, is always the shortest path to the goal.)
- 5 . Shortcut discovery. The goal is to discover a shortcut (i.e., a route never observed before) from the start to the goal after observing a video walkthrough that takes detours to reach the goal (Tolman, 1948; Allen et al., 1996; Pazzaglia & Taylor, 2007; Meneghetti et al., 2016; 2021). The ability to discover shortcuts in familiar environments is a key indicator of cognitive mapping ability (Tolman, 1948). When designing environments and walkthrough paths, we ensured that a novel shortcut exists that the model can exploit. Similar to route retracing, we treat this as an interactive navigation task and measure performance using the SPL metric.
1 For text-only models, the 'video walkthrough' is a sequence of discrete map observations presented as arrays of characters, see Figure 3 for examples.
֯
֯
Figure 2: The tasks in SPACE. For all tasks (other than the water level test), we include multimodal as well as purely textual presentations, to support evaluating both large language models (LLMs) and vision-language models (VLMs). For large-scale tasks, we visualize examples from the egocentric image presentation here and visualize alternate presentations in Figure 3. For small-scale tasks, we visualize both visual and textual presentations here. Bolding of characters in the arrays is for illustration purposes only.
<details>
<summary>Image 2 Details</summary>
### Visual Description
## Diagram: Spatial Cognition Tasks & fMRI Activation
### Overview
This diagram presents a series of spatial cognition tasks used in an fMRI study, along with corresponding brain activation maps. The tasks are categorized into Large-scale and Small-scale spatial cognition, and further subdivided into specific tests. Each task description is accompanied by a representative brain activation map showing areas of significant activity (red/yellow). The bottom section details the fMRI parameters used in the study.
### Components/Axes
The diagram is structured into several sections:
* **Header:** "Spatial Cognition Tasks & fMRI Activation"
* **Large-scale spatial cognition:** Includes Bird's-eye view, Direction estimation, Distance estimation, Map sketching, and Route retracing.
* **Small-scale spatial cognition:** Includes Mental rotation (MRT), Perspective taking (PTD), Maze completion (MCT), and Water level (WLT).
* **fMRI Parameters:** Details about the scanner, slice thickness, TR, TE, and number of volumes.
* **Brain Activation Maps:** Each task has a corresponding brain activation map displayed in a standardized brain template.
* **Activation Scale:** A color scale indicating the level of activation (from low to high).
### Detailed Analysis or Content Details
**Large-scale spatial cognition:**
* **Bird's-eye view:** Image showing Daisy, Storage chest, and Stove.
* **Direction estimation:** Question: "Pretend you are standing facing the stove as shown in this image. At what direction (in degrees) is the storage chest relative to you?" Choices: A) -10° B) 11° C) 31° D) 41°.
* **Distance estimation:** Question: "Pretend you are standing facing the stove as shown in this image. What is the approximate distance (in meters) to the storage chest and stove?" Choices: A) 1.5, 2.5 B) 1.5, 3.0 C) 1.8, 2.5 D) 1.8, 3.0.
* **Map sketching:** "You are shown a video walkthrough demonstrating the layout of the environment with the locations of the stove, storage chest, and goal. Pick the best option." Four map sketches are shown.
* **Route retracing:** "You are shown videos retracing demonstrating the shortest path to the goal from the start location. Retrace the path to the goal." Image of a walkthrough route.
**Small-scale spatial cognition:**
* **Mental rotation (MRT):** Image showing a reference object and four rotated versions. Question: "Which image shows the reference object rotated in 31°?"
* **Perspective taking (PTD):** Question: "Pretend that you are standing at the bottom of the structure as shown in this image. At what elevation angle (in degrees) do you see the stove relative to you?" Choices: A) 15° B) 30° C) 45° D) 60°.
* **Maze completion (MCT):** "You are placed in a maze. Navigate to the goal position." Image of a maze with "Agent position" and "Goal position" marked.
* **Water level (WLT):** Question: "What is the water level in the pool compared to the roof?" Choices: A) Lower B) Same C) Higher. Image of a building with a pool.
**fMRI Parameters:**
* **Scanner:** 3T Siemens Prisma
* **Slice thickness:** 3 mm
* **TR:** 2 s
* **TE:** 30 ms
* **Volumes:** 350
**Brain Activation Maps:**
Each task has a corresponding brain activation map. The maps show areas of significant activation in red and yellow, with the intensity of the color representing the level of activation. The brain template is in a standardized orientation (left is left). The activation scale is shown at the bottom right, ranging from approximately 0 to 4.5.
### Key Observations
* The activation maps vary significantly across tasks, suggesting that different spatial cognition processes engage distinct brain regions.
* Commonly activated areas include the parietal lobe, frontal lobe, and temporal lobe.
* The fMRI parameters are standard for a 3T scanner.
* The tasks are designed to isolate different aspects of spatial cognition, ranging from large-scale navigation to small-scale object manipulation.
* The questions in the tasks are multiple choice, suggesting a controlled experimental setup.
### Interpretation
This diagram illustrates an fMRI study investigating the neural basis of spatial cognition. The researchers used a series of carefully designed tasks to probe different aspects of spatial processing, and then used fMRI to identify the brain regions involved in each task. The varying activation patterns suggest that spatial cognition is not a single process, but rather a collection of distinct cognitive operations. The study provides insights into how the brain represents and processes spatial information, which is crucial for everyday activities such as navigation, object recognition, and manipulation. The use of both large-scale and small-scale tasks allows for a comprehensive understanding of the neural mechanisms underlying spatial cognition. The fMRI parameters are standard, ensuring the reliability and validity of the results. The multiple-choice format of the tasks likely helps to control for individual differences in strategy and performance. The diagram is a clear and concise representation of the study's design and findings.
</details>
֯
֯
֯
֯
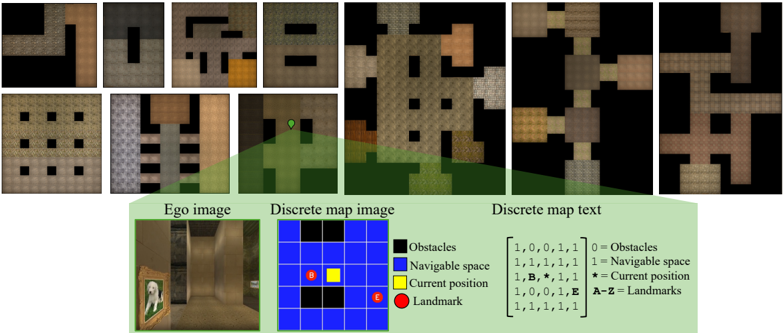
Figure 3: Large-scale spatial cognition. We design ten environment layouts based on experimental protocols in cognitive science. The top row shows bird's-eye view renderings of these environments. To evaluate largescale spatial cognition in frontier models, we implement three observation spaces: egocentric image, discrete map (DM) image, and discrete map (DM) text (see bottom row). Ego image shows a first-person view within the environment. DMimage shows a quantized, allocentric bird's-eye view of the 2 . 5m × 2 . 5m region centered on the current position. Unlike ego image, DM image enables performing the large-scale tasks in a simplified setting without requiring perspective geometry. DM text depicts the DM image using text characters. We evaluate multimodal models using ego image and DM image, and large language models using DM text.
<details>
<summary>Image 3 Details</summary>
### Visual Description
\n
## Diagram: Environment Representation
### Overview
The image presents a comparison of different representations of an indoor environment, likely for a robotic navigation or AI agent. It shows a series of "first-person" views (Ego image), discretized map representations (Discrete map image), and a textual representation of the map (Discrete map text). The goal appears to be illustrating how a continuous visual environment can be abstracted into discrete, symbolic representations.
### Components/Axes
The image is divided into three main sections:
1. **Ego Image:** A 2x6 grid of first-person perspective images of the environment. These images show what an agent "sees" from its current location.
2. **Discrete Map Image:** A 2x2 grid showing a top-down, discretized representation of the environment. This uses a grid-based map where each cell represents a specific state (obstacle, navigable space, agent position, landmark).
3. **Discrete Map Text:** A section containing a sample "Ego image", a 4x4 grid representing the discretized map, and a legend explaining the color coding.
The legend defines the following:
* Blue: Obstacles (value 0)
* White: Navigable space (value 1)
* Yellow: Current position (value B, asterisk *)
* Red: Landmark (value E, A-Z)
### Detailed Analysis or Content Details
**Ego Image:**
The Ego images show a corridor-like environment with textured walls and floors. The perspective changes across the images, suggesting the agent is moving through the environment. The lighting and textures vary, indicating different areas within the space. It's difficult to extract precise details from these images without further processing.
**Discrete Map Image:**
The Discrete Map Image shows a simplified, top-down view of the environment. The grid cells are colored according to the legend. The images show varying arrangements of obstacles and navigable space.
**Discrete Map Text:**
The Discrete Map Text section provides a concrete example of the discretized map. The 4x4 grid has the following configuration (reading row by row, left to right):
```
[1, 0, 0, 1]
[1, 1, 1, 1]
[1, B, *, 1]
[1, 1, 1, 1]
```
Where:
* 1 represents Navigable space
* 0 represents Obstacles
* B represents Current position
* \* represents Current position (duplicate of B)
* E represents Landmarks (not present in this example)
The legend also provides a matrix representation of the color coding:
```
[ 1, 0, 0, 1 ] = Obstacles
[ 1, 1, 1, 1 ] = Navigable space
[ 1, B, *, 1 ] = Current position
[ 1, 1, 1, 1 ] = Landmarks
```
### Key Observations
* The discretization process simplifies the environment, losing fine-grained details present in the Ego images.
* The current position is represented by both 'B' and '*' in the example map, which is redundant.
* The Discrete Map Image and Discrete Map Text sections provide consistent representations of the environment.
* The Ego images provide a visual context for understanding the abstracted representations.
### Interpretation
This diagram illustrates a common approach in robotics and AI: representing a continuous environment in a discrete form for planning and decision-making. The Ego images represent the raw sensory input, while the Discrete Map Image and Text represent the processed, symbolic representation. This abstraction allows algorithms to reason about the environment without dealing with the complexity of raw pixel data. The discretization process involves identifying obstacles, navigable spaces, and key locations (landmarks). The choice of discretization resolution (grid size) impacts the accuracy and computational cost of planning algorithms. The redundancy in representing the current position ('B' and '\*') suggests a potential area for optimization in the representation. The diagram highlights the trade-off between realism (Ego images) and computational efficiency (Discrete maps).
</details>
## 3.1.1 IMPLEMENTATION
3D environment generation. We create ten environment layouts based on prior work in cognitive science and artificial intelligence (Tolman, 1948; Gillner & Mallot, 1998; Richardson et al., 1999; Banino et al., 2018; Bouchekioua et al., 2021). Figure 3 shows bird's-eye view images of each layout. See the appendix for more details about the environment generation process.
Observation spaces. We create multiple observation spaces to support evaluating both text-only and vision+text models. These are egocentric images, discrete map (DM) images, and discrete map (DM) text presentations.
- Ego image. The environment is captured using a forward-facing perspective camera placed at the model's location in the environment. This is similar to the setup of an animal navigating through an immersive environment and requires understanding perspective geometry.
- DMimage. This is a quantized bird's-eye view image of a 2 . 5m × 2 . 5m area in the environment surrounding the model's location. This is akin to a human using a map to navigate. The current location is always at the center of the DM image. We use a Pacman-like coloring scheme highlighting the obstacles, navigable space, current postion, and landmarks. DM image simplifies the mapping process by removing the need for perspective geometry understanding.
- DMtext. This is a translation of DM image to an text array. We carefully select the text encoding to ensure compatibility with text tokenizers of popular models and ensure that each element of the array is encoded by the tokenizers of all evaluated models as a distinct token.
See Figure 3 (bottom) for examples of these presentations. The first two observation spaces are used for models that support visual inputs, while the last observation space is used for text-only models. See the appendix for additional illustrations of these tasks and dataset statistics.
## 3.2 SMALL-SCALE SPATIAL COGNITION
In small-scale spatial cognition tasks, we evaluate the models' ability to perceive, imagine, and mentally transform objects or shapes in two and three dimensions. We build on the body of work on visuospatial abilities, which are evaluated in humans via paper-and-pencil tasks (Allen et al., 1996; Weisberg et al., 2014; Meneghetti et al., 2022). These abilities may be used to explain individual differences between participants in large-scale spatial cognition (Meneghetti et al., 2022). We define ten small-scale tasks to evaluate abilities such as spatial perception, spatial visualization, spatial orientation, selective attention, and visuospatial working memory. See Figure 2(bottom) for illustrations of each task. We summarize each task below and provide additional details in the appendix.
- 6 . Mental rotation test (MRT). This is a test of spatial visualization, i.e., the ability to mentally manipulate 2D or 3D stimuli (Vandenberg & Kuse, 1978). In the visual presentation, a reference 3D shape from Shepard & Metzler (1971) is provided along with four choices. The correct choice is a rotated version of the reference, and the remaining choices are rotated versions of an alternate shape. The goal is to identify the correct choice from the distractors. The text-only version of this task uses 2D character arrays, akin to the card rotations test from French et al. (1963).
- 7 . Perspective taking test (PTT). This is a test of spatial orientation, i.e., the ability to imagine being in a different position in space and seeing the surroundings from a new perspective (Kozhevnikov & Hegarty, 2001). We place N randomly-sampled objects (like apples, bats, dogs, books, grapes, etc.) at random locations in an image (with no overlap between objects). The objective is to take the perspective of standing next to an object (say, a bat) facing another object (say, a book), and determine the relative orientation of a third object (say, an apple). This is a multiple-choice QA with four options (only one correct option).
- 8 . Water level test (WLT). This is a test of spatial perception (Piaget et al., 1957). Originally, it was designed to evaluate children's knowledge about the horizontal nature of the surface of water in a sealed bottle regardless of its orientation. Performance on the water-level test was found to be related to performance on spatial ability tests (Foltz, 1978; Wittig & Allen, 1984). We present the model with an image of a water container partially filled with water and ask it to imagine the position of the water if the container were tilted. We implement this as a four-way multiplechoice QA, where each choice is an image showing the tilted container with varying water levels. The objective is to select the one choice that shows the correct water level.
- 9 . Minnesota Paper Form Board test (MPFB). This is a test of spatial visualization, where the model must perform multi-step manipulations of complex spatial information (Meneghetti et al., 2022). Specifically, we provide the model with pieces of a figure and ask it to identify how the pieces fit together (Likert & Quasha, 1941; 1969). We programmatically segment a square into five pieces, and rotate the pieces randomly to generate the final segments. We generate alternate segmentations of a square as negative choices for a multiple-choice QA presentation.
- 10 . Judgement of Line Orientation test (JLO). This is a test of spatial perception (Benton, 1994), where a model must determine the angle between two lines in an image. Our visual presentation shows two lines in an image along with a set of 11 reference lines. The objective is to determine the pair of reference lines that have the same angles between them as the lines in the image. This is presented as a multiple-choice QA with four choices (only one of them correct). Our text-only presentation implements the tasks via lines embedded in 2D integer arrays.
- 11 . Selective attention task (SAtt). This is a test of selective spatial attention, i.e., the ability to selectively attend to a particular region of space while ignoring others (Serences & Kastner, 2014; Pahor et al., 2022). In particular, we use the widely used cancellation task, where the goal is to search for and mark out target stimuli embedded amidst distractors (Della Sala et al., 1992; Brickenkamp & Zillmer, 1998; Dalmaijer et al., 2015; Lacroix et al., 2021; Pahor et al., 2022; Kalina & Walgrave, 2004). We design the task as multiple-choice QA with objects as the stimuli for visual evaluation and characters as stimuli for text-only evaluation. The target stimuli and distractors are arranged on a grid. The answer must be selected from one out of four options. The correct option lists the (row, column) pairs that localize the target stimuli in the grid.
- 12 . Maze completion task (MCT). This is an interactive game to evaluate spatial orientation, planning, and executive functioning (Lacroix et al., 2021). We programmatically create mazes using Mazelib (Stilley, 2014) and render them using a Pacman-like color scheme for the visual presentation and a character array for the text-only presentation (similar to DM image and DM text in Figure 3). Using the maze rendering, a model must sequentially select an up/down/left/right action to reach the goal and execute a stop action to successfully complete the task. If the model does not reach the goal within 250 actions, it is considered to have failed. We measure the success rate, i.e., the percentage of mazes where the model reaches the goal within the allotted time.
- 13 . Corsi block-tapping task (CBTT). This is a test of visuospatial working memory and attention (Corsi, 1972; Claessen et al., 2015). We create a digital Corsi board with N blue-colored blocks that are randomly placed on the board with no overlap ( N ∈ [5 , 8]) . We randomly sample a sequence of K taps, where each block is tapped at most once ( K ∈ [4 , N ]) . The taps are digitally rendered on the blocks by highlighting them in yellow when tapped, yielding an sequence of K images. After presenting the K images, we provide a rendering of the board with integer IDs
assigned to each block and ask the model to reproduce the sequence of taps using these IDs. We treat this as multiple-choice QA with four choices of tap sequences, only one of which is correct.
- 14 . Spatial addition task (SAdd). This is a test of visuospatial working memory, i.e., the ability to store and manipulate spatial information in memory (Wechsler, 2009). The model is presented with two 2D grids, where each grid location can be empty or contain a blue or red dot. The objective is to add the two grids together by following certain rules. If a grid location has a blue dot in exactly one of grids, the result should be a blue dot. If a grid location has blue dots on both grids, the result should be a white dot. Red dots are distractors and must be ignored. We programmatically generate grid pairs with sizes sampled from { 3 , 5 , 7 , 9 } and pseudo-randomly populate them with blue and red dots. We formulate the task as multiple-choice QA, presenting four grids as possible answers, exactly one of which is correct.
- 15 . Cambridge spatial working memory test (CSWM). This is an interactive game that evaluates visuospatial working memory (Sahakian et al., 1988). The model is presented with an image containing N blue colored boxes ( N ∈ [3 , 7]) . A yellow 'treasure' is initially hidden in one of the boxes. The model must sequentially select boxes one at a time to find the hidden treasure. Once the treasure is found, another treasure is placed in one of the remaining boxes. The objective is to locate all the yellow treasures via a process of elimination. We programmatically generate instances of this task by randomly sampling blue boxes, placing them at random locations (without overlap), and placing the treasures in each box in random order. At each step, we assign random integer IDs to each box as a reference for selecting a box. The boxes' integer IDs are randomized in each step, forcing the model to remember boxes based on their spatial positions. When the model finds a treasure, the box containing the treasure becomes yellow. The model must find all the treasures before a time limit T (determined based on N ) to succeed.
As with large-scale spatial cognition, we also implement purely textual presentations of these tasks to support evaluation of large language models (LLMs). Figure 2 illustrates both the multimodal and the purely textual presentations. The key idea in instantiating the textual presentations is to encode all spatial information via 2D character arrays. We did not identify a natural such encoding for the water level test (WLT) and did not include a text-only presentation for it for this reason. See the appendix for additional illustrations of these tasks. In some tasks, such as MRT, MPFB, and JLO, the text presentations are substantially easier than the corresponding visual presentations. However, the visual and textual presentations match closely for the remaining tasks, enabling us to identify modality-specific limitations of multimodal models by evaluating them on the two presentations.
## 4 EXPERIMENTS
Baselines. We evaluate a number of LLMs and VLMs. Using text-only presentations, we evaluate GPT-4v and GPT-4o (OpenAI, 2023; 2024), Claude 3.5 Sonnet (Anthropic, 2024), the Llama3 family (Dubey et al., 2024), Mistral models such as Mixtral 8x7B, Mixtral 8x22B, and Mistral 123B (Jiang et al., 2024; Mistral AI team, 2024a), and two Yi 1.5 models (Young et al., 2024). Using multimodal presentations, we evaluate GPT-4v and GPT-4o (OpenAI, 2023; 2024), Claude 3.5 Sonnet (Anthropic, 2024), LlaVA-NeXT-Interleave (Li et al., 2024a), Pixtral 12B (Mistral AI team, 2024b), and Phi-3.5-vision (Abdin et al., 2024). We use the vLLM inference engine for evaluating the open-source models (Kwon et al., 2023). For each task, we implement a prompt that provides a detailed description of the task and the expected response format (see the appendix). We also list the results of a chance baseline that selects an answer at random. For multiple-choice QA tasks, chance is at 25% . For interactive tasks, the chance baseline samples an action at random in each step. We further include human performance for reference for the multiple-choice QA tasks. See the appendix for additional implementation details.
Large-scale spatial cognition results. The results are shown in Table 1, grouped by presentation modality (ego image, DM image, DM text). For image-based presentations, we evaluate Claude 3.5 Sonnet, GPT-4v and GPT-4o because they support video understanding (via a succession of images). For DM text, we evaluate both open and closed LLMs. We also list the performance of the chance baseline for calibration, as well as human performance (see the appendix for details). In the text-only modality, Claude 3.5 Sonnet attains the highest average performance. Mistral 123B is the highest-performing open model. All evaluated models struggle with large-scale spatial cognition, falling significantly below human performance on direction estimation, distance estimation,
## Observation space: Ego image
Table 1: Large-scale spatial cognition results. The three tables show results for different observation spaces. Results below 50% of human performance are gray. Methods are sorted based on their overall performance.
| Method | Direction estimation | Distance estimation | Map sketching | Route retracing | Shortcut discovery | Average |
|-------------------|----------------------------|----------------------------|----------------------------|----------------------------|----------------------------|----------------------------|
| Human | 82.8 | 83.2 | 96.6 | - | - | - |
| GPT-4o | 32 . 0 ± 4 . 1 | 36 . 5 ± 5 . 0 | 33 . 3 ± 4 . 1 | 6 . 6 ± 3 . 6 | 6 . 4 ± 1 . 0 | 23 . 0 |
| Claude 3.5 Sonnet | 29 . 0 ± 2 . 9 | 34 . 4 ± 2 . 9 | 27 . 5 ± 8 . 3 | 7 . 4 ± 2 . 8 | 0 . 0 ± 0 . 0 | 19 . 6 |
| GPT-4v | 29 . 7 ± 0 . 3 | 31 . 9 ± 2 . 7 | 20 . 0 ± 11 . 8 | 1 . 6 ± 1 . 2 | 3 . 9 ± 0 . 9 | 17 . 4 |
| Chance | 25.0 | 25.0 | 25.0 | 0.0 | 0.0 | 15.0 |
| | Observation space: DMimage | Observation space: DMimage | Observation space: DMimage | Observation space: DMimage | Observation space: DMimage | Observation space: DMimage |
| Method | Direction estimation | Distance estimation | Map sketching | Route retracing | Shortcut discovery | Average |
| Human | 82.9 | 82.5 | 100.0 | - | - | - |
| GPT-4o | 29 . 5 ± 5 . 5 | 31 . 9 ± 1 . 0 | 33 . 3 ± 3 . 3 | 23 . 6 ± 3 . 1 | 25 . 9 ± 2 . 0 | 28 . 8 |
| Claude 3.5 Sonnet | 32 . 5 ± 2 . 3 | 40 . 0 ± 2 . 6 | 30 . 0 ± 4 . 1 | 15 . 4 ± 4 . 3 | 13 . 7 ± 6 . 4 | 26 . 3 |
| GPT-4v | 26 . 3 ± 3 . 0 | 29 . 3 ± 4 . 1 | 45 . 0 ± 5 . 0 | 13 . 7 ± 5 . 2 | 15 . 3 ± 3 . 0 | 25 . 9 |
| Chance | 25.0 | 25.0 | 25.0 | 0.0 | 0.0 | 15.0 |
| | Observation space: DMtext | Observation space: DMtext | Observation space: DMtext | Observation space: DMtext | Observation space: DMtext | Observation space: DMtext |
| Method | Direction estimation | Distance estimation | Map sketching | Route retracing | Shortcut discovery | Average |
| Human | 66.7 | 76.5 | 66.7 | - | - | - |
| Claude 3.5 Sonnet | 29 . 2 ± 4 . 4 | 40 . 2 ± 3 . 1 | 51 . 7 ± 5 . 5 | 26 . 5 ± 2 . 9 | 20 . 0 ± 3 . 0 | 33 . 5 |
| GPT-4o | 28 . 7 ± 4 . 1 | 33 . 3 ± 1 . 7 | 46 . 7 ± 4 . 1 | 27 . 5 ± 3 . 2 | 26 . 6 ± 0 . 1 | 32 . 6 |
| Mistral 123B | 30 . 5 ± 5 . 1 | 28 . 9 ± 5 . 7 | 38 . 3 ± 5 . 5 | 20 . 3 ± 2 . 8 | 19 . 9 ± 3 . 0 | 27 . 6 |
| GPT-4v | 30 . 7 ± 4 . 1 | 26 . 5 ± 2 . 7 | 40 . 8 ± 6 . 0 | 20 . 6 ± 5 . 8 | 15 . 4 ± 2 . 0 | 26 . 8 |
| Llama 3 70B | 27 . 0 ± 2 . 2 | 30 . 4 ± 1 . 9 | 35 . 0 ± 8 . 3 | 13 . 2 ± 9 . 2 | 5 . 3 ± 4 . 1 | 22 . 2 |
| Yi 1.5 34B | 26 . 2 ± 4 . 7 | 35 . 7 ± 1 . 4 | 35 . 0 ± 10 . 7 | 3 . 2 ± 0 . 2 | 1 . 1 ± 1 . 6 | 20 . 2 |
| Mixtral 8x22B | 21 . 3 ± 1 . 9 | 19 . 4 ± 1 . 4 | 39 . 2 ± 12 . 6 | 1 . 5 ± 1 . 4 | 3 . 9 ± 1 . 7 | 17 . 0 |
| Yi 1.5 9B | 10 . 8 ± 1 . 0 | 20 . 0 ± 3 . 7 | 35 . 0 ± 5 . 0 | 5 . 0 ± 2 . 2 | 1 . 3 ± 1 . 5 | 14 . 4 |
| Llama 3 8B | 22 . 5 ± 2 . 9 | 24 . 6 ± 2 . 1 | 23 . 3 ± 7 . 1 | 0 . 0 ± 0 . 0 | 1 . 1 ± 1 . 6 | 14 . 3 |
| Mixtral 8x7B | 15 . 8 ± 2 . 0 | 16 . 1 ± 1 . 4 | 30 . 0 ± 8 . 2 | 1 . 1 ± 1 . 6 | 1 . 1 ± 1 . 6 | 12 . 8 |
| Chance | 25.0 | 25.0 | 25.0 | 0.0 | 0.0 | 15.0 |
and map sketching, and less than 30% SPL on route retracing and shortcut discovery, even with allocentric presentation. With egocentric multimodal presentation (the closest counterpart to classic experimental protocols in animal cognition), the models are near chance level on all tasks.
Human performance ranges from 80% to 100% accuracy on image-based presentations of the multiple-choice QA tasks. Since perceiving large sequences of text arrays is non-trivial for humans, the performance drops to 65% -80% for the text presentations.
Small-scale spatial cognition results. The results are shown in Table 2. With multimodal presentations, we benchmark GPT-4o, GPT-4v, Claude 3.5 Sonnet, and a number of open multimodal models. With purely textual presentations, we benchmark both open and closed models. We also list the performance of the chance baseline for calibration, as well as human performance (see the appendix for details).
Performance of some model classes (e.g., GPT-4o, GPT-4v, Claude 3.5 Sonnet) on purely textual presentations is considerably higher than on multimodal presentations. The best-performing models, Claude 3.5 Sonnet and GPT-4o, achieve 43.8% and 40.1% average accuracies in the multimodal regime and 64.5% and 65.2% average accuracies with purely textual presentations. (Chance is < 25% .) We attribute this in part to the simplified nature of the text-only implementations of tasks like MRT, MPFB, and JLO (e.g., the text-only presentation of mental rotation uses only 2D shapes and constrained 2D rotations) and in part to the relative developmental maturity of large language models (LLMs) versus multimodal models on the remaining tasks.
On tasks that evaluate visuospatial working memory (specifically SAtt, CBTT, SAdd, and CSWM), the strongest LLMs perform well. On selective attention (SAtt), GPT-4o, Claude 3.5 Sonnet, Mistral 123B, and GPT-4v all achieve over 95% accuracy, matching or outperforming the human performance on this task. On the other hand, all models perform poorly on maze completion (MCT), in both presentation modalities. (Note that the models operate with full visibility, as illustrated in Figure 2.) With multimodal presentation, all evaluated models are near chance on perspective taking (PTT) and the Minnesota Paper Form Board test (MPFB). On mental rotation (MRT), the best models are near chance with multimodal presentation, which uses 3D shapes, and only marginally better with purely textual presentation, which uses 2D arrays and constrained rotations.
Multimodal
Table 2: Small-scale spatial cognition results. The two tables show results for multimodal and text-only presentations, respectively. Results below 50% of human performance are gray, results above 90% of human performance are bold . Methods are sorted based on their average performance. ( ∗ Some multimodal models ran out of memory on MCT and CSWM tasks; their accuracy is taken to be 0 for calculating the average.)
| Method | MRT | PTT | WLT | MPFB | JLO | SAtt | MCT | CBTT | SAdd | CSWM | Average |
|---------------------|---------------------|---------------------|---------------------|-------------------|-----------------|-----------------|----------------|----------------|---------------------|-------------------------------|-----------|
| Human | 78.5 | 80.0 | 94.0 | 84.0 | 82.0 | 95.0 | - | 100.0 | 98.0 | - | - |
| Claude 3.5 Sonnet | 29 . 9 ± 3 . 8 | 21 . 8 ± 2 . 9 | 37 . 0 ± 4 . 6 | 35 . 5 ± 7 . 0 | 40 . 5 ± 3 . 8 | 90 . 5 ± 3 . 5 | 2 . 2 ± 1 . 8 | 56 . 5 ± 3 . 8 | 48 . 0 ± 6 . 2 | 76 . 7 ± 2 . 5 | 43.8 |
| GPT-4o | 33 . 3 ± 1 . 9 | 26 . 5 ± 3 . 6 | 59 . 0 ± 10 . 8 | 27 . 0 ± 2 . 2 | 26 . 5 ± 5 . 9 | 70 . 2 ± 1 . 8 | 10 . 4 ± 1 . 0 | 68 . 0 ± 2 . 0 | 40 . 5 ± 7 . 1 | 40 . 0 ± 0 . 0 | 40.1 |
| GPT-4v | 32 . 3 ± 0 . 3 | 28 . 0 ± 2 . 0 | 35 . 0 ± 7 . 7 | 22 . 5 ± 4 . 1 | 26 . 5 ± 6 . 8 | 59 . 8 ± 4 . 4 | 0 . 7 ± 1 . 0 | 44 . 5 ± 3 . 0 | 32 . 0 ± 4 . 5 | 26 . 7 ± 3 . 4 | 30 . 8 |
| Pixtral 12B | 28 . 3 ± 3 . 1 | 23 . 2 ± 4 . 9 | 43 . 0 ± 7 . 0 | 30 . 5 ± 7 . 9 | 24 . 5 ± 7 . 3 | 36 . 0 ± 3 . 9 | OOM | 39 . 5 ± 3 . 0 | 28 . 5 ± 6 . 1 | OOM | 25 . 4 ∗ |
| Phi-3.5-vision | 24 . 1 ± 1 . 0 | 27 . 0 ± 3 . 2 | 22 . 5 ± 7 . 9 | 26 . 0 ± 0 . 0 | 21 . 0 ± 4 . 1 | 44 . 0 ± 4 . 6 | OOM | 33 . 0 ± 4 . 6 | 22 . 0 ± 6 . 8 | OOM | 22 . 0 ∗ |
| Llava interleave 7B | 25 . 1 ± 3 . 2 | 25 . 8 ± 5 . 8 | 25 . 0 ± 8 . 5 | 25 . 0 ± 3 . 3 | 24 . 0 ± 5 . 7 | 32 . 0 ± 4 . 9 | OOM | 25 . 5 ± 5 . 7 | 27 . 0 ± 4 . 1 | OOM | 20 . 9 ∗ |
| Chance | 25.0 | 25.0 | 25.0 | 25.0 | 25.0 | 25.0 | 0.0 | 25.0 | 25.0 | 33 . 8 ± 5 . 4 | 23.4 |
| | Text-only | Text-only | Text-only | Text-only | Text-only | Text-only | Text-only | Text-only | Text-only | Text-only | Text-only |
| Method | MRT | PTT | MPFB | JLO | SAtt | MCT | | CBTT | SAdd | CSWM | Average |
| Human | 90.0 | 75.0 | 92.0 | 98.0 | 96.0 | | - | 100.0 | 98.0 | - | - |
| GPT-4o | 41 . 9 ± 6 . 2 | 55 . 5 ± 3 . 9 | 50 . 5 ± 9 . 6 | 66 . 5 ± 4 . 8 | 98 . 8 ± | 0 . 4 21 . 5 | ± 3 . 8 | 82 . 5 ± 1 . 7 | 93 . 5 ± 3 . 6 | 76 . 7 ± 2 . 5 | 65.2 |
| Claude 3.5 Sonnet | 37 . 5 ± 1 . 8 | 50 . 0 ± 7 . 5 | 45 . 0 ± 6 . 7 | 70 . 5 ± 4 . 3 | 97 . 0 ± 1 | . 0 10 . 0 | ± 1 . 1 | 97 . 5 ± 0 . 9 | 91 . 5 ± 4 . 3 | 82 . 0 ± 3 . 3 | 64.5 |
| Mistral 123B | 39 . 4 ± 6 . 2 | 44 . 8 ± 4 . 0 | 48 . 5 ± 5 . 2 | 57 . 0 ± 5 . 4 | 97 . 5 ± | 0 . 5 14 . 8 | ± 2 . 8 | 88 . 5 ± 0 . 9 | 92 . 5 ± 0 . 9 | 62 . 0 ± 2 . 8 | 60.5 |
| GPT-4v | 41 . 2 ± 7 . 2 | 67 . 5 ± 6 . 5 | 34 . 0 ± 6 . 0 | 62 . 0 ± 4 . 0 | 95 . 8 ± | 1 . 3 3 . 7 | ± 1 . 0 | 87 . 5 ± 3 . 6 | 79 . 0 ± 2 . 2 | 45 . 3 ± 2 . 5 | 57.3 |
| Llama 3 70B | 28 . 1 ± 9 . 2 | 29 . 2 ± 2 . 4 | 38 . 5 ± 3 . 8 | 42 . 5 ± 0 . 9 | 71 . 8 ± | 3 . 8 1 . 5 | ± 1 . 0 | 52 . 5 ± 5 . 7 | 62 . 5 ± 5 . 4 | 34 . 0 ± 5 . 9 | 40.0 |
| Mixtral 8x22B | 26 . 9 ± 3 . 2 | 24 . 5 ± 5 . 2 | 31 . 0 ± 5 . 9 | 36 . 0 ± 5 . 1 | 73 . 5 ± | 3 . 6 1 . 5 | ± 2 . 1 | 55 . 0 ± 3 . 3 | 68 . 0 ± 6 . 8 | 17 . 3 ± 2 . 5 | 37 . 0 |
| Yi 1.5 34B | 20 . 6 ± 6 . 0 | 28 . 0 ± 2 . 1 | 34 . 5 ± 4 . 6 | 33 . 5 ± 3 . 6 | 58 . 2 ± | 4 . 3 0 . 7 | ± 1 . 0 | 35 . 5 ± 8 . 4 | 41 . 5 ± 0 . 9 | 24 . 0 ± 0 . 0 | 30 . 7 |
| Yi 1.5 9B | 21 . 2 ± 1 . 2 | 23 . 8 ± 2 . 7 | 30 . 0 ± 3 . | ± 5 . | 48 . 2 ± | 4 . 0 0 . 7 | ± 1 . 0 | 36 . 5 ± 4 . 6 | 51 . 5 ± 8 . 9 | 24 . 7 ± 8 . 4 | 29 . 0 |
| | 14 . 4 ± 1 . | ± 5 . 1 | 2 | 24 . 5 5 | | . 7 0 . 0 | ± 0 . 0 | 27 . 5 ± 7 . 1 | | 26 . 0 ± 6 . 5 | 24 . 7 |
| Llama 3 8B | 1 | 25 . 8 | 26 . 0 ± 4 . 2 | 27 . 0 ± 1 . 7 | 46 . 0 ± | 3 | | 22 . 5 | 30 . 0 ± 7 . 3 | | 23 . 8 |
| Mixtral 8x7B Chance | 19 . 4 ± 4 . 5 25.0 | 10 . 5 ± 0 . 9 25.0 | 29 . 5 ± 5 . 7 25.0 | 27 . 5 ± 7 . 25.0 | 5 39 . 0 ± 25.0 | 5 . 4 0 . 0 0.0 | ± 0 . 0 | ± 3 . 8 25.0 | 43 . 5 ± 3 . 3 25.0 | 22 . 7 ± 4 . 1 33 . 0 ± 5 . 3 | 23.1 |
Humans perform well, achieving over 80% accuracy on the majority of the multiple-choice QA tasks with both text-only and multimodal presentations. Humans perform better on the textual presentations of tasks like MRT, MPFB and JLO than their vision counterparts due to the simplified nature of the text-only implementations.
Ecological compatibility of SPACE with frontier models. Our results indicate that current frontier models lack spatial cognition. Alternatively, these results could be the result of models not understanding the inputs presented to them (i.e., the inputs are not ecological compatibility). We study this in Appendix A.1 and demonstrate that this is not the case. Models can understand the inputs correctly and perform non-spatial cognition tasks well, yet fail to demonstrate spatial cognition.
## 5 DISCUSSION
We presented SPACE, a benchmark for spatial cognition in frontier models. Our evaluation of contemporary models brings up intriguing questions and opportunities for further investigation. First, our results underscore that frontier models exhibit a fundamentally different form of intelligence from what has been observed (and studied) in humans and animals. No biological intelligence we have encountered has exhibited such advanced skill in some aspects of higher cognition (Trinh et al., 2024) while failing so profoundly in basic spatial cognition. This is particularly intriguing because in biological intelligence, spatial cognition is considered a prerequisite for higher cognition, and breakdowns in spatial cognition are diagnostic of higher-level disorders (Cappa, 2008; Possin, 2010; Verghese et al., 2017; Cammisuli et al., 2024). From a scientific standpoint, the constellation of traits exhibited by frontier models is fascinating and may inspire a new cognitive science (Simon, 2019). As a precautionary stance, we can refrain from drawing analogies based on experience with biological cognition. (E.g., 'a model won the Mathematics Olympiad therefore it possesses a comparable cognitive repertoire to a human Olympiad winner and could be expected to have comparable skill in other domains'.)
Could deficiencies in spatial cognition be causally linked to some of the puzzling breakdowns exhibited by contemporary frontier models in higher-level tasks? What is the roadmap for bringing spatial cognition in frontier models up to the level of animal cognition (and perhaps beyond)? Is this a prerequisite for attaining some of the more far-reaching aspirations of contemporary artificial intelligence research? Does embodiment play a role, as it has in prior forms of intelligence (Smith & Gasser, 2005; Savva et al., 2019)? Or will artificial cognition continue to develop along a fundamentally different ontogenetic path? We expect further advances to increase the robustness and generality of frontier models, and to continue to broaden our understanding of the nature of intelligence.
## REFERENCES
- Marah I Abdin, Sam Ade Jacobs, Ammar Ahmad Awan, Jyoti Aneja, Ahmed Awadallah, Hany Awadalla, Nguyen Bach, Amit Bahree, Arash Bakhtiari, Harkirat S. Behl, et al. Phi-3 technical report: A highly capable language model locally on your phone. arXiv:2404.14219 , 2024.
- Gary L Allen, Kathleen C Kirasic, Shannon H Dobson, Richard G Long, and Sharon Beck. Predicting environmental learning from spatial abilities: An indirect route. Intelligence , 22(3), 1996.
- David I Anderson, Joseph J Campos, David C Witherington, Audun Dahl, Monica Rivera, Minxuan He, Ichiro Uchiyama, and Marianne Barbu-Roth. The role of locomotion in psychological development. Frontiers in Psychology , 4, 2013.
- Peter Anderson, Angel X. Chang, Devendra Singh Chaplot, Alexey Dosovitskiy, Saurabh Gupta, Vladlen Koltun, Jana Kosecka, Jitendra Malik, Roozbeh Mottaghi, Manolis Savva, and Amir R. Zamir. On evaluation of embodied navigation agents. arXiv:1807.06757 , 2018.
- Anthropic. Introducing Claude 3.5 Sonnet, 2024. https://www.anthropic.com/news/ claude-3-5-sonnet .
- Stanislaw Antol, Aishwarya Agrawal, Jiasen Lu, Margaret Mitchell, Dhruv Batra, C. Lawrence Zitnick, and Devi Parikh. VQA: Visual question answering. In ICCV , 2015.
- Leopold Aschenbrenner. Situational awareness: The decade ahead, 2024. https: //situational-awareness.ai/wp-content/uploads/2024/06/ situationalawareness.pdf .
- Anas Awadalla, Le Xue, Oscar Lo, Manli Shu, Hannah Lee, Etash Kumar Guha, Matt Jordan, Sheng Shen, Mohamed Awadalla, Silvio Savarese, Caiming Xiong, Ran Xu, Yejin Choi, and Ludwig Schmidt. MINT-1T: Scaling open-source multimodal data by 10x: A multimodal dataset with one trillion tokens. arXiv:2406.11271 , 2024.
- Andrea Banino, Caswell Barry, Benigno Uria, Charles Blundell, Timothy Lillicrap, Piotr Mirowski, Alexander Pritzel, Martin J Chadwick, Thomas Degris, Joseph Modayil, et al. Vector-based navigation using grid-like representations in artificial agents. Nature , 557(7705), 2018.
- Arthur Lester Benton. Contributions to neuropsychological assessment: A clinical manual . Oxford University Press, USA, 1994.
- Mark Blades and Christopher Spencer. The development of children's ability to use spatial representations. Advances in child development and behavior , 25, 1994.
- Nicole Blaser, G Dell'Omo, G Dell'Ariccia, David Paul Wolfer, and H-P Lipp. Testing cognitive navigation in unknown territories: homing pigeons choose different targets. Journal of Experimental Biology , 216(16), 2013.
- Tyler Bonnen, Stephanie Fu, Yutong Bai, Thomas O'Connell, Yoni Friedman, Nancy Kanwisher, Josh Tenenbaum, and Alexei Efros. Evaluating multiview object consistency in humans and image models. In NeurIPS , 2025.
- Youcef Bouchekioua, Aaron P Blaisdell, Yutaka Kosaki, Iku Tsutsui-Kimura, Paul Craddock, Masaru Mimura, and Shigeru Watanabe. Spatial inference without a cognitive map: the role of higher-order path integration. Biological Reviews , 96(1), 2021.
- R Brickenkamp and E Zillmer. Test d2: concentration-endurance test. Gottingen Ger. CJ Hogrefe , 1998.
- Rodney Brooks. Rodney brooks' three laws of artificial intelligence, 2024. https://rodneybrooks.com/ rodney-brooks-three-laws-of-artificial-intelligence/ .
- Davide Maria Cammisuli, Gloria Marchesi, Virginia Bellocchio, Edoardo Nicol` o Aiello, Barbara Poletti, Federico Verde, Vincenzo Silani, Nicola Ticozzi, Stefano Zago, Teresa Difonzo, et al. Behavioral disorders of spatial cognition in patients with mild cognitive impairment due to alzheimer's disease (the bdsc-mci project): Ecological validity of the corsi learning suvra-span test. Journal of Personalized Medicine , 14(5), 2024.
- SF Cappa. Cognitive neurology: a clinical textbook . Oxford University Press, 2008.
- Boyuan Chen, Zhuo Xu, Sean Kirmani, Brian Ichter, Danny Driess, Pete Florence, Dorsa Sadigh, Leonidas J. Guibas, and Fei Xia. Spatialvlm: Endowing vision-language models with spatial reasoning capabilities. In CVPR , 2024a.
- Lin Chen, Jinsong Li, Xiaoyi Dong, Pan Zhang, Conghui He, Jiaqi Wang, Feng Zhao, and Dahua Lin. Sharegpt4v: Improving large multi-modal models with better captions. arXiv:2311.12793 , 2023.
- Lin Chen, Jinsong Li, Xiaoyi Dong, Pan Zhang, Yuhang Zang, Zehui Chen, Haodong Duan, Jiaqi Wang, Yu Qiao, Dahua Lin, and Feng Zhao. Are we on the right way for evaluating large visionlanguage models? arXiv:2403.20330 , 2024b.
- Mark Chen, Jerry Tworek, Heewoo Jun, Qiming Yuan, Henrique Pond´ e de Oliveira Pinto, Jared Kaplan, Harri Edwards, Yuri Burda, Nicholas Joseph, Greg Brockman, et al. Evaluating large language models trained on code. arXiv:2107.03374 , 2021.
- Xinlei Chen, Hao Fang, Tsung-Yi Lin, Ramakrishna Vedantam, Saurabh Gupta, Piotr Doll´ ar, and C. Lawrence Zitnick. Microsoft COCO captions: Data collection and evaluation server. arXiv:1504.00325 , 2015.
- An-Chieh Cheng, Hongxu Yin, Yang Fu, Qiushan Guo, Ruihan Yang, Jan Kautz, Xiaolong Wang, and Sifei Liu. Spatialrgpt: Grounded spatial reasoning in vision language model. arXiv:2406.01584 , 2024.
- Franc ¸ois Chollet. On the measure of intelligence. arXiv:1911.01547 , 2019.
- Michiel HG Claessen, Ineke JM Van Der Ham, and Martine JE Van Zandvoort. Computerization of the standard corsi block-tapping task affects its underlying cognitive concepts: a pilot study. Applied Neuropsychology: Adult , 22(3), 2015.
- Philip Michael Corsi. Human memory and the medial temporal region of the brain. Phd thesis, McGill University, 1972. https://escholarship.mcgill.ca/concern/theses/ 05741s554 .
- Christopher J. Cueva and Xue-Xin Wei. Emergence of grid-like representations by training recurrent neural networks to perform spatial localization. In ICLR , 2018.
- Edwin S Dalmaijer, Stefan Van der Stigchel, Tanja CW Nijboer, Tim HW Cornelissen, and Masud Husain. Cancellationtools: All-in-one software for administration and analysis of cancellation tasks. Behavior Research Methods , 47, 2015.
- Dawson-Haggerty et al. trimesh, 2019. https://trimesh.org/ .
- Miguel de Guinea, Alejandro Estrada, K Anne-Isola Nekaris, and Sarie Van Belle. Cognitive maps in the wild: revealing the use of metric information in black howler monkey route navigation. Journal of Experimental Biology , 224(15), 2021.
- Sergio Della Sala, Marcella Laiacona, Hans Spinnler, and Chiara Ubezio. A cancellation test: its reliability in assessing attentional deficits in Alzheimer's disease. Psychological Medicine , 22(4), 1992.
- Jia Deng, Wei Dong, Richard Socher, Li-Jia Li, Kai Li, and Li Fei-Fei. Imagenet: A large-scale hierarchical image database. In CVPR , 2009.
- Abhimanyu Dubey, Abhinav Jauhri, Abhinav Pandey, Abhishek Kadian, Ahmad Al-Dahle, Aiesha Letman, Akhil Mathur, Alan Schelten, Amy Yang, Angela Fan, et al. The llama 3 herd of models. arXiv:2407.21783 , 2024.
- Pul Ashby Foltz. Adult performance on piaget's water level task and its relation of spatial orientation and visualization. Master's thesis, University of Richmond, 1978. https://scholarship.richmond.edu/cgi/viewcontent.cgi? article=1424&context=masters-theses .
- Nigel Foreman, Denny Foreman, Alison Cummings, and Sandra Owens. Locomotion, active choice, and spatial memory in children. The Journal of General Psychology , 117(2), 1990.
- John W French, Ruth B Ekstrom, and Leighton A Price. Manual for kit of reference tests for cognitive factors. 1963.
- Andrea Frick and Wenke M¨ ohring. A matter of balance: Motor control is related to children's spatial and proportional reasoning skills. Frontiers in Psychology , 6, 2016.
- Chaoyou Fu, Peixian Chen, Yunhang Shen, Yulei Qin, Mengdan Zhang, Xu Lin, Zhenyu Qiu, Wei Lin, Jinrui Yang, Xiawu Zheng, Ke Li, Xing Sun, and Rongrong Ji. MME: A comprehensive evaluation benchmark for multimodal large language models. arXiv:2306.13394 , 2023.
- Chaoyou Fu, Yuhan Dai, Yondong Luo, Lei Li, Shuhuai Ren, Renrui Zhang, Zihan Wang, Chenyu Zhou, Yunhang Shen, Mengdan Zhang, et al. Video-mme: The first-ever comprehensive evaluation benchmark of multi-modal llms in video analysis. arXiv:2405.21075 , 2024a.
- Xingyu Fu, Yushi Hu, Bangzheng Li, Yu Feng, Haoyu Wang, Xudong Lin, Dan Roth, Noah A. Smith, Wei-Chiu Ma, and Ranjay Krishna. BLINK: Multimodal large language models can see but not perceive. arXiv:2404.12390 , 2024b.
- Samir Yitzhak Gadre, Gabriel Ilharco, Alex Fang, Jonathan Hayase, Georgios Smyrnis, Thao Nguyen, Ryan Marten, Mitchell Wortsman, Dhruba Ghosh, Jieyu Zhang, et al. Datacomp: In search of the next generation of multimodal datasets. In NeurIPS , 2023.
- Maya Geva-Sagiv, Liora Las, Yossi Yovel, and Nachum Ulanovsky. Spatial cognition in bats and rats: from sensory acquisition to multiscale maps and navigation. Nature Reviews Neuroscience , 16(2), 2015.
- Sabine Gillner and Hanspeter A Mallot. Navigation and acquisition of spatial knowledge in a virtual maze. Journal of Cognitive Neuroscience , 10(4), 1998.
- Yash Goyal, Tejas Khot, Aishwarya Agrawal, Douglas Summers-Stay, Dhruv Batra, and Devi Parikh. Making the V in VQA matter: Elevating the role of image understanding in visual question answering. International Journal of Computer Vision , 127(4), 2019.
- Tianrui Guan, Fuxiao Liu, Xiyang Wu, Ruiqi Xian, Zongxia Li, Xiaoyu Liu, Xijun Wang, Lichang Chen, Furong Huang, Yaser Yacoob, et al. Hallusionbench: an advanced diagnostic suite for entangled language hallucination and visual illusion in large vision-language models. In CVPR , 2024.
- Mary Hegarty and David Waller. A dissociation between mental rotation and perspective-taking spatial abilities. Intelligence , 32(2), 2004.
- Mary Hegarty, Daniel R Montello, Anthony E Richardson, Toru Ishikawa, and Kristin Lovelace. Spatial abilities at different scales: Individual differences in aptitude-test performance and spatiallayout learning. Intelligence , 34(2), 2006.
- Dan Hendrycks, Collin Burns, Steven Basart, Andy Zou, Mantas Mazeika, Dawn Song, and Jacob Steinhardt. Measuring massive multitask language understanding. In ICLR , 2021a.
- Dan Hendrycks, Collin Burns, Saurav Kadavath, Akul Arora, Steven Basart, Eric Tang, Dawn Song, and Jacob Steinhardt. Measuring mathematical problem solving with the MATH dataset. In NeurIPS Datasets and Benchmarks , 2021b.
- Anna A Ivanova, Aalok Sathe, Benjamin Lipkin, Unnathi Kumar, Setayesh Radkani, Thomas H Clark, Carina Kauf, Jennifer Hu, RT Pramod, Gabriel Grand, et al. Elements of world knowledge (ewok): A cognition-inspired framework for evaluating basic world knowledge in language models. arXiv:2405.09605 , 2024.
- Petra Jansen. The dissociation of small-and large-scale spatial abilities in school-age children. Perceptual and Motor Skills , 109(2), 2009.
- Petra Jansen and Martin Heil. The relation between motor development and mental rotation ability in 5-to 6-year-old children. International Journal of Developmental Science , 4(1), 2010.
- Albert Q. Jiang, Alexandre Sablayrolles, Antoine Roux, Arthur Mensch, Blanche Savary, Chris Bamford, Devendra Singh Chaplot, Diego de Las Casas, Emma Bou Hanna, Florian Bressand, et al. Mixtral of experts. arXiv:2401.04088 , 2024.
- Ashley N Kalina and Suzie A Walgrave. Normative evaluation of a letter cancellation instrument for the assessment of sustained attention: A construct validation study. The Journal of Undergraduate Research , 2(1), 2004.
- Maria Kozhevnikov and Mary Hegarty. A dissociation between object manipulation spatial ability and spatial orientation ability. Memory & Cognition , 29, 2001.
- Maria Kozhevnikov, Michael A Motes, and Mary Hegarty. Spatial visualization in physics problem solving. Cognitive Science , 31(4), 2007.
- Woosuk Kwon, Zhuohan Li, Siyuan Zhuang, Ying Sheng, Lianmin Zheng, Cody Hao Yu, Joseph Gonzalez, Hao Zhang, and Ion Stoica. Efficient memory management for large language model serving with PagedAttention. In SOSP , 2023.
- Emilie Lacroix, St´ ephanie Cornet, Naima Deggouj, and Martin Gareth Edwards. The visuo-spatial abilities diagnosis (vsad) test: Evaluating the potential cognitive difficulties of children with vestibular impairment through a new tablet-based computerized test battery. Behavior Research Methods , 53, 2021.
- Barbara Landau. Spatial cognition. In Encyclopedia of the Human Brain . Elsevier, 2002.
- Hugo Laurenc ¸on, Lucile Saulnier, L´ eo Tronchon, Stas Bekman, Amanpreet Singh, Anton Lozhkov, Thomas Wang, Siddharth Karamcheti, Alexander M. Rush, Douwe Kiela, Matthieu Cord, and Victor Sanh. OBELICS: An open web-scale filtered dataset of interleaved image-text documents. In NeurIPS , 2023.
- Feng Li, Renrui Zhang, Hao Zhang, Yuanhan Zhang, Bo Li, Wei Li, Zejun Ma, and Chunyuan Li. Llava-next-interleave: Tackling multi-image, video, and 3d in large multimodal models. arXiv:2407.07895 , 2024a.
- Kunchang Li, Yali Wang, Yinan He, Yizhuo Li, Yi Wang, Yi Liu, Zun Wang, Jilan Xu, Guo Chen, Ping Luo, et al. Mvbench: A comprehensive multi-modal video understanding benchmark. In CVPR , 2024b.
- Rensis Likert and WH Quasha. Minnesota Paper Form Board Test . Psychological Corporation, 1941.
- Rensis Likert and William H Quasha. Revised Minnesota paper form board test . Psychological Corporation, 1969.
- Haotian Liu, Chunyuan Li, Qingyang Wu, and Yong Jae Lee. Visual instruction tuning. In NeurIPS , 2023a.
- Yuan Liu, Haodong Duan, Yuanhan Zhang, Bo Li, Songyang Zhang, Wangbo Zhao, Yike Yuan, Jiaqi Wang, Conghui He, Ziwei Liu, Kai Chen, and Dahua Lin. Mmbench: Is your multi-modal model an all-around player? arXiv:2307.06281 , 2023b.
- Pan Lu, Hritik Bansal, Tony Xia, Jiacheng Liu, Chunyuan Li, Hannaneh Hajishirzi, Hao Cheng, KaiWei Chang, Michel Galley, and Jianfeng Gao. Mathvista: Evaluating mathematical reasoning of foundation models in visual contexts. In ICLR , 2024.
- Arjun Majumdar, Anurag Ajay, Xiaohan Zhang, Pranav Putta, Sriram Yenamandra, Mikael Henaff, Sneha Silwal, Paul Mcvay, Oleksandr Maksymets, Sergio Arnaud, et al. Openeqa: Embodied question answering in the era of foundation models. In CVPR , 2024.
- Hanspeter A Mallot. From Geometry to Behavior: An Introduction to Spatial Cognition . MIT Press, 2024.
- Kenneth Marino, Mohammad Rastegari, Ali Farhadi, and Roozbeh Mottaghi. OK-VQA: A visual question answering benchmark requiring external knowledge. In CVPR , 2019.
- J´ er ˆ ome Marquet-Dol´ eac, R´ egis Soppelsa, and Jean-Michel Albaret. Laby 5-12: Test des labyrinthes . Hogrefe, 2010.
- John C Marshall and Gereon R Fink. Spatial cognition: Where we were and where we are. Neuroimage , 14(1), 2001.
- Chiara Meneghetti, Clara Zancada-Men´ endez, Patricia Sampedro-Piquero, Laudino Lopez, Massimiliano Martinelli, Lucia Ronconi, and Barbara Rossi. Mental representations derived from navigation: The role of visuo-spatial abilities and working memory. Learning and Individual Differences , 49, 2016.
- Chiara Meneghetti, Laura Miola, Enrico Toffalini, Massimiliano Pastore, and Francesca Pazzaglia. Learning from navigation, and tasks assessing its accuracy: The role of visuospatial abilities and wayfinding inclinations. Journal of Environmental Psychology , 75, 2021.
- Chiara Meneghetti, Laura Miola, Tommaso Feraco, and Veronica Muffato. Individual differences in navigation: An introductory overview. In Prime Archives in Psychology . Vide Leaf, 2nd edition, 2022.
- Emil W Menzel. Chimpanzee spatial memory organization. Science , 182(4115), 1973.
- Mistral AI team. Large enough, 2024a. https://mistral.ai/news/ mistral-large-2407/ .
- Mistral AI team. Announcing pixtral 12b, 2024b. https://mistral.ai/news/ pixtral-12b/ .
- Ida Momennejad, Hosein Hasanbeig, Felipe Vieira Frujeri, Hiteshi Sharma, Robert Osazuwa Ness, Nebojsa Jojic, Hamid Palangi, and Jonathan Larson. Evaluating cognitive maps in large language models with cogeval: No emergent planning. In NeurIPS , 2023.
- Arsenii Moskvichev, Victor Vikram Odouard, and Melanie Mitchell. The conceptarc benchmark: Evaluating understanding and generalization in the ARC domain. Transactions on Machine Learning Research , 2023.
- Nora S. Newcombe. Making space: The development of spatial representation and reasoning . MIT Press, 2000.
- Nora S. Newcombe. Picture this: Increasing math and science learning by improving spatial thinking. American Educator , 34(2), 2010.
- Nora S. Newcombe. Spatial Cognition. In Open Encyclopedia of Cognitive Science . MIT Press, 2024.
- Rahel Noser and Richard W Byrne. Mental maps in chacma baboons (papio ursinus): using intergroup encounters as a natural experiment. Animal Cognition , 10, 2007.
- John O'Keefe and Lynn Nadel. The hippocampus as a cognitive map . Oxford University Press, 1978.
- OpenAI. GPT-4 technical report. arXiv:2303.08774 , 2023.
- OpenAI. Hello gpt-4o, 2024. https://openai.com/index/hello-gpt-4o/ .
- Long Ouyang, Jeffrey Wu, Xu Jiang, Diogo Almeida, Carroll L. Wainwright, Pamela Mishkin, Chong Zhang, Sandhini Agarwal, Katarina Slama, Alex Ray, John Schulman, Jacob Hilton, Fraser Kelton, Luke Miller, Maddie Simens, Amanda Askell, Peter Welinder, Paul F. Christiano, Jan Leike, and Ryan Lowe. Training language models to follow instructions with human feedback. In NeurIPS , 2022.
- Anja Pahor, Randy E Mester, Audrey A Carrillo, Eunice Ghil, Jason F Reimer, Susanne M Jaeggi, and Aaron R Seitz. Ucancellation: A new mobile measure of selective attention and concentration. Behavior Research Methods , 54(5), 2022.
- Viorica Patraucean, Lucas Smaira, Ankush Gupta, Adri` a Recasens, Larisa Markeeva, Dylan Banarse, Skanda Koppula, Joseph Heyward, Mateusz Malinowski, Yi Yang, et al. Perception test: A diagnostic benchmark for multimodal video models. In NeurIPS , 2023.
- HL Payne, GF Lynch, and Dmitriy Aronov. Neural representations of space in the hippocampus of a food-caching bird. Science , 373(6552), 2021.
- Francesca Pazzaglia and Holly A Taylor. Perspective, instruction, and cognitive style in spatial representation of a virtual environment. Spatial Cognition and Computation , 7(4), 2007.
- Michael Peters, Bruno Laeng, Kerry Latham, Marla Jackson, Raghad Zaiyouna, and Chris Richardson. A redrawn vandenberg and kuse mental rotations test-different versions and factors that affect performance. Brain and Cognition , 28(1), 1995.
- Roger Paul Peters. Wolf-sign: Scents And Space In A Wide-ranging Predator. University of Michigan, 1974.
- Jean Piaget, Baerbel Inhelder, F. J. Langdon, and J. L. Lunzer. The child's conception of space. British Journal of Educational Studies , 5(2), 1957.
- Leila M Porter and Paul A Garber. Foraging and spatial memory in wild weddell's saddleback tamarins (saguinus fuscicollis weddelli) when moving between distant and out-of-sight goals. International Journal of Primatology , 34, 2013.
- Katherine L Possin. Visual spatial cognition in neurodegenerative disease. Neurocase , 16(6), 2010.
- Andrea Presotto, Richard Fayrer-Hosken, Caitlin Curry, and Marguerite Madden. Spatial mapping shows that some african elephants use cognitive maps to navigate the core but not the periphery of their home ranges. Animal Cognition , 22, 2019.
- Rafael Rafailov, Archit Sharma, Eric Mitchell, Christopher D. Manning, Stefano Ermon, and Chelsea Finn. Direct preference optimization: Your language model is secretly a reward model. In NeurIPS , 2023.
- Ahad Rana. Common crawl - building an open web-scale crawl using hadoop, 2010. https: //www.slideshare.net/hadoopusergroup/common-crawlpresentation .
- Machel Reid, Nikolay Savinov, Denis Teplyashin, Dmitry Lepikhin, Timothy P. Lillicrap, JeanBaptiste Alayrac, Radu Soricut, Angeliki Lazaridou, Orhan Firat, Julian Schrittwieser, et al. Gemini 1.5: Unlocking multimodal understanding across millions of tokens of context. arXiv:2403.05530 , 2024.
- Anthony E Richardson, Daniel R Montello, and Mary Hegarty. Spatial knowledge acquisition from maps and from navigation in real and virtual environments. Memory & Cognition , 27(4), 1999.
- Barbara J Sahakian, Robin G Morris, John L Evenden, Andrew Heald, Raymond Levy, Michael Philpot, and Trevor W Robbins. A comparative study of visuospatial memory and learning in alzheimer-type dementia and parkinson's disease. Brain , 111(3), 1988.
- Keisuke Sakaguchi, Ronan Le Bras, Chandra Bhagavatula, and Yejin Choi. Winogrande: an adversarial winograd schema challenge at scale. Commun. ACM , 64(9), 2021.
- Manolis Savva, Abhishek Kadian, Oleksandr Maksymets, Yili Zhao, Erik Wijmans, Bhavana Jain, Julian Straub, Jia Liu, Vladlen Koltun, Jitendra Malik, Devi Parikh, and Dhruv Batra. Habitat: A platform for embodied AI research. In ICCV , 2019.
- John T. Serences and Sabine Kastner. A multi-level account of selective attention. The Oxford Handbook of Attention , 2014.
- Roger N Shepard and Jacqueline Metzler. Mental rotation of three-dimensional objects. Science , 171(3972), 1971.
Herbert A. Simon. The Sciences of the Artificial . MIT Press, 3rd edition, 2019.
- Linda Smith and Michael Gasser. The development of embodied cognition: Six lessons from babies. Artificial Life , 11(1-2), 2005.
- Ben Sorscher, Gabriel C Mel, Samuel A Ocko, Lisa M Giocomo, and Surya Ganguli. A unified theory for the computational and mechanistic origins of grid cells. Neuron , 111(1), 2023.
- Robert J Spencer, Carrington R Wendell, Paul P Giggey, Stephen L Seliger, Leslie I Katzel, and Shari R Waldstein. Judgment of line orientation: an examination of eight short forms. Journal of Clinical and Experimental Neuropsychology , 35(2), 2013.
- John Stilley. mazelib: A python api for creating and solving mazes, 2014. https://github. com/john-science/mazelib .
- Together Computer. Redpajama: An open source recipe to reproduce llama training dataset, 2023. https://github.com/togethercomputer/RedPajama-Data .
- Sivan Toledo, David Shohami, Ingo Schiffner, Emmanuel Lourie, Yotam Orchan, Yoav Bartan, and Ran Nathan. Cognitive map-based navigation in wild bats revealed by a new high-throughput tracking system. Science , 369(6500), 2020.
- Edward C Tolman. Cognitive maps in rats and men. Psychological Review , 55(4), 1948.
- Luca Tommasi, Cinzia Chiandetti, Tommaso Pecchia, Valeria Anna Sovrano, and Giorgio Vallortigara. From natural geometry to spatial cognition. Neuroscience & Biobehavioral Reviews , 36(2), 2012.
- Shengbang Tong, Zhuang Liu, Yuexiang Zhai, Yi Ma, Yann LeCun, and Saining Xie. Eyes wide shut? Exploring the visual shortcomings of multimodal LLMs. In CVPR , 2024.
- Trieu Trinh, Yuhuai Wu, Quoc Le, He He, and Thang Luong. Solving olympiad geometry without human demonstrations. Nature , 2024.
- Karthik Valmeekam, Alberto Olmo, Sarath Sreedharan, and Subbarao Kambhampati. PlanBench: An extensible benchmark for evaluating large language models on planning and reasoning about change. In NeurIPS , 2024.
- Steven G Vandenberg and Allan R Kuse. Mental rotations, a group test of three-dimensional spatial visualization. Perceptual and Motor Skills , 47(2), 1978.
- Marina Vasilyeva and Stella F Lourenco. Development of spatial cognition. Wiley Interdisciplinary Reviews: Cognitive Science , 3(3), 2012.
- Joe Verghese, Richard Lipton, and Emmeline Ayers. Spatial navigation and risk of cognitive impairment: A prospective cohort study. Alzheimer's & Dementia , 13(9), 2017.
- David Ed Waller and Lynn Ed Nadel. Handbook of Spatial Cognition . American Psychological Association, 2013.
- Lu Wang, Allan S Cohen, and Martha Carr. Spatial ability at two scales of representation: A metaanalysis. Learning and Individual Differences , 36, 2014.
- David Wechsler. WMS-IV: Wechsler Memory Scale . Pearson, 2009.
- Steven M Weisberg, Victor R Schinazi, Nora S Newcombe, Thomas F Shipley, and Russell A Epstein. Variations in cognitive maps: understanding individual differences in navigation. Journal of Experimental Psychology: Learning, Memory, and Cognition , 40(3), 2014.
- Joseph F Welklin, Benjamin R Sonnenberg, Carrie L Branch, Virginia K Heinen, Angela M Pitera, Lauren M Benedict, Lauren E Whitenack, Eli S Bridge, and Vladimir V Pravosudov. Spatial cognitive ability is associated with longevity in food-caching chickadees. Science , 385(6713), 2024.
- Erik Wijmans, Manolis Savva, Irfan Essa, Stefan Lee, Ari S. Morcos, and Dhruv Batra. Emergence of maps in the memories of blind navigation agents. In ICLR , 2023.
- Michele Andrisin Wittig and Mary J Allen. Measurement of adult performance on piaget's water horizontality task. Intelligence , 8(4), 1984.
- Dˆ everton Pl´ acido Xavier, Filipa Abreu, Antonio Souto, and Nicola Schiel. Choosing the best way: how wild common marmosets travel to efficiently exploit resources. Animal Cognition , 27(1), 2024.
- Jiayun Xu, Mauricio Girardi-Schappo, Jean-Claude Beique, Andr´ e Longtin, and Leonard Maler. Shortcutting from self-motion signals reveals a cognitive map in mice. Elife , 13, 2024.
- Yutaro Yamada, Yihan Bao, Andrew Kyle Lampinen, Jungo Kasai, and Ilker Yildirim. Evaluating spatial understanding of large language models. Transactions on Machine Learning Research , 2024.
- Kaining Ying, Fanqing Meng, Jin Wang, Zhiqian Li, Han Lin, Yue Yang, Hao Zhang, Wenbo Zhang, Yuqi Lin, Shuo Liu, et al. Mmt-bench: A comprehensive multimodal benchmark for evaluating large vision-language models towards multitask AGI. In ICML , 2024.
- Eunice Yiu, Maan Qraitem, Charlie Wong, Anisa Noor Majhi, Yutong Bai, Shiry Ginosar, Alison Gopnik, and Kate Saenko. Kiva: Kid-inspired visual analogies for testing large multimodal models. arXiv:2407.17773 , 2024.
- Alex Young, Bei Chen, Chao Li, Chengen Huang, Ge Zhang, Guanwei Zhang, Heng Li, Jiangcheng Zhu, Jianqun Chen, Jing Chang, et al. Yi: Open foundation models by 01.ai. arXiv:2403.04652 , 2024.
- Christopher J Young, Susan C Levine, and Kelly S Mix. The connection between spatial and mathematical ability across development. Frontiers in Psychology , 9, 2018.
- Weihao Yu, Zhengyuan Yang, Linjie Li, Jianfeng Wang, Kevin Lin, Zicheng Liu, Xinchao Wang, and Lijuan Wang. Mm-vet: Evaluating large multimodal models for integrated capabilities. In ICML , 2024.
- Xiang Yue, Yuansheng Ni, Kai Zhang, Tianyu Zheng, Ruoqi Liu, Ge Zhang, Samuel Stevens, Dongfu Jiang, Weiming Ren, Yuxuan Sun, et al. MMMU: A massive multi-discipline multimodal understanding and reasoning benchmark for expert AGI. In CVPR , 2024.
## A APPENDIX
## A.1 ECOLOGICAL COMPATIBILITY OF MULTIMODAL INPUTS WITH FRONTIER MODELS
Our results in Section 4 suggest that state-of-the-art frontier models fail in the spatial cognition tasks presented in SPACE. These failures can be attributed to the lack of spatial cognition in these models. Alternatively, these failures could be due to models not comprehending the inputs presented to them (i.e., the inputs are not ecologically compatible with the models). To rule out this alternative possibility, we design additional tests unrelated to spatial cognition on the same vision / text inputs used in our benchmark. If models succeed on these tests, we can infer that the inputs are ecologically compatible since the models can understand and perform tasks using these inputs. In each test, we pose a series of multiple-choice questions evaluating a model's fine-grained understanding of the inputs. We now describe these additional tests.
## Test 1: Given discrete map image / text inputs (see Figure 3), answer the following questions:
- Q1. What is the size of the grid (H x W)?
- Q2. What is your current (x, y) location?
- Q3. What are the (x, y) locations of all navigable cells? Include cells containing landmarks and your current position.
- Q4. What are the (x, y) locations of all obstacle cells?
- Q5. What are the landmarks visible in the image / array?
- Q6. What are the locations of the landmarks visible in the image / array?
## Test 2: Given an ego image (see Figure 3), answer the following questions:
- Q1. What is the name of the landmark visible in the image?
- Q2. Is the landmark < name > in the left half of the image?
- Q3. Is the landmark < name > in the right half of the image?
- Q4. Is the landmark < name > in the central section of the image?
## Test 3: Given two consecutive ego images from a walkthrough (see Figure 4), answer the following question:
- Q1. What is the action taken to go from image 1 to image 2 (move forward, turn left, turn right, wait/do nothing)?
## Test 4: Given a perspective taking image / text array (see Figures 9 and 10), answer the following questions:
- Q1. How many objects / non-zero locations are present in the image / array?
- Q2. What objects / non-zero locations are present in the image / array?
- Q3. Is < object / location > to the left of < object / location > in the image / array?
- Q4. Is < object / location > to the above < object / location > in the image / array?
## Test 5: Given water level test images (see Figure 11), answer the following questions:
- Q1. Is there water in the water container?
- Q2. From image 1 to image 2, is the water container rotated to the left, right or not rotated at all?
- Q3. From image 1 to image 2, what is the absolute rotation angle of the water container (in degrees)?
## Test 6: Given a grid of icons / characters from selective attention (see Figures 16 and 17), answer the following questions:
- Q1. How many total objects / characters are present in the image / grid (including repetitions)?
- Q2. What is the size of the grid of objects / characters (width x height)?
- Q3. How many unique objects / characters are present in the grid (ignore repetitions)?
Results discussion: We evaluate GPT-4o and GPT-4v on these tests. The results are shown in Tables 3 and 4. Both models largely understand DM image and text inputs (test 1). However, they fall short in calculating the grid size for DM images (Q1). GPT-4o understands egocentric images,
## Multimodal evaluation
| | Test | 1 | 1 | 1 | 1 | 1 | | Test 2 | Test 2 | Test 2 | Test 2 | Test 2 | Test 3 |
|--------|--------|------|------|------|-------|------|------|----------|----------|----------|----------|----------|----------|
| Model | Q1 | Q2 | Q3 | Q4 | Q5 | Q6 | Avg. | Q1 | Q2 | Q3 | Q4 | Avg. | Q1 |
| GPT-4o | 30.4 | 78.2 | 89.4 | 87.8 | 100.0 | 93.6 | 79.9 | 100.0 | 84.0 | 95.5 | 83.5 | 92.6 | 59.3 |
| GPT-4v | 55.8 | 86.2 | 89.8 | 91.2 | 99.8 | 79.2 | 83.6 | 98.0 | 45.0 | 36.5 | 56.5 | 66.8 | 48.0 |
## Text-only evaluation
Table 3: Measuring ecological compatibility of multimodal inputs with frontier models (part 1)
| | Test 1 | Test 1 | Test 1 | Test 1 | Test 1 | Test 1 | Test 1 | Test 2 | Test 2 | Test 2 | Test 2 | Test 2 | Test 3 |
|--------|----------|----------|----------|----------|----------|----------|----------|----------|----------|----------|----------|----------|----------|
| Model | Q1 | Q2 | Q3 | Q4 | Q5 | Q6 | Avg. | Q1 | Q2 | Q3 | Q4 | Avg. | Q1 |
| GPT-4o | 100.0 | 100.0 | 77.5 | 85.6 | 100.0 | 82.8 | 90.9 | - | - | - | - | - | - |
| GPT-4v | 100.0 | 100.0 | 96.8 | 91.0 | 100.0 | 77.6 | 94.2 | - | - | - | - | - | - |
## Multimodal evaluation
| Model | | | | | | Test 4 | Test 4 | Test 4 | Test 4 | Test | Test | Test | Test |
|---------|------|------|------|------|------|----------|----------|----------|----------|--------|--------|--------|--------|
| Model | Q1 | Q2 | Q3 | Q4 | Avg. | Q1 | Q2 | Q3 | Avg. | Q1 | Q2 | Q3 | Avg. |
| GPT-4o | 99.6 | 99.6 | 89.8 | 87.7 | 92.4 | 100.0 | 73.9 | 38.7 | 64.0 | 83.0 | 90.5 | 58.2 | 77.2 |
| GPT-4v | 78.3 | 87.4 | 78.4 | 76.0 | 79.0 | 100.0 | 56.3 | 32.4 | 55.4 | 74.5 | 88.0 | 35.8 | 66.0 |
## Text-only evaluation
Table 4: Measuring ecological compatibility of multimodal inputs with frontier models (part 2)
| | Test 4 | Test 4 | Test 4 | Test 4 | Test 5 | Test 5 | Test 5 | Test 5 | Test 5 | Test 6 | Test 6 | Test 6 | Test 6 |
|--------|----------|----------|----------|----------|----------|----------|----------|----------|----------|----------|----------|----------|----------|
| Model | Q1 | Q2 | Q3 | Q4 | Avg. | Q1 | Q2 | Q3 | Avg. | Q1 | Q2 | Q3 | Avg. |
| GPT-4o | 97.6 | 99.6 | 99.5 | 94.2 | 97.4 | - | - | - | - | 100.0 | 100.0 | 99.5 | 99.8 |
| GPT-4v | 96.8 | 98.1 | 92.2 | 76.8 | 90.8 | - | - | - | - | 99.5 | 100.0 | 94.8 | 98.1 |
i.e., recognizes and localizes landmarks in egocentric images (test 2). GPT-4v recognizes landmarks well (Q1), but performs poorly in localization (Q2, Q3 and Q4). Both GPT-4o and GPT-4v perform poorly on action estimation (test 3) and estimation of water container rotations (Q2 and Q3 in test 5). GPT-4o excels in understanding the perspective taking inputs with multimodal and text-only presentations (test 4). GPT-4v also performs well on test 4, but is worse with multimodal inputs when compared to text-only inputs. Finally, both GPT-4o and GPT-4v perform adequately with counting objects (Q1 in test 6) and grid sizes (Q2 in test 6) on selective attention task inputs with multimodal inputs. However, they struggle to calculate the number of unique objects / characters (Q3 in test 6). Both GPT-4o and GPT-4v excel at the text-only presentation of test 6.
Our results indicate that state-of-the-art models can understand multimodal and text-only inputs provided in our benchmark. They perform well in most of the tests, but have specific shortcomings (e.g., localizing landmarks in ego images for GPT-4v, understanding rotations of water containers and counting unique characters / objects in a grid). Importantly, the average results on each test is much higher than the SPACE task counterparts. For example, even though GPT-4o and GPT-4v understand DM text inputs nearly perfectly (test 1), they perform poorly in the DM text versions of the large-scale spatial cognition tasks (see Table 1). Similarly, even though GPT-4o understands the perspective taking inputs nearly perfectly for both text-only and multimodal presentations, it performs poorly on the perspective taking task in SPACE (see Table 2). Therefore, the failure of frontier models on SPACE is most likely due to their lack of spatial cognition, and not because they cannot understand the inputs presented to them.
## A.2 SMALL-SCALE SPATIAL COGNITION: ADDITIONAL DETAILS
We described the small-scale spatial cognition tasks from our benchmark in Section 3.2. Here, we provide additional details about the historical context and motivations behind these tasks.
Mental rotation test (MRT). This was introduced by Vandenberg & Kuse (1978) as a test of spatial visualization. The original MRT contained 20 items, where each item consisted of a criterion figure, two correct alternatives, and two distractors (Vandenberg & Kuse, 1978). The criterion figure is a perspective rendering of a 3D criterion shape from Shepard & Metzler (1971). The correct alternatives are rotated versions of the criterion shape, where the rotation is applied in the 2D image space
on the criterion figure, or along the vertical axis in 3D for the criterion shape. The distractors are rotated mirror-images of the criterion shape or renderings of other criterion shapes. The goal was to identify the two correct alternatives from the four choices. We implement a version of MRT with one correct choice and three distractors, and incorporate rotations along multiple axes (Peters et al., 1995).
Perspective taking test (PTT). This was introduced by Kozhevnikov & Hegarty (2001) as a test of spatial orientation. An arrangement of objects is shown on a piece of paper. A test participant is asked to take the perspective of standing next to an object (say, object A) facing another (say, object B), and is required to point to a third object (say, object C). This task has been used extensively in subsequent literature (Hegarty & Waller, 2004; Weisberg et al., 2014; Meneghetti et al., 2022). We implement this task by randomly sampling N icons of objects like cars, carrots, chairs, and grapes and place them at random locations in an image (with no overlap between objects). We then randomly sample three of the N objects as A, B, and C.
Water level test (WLT). This was introduced by Piaget et al. (1957) as a test of visuospatial perception. Originally, the test was designed to evaluate children's knowledge about the horizontal nature of the surface of water in a sealed bottle regardless of its orientation. Children were presented with bottles partially filled with colored water and asked to imagine the position of the water if it were tilted. Children had to gesture, draw, or use cardboard cutouts to answer the question (Piaget et al., 1957; Foltz, 1978; Wittig & Allen, 1984). Performance on the water-level test was found to be related to performance on spatial ability tests (Foltz, 1978; Wittig & Allen, 1984).
Judgement of Line Orientation test (JLO). This was introduced by Benton (1994) as a measure of visuospatial perception. The original implementation contained 30 samples presented in a flip-book style, where two lines are shown at the top of each page. The goal is to determine the angles between the two lines by comparing them to an array of reference lines (i.e., pick two reference lines that have same angle between them as the lines at the top). There have been multiple variations of JLO with subsets of the 30 questions for faster evaluation (Spencer et al., 2013). We recreate the JLO test suite by randomly sampling pairs of lines on a 2D plane with an angle between 0 to 180 degrees (in multiples of 18 degrees) and formulate it as multiple-choice QA.
Selective attention task (SAtt). This is designed to evaluate selective spatial attention (Serences & Kastner, 2014; Pahor et al., 2022). In particular, we use the widely used cancellation task, where the goal is to search for and mark out target stimuli embedded amidst distractors (Della Sala et al., 1992; Brickenkamp & Zillmer, 1998; Dalmaijer et al., 2015; Lacroix et al., 2021; Pahor et al., 2022; Kalina &Walgrave, 2004). The stimuli may be characters (Brickenkamp & Zillmer, 1998; Dalmaijer et al., 2015; Pahor et al., 2022; Della Sala et al., 1992; Kalina & Walgrave, 2004), pictures (Lacroix et al., 2021; Pahor et al., 2022), or icons (Lacroix et al., 2021). We implement this task with objects as the stimuli for visual evaluation and characters as stimuli for textual evaluation.
Maze completion task (MCT). This task was designed to evaluate spatial orientation, planning, and executive functioning (Lacroix et al., 2021). It was used as a neuropsychological test to assess executive function disorders in children (Marquet-Dol´ eac et al., 2010).
Corsi block-tapping task (CBTT). This is designed to assess visuospatial working memory and attention in healthy participants and patients with known or suspected brain damage (Corsi, 1972; Claessen et al., 2015). An examiner demonstrates a sequence of block-tapping movements on a board containing fixed blocks placed in pseudo-random positions. Participants are required to reproduce the same sequence (forward condition) or the inverted sequence (backward condition) of block-tapping movements to succeed. We evaluate frontier models on the forward condition since prior work has not found significant differences between task performance in the forward and backward conditions (Claessen et al., 2015).
Spatial addition task (SAdd). This was introduced in the fourth edition of the Wechsler Memory Scale, a suite of neuropsychological tests to evaluate memory function in individuals aged 16 to 90 (Wechsler, 2009). SAdd evaluates visuospatial storage and manipulation in working memory. A test participant is shown a grid with blue and red dots for five seconds. The participant is asked to remember the location of the blue dots and ignore the red dots. The participant is then shown another such grid. The objective is to add the two grids together by following certain rules. If a grid location has a blue dot in exactly one of grids, the result should be blue. If a grid location has blue dots on both grids, the result should be white.
Cambridge spatial working memory test (CSWM). This was designed to evaluate spatial working memory in human subjects (Sahakian et al., 1988). Multiple colored boxes are shown on a screen. Ayellow 'treasure' is initially hidden in one of the boxes. The participant must select boxes one at a time to open them and search for the treasure. Once the treasure is found, another treasure is placed in one of the remaining boxes. The intention is for the participant to locate all the yellow treasures via a process of elimination.
## A.3 SPACE EXAMPLES
We illustrate examples for each task from our proposed SPACE benchmark.
## Large-scale spatial cognition
- Egocentric image observations: Figures 4
- DMimage observations 2 : Figures 5, 6
## Small-scale spatial cognition
- MRT: Figures 7 and 8
- PTT: Figures 9 and 10
- WLT: Figure 11
- MPFB: Figures 12 and 13
- JLO: Figures 14 and 15
- MCT: Figures 22 and 23
- CBTT: Figures 18 and 19
- SAdd: Figures 20 and 21
- CSWM: Figures 24 and 25
## A.4 IMPLEMENTATION DETAILS
We provide additional implementation details about our experimental setup in this section.
3D environment generation: We create ten environment layouts based on prior work in cognitive science and artificial intelligence (Tolman, 1948; Gillner & Mallot, 1998; Richardson et al., 1999; Banino et al., 2018; Bouchekioua et al., 2021). Figure 3 shows bird's-eye view images of each layout. We populate each environment with visual landmarks in the form of paintings hanging on the walls, where the painting frames are 3D meshes and the paintings are images from ImageNet (Deng et al., 2009). To create a 3D environment for a given layout, we first randomly sample textures for walls, floors, and ceilings from a database of textures to create the base 3D mesh. Next, we randomly assign ImageNet images and 3D frame meshes to predefined landmark locations in the environment. We create the 3D environment using the Trimesh library and export it in glTF format (DawsonHaggerty et al., 2019). We simulate the environment using the Habitat simulator (Savva et al., 2019). We create 3 environments per layout, for a total of 30 environments in our benchmark.
Randomized trails for evaluation: For multiple-choice QA, we randomize the placement of the correct answer among the four choices such that it appears in each of the four positions once, yielding four trials per question. For each trial, we evaluate the performance over all questions to obtain the average accuracy. For interactive tasks like route retracing, shortcut discovery, MCT and CSWM, we evaluate each model in three independent trials and obtain the corresponding metrics. By performing multiple trials, we can compute means and standard deviations for each model on each task across the trials.
Humanperformance: Weobtain human performance on SPACE tasks by evaluating 29 participants (aged 20 - 50). We evenly divide the questions from our benchmark across all participants. For each participant, we provide HTML files containing a subset of questions from each SPACE task and the corresponding choices. The HTML files contain formatted versions of the prompts used to evaluate
2 DMtext observations are obtained by simply converting the DM image to text as illustrated in Figure 3.
frontier models. We do not provide any additional instructions or background information about how to solve the tasks. For efficiency, we group all questions corresponding to a single environment in the large-scale spatial cognition tasks. Each participant is assigned to view a video walkthrough from one environment and asked to answer a series of questions about that same environment. This is in line with classical protocols in human cognition (Allen et al., 1996; Hegarty et al., 2006; Pazzaglia & Taylor, 2007; Weisberg et al., 2014; Meneghetti et al., 2016; 2021). We further provide a CSV file where the participant is instructed to enter the answers. We instruct the participants to perform all tasks mentally without any aids like pen and paper. Each participant is estimated to have taken 60 to 90 minutes to answer all the questions. The participants send us their responses and we evaluate them collectively. We denote the collective performance of all participants as the human performance in Tables 1 and 2.
Note that we establish the human baseline only for the multiple-choice QA tasks since it was straightforward to share the test materials with the participants online and obtain their answers. The interactive tasks would require us to meet participants in person to perform evaluations and we were not equipped to do this.
Image preprocessing: For most of our experiments, we use square images. We provide the images to models as is without preprocessing. For most models (especially closed-source ones), the processing of the image beyond the input stage is outside our control. We rely on the model creators to correctly process the images. The exact image resolution and aspect ratios are task-dependent and listed in Table 5. For egocentric video inputs in the large-scale spatial cognition tasks, the number of frames varies from 61 to 240. Since GPT-4o, GPT-4v and Claude 3.5 Sonnet APIs did not permit 240+ frames as inputs, we subsample the video frames by a factor of 2 before providing them to the model. For DM video inputs, the number of frames varies from 13 to 72. We provide them as is to the model.
Table 5: Image resolutions and aspect ratios for images and videos in SPACE.
| Task | Image resolutions (W × H) |
|--------------------------------------------|-------------------------------------------------------------------------------------------------------------------------------------------------|
| Large-scale spatial cognition (Ego images) | 512 × 512 |
| Large-scale spatial cognition (DM images) | 512 × 512 |
| Mental rotation (MRT) | Varies from 595 × 541 to 1133 × 1432 since we crop the redundant white space around images. |
| Perspective taking (PTT) | 640 × 480 |
| Water level (WLT) | Varies from 239 × 488 to 787 × 631 since we crop the redundant white space around images. |
| Minnesota paper form board (MPFB) | 480 × 480 for choice images (i.e., puzzle pieces put together). Varies from 831 × 578 to 1211 × 740 for the image containing the puzzle pieces. |
| Judgement of line orientation (JLO) | 512 × 512 for the input image, 1656 × 910 for the legend |
| Selective attention (SAtt) | 512 × 512 for 3 × 3 grids, 768 × 768 for 4 × 4 grids, and 1024 × 1024 for 5 × 5 and 6 × 6 grids |
| Maze completion (MCT) | 1100 × 1100 for 11 × 11 mazes, 2300 × 2300 for 23 × 23 mazes, and 3100 × 3100 for 31 × 31 mazes |
| Corsi block-tapping (CBTT) | 1024 × 1024 |
| Spatial addition (SAdd) | 300 × 300 for 3 × 3 grids, 500 × 500 for 5 × 5 grids, 700 × 700 for 7 × 7 grids, and 900 × 900 for 9 × 9 grids |
| Cambridge spatial working memory (CSWM) | 1024 × 1024 |
Prompting frontier models for SPACE tasks: We evaluate frontier models on each of the SPACE tasks using zero-shot prompting. For each task, we design a prompt that provides a detailed description of the task and the expected response format. Below, we provide the prompt templates for each of the SPACE tasks. While the prompts have been formatted for visual display in L A T E X, the content remains the same. We have replaced images and arrays (in some cases) with placeholders for brevity.
Figure 4: Large-scale spatial cognition with ego image observations
<details>
<summary>Image 4 Details</summary>
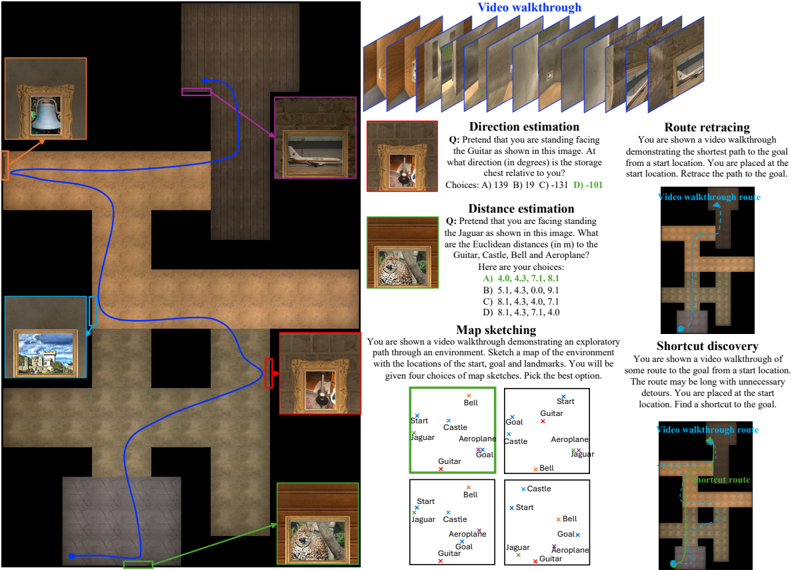
### Visual Description
## Diagram: Robotic Navigation Task Examples
### Overview
The image presents a collage of screenshots demonstrating various tasks within a robotic navigation environment. The tasks involve direction estimation, distance estimation, map sketching, route retracing, and shortcut discovery. Each task is presented with a visual scenario and multiple-choice questions. The overall theme is evaluating a robot's ability to understand and navigate a complex environment.
### Components/Axes
The image is divided into several sections, each representing a different task. Each section contains:
* **Visual Scenario:** A first-person view from a robot navigating an indoor environment with objects like a guitar, castle, bell, airplane, and jaguar.
* **Question:** A text-based question related to the visual scenario.
* **Choices:** Multiple-choice answers (A, B, C, D) to the question.
* **Header:** "Video walkthrough" with a series of small images depicting a robot moving through a similar environment.
### Detailed Analysis or Content Details
**1. Direction Estimation:**
* **Question:** "Q: Pretend that you are standing facing the Guitar as shown in this image. At what direction (in degrees) is the storage chest relative to you?"
* **Choices:** A) 130 B) 19 C) 131 D) -101
**2. Distance Estimation:**
* **Question:** "Q: Pretend that you are facing standing the Jaguar as shown in this image. What are the Euclidean distances (in m) to the Guitar, Castle, Bell and Aeroplane?"
* **Choices:**
* A) 4.0, 4.3, 7.1, 8.1
* B) 5.1, 4.3, 0.0, 9.1
* C) 8.1, 4.3, 4.0, 7.1
* D) 8.1, 4.3, 7.1, 4.0
**3. Map Sketching:**
* **Question:** "You are shown a video walkthrough demonstrating an exploratory path through an environment. Sketch a map of the environment with the locations of the start, goal and landmarks. You will be given four choices of map sketches. Pick the best option."
* **Map Options (Four Sketches):** Each sketch depicts the relative positions of "Start", "Goal", "Guitar", "Castle", "Bell", "Aeroplane", and "Jaguar". The sketches vary in the arrangement of these elements.
**4. Route Retracing:**
* **Question:** "You are shown a video walkthrough demonstrating the shortest path to the goal from a start location. You are placed at the start location. Retrace the path to the goal."
* **Visual:** A screenshot showing a path traced from a starting point to a goal point within a room.
**5. Shortcut Discovery:**
* **Question:** "You are shown a video walkthrough of some route to the goal from a start location. The route may be long with unnecessary detours. You are placed at the start location. Find a shortcut to the goal."
* **Visual:** A screenshot showing a path traced from a starting point to a goal point within a room, with a highlighted "shortcut route".
**Header Images:**
The header contains a series of approximately 10 small images showing a robot navigating a similar indoor environment. The robot appears to be a small, wheeled device.
### Key Observations
* The tasks are designed to assess different aspects of robotic navigation, including spatial reasoning, distance estimation, and path planning.
* The visual scenarios are consistent across tasks, using the same environment and objects.
* The multiple-choice questions require the user to interpret the visual information and apply their understanding of spatial relationships.
* The map sketching task is particularly challenging, as it requires the user to create a mental representation of the environment.
### Interpretation
The image demonstrates a series of tests designed to evaluate a robot's ability to perform complex navigation tasks in a realistic indoor environment. The tasks move from basic spatial reasoning (direction and distance estimation) to more advanced skills like map building and path planning. The inclusion of "shortcut discovery" suggests an emphasis on efficient navigation and the ability to adapt to changing circumstances. The use of multiple-choice questions allows for quantitative assessment of the robot's performance. The header images provide context, showing the robot actively exploring the environment. The overall goal appears to be to develop and test algorithms that enable robots to navigate and interact with the world in a more intelligent and autonomous way. The tasks are designed to mimic real-world scenarios, making the evaluation more relevant and practical. The consistent environment and objects across tasks allow for a controlled comparison of the robot's performance on different challenges.
</details>
## Large-scale spatial cognition
- Direction estimation:
Prompts 1, 2 and 3
- Distance estimation:
Prompts 4, 5 and 6
- •
- Map sketching:
Prompts 4, 5 and 6
- Route retracing:
Prompts 10, 11, 12 and 13
- •
- Shortcut discovery:
Prompts 14, 15, 16 and 17
## Small-scale spatial cognition
- Mental rotation test: Prompts 18 and 19
- Perspective taking test:
Prompts 20 and 21
- Water level test:
Prompt 22
- Minnesota Paper Form Board test:
Prompts 23 and 24
- Judgement of Line Orientation test:
Prompts 25 and 26
- Selective attention task:
Prompts 27 and 28
- Maze completion task:
Prompts 29 and 30
- Corsi block-tapping task: Prompts 32 and 31
- •
- Spatial addition task:
Prompts 33 and 34
- Cambridge spatial working memory test:
Prompts 35 and 36
Figure 5: Large-scale spatial cognition with DM image observations. Please note that the top-down visualization on the left needs to be rotated by 90 ◦ clockwise to get the DM images.
<details>
<summary>Image 5 Details</summary>
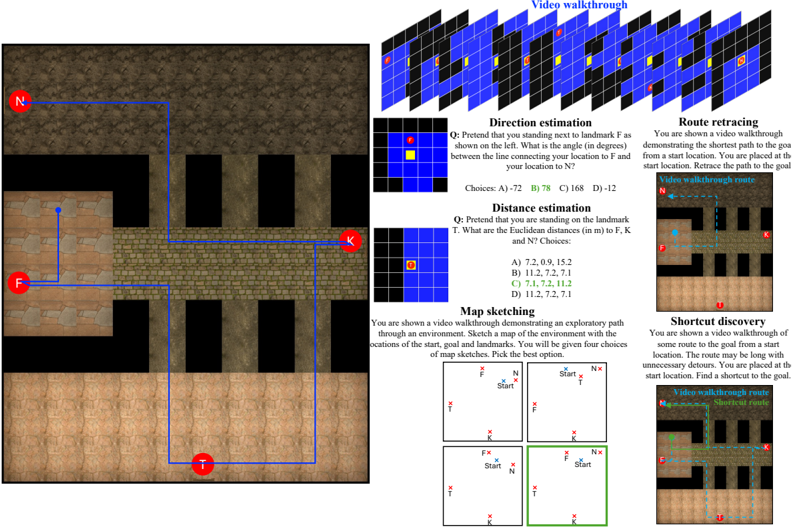
### Visual Description
\n
## Diagram: Spatial Reasoning Tasks
### Overview
The image presents a collection of spatial reasoning tasks, visually represented with diagrams and accompanying text questions. The tasks involve direction estimation, distance estimation, map sketching, route retracing, and shortcut discovery, all within a simulated environment resembling a brick wall. The diagram is divided into several sections, each focusing on a specific task.
### Components/Axes
The diagram is composed of the following sections:
* **Top Section:** "Video walkthrough" - A grid of small images representing a video sequence.
* **Left Section:** A 2D representation of a brick wall with landmarks labeled 'F', 'N', and 'T'.
* **Center-Left Section:** "Direction estimation" - A question and multiple-choice answers.
* **Center Section:** "Distance estimation" - A question and multiple-choice answers.
* **Bottom-Left Section:** "Map sketching" - Four map options with start, goal, and landmark locations.
* **Center-Right Section:** "Route retracing" - A video walkthrough demonstrating the shortest path.
* **Right Section:** "Shortcut discovery" - A video walkthrough demonstrating a route with potential shortcuts.
### Detailed Analysis or Content Details
**Left Section (2D Map):**
* Landmark F is positioned on the left side of the image.
* Landmark N is positioned on the top-left side of the image.
* Landmark T is positioned on the bottom-left side of the image.
* A blue line connects Landmark F to Landmark N.
* A red line connects Landmark F to Landmark T.
**Direction Estimation:**
* **Question:** "Pretend that you are standing next to landmark F as shown on the left. What is the angle (in degrees) between the line connecting your location to F and your location to N?"
* **Choices:** A) -72, B) -78, C) 168, D) -12
**Distance Estimation:**
* **Question:** "Pretend that you are standing on the landmark T. What are the Euclidean distances (in m) to F, K and N? Choices:"
* **Choices:** A) 7.2, 0.9, 15.2, B) 11.2, 7.2, 7.1, C) 7.1, 7.2, 11.2, D) 11.2, 7.2, 7.1
**Map Sketching:**
* **Question:** "You are shown a video walkthrough demonstrating an exploratory path through an environment. Sketch a map of the environment with the locations of the start, goal and landmarks. You will be given four choices of map sketches. Pick the best option."
* Four map options are presented, each showing the relative positions of "Start", "F", "N", and "T".
**Route Retracing:**
* **Text:** "You are shown a video walkthrough demonstrating the shortest path to the goal from a start location. You are placed at the start location. Retrace the path to the goal."
* A series of small images depict a video walkthrough of a path.
**Shortcut Discovery:**
* **Text:** "You are shown a video walkthrough with some route to the goal from a start location. The route may be long with unnecessary detours. You are placed at the start location. Find a shortcut to the goal."
* A series of small images depict a video walkthrough of a path, potentially with detours.
**Top Section (Video Walkthrough):**
* A grid of approximately 7x9 small images, likely representing frames from a video.
### Key Observations
* The tasks are designed to assess spatial reasoning abilities.
* The environment is consistently represented as a brick wall with specific landmarks.
* The questions require the user to apply geometric concepts (angles, distances) and map-reading skills.
* The video walkthroughs provide visual context for the tasks.
### Interpretation
The diagram illustrates a series of experiments or exercises aimed at evaluating human or artificial intelligence's spatial reasoning capabilities. The tasks progressively increase in complexity, starting with simple angle and distance estimations and moving towards more complex map sketching and route planning. The use of a consistent environment (the brick wall) allows for controlled comparisons between different approaches to spatial reasoning. The inclusion of video walkthroughs suggests a focus on dynamic environments and the ability to learn from observation. The questions are designed to test the ability to translate visual information into quantitative measurements (angles, distances) and to create mental representations of the environment. The "shortcut discovery" task highlights the importance of efficient path planning and the ability to identify and exploit opportunities for optimization. The overall goal appears to be to understand how individuals or agents perceive, represent, and navigate spatial environments.
</details>
Figure 6: Large-scale spatial cognition with DM image observations. Please note that the top-down visualization on the left needs to be rotated by 90 ◦ clockwise to get the DM images.
<details>
<summary>Image 6 Details</summary>
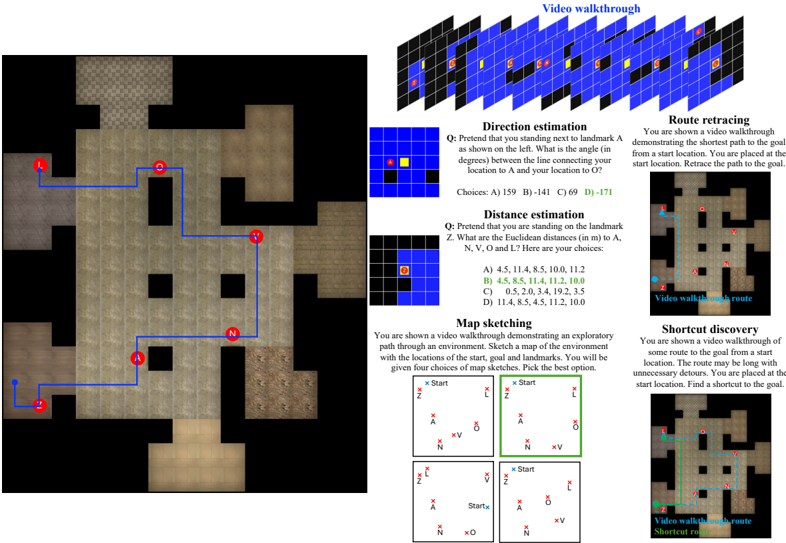
### Visual Description
\n
## Spatial Reasoning Task: Environment Navigation
### Overview
The image presents a collection of spatial reasoning tasks related to navigating a grid-based environment. It includes a central grid map, several question prompts with multiple-choice answers, and visual demonstrations of pathfinding concepts like shortest routes and shortcuts. The tasks assess skills in direction estimation, distance estimation, map sketching, route retracing, and shortcut discovery.
### Components/Axes
The image is divided into several sections:
* **Central Grid Map:** A 7x7 grid with colored squares (blue, red, yellow, green) representing different locations or landmarks. The grid has a path marked with a blue line. Landmarks are indicated by circular icons labeled 'A', 'N', 'O', and 'L'.
* **Video Walkthrough (Top):** A 3D isometric view of a similar grid environment, likely used as a visual aid for the tasks.
* **Direction Estimation:** A question prompt asking for the angle between two locations (A and O) on the grid. Choices are A) 159 B) 141 C) 69 D) 171.
* **Distance Estimation:** A question prompt asking for Euclidean distances (in m) between locations N, V, and L. Choices are A) 4.5, 11.4, 8.5, 10.0, 11.2 B) 4.5, 8.5, 11.4, 11.2, 10.0 C) 0.5, 2.0, 3.4, 19.2, 3.5 D) 11.4, 8.5, 4.5, 11.2, 10.0.
* **Map Sketching:** Four options for map sketches, each showing the start location, goal, and landmarks A, N, V, and O.
* **Route Retracing (Right):** A visual demonstration of retracing the shortest path from a start location to the goal, with a blue line indicating the route. The text reads "You are shown a video walkthrough demonstrating the shortest path to the goal from a start location. Retrace the path to the goal."
* **Shortcut Discovery (Bottom-Right):** A visual demonstration of finding a shortcut from a start location to the goal, with a green line indicating the shortcut. The text reads "You are shown a video walkthrough of some route to the goal from a start location. The route may be long with unnecessary detours. You are placed at the start location. Find a shortcut to the goal."
### Detailed Analysis or Content Details
**Central Grid Map:**
* The grid is 7x7.
* The path starts at the bottom-left corner and ends near the top-right corner.
* Landmark A is located at (1,0) (row 0, column 1).
* Landmark N is located at (5,1).
* Landmark O is located at (0,6).
* Landmark L is located at (6,6).
**Direction Estimation:**
* The question asks for the angle between locations A and O.
* The choices are: 159°, 141°, 69°, 171°.
**Distance Estimation:**
* The question asks for the Euclidean distances between N, V, and L.
* The choices are:
* A) 4.5, 11.4, 8.5, 10.0, 11.2
* B) 4.5, 8.5, 11.4, 11.2, 10.0
* C) 0.5, 2.0, 3.4, 19.2, 3.5
* D) 11.4, 8.5, 4.5, 11.2, 10.0
**Map Sketching:**
* Four map sketches are provided, each with a different arrangement of landmarks relative to the start and goal.
**Route Retracing:**
* The visual shows a blue line tracing a path through the grid.
**Shortcut Discovery:**
* The visual shows a green line representing a shortcut through the grid.
### Key Observations
* The tasks are designed to test spatial reasoning abilities in a grid-based environment.
* The visual aids (3D walkthroughs and grid maps) are intended to help participants understand the spatial relationships.
* The multiple-choice questions require participants to apply their spatial reasoning skills to estimate angles and distances.
* The map sketching task requires participants to create a mental representation of the environment and translate it into a visual form.
* The route retracing and shortcut discovery tasks assess participants' ability to find optimal paths through the grid.
### Interpretation
The image represents a comprehensive assessment of spatial reasoning skills. The tasks are interconnected, as understanding the environment (through the grid map and walkthroughs) is crucial for answering the questions and completing the challenges. The tasks progressively increase in complexity, starting with basic direction and distance estimation and culminating in more complex pathfinding tasks.
The inclusion of multiple-choice options suggests that the assessment is designed to be relatively objective. However, the map sketching task introduces a degree of subjectivity, as there may be multiple valid ways to represent the environment.
The visual demonstrations of route retracing and shortcut discovery highlight the importance of efficient pathfinding. The contrast between the longer route and the shortcut emphasizes the benefits of identifying and utilizing shortcuts to reach the goal more quickly.
The overall purpose of the assessment is likely to evaluate individuals' ability to navigate and reason about spatial environments, which is a valuable skill in many real-world applications, such as robotics, navigation, and urban planning. The tasks are designed to test both perceptual and cognitive aspects of spatial reasoning, including spatial awareness, mental rotation, and path planning.
</details>
Figure 7: Mental rotation (MRT) with visual inputs: Which choice image shows the reference shape rotated in 3D?
<details>
<summary>Image 7 Details</summary>
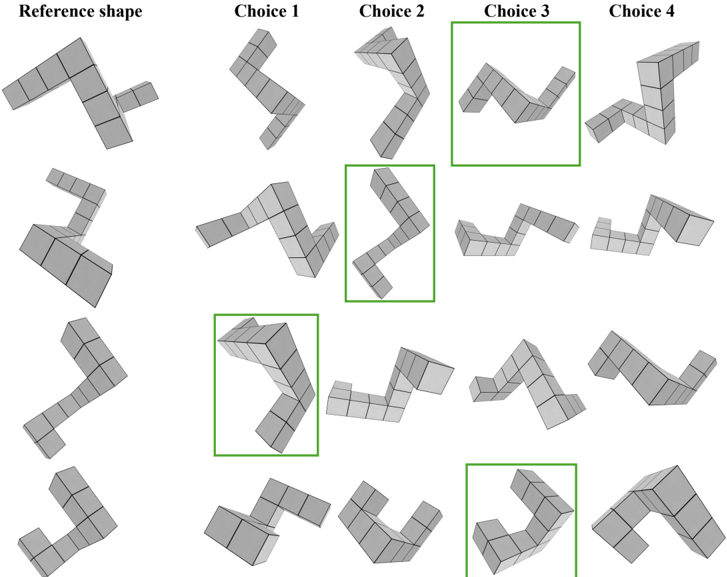
### Visual Description
\n
## Diagram: Shape Matching Task
### Overview
The image presents a shape matching task. A "Reference shape" is shown on the left, and four "Choices" (labeled 1 through 4) are presented to the right. The task appears to be identifying which of the choices is a rotated or mirrored version of the reference shape. Several instances of the choices are shown, with some choices highlighted by a green bounding box.
### Components/Axes
The diagram consists of the following labeled components:
* **Reference shape:** Located in the top-left corner.
* **Choice 1:** Located to the right of the "Reference shape", in the top row.
* **Choice 2:** Located to the right of "Choice 1", in the top row.
* **Choice 3:** Located to the right of "Choice 2", in the top row.
* **Choice 4:** Located to the right of "Choice 3", in the top row.
The diagram is arranged in a grid-like structure, with multiple repetitions of the four choices below the initial row. A green bounding box highlights specific instances of Choices 2, 3, and 4.
### Detailed Analysis or Content Details
The "Reference shape" is a complex 3D structure composed of multiple cubes connected together. It has a distinctive "S" like bend.
* **Choice 1:** Appears to be a rotated version of the reference shape, but with a different orientation.
* **Choice 2:** Appears to be a rotated and potentially mirrored version of the reference shape.
* **Choice 3:** Appears to be a rotated version of the reference shape, closely resembling the original.
* **Choice 4:** Appears to be a rotated version of the reference shape, with a different orientation.
The green bounding boxes highlight the following instances:
* Choice 2 in the second row.
* Choice 3 in the third row.
* Choice 4 in the fourth row.
* Choice 2 in the bottom row.
### Key Observations
The diagram presents a visual task that requires spatial reasoning and the ability to mentally rotate and/or mirror 3D objects. The green bounding boxes suggest that these specific instances of the choices are of particular interest, potentially representing correct matches or examples used in an experiment. The repetition of the choices suggests a multiple-choice format or a series of trials.
### Interpretation
This diagram likely represents a stimulus used in a cognitive psychology experiment, specifically one investigating spatial abilities. The task requires participants to identify the shape that is congruent to the reference shape, despite variations in orientation. The green boxes could indicate correct responses, or responses selected by a participant. The experiment could be designed to assess an individual's ability to perform mental rotations, or to identify patterns in their error rate. The complexity of the shape suggests that the task is not trivial and requires significant cognitive effort. The arrangement of the choices and the repetition of the task suggest a controlled experimental setup. The diagram does not provide any quantitative data, but it clearly illustrates the nature of the task being presented.
</details>
view ,none, back used,year ,none view,been ,none
Figure 8: Mental rotation (MRT) with text inputs: Which choice array shows the reference array rotated in 2D?
<details>
<summary>Image 8 Details</summary>
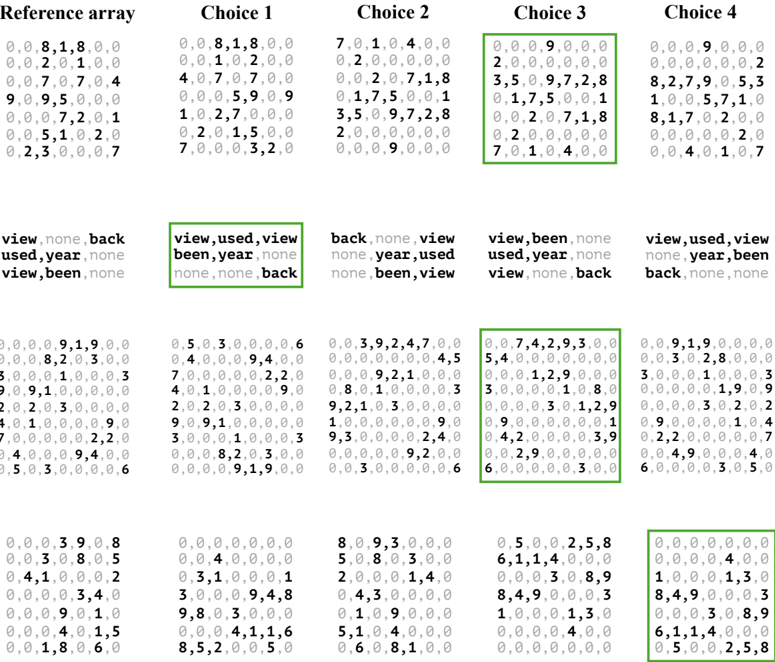
### Visual Description
## Data Array: Choice Selections
### Overview
The image presents four arrays of numerical data, labeled "Choice 1" through "Choice 4", alongside a "Reference array". Each array is accompanied by a row of text labels. The arrays appear to represent selections or preferences, with the numerical values potentially indicating strength or frequency of those selections.
### Components/Axes
* **Reference array:** Located at the top-left corner. Contains numerical values.
* **Choice 1-4:** Four arrays positioned to the right of the Reference array, arranged in a row. Each contains numerical values.
* **Text Labels:** Below each array, a row of text labels is present.
* **Color Coding:** The numerical values within each array are color-coded, with a legend at the bottom of the image. The legend maps colors to numerical ranges.
* **Legend:** Located at the bottom of the image. It shows a gradient of colors and corresponding numerical ranges. The colors are:
* White: 0.0
* Light Blue: 0.1 - 0.2
* Medium Blue: 0.3 - 0.4
* Dark Blue: 0.5 - 0.6
* Green: 0.7 - 0.8
* Yellow: 0.9
* Red: 1.0
### Detailed Analysis or Content Details
**Reference array:**
The Reference array contains the following values (approximate):
0.0, 0.8, 1.8, 0.0, 0.0, 2.0, 1.0, 0.4, 9.0, 9.5, 0.0, 0.0, 0.0, 7.2, 0.1, 0.0, 5.1, 1.2, 0.7, 0.0, 2.3, 3.0, 3.2, 0.0
**Choice 1:**
The values in Choice 1 are:
0.0, 0.8, 1.8, 0.0, 0.0, 2.0, 1.0, 0.4, 4.0, 7.0, 0.0, 1.0, 2.7, 0.0, 0.0, 0.0, 7.0, 0.0, 5.0, 3.2, 0.0
Text label: "view, used, view, been, year, none, none, none, back"
**Choice 2:**
The values in Choice 2 are:
7.0, 1.0, 4.0, 0.0, 0.0, 2.0, 0.0, 0.0, 0.0, 2.0, 7.1, 8, 1.7, 5.0, 0.1, 3.5, 5.0, 9.7, 2.8, 2.0, 0.0, 0.0, 0.0
Text label: "back, none, view, none, year, used, none, been, view"
**Choice 3:**
The values in Choice 3 are:
2.0, 0.0, 9.0, 0.0, 0.0, 0.0, 0.0, 0.0, 3.5, 0.9, 7.2, 8, 1.7, 5.0, 0.1, 0.0, 2.0, 7.1, 8, 7.0, 1.0, 4.0, 0.0
Text label: "view, been, none, used, year, none, view, back, none"
**Choice 4:**
The values in Choice 4 are:
0.0, 0.0, 9.0, 0.0, 0.0, 0.0, 0.0, 0.2, 8.2, 7.9, 0.5, 3, 1.0, 0.5, 7.1, 8.1, 7.2, 0.0, 2.0, 0.0, 4.0, 1.0, 7
Text label: "view, used, view, none, year, back, none, been, view"
**Bottom Row Arrays:**
Each of the four bottom row arrays contains similar numerical values to the arrays above them. The values are:
* Array 1: 0.0, 5.0, 3.0, 9.1, 9.0, 6, 4.0, 3.0, 9.4, 0.0, 7.0, 0.0, 2.2, 2.0, 4.1, 1.0, 3.0, 0.0, 9.2, 1.0, 3.3, 0.0
* Array 2: 0.0, 5.0, 3.0, 9.1, 9.0, 6, 4.0, 3.0, 9.4, 0.0, 7.0, 0.0, 2.2, 2.0, 4.1, 1.0, 3.0, 0.0, 9.2, 1.0, 3.3, 0.0
* Array 3: 0.0, 3.9, 2.4, 7.0, 0.0, 4.5, 0.0, 0.0, 9.2, 1.0, 3.0, 0.0, 0.0, 1.2, 8.8, 0.0, 3.0, 1.0, 2.0, 0.0, 0.0, 0.0
* Array 4: 0.0, 9.1, 9.0, 3.0, 0.0, 0.0, 5.4, 0.0, 4.2, 9.3, 0.0, 3.0, 1.2, 9.8, 0.0, 0.0, 3.0, 1.0, 1.8, 0.0, 2.9, 4.3
### Key Observations
* The "Reference array" appears to serve as a baseline or control.
* The text labels below each array suggest categories or features being evaluated ("view", "used", "year", "none", "back", "been").
* The color coding indicates the strength of selection for each category. Red (1.0) represents the strongest selection, while white (0.0) represents no selection.
* There is a high degree of similarity between the values in "Choice 1" and the "Reference array".
* "Choice 2" and "Choice 4" have several high values (red) in the range of 7.0-9.0.
* The bottom row arrays seem to be a repetition of the top arrays, potentially representing a different dimension or iteration of the same data.
### Interpretation
This data likely represents user preferences or selections across different choices. The "Reference array" could be a default or average preference profile. The "Choices" represent alternative profiles, potentially generated by different users or under different conditions. The text labels indicate the features or categories being considered when making these selections.
The high values in "Choice 2" and "Choice 4" suggest that these profiles strongly favor certain features (indicated by the red color). The similarity between "Choice 1" and the "Reference array" suggests that this profile closely aligns with the default or average preference.
The repetition of the arrays in the bottom row could indicate a second-order analysis or a different perspective on the same data. For example, it could represent the frequency of each selection within each choice.
Without further context, it's difficult to determine the specific meaning of the features ("view", "used", "year", etc.). However, the data suggests a clear pattern of preferences and variations across different choices.
</details>
Pretend that you are standing at the bat and facing the book. At what clockwise angle (in degrees) is the apple located relative to you?
<details>
<summary>Image 9 Details</summary>
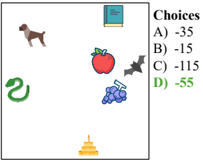
### Visual Description
\n
## Image: Multiple Choice Question with Images
### Overview
The image presents a multiple-choice question with images as visual cues. The question itself is not explicitly stated, but the answer choices are numerical values. The images appear to be unrelated objects.
### Components/Axes
The image contains the following elements:
* **Images:** Dog, Book, Apple, Bat, Grapes, Snake, Pagoda.
* **Choices:** A) -35, B) -15, C) -115, D) -55.
* **Layout:** The images are scattered across the image. The choices are listed in the top-right corner.
### Detailed Analysis or Content Details
The image does not contain any data points or trends to analyze. It is a visual representation of a multiple-choice question. The images are positioned as follows:
* Dog: Top-left
* Book: Top-center
* Apple: Center
* Bat: Top-right, next to the choices
* Grapes: Center-bottom
* Snake: Bottom-left
* Pagoda: Bottom-center
The choices are listed vertically:
* A) -35
* B) -15
* C) -115
* D) -55
### Key Observations
The image is a static representation of a question. There are no numerical trends or data distributions to observe. The question is likely designed to test a conceptual understanding or association between the images and the numerical choices.
### Interpretation
The image presents a multiple-choice question where the correct answer is likely linked to the images provided. Without the question itself, it is impossible to determine the logic behind the association. The negative values in the choices suggest the question might involve subtraction, temperature, or some other concept where negative numbers are relevant. The images are seemingly random, and their connection to the numerical choices is unknown without the question statement. The image is a visual aid for a question, not a data representation in itself.
</details>
Pretend that you are standing at the grapes and facing the donut. At what clockwise angle (in degrees) is the book relative to you?
Pretend that you are standing at the cake and facing the desk. At what clockwise angle (in degrees) is the bat relative to you?
Figure 9: Perspective taking (PTT) with visual inputs .
<details>
<summary>Image 10 Details</summary>
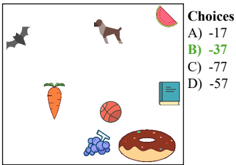
### Visual Description
\n
## Image: Multiple Choice Question with Visual Elements
### Overview
The image presents a multiple-choice question with a series of visual elements (images of objects) and a list of numerical answer choices. The question itself is not explicitly stated, but the format suggests a pattern-recognition or association task. There is no data or chart to analyze, only a visual arrangement of objects and answer options.
### Components/Axes
The image is divided into two main sections:
1. **Visual Elements:** A collection of images depicting a bat, a dog, a watermelon slice, a carrot, a basketball, grapes, a donut, and a book. These are scattered across the image.
2. **Answer Choices:** A list labeled "Choices" with four options:
* A) -17
* B) -37
* C) -77
* D) -57
The "Choices" label is positioned in the top-right corner of the image. The visual elements are distributed throughout the central area.
### Detailed Analysis or Content Details
There is no numerical data or trends to analyze. The image consists solely of visual elements and answer choices. The objects are:
* Bat (grey)
* Dog (brown)
* Watermelon (pink/red)
* Carrot (orange)
* Basketball (orange/brown)
* Grapes (purple)
* Donut (brown)
* Book (blue)
The answer choices are:
* -17
* -37
* -77
* -57
### Key Observations
The image presents a visual puzzle or question. The relationship between the objects and the numerical answer choices is not immediately apparent. The negative signs in the answer choices suggest a possible subtraction or negative correlation.
### Interpretation
The image likely represents a question designed to test a specific type of reasoning or pattern recognition. Without the question prompt, it's impossible to determine the intended logic. The objects could be categorized based on various criteria (e.g., animal vs. food, color, shape), and the answer choices might correspond to a numerical value assigned to each category or object. The negative numbers suggest a possible subtraction or a negative association. The question is likely designed to be ambiguous and require some form of lateral thinking or deduction. It is a visual problem-solving task.
</details>
<details>
<summary>Image 11 Details</summary>
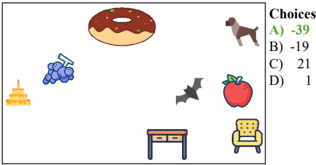
### Visual Description
\n
## Image: Multiple Choice Question with Visuals
### Overview
The image presents a multiple-choice question with visual elements. The question appears to be a visual reasoning or pattern recognition task. There are several images scattered across the image, and a list of choices labeled A through D with corresponding numerical values.
### Components/Axes
There are no axes or scales present. The components are:
* **Images:** Donut, Dog, Grapes, Cake, Bat, Apple, Table, Chair.
* **Choices:** A, B, C, D
* **Values:** -39, -19, 21, 1
### Detailed Analysis or Content Details
The image contains the following choices and their associated values:
* A: -39 (Green text)
* B: -19 (Green text)
* C: 21 (Green text)
* D: 1 (Green text)
The images are positioned seemingly randomly across the image. There is no apparent relationship between the images and the choices. The question itself is not explicitly stated.
### Key Observations
The values associated with the choices are integers, including both negative and positive numbers. The question appears to be testing a pattern or relationship between the images and the numerical values. Without the question prompt, it is impossible to determine the logic behind the choices.
### Interpretation
The image presents a visual reasoning puzzle. The task likely involves identifying a pattern or relationship between the images and the numerical values provided as choices. The absence of a clear question makes it difficult to determine the intended logic. It is possible the question is asking to select the value that corresponds to a specific image, or to identify a pattern based on the images' characteristics. The image is a test question, and the intent is to assess problem-solving skills. The question is incomplete without the prompt.
</details>
Figure 10: Perspective taking (PTT) with text inputs . The array colors are only for illustration purposes.
<details>
<summary>Image 12 Details</summary>
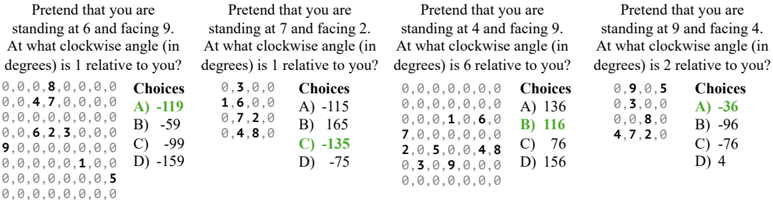
### Visual Description
## Textual Problem Set: Spatial Reasoning
### Overview
The image presents four independent spatial reasoning problems. Each problem describes a scenario where a person is standing at one point and facing another, and asks for the clockwise angle (in degrees) between their line of sight and a reference point. Each problem includes a set of choices (A-D) for the answer. The problems are arranged in a horizontal row, four problems side-by-side.
### Components/Axes
Each problem consists of:
* **Problem Statement:** A sentence describing the standing position, facing direction, and the angle to be determined.
* **Coordinate Data:** A series of numbers, presumably representing coordinates or points in a 2D space. These numbers are arranged in rows and columns, but their specific meaning isn't explicitly stated.
* **Choices:** Four multiple-choice options (A, B, C, D) with corresponding numerical values representing angles in degrees.
### Content Details
Here's a breakdown of each problem:
**Problem 1:**
* Standing at 6, facing 9.
* Angle to determine: Angle between line of sight to 1 relative to the observer.
* Choices:
* A) -119
* B) -59
* C) -99
* D) -159
**Problem 2:**
* Standing at 7, facing 2.
* Angle to determine: Angle between line of sight to 1 relative to the observer.
* Choices:
* A) -115
* B) 165
* C) -135
* D) -75
**Problem 3:**
* Standing at 4, facing 9.
* Angle to determine: Angle between line of sight to 6 relative to the observer.
* Choices:
* A) 136
* B) 116
* C) 76
* D) 156
**Problem 4:**
* Standing at 9, facing 4.
* Angle to determine: Angle between line of sight to 2 relative to the observer.
* Choices:
* A) -36
* B) -96
* C) -76
* D) 4
The coordinate data for each problem is as follows:
**Problem 1:** 0, 0, 8, 0, 0, 0, 0, 4, 7, 0, 0, 0, 0, 6, 2, 3, 0, 0, 9, 0, 0, 0, 0, 5, 0, 0, 0, 0, 0, 0
**Problem 2:** 0, 3, 0, 0, 0, 1, 6, 0, 0, 0, 7, 2, 0, 0, 4, 8, 0, 0
**Problem 3:** 0, 0, 0, 0, 0, 0, 0, 0, 0, 0, 0, 1, 6, 0, 7, 0, 0, 2, 5, 0, 4, 8, 0, 3, 9, 0, 0, 0, 0, 0
**Problem 4:** 0, 9, 5, 0, 3, 0, 0, 0, 0, 8, 0, 0, 4, 7, 2, 0, 0
### Key Observations
The problems are designed to test spatial reasoning skills. The coordinate data is likely intended to be used in conjunction with the standing and facing positions to calculate the angle. The negative angles suggest a clockwise rotation. The coordinate data appears to be irrelevant to the solution.
### Interpretation
The image presents a set of geometry problems. The problems require the user to visualize a scenario in 2D space and calculate an angle based on the given positions and orientations. The coordinate data is a red herring, and the solution likely relies on understanding the relative positions of the points and applying trigonometric principles or geometric reasoning. The problems are likely part of an assessment or practice material for spatial reasoning skills. The problems are testing the ability to mentally rotate objects and determine angles.
</details>
Figure 11: Water level (WLT) with vision inputs: Given a water container filled with water, predict the water level in the rotated container.
<details>
<summary>Image 13 Details</summary>
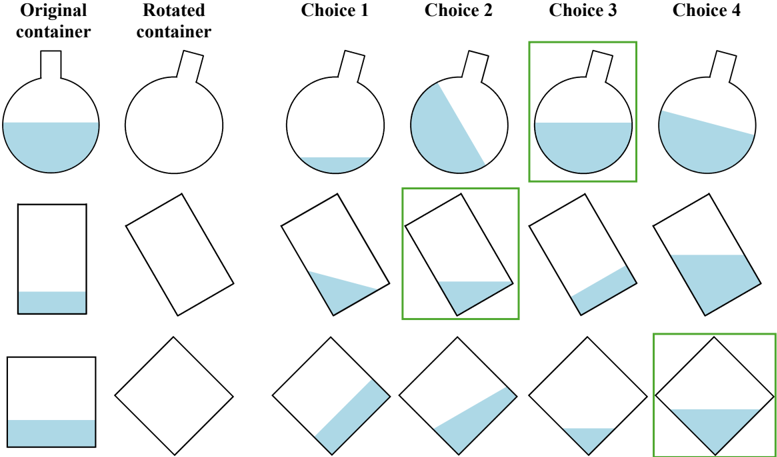
### Visual Description
\n
## Diagram: Liquid Volume Conservation Test
### Overview
The image presents a visual test designed to assess understanding of liquid volume conservation. It displays a series of containers, initially with a liquid level in the "Original container", then rotated, and then presented with four "Choice" containers. The choices are highlighted with green boxes around the containers that match the original volume.
### Components/Axes
The diagram is organized into columns labeled: "Original container", "Rotated container", "Choice 1", "Choice 2", "Choice 3", and "Choice 4". There are three rows, each depicting a different container shape: a flask, a rectangle, and a diamond. Each container is shown with a liquid level.
### Detailed Analysis or Content Details
The diagram shows three different container shapes, each in three states: original, rotated, and four possible choices.
* **Flask:**
* Original: The flask is upright, with the liquid filling approximately the bottom quarter of the container.
* Rotated: The flask is rotated 90 degrees clockwise, with the liquid level remaining the same relative to the container.
* Choice 1: The flask is upright, with approximately half of the container filled with liquid.
* Choice 2: The flask is upright, with approximately the bottom quarter of the container filled with liquid.
* Choice 3: The flask is rotated 90 degrees clockwise, with approximately half of the container filled with liquid.
* Choice 4: The flask is rotated 90 degrees clockwise, with approximately the bottom quarter of the container filled with liquid. (Highlighted in green)
* **Rectangle:**
* Original: The rectangle is upright, with the liquid filling approximately the bottom sixth of the container.
* Rotated: The rectangle is rotated 45 degrees clockwise, with the liquid level remaining the same relative to the container.
* Choice 1: The rectangle is rotated 45 degrees clockwise, with approximately the bottom third of the container filled with liquid.
* Choice 2: The rectangle is rotated 45 degrees clockwise, with approximately the bottom sixth of the container filled with liquid. (Highlighted in green)
* Choice 3: The rectangle is rotated 45 degrees clockwise, with approximately the bottom third of the container filled with liquid.
* Choice 4: The rectangle is rotated 45 degrees clockwise, with approximately the bottom sixth of the container filled with liquid.
* **Diamond:**
* Original: The diamond is upright, with the liquid filling approximately the bottom sixth of the container.
* Rotated: The diamond is rotated 45 degrees clockwise, with the liquid level remaining the same relative to the container.
* Choice 1: The diamond is rotated 45 degrees clockwise, with approximately the bottom third of the container filled with liquid.
* Choice 2: The diamond is rotated 45 degrees clockwise, with approximately the bottom sixth of the container filled with liquid. (Highlighted in green)
* Choice 3: The diamond is rotated 45 degrees clockwise, with approximately the bottom third of the container filled with liquid.
* Choice 4: The diamond is rotated 45 degrees clockwise, with approximately the bottom sixth of the container filled with liquid.
### Key Observations
The diagram highlights the correct choices (Choice 2 for the rectangle and diamond, and Choice 4 for the flask) with green boxes. These choices represent the containers where the liquid volume remains the same despite the change in orientation. The other choices demonstrate a misunderstanding of volume conservation, where the perceived liquid level changes with the container's orientation.
### Interpretation
This diagram illustrates a classic cognitive development test related to Piaget's theory of cognitive development, specifically the concept of conservation. The test aims to determine whether an individual understands that the amount of liquid remains constant even when its appearance changes due to a change in container shape or orientation. The correct responses (highlighted in green) indicate an understanding of volume conservation, while incorrect responses suggest a focus on perceptual cues (e.g., height of the liquid) rather than the underlying quantity. The diagram demonstrates that children in the preoperational stage often struggle with this concept, as they tend to focus on the visible aspects of the liquid rather than its actual volume. The consistent highlighting of the rotated container with the same volume suggests the test is designed to assess the ability to disregard the shape and focus on the quantity.
</details>
Figure 12: Minnesota Paper Form Board (MPFB) with visual inputs: Which one of the four choices shows what it would be like when the puzzle pieces are put together? The puzzle pieces can be rotated but not flipped.
<details>
<summary>Image 14 Details</summary>
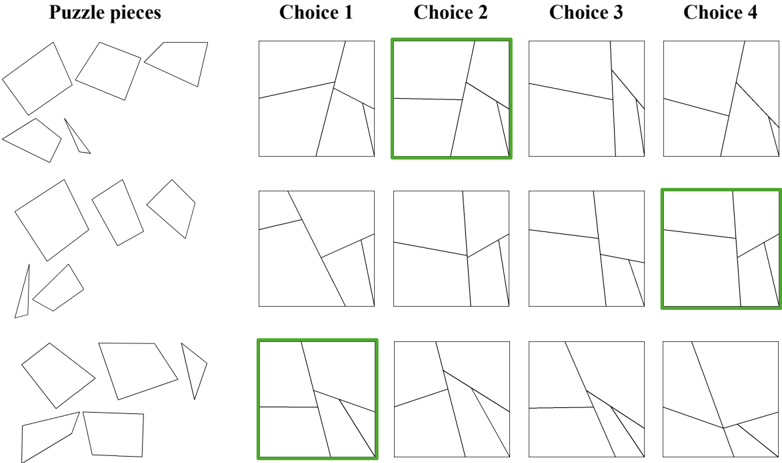
### Visual Description
\n
## Diagram: Puzzle Piece Matching
### Overview
The image presents a puzzle-solving task. It displays three sets of puzzle pieces on the left, and for each set, four possible arrangements of those pieces within a square frame on the right. Some of the correct arrangements are highlighted with a green border. The purpose appears to be to identify the correct arrangement of puzzle pieces.
### Components/Axes
The diagram is organized into two main columns: "Puzzle pieces" and "Choice 1" through "Choice 4". Each row represents a different puzzle set. There are no explicit axes or scales. The diagram relies on visual comparison.
### Detailed Analysis or Content Details
The diagram consists of three rows, each with a set of puzzle pieces on the left and four possible solutions on the right.
* **Row 1:**
* Puzzle Pieces: Four pieces, roughly trapezoidal and triangular shapes.
* Choice 2 is highlighted with a green border.
* **Row 2:**
* Puzzle Pieces: Four pieces, with more irregular shapes.
* Choice 4 is highlighted with a green border.
* **Row 3:**
* Puzzle Pieces: Four pieces, similar to the first set but with slight variations in shape.
* Choice 3 is highlighted with a green border.
The puzzle pieces in each row are distinct, and the arrangements in the "Choice" columns vary. The green borders indicate the correct solutions for each puzzle set.
### Key Observations
The diagram demonstrates a visual matching task. The correct solutions are not immediately obvious and require careful comparison of the puzzle piece shapes and their arrangement within the square frame. The green borders serve as the answer key.
### Interpretation
This diagram likely represents a cognitive assessment or a test of spatial reasoning skills. It assesses the ability to mentally manipulate shapes and determine how they fit together. The task requires visual attention to detail and the ability to recognize patterns. The use of a green border to highlight the correct answers suggests a binary evaluation – either the arrangement is correct or it is not. The varying complexity of the puzzle pieces across the rows could indicate different levels of difficulty. The diagram is a straightforward presentation of a problem-solving task, designed to evaluate a specific cognitive ability.
</details>
Figure 13: Minnesota Paper Form Board (MPFB) with text inputs: Which one of the four choices shows what it would be like when the array pieces are put together? The pieces merge at the edges (1s). They can be rotated in multiples of 90 degrees but not flipped. The array colors are purely for illustration purposes.
<details>
<summary>Image 15 Details</summary>
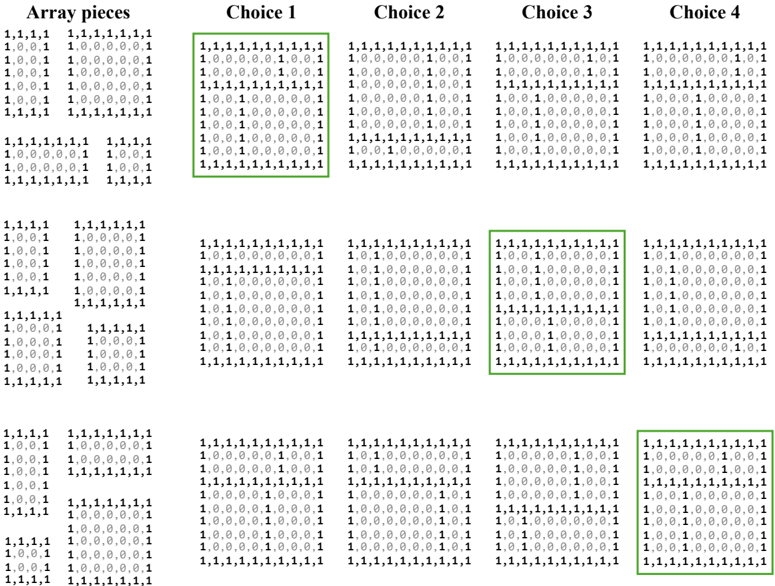
### Visual Description
\n
## Heatmap: Array Pieces vs. Choices
### Overview
The image presents a heatmap comparing "Array pieces" against four "Choices" (Choice 1, Choice 2, Choice 3, and Choice 4). The heatmap uses a color gradient to represent the values within a 5x5 grid for each combination of array piece and choice. The values appear to be numerical, likely representing some form of score or probability. The color scale is not explicitly provided, but it appears to range from dark green (low value) to light green/white (high value).
### Components/Axes
* **X-axis:** Represents the four Choices: Choice 1, Choice 2, Choice 3, Choice 4.
* **Y-axis:** Represents the "Array pieces". There are 5 distinct array pieces, each repeated multiple times.
* **Cells:** Each cell in the grid represents the value for a specific array piece and choice combination.
* **Color Scale:** Implicitly ranges from dark green (low value) to light green/white (high value).
* **Highlighted Cells:** Several cells are highlighted with a green box, indicating specific points of interest.
### Detailed Analysis
The heatmap consists of four 5x5 grids, one for each choice. Each grid contains values represented by color intensity. The values within each cell appear to be either 0, 0.1, 0.6, or 1.
**Choice 1:**
* The majority of cells contain the value 1, represented by a light green/white color.
* There are a few cells with values of 0.6, 0.1, and 0.
* Highlighted cells: (Row 1, Col 1), (Row 3, Col 2), (Row 5, Col 3).
**Choice 2:**
* Similar to Choice 1, most cells contain the value 1.
* There are scattered cells with values of 0.6, 0.1, and 0.
* Highlighted cells: (Row 1, Col 1), (Row 3, Col 2), (Row 5, Col 3).
**Choice 3:**
* Again, the majority of cells contain the value 1.
* There are scattered cells with values of 0.6, 0.1, and 0.
* Highlighted cells: (Row 1, Col 1), (Row 3, Col 2), (Row 5, Col 3).
**Choice 4:**
* The majority of cells contain the value 1.
* There are scattered cells with values of 0.6, 0.1, and 0.
* Highlighted cells: (Row 1, Col 1), (Row 3, Col 2), (Row 5, Col 3).
The values within each grid are arranged as follows (reading row by row):
1,1,1,1,1
1,0,0,1,1
1,0,0,0,1
1,0,0,0,0
1,1,1,1,1
1,1,1,1,1
1,0,0,1,1
1,0,0,0,1
1,0,0,0,0
1,1,1,1,1
1,1,1,1,1
1,0,0,1,1
1,0,0,0,1
1,0,0,0,0
1,1,1,1,1
1,1,1,1,1
1,0,0,1,1
1,0,0,0,1
1,0,0,0,0
1,1,1,1,1
### Key Observations
* The value '1' dominates across all choices, suggesting a strong positive association for most array piece/choice combinations.
* The highlighted cells are consistent across all four choices, indicating that these specific array piece/choice combinations are of particular interest.
* The distribution of lower values (0, 0.1, 0.6) appears somewhat random within each grid.
* The array pieces are identical across all choices.
### Interpretation
The heatmap likely represents the suitability or compatibility of different "Array pieces" with each of the four "Choices". The high prevalence of '1' suggests that most array pieces are generally well-suited to all choices. The highlighted cells, which are consistent across all choices, may represent array piece/choice combinations that are particularly strong or important. The lower values (0, 0.1, 0.6) could indicate areas where the array piece and choice are less compatible or require further consideration.
The consistent pattern across the four choices suggests that the underlying relationship between array pieces and choices is relatively stable. The heatmap could be used to inform decision-making, for example, by prioritizing array pieces that consistently score highly across all choices. The highlighted cells could be used to identify optimal combinations or areas for further investigation.
</details>
Figure 14: Judgement of line orientation (JLO) with visual inputs: Which pair of lines from the legend have a matching angle to the lines in the input image?
<details>
<summary>Image 16 Details</summary>
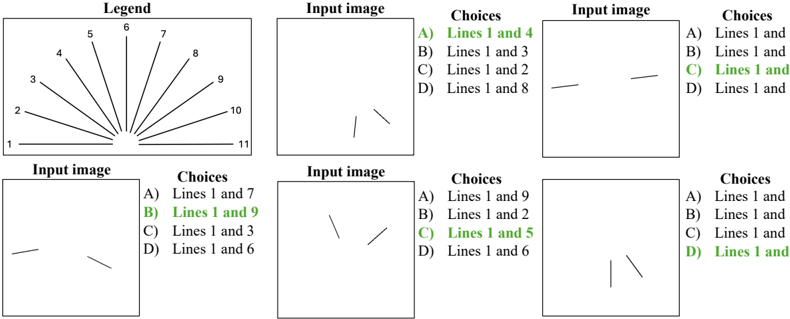
### Visual Description
\n
## Diagram: Line Combination Choices
### Overview
The image presents a series of diagrams designed to test the identification of line combinations. There is a legend identifying 11 lines, followed by several "Input image" sections each with a set of lines and a corresponding "Choices" section offering potential line pairings. The diagrams themselves do not contain numerical data, but rather visual representations of lines and multiple-choice options.
### Components/Axes
* **Legend:** Located in the top-left corner, it displays a circular arrangement of lines numbered 1 through 11. Each line is a different color, and the numbers serve as identifiers.
* **Input Image:** Appears four times, each containing a varying arrangement of lines.
* **Choices:** Appears four times, each presenting four options (A, B, C, D) listing pairs of lines identified by their numbers from the legend.
### Detailed Analysis or Content Details
The image consists of the following elements:
1. **Legend:**
* Line 1: Darkest shade of gray
* Line 2: Light gray
* Line 3: Medium gray
* Line 4: Lightest shade of gray
* Line 5: Darker shade of gray
* Line 6: Medium shade of gray
* Line 7: Light shade of gray
* Line 8: Darkest shade of gray
* Line 9: Light gray
* Line 10: Medium gray
* Line 11: Lightest shade of gray
2. **Input Image 1:** Contains a single line.
* Choices:
* A) Lines 1 and 4
* B) Lines 1 and 3
* C) Lines 1 and 2
* D) Lines 1 and 8
3. **Input Image 2:** Contains a single line.
* Choices:
* A) Lines 1 and 7
* B) Lines 1 and 9
* C) Lines 1 and 3
* D) Lines 1 and 6
4. **Input Image 3:** Contains a single line.
* Choices:
* A) Lines 1 and 9
* B) Lines 1 and 2
* C) Lines 1 and 5
* D) Lines 1 and 6
5. **Input Image 4:** Contains a single line.
* Choices:
* A) Lines 1 and 8
* B) Lines 1 and 2
* C) Lines 1 and 5
* D) Lines 1 and 6
### Key Observations
The diagrams are designed as a visual matching exercise. Each "Input image" presents a line, and the "Choices" section asks the user to identify which other line(s) are present in the image. The legend provides the key to identify each line by its number. The diagrams are very simple, each containing only one line.
### Interpretation
The image is a test or exercise focused on visual pattern recognition and the ability to correlate visual elements (lines) with numerical identifiers (legend numbers). The purpose is likely to assess the user's attention to detail and their ability to accurately identify and match lines based on their visual characteristics. The simplicity of the diagrams suggests a basic level of visual discrimination is being tested. The repeated structure of "Input image" and "Choices" indicates a series of similar questions are being presented. The fact that each input image only contains one line suggests the test is designed to be straightforward, focusing on the ability to correctly identify a single line from a set of options.
</details>
Figure 15: Judgement of line orientation (JLO) with text inputs: Which choice has an angle between lines 1 and 2 that matches the angle from the input array? The array colors are purely for illustration purposes.
<details>
<summary>Image 17 Details</summary>
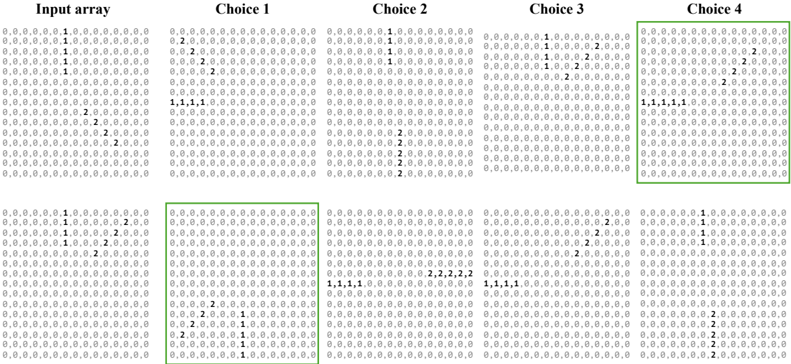
### Visual Description
\n
## Diagram: Input Array and Choices
### Overview
The image presents a visual comparison of an "Input array" and four "Choices" (Choice 1, Choice 2, Choice 3, Choice 4). Each array is represented as a grid of numbers, primarily 0, 1, and 2. Certain cells within the arrays are highlighted with a blue box, indicating specific elements of interest.
### Components/Axes
The diagram consists of five arrays arranged horizontally. Each array is labeled at the top: "Input array", "Choice 1", "Choice 2", "Choice 3", and "Choice 4". The arrays themselves are grids of numbers. There are no explicit axes or scales.
### Detailed Analysis or Content Details
Let's analyze each array, noting the positions of the highlighted cells:
**Input array:**
The array is 10x10. The values are mostly 0, with some 1s and 2s. The highlighted cells (blue boxes) are located at:
- Row 1, Column 5: Value 1
- Row 2, Column 5: Value 1
- Row 3, Column 5: Value 1
- Row 4, Column 5: Value 2
- Row 5, Column 5: Value 2
- Row 6, Column 5: Value 2
- Row 7, Column 5: Value 2
- Row 8, Column 5: Value 2
- Row 9, Column 5: Value 2
- Row 10, Column 5: Value 2
**Choice 1:**
The array is 10x10. The highlighted cells are located at:
- Row 1, Column 5: Value 1
- Row 2, Column 5: Value 1
- Row 3, Column 5: Value 1
- Row 4, Column 5: Value 2
- Row 5, Column 5: Value 2
- Row 6, Column 5: Value 2
- Row 7, Column 5: Value 2
- Row 8, Column 5: Value 2
- Row 9, Column 5: Value 2
- Row 10, Column 5: Value 2
**Choice 2:**
The array is 10x10. The highlighted cells are located at:
- Row 1, Column 5: Value 1
- Row 2, Column 5: Value 1
- Row 3, Column 5: Value 1
- Row 4, Column 5: Value 2
- Row 5, Column 5: Value 2
- Row 6, Column 5: Value 2
- Row 7, Column 5: Value 2
- Row 8, Column 5: Value 2
- Row 9, Column 5: Value 2
- Row 10, Column 5: Value 2
**Choice 3:**
The array is 10x10. The highlighted cells are located at:
- Row 1, Column 5: Value 1
- Row 2, Column 5: Value 1
- Row 3, Column 5: Value 1
- Row 4, Column 5: Value 2
- Row 5, Column 5: Value 2
- Row 6, Column 5: Value 2
- Row 7, Column 5: Value 2
- Row 8, Column 5: Value 2
- Row 9, Column 5: Value 2
- Row 10, Column 5: Value 2
**Choice 4:**
The array is 10x10. The highlighted cells are located at:
- Row 1, Column 5: Value 1
- Row 2, Column 5: Value 1
- Row 3, Column 5: Value 1
- Row 4, Column 5: Value 2
- Row 5, Column 5: Value 2
- Row 6, Column 5: Value 2
- Row 7, Column 5: Value 2
- Row 8, Column 5: Value 2
- Row 9, Column 5: Value 2
- Row 10, Column 5: Value 2
### Key Observations
All four choices (Choice 1, Choice 2, Choice 3, and Choice 4) are identical to the "Input array" in terms of the values and positions of the highlighted cells. The arrays are visually indistinguishable.
### Interpretation
The diagram appears to be illustrating a scenario where an input array is being compared to several possible "choices". In this case, all the choices are identical to the input. This suggests that the task might be to identify the correct choice, and in this instance, any of the four choices would be valid. The highlighting of specific cells likely indicates that these are the key elements to consider when evaluating the choices. The diagram doesn't provide information about *why* these choices are being presented, or what the overall goal of the comparison is. It simply shows that all choices perfectly match the input.
</details>
Figure 16: Selective attention (SAtt) with visual inputs: What are the (row, column) grid locations of the reference object? The top-left element of the grid is (0, 0).
<details>
<summary>Image 18 Details</summary>
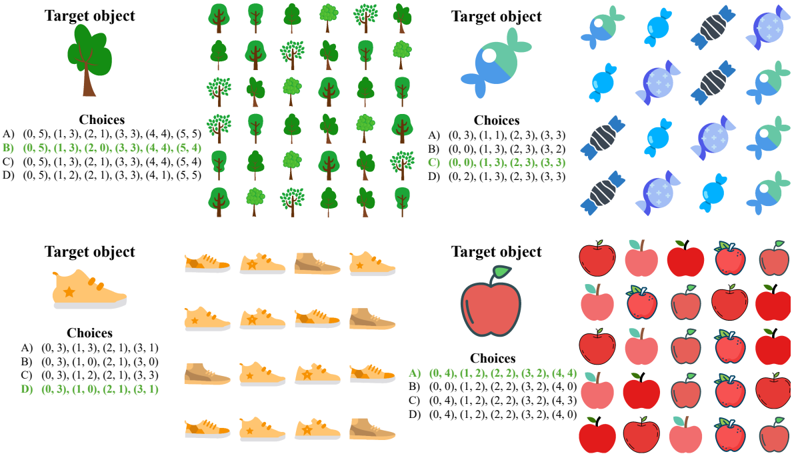
### Visual Description
\n
## Diagram: Visual Preference Task Choices
### Overview
The image presents four separate visual preference tasks. Each task displays a "Target object" alongside four "Choices" represented by sets of objects with associated numerical tuples. The tasks involve different object categories: trees, fish, shoes, and apples. The numerical tuples likely represent some feature vector or attribute associated with each choice.
### Components/Axes
Each task is structured as follows:
* **Target object:** A single, larger image of the object being compared.
* **Choices:** Four sets of smaller images, each with a corresponding numerical tuple.
* **Labels:** Each choice is labeled A, B, C, and D.
* **Numerical Tuples:** Each choice has a tuple of five numbers in parentheses, e.g., (0, 5), (1, 3), etc.
### Detailed Analysis or Content Details
**Task 1: Trees**
* Target object: A green tree with red apples.
* Choice A: Five green trees with tuple (0, 5), (1, 3), (2, 1), (3, 3), (4, 5).
* Choice B: Four green trees with tuple (0, 5), (1, 3), (2, 0), (3, 3), (4, 4).
* Choice C: Five green trees with tuple (0, 5), (1, 3), (2, 1), (3, 3), (4, 5).
* Choice D: Five green trees with tuple (0, 5), (1, 2), (2, 1), (3, 3), (4, 1), (5, 5).
**Task 2: Fish**
* Target object: A blue fish.
* Choice A: Three blue fish with tuple (0, 3), (1, 1), (2, 3), (3, 3).
* Choice B: Three blue fish with tuple (0, 0), (1, 3), (2, 3), (3, 2).
* Choice C: Three blue fish with tuple (0, 0), (1, 3), (2, 3), (3, 3).
* Choice D: Three blue fish with tuple (0, 2), (1, 3), (2, 3), (3, 3).
**Task 3: Shoes**
* Target object: A yellow sneaker.
* Choice A: Three yellow sneakers with tuple (0, 0), (1, 3), (2, 1), (3, 1).
* Choice B: Two yellow sneakers and one brown shoe with tuple (0, 0), (1, 0), (2, 1), (3, 0).
* Choice C: Three yellow sneakers with tuple (0, 3), (1, 2), (2, 1), (3, 1).
* Choice D: Three yellow sneakers with tuple (0, 3), (1, 0), (2, 1), (3, 1).
**Task 4: Apples**
* Target object: A red apple.
* Choice A: Four red apples with tuple (0, 4), (1, 2), (2, 2), (3, 2), (4, 4).
* Choice B: Two red apples and two purple apples with tuple (0, 0), (1, 2), (2, 2), (3, 2), (4, 0).
* Choice C: Four red apples with tuple (0, 4), (1, 2), (2, 2), (3, 2), (4, 4).
* Choice D: Four red apples with tuple (0, 4), (1, 2), (2, 3), (3, 2), (4, 0).
### Key Observations
* The numerical tuples appear to be consistent within each choice set, but vary across choices.
* The tuples likely represent features of the objects, such as color, size, shape, or texture.
* The tasks are designed to assess visual preferences based on these features.
* Some choices include objects that differ from the target object (e.g., brown shoe in the sneaker task, purple apples in the apple task).
### Interpretation
This diagram illustrates a visual preference task, likely used in a study of perception, cognition, or machine learning. The goal is to understand how individuals (or algorithms) choose between different visual stimuli based on their features. The numerical tuples represent a quantifiable description of these features. The tasks are designed to test how sensitive subjects are to variations in these features. The inclusion of slightly different objects within the choices (e.g., the brown shoe) suggests that the study is also investigating how subjects handle variations in object category. The data collected from these tasks could be used to train a model to predict human visual preferences or to understand the underlying neural mechanisms of visual perception. The tuples could represent a feature vector, and the task is to determine which feature vector is most similar to the target object.
</details>
Figure 17: Selective attention (SAtt) with text inputs: What are the (row, column) grid locations of the target character? The top-left element of the grid is (0, 0).
<details>
<summary>Image 19 Details</summary>
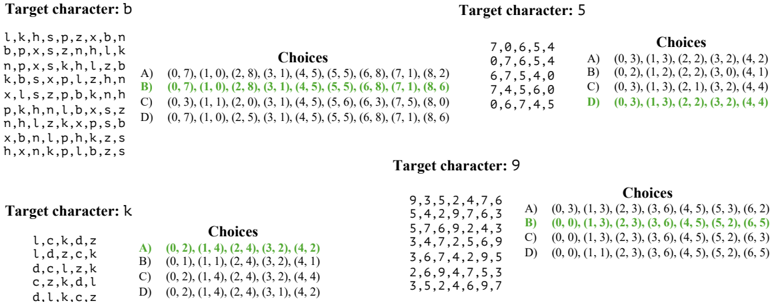
### Visual Description
\n
## Multiple Choice Questions: Character Identification
### Overview
The image presents four sets of multiple-choice questions. Each set focuses on identifying a "Target character" from a list of characters, given a set of "Choices" with associated numerical values. The questions appear to be related to a coding or pattern-recognition task.
### Components/Axes
Each question set is structured as follows:
* **Target character:** A single letter (b, 5, 9, k) is identified as the target.
* **Character List:** A list of lowercase letters (for 'b' and 'k') or digits (for '5' and '9') is presented.
* **Choices:** Four options (A, B, C, D) are provided, each associated with a sequence of numerical values enclosed in parentheses.
### Detailed Analysis or Content Details
**Question 1: Target character b**
* Character List: l, k, h, s, p, z, x, b, n, b, p, x, s, z, n, h, l, k, x, l, s, z, p, b, k, n, h, p, k, n, l, b, x, s, z, n, h, l, z, k, x, p, s, b, x, b, n, l, p, h, k, z, s, h, x, n, k, p, l, b, z, s
* Choices:
* A) (0.7, (1.0, (2.8, (3.1, (4.5, (5.5, (6.8, (7.1, (8.2)
* B) (0.7, (1.0, (2.8, (3.1, (4.5, (5.5, (6.8, (7.1, (8.6)
* C) (0.3, (1.1, (2.0, (3.1, (4.5, (5.6, (6.3, (7.5, (8.0)
* D) (0.7, (1.0, (2.5, (3.1, (4.5, (5.3, (6.8, (7.1, (8.6)
**Question 2: Target character 5**
* Character List: 7, 0, 6, 5, 4, 0, 7, 6, 5, 4, 6, 7, 5, 4, 0, 7, 4, 5, 6, 0, 6, 7, 4, 5
* Choices:
* A) (0.3, (1.3, (2.2, (3.2, (4.2)
* B) (0.2, (1.2, (2.2, (3.0, (4.1)
* C) (0.3, (1.3, (2.1, (3.2, (4.4)
* D) (0.3, (1.3, (2.2, (3.2, (4.4)
**Question 3: Target character 9**
* Character List: 9, 3, 5, 2, 4, 7, 6, 5, 4, 2, 9, 7, 6, 3, 4, 7, 2, 5, 6, 9, 3, 6, 7, 4, 2, 9, 5, 2, 6, 9, 4, 7, 5, 3, 3, 5, 2, 4, 6, 9, 7
* Choices:
* A) (0.3, (1.3, (2.3, (3.0, (4.5, (5.3, (6.2)
* B) (0.0, (1.0, (2.0, (3.0, (4.5, (5.3, (6.2)
* C) (0.0, (1.3, (2.3, (3.0, (4.5, (5.2, (6.3)
* D) (0.0, (1.1, (2.3, (3.0, (4.5, (5.2, (6.5)
**Question 4: Target character k**
* Character List: l, v, d, z, k, j, c, k, d, c, l, z, k, d, l, k, d, n, h, c, k, j, c, k, l, d, z, k, j, c, k
* Choices:
* A) (0.2, (1.1, (2.4, (3.2, (4.2, (4.4)
* B) (0.2, (1.1, (2.4, (3.0, (4.3, (4.4)
* C) (0.2, (1.1, (2.4, (3.2, (4.4, (4.4)
* D) (0.2, (1.2, (2.4, (3.2, (4.4, (4.6)
### Key Observations
The numerical values associated with each choice appear to be increasing. The first number in each set of parentheses is relatively small (between 0.0 and 0.7). The subsequent numbers increase, potentially representing a sequence or a function. The questions seem to be testing the ability to identify patterns within the given data.
### Interpretation
The image presents a series of pattern-recognition problems. The task is likely to identify the correct choice based on a hidden rule or relationship between the target character, the character list, and the numerical values. The numerical sequences might represent probabilities, frequencies, or some other metric related to the target character's presence or characteristics within the character list. Without further context, it's difficult to determine the exact nature of the underlying pattern. The questions could be part of a larger test assessing logical reasoning, data analysis, or coding skills. The format suggests a quantitative approach to character identification, rather than a simple visual or semantic match.
</details>
Figure 18: Corsi block tapping (CBTT) with visual inputs: Each row shows a set of blue boxes. The boxes are tapped in a sequence (highlighted in yellow). What is the sequence of taps? Use the box ids in the reference.
<details>
<summary>Image 20 Details</summary>
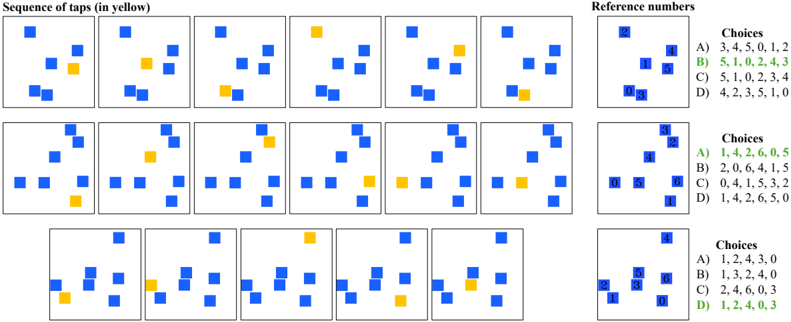
### Visual Description
## Diagram: Sequence of Taps & Reference Numbers
### Overview
The image presents a series of diagrams depicting sequences of taps, represented by blue squares, with a single yellow square highlighting the current tap in each sequence. Alongside these diagrams are "Reference Numbers" and "Choices" presented in a table format. The diagrams are arranged in a 3x4 grid.
### Components/Axes
The image consists of:
* **Tap Sequences:** 12 diagrams, each showing a sequence of blue squares with one yellow square.
* **Reference Numbers:** A table on the right side of the image, with numbers 1 through 6 labeled with colors (green, blue, red, purple, orange, and dark blue).
* **Choices:** A table next to the Reference Numbers, presenting four options (A, B, C, D) each containing a sequence of numbers.
* **Title:** "Sequence of taps (in yellow)" at the top-left.
* **Title:** "Reference numbers" at the top-right.
### Detailed Analysis or Content Details
**Tap Sequences (Row 1):**
* Diagram 1: 7 blue squares, 1 yellow square.
* Diagram 2: 6 blue squares, 1 yellow square.
* Diagram 3: 6 blue squares, 1 yellow square.
* Diagram 4: 6 blue squares, 1 yellow square.
**Tap Sequences (Row 2):**
* Diagram 5: 7 blue squares, 1 yellow square.
* Diagram 6: 7 blue squares, 1 yellow square.
* Diagram 7: 7 blue squares, 1 yellow square.
* Diagram 8: 7 blue squares, 1 yellow square.
**Tap Sequences (Row 3):**
* Diagram 9: 6 blue squares, 1 yellow square.
* Diagram 10: 6 blue squares, 1 yellow square.
* Diagram 11: 6 blue squares, 1 yellow square.
* Diagram 12: 6 blue squares, 1 yellow square.
**Reference Numbers Table:**
| Number | Color |
|--------|----------|
| 1 | Green |
| 2 | Blue |
| 3 | Red |
| 4 | Purple |
| 5 | Orange |
| 6 | Dark Blue|
**Choices Table (First Column):**
* **Choice A:** 3, 4, 5, 5, 0, 1, 2
* **Choice B:** 5, 1, 0, 2, 4, 3
* **Choice C:** 5, 1, 0, 2, 3, 4
* **Choice D:** 4, 2, 3, 5, 1, 0
**Choices Table (Second Column):**
* **Choice A:** 1, 4, 2, 6, 0, 5
* **Choice B:** 2, 0, 6, 4, 1, 5
* **Choice C:** 0, 4, 1, 5, 5, 2
* **Choice D:** 1, 4, 2, 6, 5, 0
**Choices Table (Third Column):**
* **Choice A:** 1, 2, 4, 3, 0
* **Choice B:** 1, 3, 2, 4, 0
* **Choice C:** 2, 4, 6, 0, 3
* **Choice D:** 1, 2, 4, 0, 3
### Key Observations
The tap sequences appear to be random arrangements of blue squares, with the yellow square indicating the current step. The Reference Numbers table assigns a color to each number from 1 to 6. The Choices tables provide multiple numerical sequences (A, B, C, D) for each set of Reference Numbers. The sequences in the Choices tables are all different.
### Interpretation
This diagram likely represents a cognitive or behavioral experiment. The tap sequences could be a task performed by participants, and the Reference Numbers and Choices represent a memory or recall test. Participants might be asked to remember the order of taps (indicated by the yellow square) and then select the corresponding sequence from the Choices provided. The different sets of Reference Numbers and Choices suggest multiple trials or conditions within the experiment. The purpose could be to investigate short-term memory, pattern recognition, or the impact of sequence length on recall accuracy. The color coding of the Reference Numbers might be used to associate specific colors with particular sequences, potentially influencing recall performance. The varying lengths of the sequences in the Choices tables could be a factor in the difficulty of the task. Without further context, it's difficult to determine the precise experimental design or hypothesis being tested.
</details>
Figure 19: Corsi block tapping (CBTT) with text inputs: Each row shows a set of boxes ( B ) laid out in space. This is shown as a 2D array where 0 is empty space. The boxes are tapped in a sequence (highlighted as T ). What is the sequence of taps? Use the box ids in the reference. The array colors are purely for illustration purposes.
<details>
<summary>Image 21 Details</summary>
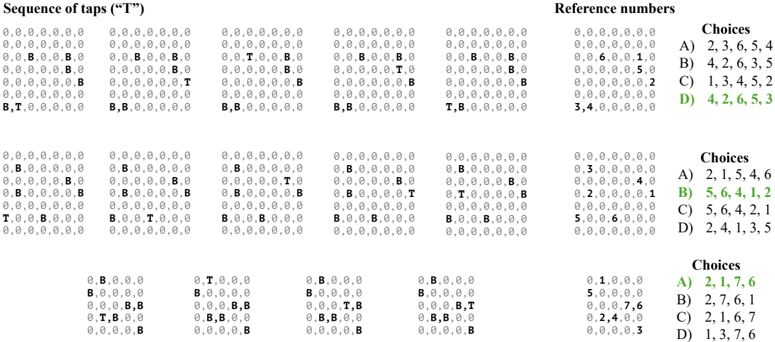
### Visual Description
\n
## Diagram: Sequence of Taps & Reference Numbers
### Overview
The image presents a series of diagrams depicting sequences of taps, represented by the letters "T" and "B", alongside corresponding reference numbers and multiple-choice options. The diagrams are arranged in a grid-like structure, with three distinct rows of sequences. Each sequence is followed by a set of reference numbers and four choices labeled A, B, C, and D.
### Components/Axes
The diagram consists of the following components:
* **Tap Sequences:** Represented by arrangements of "T" and "B" characters.
* **Reference Numbers:** Numerical sequences associated with each tap sequence.
* **Choices:** Multiple-choice options (A, B, C, D) with numerical lists.
There are no explicit axes in the traditional sense, but the arrangement of elements creates a visual structure.
### Detailed Analysis or Content Details
**Row 1:**
* **Sequence 1:** 0,0,0,0,0,0,0,0; 0,B,B,0,0,0,B,0; 0,0,0,0,0,0,0,0; 0,0,0,0,0,0,0,0; 0,0,0,0,0,0,0,0; 0,0,0,0,0,0,0,0
* **Reference Numbers 1:** 0,0,0,0,0,0,0,0; 0,0,0,0,0,0,0,0; 0,0,0,0,0,0,0,0; 0,0,0,0,0,0,0,0; 0,0,0,0,0,0,0,0; 0,0,0,0,0,0,0,0
* **Choices 1:** A) 2, 3, 6, 5, 4; B) 4, 2, 6, 3, 5; C) 1, 3, 4, 5, 2; D) 4, 2, 6, 5, 3
* **Sequence 2:** 0,0,0,0,0,0,0,0; 0,B,B,0,0,0,B,0; 0,0,0,0,0,0,0,0; 0,0,0,0,0,0,0,T; 0,0,0,0,0,0,0,0; B,T,0,0,0,0,0,0
* **Reference Numbers 2:** 0,0,0,0,0,0,0,0; 0,0,0,0,0,0,0,0; 0,0,0,0,0,0,0,0; 0,0,0,0,0,0,0,0; 0,0,0,0,0,0,0,0; 3,4,0,0,0,0,0,0
* **Choices 2:** A) 4, 2, 6, 3, 5; B) 5, 6, 4, 1, 2; C) 5, 6, 4, 2, 1; D) 2, 4, 1, 3, 5
**Row 2:**
* **Sequence 3:** 0,0,0,0,0,0,0,0; 0,B,B,0,0,0,B,0; 0,0,0,0,0,0,0,0; 0,0,0,0,0,0,0,T; 0,0,0,0,0,0,0,0; T,0,0,B,B,0,0,0
* **Reference Numbers 3:** 0,0,0,0,0,0,0,0; 0,3,0,0,0,0,0,0; 0,2,0,0,0,0,0,0; 0,2,0,0,0,0,0,0; 0,0,0,0,0,0,0,0; 5,0,0,0,0,0,0,0
* **Choices 3:** A) 2, 1, 5, 4, 6; B) 2, 7, 6, 1; C) 2, 1, 6, 7; D) 1, 3, 7, 6
* **Sequence 4:** 0,0,0,0,0,0,0,0; 0,B,B,0,0,0,B,0; 0,0,0,0,0,0,0,0; 0,0,0,0,0,0,0,T; 0,0,0,0,0,0,0,0; B,0,0,T,T,0,0,0
* **Reference Numbers 4:** 0,0,0,0,0,0,0,0; 0,3,0,0,0,0,0,0; 0,2,0,0,0,0,0,0; 0,2,0,0,0,0,0,0; 0,0,0,0,0,0,0,0; 1,0,0,0,0,0,0,0
* **Choices 4:** A) 2, 1, 7, 6; B) 1, 3, 7, 6; C) 1, 3, 4, 5; D) 1, 3, 7, 6
**Row 3:**
* **Sequence 5:** 0,B,0,0,0,0,0,0; 0,T,0,0,0,0,0,0; B,B,0,0,0,0,0,0; 0,0,B,B,0,0,0,0; 0,0,0,0,0,0,0,0; 4,0,0,0,0,0,0,0
* **Reference Numbers 5:** 0,1,0,0,0,0,0,0; 0,3,0,0,0,0,0,0; 0,2,4,0,0,0,0,0; 0,2,4,0,0,0,0,0; 0,0,0,0,0,0,0,0; 0,0,0,0,0,0,0,0
* **Choices 5:** A) 2, 1, 7, 6; B) 1, 3, 7, 6; C) 1, 3, 4, 5; D) 1, 3, 7, 6
### Key Observations
The diagram presents a pattern-matching exercise. Each sequence of "T" and "B" taps is associated with a set of reference numbers and a multiple-choice question. The choices likely represent different interpretations or classifications of the tap sequences. The reference numbers may be related to the positions or characteristics of the "T" and "B" taps within each sequence.
### Interpretation
This diagram appears to be part of a cognitive assessment or a test of pattern recognition. The task likely involves identifying the correct multiple-choice option based on the given tap sequence and reference numbers. The "T" and "B" taps could represent different actions or stimuli, and the sequences may encode specific information or rules. The choices could represent different categories, classifications, or responses to the tap sequences. Without further context, it is difficult to determine the exact meaning of the diagram, but it clearly demonstrates a structured approach to evaluating cognitive abilities or pattern recognition skills. The consistent format across rows suggests a standardized test or assessment.
</details>
Figure 20: Spatial addition (SAdd) with visual inputs: What is the sum of the two arrays? Ignore red circles. Blue circles represent 1, white circles represent 2 and empty spaces represent 0.
<details>
<summary>Image 22 Details</summary>
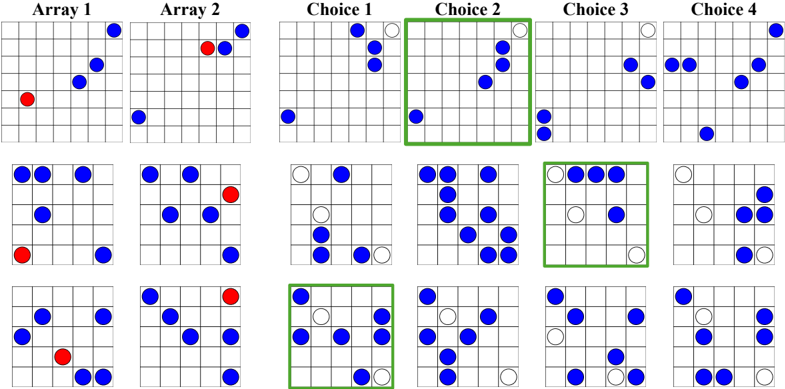
### Visual Description
\n
## Grid Arrangement: Array and Choice Configurations
### Overview
The image presents a 3x2 grid of arrays, each containing a set of blue and red dots on a square grid. To the right of the arrays are four "Choice" grids, also containing blue and white dots. The arrays appear to be source data, and the choices represent potential transformations or selections from those arrays.
### Components/Axes
The image is organized into two main sections: "Array" and "Choice".
- **Arrays:** Labeled "Array 1" and "Array 2", repeated three times vertically. Each array is a 7x7 grid.
- **Choices:** Labeled "Choice 1", "Choice 2", "Choice 3", and "Choice 4", repeated three times vertically. Each choice is a 7x7 grid.
- **Dots:** Blue and red dots are present in the Array grids. Blue and white dots are present in the Choice grids.
- **Grid:** All grids are composed of a 7x7 arrangement of cells.
### Detailed Analysis or Content Details
Let's analyze the dot configurations in each array and choice. I will describe the approximate position of each dot, referencing rows and columns starting from 1 at the top-left.
**Array Configurations (repeated 3 times):**
* **Array 1:**
* Red dot: (2, 2)
* Blue dots: (1, 4), (3, 6), (4, 1), (5, 5), (6, 3)
* **Array 2:**
* Red dot: (2, 6)
* Blue dots: (1, 3), (3, 2), (4, 7), (5, 4), (6, 1)
**Choice Configurations (repeated 3 times):**
* **Choice 1:**
* Blue dots: (2, 2), (3, 3), (4, 4), (5, 5), (6, 6)
* White dots: All other cells.
* **Choice 2:**
* Blue dots: (3, 1), (4, 2), (5, 3), (6, 4)
* White dots: All other cells.
* **Choice 3:**
* Blue dots: (1, 5), (2, 4), (3, 3), (4, 2), (5, 1)
* White dots: All other cells.
* **Choice 4:**
* Blue dots: (1, 1), (3, 4), (5, 6), (7, 7)
* White dots: All other cells.
The green rectangles highlight Choice 2 and Choice 3 in each row.
### Key Observations
* Each array has one red dot and five blue dots.
* Each choice grid contains a varying number of blue dots, with the rest of the cells being white.
* The choices appear to be selections or transformations of the dots from the arrays.
* The green rectangles consistently highlight Choice 2 and Choice 3, suggesting these are of particular interest.
* The dot positions within the arrays and choices do not appear to follow a simple, predictable pattern.
### Interpretation
The image likely represents a visual experiment or a problem-solving task. The arrays could be initial states, and the choices represent possible actions or outcomes. The highlighting of Choice 2 and Choice 3 suggests that these choices are being evaluated or compared.
The arrangement of dots within the arrays and choices could be encoding information, such as coordinates or features. The task might involve identifying patterns, predicting outcomes, or selecting the best choice based on certain criteria. Without further context, it's difficult to determine the exact purpose of this arrangement. The image could be related to a cognitive psychology experiment, a data visualization technique, or a game-like puzzle. The consistent highlighting of specific choices suggests a focus on those particular options within the broader set of possibilities.
</details>
Figure 21: Spatial addition (SAdd) with text inputs: What is the sum of the two arrays? Ignore R . E is 0, B is 1 and W is 2. The array colors are purely for illustration purposes.
<details>
<summary>Image 23 Details</summary>
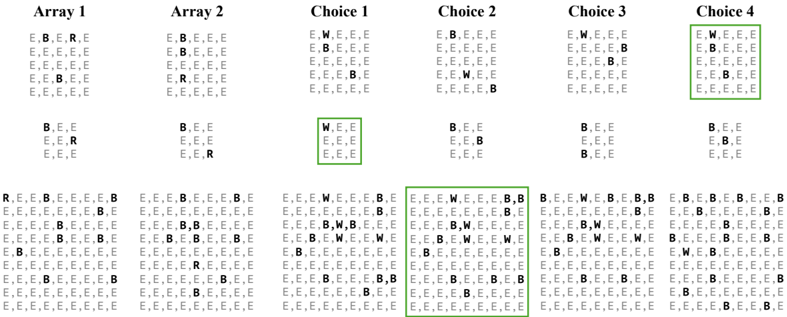
### Visual Description
\n
## Array Visualization: Choice Preference
### Overview
The image presents a visualization of choices made across multiple arrays. Each array represents a set of options, and the choices are indicated by letters: 'E', 'B', 'R', and 'W'. The visualization appears to be a grid-based representation of these choices, with each cell representing a selection. The arrays are labeled "Array 1", "Array 2", "Choice 1", "Choice 2", "Choice 3", and "Choice 4". Certain cells are highlighted with green boxes.
### Components/Axes
The image consists of six arrays arranged horizontally. Each array is a grid of letters. There are no explicit axes or scales. The letters represent the choices made. The green boxes highlight specific cells within the arrays.
### Detailed Analysis or Content Details
Let's analyze each array and the highlighted cells:
**Array 1:**
The array is filled predominantly with 'E's, with scattered 'B's and 'R's. There is one highlighted cell in the top-left corner containing 'E', 'B', 'R', 'E'.
**Array 2:**
Similar to Array 1, this array is mostly 'E's with some 'B's and 'R's. There is one highlighted cell in the bottom-left corner containing 'E', 'E', 'R'.
**Choice 1:**
This array is predominantly 'E's, with some 'W's. There is one highlighted cell in the center containing 'W', 'E', 'E'.
**Choice 2:**
This array is mostly 'E's and 'B's. There is one highlighted cell in the bottom-center containing 'E', 'E', 'W', 'E', 'E', 'B'.
**Choice 3:**
This array is a mix of 'E's, 'W's, and 'B's. There is one highlighted cell in the bottom-right corner containing 'W', 'E', 'E', 'B'.
**Choice 4:**
This array is a mix of 'E's, 'W's, and 'B's. There is one highlighted cell in the top-right corner containing 'W', 'E', 'E', 'B'.
**Letter Counts (Approximate):**
* 'E': Dominant in all arrays.
* 'B': Present in all arrays, but less frequent than 'E'.
* 'R': Relatively rare, mostly in Array 1 and Array 2.
* 'W': More prominent in Choice 1, Choice 3, and Choice 4.
### Key Observations
* The arrays are not uniform in their letter distribution.
* The highlighted cells do not appear to follow a clear pattern across the arrays.
* 'E' is the most frequent choice in all arrays.
* 'R' is the least frequent choice.
* 'W' appears to be more prevalent in the "Choice" arrays than in the "Array" arrays.
### Interpretation
The data suggests a preference for 'E' as the most common choice across all arrays. The presence of 'B', 'R', and 'W' indicates some degree of variability in the choices. The highlighted cells might represent specific instances of interest or selections made under certain conditions. The shift in letter distribution from "Array" to "Choice" arrays could indicate a change in the decision-making process or the introduction of new options. The visualization doesn't provide enough context to determine the meaning of the arrays or the choices, but it does reveal a clear preference for 'E' and a varying distribution of other options. The green highlighting suggests a focus on specific instances of these choices, potentially for further analysis or comparison. Without additional information, it's difficult to determine the underlying process generating these choices. It could represent user selections, experimental results, or a simulation of a decision-making process.
</details>
Figure 22: Maze completion (MCT) with visual inputs: We illustrate examples of mazes used for the MCT task. We programmatically generate mazes of different sizes using Mazelib (Stilley, 2014). Blue cells are obstacles. Black cells are navigable space. The yellow square represents the current location. The red circle represents the goal location.
<details>
<summary>Image 24 Details</summary>
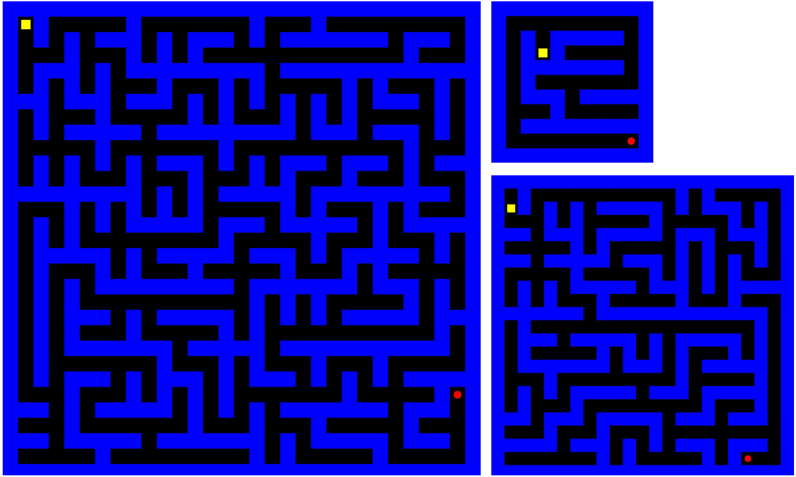
### Visual Description
\n
## Diagram: Mazes
### Overview
The image depicts three mazes. The mazes are constructed with black lines on a blue background. Each maze has a distinct starting point marked with a yellow square and an ending point marked with a red square. The mazes vary in size and complexity.
### Components/Axes
There are no axes or legends present in this image. The components are solely the mazes themselves, defined by their black pathways on a blue background, and the start/end markers.
### Detailed Analysis or Content Details
* **Maze 1 (Top-Left):** This is the largest and most complex maze. The starting point (yellow square) is located in the top-left corner, and the ending point (red square) is located in the bottom-right corner. The maze consists of a dense network of interconnected pathways.
* **Maze 2 (Top-Right):** This maze is smaller and less complex than Maze 1. The starting point (yellow square) is in the top-left corner, and the ending point (red square) is in the bottom-right corner. The pathways are more straightforward.
* **Maze 3 (Bottom-Center):** This maze is of intermediate size and complexity. The starting point (yellow square) is in the top-left corner, and the ending point (red square) is in the bottom-right corner. The pathways are more intricate than Maze 2 but less so than Maze 1.
### Key Observations
All three mazes share a common color scheme (black pathways on a blue background) and a consistent start/end point convention (yellow start, red end). The complexity of the mazes increases from Maze 2 to Maze 3 to Maze 1. There is no numerical data or quantifiable information present.
### Interpretation
The image presents a visual challenge – solving mazes. The varying complexity suggests a potential progression in difficulty. The image doesn't offer any specific data or insights beyond the visual representation of the mazes themselves. It's a purely graphical representation of a problem-solving activity. The mazes could be used for testing spatial reasoning, problem-solving skills, or as a recreational activity. The lack of any additional context or information limits the depth of interpretation. The image is a demonstration of maze design, and the differences in complexity could be used to illustrate different levels of challenge.
</details>
Figure 23: Maze completion (MCT) with text inputs: We illustrate examples of mazes used for the MCT task. We programmatically generate mazes of different sizes using Mazelib (Stilley, 2014). 0 s are obstacles. 1 s are navigable space. A represents the current location. G represents the goal location. The array colors are purely for illustration purposes.
<details>
<summary>Image 25 Details</summary>
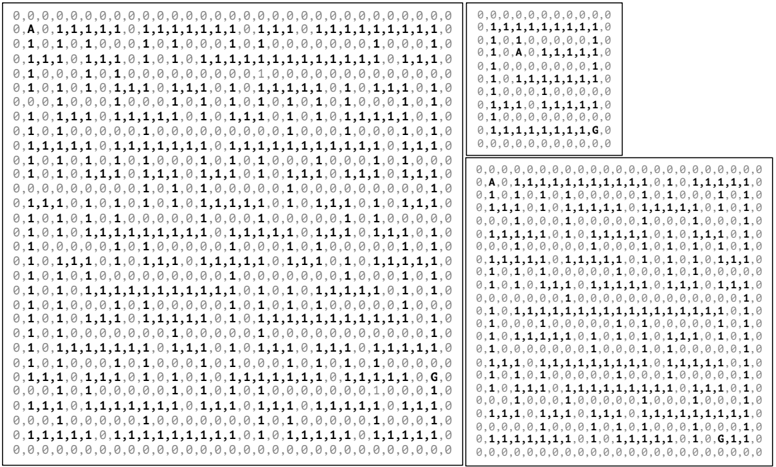
### Visual Description
\n
## Binary Matrix Visualization: Cellular Automata Pattern
### Overview
The image displays three distinct rectangular matrices composed of binary values (0 and 1), resembling a visualization of a cellular automaton or a similar discrete system. The matrices are arranged horizontally, with the leftmost matrix being the largest and the rightmost being the smallest. The values are represented by filled circles (1) and empty spaces (0). A green rectangle highlights the central matrix.
### Components/Axes
There are no explicit axes or labels in the traditional sense. The matrices themselves represent the data. The values within each matrix are arranged in a grid-like structure. The matrices are visually separated, suggesting they represent different states or iterations of a system.
### Detailed Analysis or Content Details
**Matrix 1 (Leftmost, Largest):**
This matrix is approximately 25 rows by 30 columns. The pattern appears largely random, with a higher density of '1' values in the upper-left quadrant and a sparser distribution towards the bottom-right. There are a few isolated clusters of '1's.
* Approximate number of '1's: ~350
* Approximate number of '0's: ~350
**Matrix 2 (Center, Highlighted in Green):**
This matrix is approximately 20 rows by 25 columns. The pattern is more structured than the first matrix. There's a clear diagonal band of '1's running from the top-left to the bottom-right. The density of '1's is higher along this diagonal.
* Approximate number of '1's: ~250
* Approximate number of '0's: ~250
**Matrix 3 (Rightmost, Smallest):**
This matrix is approximately 15 rows by 20 columns. The pattern is even more concentrated, with a prominent central cluster of '1's. The surrounding areas are mostly '0's.
* Approximate number of '1's: ~150
* Approximate number of '0's: ~150
**Value Distribution:**
Across all matrices, the values are binary: '0' and '1'. The distribution of these values varies between the matrices, with the leftmost matrix having a more uniform distribution, the center matrix having a diagonal concentration, and the rightmost matrix having a central concentration.
### Key Observations
* The matrices appear to represent successive states of a dynamic system.
* The green highlight on the central matrix suggests it is of particular interest.
* The pattern evolves from a more random distribution (leftmost) to a more concentrated one (rightmost).
* The number of '1's decreases as we move from left to right.
### Interpretation
The image likely depicts the evolution of a cellular automaton or a similar discrete dynamical system. The matrices represent snapshots of the system at different time steps. The green highlight suggests that the central state is being analyzed or is a key intermediate step in the evolution.
The transition from a random distribution to a concentrated pattern suggests that the system is converging towards a stable state or a specific configuration. The decreasing number of '1's could indicate a loss of energy or information within the system.
Without knowing the specific rules governing the system, it's difficult to provide a more detailed interpretation. However, the image clearly demonstrates a dynamic process with a clear trend towards a more ordered state. The matrices could represent, for example, the spread of a signal, the growth of a pattern, or the evolution of a population. The visual representation is a common method for studying complex systems and emergent behavior.
</details>
Figure 24: Cambridge spatial working memory (CSWM) with visual inputs: Weillustrate two game plays of the CSWM task in the two rows. In each row, we show the initial observation followed by actions taken and the resulting observations. Note how the box identities change after each step. This is intended to force models to remember boxes by their spatial locations instead of their integer identities. As treasures get collected, they are populated in the 'Treasures collected' section of the game screen. When a treasure is collected, a new treasure is placed in one of the boxes where the treasure never appeared before.
<details>
<summary>Image 26 Details</summary>
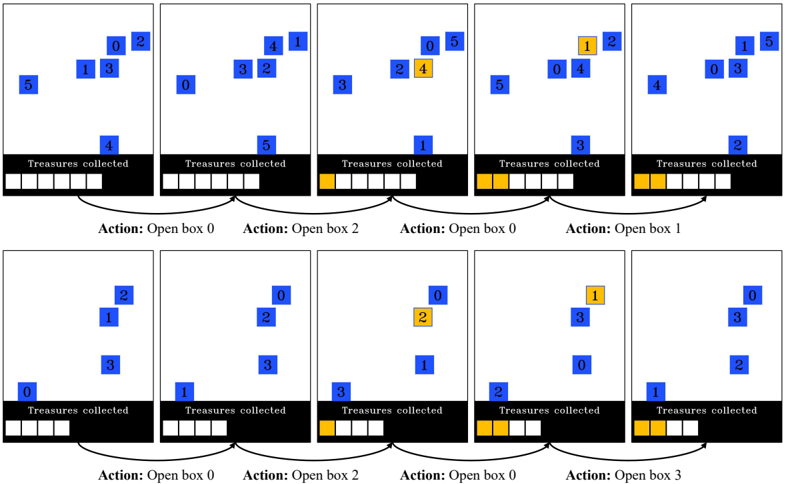
### Visual Description
\n
## Diagram: Treasure Collection Simulation
### Overview
The image presents a series of diagrams illustrating a treasure collection simulation. Each diagram depicts a 2D space with numbered "boxes" (represented by blue squares) containing treasures. Below each diagram is a bar chart representing the "Treasures collected" and an action taken ("Action: Open box X"). The diagrams show the state of treasure distribution after a specific box is opened.
### Components/Axes
The diagrams consist of:
* **Boxes:** Blue squares numbered 0-5, representing containers with treasures.
* **Treasures:** Numbers within the boxes, indicating the number of treasures contained.
* **Action Label:** Text below each diagram indicating which box was opened (e.g., "Action: Open box 0").
* **Treasures Collected Bar Chart:** A bar chart with black and yellow segments, representing the total treasures collected. The length of the bar corresponds to the total number of treasures collected.
### Detailed Analysis or Content Details
The image contains six diagrams arranged in two rows of three. Each diagram represents a step in the simulation.
**Row 1:**
1. **Diagram 1:**
* Box 0: 2 treasures
* Box 1: 3 treasures
* Box 2: 0 treasures
* Box 3: 5 treasures
* Treasures Collected: 4 (black segment)
2. **Diagram 2:**
* Box 0: 3 treasures
* Box 1: 2 treasures
* Box 2: 4 treasures
* Box 3: 1 treasures
* Treasures Collected: 5 (black segment)
3. **Diagram 3:**
* Box 0: 2 treasures
* Box 1: 5 treasures
* Box 2: 4 treasures
* Box 3: 1 treasures
* Treasures Collected: 1 (black segment)
**Row 2:**
4. **Diagram 4:**
* Box 0: 1 treasures
* Box 1: 2 treasures
* Box 2: 0 treasures
* Box 3: 3 treasures
* Treasures Collected: 3 (black segment)
5. **Diagram 5:**
* Box 0: 1 treasures
* Box 1: 5 treasures
* Box 2: 0 treasures
* Box 3: 2 treasures
* Treasures Collected: 2 (black segment)
6. **Diagram 6:**
* Box 0: 0 treasures
* Box 1: 1 treasures
* Box 2: 3 treasures
* Box 3: 0 treasures
* Treasures Collected: 1 (black segment)
### Key Observations
* The number of treasures in each box changes after an action is taken.
* The "Treasures collected" bar chart shows a varying amount of treasures collected at each step.
* The action taken (opening a specific box) seems to influence the distribution of treasures across the boxes.
* The initial distribution of treasures is not uniform.
### Interpretation
The diagrams illustrate a simulation where treasures are distributed among boxes, and opening a box affects the treasure distribution. The simulation likely models a scenario where treasures can be moved or redistributed when a box is opened. The "Treasures collected" bar chart represents the cumulative number of treasures obtained up to that step. The simulation could be used to study strategies for maximizing treasure collection by choosing which boxes to open. The changing treasure counts within the boxes suggest a dynamic system where opening one box can influence the contents of others. The black and yellow segments in the bar chart likely represent treasures collected before and after the action, respectively. The simulation appears to be exploring the impact of sequential actions on a treasure distribution system.
</details>
Figure 25: Cambridge spatial working memory (CSWM) with text inputs: We illustrate two game plays of the CSWM task in the two rows. In each row, we show the initial observation (provided as text arrays) followed by actions taken and the resulting observations. The boxes in each array are the non-zero elements. Note how the box identities change after each step. This is intended to force models to remember boxes by their spatial locations instead of their integer identities. As treasures get collected, the 'Number of treasures collected' gets incremented. When a treasure is collected, a new treasure is placed in one of the boxes where the treasure never appeared before. The array colors are purely for illustration purposes.
<details>
<summary>Image 27 Details</summary>
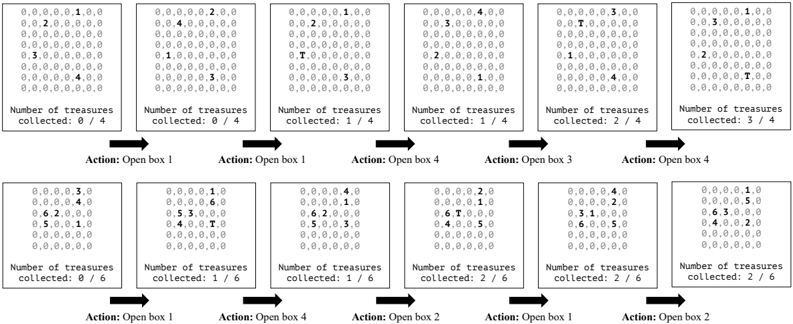
### Visual Description
\n
## Diagram: Treasure Collection Process
### Overview
The image depicts a diagram illustrating a process of treasure collection, likely within a grid-based environment. The diagram shows a sequence of actions ("Action: Open box X") and their resulting impact on the number of treasures collected. Each step involves a grid representing a potential treasure location, with 'T' marking the location of a treasure. The diagram is arranged in two rows, each representing a different set of initial conditions or a different stage of the process.
### Components/Axes
The diagram consists of the following components:
* **Grids:** 12 grids, each representing a 10x10 area, populated with numbers (mostly 0s) and 'T' symbols.
* **Action Labels:** Labels below each grid indicating the action performed ("Action: Open box X", where X is a number from 1 to 4).
* **Treasure Count Labels:** Labels below the action labels indicating the number of treasures collected at that stage ("Number of treasures collected: X / Y").
* **Arrows:** Arrows connecting the grids, indicating the flow of the process.
There are no explicit axes in the traditional sense, but the grids can be considered as representing a spatial arrangement of potential treasure locations.
### Detailed Analysis or Content Details
**Row 1 (Top Row):**
1. **Grid 1:** Mostly 0s, with a few 1s and 2s. "Number of treasures collected: 0 / 4". Action: Open box 1.
2. **Grid 2:** Contains 0s, 1s, 2s, and a 'T' in the center. "Number of treasures collected: 0 / 4". Action: Open box 1.
3. **Grid 3:** Contains 0s, 1s, 2s, and a 'T' near the top. "Number of treasures collected: 1 / 4". Action: Open box 4.
4. **Grid 4:** Contains 0s, 1s, 2s, 3s, and a 'T' near the top. "Number of treasures collected: 1 / 4". Action: Open box 3.
5. **Grid 5:** Contains 0s, 1s, 2s, 3s, and a 'T' near the top. "Number of treasures collected: 2 / 4". Action: Open box 4.
6. **Grid 6:** Contains 0s, 1s, 2s, 3s, and a 'T' near the top. "Number of treasures collected: 3 / 4". Action: Open box 4.
**Row 2 (Bottom Row):**
1. **Grid 7:** Contains 0s, 3s, 4s, 5s, and a 'T' near the top. "Number of treasures collected: 0 / 6". Action: Open box 1.
2. **Grid 8:** Contains 0s, 1s, 3s, 4s, 5s, and a 'T' near the top. "Number of treasures collected: 1 / 6". Action: Open box 4.
3. **Grid 9:** Contains 0s, 2s, 4s, 5s, 6s, and a 'T' near the top. "Number of treasures collected: 1 / 6". Action: Open box 2.
4. **Grid 10:** Contains 0s, 2s, 4s, 5s, 6s, and a 'T' near the top. "Number of treasures collected: 2 / 6". Action: Open box 1.
5. **Grid 11:** Contains 0s, 2s, 4s, 5s, 6s, and a 'T' near the top. "Number of treasures collected: 2 / 6". Action: Open box 2.
6. **Grid 12:** Contains 0s, 1s, 3s, 4s, 5s, and a 'T' near the top. "Number of treasures collected: 2 / 6". Action: Open box 2.
The numbers within the grids appear to represent some kind of value or density associated with each cell. The 'T' symbol consistently indicates the location of a treasure.
### Key Observations
* The number of treasures collected increases with each action in both rows.
* The action "Open box 4" appears frequently in both rows.
* The initial number of treasures to be collected differs between the two rows (4 in the top row, 6 in the bottom row).
* The distribution of numbers within the grids varies, suggesting different levels of "treasure potential" in different areas.
* The 'T' symbol is not always in the same location within the grids.
### Interpretation
This diagram likely represents a simplified model of a treasure-hunting process. The grids represent a search space, and the numbers within the grids could represent the probability of finding a treasure in that location, or the value of the treasure if found. The actions ("Open box X") represent attempts to locate treasures.
The diagram demonstrates that opening certain boxes (e.g., box 4) is more likely to lead to treasure discovery than others. The increasing treasure count with each action suggests a successful search strategy. The difference in initial treasure counts between the two rows could represent different levels of difficulty or different starting conditions.
The presence of numbers other than 0 and 'T' within the grids is intriguing. These numbers could represent a "heat map" of treasure potential, where higher numbers indicate a greater likelihood of finding a treasure. The diagram could be used to analyze the effectiveness of different search strategies and to optimize the process of treasure collection. The diagram is a visual representation of a state machine, where each grid represents a state, and the actions represent transitions between states. The treasure count represents the accumulated reward.
</details>
```
```
Prompt 1: Direction estimation (Ego image)
```
Prompt 2: Direction estimation (DM image)
USER: You are playing a game in a 2D world. Each image shows the immediate surroundings around you, with you at the center of
the image (in yellow). The black cells are obstacles, i.e., you cannot move over them. The blue cells are navigable spaces that you can
move over. Some blue cells have landmarks in them (red circles with a text label). These are important to remember. Here is a video
taken in the 2D world as you were navigating in it. Understand the 2D world you are navigating in, build a map of the world to keep
track of your position as well as locations of landmarks in the world.
<IMAGE 1>
<IMAGE 2>
.
.
.
You must now answer a question based on your understanding of the 2D world. Pretend that you are standing next to the landmark A.
See image below.
<IMAGE OF A>
What is the angle between the line connecting your current location to the landmark A and the line connecting your current location to
the landmark C? Angles range from -180 to 180 degrees. Here are your choices: 1) 156 2) 96 3) 66 4) -24 Think step by step. Then
answer your question in the following json format.
```
{
"answer": <fill in one of 1/2/3/4 integer choice value>
}
```
```
Prompt 2: Direction estimation (DM image)
## Large-scale spatial cognition
| | | Direction est. | Distance est. | Map sketching | Route retracing | Shortcut discovery |
|-----------|-------------|------------------|-----------------|-----------------|-------------------|----------------------|
| Ego image | # questions | 150 | 135 | 30 | 30 | 30 |
| | # videos | 30 | 30 | 30 | 30 | 30 |
| DMimage | # questions | 150 | 135 | 30 | 30 | 30 |
| | # videos | 30 | 30 | 30 | 30 | 30 |
| DMtext | # questions | 150 | 135 | 30 | 30 | 30 |
## Small-scale spatial cognition
| | | MRT | PTT | WLT | MPFB | JLO | SAtt | MCT | CBTT | SAdd | CSWM |
|---------|-------------|-------|-------|-------|--------|-------|--------|-------|--------|--------|--------|
| Visual | # questions | 172 | 100 | 50 | 50 | 50 | 100 | 45 | 50 | 50 | 50 |
| Visual | # images | 139 | 20 | 300 | 250 | 51 | 200 | - | 297 | 300 | - |
| Textual | # questions | 40 | 100 | - | 50 | 50 | 100 | 45 | 50 | 50 | 50 |
Table 6: SPACE benchmark statistics: We show the number of questions, images, and videos for each SPACE task. For large-scale spatial cognition tasks, we have one video per environment. We generate questions and navigation tasks based on these videos. Some small-scale spatial cognition tasks have multiple images for the same question (e.g., MPFB, WLT, SAtt and CBTT), while other tasks have multiple questions for the same image (e.g., PTT, MRT). For interactive tasks like MCT, CSWM, route retracing and shortcut discovery, images are rendered conditioned on the actions taken by the agent.
Prompt 3: Direction estimation (DM text)
USER: You are playing a game in a 2D text world. The console of the game is represented as a comma-separated text array. Obstacles are represented using 0, i.e., you cannot move over them. Navigable spaces that you can move over are represented using 1. Some navigable spaces have landmarks represented as an ascii character (A - Z). These are also navigable spaces and are just labeled with an ascii character. These landmarks are important to remember. You will always be located at the center of the array with your position highlighted using the '*' character. Here is a sequence of console screen recordings taken as you were navigating in the 2D text world. Understand the world you are navigating in, build a map of the world to keep track of your position as well as locations of landmarks in the world.
```
```
You must now answer a question based on your understanding of the 2D text world. Pretend that you are standing next to the landmark B as shown below.
```
1, 1, 1, 1, 1, 1
1, 1, 1, 1, 1, 1
1, B *, 1, 1
1, 0, 1, 1, 0
1, 1, 1, 1, 1
```
What is the angle between the line connecting your current location to the landmark B and the line connecting your current location to the landmark C? Angles range from -180 to 180 degrees. Note that you may not see landmark C in your immediate vicinity. You must use spatial knowledge from the sequence of screen recordings to locate your current position and both landmarks to answer this question.
```
Here are your choices: 1) -127 2) 53 3) 83 4) -97
Think step by step. Then answer your question in the following json format.
```
{
"answer": <fill in one of 1/2/3/4 integer choice value>
}
```
```
```
Prompt 4: Distance estimation (Ego image)
```
Prompt 4: Distance estimation (Ego image)
Prompt 5: Distance estimation (DM image)
USER: You are playing a game in a 2D world. Each image shows the immediate surroundings around you, with you at the center of the image (in yellow). The black cells are obstacles, i.e., you cannot move over them. The blue cells are navigable spaces that you can move over. Some blue cells have landmarks in them (red circles with a text label). These are important to remember. Here is a video taken in the 2D world as you were navigating in it. Understand the 2D world you are navigating in, build a map of the world to keep track of your position as well as locations of landmarks in the world.
```
taken in the 2D world as you were navigating in it. Understand the 2D world you are navigating in, build a map of the world to keep track of your position as well as locations of landmarks in the world.
<IMAGE>
<IMAGE>
.
.
.
You must now answer a question based on your understanding of the 2D world. Pretend that you are standing on the landmark C. What are the euclidean distances (in meters) from landmark C to each of the following landmarks: B, A, N, O, Y? Assume that each grid square (white borders) is 1m x 1m in size. Here are your choices: 1) 4.5, 8.5, 11.4, 11.2, 10.0 2) 11.4, 8.5, 4.5, 11.2, 10.3) 10.0, 8.5, 4.5, 11.4, 11.2) 12.5, 6.0, 3.4, -3.5, 7.2
Think step by step. Then answer your question in the following json format.
```
Prompt 6: Distance estimation (DM text)
USER: You are playing a game in a 2D text world. The console of the game is represented as a comma-separated text array. Obstacles are represented using 0, i.e., you cannot move over them. Navigable spaces that you can move over are represented using 1. Some navigable spaces have landmarks represented as an ascii character (A - Z). These are also navigable spaces and are just labeled with an ascii character. These landmarks are important to remember. You will always be located at the center of the array with your position highlighted using the '*' character. Here is a sequence of console screen recordings taken as you were navigating in the 2D text world. Understand the world you are navigating in, build a map of the world to keep track of your position as well as locations of landmarks
```
USER: You are playing a game in a 2D text world. The console of the game is represented as a comma-separated text array. Obstacles
are represented using 0, i.e., you cannot move over them. Navigable spaces that you can move over are represented using 1. Some
navigable spaces have landmarks represented as an ascii character (A - Z). These are also navigable spaces and are just labeled with an
ascii character. These landmarks are important to remember. You will always be located at the center of the array with your position
highlighted using the "*" character. Here is a sequence of console screen recordings taken as you were navigating in the 2D text world.
Understand the world you are navigating in, build a map of the world to keep track of your position as well as locations of landmarks
in the world.
======== Start of console screen recordings ======
Screen at time = 0
======== End of console screen recordings ======
```
```
USER: You are a sentient AI system capable of visually understanding the physical world, performing spatial reasoning, remembering
landmarks in the world and navigating in it. Here is a video taken in a physical enviornment as you were navigating in it. Understand
the environment you are navigating in, build a map of the environment to keep track of your position as well as locations of landmarks
in the environment. Landmarks are paintings of objects hung on the walls.
<IMAGE 1>
<IMAGE 2>
.
.
```
Prompt 7: Map sketching (Ego image)
## Prompt 8: Map sketching (DM image)
```
Prompt 8: Map sketching (DM image)
USER: You are playing a game in a 2D world. Each image shows the immediate surroundings around you, with you at the center of
the image (in yellow). The black cells are obstacles, i.e., you cannot move over them. The blue cells are navigable spaces that you can
move over. Some blue cells have landmarks in them (red circles with a text label). These are important to remember. Here is a video
taken in the 2D world as you were navigating in it. Understand the 2D world you are navigating in, build a map of the world to keep
track of your position as well as locations of landmarks in the world.
<IMAGE 1>
<IMAGE 2>
.
.
You must now sketch a map of the environment with the locations of the start and landmark locations. Use your understanding of the
2D world. Which of these map sketches best capture the true structure of the 2D world?
Choice 1
<SKETCH IMAGE OF Choice 1>
Choice 2
<SKETCH IMAGE OF Choice 2>
Choice 3
<SKETCH IMAGE OF Choice 3>
Choice 4
<SKETCH IMAGE OF Choice 4>
Think step by step. Then answer your question in the following json format.
```
{
"answer": <fill in one of 1/2/3/4 integer choice value>
}
```
```
```
Prompt 9: Map sketching (DM text)
USER: You are playing a game in a 2D text world. The console screen of the game is represented as a comma-separated text array.
Obstacles are represented using 0, i.e., you cannot move over them. Navigable spaces that you can move over are represented using 1.
Some navigable spaces have landmarks represented as an ascii character (A - Z). These are also navigable spaces and are just labeled
with an ascii character. These landmarks are important to remember. You will always be located at the center of the array with your
position highlighted using the "*" character. Here is a sequence of console screen recordings taken as you were navigating in the 2D
text world. Understand the world you are navigating in, build a map of the world to keep track of your position as well as locations of
landmarks in the world.
========= Start of console screen recordings =========
Screen at time = 0
0,0,0,0
0,0,0,0
0,1+,1,1
0,C,1,1,1
0,0,1,1,0
Screen at time = 1
0,0,0,0,0
0,0,0,0,0
0,0,*,1,1
0,0,C,1,1
0,0,0,1,1
.
.
========= End of console screen recordings =========
```
Prompt 9: Map sketching (DM text)
## Prompt 10: Route retracing (Ego image)
SYSTEM: You are a sentient living creature capable of navigating in environments, building internal spatial representations of environments, and finding goals in them. You will be shown a video of the shortest route from the initial position to the goal. You must look at the video and understand the environment structure and the route taken. Then, you will be placed in the environment at the same initial position. You must navigate from the initial position to the goal using the same route shown in the video, as quickly as possible. Below, you will find sections highlighting more details about the task. You can refer to these for more information.
## OBSERVATIONS:
The images are recorded from a perspective viewpoint (i.e., egocentric or first-person). This means that you are likely to see objects from different angles, resulting in a skewed appearance of the underlying 3D objects. It is important for you to look past this skew in the appearance and percive the true shape of the object in 3D.
## GOAL:
You will be provided an object goal using a text description and an image of the object. You must find the goal object in the environment by repeating the path shown in the video walkthrough. Once you find it, move close to the location of the goal and re-orient yourself to face the object.
## ACTIONS:
You have four actions available.
move forward: move forward by 0.25m along the current heading direction. It does not change the heading angle. turn left: decrease your heading angle by 30 degrees. It does not change the (x, y) position. turn right: increase your heading angle by 30 degrees. It does not change the (x, y) position.
stop: ends the current task. Issue this action only if you think you have reached the goal. If you haven't reached the goal, this action will result in a navigation failure that cannot be recovered from.
## STUCK IN PLACE BEHAVIOR:
Avoid getting stuck in one place, i.e., do not alternate between left and right turns without going anywhere. You must try and move around consistently without being stuck in one place.
## STOP CRITERIA:
Before executing stop, you must ensure that you've 'reached' the goal correctly. To reach a goal, you have to move close enough to the wall where you see the goal, and see the object clearly in your observation in front of you.
## RESPONSE FORMAT:
Respond in the following format:
Reasoning: text explanation string in one or two short sentences - provide all your explanations and inner thoughts here - avoid verbosity and be concise
Intent: state your intent in one short sentence, i.e., what you are trying to achieve
Then provide the final action to take in a json formatted string.
```
```
USER: Here are the sequence of frames from the walkthrough video demonstrating the route you need to take. Analyze the walkthrough to understand the movements and the maze structure. Take a note of all the details needed to help you repeat this route when navigating next. Think step by step.
```
<IMAGE 1>
<IMAGE 2>
*
*
```
## ASSISTANT: ...
USER: Now, you must navigate to the goal. Here is the goal description and the image: Painting of a Soccer Ball
```
USER: Now, you must navigate to the goal. H
```
Prompt 11: Route retracing (DM image)
SYSTEM: You are playing a game in a 2D world. You will be shown a video of the shortest route from an initial position to a goal. You must look at the video and understand the 2D world structure and the route taken. Then, you will be placed in the 2D world at the same initial position. You must navigate from the initial position to the goal using the same route shown in the video, as quickly as possible. Below, you will find sections highlighting more details about the 2D world and the task. You can refer to these for more information.
## 2D WORLD:
The world consists of the following.
* black cells: these are obstacles, i.e., you cannot move over them
* blue cells: these are navigable spaces, i.e., you can move over them
Some blue cells contain landmarks, which are red circles filled with a text character. These are important as they will allow you to better understand the world and locate yourself. Your position will be marked using a yellow square.
## OBSERVATIONS:
The images are recorded from a birds-eye view of the 2D world. The images capture a local neighborhood surrounding your current position in the world, i.e., you will always remain at the center of the image while the world changes around you.
## GOAL:
You will be asked to navigate to a goal landmark. You must find the goal in the 2D world by repeating the path shown in the video. Once you find it, move to the location of the goal till you are standing on the landmark and then execute a stop action.
## ACTIONS:
You have four actions available.
up: move up by one unit cell down: move down by one unit cell
left: move left by one unit cell right: move right by one unit cell
stop: ends the current task. Issue this action only if you think you have reached the goal. If you haven't reached the goal, this action will result in a navigation failure that cannot be recovered from.
## STOP CRITERIA:
Before executing stop, you must ensure that you've 'reached' the goal correctly. To reach a goal, you have to move to the cell containing the goal landmark. Then execute the stop action.
## RESPONSE FORMAT:
Respond in the following format:
Reasoning: text explanation string in one or two short sentences - provide all your explanations and inner thoughts here - avoid verbosity and be concise
Intent: state your intent in one short sentence, i.e., what you are trying to achieve
```
Intent: state your intent in one short sentence, i.e., what you are trying to achieve
Then provide the final action to take in a json formatted string.
```
{
"action": <action name -- must be one of up, down, left, right>
}
```
```
```
{
"action": <action name -- must be one of up, down, left, right>
}
```
```
USER: Here is sequence of video frames recorded in the 2D world. This demonstrates the route you need to repeat. Analyze the video to understand the movements and the world structure. Take a note of all the details needed to help you repeat this route when navigating next. Think step by step.
```
<IMAGE 1>
<IMAGE 2>
*
*
```
## ASSISTANT: ...
USER: Now, you must navigate to the goal based on your knowledge of the 2D world you obtained from the video. Here is the goal description: landmark Y
USER: Here is the local view of your surroundings in the 2D world. You are at the center of this view.
```
<PRE>
<CURRENT IMAGE OBSERVATION>
```
## ASSISTANT: ...
USER: Here is the local view of your surroundings in the 2D world. You are at the center of this view.
```
<PRE>
<CURRENT IMAGE OBSERVATION>
```
.
.
.
## Prompt 12: Route retracing (DM text) - part 1
SYSTEM: You are playing a game in a 2D text world. The console screen of the game is represented as a comma-separated text array. You will be shown a sequence of console screen recordings that demonstrate the shortest route from an initial position to a goal. You must look at the sequence and understand the 2D text world structure and the route taken. Then, you will be placed in the 2D text world at the same initial position. You must navigate from the initial position to the goal using the same route shown in the screen recording sequence, as quickly as possible. Below, you will find sections highlighting more details about the 2D text world and the task. You can refer to these for more information.
## 2D TEXT WORLD:
The console of the game is represented as a comma-separated text array. Obstacles are represented using 0, i.e., you cannot move over them. Navigable spaces that you can move over are represented using 1. Some navigable spaces have landmarks represented as an ascii character (A - Z). These are also navigable spaces and are just labeled with an ascii character. These landmarks are important to remember. You will always be located at the center of the array with your position highlighted using the '*' character.
## OBSERVATIONS:
The images are recorded from a birds-eye view of the 2D world. The images capture a local neighborhood surrounding your current position in the world, i.e., you will always remain at the center of the image while the world changes around you.
## GOAL:
You will be asked to navigate to a goal landmark. You must find the goal in the 2D text world by repeating the path shown in the console screen recording sequence. Once you find it, move to the location of the goal till you are standing on the landmark and then execute a stop action.
## ACTIONS:
You have four actions available.
up: move up by one unit cell down: move down by one unit cell
left: move left by one unit cell right: move right by one unit cell
stop: ends the current task. Issue this action only if you think you have reached the goal. If you haven't reached the goal, this action will result in a navigation failure that cannot be recovered from.
## STOP CRITERIA:
Before executing stop, you must ensure that you've 'reached' the goal correctly. To reach a goal, you have to move to the cell containing the goal landmark. Then execute the stop action.
## RESPONSE FORMAT:
## Respond in the following format:
Reasoning: text explanation string in one or two short sentences - provide all your explanations and inner thoughts here - avoid verbosity and be concise Intent: state your intent in one short sentence, i.e., what you are trying to achieve Then provide the final action to take in a json formatted string.
```
```
{
"action": <action name -- must be one of up, down, left, right>
}
```
```
USER: Here is the sequence of console screen recordings taken in the 2D text world. This demonstrates the route you need to repeat. Analyze the sequence to understand the movements and the world structure. Take a note of all the details needed to help you repeat this route when navigating next. Think step by step.
```
USER: Here is the sequence of console screen recordings analyze the sequence to understand the movements and the route when navigating next. Think step by step.
#### Console screen recorded at time = 0
```
0,0,0,0,0
0,0,0,0,0
0,1,*,1,1
0,C,1,1,1
0,0,1,1,0
```
#### Console screen recorded at time = 1
```
0,0,0,0,0
0,1,1,1,1
0,C,*,1,1
0,0,1,1,0
0,1,1,1,1
```
Prompt 13: Route retracing (DM text) - part 2
<details>
<summary>Image 28 Details</summary>
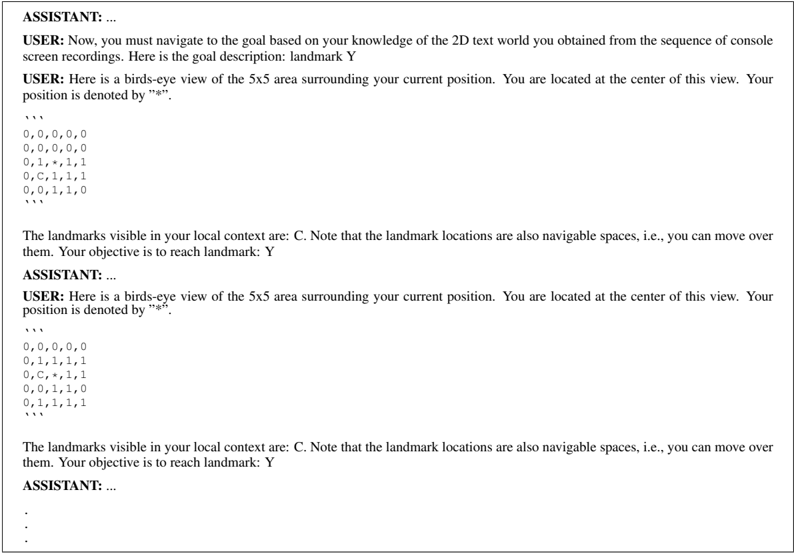
### Visual Description
## Textual Data: Console Output
### Overview
The image presents a series of console outputs from a simulated environment, likely a text-based game or navigation system. The outputs describe a 2D world represented as a 5x5 grid, the player's position, and the goal (landmark Y). The outputs are presented in a conversational format between "USER" and "ASSISTANT".
### Components/Axes
The key components are:
* **Grid Representation:** The world is represented by a 5x5 grid using characters (0, 1, *, C, Y).
* **Player Position:** Marked by the character "*".
* **Landmarks:** 'C' and 'Y' denote landmarks.
* **Navigable Space:** '0' and '1' represent navigable spaces.
* **Dialogue:** The "USER" provides instructions and context, while the "ASSISTANT" acknowledges and presents the world state.
### Detailed Analysis or Content Details
The image contains two distinct blocks of console output. Let's analyze each:
**Block 1:**
* **USER:** "Now, you must navigate to the goal based on your knowledge of the 2D text world you obtained from the sequence of console screen recordings. Here is the goal description: landmark Y"
* **USER:** "Here is a birds-eye view of the 5x5 area surrounding your current position. You are located at the center of this view. Your position is denoted by "*""
* **Grid:**
```
0,0,0,0,0
0,0,0,0,0
0,1,* ,1,1
0,C,1,1,1
0,0,1,1,0
```
* **USER:** "The landmarks visible in your local context are: C. Note that the landmark locations are also navigable spaces, i.e., you can move over them. Your objective is to reach landmark: Y"
**Block 2:**
* **ASSISTANT:** "..." (Indicates continuation of the dialogue)
* **USER:** "Here is a birds-eye view of the 5x5 area surrounding your current position. You are located at the center of this view. Your position is denoted by "*""
* **Grid:**
```
0,0,0,0,0
0,1,1,1,1
0,C,*,1,1
0,0,1,1,1
0,1,1,1,0
```
* **USER:** "The landmarks visible in your local context are: C. Note that the landmark locations are also navigable spaces, i.e., you can move over them. Your objective is to reach landmark: Y"
**Block 3:**
* **ASSISTANT:** "..." (Indicates continuation of the dialogue)
### Key Observations
* The player's position ("*") changes between the two grid representations. In the first grid, the player is at (2,2) (row 2, column 2). In the second grid, the player is at (2,2) (row 2, column 2).
* Landmark 'C' remains in the same position in both grids, at (3,1).
* The goal is to reach landmark 'Y', which is not present in either of the displayed grids.
* The environment is static except for the player's movement.
* The dialogue indicates a learning or navigation task where the agent must use past observations to achieve a goal.
### Interpretation
The data suggests a reinforcement learning or pathfinding scenario. The agent receives visual input (the grid) and instructions (the goal). The agent's task is to navigate from its current position to the goal landmark 'Y'. The console output provides a sequence of states and instructions, allowing the agent to learn the environment and develop a strategy for reaching the goal. The presence of landmark 'C' suggests that the environment may contain multiple landmarks, and the agent needs to distinguish between them. The fact that landmarks are navigable spaces implies that the agent can move through them without penalty. The repeated "ASSISTANT: ..." suggests that the interaction is ongoing, and the agent is receiving further updates and instructions. The absence of 'Y' in the provided grids implies that the agent may need to explore beyond the initially visible area to find the goal. The changing position of the player indicates that the agent is taking actions and receiving feedback from the environment.
</details>
Prompt 14: Shortcut discovery (Ego image)
SYSTEM: You are a sentient living creature capable of navigating in environments, building internal spatial representations of environments, and finding goals in them. You will be shown a video of some route from the initial position to the goal. You must look at the video and understand the environment structure, and remember the locations of the start and the goal. The video may show a long-winded route from the start to the goal with unnecessary detours. Based on the environment structure, you must identify a faster route to the goal. Then, you will be placed in the environment at the same initial position. You must navigate to the goal using your identified shortest route as quickly as possible. Below, you will find sections highlighting more details about the task. You can refer to these for more information.
## OBSERVATIONS:
The images are recorded from a perspective viewpoint (i.e., egocentric or first-person). This means that you are likely to see objects from different angles, resulting in a skewed appearance of the underlying 3D objects. It is important for you to look past this skew in the appearance and perceive the true shape of the object in 3D.
## GOAL:
You will be provided an object goal using a text description and an image of the object. You must find the goal object in the environment by identifying the shortest route based on your experience from the video. Once you find the goal, move close to its location and reorient yourself to face the object.
## ACTIONS:
You have four actions available.
move forward: move forward by 0.25m along the current heading direction. It does not change the heading angle. turn left: decrease your heading angle by 30 degrees. It does not change the (x, y) position. turn right: increase your heading angle by 30 degrees. It does not change the (x, y) position.
stop: ends the current task. Issue this action only if you think you have reached the goal. If you haven't reached the goal, this action will result in a navigation failure that cannot be recovered from.
## STUCK IN PLACE BEHAVIOR:
Avoid getting stuck in one place, i.e., do not alternate between left and right turns without going anywhere. You must try and move around consistently without being stuck in one place.
## STOP CRITERIA:
Before executing stop, you must ensure that you've 'reached' the goal correctly. To reach a goal, you have to move the robot close enough to the wall where you see the goal, and see the object clearly in your observation in front of you.
## RESPONSE FORMAT:
Respond in the following format:
Reasoning: text explanation string in one or two short sentences - provide all your explanations and inner thoughts here - avoid verbosity and be concise
Intent: state your intent in one short sentence, i.e., what you are trying to achieve
Then provide the final action to take in a json formatted string.
```
'''
{
"action": <action name -- must be one of move_forward, turn_left, turn_right, stop>
}
'''
```
```
top>
```
USER: Here are the sequence of frames from the walkthrough video demonstrating a suboptimal route from the start to some goal location. Analyze the walkthrough to understand the movements and the environment structure. Keep track of the start and goal locations, and the current location in the environment as you watch the walkthrough. Then plan a shortcut route that takes you to the goal while avoiding unnecessary detours. Think step by step.
```
<IMAGE 1>
<IMAGE 2>
*
*
```
## ASSISTANT: ...
USER: Now, you must navigate to the goal. Here is the goal description and the image: Painting of a Soccer Ball
```
USER: Now, you must navigate to the goal. H
```
Prompt 15: Shortcut discovery (DM image)
SYSTEM: You are playing a game in a 2D world. You will be shown a video of some route from an initial position to a goal. You must look at the video and understand the 2D world structure and remember the locations of the start and the goal. The video may show a long-winded route from the start to the goal with unnecessary detours. Based on the world structure, you must identify a faster route to the goal. Then, you will be placed in the 2D world at the same initial position. You must navigate from the initial position to the goal using your identified shortest route as quickly as possible. Below, you will find sections highlighting more details about the 2D world
Some blue cells contain landmarks, which are red circles filled with a text character. These are important as they will allow you to better understand the world and locate yourself. Your position will be marked using a yellow square.
The images are recorded from a birds-eye view of the 2D world. The images capture a local neighborhood surrounding your current position in the world, i.e., you will always remain at the center of the image while the world changes around you.
You will be asked to navigate to a goal landmark. You must find the goal in the 2D world by identifying the shortest path based your your experience from the video. Once you find it, move to the location of the goal till you are standing on the landmark and then execute stop: ends the current task. Issue this action only if you think you have reached the goal. If you haven't reached the goal, this action
Before executing stop, you must ensure that you've 'reached' the goal correctly. To reach a goal, you have to move to the cell containing the goal landmark. Then execute the stop action.
Reasoning: text explanation string in one or two short sentences - provide all your explanations and inner thoughts here - avoid verbosity and be concise
USER: Here is the sequence of video frames recorded in the 2D world. This demonstrates a suboptimal route from the start to some goal location. Analyze the video to understand the movements and the world structure. Keep track of the start and goal locations, and the current location in the world as you watch the video. Then plan a shortcut route that takes you to the goal while avoiding any unnecessary detours. Think step by step.
USER: Now, you must navigate to the goal based on your knowledge of the 2D world you obtained from the video. Here is the goal
- and the task. You can refer to these for more information. 2D WORLD: The world consists of the following. * black cells: these are obstacles, i.e., you cannot move over them * blue cells: these are navigable spaces, i.e., you can move over them OBSERVATIONS: GOAL: a stop action. ACTIONS: You have four actions available. up: move up by one unit cell down: move down by one unit cell left: move left by one unit cell right: move right by one unit cell will result in a navigation failure that cannot be recovered from. STOP CRITERIA: RESPONSE FORMAT: Respond in the following format: Intent: state your intent in one short sentence, i.e., what you are trying to achieve Then provide the final action to take in a json formatted string. ''' { "action": <action name -- must be one of up, down, left, right> } ''' <IMAGE 1> <IMAGE 2> . . . ASSISTANT: ... description: landmark Y USER: Here is the local view of your surroundings in the 2D world. You are at the center of this view. <CURRENT IMAGE OBSERVATION> ASSISTANT: ... USER: Here is the local view of your surroundings in the 2D world. You are at the center of this view. <CURRENT IMAGE OBSERVATION> ASSISTANT: ... . . .
## Prompt 16: Shortcut discovery (DM text) - part 1
SYSTEM: You are playing a game in a text 2D world. The console screen of the game is represented as a comma-separated text array. You will be shown a sequence of console screen recordings that demonstrates a route from an initial position to a goal. You must look at the sequence and understand the 2D text world structure and remember the locations of the start and the goal. The recordings may show a long-winded route from the start to the goal with unnecessary detours. Based on the world structure, you must identify a faster route to the goal. Then, you will be placed in the 2D text world at the same initial position. You must navigate from the initial position to the goal using your identified shortest route as quickly as possible. Below, you will find sections highlighting more details about the 2D text world and the task. You can refer to these for more information.
## 2D TEXT WORLD:
The console of the game is represented as a comma-separated text array. Obstacles are represented using 0, i.e., you cannot move over them. Navigable spaces that you can move over are represented using 1. Some navigable spaces have landmarks represented as an ascii character (A - Z). These are also navigable spaces and are just labeled with an ascii character. These landmarks are important to remember. You will always be located at the center of the array with your position highlighted using the '*' character.
## OBSERVATIONS:
The images are recorded from a birds-eye view of the 2D world. The images capture a local neighborhood surrounding your current position in the world, i.e., you will always remain at the center of the image while the world changes around you.
## GOAL:
You will be asked to navigate to a goal landmark. You must find the goal in the 2D text world by identifying the shortest path based your your experience from the screen recording sequence. Once you find it, move to the location of the goal till you are standing on the landmark and then execute a stop action.
## ACTIONS:
You have four actions available.
up: move up by one unit cell down: move down by one unit cell left: move left by one unit cell right: move right by one unit cell
stop: ends the current task. Issue this action only if you think you have reached the goal. If you haven't reached the goal, this action will result in a navigation failure that cannot be recovered from.
## STOP CRITERIA:
Before executing stop, you must ensure that you've 'reached' the goal correctly. To reach a goal, you have to move to the cell containing the goal landmark. Then execute the stop action.
## RESPONSE FORMAT:
Respond in the following format:
Reasoning: text explanation string in one or two short sentences - provide all your explanations and inner thoughts here - avoid verbosity and be concise
Intent: state your intent in one short sentence, i.e., what you are trying to achieve Then provide the final action to take in a json formatted string.
```
'''
{
"action": <action name -- must be one of up, down, left, right>
}
'''
```
```
"action": <action name -- must be one of up, down, left, right>
}
```
```
USER: Here is the sequence of console screen recordings taken in the 2D text world. This demonstrates a suboptimal route from the start to some goal location. Analyze the sequence to understand the movements and the world structure. Keep track of the start and goal locations, and the current location in the world as you study the sequence. Then plan a shortcut route that takes you to the goal while avoiding any unnecessary detours. Think step by step.
```
start to some goal location. Analyze the sequence to undergoal locations, and the current location in the world as you while avoiding any unnecessary detours. Think step by step
```
```
Prompt 17: Shortcut discovery (DM text) - part 2
ASSISTANT: ...
USER: Now, you must navigate to the goal based on your knowledge of the 2D text world you obtained from the sequence of console screen recordings. Here is the goal description: landmark Y
USER: Here is a birds-eye view of the 5x5 area surrounding your current position. You are located at the center of this view. Your position is denoted by "*".
''''''
0,0,0,0,0
0,0,0,0,0
0,1,*,1,1
0,C,1,1,1
0,0,1,1,0
'''''''
The landmarks visible in your local context are: C. Note that the landmark locations are also navigable spaces, i.e., you can move over them. Your objective is to reach landmark: Y
ASSISTANT: ...
USER: Here is a birds-eye view of the 5x5 area surrounding your current position. You are located at the center of this view. Your position is denoted by "*".
''''''
0,0,0,0,0
0,0,0,0,0
1,1,*,1,0
C,1,1,1,0
0,1,1,0,0
'''''''
The landmarks visible in your local context are: C. Note that the landmark locations are also navigable spaces, i.e., you can move over them. Your objective is to reach landmark: Y
ASSISTANT: ...
```
Prompt 17: Shortcut discovery (DM text) - part 2
```
USER: Here is an image of a three-dimensional shape.
<IMAGE OF REFERENCE 3D SHAPE>
Which of these images show the same object rotated in 3D?
<IMAGE OF REFERENCE 3D SHAPE>
Which of these images show the same object rotated in 3D?
<IMAGE OF REFERENCE 3D SHAPE>
Choice 1
<IMAGE OF REFERENCE 3D SHAPE>
Choice 2
<IMAGE OF REFERENCE 3D SHAPE>
Choice 2
<IMAGE OF REFERENCE 3D SHAPE>
Choice 2
<IMAGE OF REFERENCE 3D SHAPE>
Choice 3
<IMAGE OF REFERENCE 3D SHAPE>
Choice 3
<IMAGE OF REFERENCE 3D SHAPE>
Choice 4
<IMAGE OF REFERENCE 3D SHAPE>
Think step by step. Then answer your question in the following json format.
```
{
"answer": <fill in one of 1/2/3/4 integer value>
}
```
```
Prompt 18: Mental rotation (vision)
```
USER: Here is a two-dimensional array.
over,none,page
such,none,free
site,none,list
Which of these options show the same array rotated in 2D? Note: It must only be rotated, not mirrored.
Choice 1:
page,free,list
none,none,none
over,such,site
Choice 2:
list,free,page
none,none,none
site,such,over
Choice 3:
page,none,over
free,none,such
list,none,site
Choice 4:
over,such,site
none,none,none
page,free,list
Think step by step. Then answer your question in the following json format.
```
{
"answer": <fill in one of 1/2/3/4 integer value>
}
```
```
Prompt 19: Mental rotation (text)
## Prompt 20: Perspective taking (vision)
```
PROMPT 20: Perspective taking (vision)
USER: Here is an image of various objects (animate and inanimate) on a two-dimensional plane.
<IMAGE OF OBJECTS>
Pretend that you are standing at the centroid of guitar and facing the centroid of bat. Visualize the world around you. At what angle
(from-180 to 180 degrees) is snake located relative to you? Clockwise rotations are positive and anti-clockwise rotations are negative.
Here are your options: 1) 45 2) 85 3) 105 4) 5
Think step by step. Then answer your question in the following json format.
{
"answer": <fill in one of 1/2/3/4 integer value>
}
''''''''''''''''''''''''''''''''''''''''''''''''''''''''''''''
```
## Prompt 21: Perspective taking (text)
```
Prompt 21: Perspective taking (text)
USER: Here is an array of numbers representing the birds-eye view of a two-dimensional plane.
0,7,0,9
8,0,0,0
0,0,0,5
0,0,0,3
Empty locations are indicated using 0. Important locations are indicated with a number 1 - 9. Pretend that you are standing at the location 8 and facing the location 9. Visualize the world around you. At what angle (from -180 to 180 degrees) is the location 3 relative to you? Clockwise rotations are positive and anti-clockwise rotations are negative.
Here are your options: 1) 52 2) 32 3) 72 4) 112
Think step by step. Then answer your question in the following json format.
'''
{
"answer": <fill in one of 1/2/3/4 integer value>
}
'''
```
```
USER: Here is a container filled with water.
<IMAGE OF FILLED WATER CONTAINER>
What will be the water level when it is rotated as shown here?
<IMAGE OF ROTATED EMPTY WATER CONTAINER>
Here are your choices. Which of these match the expected water level in the rotated container?
Choice 1
<IMAGE OF CHOICE 1>
Choice 2
<IMAGE OF CHOICE 2>
Choice 3
<IMAGE OF CHOICE 3>
Choice 4
<IMAGE OF CHOICE 4>
Think step by step. Then answer your question in the following json format.
```
*answer*: <fill in one of 1/2/3/4 integer value>
}
```
Prompt 22: Water level (vision)
```
Prompt 23: Minnesota paper form board (vision)
USER: This image shows the different pieces of a puzzle.
<IMAGE OF PUZZLE PIECES>
These pieces are put together by an oracle. Which one of these four options shows what it would look like when the pieces are put together? Pay close attention to not just the final fitted shape, but also the individual pieces contained within the shape.
Choice 1
<IMAGE OF CHOICE 1>
Choice 2
<IMAGE OF CHOICE 2>
Choice 3
<IMAGE OF CHOICE 3>
Choice 4
<IMAGE OF CHOICE 4>
Think step by step. Then answer your question in the following json format.
```
{
"answer": <fill in one of 1/2/3/4 integer value>
}
```
```
Prompt 23: Minnesota paper form board (vision)
```
Prompt 24: Minnesota paper form board (text)
USER: You are playing putting together a text jigsaw puzzle. Here are the pieces, where 0 represents the interiors of the puzzle piece
and I represents the boundary.
1,1,1,1,1,1
1,0,0,0,0,1
1,0,0,0,0,1
1,0,0,0,0,1
1,0,0,0,0,1
1,0,0,0,0,1
1,1,1,1,1,1
1,0,0,0,0,1
1,0,0,0,0,1
1,0,0,0,0,1
1,0,0,0,0,1
1,1,1,1,1,1
1,0,0,0,0,1
1,0,0,0,0,1
1,0,0,0,0,1
1,1,1,1,1,1
These pieces are now put together to solve the puzzle by an oracle. Which of these four options shows what it would look like when
```
Prompt 24: Minnesota paper form board (text)
```
Prompt 25: Judgement of line orientation (vision)
USER: Here is an image showing two lines. Your goal is to measure the angle between the two lines.
<IMAGE OF LINES>
Here is a legend showing a set of reference lines numbered from 1 to 11.
Which of the following reference line pairs match the angle between the original lines shown in the image?
1) Lines 1 and 9
2) Lines 1 and 7
3) Lines 1 and 10
4) Lines 1 and 3
Think step by step. Then answer your question in the following json format.
```
{
"answer": <fill in one of 1/2/3/4 integer value>
}
```
```
Prompt 25: Judgement of line orientation (vision)
```
```
Prompt 26: Judgement of line orientation (text)
```
Prompt 27: Selective attention (vision)
USER: Here is an image of a apple. Let us call this the target.
<IMAGE OF TARGET>
Here is a grid of apple images. This contains multiple instances of apple, but not all of them are the target object. The grid is indexed from top-left to bottom-right, starting from row, column = (0, 0).
<IMAGE OF GRID>
Which of these options represent the true locations of the target object in the grid? Locations are represented as (row, column).
Choice 1. (0, 3), (1, 2), (2, 2), (3, 3)
Choice 2. (0, 1), (1, 0), (2, 0), (3, 3)
Choice 3. (0, 3), (1, 2), (2, 2), (3, 1)
Choice 4. (0, 3), (1, 2), (2, 2), (3, 1)
Think step by step. Then answer your question in the following json format.
```
{
"answer": <fill in one of 1/2/3/4 integer value>
}
```
```
Prompt 27: Selective attention (vision)
## Prompt 28: Selective attention (text)
```
```
Prompt 29: Maze completion (vision)
```
```
## Prompt 30: Maze completion (text)
USER: You are a sentient living creature capable navigating in mazes, planning, and spatial reasoning. You are playing a text-based maze game. You start at some random position in the maze. You must escape the maze as quickly as possible to reach the goal. You are given a 2D array representing the maze, which contains the following:
* maze structure - 0 is obstacle space, 1 is navigable space. You can only move on 1s (i.e., navigable spaces). You cannot move through 0s (i.e., obstacles).
* your current position - marked as A
* goal position - marked as G
Goal and current positions are always navigable spaces.
Actions available: You can take five possible actions.
* left - move left from your current position by one step
* right - move right from your current position by one step
* up - move up from your current position by one step
* down - move down from your current position by one step
* stop - issue this action only after you have reached the goal position. If you execute it prematurely, you will fail. If you do not execute it after reaching the goal, you will again fail.
## Response format: Respond in the following format.
```
```
## ASSISTANT: ...
USER: Here is the current view of the maze.
```
```
0 represents obstacles. 1 represents free spaces. G is the goal. A is your current position in the maze. Your current location in the maze is row, column = (1, 1). The goal location is row, column = (21, 19). Think step-by-step about how to reach the goal. What action do you take next?
## ASSISTANT: ...
.
.
.
Prompt 31: Corsi block tapping (text)
<details>
<summary>Image 29 Details</summary>
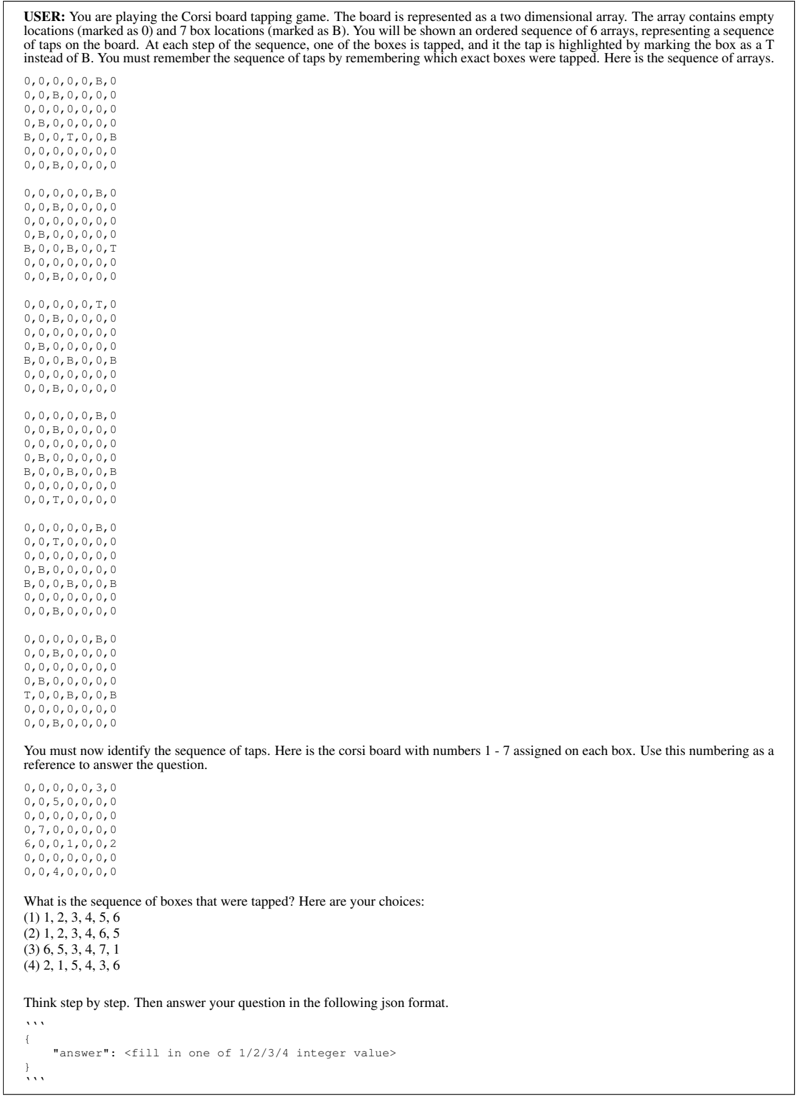
### Visual Description
\n
## Textual Document: Corsi Board Tapping Game Instructions & Question
### Overview
The image presents instructions for a Corsi board tapping game, along with a specific game instance and a multiple-choice question. The game involves remembering a sequence of tapped boxes on a grid. The instructions explain the board representation (0 for empty, B for box, T for tapped) and the task of identifying the tapped sequence. The image also includes a sample board configuration and a question asking to identify the sequence of tapped boxes.
### Components/Axes
The document consists of the following sections:
1. **Instructions:** A textual description of the game rules and board representation.
2. **Game Board (Sequence 1):** A 9x9 grid represented by characters '0', 'B', and 'T'.
3. **Game Board (Sequence 2):** A 9x9 grid represented by characters '0', 'B', and 'T', numbered 1-7.
4. **Question:** A multiple-choice question asking for the sequence of tapped boxes.
5. **Answer Format:** Instructions for providing the answer in JSON format.
### Detailed Analysis or Content Details
**Instructions:**
"USER: You are playing the Corsi board tapping game. The board is represented as a two dimensional array. The array contains empty locations (marked as 0) and 7 box locations (marked as B). You will be shown an ordered sequence of 6 arrays, representing a sequence of taps on the board. At each step of the sequence, one of the boxes is tapped, and it the tap is highlighted by marking the box as a 'T' instead of 'B'. You must remember the sequence of taps by remembering which exact boxes were tapped. Here is the sequence of arrays."
**Game Board (Sequence 1):**
The first board is a 9x9 grid with the following configuration:
```
0, 0, 0, 0, 0, 0, 0, 0, 0
0, 0, 0, 0, 0, 0, 0, 0, 0
0, 0, B, 0, 0, 0, 0, 0, 0
0, 0, 0, 0, 0, 0, 0, 0, 0
0, B, 0, 0, 0, 0, 0, 0, 0
0, 0, 0, 0, 0, 0, 0, 0, 0
0, 0, 0, 0, 0, 0, 0, B, 0
0, 0, 0, 0, 0, 0, 0, 0, 0
0, 0, 0, 0, 0, 0, 0, 0, 0
```
**Game Board (Sequence 2):**
The second board is a 9x9 grid with the following configuration, numbered 1-7:
```
0, 0, 0, 0, 0, 0, 0, 0, 0
0, 0, 0, 0, 0, 0, 0, 0, 0
0, 0, B, 0, 0, 0, 0, 0, 0
0, 0, 0, 0, 0, 0, 0, 0, 0
0, B, 0, 0, 0, 0, 0, 0, 0
0, 0, 0, 0, 0, 0, 0, 0, 0
0, 0, 0, 0, 0, 0, 0, B, 0
1, 2, 3, 4, 5, 6, 7, 0, 0
0, 0, 0, 0, 0, 0, 0, 0, 0
```
**Question:**
"What is the sequence of boxes that were tapped? Here are your choices:
(1) 1, 2, 3, 4, 5, 6
(2) 1, 2, 3, 4, 5, 7
(3) 1, 2, 3, 4, 6, 7
(4) 1, 2, 3, 5, 6, 7"
**Answer Format:**
"Think step by step. Then answer your question in the following json format."
```json
{
"answer": "<fill in one of 1/2/3/4 integer value>"
}
```
### Key Observations
The game presents a memory task where the user needs to identify the sequence of tapped boxes. The board uses '0' to represent empty locations, 'B' to represent boxes, and 'T' to represent tapped boxes. The question provides multiple-choice options for the sequence of tapped boxes. The answer should be provided in a specific JSON format.
### Interpretation
The document describes a cognitive task designed to assess short-term memory and spatial reasoning. The Corsi block-tapping test is a neuropsychological assessment used to evaluate visuospatial working memory. The task requires the user to encode the spatial locations of the tapped boxes and recall them in the correct order. The use of a grid and simple symbols ('0', 'B', 'T') simplifies the visual complexity, focusing the task on memory and sequencing. The JSON format for the answer suggests the task might be part of an automated assessment or experiment. The numbered boxes in the second board are likely to indicate the order of the taps. The question asks to identify the sequence of taps based on the numbered boxes. The options provided suggest that the correct answer is likely to be one of the sequences listed.
</details>
```
```
Prompt 32: Corsi block tapping (vision)
```
USER: You are playing the array addition game. You have to add two arrays by following certain rules. Each array location can be empty (i.e., fully white) or filled with colored circles. Empty locations represent zeros. The colors of the circles mean specific things.
* Blue circle is a one
* Red circle is a distraction and must be ignored (i.e., it does not contribute to the array addition)
* White circle is a two
Array addition works as follows:
* sum of zeros must be a zero (i.e., an empty array cell)
* sum of one and zero (or zero and one) must be one (i.e., a blue circle)
* sum of one and one must be two (i.e., a white circle)
Here is the first array.
<IMAGE OF ARRAY 1>
Here is the second array.
<IMAGE OF ARRAY 2>
What is the sum of the two arrays? Pick from one of these four choices.
Choice 1
<IMAGE OF CHOICE 1>
Choice 2
<IMAGE OF CHOICE 2>
Choice 3
<IMAGE OF CHOICE 3>
Choice 4
<IMAGE OF CHOICE 4>
Think step by step. Then answer your question in the following json format.
```
{
"answer": <fill in one of 1/2/3/4 integer value>
}
```
```
Prompt 33: Spatial addition (vision)
```
```
Prompt 34: Spatial addition (text)
## Prompt 35: Cambridge spatial working memory (vision)
USER: You are playing the Cambridge Spatial Working Memory game. You will be shown a screen with blue boxes. A treasure is hidden in one of the blue boxes. You must identify the box containing the treasure, which is shown as an yellow square. Once you find a treasure, it will be collected and placed in the 'Treasures collected' section shown below the image. A new treasure will be hidden in one of the other boxes where the treasure did not appear before. You must again find the new treasure. This process is repeated till you find all treasures placed in each of the blue boxes once. Note: The treasure will never appear in a box where it had already been placed. Each turn, there are randomly selected numbers associated with each box. These numbers are meant to aid you with communication, i.e., specify what box you want to open in that turn. However, these numbers will change after every turn. So do NOT associate boxes with numbers over the long term. The number identity of a box can change any time. Therefore, you must remember the boxes based on their spatial positions and not the numbers.
## RESPONSE FORMAT:
Think step-by-step about where the treasure might be based on your past actions. After that, indicate the box you want to open in the following json format:
```
```
{
"action": <box integer index>
}
```
```
## ASSISTANT: ...
USER: Here is the current state of the game. You must find the next treasure. Note that the numbers of the boxes have changed, but the box locations are fixed. Decide which box you want to open next, and then use the number associated with the box as the action.
```
<IMG ALIGN=TOP WIDTH=100 HEIGHT=0>
ASSISTANT: ...
```
## Prompt 36: Cambridge spatial working memory (text)
USER: You are playing the Cambridge Spatial Working Memory game. You will be shown an array with integers. 0 represents empty locations. Locations numbered 1 - 9 represent boxes. A treasure is hidden in one of the boxes. You must identify the box containing the treasure. Once you find a treasure, the location will be momentarily shown as a 'T' indicating that the treasure was found. The treasure is then collected and a new treasure will be hidden in one of the other boxes where the treasure did not appear before. You must then find the new treasure. This process is repeated till you find all treasures placed in each of the boxes once. Note: The treasure will never appear in a box where it had already been placed.
While the boxes are represented using integers from 1 - 9, the true identity of the box is its location (row, column) in the array. The box location is always fixed (i.e., the boxes will not move and the number of boxes will not change). However, each turn, the integer id associated with the box will change randomly. These integer ids are meant to aid you with communication, i.e., specify what box you want to open in that turn. However, these numbers will change after every turn. So do NOT associate boxes with numbers over the long term. The number identity of a box can change any time. Therefore, you must remember the boxes based on their spatial positions and not the numbers.
## RESPONSE FORMAT:
Think step-by-step about where the treasure might be based on your past actions. After that, indicate the box you want to open in the following json format:
```
```
{
"action": <box integer index>
}
```
```
## ASSISTANT: ...
USER: Here is the current view of the board. You must find the next treasure. Note that the numbers of the boxes have changed, but the box locations are fixed. Decide which box location you want to open next. Then provide the number associated with the box as the action.
```
0, 0, 0, 0, 0, 0, 0, 0, 0, 0, 0, 0, 3, 0,
0, 0, 0, 0, 0, 0, 0, 0, 0, 1, 0, 0, 0, 0, 0,
0, 0, 0, 0, 0, 0, 0, 0, 0, 0, 0, 0, 0, 0, 0,
0, 0, 0, 0, 0, 0, 0, 0, 0, 0, 0, 0, 0, 0, 0,
0, 0, 0, 0, 2, 0, 0, 0, 0
```
```
Number of treasures collected: 0 / 3
```