# Paths-over-Graph: Knowledge Graph Empowered Large Language Model Reasoning
**Authors**: Xingyu Tan, Xiaoyang Wang, Qing Liu, Xiwei Xu, Xin Yuan, Wenjie Zhang
> 0009-0000-7232-7051 University of New South Wales Data61, CSIRO Sydney Australia
> 0000-0003-3554-3219 University of New South Wales Sydney Australia
> 0000-0001-7895-9551 Data61, CSIRO Sydney Australia
> 0000-0002-2273-1862 Data61, CSIRO Sydney Australia
> 0000-0002-9167-1613 Data61, CSIRO Sydney Australia
> 0000-0001-6572-2600 University of New South Wales Sydney Australia
(2025)
## Abstract
Large Language Models (LLMs) have achieved impressive results in various tasks but struggle with hallucination problems and lack of relevant knowledge, especially in deep complex reasoning and knowledge-intensive tasks. Knowledge Graphs (KGs), which capture vast amounts of facts in a structured format, offer a reliable source of knowledge for reasoning. However, existing KG-based LLM reasoning methods face challenges like handling multi-hop reasoning, multi-entity questions, and effectively utilizing graph structures. To address these issues, we propose Paths-over-Graph (PoG), a novel method that enhances LLM reasoning by integrating knowledge reasoning paths from KGs, improving the interpretability and faithfulness of LLM outputs. PoG tackles multi-hop and multi-entity questions through a three-phase dynamic multi-hop path exploration, which combines the inherent knowledge of LLMs with factual knowledge from KGs. In order to improve the efficiency, PoG prunes irrelevant information from the graph exploration first and introduces efficient three-step pruning techniques that incorporate graph structures, LLM prompting, and a pre-trained language model (e.g., SBERT) to effectively narrow down the explored candidate paths. This ensures all reasoning paths contain highly relevant information captured from KGs, making the reasoning faithful and interpretable in problem-solving. PoG innovatively utilizes graph structure to prune the irrelevant noise and represents the first method to implement multi-entity deep path detection on KGs for LLM reasoning tasks. Comprehensive experiments on five benchmark KGQA datasets demonstrate PoG outperforms the state-of-the-art method ToG across GPT-3.5-Turbo and GPT-4, achieving an average accuracy improvement of 18.9%. Notably, PoG with GPT-3.5-Turbo surpasses ToG with GPT-4 by up to 23.9%.
Large Language Models; Knowledge Graph; Knowledge Graph Question Answering; Retrieval-Augmented Generation journalyear: 2025 copyright: acmlicensed conference: Proceedings of the ACM Web Conference 2025; April 28-May 2, 2025; Sydney, NSW, Australia booktitle: Proceedings of the ACM Web Conference 2025 (WWW ’25), April 28-May 2, 2025, Sydney, NSW, Australia doi: 10.1145/3696410.3714892 isbn: 979-8-4007-1274-6/25/04 ccs: Information systems Question answering
## 1. Introduction
<details>
<summary>x1.png Details</summary>
### Visual Description
## Diagram: Multi-stage Reasoning Process for Answering a Knowledge-based Question
### Overview
This diagram illustrates a multi-stage process for answering a complex question using Large Language Models (LLMs) and Knowledge Graphs (KGs). It depicts three distinct approaches or stages, each with its own methodology and outcome, ultimately leading to a correct answer through a refined reasoning path. The question being addressed is: "What country bordering France contains an airport that serves Nijmegen?".
### Components/Axes
The diagram is segmented into four main sections, labeled (a), (b), (c), and (d), representing different stages or approaches.
**Section (a): GPT-3.5/GPT-4 LLM only**
* **Question:** "What country bordering France contains an airport that serves Nijmegen?"
* **Input:** "GPT-3.5/GPT-4 LLM only" (represented by a yellow box).
* **Process:** A question mark icon connected to an LLM logo (representing a generative AI model).
* **Output:** A pink box containing "Belgium" and a red cross icon, indicating an incorrect answer.
* **Explanation Text:** "(Chain of Thoughts prompt): Let's go step by step. Response: Nijmegen is served by airports in the neighboring countries, and one of the closest major ones is Brussels Airport (BRU) in Belgium, which is relatively near Nijmegen compared to other major airports. The answer is Belgium."
**Section (b): LLM empowered KG exploration search**
* **Input:** "LLM empowered KG exploration search" (represented by a light green box).
* **Entities:** "France" and "Nijmegen" (represented by white boxes).
* **Process:** An icon representing a knowledge graph (interconnected nodes and edges) combined with an LLM logo, leading to "KG Triples".
* **Output:** A pink box containing "Netherlands" and a red cross icon, indicating an incorrect answer.
* **Explanation Text:** "(ToG): Exlporated triples: [France, location.containedby, Europe], [France, location.location.containedby, Western Europe], [France, location.location.geolocation, Unnamed Entity], [Nijmegen, second_level_division, Netherland]. Answering: First, Nijmegen is a city in the Netherlands. Second, the Netherlands is a country bordering France. The answer is {Netherlands}"
**Section (c): LLM empowered KG subgraph answering (MindMap)**
* **Input:** "LLM empowered KG subgraph answering" (represented by a light purple box).
* **Process:** A question mark icon, a knowledge graph icon, and an LLM logo, leading to a document icon and a knowledge graph icon.
* **Output:** A pink box containing "Refuse to answering" and a red cross icon, indicating a refusal to answer.
* **Explanation Text:** "(MindMap): MindMap cannot prompt LLM to construct a graph and generate the graph descript document since the retrieved subgraph is extremely large and dense."
**Section (d): PoG (Path of Graph) Reasoning**
* **Header:** "PoG" (represented by a light blue box).
* **Stage 1: Subgraph Detection:** A question mark icon leading to multiple small knowledge graph icons, then to a larger, more complex knowledge graph icon.
* **Stage 2: Question Analysis:** A question mark icon connected to an LLM logo, leading to a question mark icon.
* **Stage 3: Reasoning Path Exploration:** A list of black horizontal bars, followed by an LLM logo, leading to a more structured list of black horizontal bars.
* **Stage 4: Reasoning Path Pruning:** The structured list of bars, followed by an LLM logo, leading to a green box containing "Germany" and a green checkmark icon, indicating a correct answer.
* **Reasoning Paths Text:**
* "Nijmegen nearby Weeze Airport contain by Germany continent Europ, Western Europ contain France"
* "Nijmegen nearby Weeze Airport contain by Germany adjoining Unnamed Entity adjoining France"
* **Response Text:** "Response: From the provided knowledge graph path contains an airport serving Nijmegen and is also the country bordering France. Therefore, the answer to the main question \"What country bordering France contains an airport that serves Nijmegen?\" is {Germany}."
### Detailed Analysis or Content Details
**Section (a): Direct LLM Response**
* The LLM, without explicit KG integration or step-by-step reasoning guidance, incorrectly identifies Belgium.
* The reasoning provided focuses on proximity of Brussels Airport to Nijmegen, but fails to consider the "bordering France" constraint.
**Section (b): KG Exploration with Triples**
* This stage attempts to use KG triples extracted from an LLM exploration.
* The extracted triples are: `[France, location.containedby, Europe]`, `[France, location.location.containedby, Western Europe]`, `[France, location.location.geolocation, Unnamed Entity]`, `[Nijmegen, second_level_division, Netherland]`.
* The LLM's interpretation of these triples leads to the conclusion that Nijmegen is in the Netherlands, which borders France, thus incorrectly identifying the Netherlands as the answer. This misses the crucial "airport serving Nijmegen" aspect in relation to the bordering country.
**Section (c): KG Subgraph Answering (MindMap)**
* This approach involves constructing a graph from a retrieved subgraph.
* The process is halted because the retrieved subgraph is too large and dense for the LLM to effectively process and generate a descriptive document. This leads to a refusal to answer.
**Section (d): PoG Reasoning**
* This is presented as the successful approach.
* **Subgraph Detection:** Identifies relevant subgraphs from the KG.
* **Question Analysis:** The LLM analyzes the question.
* **Reasoning Path Exploration:** The LLM explores potential reasoning paths. The visual representation shows an initial broad exploration (many bars) followed by a more focused exploration (fewer bars).
* **Reasoning Path Pruning:** The LLM refines and prunes the reasoning paths to arrive at the most logical conclusion.
* **Reasoning Paths:**
* Path 1: Nijmegen -> nearby -> Weeze Airport -> contain by -> Germany -> continent -> Europ, Western Europ -> contain -> France.
* Path 2: Nijmegen -> nearby -> Weeze Airport -> contain by -> Germany -> adjoining -> Unnamed Entity -> adjoining -> France.
* **Final Response:** The system correctly identifies Germany. The reasoning states that the knowledge graph path indicates an airport serving Nijmegen (Weeze Airport) is in Germany, and Germany is a country bordering France.
### Key Observations
* **Progressive Refinement:** The diagram shows a progression from simpler, less effective methods (direct LLM, basic KG triples) to a more sophisticated reasoning process (PoG) that yields the correct answer.
* **Importance of KG Structure:** The failure in section (c) highlights the challenges of handling large and dense knowledge graph subgraphs.
* **Multi-hop Reasoning:** The successful PoG method demonstrates the ability to perform multi-hop reasoning, connecting Nijmegen to an airport, the airport to a country (Germany), and then establishing Germany's relationship with France.
* **Constraint Satisfaction:** The correct answer in (d) successfully satisfies all constraints of the question: "country bordering France" AND "contains an airport that serves Nijmegen".
### Interpretation
This diagram effectively illustrates the challenges and evolution of answering complex, knowledge-intensive questions using AI.
* **Direct LLM limitations:** Section (a) shows that a direct LLM response, even with a "chain of thought" prompt, can be superficial and miss critical constraints, leading to incorrect answers. The LLM prioritizes proximity over geographical relationships.
* **KG Triple limitations:** Section (b) demonstrates that while KG triples provide structured data, their interpretation by an LLM can still be flawed if the reasoning path is not robust enough to connect all pieces of information and satisfy all question constraints. The LLM correctly identifies Nijmegen is in the Netherlands, but fails to link this to the "airport serving Nijmegen" and "bordering France" constraints simultaneously.
* **Scalability Issues:** Section (c) points to practical limitations in applying LLMs to very large and complex knowledge graph structures, suggesting a need for efficient subgraph retrieval and processing mechanisms.
* **The Power of Structured Reasoning:** Section (d) highlights the effectiveness of a structured reasoning process, termed "PoG" (Path of Graph), which involves explicit steps like subgraph detection, question analysis, and reasoning path exploration/pruning. This approach allows the AI to systematically build a logical connection between entities and satisfy all conditions of the question. The explicit identification of Weeze Airport in Germany, and Germany's adjacency to France, is the key to the correct answer. This method moves beyond simple information retrieval to genuine inferential reasoning.
In essence, the diagram argues that for complex questions requiring the integration of multiple pieces of information and geographical/relational constraints, a structured, multi-stage reasoning process that leverages knowledge graphs is superior to direct LLM responses or simpler KG triple extraction. The PoG method, by breaking down the problem and systematically exploring and pruning reasoning paths, achieves a more accurate and robust answer.
</details>
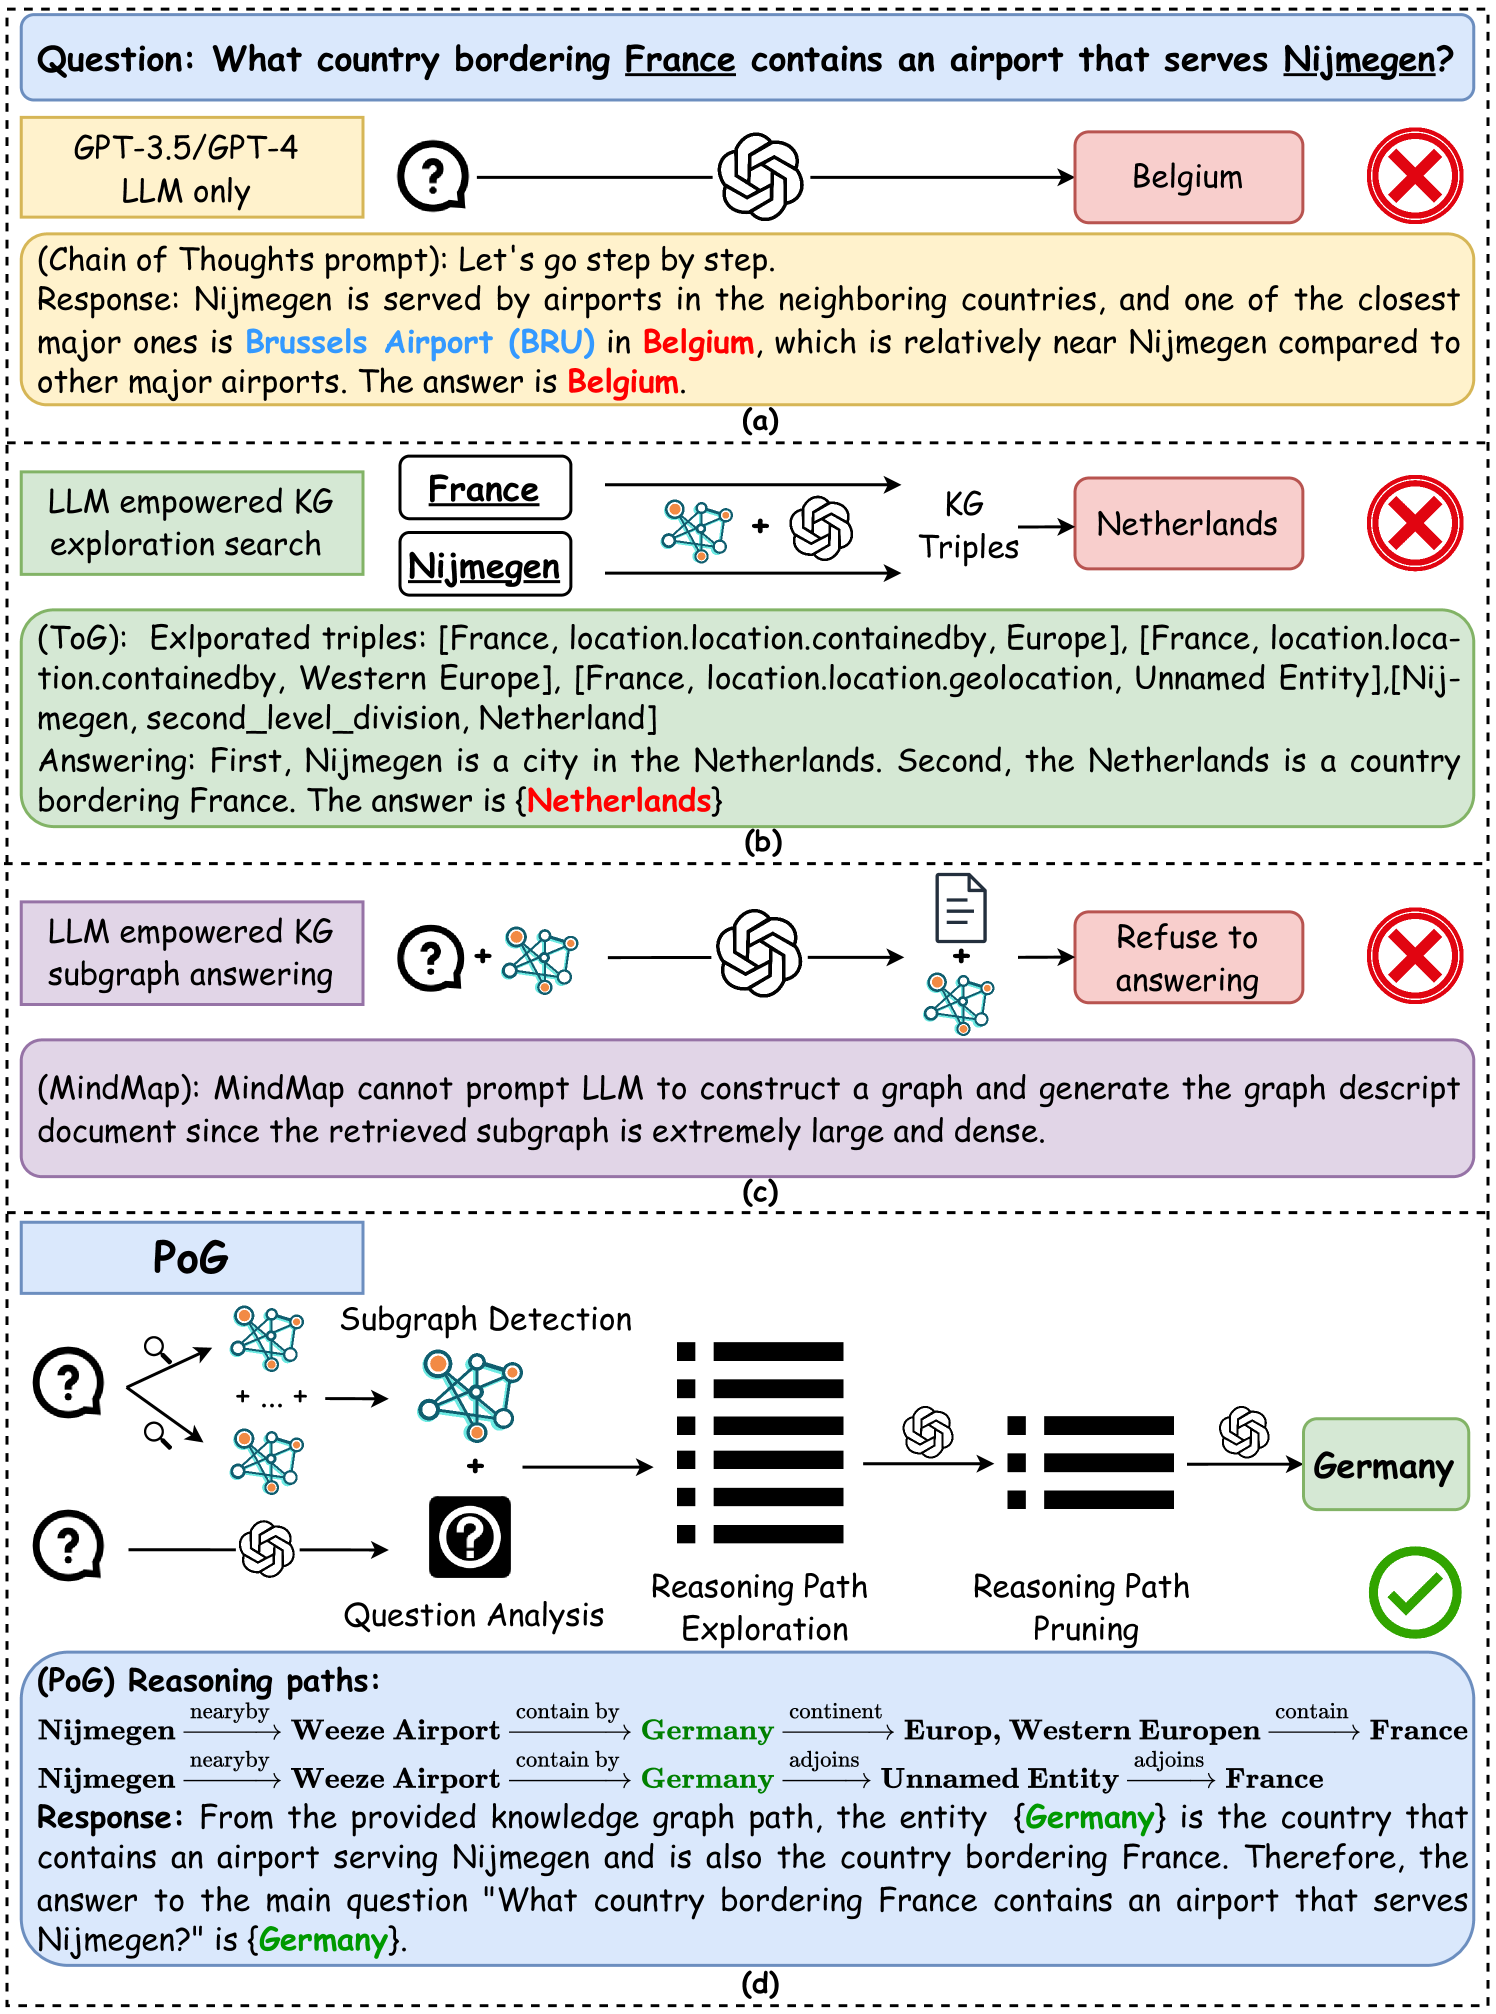
Figure 1. Representative workflow of four LLM reasoning paradigms.
Large Language Models (LLMs) have demonstrated remarkable performance in various tasks (Brown, 2020; Chowdhery et al., 2023; Touvron et al., 2023; Besta et al., 2024; Huang et al., 2025). These models leverage pre-training techniques by scaling to billions of parameters and training on extensive, diverse, and unlabelled data (Touvron et al., 2023; Rawte et al., 2023). Despite these impressive capabilities, LLMs face two well-known challenges. First, they struggle with deep and responsible reasoning when tackling complex tasks (Petroni et al., 2020; Talmor et al., 2018; Khot et al., 2022). Second, the substantial cost of training makes it difficult to keep models updated with the latest knowledge (Sun et al., 2024; Wen et al., 2024), leading to errors when answering questions that require specialized information not included in their training data. For example, in Figure 1 (a), though models like GPT can generate reasonable answers for knowledge-specific questions, these answers may be incorrect due to outdated information or hallucination of reasoning on LLM inherent Knowledge Base (KB).
To deal with the problems of error reasoning and knowledge gaps, the plan-retrieval-answering method has been proposed (Luo et al., 2024; Zhao et al., 2023; Li et al., 2023b). In this approach, LLMs are prompted to decompose complex reasoning tasks into a series of sub-tasks, forming a plan. Simultaneously, external KBs are retrieved to answer each step of the plan. However, this method still has the issue of heavily relying on the reasoning abilities of LLMs rather than the faithfulness of the retrieved knowledge. The generated reasoning steps guide information selection, but answers are chosen based on the LLM’s interpretation of the retrieved knowledge rather than on whether the selection leads to a correct and faithful answer.
To address these challenges, incorporating external knowledge sources like Knowledge Graphs (KGs) is a promising solution to enhance LLM reasoning (Sun et al., 2024; Luo et al., 2024; Pan et al., 2024; Luo et al., 2023). KGs offer abundant factual knowledge in a structured format, serving as a reliable source to improve LLM capabilities. Knowledge Graph Question Answering (KGQA) serves as an approach for evaluating the integration of KGs with LLMs, which requires machines to answer natural language questions by retrieving relevant facts from KGs. These approaches typically involve: (1) identifying the initial entities from the question, and (2) iteratively retrieving and refining inference paths until sufficient evidence has been obtained. Despite their success, they still face challenges such as handling multi-hop reasoning problems, addressing questions with multiple topic entities, and effectively utilizing the structural information of graphs.
Challenge 1: Multi-hop reasoning problem. Current methods (Guo et al., 2024; Ye et al., 2021; Sun et al., 2024; Ma et al., 2024), such as the ToG model presented in Figure 1 (b), begin by exploring from each topic entity, with LLMs selecting connected knowledge triples like (France, contained_by, Europe). This process relies on the LLM’s inherent understanding of these triples. However, focusing on one-hop neighbors can result in plausible but incorrect answers and prematurely exclude correct ones, especially when multi-hop reasoning is required. Additionally, multi-hop reasoning introduces significant computational overhead, making efficient pruning essential, especially in dense and large KGs.
Challenge 2: Multi-entity question. As shown in Figure 1 (b), existing work (Guo et al., 2024; Ye et al., 2021; Sun et al., 2024; Ma et al., 2024) typically explores KG for each topic entity independently. When a question involves multiple entities, these entities are examined in separate steps without considering their interconnections. This approach can result in a large amount of irrelevant information in the candidate set that does not connect to the other entities in the question, leading to suboptimal results.
Challenge 3: Utilizing graph structure. Existing methods (Wen et al., 2024; Guo et al., 2023; Chen et al., 2024) often overlook the inherent graph structures when processing retrieved subgraphs. For example, the MindMap model in Figure 1 (c) utilizes LLMs to generate text-formatted subgraphs from KG triples, converting them into graph descriptions that are fed back into the LLM to produce answers. This textual approach overlooks the inherent structural information of graphs and can overwhelm the LLM when dealing with large graphs. Additionally, during KG information selection, most methods use in-context learning by feeding triples into the LLM, ignoring the overall graph structure.
Contributions. In this paper, we introduce a novel method, P aths- o ver- G raph (PoG). Unlike previous studies that utilize knowledge triples for retrieval (Sun et al., 2024; Ma et al., 2024), PoG employs knowledge reasoning paths, that contain all the topic entities in a long reasoning length, as a retrieval-augmented input for LLMs. The paths in KGs serve as logical reasoning chains, providing KG-supported, interpretable reasoning logic that addresses issues related to the lack of specific knowledge background and unfaithful reasoning paths.
To address multi-hop reasoning problem, as shown in Figure 1 (d), PoG first performs question analysis, to extract topic entities from questions. Utilizing these topic entities, it decomposes the complex question into sub-questions and generates an LLM thinking indicator termed "Planning". This planning not only serves as an answering strategy but also predicts the implied relationship depths between the answer and each topic entity. The multi-hop paths are then explored starting from a predicted depth, enabling a dynamic search process. Previous approaches using planning usually retrieve information from scratch, which often confuses LLMs with source neighborhood-based semantic information. In contrast, our method ensures that LLMs follow accurate reasoning paths that directly lead to the answer.
To address multi-entity questions, PoG employs a three-phase exploration process to traverse reasoning paths from the retrieved question subgraph. All paths must contain all topic entities in the same order as they occur in the LLM thinking indicator. In terms of reasoning paths in KGs, all paths are inherently logical and faithful. Each path potentially contains one possible answer and serves as the interpretable reasoning logic. The exploration leverages the inherent knowledge of both LLM and KG.
To effectively utilize graph structure, PoG captures the question subgraph by expanding topic entities to their maximal depth neighbors, applying graph clustering and reduction to reduce graph search costs. In the path pruning phase, we select possible correct answers from numerous candidates. All explored paths undergo a three-step beam search pruning, integrating graph structures, LLM prompting, and a pre-trained language understanding model (e.g., BERT) to ensure effectiveness and efficiency. Additionally, inspired by the Graph of Thought (GoT) (Besta et al., 2024), to reduce LLM hallucination, PoG prompts LLMs to summarize the obtained Top- $W_{\max}$ paths before evaluating the answer, where $W_{\max}$ is a user-defined maximum width in the path pruning phase. In summary, the advantage of PoG can be abbreviated as:
- Dynamic deep search: Guided by LLMs, PoG dynamically extracts multi-hop reasoning paths from KGs, enhancing LLM capabilities in complex knowledge-intensive tasks.
- Interpretable and faithful reasoning: By utilizing highly question-relevant knowledge paths, PoG improves the interpretability of LLM reasoning, enhancing the faithfulness and question-relatedness of LLM-generated content.
- Efficient pruning with graph structure integration: PoG incorporates efficient pruning techniques in both the KG and reasoning paths to reduce computational costs, mitigate LLM hallucinations caused by irrelevant noise, and effectively narrow down candidate answers.
- Flexibility and effectiveness: a) PoG is a plug-and-play framework that can be seamlessly applied to various LLMs and KGs. b) PoG allows frequent knowledge updates via the KG, avoiding the expensive and slow updates required for LLMs. c) PoG reduces the LLMs token usage by over 50% with only a ±2% difference in accuracy compared to the best-performing strategy. d) PoG achieves state-of-the-art results on all the tested KGQA datasets, outperforming the strong baseline ToG by an average of 18.9% accuracy using both GPT-3.5 and GPT-4. Notably, PoG with GPT-3.5 can outperform ToG with GPT-4 by up to 23.9%.
## 2. Related Work
KG-based LLM reasoning. KGs provide structured knowledge valuable for integration with LLMs (Pan et al., 2024). Early studies (Peters et al., 2019; Luo et al., 2024; Zhang et al., 2021; Li et al., 2023b) embed KG knowledge into neural networks during pre-training or fine-tuning, but this can reduce explainability and hinder efficient knowledge updating (Pan et al., 2024). Recent methods combine KGs with LLMs by converting relevant knowledge into textual prompts, often ignoring structural information (Pan et al., 2024; Wen et al., 2024). Advanced works (Sun et al., 2024; Jiang et al., 2023; Ma et al., 2024) involve LLMs directly exploring KGs, starting from an initial entity and iteratively retrieving and refining reasoning paths until the LLM decides the augmented knowledge is sufficient. However, by starting from a single vertex and ignoring the question’s position within the KG’s structure, these methods overlook multiple topic entities and the explainability provided by multi-entity paths.
Reasoning with LLM prompting. LLMs have shown significant potential in solving complex tasks through effective prompting strategies. Chain of Thought (CoT) prompting (Wei et al., 2022) enhances reasoning by following logical steps in few-shot learning. Extensions like Auto-CoT (Zhang et al., 2023), Complex-CoT (Fu et al., 2022), CoT-SC (Wang et al., 2022), Zero-Shot CoT (Kojima et al., 2022), ToT (Yao et al., 2024), and GoT (Besta et al., 2024) build upon this approach. However, these methods often rely solely on knowledge present in training data, limiting their ability to handle knowledge-intensive or deep reasoning tasks. To solve this, some studies integrate external KBs using plan-and-retrieval methods such as CoK (Li et al., 2023b), RoG (Luo et al., 2024), and ReAct (Yao et al., 2022), decomposing complex questions into subtasks to reduce hallucinations. However, they may focus on the initial steps of sub-problems and overlook further steps of final answers, leading to locally optimal solutions instead of globally optimal ones. To address these deep reasoning challenges, we introduce dynamic multi-hop question reasoning. By adaptively determining reasoning depths for different questions, we enable the model to handle varying complexities effectively.
KG information pruning. Graphs are widely used to model complex relationships among different entities (Tan et al., 2023; Sima et al., 2024; Li et al., 2024b, a). KGs contain vast amounts of facts (Guo et al., 2019; Wu et al., 2024; Wang et al., 2024a), making it impractical to involve all relevant triples in the context of the LLM due to high costs and potential noise (Wang et al., 2024b). Existing methods (Sun et al., 2024; Jiang et al., 2023; Ma et al., 2024) typically identify initial entities and iteratively retrieve reasoning paths until an answer is reached, often treating the LLM as a function executor and relying on in-context learning or fine-tuning, which is expensive. Some works attempt to reduce pruning costs. KAPING (Baek et al., 2023a) projects questions and triples into the same semantic space to retrieve relevant knowledge via similarity measures. KG-GPT (Kim et al., 2023) decomposes complex questions, matches, and selects the relevant relations with sub-questions to form evidence triples. However, these methods often overlook the overall graph structure and the interrelations among multiple topic entities, leading to suboptimal pruning and reasoning performance.
<details>
<summary>x2.png Details</summary>
### Visual Description
## Diagram: Knowledge Graph Question Answering System
### Overview
This diagram illustrates a system designed to answer questions by leveraging a knowledge graph. The system comprises three main stages: Initialization, Exploration, and Question Answering. The Initialization stage processes the input question to identify key entities and structure. The Exploration stage navigates and expands paths within the knowledge graph based on the identified entities. Finally, the Question Answering stage prunes and summarizes the explored paths to generate an answer.
### Components/Axes
The diagram is structured into distinct sections with labels and visual cues indicating flow and relationships.
**Main Knowledge Graph Section (Top-Left):**
This section depicts a knowledge graph with entities represented by nodes and relationships by directed edges.
* **Entities (Nodes):**
* **Red:** Nijmegen, Germany
* **Blue:** Weeze Airport, Public airport, Lyon-Saint Exupéry Airport, Europe, Western Europe
* **Gray:** Netherlands, Unnamed Entity, ..., 2000, 2002, 1924 Olympics, Kingdom of the Netherlands, Veghel, Strijen, Rhenen, Oostzaan, Central European Time Zone
* **Yellow:** France
* **White:** UnnamedEntity (appears twice)
* **Orange:** Ryanair, Wired
* **Relationships (Edges/Labels):**
* `second_level_division` (Netherlands -> Nijmegen)
* `nearby` (Nijmegen -> Weeze Airport)
* `location.administrative_division, containedby` (Nijmegen -> Kingdom of the Netherlands)
* `airport type` (Weeze Airport -> Public airport)
* `containedby` (Weeze Airport -> Germany)
* `containedby` (Kingdom of the Netherlands -> Europe, Western Europe)
* `country` (Kingdom of the Netherlands -> Veghel, Strijen, Rhenen, Oostzaan)
* `continent` (Germany -> Europe, Western Europe)
* `time zones` (Veghel, Strijen, Rhenen, Oostzaan -> Central European Time Zone)
* `user.topics` (Ryanair -> Wired)
* `airports of this type` (Public airport -> Lyon-Saint Exupéry Airport)
* `containedby` (Lyon-Saint Exupéry Airport -> France)
* `adjoin_s` (Germany -> UnnamedEntity)
* `contain` (UnnamedEntity -> France)
* `in_this_time_zone` (Europe, Western Europe -> Central European Time Zone)
* `participating countries` (2000, 2002, 1924 Olympics -> France)
* `athlete. affiliation` (Unnamed Entity, ... -> 2000, 2002, 1924 Olympics)
* `olympic. athletes` (Netherlands -> Unnamed Entity, ...)
**Initialization Section (Top-Right):**
This section outlines the initial steps of processing a question.
* **Question Box (Purple):** Contains the example question: "What country bordering France contains an airport that serves Nijmegen?"
* **Topic Entity Recognition (Yellow Box):** A process step.
* **Question Subgraph Detection (Light Blue Box):** A process step, visually represented by a small graph.
* **Split Questions, LLM indicator, Ordered Entities (Green Box):** A process step, indicated by a stylized "G" logo (likely representing a Large Language Model).
**Exploration Section (Middle-Right):**
This section details different path exploration strategies within the knowledge graph. Each sub-section shows a simplified graph representation with nodes colored red, green, blue, and yellow, indicating different stages or types of nodes.
* **Topic Entity Path Exploration:** Shows an initial path exploration.
* **LLM Supplement Path Exploration:** Shows an expanded path exploration, with additional green nodes.
* **Node Expand Exploration:** Shows further expansion of paths with more gray nodes.
**Question Answering Section (Bottom):**
This section describes the final stages of generating an answer.
* **Fuzzy Selection (Yellow Box):** Takes an `Indicator` (H_I) and `Paths_Set` (H_Path) as input and produces a simplified graph.
* **Precise Path Selection (Green Box):** Takes multiple paths and selects a subset, visualized as a branching structure.
* **Branch Reduced Selection (Green Box):** Further refines the selected paths.
* **Path Pruning (Label below Precise/Branch Reduced):** A general label for the selection processes.
* **Path Summarizing (Yellow Box):** Takes the pruned paths and summarizes them.
* **Decision Point (Stylized "G" logo):** Represents a decision based on the summarized path.
* **"No" branch:** Leads back to the "Split Questions, LLM indicator, Ordered Entities" step.
* **"Yes!" branch:** Leads to the "Answer" box.
* **Answer Box (Green):** The final output.
### Detailed Analysis or Content Details
**Knowledge Graph Structure:**
The knowledge graph connects various entities related to geography, transportation, and events.
* **Nijmegen** is a location that has `nearby` airports, specifically **Weeze Airport**.
* **Weeze Airport** is a `Public airport` and is `containedby` **Germany**.
* **Germany** is on the `continent` of **Europe, Western Europe**.
* **Nijmegen** is also `location.administrative_division, containedby` the **Kingdom of the Netherlands**.
* The **Kingdom of the Netherlands** is a `country` within **Europe, Western Europe**.
* **Veghel, Strijen, Rhenen, Oostzaan** are locations within the **Kingdom of the Netherlands** and are associated with `time zones` that fall under the **Central European Time Zone**.
* **Ryanair** is an airline that has `user.topics` related to **Wired**.
* **Public airports** are of the type that includes **Lyon-Saint Exupéry Airport**.
* **Lyon-Saint Exupéry Airport** is `containedby` **France**.
* **Germany** `adjoin_s` an `UnnamedEntity`, which `contain`s **France**.
* **Europe, Western Europe** is `in_this_time_zone` as the **Central European Time Zone**.
* The **Netherlands** has `olympic. athletes` associated with an `Unnamed Entity, ...`, which has an `athlete. affiliation` with the **2000, 2002, 1924 Olympics**.
* The **2000, 2002, 1924 Olympics** had `participating countries` including **France**.
**Question Answering Flow:**
1. **Initialization:** The question "What country bordering France contains an airport that serves Nijmegen?" is processed. `Topic Entity Recognition` identifies "France" and "Nijmegen". `Question Subgraph Detection` likely extracts a subgraph relevant to these entities and their relationships. The output is `Split Questions, LLM indicator, Ordered Entities`.
2. **Exploration:** The system performs path exploration in the knowledge graph.
* `Topic Entity Path Exploration` finds initial paths.
* `LLM Supplement Path Exploration` uses an LLM to find additional relevant paths.
* `Node Expand Exploration` further expands these paths.
3. **Question Answering:**
* `Fuzzy Selection` and `Precise Path Selection` (including `Branch Reduced Selection` and `Path Pruning`) are applied to filter and refine the explored paths.
* `Path Summarizing` condenses the relevant paths into a concise representation.
* A final decision is made (likely by an LLM, indicated by the "G" logo). If the summarized path leads to a valid answer ("Yes!"), the `Answer` is generated. If not ("No"), the process might loop back to refine the question or exploration.
### Key Observations
* The system aims to answer complex relational questions by traversing a knowledge graph.
* It utilizes different exploration strategies, including LLM-assisted path finding, to cover potential answer paths.
* A multi-stage pruning and selection process is employed to refine the relevant information from the explored paths.
* The example question demonstrates a query requiring the identification of a country bordering France that has an airport serving Nijmegen. This implies a need to connect Nijmegen to its airports, identify the country of those airports, and then check for adjacency to France.
* The use of different colored nodes in the exploration diagrams suggests a hierarchical or type-based distinction of entities or path segments during exploration.
### Interpretation
This diagram outlines a sophisticated question-answering system that bridges natural language queries with structured knowledge graph data. The system's strength lies in its ability to decompose a complex question into manageable steps: identifying key entities, exploring relevant connections within the knowledge graph using both structured and LLM-based methods, and then rigorously filtering and summarizing these connections to arrive at a precise answer.
The `Initialization` phase highlights the critical role of Natural Language Processing (NLP) and Large Language Models (LLMs) in understanding the user's intent and extracting the core components of the question. The `Exploration` phase demonstrates a systematic approach to graph traversal, where multiple strategies are employed to ensure comprehensive coverage of potential answer paths. The inclusion of "LLM Supplement Path Exploration" suggests an adaptive system that can leverage the generative capabilities of LLMs to discover relationships not explicitly encoded in traditional graph traversal algorithms.
The `Question Answering` section, particularly `Path Pruning` and `Path Summarizing`, indicates a focus on efficiency and accuracy. By reducing the number of paths and then distilling them, the system aims to avoid information overload and present a clear, concise answer. The feedback loop ("No" branch) suggests an iterative refinement process, allowing the system to re-evaluate or re-query if an initial answer is not satisfactory or if the exploration was insufficient.
Ultimately, this system represents a hybrid approach, combining symbolic reasoning (knowledge graph traversal) with sub-symbolic reasoning (LLM integration) to tackle complex question-answering tasks. The example question, "What country bordering France contains an airport that serves Nijmegen?", is a good test case for such a system, requiring multi-hop reasoning and the integration of geographical and transportation-related information. The system's design suggests it can handle queries that involve identifying entities, their attributes, and their relationships across multiple levels of abstraction within the knowledge graph.
</details>
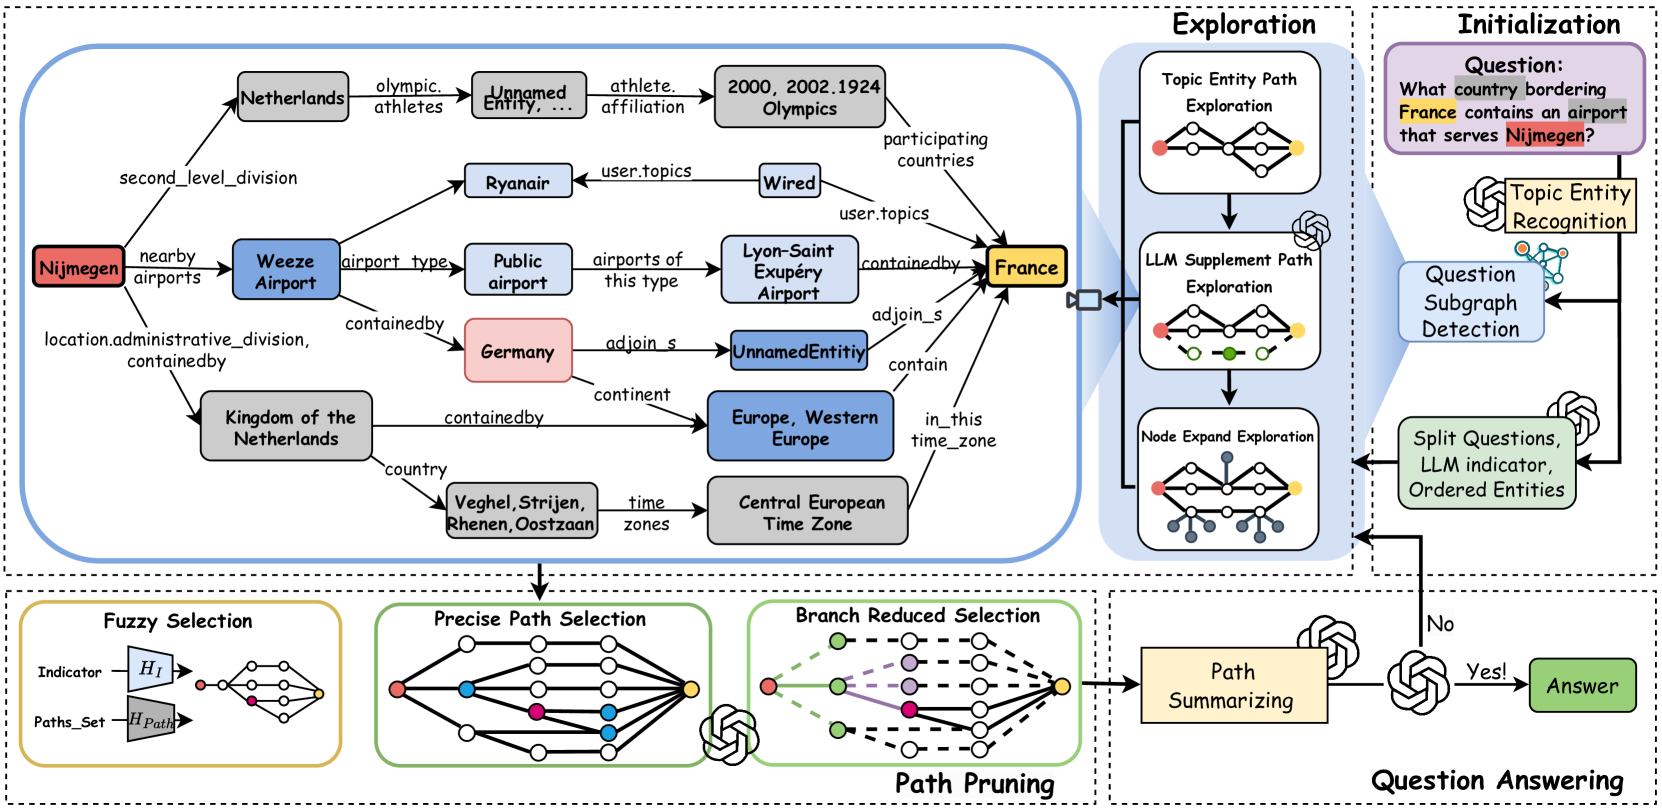
Figure 2. Overview of the PoG architecture. Exploration: After initialization (detailed in Figure 3), the model retrieves entity paths from $\mathcal{G}_{q}$ through three exploration phases. Path Pruning: PoG applies a three-step beam search to prune paths after each exploration phase. Question Answering: The pruned paths are then evaluated for question answering. If these paths do not fully answer the question, the model explores deeper paths until $D_{max}$ is reached or moves on to the next exploration phase.
## 3. Preliminary
Consider a Knowledge Graph (KG) $\mathcal{G(E,R,T)}$ , where $\mathcal{E}$ , $\mathcal{R}$ and $\mathcal{T}$ represent the set of entities, relations, and knowledge triples, respectively. Each knowledge triple $T\in\mathcal{T}$ encapsulates the factual knowledge in $\mathcal{G}$ , and is represented as $T=(e_{h},r,e_{t})$ , where $e_{h},e_{t}\in\mathcal{E}$ and $r\in\mathcal{R}$ . Given an entity set $\mathcal{E_{S}\subseteq E}$ , the induced subgraph of $\mathcal{E_{S}}$ is denoted as $\mathcal{S=(E_{S},R_{S},T_{S})}$ , where $\mathcal{T}_{S}=\{(e,r,e^{\prime})\in\mathcal{T}\mid e,e^{\prime}\in\mathcal{E }_{S}\}$ , and $\mathcal{R}_{S}=\{r\in\mathcal{R}\mid(e,r,e^{\prime})\in\mathcal{T}_{S}\}.$ Furthermore, we denote $\mathcal{D}(e)$ and $\mathcal{D}(r)$ as the sets of short textual descriptions for each entity $e\in\mathcal{E}$ and each relation $r\in\mathcal{R}$ , respectively. For example, the text description of the entity “m.0f8l9c” is $\mathcal{D}$ (“m.0f8l9c”)= “France”. For simplicity, in this paper, all entities and relations are referenced through their $\mathcal{D}$ representations and transformed into natural language.
** Definition 0 (Reasoning Path)**
*Given a KG $\mathcal{G}$ , a reasoning path within $\mathcal{G}$ is defined as a connected sequence of knowledge triples, represented as: $path_{\mathcal{G}}(e_{1},e_{l+1})=\{T_{1},T_{2},...,T_{l}\}=\{(e_{1},r_{1},e_{ 2}),(e_{2},r_{2},e_{3})$ $,...,(e_{l},r_{l},e_{l+1})\}$ , where $T_{i}\in\mathcal{T}$ denotes the $i$ -th triple in the path and $l$ denotes the length of the path, i.e., $length(path_{\mathcal{G}}(e_{1},e_{l+1}))=l$ .*
** Example 0**
*Consider a reasoning path between ”University” and ”Student” in KG: $path_{\mathcal{G}}(\text{University}$ , $\text{Student})$ $=\{(\text{University}$ , employs, $\text{Professor})$ , $(\text{Professor}$ , teaches, $\text{Course})$ , $(\text{Course}$ , enrolled_in, $\text{Student})\}$ , and can be visualized as:
$$
\text{University}\xrightarrow{\text{employs}}\text{Professor}\xrightarrow{
\text{teaches}}\text{Course}\xrightarrow{\text{enrolled\_in}}\text{Student}.
$$
It indicates that a “University” employs a “Professor,” who teaches a “Course,” in which a ”Student” is enrolled. The length of the path is 3.*
For any entity $s$ and $t$ in $\mathcal{G}$ , if there exists a reasoning path between $s$ and $t$ , we say $s$ and $t$ can reach each other, denoted as $s\leftrightarrow t$ . The distance between $s$ and $t$ in $\mathcal{G}$ , denoted as $dist_{\mathcal{G}}(s,t)$ , is the shortest reasoning path distance between $s$ and $t$ . For the non-reachable vertices, their distance is infinite. Given a positive integer $h$ , the $h$ -hop neighbors of an entity $s$ in $\mathcal{G}$ is defined as $N_{\mathcal{G}}(s,h)=\{t\in\mathcal{E}|dist_{\mathcal{G}}(s,t)\leq h\}$ .
** Definition 0 (Entity Path)**
*Given a KG $\mathcal{G}$ and a list of entities $list_{e}$ = [ $e_{1},e_{2},e_{3},\ldots,e_{l}$ ], the entity path of $list_{e}$ is defined as a connected sequence of reasoning paths, which is denoted as $path_{\mathcal{G}}(list_{e})$ $=\{path_{\mathcal{G}}(e_{1},e_{2}),$ $path_{\mathcal{G}}(e_{2},e_{3}),\ldots,path_{\mathcal{G}}(e_{l-1},e_{l})\}=\{( e_{s},r,e_{t})$ $|(e_{s},r,e_{t})\in path_{\mathcal{G}}(e_{i},e_{i+1})\land 1\leq i<l\}$ .*
Knowledge Graph Question Answering (KGQA) is a fundamental reasoning task based on KGs. Given a natural language question $q$ and a KG $\mathcal{G}$ , the objective is to devise a function $f$ that predicts answers $a\in Answer(q)$ utilizing knowledge encapsulated in $\mathcal{G}$ , i.e., $a=f(q,\mathcal{G})$ . Consistent with previous research (Sun et al., 2019; Luo et al., 2024; Sun et al., 2024; Ma et al., 2024), we assume the topic entities $Topic(q)$ mentioned in $q$ and answer entities $Answer(q)$ in ground truth are linked to the corresponding entities in $\mathcal{G}$ , i.e., $Topic(q)\subseteq\mathcal{E}\text{ and }Answer(q)\subseteq\mathcal{E}$ .
## 4. Method
PoG implements the “KG-based LLM Reasoning” by first exploring all possible faithful reasoning paths and then collaborating with LLM to perform a 3-step beam search selection on the retrieved paths. Compared to previous approaches (Sun et al., 2024; Ma et al., 2024), our model focuses on providing more accurate and question-relevant retrieval-argument graph information. The framework of PoG is outlined in Figure 2, comprising four main components.
- Initialization. The process begins by identifying the set of topic entities from the question input, and then queries the source KG $\mathcal{G}$ by exploring up to $D_{\max}$ -hop from each topic entity to construct the evidence sub-graph $\mathcal{G}_{q}$ , where $D_{\max}$ is the user-defined maximum exploration depth. Subsequently, we prompt the LLM to analyze the question and generate an indicator that serves as a strategy for the answer formulation process and predicting the exploration depth $D_{\text{predict}}$ .
- Exploration. After initialization, the model retrieves topic entity paths from $\mathcal{G}_{q}$ through three exploration phases: topic entity path exploration, LLM supplement path exploration, and node expand exploration. All reasoning paths are constrained within the depth range $D\in[D_{\text{predict}},D_{\max}]$ .
- Path Pruning. Following each exploration phase, PoG employs a pre-trained LM, LLM prompting, and graph structural analysis to perform a three-step beam search. The pruned paths are then evaluated in the question answering.
- Question Answering. Finally, LLM is prompted to assess if the pruned reasoning paths sufficiently answer the question. If not, continue exploration with deeper paths incrementally until the $D_{\max}$ is exceeded or proceed to the next exploration phase.
<details>
<summary>x3.png Details</summary>
### Visual Description
## Diagram: Knowledge Graph Question Answering Pipeline
### Overview
This diagram illustrates a pipeline for answering complex questions using a knowledge graph. The process involves taking an input question, analyzing it to identify key entities and relationships, and then performing operations on a knowledge graph to extract relevant information. The pipeline outputs processed graph representations and potentially intermediate LLM outputs.
### Components/Axes
The diagram is structured into several distinct sections, each representing a stage in the pipeline:
**1. Input and Initial Processing:**
* **Input Arrow:** Labeled "Input:", pointing to a purple box.
* **Input Variables:** Below the "Input:" label, the variables "G, q, Dmax" are shown, representing the Knowledge Graph, the Question, and a maximum distance parameter, respectively.
* **Question Box (Purple):** Contains the text "Question:", followed by the question: "What country bordering France contains an airport that serves Nijmegen?". Key entities "France" and "Nijmegen" are highlighted with gray boxes.
* **LLM Symbol:** A stylized "S" symbol within a circle, indicating a Large Language Model (LLM) process. This symbol connects the Input Question to subsequent analysis.
* **Entity Extraction Box:** A box with a light purple background, listing:
* "Country" (Yellow highlight)
* "France" (Yellow highlight)
* "Airport" (No highlight)
* "Nijmegen" (Red highlight)
* **Relation/Feature Extraction:** Two boxes labeled "HG" and "HT" with arrows pointing to the right, suggesting extracted graph-based and text-based features, respectively.
**2. Question Analysis and LLM Indicator:**
* **LLM Indicator Box (Green):** Contains the label "LLM Indictor:" and a stylized "S" symbol within a circle.
* It shows a relationship: "Nijmegen" <- "serves" <- "airport" <- "own" <- "answer (country)".
* It also shows a relationship: "answer (country)" -> "borders" -> "France".
* **Split Question Output:** Below the LLM Indicator, two split questions are presented:
* "Split_question1: What country contains an airport that serves Nijmegen?"
* "Split_question2: What country borders France?"
* **Output 1 Arrow:** Labeled "Output1:", pointing left from the LLM Indicator box.
* **Output 1 Variables:** Below the "Output1:" label, the variables "I LLM, qsplit" are shown, likely representing LLM intermediate outputs and split questions.
**3. Knowledge Graph Visualization:**
* **Knowledge Graph (G) Symbol:** A small icon of a connected graph with orange and blue nodes, labeled "Knowledge Graph (G)".
* **Entity-Centric Views:** Two concentric circle diagrams are shown, representing proximity within the knowledge graph.
* **Left Circle (Yellow):** Centered around "France". It has dashed concentric circles indicating distance. A camera icon is positioned above and to the left, with a red gradient cone pointing towards the center. A variable "Dmax" is indicated as the maximum radius. A path within the graph is shown originating from "France".
* **Right Circle (Red):** Centered around "Nijmegen". Similar concentric dashed circles and a "Dmax" radius are shown. A camera icon is positioned above and to the right, with a red gradient cone pointing towards the center. A path within the graph is shown originating from "Nijmegen".
* **Combination Symbol:** A "+" symbol between the two circle diagrams, indicating their combination or interaction.
* **Arrow to Graph Detection:** A downward-pointing arrow originates from the combined entity-centric views, leading to the "Graph Detection" section.
**4. Graph Processing Stages (Bottom Row):**
These three boxes, arranged from right to left with arrows indicating flow, represent stages of graph processing.
* **Graph Detection Box (Light Blue, Rightmost):**
* **Title:** "Graph Detection"
* **Content:** A grid-like representation of nodes (white circles) connected by edges of various colors (black, blue, dark red, purple, green, light blue, pink, brown, light pink). A yellow node is present in the bottom-left quadrant, and a red node is present in the bottom-right quadrant.
* **Node and Relation Clustering Box (Light Blue, Middle):**
* **Title:** "Node and Relation Clustering"
* **Content:** Similar to "Graph Detection" but with some nodes and edges potentially grouped or highlighted differently. The yellow node is prominent in the center-left, and the red node is in the center-right. An orange node appears near the top. The connections and colors of edges are largely preserved but might be visually clustered.
* **Graph Reduction Box (Light Blue, Leftmost):**
* **Title:** "Graph Reduction"
* **Content:** A further processed graph. The yellow node is on the left, and the red node is on the right. The connections are simplified, and some nodes/edges might be removed or consolidated. An orange node is present in the top-middle.
* **Output 2 Arrow:** Labeled "Output2:", pointing left from the "Graph Reduction" box.
* **Output 2 Variable:** Below the "Output2:" label, the variable "Gq" is shown, likely representing the final processed query graph.
### Detailed Analysis or Content Details
* **Input Question:** The question "What country bordering France contains an airport that serves Nijmegen?" is a multi-hop question requiring the integration of information about countries, borders, airports, and services.
* **Entity Extraction:** The LLM identifies "France" as a "Country" and "Nijmegen" as an "Airport" (or related to an airport). This suggests the LLM is capable of recognizing entities and their types.
* **LLM Indicator Relationships:** The LLM indicator suggests it can infer relationships like "Nijmegen serves airport" and "answer (country) borders France". It also breaks down the original question into two sub-questions:
1. "What country contains an airport that serves Nijmegen?"
2. "What country borders France?"
This demonstrates a capability for question decomposition.
* **Knowledge Graph Visualization:** The concentric circles with "Dmax" indicate a focus on nodes within a certain distance from the target entities ("France" and "Nijmegen") in the knowledge graph. The camera icon and gradient suggest a "view" or "focus" mechanism, possibly related to graph traversal or attention.
* **Graph Processing Stages:**
* **Graph Detection:** This stage appears to identify relevant subgraphs or paths within the larger knowledge graph based on the query. The diverse edge colors suggest different types of relationships (e.g., "borders", "serves", "located_in").
* **Node and Relation Clustering:** This stage likely groups similar nodes or relationships to simplify the graph structure or highlight important clusters of information.
* **Graph Reduction:** This final stage aims to produce a concise and relevant subgraph (Gq) that directly addresses the decomposed questions, potentially removing redundant information.
### Key Observations
* The pipeline leverages an LLM for initial question understanding, entity/relation extraction, and question decomposition.
* It utilizes a knowledge graph (G) as the primary data source.
* The process involves focusing on entities and their local neighborhoods within the knowledge graph (indicated by Dmax and concentric circles).
* A multi-stage graph processing approach (Detection, Clustering, Reduction) is employed to refine the relevant information from the knowledge graph.
* The output is a processed graph representation (Gq) suitable for answering the original complex question.
### Interpretation
This diagram outlines a sophisticated approach to knowledge graph question answering, particularly for complex, multi-hop questions. The integration of an LLM at the initial stages is crucial for understanding natural language queries, identifying key entities, and breaking down complex questions into simpler, manageable sub-questions. This decomposition is a common strategy to overcome the limitations of directly querying complex knowledge graphs with natural language.
The visualization of the knowledge graph around specific entities ("France" and "Nijmegen") with a distance parameter (Dmax) suggests a method for retrieving relevant local subgraphs. This is more efficient than searching the entire graph and helps to focus on information directly related to the entities in question. The "camera" icon might represent a form of attention mechanism or a focused traversal strategy within the graph.
The subsequent graph processing stages (Detection, Clustering, Reduction) are essential for transforming the raw, potentially noisy, retrieved subgraph into a clean, structured representation (Gq) that can be used to derive the final answer. Graph Detection likely identifies potential paths and connections, Node and Relation Clustering groups similar entities or relationships to simplify the structure, and Graph Reduction prunes irrelevant nodes and edges, leaving only the most pertinent information.
Overall, the pipeline demonstrates a hybrid approach, combining the linguistic understanding capabilities of LLMs with the structured reasoning power of knowledge graphs. The process aims to efficiently extract and refine information from a knowledge graph to answer complex natural language questions, producing a processed graph (Gq) as an intermediate or final output. This methodology is likely designed to improve the accuracy and efficiency of knowledge graph question answering systems.
</details>
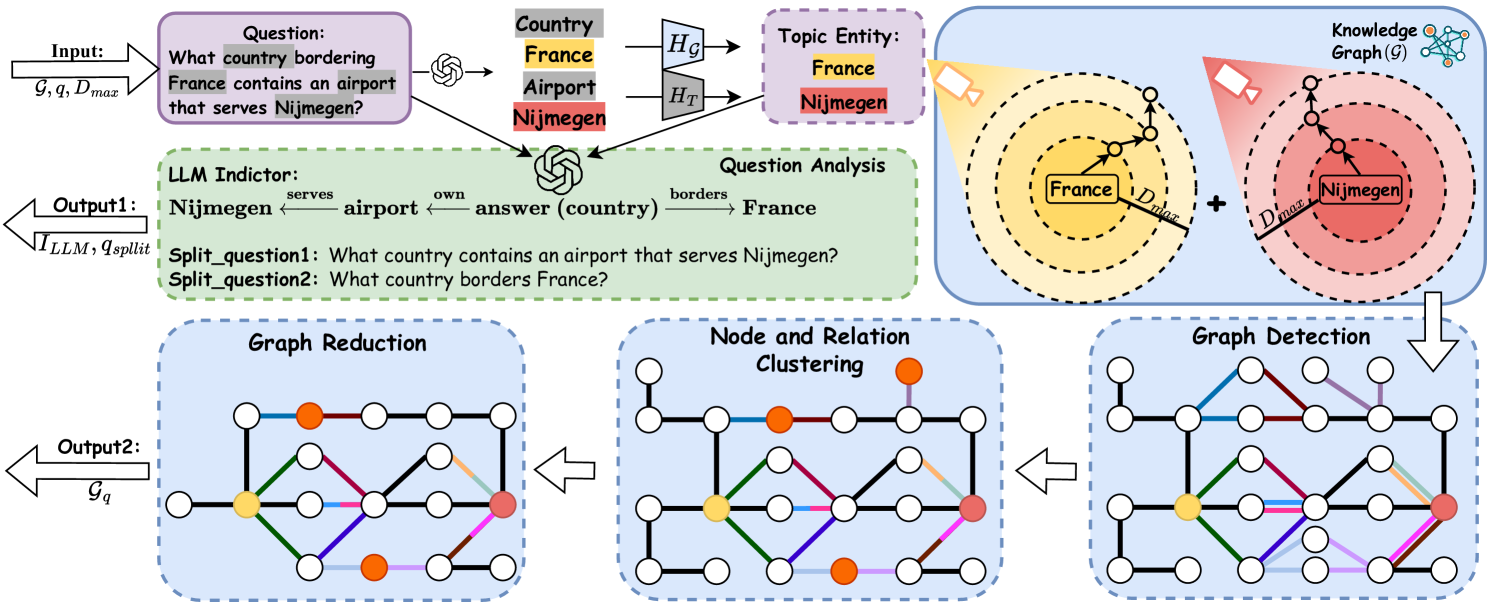
Figure 3. Overview of the initialization phase. Output 1: from the input question, the model identifies topic entities and prompts the LLM to decompose questions into split questions $q_{split}$ and generate an indicator $I_{LLM}$ . The indicator outlines a strategy for formulating the answer and predicts the exploration depth $D_{predict}$ . Output 2: the model queries the source KG up to $D_{max}$ -hop from identified topic entities, constructing and pruning the evidence subgraph $\mathcal{G}_{q}$ .
### 4.1. Initialization
The initialization has two main stages, i.e., question subgraph detection and question analysis. The framework is shown in Figure 3.
Question subgraph detection. Given a question $q$ , PoG initially identifies the question subgraph, which includes all the topic entities of $q$ and their $D_{\max}$ -hop neighbors.
Topic entity recognition. To identify the relevant subgraph, PoG first employs LLMs to extract the potential topic entities from the question. Following the identification, the process applies BERT-based similarity matching to align these potential entities with entities from KG. Specifically, as shown in Figure 3, we encode both the keywords and all entities from KG into dense vector embeddings as $H_{T}$ and $H_{\mathcal{G}}$ . We then compute a cosine similarity matrix between these embeddings to determine the matches. For each keyword, the entities with the highest similarity scores are selected to form the set $Topic(q)$ . This set serves as the foundation for constructing the question subgraph in subsequent steps.
Subgraph detection. Upon identifying the topic entities, PoG captures the induced subgraph $\mathcal{G}_{q}\subseteq\mathcal{G}$ by expanding around each entity $e$ in $Topic(q)$ . For each entity, we retrieve knowledge triples associated with its $D_{\max}$ -hop neighbors, thereby incorporating query-relevant and faithful KG information into $\mathcal{G}_{q}$ . Through this process, we update $\mathcal{E}_{q}$ with newly added intermediate nodes that serve as bridging pathways between the topic entities. The result subgraph, $\mathcal{G}_{q}$ is defined as $(\mathcal{E}_{q},\mathcal{R}_{q},\mathcal{T}_{q})$ , where $\mathcal{E}_{q}$ encompasses $Topic(q)$ together with the set $\{N_{\mathcal{G}}(e,D_{\max})\mid e\in Topic(q)\}$ , effectively linking all relevant entities and their connective paths within the defined hop distance. To interact with KG, we utilize the pre-defined SPARQL queries as detailed in Appendix D.
Graph pruning. To efficiently manage information overhead and reduce computational cost, we implement graph pruning on the question subgraph $\mathcal{G}_{q}$ using node and relation clustering alongside graph reduction techniques. As illustrated in Figure 3, node and relation clustering is achieved by compressing multiple nodes and their relations into supernodes, which aggregate information from the original entities and connections. For graph reduction, we employ bidirectional BFS to identify all paths connecting the topic entities. Based on these paths, we regenerate induced subgraphs that involve only the relevant connections, effectively excluding nodes and relations that lack strong relevance to the topic entities.
Question analysis. To reduce hallucinations in LLMs, the question analysis phase is divided into two parts and executed within a single LLM call using an example-based prompt (shown in Appendix E). First, the complex question $q$ is decomposed into simpler questions based on the identified topic entities, each addressing their relationship to the potential answer. Addressing these simpler questions collectively guides the LLM to better answer the original query, thereby reducing hallucinations. Second, a LLM indicator is generated, encapsulating all topic entities and predicting the answer position within a single chain of thought derived from the original question. This indicator highlights the relationships and sequence among the entities and answer. Based on this, a predicted depth $D_{\text{predict}}$ is calculated, defined as the maximum distance between the predicted answer and each topic entity. An example of question analysis is shown in Figure 3 with predicted depth 2.
### 4.2. Exploration
As discussed in Section 1, identifying reasoning paths that encompass all topic entities is essential to derive accurate answers. These paths serve as interpretable chains of thought, providing both the answer and the inference steps leading to it, a feature we refer as interpretability. To optimize the discovery of such paths efficiently and accurately, the exploration process is divided into three phases: topic entity path exploration, LLM supplement path exploration, and node expand exploration. After each phase, we perform path pruning and question answering. If a sufficient path is found, the process terminates; otherwise, it advances to the next phase to explore additional paths. Due to the space limitation, the pseudo-code of exploration section is shown in Appendix A.1.
Topic entity path exploration. To reduce LLM usage and search space, PoG begins exploration from a predicted depth $D_{\text{predict}}$ rather than the maximum depth. Using the question subgraph $\mathcal{G}_{q}$ , topic entities $Topic(q)$ , LLM indicator $I_{\text{LLM}}$ , and $D_{\text{predict}}$ , PoG identifies reasoning paths containing all topic entities by iteratively adjusting the exploration depth $D$ . Entities in $Topic(q)$ are ordered according to $I_{\text{LLM}}$ to facilitate reasoning effectively. Starting from the predicted depth $D=min(D_{\text{predict}},D_{\text{max}})$ , we employ a bidirectional BFS to derive all potential entity paths, which is defined as:
$$
Paths_{t}=\{p\mid|Topic(q)|\times(D-1)<length(p)\leq|Topic(q)|\times D\},
$$
where $p=Path_{\mathcal{G}_{q}}(Topic(q))$ . To reduce the complexity, a pruning strategy is employed and selects the top- $W_{\max}$ paths based on $Paths_{t}$ , $I_{\text{LLM}}$ , and split questions from Section 4.1. These paths are evaluated for sufficiency verification. If inadequate, $D$ is incremented until $D_{\max}$ is reached. Then the next phase commences.
LLM supplement path exploration. Traditional KG-based LLM reasoning often rephrases KG facts without utilizing the LLM’s inherent knowledge. To overcome this, PoG prompts LLMs to generate predictions based on path understanding and its implicit knowledge, providing additional relevant insights. It involves generating new LLM thinking indicators $I_{\text{Sup}}$ for predicted entities $e\in Predict(q)$ , and then using text similarity to verify and align them with $\mathcal{E}_{q}\in\mathcal{G}_{q}$ . The supplementary entity list $List_{S}(e)=Topic(q)+e$ is built and ranked by $I_{\text{Sup}}$ to facilitate reasoning effectively. Next, supplementary paths $Paths_{s}$ are derived from $List_{S}(e)$ in the evidence KG $\mathcal{G}_{q}$ with a fixed depth $D_{\max}$ :
$$
Paths_{s}=\{p\mid\text{length}(p)\leq|Topic(q)|\times D_{\max}\},
$$
where $p=Path_{\mathcal{G}_{q}}(List_{S}(e))$ . These paths with new indicators are evaluated similarly to the topic entity path exploration phase. The prompting temple is shown in Appendix E.
Node expand exploration. If previous phases cannot yield sufficient paths, PoG proceeds to node expansion. Unlike previous methods (Sun et al., 2024; Ma et al., 2024) that separately explore relations and entities, PoG explores both simultaneously, leveraging clearer semantic information for easier integration with existing paths. During the exploration, PoG expands unvisited entities by 1-hop neighbors in $\mathcal{G}$ . New triples are merged into existing paths to form the new paths, followed by pruning and evaluation.
### 4.3. Path Pruning
As introduced in Section 2, KGs contain vast amounts of facts, making it impractical to involve all relevant triples in the LLM’s context due to high costs. To address this complexity and reduce LLM overhead, we utilize a three-step beam search for path pruning. The corresponding pseudo-code can be found in Appendix A.2.
Fuzzy selection. Considering that only a small subset of the generated paths is relevant, the initial step of our beam search involves fuzzy selection by integrating a pre-trained language model (e.g. SentenceBERT (Reimers and Gurevych, 2019)), to filter the irrelevant paths quickly. As shown in Figure 2, we encode the LLM indicator $I_{\text{LLM}}$ (or $I_{\text{Sup}}$ ) and all reasoning paths into vector embeddings, denoted as $H_{I}$ and $H_{Paths}$ , and calculate cosine similarities between them. The top- $W_{1}$ paths with the highest similarity scores are selected for further evaluation.
Precise path selection. Following the initial fuzzy selection, the number of candidate paths is reduced to $W_{1}$ . At this stage, we prompt the LLM to select the top- $W_{\max}$ reasoning paths most likely to contain the correct answer. The specific prompt used to guide LLM in selection phase can be found in Appendix E.
Branch reduced selection. Considering that paths are often represented in natural language and can be extensive, leading to high processing costs for LLMs, we implement a branch reduced selection method integrated with the graph structure. This method effectively balances efficiency and accuracy by further refining path selection. Starting with $D=1$ , for each entity $e$ in the entity list, we extract the initial $D$ -step paths from every path in the candidate set $Paths_{c}$ into a new set $Paths_{e}$ . If the number of $Paths_{e}$ exceeds the maximum designated width $W_{\max}$ , these paths are pruned using precise path selection. The process iterates until the number of paths in $Paths_{c}$ reaches $D_{\max}$ . For example, as illustrated in Figure 2, with $W_{\max}=1$ , only the initial step paths (depicted in green) are extracted for further examination, while paths represented by dashed lines are pruned. This selection method enables efficient iterative selection by limiting the number of tokens and ensuring the relevance and conciseness of the reasoning paths.
Beam search strategy. Based on the three path pruning methods above, PoG can support various beam search strategies, ranging from non-reliant to fully reliant on LLMs. These strategies are selectable in a user-friendly manner, allowing flexibility based on the specific requirements of the task. We have defined four such strategies in Algorithm 2 of Appendix A.2.
### 4.4. Question Answering
Based on the pruned paths in Section 4.3, we introduce a two-step question-answering method.
Path Summarizing. To address hallucinations caused by paths with excessive or incorrect text, we develop a summarization strategy by prompting LLM to review and extract relevant triples from provided paths, creating a concise and focused path. Details of the prompts used are in Appendix E.
Question answering. Based on the current reasoning path derived from path pruning and summarizing, we prompt the LLM to first evaluate whether the paths are sufficient for answering the split question and then the main question. If the evaluation is positive, LLM is prompted to generate the answer using these paths, along with the question and question analysis results as inputs, as shown in Figures 2. The prompts for evaluation and generation are detailed in Appendix E. If the evaluation is negative, the exploration process is repeated until completion. If node expand exploration reaches its depth limit without yielding a satisfactory answer, LLM will leverage both provided and inherent knowledge to formulate a response. Additional details on the prompts can be found in Appendix E.
## 5. Experiments
Table 1. Results of PoG across various datasets, compared with the state-of-the-art (SOTA) in Supervised Learning (SL) and In-Context Learning (ICL) methods. The highest scores for ICL methods are highlighted in bold, while the second-best results are underlined. The Prior FT (Fine-tuned) SOTA includes the best-known results achieved through supervised learning.
| Method | Class | LLM | Multi-Hop KGQA | Single-Hop KGQA | Open-Domain QA | | |
| --- | --- | --- | --- | --- | --- | --- | --- |
| CWQ | WebQSP | GrailQA | Simple Questions | WebQuestions | | | |
| Without external knowledge | | | | | | | |
| IO prompt (Sun et al., 2024) | - | GPT-3.5-Turbo | 37.6 | 63.3 | 29.4 | 20.0 | 48.7 |
| CoT (Sun et al., 2024) | - | GPT-3.5-Turbo | 38.8 | 62.2 | 28.1 | 20.3 | 48.5 |
| SC (Sun et al., 2024) | - | GPT-3.5-Turbo | 45.4 | 61.1 | 29.6 | 18.9 | 50.3 |
| With external knowledge | | | | | | | |
| Prior FT SOTA | SL | - | 70.4 (Das et al., 2021) | 85.7 (Luo et al., 2024) | 75.4 (Gu et al., 2023) | 85.8 (Baek et al., 2023b) | 56.3 (Kedia et al., 2022) |
| KB-BINDER (Li et al., 2023a) | ICL | Codex | - | 74.4 | 58.5 | - | - |
| ToG/ToG-R (Sun et al., 2024) | ICL | GPT-3.5-Turbo | 58.9 | 76.2 | 68.7 | 53.6 | 54.5 |
| ToG-2.0 (Ma et al., 2024) | ICL | GPT-3.5-Turbo | - | 81.1 | - | - | - |
| ToG/ToG-R (Sun et al., 2024) | ICL | GPT-4 | 69.5 | 82.6 | 81.4 | 66.7 | 57.9 |
| PoG-E | ICL | GPT-3.5-Turbo | 71.9 | 90.9 | 87.6 | 78.3 | 76.9 |
| PoG | ICL | GPT-3.5-Turbo | 74.7 | 93.9 | 91.6 | 80.8 | 81.8 |
| PoG-E | ICL | GPT-4 | 78.5 | 95.4 | 91.4 | 81.2 | 82.0 |
| PoG | ICL | GPT-4 | 81.4 | 96.7 | 94.4 | 84.0 | 84.6 |
Experimental settings. We evaluate PoG on five KGQA datasets, i.e., CWQ (Talmor and Berant, 2018), WebQSP (Yih et al., 2016), GrailQA (Gu et al., 2021), SimpleQuestions (Petrochuk and Zettlemoyer, 2018), and WebQuestions (Berant et al., 2013). PoG is tested against methods without external knowledge (IO, CoT (Wei et al., 2022), SC (Wang et al., 2022)) and the state-of-the-art (SOTA) approaches with external knowledge, including prompting-based and fine-tuning-based methods. Freebase (Bollacker et al., 2008) serves as the background knowledge graph for all datasets. Experiments are conducted using two LLMs, i.e., GPT-3.5 (GPT-3.5-Turbo) and GPT-4. Following prior studies, we use exact match accuracy (Hits@1) as the evaluation metric. Due to the space limitation, detailed experimental settings, including dataset statistics, baselines, and implementation details, are provided in Appendix C.
PoG setting. We adopt the Fuzzy + Precise Path Selection strategy in Algorithm 2 of Appendix A.2 for PoG, with $W_{1}=80$ for fuzzy selection. Additionally, we introduce PoG-E, which randomly selects one relation from each edge in the clustered question subgraph to evaluate the impact of graph structure on KG-based LLM reasoning. $W_{\max}$ and $D_{\max}$ are 3 by default for beam search.
### 5.1. Main Results
Since PoG leverages external knowledge to enhance LLM reasoning, we first compare it with other methods that utilize external knowledge. Although PoG is a training-free, prompting-based method and has natural disadvantages compared to fine-tuned methods trained on evaluation data. As shown in Table 1, PoG with GPT-3.5-Turbo still achieves new SOTA performance across most datasets. Additionally, PoG with GPT-4 surpasses fine-tuned SOTA across all the multi-hop and open-domain datasets by an average of 17.3% and up to 28.3% on the WebQuestions dataset. Comparing all the in-context learning (ICL) methods, PoG with GPT-3.5-Turbo surpasses all the previous SOTA methods. When comparing PoG with GPT-3.5-Turbo against SOTA using GPT-4, PoG outperforms the SOTA by an average of 12.9% and up to 23.9%. When using the same LLM, PoG demonstrates substantial improvements: with GPT-3.5-Turbo, it outperforms SOTA by an average of 21.2% and up to 27.3% on the WebQuestions dataset; with GPT-4, it outperforms SOTA by 16.6% on average and up to 26.7% on the WebQuestions dataset. Additionally, PoG with GPT-3.5-Turbo outperforms methods without external knowledge (e.g., IO, CoT, SC prompting) by 62% on GrailQA and 60.5% on Simple Questions. These results show that incorporating external knowledge graphs significantly enhances reasoning tasks. PoG-E also achieves excellent results. Under GPT-4, PoG-E surpasses all SOTA in ICL by 14.1% on average and up to 24.1% on the WebQuestions dataset. These findings demonstrate that the graph structure is crucial for reasoning tasks, particularly for complex logical reasoning. By integrating the structural information of the question within the graph, PoG enhances the deep reasoning capabilities of LLMs, leading to superior performance.
### 5.2. Ablation Study
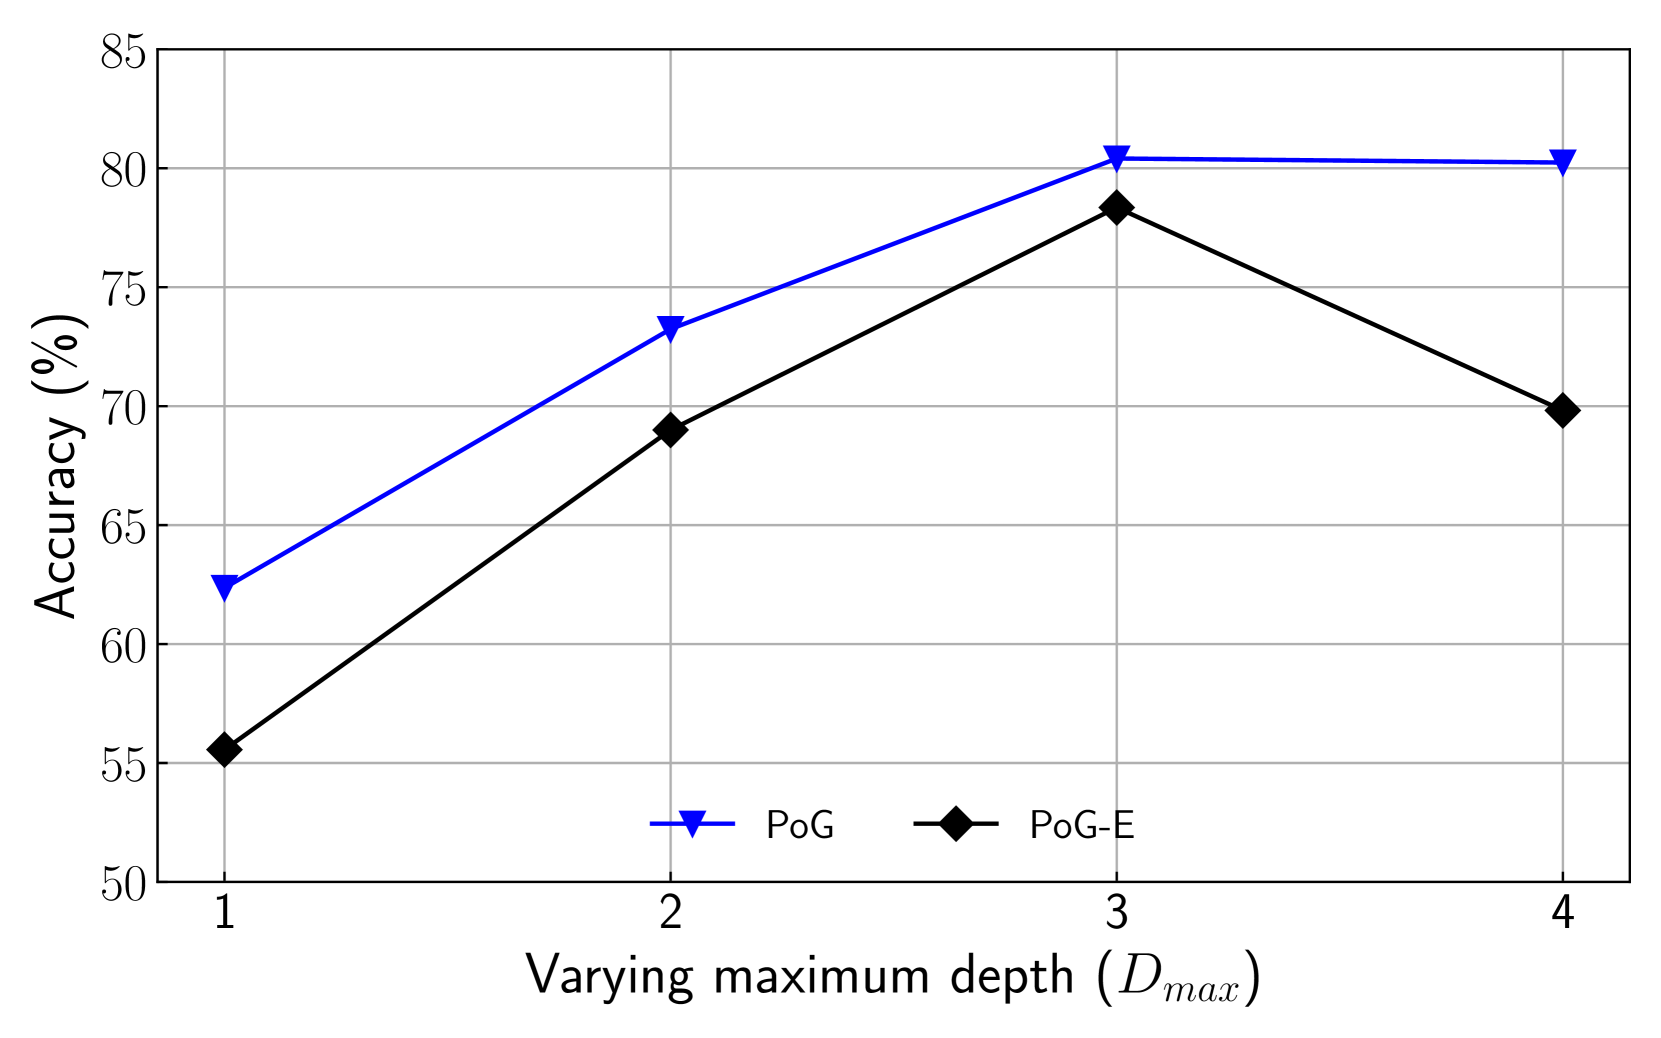
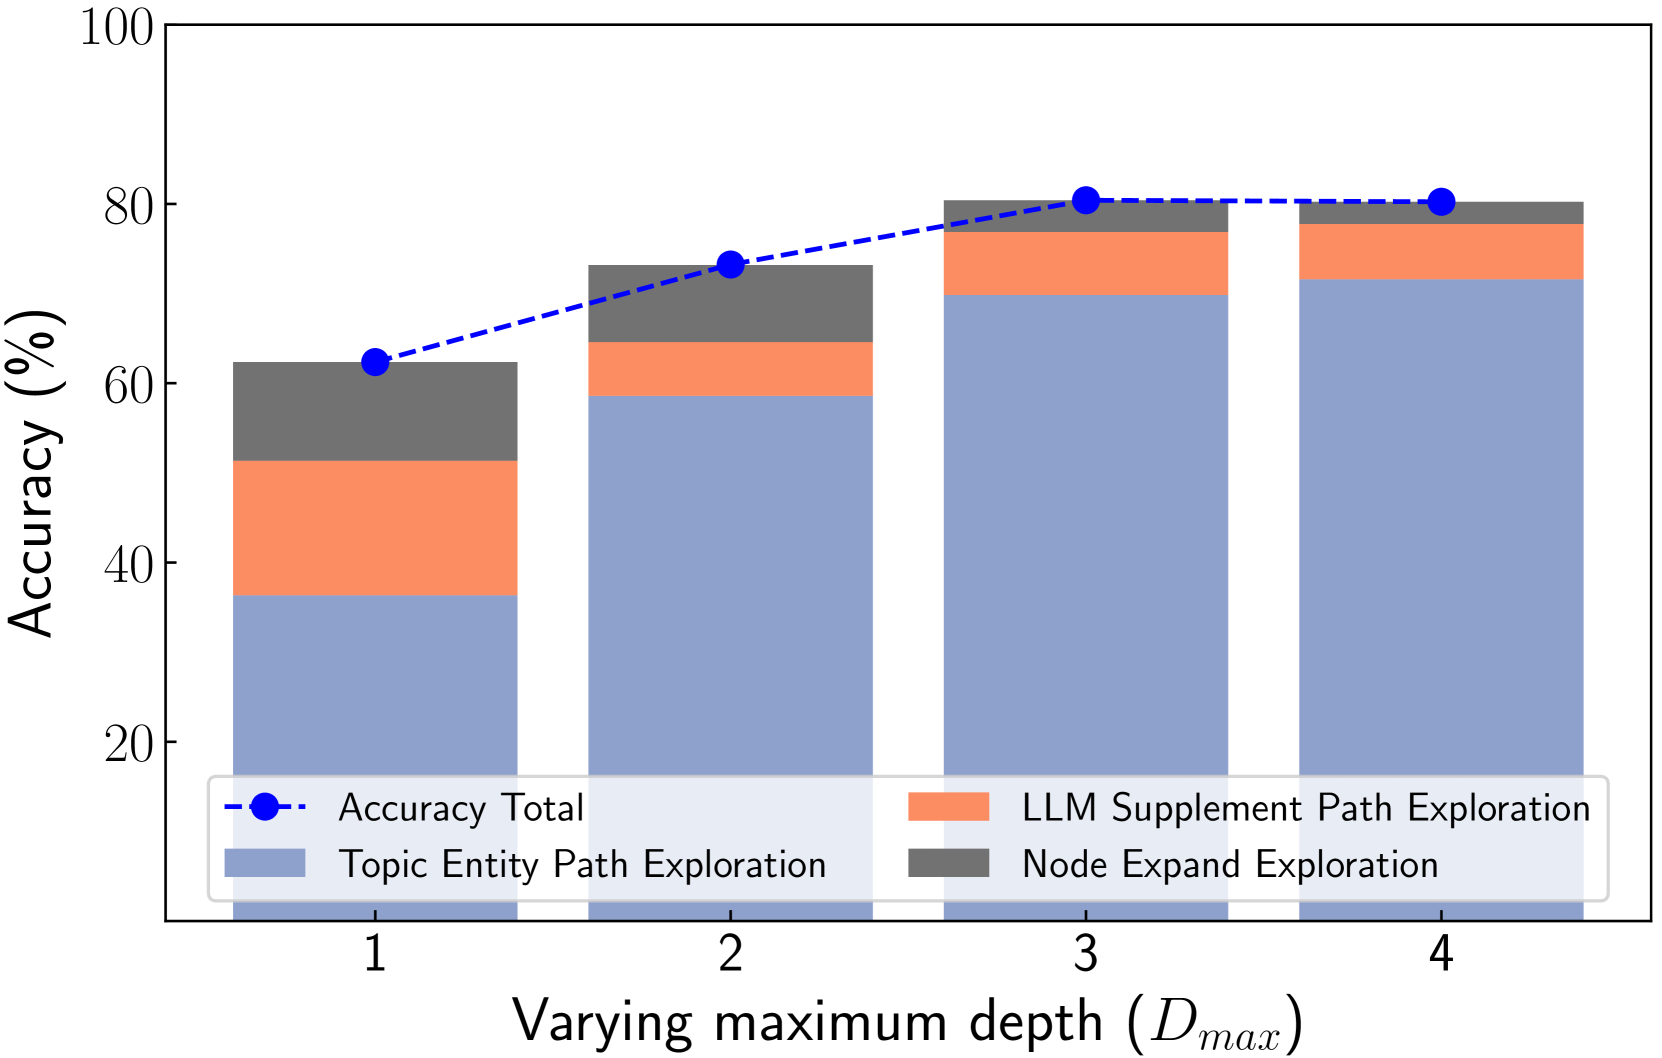
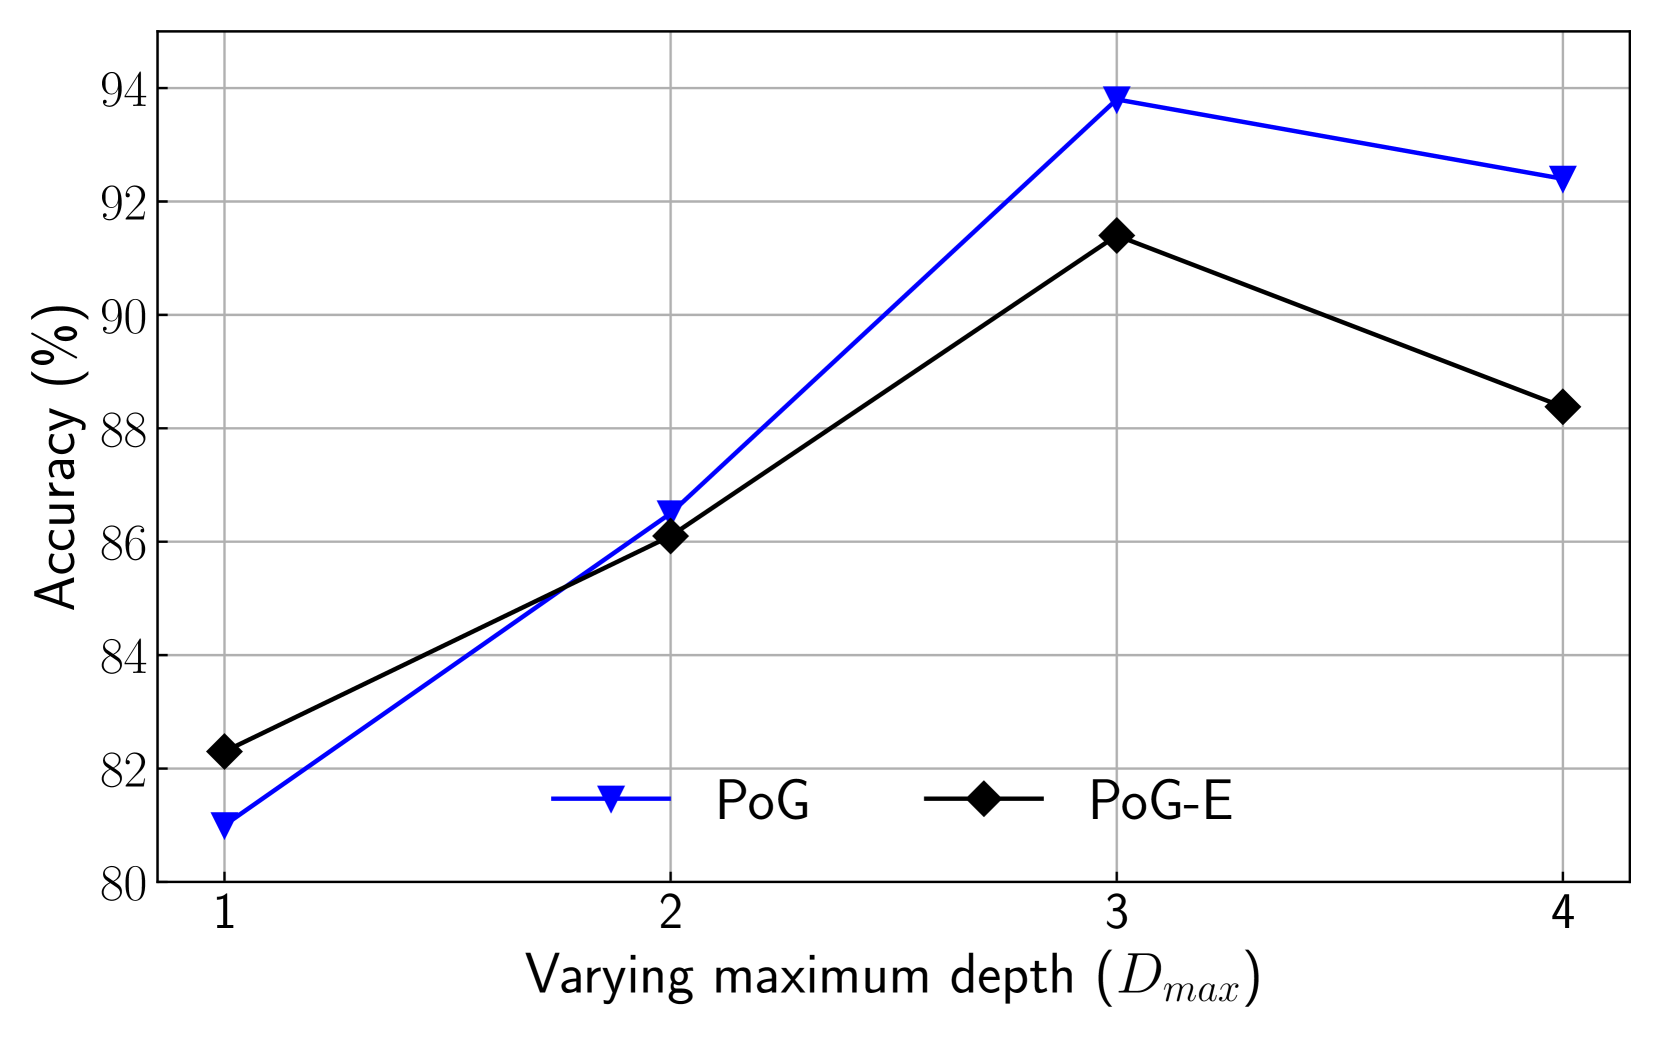
We perform various ablation studies to understand the importance of different factors in PoG. These ablation studies are performed with GPT-3.5-Turbo on two subsets of the CWQ and WebQSP test sets, each containing 500 randomly sampled questions. Does search depth matter? As described, PoG’s dynamic deep search is limited by $D_{max}$ . To assess the impact of $D_{\max}$ on performance, we conduct experiments with depth from 1 to 4. The results, shown in Figures 4 (a) and (c), indicate that performance improves with increased depth, but the benefits diminish beyond a depth of 3. Figures 4 (b) and (d), showing which exploration phase the answer is generated from, reveal that higher depths reduce the effectiveness of both LLM-based path supplementation and node exploration. Excessive depth leads to LLM hallucinations and difficulties in managing long reasoning paths. Therefore, we set the maximum depth to 3 for experiments to balance performance and computational efficiency. Additionally, even at lower depths, PoG maintains strong performance by effectively combining the LLM’s inherent knowledge with the structured information from the KG.
<details>
<summary>x4.png Details</summary>
### Visual Description
## Line Chart: Accuracy vs. Varying Maximum Depth
### Overview
This image displays a line chart illustrating the accuracy (%) of two different methods, "PoG" and "PoG-E", as a function of varying maximum depth ($D_{max}$). The chart shows how the accuracy changes for each method across different depth values.
### Components/Axes
* **Y-axis Title**: "Accuracy (%)"
* **Scale**: Ranges from 50 to 85, with major grid lines at intervals of 5 (50, 55, 60, 65, 70, 75, 80, 85).
* **X-axis Title**: "Varying maximum depth ($D_{max}$)"
* **Scale**: Ranges from 1 to 4, with major grid lines at integer values (1, 2, 3, 4).
* **Legend**: Located in the bottom-center of the chart.
* "PoG": Represented by blue upward-pointing triangles.
* "PoG-E": Represented by black diamonds.
### Detailed Analysis
**Data Series: PoG (Blue Upward-Triangles)**
* **Trend**: The "PoG" line shows an upward trend from $D_{max}=1$ to $D_{max}=3$, and then plateaus from $D_{max}=3$ to $D_{max}=4$.
* **Data Points**:
* At $D_{max}=1$: Accuracy is approximately 63%.
* At $D_{max}=2$: Accuracy is approximately 74%.
* At $D_{max}=3$: Accuracy is approximately 81%.
* At $D_{max}=4$: Accuracy is approximately 81%.
**Data Series: PoG-E (Black Diamonds)**
* **Trend**: The "PoG-E" line shows an upward trend from $D_{max}=1$ to $D_{max}=3$, and then a downward trend from $D_{max}=3$ to $D_{max}=4$.
* **Data Points**:
* At $D_{max}=1$: Accuracy is approximately 55%.
* At $D_{max}=2$: Accuracy is approximately 69%.
* At $D_{max}=3$: Accuracy is approximately 78%.
* At $D_{max}=4$: Accuracy is approximately 70%.
### Key Observations
* Both "PoG" and "PoG-E" methods show an increase in accuracy as the maximum depth increases from 1 to 3.
* The "PoG" method achieves a higher accuracy than "PoG-E" at $D_{max}=1$ and $D_{max}=2$.
* At $D_{max}=3$, "PoG" reaches its peak accuracy of approximately 81%, while "PoG-E" reaches approximately 78%.
* The "PoG" method maintains its peak accuracy from $D_{max}=3$ to $D_{max}=4$.
* The "PoG-E" method experiences a significant drop in accuracy from $D_{max}=3$ to $D_{max}=4$, falling to approximately 70%.
### Interpretation
The data suggests that increasing the maximum depth ($D_{max}$) generally improves the accuracy of both "PoG" and "PoG-E" methods, up to a certain point. The "PoG" method appears to be more robust to increasing depth, reaching a plateau and maintaining its performance. In contrast, the "PoG-E" method shows signs of overfitting or diminishing returns beyond a depth of 3, as its accuracy decreases significantly at $D_{max}=4$. This indicates that for the "PoG-E" method, a maximum depth of 3 might be optimal, while for "PoG", a depth of 3 or 4 yields the best results. The "PoG" method consistently outperforms "PoG-E" at lower depths and maintains a higher accuracy at the optimal depth.
</details>
(a) CWQ (Vary $D_{\max}$ )
<details>
<summary>x5.png Details</summary>
### Visual Description
## Stacked Bar Chart with Line Plot: Accuracy vs. Varying Maximum Depth
### Overview
This image displays a stacked bar chart and a line plot illustrating the accuracy of a system as a function of "Varying maximum depth ($D_{max}$)". The x-axis represents the maximum depth, ranging from 1 to 4. The y-axis represents accuracy in percentage, ranging from 0 to 100%. The stacked bars show the contribution of three different exploration strategies to the total accuracy at each depth: "Topic Entity Path Exploration" (blueish-grey), "LLM Supplement Path Exploration" (orange), and "Node Expand Exploration" (dark grey). A dashed blue line with circular markers represents the "Accuracy Total" at each depth.
### Components/Axes
* **X-axis Title**: "Varying maximum depth ($D_{max}$)"
* **X-axis Markers**: 1, 2, 3, 4
* **Y-axis Title**: "Accuracy (%)"
* **Y-axis Markers**: 0, 20, 40, 60, 80, 100
* **Legend**: Located in the bottom-right quadrant of the chart.
* **"Accuracy Total"**: Represented by a dashed blue line with blue circular markers.
* **"Topic Entity Path Exploration"**: Represented by a blueish-grey color.
* **"LLM Supplement Path Exploration"**: Represented by an orange color.
* **"Node Expand Exploration"**: Represented by a dark grey color.
### Detailed Analysis
The chart displays data for four different maximum depths: 1, 2, 3, and 4.
**Depth 1:**
* **Topic Entity Path Exploration**: Rises from 0% to approximately 36%.
* **LLM Supplement Path Exploration**: Rises from approximately 36% to approximately 53% (a contribution of ~17%).
* **Node Expand Exploration**: Rises from approximately 53% to approximately 63% (a contribution of ~10%).
* **Accuracy Total (Line Plot)**: The blue marker is at approximately 63%.
**Depth 2:**
* **Topic Entity Path Exploration**: Rises from 0% to approximately 60%.
* **LLM Supplement Path Exploration**: Rises from approximately 60% to approximately 72% (a contribution of ~12%).
* **Node Expand Exploration**: Rises from approximately 72% to approximately 74% (a contribution of ~2%).
* **Accuracy Total (Line Plot)**: The blue marker is at approximately 74%.
**Depth 3:**
* **Topic Entity Path Exploration**: Rises from 0% to approximately 70%.
* **LLM Supplement Path Exploration**: Rises from approximately 70% to approximately 79% (a contribution of ~9%).
* **Node Expand Exploration**: Rises from approximately 79% to approximately 80% (a contribution of ~1%).
* **Accuracy Total (Line Plot)**: The blue marker is at approximately 80%.
**Depth 4:**
* **Topic Entity Path Exploration**: Rises from 0% to approximately 72%.
* **LLM Supplement Path Exploration**: Rises from approximately 72% to approximately 79% (a contribution of ~7%).
* **Node Expand Exploration**: Rises from approximately 79% to approximately 80% (a contribution of ~1%).
* **Accuracy Total (Line Plot)**: The blue marker is at approximately 80%.
### Key Observations
* **Overall Trend**: The "Accuracy Total" generally increases with increasing maximum depth from depth 1 to depth 3, and then plateaus from depth 3 to depth 4.
* **Topic Entity Path Exploration**: This component shows a significant increase from depth 1 (approx. 36%) to depth 2 (approx. 60%), and then a smaller increase to depth 3 (approx. 70%) and depth 4 (approx. 72%). It forms the largest portion of the total accuracy for all depths.
* **LLM Supplement Path Exploration**: This component shows a decrease in its contribution as the maximum depth increases. It contributes approximately 17% at depth 1, 12% at depth 2, 9% at depth 3, and 7% at depth 4.
* **Node Expand Exploration**: This component contributes a small and relatively constant amount to the total accuracy, around 10% at depth 1, 2% at depth 2, and 1% at depths 3 and 4.
* **Plateau**: The "Accuracy Total" reaches a plateau at approximately 80% for maximum depths of 3 and 4.
### Interpretation
The data suggests that increasing the maximum depth ($D_{max}$) has a positive impact on the overall accuracy up to a certain point. The "Topic Entity Path Exploration" appears to be the most crucial component for achieving higher accuracy, and its effectiveness also increases with depth, albeit with diminishing returns after depth 2.
The "LLM Supplement Path Exploration" seems to be more beneficial at lower depths, contributing more significantly to the accuracy when the maximum depth is limited. As the maximum depth increases, the need for this supplementary exploration might decrease, or other components become more dominant.
The "Node Expand Exploration" has a minimal and inconsistent impact, particularly at higher depths. Its contribution is negligible for depths 3 and 4.
The plateau observed at depths 3 and 4 indicates that further increases in maximum depth beyond this point do not yield significant improvements in accuracy. This could suggest that the model has reached its optimal performance within the given exploration strategies, or that other factors are limiting further gains. The system's performance is primarily driven by "Topic Entity Path Exploration" and is capped around 80% accuracy for $D_{max} \ge 3$.
</details>
(b) CWQ(PoG)
<details>
<summary>x6.png Details</summary>
### Visual Description
## Line Chart: Accuracy vs. Varying Maximum Depth
### Overview
This image is a line chart displaying the accuracy (%) of two different methods, "PoG" and "PoG-E", as a function of "Varying maximum depth (Dmax)". The chart shows how the accuracy of each method changes with increasing maximum depth.
### Components/Axes
* **Y-axis Title**: "Accuracy (%)"
* **Scale**: Ranges from 80 to 94, with major tick marks at 80, 82, 84, 86, 88, 90, 92, and 94. Minor grid lines are present between major tick marks.
* **X-axis Title**: "Varying maximum depth (Dmax)"
* **Scale**: Ranges from 1 to 4, with major tick marks at 1, 2, 3, and 4.
* **Legend**: Located in the bottom-center of the chart.
* "PoG": Represented by a blue line with downward-pointing triangle markers.
* "PoG-E": Represented by a black line with diamond markers.
### Detailed Analysis or Content Details
**Data Series: PoG (Blue line with downward-pointing triangles)**
* **Trend**: The "PoG" line initially slopes upward, reaching a peak, and then slopes downward.
* **Data Points**:
* At Dmax = 1: Accuracy is approximately 81.2% (blue downward triangle).
* At Dmax = 2: Accuracy is approximately 86.5% (blue downward triangle).
* At Dmax = 3: Accuracy is approximately 94.0% (blue downward triangle).
* At Dmax = 4: Accuracy is approximately 92.3% (blue downward triangle).
**Data Series: PoG-E (Black line with diamonds)**
* **Trend**: The "PoG-E" line initially slopes upward, reaches a peak, and then slopes downward.
* **Data Points**:
* At Dmax = 1: Accuracy is approximately 82.2% (black diamond).
* At Dmax = 2: Accuracy is approximately 86.2% (black diamond).
* At Dmax = 3: Accuracy is approximately 91.5% (black diamond).
* At Dmax = 4: Accuracy is approximately 88.3% (black diamond).
### Key Observations
* Both "PoG" and "PoG-E" show an increasing trend in accuracy up to a maximum depth of 3.
* "PoG" achieves a higher peak accuracy of approximately 94.0% at Dmax = 3 compared to "PoG-E" which reaches approximately 91.5% at Dmax = 3.
* Beyond Dmax = 3, both methods experience a decrease in accuracy. "PoG" decreases from 94.0% to 92.3%, while "PoG-E" decreases from 91.5% to 88.3%.
* At Dmax = 1, "PoG-E" has a slightly higher accuracy (82.2%) than "PoG" (81.2%).
* At Dmax = 2, the accuracies are very close, with "PoG" at 86.5% and "PoG-E" at 86.2%.
* At Dmax = 4, "PoG" (92.3%) maintains a significantly higher accuracy than "PoG-E" (88.3%).
### Interpretation
This chart demonstrates the performance of two methods, "PoG" and "PoG-E", across different maximum depths (Dmax). The data suggests that for both methods, there is an optimal maximum depth for achieving the highest accuracy, which appears to be at Dmax = 3. Beyond this depth, performance degrades, indicating a potential for overfitting or diminishing returns.
"PoG" appears to be the more effective method, as it achieves a higher peak accuracy and maintains a greater accuracy advantage over "PoG-E" at higher depths (Dmax = 4). The initial slight advantage of "PoG-E" at Dmax = 1 and the close performance at Dmax = 2 suggest that at shallower depths, the methods are comparable, but "PoG" scales better and achieves superior results as the complexity (depth) increases up to the optimal point. The subsequent decline in accuracy for both methods highlights the importance of selecting an appropriate maximum depth to avoid overfitting and maximize generalization performance.
</details>
(c) WebQSP (Vary $D_{\max}$ )
<details>
<summary>x7.png Details</summary>
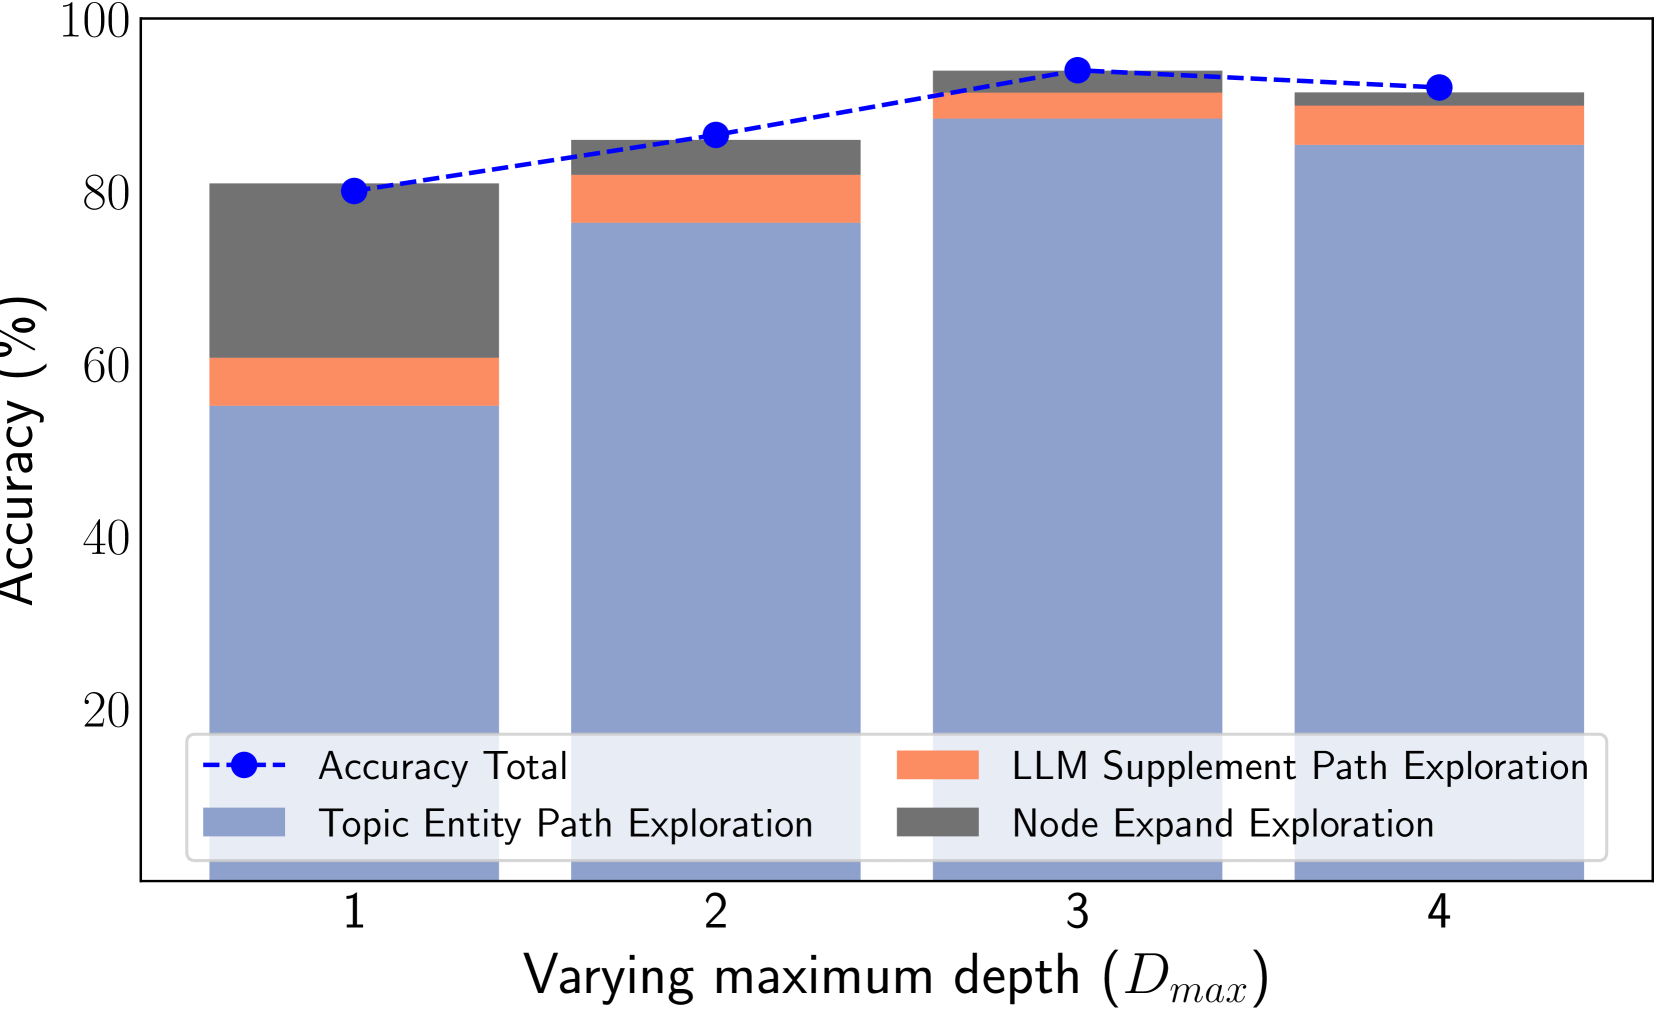
### Visual Description
## Stacked Bar Chart with Line Plot: Accuracy vs. Varying Maximum Depth
### Overview
This image displays a stacked bar chart and a line plot, illustrating the accuracy of a system across different values of "Varying maximum depth ($D_{max}$)". The accuracy is broken down into three components: "Topic Entity Path Exploration", "LLM Supplement Path Exploration", and "Node Expand Exploration". A separate line plot, labeled "Accuracy Total", shows the overall accuracy.
### Components/Axes
* **Y-axis Title**: "Accuracy (%)"
* **Scale**: Ranges from 0 to 100, with major tick marks at 20, 40, 60, 80, and 100.
* **X-axis Title**: "Varying maximum depth ($D_{max}$)"
* **Scale**: Discrete values labeled 1, 2, 3, and 4.
* **Legend**: Located in the bottom-center of the chart.
* "Accuracy Total": Represented by a dashed blue line with blue circular markers.
* "Topic Entity Path Exploration": Represented by light blue bars.
* "LLM Supplement Path Exploration": Represented by orange bars.
* "Node Expand Exploration": Represented by dark gray bars.
### Detailed Analysis
The chart presents data for four different maximum depths: 1, 2, 3, and 4.
**For $D_{max} = 1$**:
* "Topic Entity Path Exploration" (light blue): Approximately 55% accuracy.
* "LLM Supplement Path Exploration" (orange): Approximately 6% accuracy (from ~55% to ~61%).
* "Node Expand Exploration" (dark gray): Approximately 19% accuracy (from ~61% to ~80%).
* "Accuracy Total" (blue line): Approximately 80% accuracy.
**For $D_{max} = 2$**:
* "Topic Entity Path Exploration" (light blue): Approximately 75% accuracy.
* "LLM Supplement Path Exploration" (orange): Approximately 5% accuracy (from ~75% to ~80%).
* "Node Expand Exploration" (dark gray): Approximately 5% accuracy (from ~80% to ~85%).
* "Accuracy Total" (blue line): Approximately 84% accuracy.
**For $D_{max} = 3$**:
* "Topic Entity Path Exploration" (light blue): Approximately 87% accuracy.
* "LLM Supplement Path Exploration" (orange): Approximately 3% accuracy (from ~87% to ~90%).
* "Node Expand Exploration" (dark gray): Approximately 3% accuracy (from ~90% to ~93%).
* "Accuracy Total" (blue line): Approximately 93% accuracy.
**For $D_{max} = 4$**:
* "Topic Entity Path Exploration" (light blue): Approximately 86% accuracy.
* "LLM Supplement Path Exploration" (orange): Approximately 3% accuracy (from ~86% to ~89%).
* "Node Expand Exploration" (dark gray): Approximately 3% accuracy (from ~89% to ~92%).
* "Accuracy Total" (blue line): Approximately 91% accuracy.
**Trend Verification**:
* **"Topic Entity Path Exploration"**: The light blue bars show an upward trend from $D_{max}=1$ to $D_{max}=3$, reaching a peak, and then a slight decrease at $D_{max}=4$.
* **"LLM Supplement Path Exploration"**: The orange bars show a generally decreasing trend as $D_{max}$ increases, with a slight increase from $D_{max}=3$ to $D_{max}=4$.
* **"Node Expand Exploration"**: The dark gray bars show a significant decrease from $D_{max}=1$ to $D_{max}=2$, and then remain relatively stable with minor fluctuations for $D_{max}=3$ and $D_{max}=4$.
* **"Accuracy Total"**: The blue line shows an upward trend from $D_{max}=1$ to $D_{max}=3$, reaching a peak, and then a slight decrease at $D_{max}=4$.
### Key Observations
* The "Topic Entity Path Exploration" is the dominant contributor to the total accuracy across all tested depths.
* The "Accuracy Total" generally increases with maximum depth up to $D_{max}=3$, after which it slightly declines.
* The contribution of "LLM Supplement Path Exploration" and "Node Expand Exploration" to the total accuracy is relatively small, especially at higher depths.
* There is a notable drop in the contribution of "Node Expand Exploration" between $D_{max}=1$ and $D_{max}=2$.
### Interpretation
The data suggests that increasing the maximum depth ($D_{max}$) initially improves the overall accuracy of the system, peaking at $D_{max}=3$. This indicates that a certain level of depth is beneficial for the system's performance. However, beyond $D_{max}=3$, the accuracy starts to degrade slightly. This could imply that excessively deep exploration might lead to diminishing returns or introduce noise, negatively impacting performance.
The "Topic Entity Path Exploration" appears to be the most crucial component for achieving high accuracy, as its contribution is consistently the largest and follows a similar trend to the "Accuracy Total". The other two components, "LLM Supplement Path Exploration" and "Node Expand Exploration", have a much smaller impact on the overall accuracy, particularly at higher depths. The significant decrease in "Node Expand Exploration" between $D_{max}=1$ and $D_{max}=2$ warrants further investigation to understand the underlying reasons for this drop. The overall trend suggests an optimal maximum depth exists for this system, and exploring beyond this point may not be beneficial.
</details>
(d) WebQSP(PoG)
Figure 4. The accuracy of PoG and PoG-E among CWQ and WebQSP datasets by varying different $D_{\max}$ .
### 5.3. Effectiveness Evaluation
Effective evaluation on multi-entity questions. To evaluate PoG’s performance on multi-entity questions, we report the accuracy on all test sets by categorizing questions based on the number of topic entities. The results, shown in Table 2, demonstrate that, despite the increased complexity of multi-entity questions compared to single-entity ones, PoG maintains excellent accuracy, achieving up to 93.9% on the WebQSP dataset. This underscores the effectiveness of our structure-based model in handling complex multi-entity queries. Notably, the slightly lower performance on the GrailQA dataset can be attributed to some questions lacking matched topic entities, which prevents effective reasoning using KG.
Table 2. Performance of PoG and PoG-E on multi-entity and single-entity questions of all datasets. The symbol ‘-’ indicates no multi-entity question inside.
| Question Set | CWQ | WebQSP | GrailQA | WebQuestions | Simple Questions |
| --- | --- | --- | --- | --- | --- |
| PoG with GPT-3.5-Turbo | | | | | |
| Single-entity | 70.3 | 93.9 | 92.1 | 81.7 | 78.3 |
| Multi-entity | 80.2 | 93.1 | 70.7 | 82.8 | - |
| PoG-E with GPT-3.5-Turbo | | | | | |
| Single-entity | 67.5 | 91 | 88.2 | 76.8 | 80.8 |
| Multi-entity | 77.5 | 82.8 | 76.0 | 82.8 | - |
Effective evaluation on multi-hop reasoning. To assess PoG’s performance on multi-hop reasoning tasks, we analyze accuracy by categorizing questions based on the length of their ground-truth SPARQL queries. We randomly sample 1,000 questions from CWQ and WebQSP datasets and determine the reasoning length of each question by counting the number of relations in their ground-truth SPARQL queries. The distribution of questions with varying reasoning lengths is illustrated in Figure 5. We evaluate the performance of PoG and PoG-E across different ground-truth lengths to understand their effectiveness under varying query complexities. As shown in Figure 6, the performance of PoG and PoG-E remains consistent across different reasoning lengths. Even at the highest length levels in the WebQSP dataset, PoG achieves excellent accuracy, reaching up to 90%. Notably, although some questions have ground-truth lengths of eight or more, PoG successfully addresses them without matching the ground-truth length, demonstrating its ability to explore novel paths by effectively combining the LLM’s inherent knowledge with the structured information from the KG. These results demonstrate the effectiveness of PoG in handling complex multi-hop reasoning tasks.
Table 3. The illustration of graph size reduction.
| | CWQ | WebQSP | GrailQA | WebQuestions |
| --- | --- | --- | --- | --- |
| Ave Entity Number | 3,540,267 | 243,826 | 62,524 | 240,863 |
| Ave Entity Number After Pruned | 1,621,055 | 182,673 | 30,267 | 177,822 |
| Ave Entitiy Reduction Proportion (%) | 54% | 25% | 52% | 26% |
<details>
<summary>x8.png Details</summary>
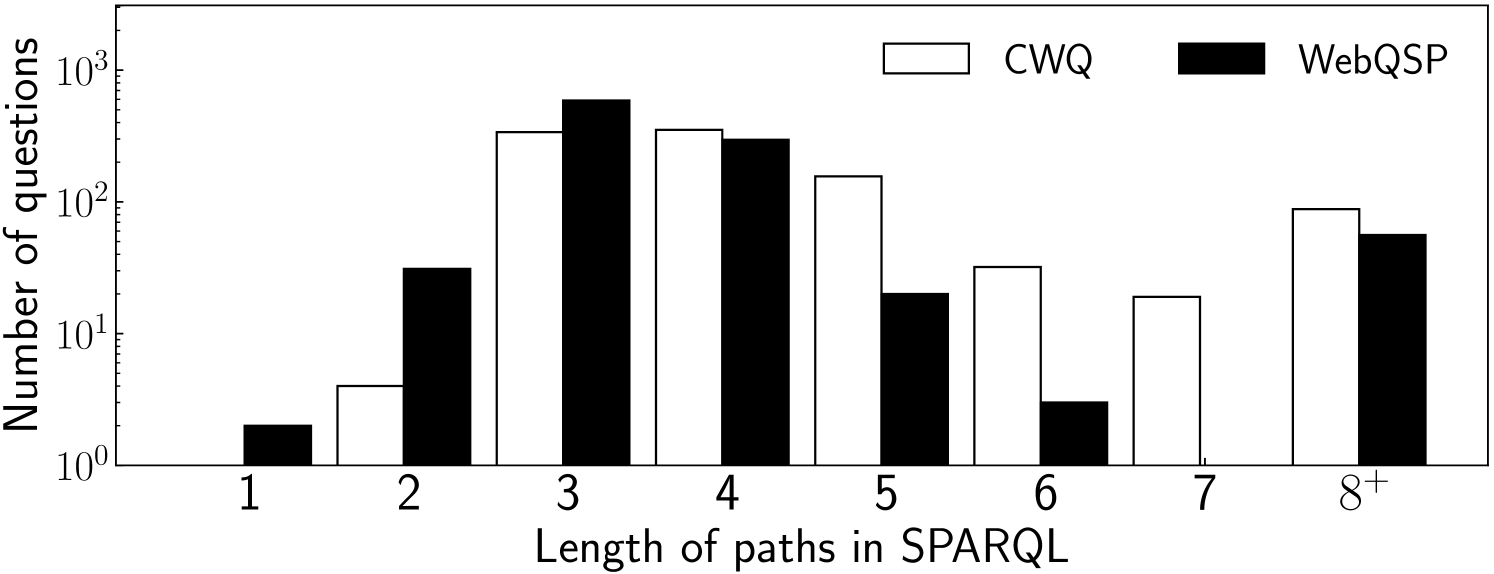
### Visual Description
## Bar Chart: Number of Questions by Path Length in SPARQL for CWQ and WebQSP
### Overview
This image is a bar chart comparing the number of questions based on the length of paths in SPARQL queries. Two datasets, CWQ (represented by white bars) and WebQSP (represented by black bars), are presented side-by-side for each path length. The y-axis is on a logarithmic scale, indicating a wide range of question counts.
### Components/Axes
* **Title:** Implicitly, the chart compares question counts by SPARQL path length for two systems.
* **Y-axis Label:** "Number of questions"
* **Y-axis Scale:** Logarithmic, with major tick marks at 10^0 (1), 10^1 (10), and 10^2 (100), and 10^3 (1000).
* **X-axis Label:** "Length of paths in SPARQL"
* **X-axis Categories:** The categories are discrete path lengths, labeled numerically from 1 to 7, and a final category labeled "S^1".
* 1
* 2
* 3
* 4
* 5
* 6
* 7
* S^1
* **Legend:** Located in the top-center of the chart.
* White rectangle: "CWQ"
* Black rectangle: "WebQSP"
### Detailed Analysis
The chart displays the distribution of questions across different SPARQL path lengths for CWQ and WebQSP.
**Path Length 1:**
* CWQ (white bar): Approximately 2 questions.
* WebQSP (black bar): Approximately 20 questions.
**Path Length 2:**
* CWQ (white bar): Approximately 30 questions.
* WebQSP (black bar): Approximately 40 questions.
**Path Length 3:**
* CWQ (white bar): Approximately 180 questions.
* WebQSP (black bar): Approximately 250 questions.
**Path Length 4:**
* CWQ (white bar): Approximately 170 questions.
* WebQSP (black bar): Approximately 150 questions.
**Path Length 5:**
* CWQ (white bar): Approximately 110 questions.
* WebQSP (black bar): Approximately 20 questions.
**Path Length 6:**
* CWQ (white bar): Approximately 35 questions.
* WebQSP (black bar): Approximately 5 questions.
**Path Length 7:**
* CWQ (white bar): Approximately 15 questions.
* WebQSP (black bar): Approximately 10 questions.
**Path Length S^1:**
* CWQ (white bar): Approximately 80 questions.
* WebQSP (black bar): Approximately 60 questions.
### Key Observations
* **Dominance of Shorter Paths:** Both CWQ and WebQSP show a peak in the number of questions for path lengths 3 and 4.
* **WebQSP's Higher Count for Short Paths:** WebQSP has a significantly higher number of questions for path length 1 compared to CWQ.
* **CWQ's Higher Count for Medium Paths:** CWQ has a higher number of questions for path lengths 5 and 7 compared to WebQSP.
* **WebQSP's Peak at Path Length 3:** WebQSP exhibits its highest count at path length 3.
* **CWQ's Peak at Path Length 3:** CWQ also shows a high count at path length 3, slightly lower than WebQSP.
* **"S^1" Category:** This category, appearing after path length 7, shows a notable number of questions for both CWQ and WebQSP, with CWQ having a slightly higher count. The meaning of "S^1" is not explicitly defined in the chart but likely represents a specific type of SPARQL path or query structure.
* **Logarithmic Scale Impact:** The logarithmic scale emphasizes the relative differences, especially for smaller counts. For instance, the difference between 2 and 20 questions (path length 1) is visually significant.
### Interpretation
This bar chart illustrates the distribution of SPARQL query complexity, as measured by path length, for two question-answering systems, CWQ and WebQSP. The data suggests that both systems tend to generate queries with moderate path lengths (3 and 4) most frequently.
WebQSP appears to be more inclined towards generating very short paths (length 1) compared to CWQ, which might indicate a different strategy in query decomposition or generation for simpler queries. Conversely, CWQ shows a stronger presence in questions with path lengths 5 and 7, suggesting it might be capable of handling or generating more complex path structures in certain scenarios.
The "S^1" category is an interesting outlier. Its presence and the relatively high number of questions associated with it for both systems warrant further investigation into what this category represents. It could be a specific type of complex query, a fallback mechanism, or a category for queries that don't fit neatly into the numerical path lengths. The fact that both systems have a substantial number of questions in this category suggests it's a common or important aspect of the question-answering task they are designed for.
Overall, the chart provides insights into the query generation patterns of CWQ and WebQSP, highlighting differences in their handling of query complexity based on SPARQL path length. This information could be valuable for optimizing query engines, understanding user query behavior, or evaluating the capabilities of these systems.
</details>
Figure 5. The lengths of the ground-truth SPARQL queries within the CWQ and WebQSP datasets.
<details>
<summary>x9.png Details</summary>
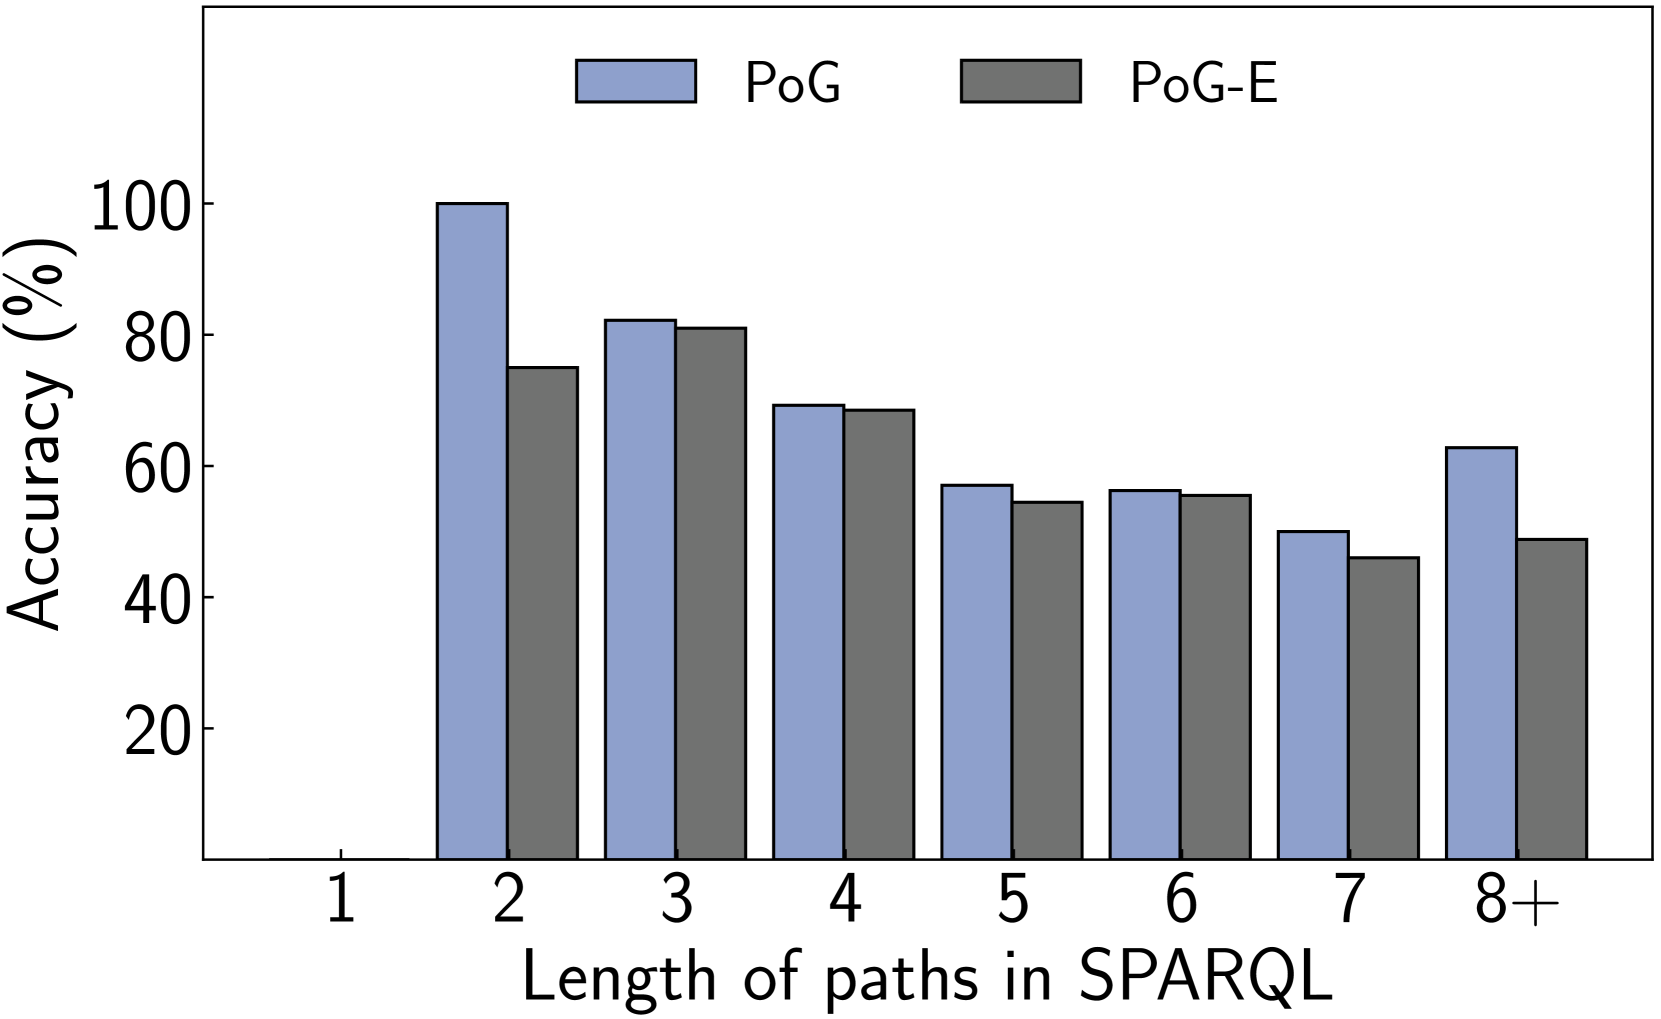
### Visual Description
## Bar Chart: Accuracy (%) vs. Length of paths in SPARQL
### Overview
This image is a bar chart comparing the accuracy of two methods, "PoG" and "PoG-E", across different lengths of paths in SPARQL queries. The x-axis represents the length of paths in SPARQL queries, categorized from 1 to 8+. The y-axis represents the accuracy in percentage.
### Components/Axes
* **Title:** Implicitly, the chart title is "Accuracy (%) vs. Length of paths in SPARQL".
* **X-axis Label:** "Length of paths in SPARQL"
* **X-axis Markers:** 1, 2, 3, 4, 5, 6, 7, 8+
* **Y-axis Label:** "Accuracy (%)"
* **Y-axis Markers:** 0, 20, 40, 60, 80, 100
* **Legend:** Located at the top-center of the chart.
* **"PoG"**: Represented by light blue bars.
* **"PoG-E"**: Represented by dark gray bars.
### Detailed Analysis
The chart displays paired bars for each category on the x-axis, representing the accuracy for "PoG" and "PoG-E".
* **Path Length 1:**
* PoG: No bar is visible, suggesting an accuracy of 0% or it's not applicable/measured.
* PoG-E: No bar is visible, suggesting an accuracy of 0% or it's not applicable/measured.
* **Path Length 2:**
* PoG (light blue): Slopes upward to approximately 100%.
* PoG-E (dark gray): Slopes upward to approximately 75%.
* **Path Length 3:**
* PoG (light blue): Slopes upward to approximately 82%.
* PoG-E (dark gray): Slopes upward to approximately 81%.
* **Path Length 4:**
* PoG (light blue): Slopes upward to approximately 68%.
* PoG-E (dark gray): Slopes upward to approximately 69%.
* **Path Length 5:**
* PoG (light blue): Slopes upward to approximately 58%.
* PoG-E (dark gray): Slopes upward to approximately 56%.
* **Path Length 6:**
* PoG (light blue): Slopes upward to approximately 57%.
* PoG-E (dark gray): Slopes upward to approximately 57%.
* **Path Length 7:**
* PoG (light blue): Slopes upward to approximately 50%.
* PoG-E (dark gray): Slopes upward to approximately 46%.
* **Path Length 8+:**
* PoG (light blue): Slopes upward to approximately 63%.
* PoG-E (dark gray): Slopes upward to approximately 50%.
### Key Observations
* **Path Length 2:** "PoG" achieves its highest accuracy at approximately 100%, significantly outperforming "PoG-E" which is around 75%.
* **Path Length 3:** Both "PoG" and "PoG-E" show very similar accuracies, around 82% and 81% respectively.
* **General Trend:** For path lengths 2 through 7, the accuracy for both methods generally decreases as the path length increases, with a slight dip and then a rise for "PoG" at path length 8+.
* **Path Length 8+:** "PoG" shows a notable increase in accuracy to approximately 63%, while "PoG-E" drops to approximately 50%.
* **Comparison:** "PoG" generally performs better or comparably to "PoG-E" across most path lengths, with the exception of path length 4 where "PoG-E" is slightly higher. "PoG" shows a more pronounced peak at path length 2 and a significant recovery at path length 8+.
### Interpretation
This chart demonstrates the performance of two methods, "PoG" and "PoG-E", in terms of accuracy when dealing with SPARQL queries of varying path lengths.
* **Method Performance:** "PoG" appears to be a more robust method, especially for shorter and longer path lengths. Its peak performance at path length 2 (near 100% accuracy) suggests it is highly effective for queries with a single hop or very simple structures. The significant increase in accuracy for path length 8+ compared to path length 7 indicates that "PoG" might be better at handling complex, multi-hop queries than "PoG-E".
* **Impact of Path Length:** The general trend of decreasing accuracy with increasing path length (from 2 to 7) is a common observation in query processing, as longer paths can introduce more complexity, ambiguity, and potential for errors. However, the behavior at path length 8+ for "PoG" suggests that for very complex queries, its architecture might be more adaptable or it might be leveraging different strategies.
* **"PoG-E" Behavior:** "PoG-E" shows a more consistent, albeit lower, performance compared to "PoG" for path lengths 2 through 7. Its accuracy is generally slightly lower than "PoG" in this range, and it does not show the same recovery at path length 8+. This could imply that "PoG-E" is more sensitive to the increasing complexity of longer paths.
* **Relationship between Elements:** The x-axis categories (path lengths) directly influence the y-axis values (accuracy) for each of the two data series ("PoG" and "PoG-E"). The legend clearly distinguishes these two series, allowing for direct comparison at each path length. The visual representation as bars allows for quick identification of relative performance.
* **Underlying Data:** The data suggests that while both methods struggle with increasing path complexity, "PoG" exhibits a more dynamic performance profile, excelling at both very short and very long path lengths, while "PoG-E" offers a more stable but generally lower accuracy across intermediate path lengths. The absence of data for path length 1 for both methods might indicate that such queries are not relevant or not handled by these methods.
</details>
(a) CWQ
<details>
<summary>x10.png Details</summary>
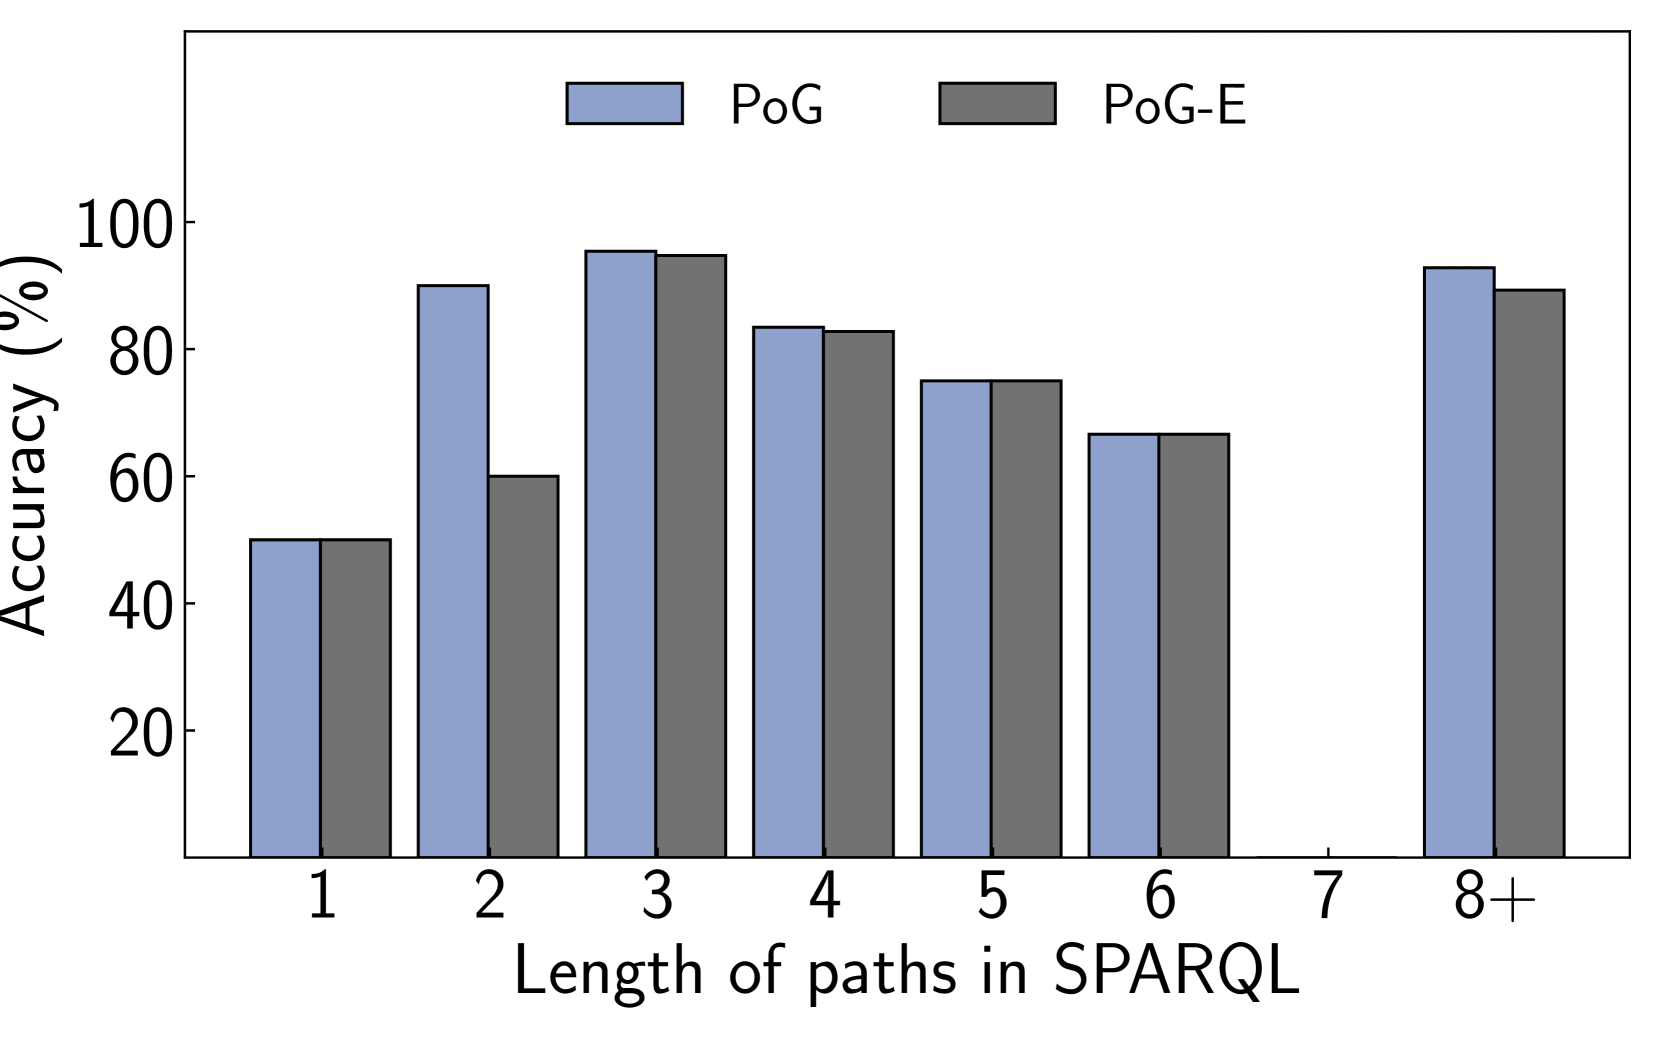
### Visual Description
## Bar Chart: Accuracy vs. Length of Paths in SPARQL
### Overview
This image is a bar chart that displays the accuracy of two methods, "PoG" and "PoG-E", across different lengths of paths in SPARQL queries. The x-axis represents the length of paths, categorized from 1 to 6, and then a combined category "8+". The y-axis represents the accuracy in percentage.
### Components/Axes
* **Title**: Implicitly, the chart is about the performance of "PoG" and "PoG-E" based on SPARQL path length.
* **Y-axis Label**: "Accuracy (%)"
* **Scale**: Linear, ranging from 0 to 100, with major tick marks at 20, 40, 60, 80, and 100.
* **X-axis Label**: "Length of paths in SPARQL"
* **Categories**: 1, 2, 3, 4, 5, 6, 7, 8+
* **Legend**: Located at the top-center of the chart.
* **"PoG"**: Represented by a light blue rectangle.
* **"PoG-E"**: Represented by a dark gray rectangle.
### Detailed Analysis
The chart displays paired bars for each category on the x-axis, representing "PoG" (light blue) and "PoG-E" (dark gray).
* **Path Length 1**:
* PoG: Approximately 50% accuracy.
* PoG-E: Approximately 50% accuracy.
* **Path Length 2**:
* PoG: Approximately 90% accuracy.
* PoG-E: Approximately 60% accuracy.
* **Path Length 3**:
* PoG: Approximately 96% accuracy.
* PoG-E: Approximately 95% accuracy.
* **Path Length 4**:
* PoG: Approximately 82% accuracy.
* PoG-E: Approximately 82% accuracy.
* **Path Length 5**:
* PoG: Approximately 76% accuracy.
* PoG-E: Approximately 76% accuracy.
* **Path Length 6**:
* PoG: Approximately 66% accuracy.
* PoG-E: Approximately 66% accuracy.
* **Path Length 7**: No data is presented for path length 7.
* **Path Length 8+**:
* PoG: Approximately 90% accuracy.
* PoG-E: Approximately 88% accuracy.
### Key Observations
* For path length 1, both PoG and PoG-E show similar, moderate accuracy.
* For path length 2, PoG significantly outperforms PoG-E.
* For path lengths 3, 4, 5, and 6, both methods exhibit very similar accuracy levels, with PoG-E being slightly lower or equal to PoG in most cases.
* For path length 8+, both methods show high accuracy, with PoG being slightly higher than PoG-E.
* There is a noticeable dip in accuracy for both methods between path lengths 3 and 6, before a recovery at path length 8+.
* Path length 7 is not represented in the data.
### Interpretation
This bar chart demonstrates the performance of two methods, PoG and PoG-E, in relation to the complexity of SPARQL queries, as measured by the length of the paths within them.
* **Initial Performance (Length 1)**: The similar accuracy at path length 1 suggests that both methods are equally capable of handling very simple queries.
* **Divergence at Length 2**: The significant drop in PoG-E's accuracy at path length 2, while PoG maintains high accuracy, indicates a potential weakness in PoG-E for queries of this specific complexity. This could imply that PoG-E struggles with a particular type of path structure or reasoning required for length 2 paths.
* **Convergence and Decline (Lengths 3-6)**: The convergence of accuracy between PoG and PoG-E for path lengths 3 through 6, and the general decline in accuracy from length 3 to length 6, suggests that as path lengths increase, the task becomes more challenging for both methods. The close performance suggests they might be encountering similar limitations or benefiting from similar underlying mechanisms as complexity grows. The slight edge of PoG in some of these categories might indicate a marginal advantage in handling these intermediate complexities.
* **Recovery at Length 8+**: The resurgence in accuracy for both methods at path length 8+ is notable. This could imply that for very long and complex paths, the methods might employ different strategies or that the nature of these long paths allows for more robust pattern matching or inference, leading to improved performance compared to intermediate lengths. The slight lead of PoG here might suggest it's more resilient to the highest levels of complexity.
* **Missing Data (Length 7)**: The absence of data for path length 7 is an anomaly that prevents a complete understanding of the trend. It's unclear if this is an intentional omission or a data gap.
Overall, the data suggests that PoG is generally more robust or consistently performs better, especially at path length 2 and slightly at longer path lengths. PoG-E shows comparable performance to PoG in many intermediate and longer path lengths but struggles significantly at path length 2. The dip and subsequent recovery in accuracy across path lengths indicate a non-linear relationship between SPARQL path length and the effectiveness of these methods.
</details>
(b) WebQSP
Figure 6. The accuracy of PoG and PoG-E on the CWQ and WebQSP datasets, categorized by the different lengths of the ground-truth answers for each question.
Graph structure pruning. To evaluate the effectiveness of the graph pruning method proposed in Section 4.1, we conduct experiments using 200 random samples from each dataset. We report the average number of entities per question before and after graph reduction, as well as the proportion of entities reduced, in Table 3. The results indicate that up to 54% of entities in the CWQ dataset can be pruned before path exploration. This demonstrates the effectiveness of eliminating irrelevant data from the outset.
Case study: interpretable reasoning. We also conduct the case study to demonstrate interpretability of PoG, we present three reasoning examples in Table 9 of Appendix B.5. These examples feature questions with one, two, and three entities, respectively. Through the case study, we showcase PoG’s effectiveness in handling multi-entity and multi-hop tasks by providing faithful and interpretable reasoning paths that lead to accurate answers.
To further evaluate the effectiveness and efficiency of PoG, we perform additional experiments, including pruning beam search strategy ablation and prompt setting ablation (Appendix B.1), reasoning faithfulness analysis (Appendix B.2), error analysis (Appendix B.3), LLM calls cost and running time analysis (Appendix B.4), and graph reduction and path pruning case study (Appendix B.5).
## 6. Conclusion
In this paper, we introduce Paths-over-Graphs (PoG), a novel method that integrates LLMs with KGs to enable faithful and interpretable reasoning. PoG addresses complex reasoning tasks through a three-phase dynamic multi-hop path exploration, combining the inherent knowledge of LLMs with factual information from KGs. Efficiency is enhanced by graph-structured pruning and a three-step pruning process to effectively narrow down candidate paths. Extensive experiments on five public datasets demonstrate that PoG outperforms existing baselines, showcasing its superior reasoning capabilities and interoperability.
## 7. Acknowledgment
Xiaoyang Wang is supported by the Australian Research Council DP230101445 and DP240101322. Wenjie Zhang is supported by the Australian Research Council DP230101445 and FT210100303.
## References
- (1)
- Baek et al. (2023b) Jinheon Baek, Alham Fikri Aji, Jens Lehmann, and Sung Ju Hwang. 2023b. Direct Fact Retrieval from Knowledge Graphs without Entity Linking. In ACL.
- Baek et al. (2023a) Jinheon Baek, Alham Fikri Aji, and Amir Saffari. 2023a. Knowledge-augmented language model prompting for zero-shot knowledge graph question answering. arXiv preprint arXiv:2306.04136 (2023).
- Berant et al. (2013) Jonathan Berant, Andrew Chou, Roy Frostig, and Percy Liang. 2013. Semantic Parsing on Freebase from Question-Answer Pairs. In EMNLP. 1533–1544.
- Besta et al. (2024) Maciej Besta, Nils Blach, Ales Kubicek, Robert Gerstenberger, Michal Podstawski, Lukas Gianinazzi, Joanna Gajda, Tomasz Lehmann, Hubert Niewiadomski, Piotr Nyczyk, et al. 2024. Graph of thoughts: Solving elaborate problems with large language models. In AAAI, Vol. 38. 17682–17690.
- Bollacker et al. (2008) Kurt Bollacker, Colin Evans, Praveen Paritosh, Tim Sturge, and Jamie Taylor. 2008. Freebase: a collaboratively created graph database for structuring human knowledge. In SIGMOD. 1247–1250.
- Brown (2020) Tom B Brown. 2020. Language models are few-shot learners. arXiv preprint arXiv:2005.14165 (2020).
- Chen et al. (2024) Zhikai Chen, Haitao Mao, Hang Li, Wei Jin, Hongzhi Wen, Xiaochi Wei, Shuaiqiang Wang, Dawei Yin, Wenqi Fan, Hui Liu, et al. 2024. Exploring the potential of large language models (llms) in learning on graphs. ACM SIGKDD Explorations Newsletter 25, 2 (2024), 42–61.
- Chowdhery et al. (2023) Aakanksha Chowdhery, Sharan Narang, Jacob Devlin, Maarten Bosma, Gaurav Mishra, Adam Roberts, Paul Barham, Hyung Won Chung, Charles Sutton, Sebastian Gehrmann, et al. 2023. Palm: Scaling language modeling with pathways. Journal of Machine Learning Research 24, 240 (2023), 1–113.
- Das et al. (2021) Rajarshi Das, Manzil Zaheer, Dung Thai, Ameya Godbole, Ethan Perez, Jay Yoon Lee, Lizhen Tan, Lazaros Polymenakos, and Andrew McCallum. 2021. Case-based Reasoning for Natural Language Queries over Knowledge Bases. In EMNLP.
- Fu et al. (2022) Yao Fu, Hao Peng, Ashish Sabharwal, Peter Clark, and Tushar Khot. 2022. Complexity-based prompting for multi-step reasoning. In ICLR.
- Gu et al. (2023) Yu Gu, Xiang Deng, and Yu Su. 2023. Don’t Generate, Discriminate: A Proposal for Grounding Language Models to Real-World Environments. In ACL.
- Gu et al. (2021) Yu Gu, Sue Kase, Michelle Vanni, Brian Sadler, Percy Liang, Xifeng Yan, and Yu Su. 2021. Beyond I.I.D.: Three Levels of Generalization for Question Answering on Knowledge Bases. In WWW. 3477–3488.
- Guo et al. (2023) Jiayan Guo, Lun Du, Hengyu Liu, Mengyu Zhou, Xinyi He, and Shi Han. 2023. Gpt4graph: Can large language models understand graph structured data? an empirical evaluation and benchmarking. arXiv preprint arXiv:2305.15066 (2023).
- Guo et al. (2019) Lingbing Guo, Zequn Sun, and Wei Hu. 2019. Learning to exploit long-term relational dependencies in knowledge graphs. In International conference on machine learning. PMLR, 2505–2514.
- Guo et al. (2024) Tiezheng Guo, Qingwen Yang, Chen Wang, Yanyi Liu, Pan Li, Jiawei Tang, Dapeng Li, and Yingyou Wen. 2024. Knowledgenavigator: Leveraging large language models for enhanced reasoning over knowledge graph. Complex & Intelligent Systems 10, 5 (2024), 7063–7076.
- Huang et al. (2025) Chengkai Huang, Yu Xia, Rui Wang, Kaige Xie, Tong Yu, Julian McAuley, and Lina Yao. 2025. Embedding-Informed Adaptive Retrieval-Augmented Generation of Large Language Models. In COLING.
- Jiang et al. (2023) Jinhao Jiang, Kun Zhou, Zican Dong, Keming Ye, Wayne Xin Zhao, and Ji-Rong Wen. 2023. Structgpt: A general framework for large language model to reason over structured data. arXiv preprint arXiv:2305.09645 (2023).
- Kedia et al. (2022) Akhil Kedia, Mohd Abbas Zaidi, and Haejun Lee. 2022. FiE: Building a Global Probability Space by Leveraging Early Fusion in Encoder for Open-Domain Question Answering. In EMNLP.
- Khot et al. (2022) Tushar Khot, Harsh Trivedi, Matthew Finlayson, Yao Fu, Kyle Richardson, Peter Clark, and Ashish Sabharwal. 2022. Decomposed prompting: A modular approach for solving complex tasks. arXiv preprint arXiv:2210.02406 (2022).
- Kim et al. (2023) Jiho Kim, Yeonsu Kwon, Yohan Jo, and Edward Choi. 2023. Kg-gpt: A general framework for reasoning on knowledge graphs using large language models. arXiv preprint arXiv:2310.11220 (2023).
- Kojima et al. (2022) Takeshi Kojima, Shixiang Shane Gu, Machel Reid, Yutaka Matsuo, and Yusuke Iwasawa. 2022. Large language models are zero-shot reasoners. NeurIPS (2022).
- Li et al. (2024a) Fan Li, Xiaoyang Wang, Dawei Cheng, Wenjie Zhang, Ying Zhang, and Xuemin Lin. 2024a. Hypergraph Self-supervised Learning with Sampling-efficient Signals. arXiv preprint arXiv:2404.11825 (2024).
- Li et al. (2024b) Fan Li, Zhiyu Xu, Dawei Cheng, and Xiaoyang Wang. 2024b. AdaRisk: Risk-adaptive Deep Reinforcement Learning for Vulnerable Nodes Detection. IEEE TKDE (2024).
- Li et al. (2023a) Tianle Li, Xueguang Ma, Alex Zhuang, Yu Gu, Yu Su, and Wenhu Chen. 2023a. Few-shot In-context Learning on Knowledge Base Question Answering. In ACL.
- Li et al. (2023b) Xingxuan Li, Ruochen Zhao, Yew Ken Chia, Bosheng Ding, Shafiq Joty, Soujanya Poria, and Lidong Bing. 2023b. Chain-of-knowledge: Grounding large language models via dynamic knowledge adapting over heterogeneous sources. arXiv preprint arXiv:2305.13269 (2023).
- Luo et al. (2023) Linhao Luo, Jiaxin Ju, Bo Xiong, Yuan-Fang Li, Gholamreza Haffari, and Shirui Pan. 2023. Chatrule: Mining logical rules with large language models for knowledge graph reasoning. arXiv preprint arXiv:2309.01538 (2023).
- Luo et al. (2024) Linhao Luo, Yuanfang Li, Reza Haf, and Shirui Pan. 2024. Reasoning on Graphs: Faithful and Interpretable Large Language Model Reasoning. In ICLR.
- Ma et al. (2024) Shengjie Ma, Chengjin Xu, Xuhui Jiang, Muzhi Li, Huaren Qu, and Jian Guo. 2024. Think-on-Graph 2.0: Deep and Interpretable Large Language Model Reasoning with Knowledge Graph-guided Retrieval. arXiv preprint arXiv:2407.10805 (2024).
- Pan et al. (2024) Shirui Pan, Linhao Luo, Yufei Wang, Chen Chen, Jiapu Wang, and Xindong Wu. 2024. Unifying large language models and knowledge graphs: A roadmap. TKDE (2024).
- Peters et al. (2019) Matthew E Peters, Mark Neumann, Robert L Logan IV, Roy Schwartz, Vidur Joshi, Sameer Singh, and Noah A Smith. 2019. Knowledge enhanced contextual word representations. arXiv preprint arXiv:1909.04164 (2019).
- Petrochuk and Zettlemoyer (2018) Michael Petrochuk and Luke Zettlemoyer. 2018. SimpleQuestions Nearly Solved: A New Upperbound and Baseline Approach. In EMNLP. 554–558.
- Petroni et al. (2020) Fabio Petroni, Aleksandra Piktus, Angela Fan, Patrick Lewis, Majid Yazdani, Nicola De Cao, James Thorne, Yacine Jernite, Vladimir Karpukhin, Jean Maillard, et al. 2020. KILT: a benchmark for knowledge intensive language tasks. arXiv preprint arXiv:2009.02252 (2020).
- Rawte et al. (2023) Vipula Rawte, Amit Sheth, and Amitava Das. 2023. A survey of hallucination in large foundation models. arXiv preprint arXiv:2309.05922 (2023).
- Reimers and Gurevych (2019) Nils Reimers and Iryna Gurevych. 2019. Sentence-BERT: Sentence Embeddings using Siamese BERT-Networks. In EMNLP.
- Sima et al. (2024) Qing Sima, Jianke Yu, Xiaoyang Wang, Wenjie Zhang, Ying Zhang, and Xuemin Lin. 2024. Deep Overlapping Community Search via Subspace Embedding. arXiv preprint arXiv:2404.14692 (2024).
- Sun et al. (2019) Haitian Sun, Tania Bedrax-Weiss, and William W Cohen. 2019. Pullnet: Open domain question answering with iterative retrieval on knowledge bases and text. arXiv preprint arXiv:1904.09537 (2019).
- Sun et al. (2024) Jiashuo Sun, Chengjin Xu, Lumingyuan Tang, Saizhuo Wang, Chen Lin, Yeyun Gong, Lionel Ni, Heung-Yeung Shum, and Jian Guo. 2024. Think-on-Graph: Deep and Responsible Reasoning of Large Language Model on Knowledge Graph. In ICLR.
- Talmor and Berant (2018) Alon Talmor and Jonathan Berant. 2018. The Web as a Knowledge-Base for Answering Complex Questions. In NAACL.
- Talmor et al. (2018) Alon Talmor, Jonathan Herzig, Nicholas Lourie, and Jonathan Berant. 2018. Commonsenseqa: A question answering challenge targeting commonsense knowledge. arXiv preprint arXiv:1811.00937 (2018).
- Tan et al. (2023) Xingyu Tan, Jingya Qian, Chen Chen, Sima Qing, Yanping Wu, Xiaoyang Wang, and Wenjie Zhang. 2023. Higher-Order Peak Decomposition. In CIKM.
- Touvron et al. (2023) Hugo Touvron, Louis Martin, Kevin Stone, Peter Albert, Amjad Almahairi, Yasmine Babaei, Nikolay Bashlykov, Soumya Batra, Prajjwal Bhargava, Shruti Bhosale, et al. 2023. Llama 2: Open foundation and fine-tuned chat models. arXiv preprint arXiv:2307.09288 (2023).
- Wang et al. (2024a) Jinghao Wang, Yanping Wu, Xiaoyang Wang, Ying Zhang, Lu Qin, Wenjie Zhang, and Xuemin Lin. 2024a. Efficient Influence Minimization via Node Blocking. Proc. VLDB Endow. (2024).
- Wang et al. (2024b) Kai Wang, Yuwei Xu, Zhiyong Wu, and Siqiang Luo. 2024b. LLM as Prompter: Low-resource Inductive Reasoning on Arbitrary Knowledge Graphs. In ACL.
- Wang et al. (2022) Xuezhi Wang, Jason Wei, Dale Schuurmans, Quoc Le, Ed Chi, Sharan Narang, Aakanksha Chowdhery, and Denny Zhou. 2022. Self-consistency improves chain of thought reasoning in language models. arXiv preprint arXiv:2203.11171 (2022).
- Wei et al. (2022) Jason Wei, Xuezhi Wang, Dale Schuurmans, Maarten Bosma, Fei Xia, Ed Chi, Quoc V Le, Denny Zhou, et al. 2022. Chain-of-thought prompting elicits reasoning in large language models. NeurIPS (2022).
- Wen et al. (2024) Yilin Wen, Zifeng Wang, and Jimeng Sun. 2024. Mindmap: Knowledge graph prompting sparks graph of thoughts in large language models. In ACL.
- Wu et al. (2024) Yanping Wu, Renjie Sun, Xiaoyang Wang, Dong Wen, Ying Zhang, Lu Qin, and Xuemin Lin. 2024. Efficient Maximal Frequent Group Enumeration in Temporal Bipartite Graphs. Proc. VLDB Endow. (2024).
- Yao et al. (2024) Shunyu Yao, Dian Yu, Jeffrey Zhao, Izhak Shafran, Tom Griffiths, Yuan Cao, and Karthik Narasimhan. 2024. Tree of thoughts: Deliberate problem solving with large language models. NeurIPS (2024).
- Yao et al. (2022) Shunyu Yao, Jeffrey Zhao, Dian Yu, Nan Du, Izhak Shafran, Karthik Narasimhan, and Yuan Cao. 2022. React: Synergizing reasoning and acting in language models. arXiv preprint arXiv:2210.03629 (2022).
- Ye et al. (2021) Xi Ye, Semih Yavuz, Kazuma Hashimoto, Yingbo Zhou, and Caiming Xiong. 2021. Rng-kbqa: Generation augmented iterative ranking for knowledge base question answering. arXiv preprint arXiv:2109.08678 (2021).
- Yih et al. (2016) Wen-tau Yih, Matthew Richardson, Chris Meek, Ming-Wei Chang, and Jina Suh. 2016. The Value of Semantic Parse Labeling for Knowledge Base Question Answering. In ACL. 201–206.
- Zhang et al. (2021) Hang Zhang, Yeyun Gong, Yelong Shen, Weisheng Li, Jiancheng Lv, Nan Duan, and Weizhu Chen. 2021. Poolingformer: Long document modeling with pooling attention. In ICML. 12437–12446.
- Zhang et al. (2023) Zhuosheng Zhang, Aston Zhang, Mu Li, and Alex Smola. 2023. Automatic Chain of Thought Prompting in Large Language Models. In ICLR.
- Zhao et al. (2023) Ruochen Zhao, Xingxuan Li, Shafiq Joty, Chengwei Qin, and Lidong Bing. 2023. Verify-and-Edit: A Knowledge-Enhanced Chain-of-Thought Framework. In ACL.
## Appendix A Algorithm
### A.1. Exploration
We summarize the comprehensive algorithmic procedure for exploration detailed in Section 4.2 as presented in Algorithm 1.
AlgoLine0.1
Input : Question subgraph ( $\mathcal{G}_{q}$ ), source KG ( $\mathcal{G}$ ),question and split question ( $Q=q$ + $q_{split}$ ), topic entities ( $Topic(q)$ ), LLM indicator ( $I_{\text{LLM}}$ ), predict depth ( $D_{\text{predict}}$ ), maximum depth ( $D_{\max}$ ), maximum width ( $W_{\max}$ ), and path pruning case ( $case$ )
Output : PoG answers ( $a(q)$ ), final reasoning path ( $Paths_{f}(q)$ )
AlgoLine0.2
/* Start with topic entity path exploration */ AlgoLine0.3
$List_{T}\leftarrow$ Reorder ( $Topic(q),I_{\text{LLM}}$ ), $D\leftarrow$ min( $D_{\text{predict}},D_{\max}$ ); AlgoLine0.4
AlgoLine0.5
while $D\leq D_{\max}$ do $Paths_{t}\leftarrow\text{EntityPathFind}$ ( $List_{T},D$ , $\mathcal{G}_{q}$ ); AlgoLine0.6
$\text{PathPruning}(Paths_{t},Q,I_{\text{LLM}},W_{\max},D_{\max},List_{T},case)$ ; AlgoLine0.7
$Answer,Paths_{T}\leftarrow\text{QuestionAnswering}(Paths_{t},Q,I_{\text{LLM}})$ ; AlgoLine0.8
AlgoLine0.9
if $\texttt{"\{Yes\}"}\text{ in }Answer$ then return $Answer,Paths_{T}$ ; AlgoLine0.10
else $D\leftarrow D+1$ ; AlgoLine0.11
AlgoLine0.12
/* LLM supplement path exploration procedure */ AlgoLine0.13
$Paths_{s}\leftarrow[]$ ; AlgoLine0.14
AlgoLine0.15
$Predict(q)\leftarrow$ SupplementPrediction( $Paths_{T},Q,I_{\text{LLM}}$ ); AlgoLine0.16
for each $e,I_{sup(e)}\in Predict(q)$ do AlgoLine0.17
$List_{S}\leftarrow$ Reorder ( $List_{T}+e,I_{sup(e)}$ ); AlgoLine0.18
$Paths_{s}^{\prime}\leftarrow\text{EntityPathFind}$ ( $List_{S},D_{\max}$ , $\mathcal{G}_{q}$ ); AlgoLine0.19
$Paths_{s}\leftarrow Paths_{s}+\text{FuzzySelect}$ ( $Paths_{s}^{\prime},I_{sup(e)},W_{\max}$ ); AlgoLine0.20
AlgoLine0.21
$\text{PathPruning}(Paths_{s},Q,I_{\text{LLM}},W_{\max},D_{\max},List_{S},case)$ ; AlgoLine0.22
$Answer,Paths_{S}\leftarrow\text{QuestionAnswering}(Paths_{s},Q,I_{\text{LLM}})$ ; AlgoLine0.23
AlgoLine0.24
if "{Yes}" in $Answer$ then return $Answer,Paths_{S}$ ; AlgoLine0.25
AlgoLine0.26
AlgoLine0.27
/* Node expand exploration procedure */ AlgoLine0.28
$Visted\leftarrow\emptyset$ , $D\leftarrow 1$ , $Paths_{e}\leftarrow Paths_{T}+Paths_{S}$ ; AlgoLine0.29
$\text{PathPruning}(Paths_{e},Q,I_{\text{LLM}},W_{\max},D_{\max},List_{T},case)$ ;; AlgoLine0.30
AlgoLine0.31
while $D\leq D_{\max}$ do for each $e\in\text{ExtractEntity}(Paths_{e})\land e\notin Visted$ do $Related\_edges=\text{Find\_1\_hop\_Edges}(\mathcal{G},e)$ ; AlgoLine0.32
$Paths_{e}\leftarrow\text{MergeTogether}(Paths_{e},Related\_edge)$ ; AlgoLine0.33
AlgoLine0.34
$\text{PathPruning}(Paths_{e},Q,I_{\text{LLM}},W_{\max},D_{\max},List_{T},case)$ ; AlgoLine0.35
$Answer,Paths_{e}\leftarrow\text{QuestionAnswering}(Paths_{e},Q,I_{\text{LLM}})$ ; AlgoLine0.36
if $\texttt{"\{Yes\}"}\text{ in }Answer$ then return $Answer,Paths_{e}$ ; AlgoLine0.37
else $Visted\leftarrow Visted\cup e$ ; $D\leftarrow D+1$ ; AlgoLine0.38
AlgoLine0.39
$Paths_{l}\leftarrow Paths_{T}+Paths_{S}+Paths_{E}$ ; AlgoLine0.40
$\text{PathPruning}(Paths_{l},Q,I_{\text{LLM}},W_{\max},D_{\max},List_{T},case)$ ; AlgoLine0.41
AlgoLine0.42
$Answer,Paths_{L}\leftarrow\text{QuestionAnsweringFinal}(Paths_{l},Q,I_{\text{ LLM}})$ ; AlgoLine0.43
Return $Answer,Paths_{L}$ ; AlgoLine0.44
AlgoLine0.45
Algorithm 1 Exploration
45
45
45
45
45
45
45
45
45
45
45
45
45
45
45
45
45
45
45
45
45
45
45
45
45
45
45
45
45
45
45
45
45
45
45
45
45
45
45
45
45
45
45
45
45
### A.2. Path Pruning
We summarize the comprehensive algorithmic procedure of path pruning detailed in Section 4.3 as presented in Algorithm 2.
AlgoLine0.1
Input : Candidate paths( $Paths_{c}$ ), question and split question ( $Q=q+q_{split}$ ), indicator ( $I$ ), maximum width ( $W_{\max}$ ), maximum depth ( $D_{\max}$ ), entity list ( $list$ )
Output : Pruned candidate paths ( $Paths_{c}$ )
if Case = Fuzzy Selection Only then $\text{FuzzySelect}(Paths_{c},Q,I,W_{\max})$ ; AlgoLine0.2
else if Case = Fuzzy + Precise Path Selection then $\text{FuzzySelect}(Paths_{c},Q,I,W_{1})$ ; AlgoLine0.3
$\text{PrecisePathSelect}(Paths_{c},Q,I,W_{\max})$ ; AlgoLine0.4
else if Case = Fuzzy + Branch Reduced Selection then $\text{FuzzySelect}(Paths_{c},Q,I,W_{1})$ ; AlgoLine0.5
$\text{BranchReduceSelect}(Paths_{c},Q,I,W_{\max},D_{\max},list)$ ; AlgoLine0.6
AlgoLine0.7
else if Case = Fuzzy + Branch Reduced + Precise Path then /* case = 3-Step Beam Search */ $\text{FuzzySelect}(Paths_{c},Q,I,W_{1})$ ; AlgoLine0.8
$\text{BranchReduceSelect}(Paths_{c},Q,I,W_{2},D_{\max},list)$ ; AlgoLine0.9
$\text{PrecisePathSelect}(Paths_{c},Q,I,W_{\max})$ ; AlgoLine0.10
AlgoLine0.11
Procedure BranchReduceSelect $(Paths_{c},Q,I,W,D_{\max},list)$ AlgoLine0.12
$D\leftarrow 1$ , $Paths_{e}\leftarrow\emptyset$ ; AlgoLine0.13
AlgoLine0.14
while $|Paths_{c}|\geq W\land D\leq D_{\max}$ do AlgoLine0.15
for each $e\in list$ do AlgoLine0.16
$Paths_{e}\leftarrow Paths_{e}\cup\text{ExtractHeadSteps}(Paths_{c},e,D)$ ; AlgoLine0.17
if $|Paths_{e}|>W$ then $\text{PrecisePathSelect}(Paths_{e},Q,I,W)$ ; AlgoLine0.18
AlgoLine0.19
$Paths_{c}\leftarrow\text{IntersectMatchUpdate}(Paths_{e},Paths_{c})$ ; AlgoLine0.20
$Paths_{e}\leftarrow\emptyset$ ; AlgoLine0.21
$D\leftarrow D+1$ ; AlgoLine0.22
AlgoLine0.23
if $|Paths_{c}|>W$ then $\text{PrecisePathSelect}(Paths_{c},Q,I,W)$ ; AlgoLine0.24
AlgoLine0.25
Algorithm 2 PathPruning
25
25
25
25
25
25
25
25
25
25
25
25
25
25
25
25
25
25
25
25
25
25
25
25
25
## Appendix B Experiment
### B.1. Additional Ablation Study
Compare the effect of different beam search strategies. As introduced in Section 4.3, PoG supports various beam search strategies, ranging from non-reliant to fully reliant on LLMs, selectable in a user-friendly manner. To evaluate the computational cost and performance, we test four cases outlined in Algorithm 2. In the 3-Step Beam Search case, we set $W_{2}=20$ for internal narrowing. The Fuzzy Selection approach, as described in Section 4.3, utilizes all candidate paths and a LLM-generated indicator for encoding and comparison. We report accuracy, average LLM calls in total, and average token input during the path pruning for each beam search strategy applied to PoG and PoG-E in Table 4 and Table 5. These results indicate that PoG/PoG-E with Fuzzy and Precise Path Selection achieves the highest accuracy. Additionally, the BranchReduced Selection method, which leverages the graph structure, not only delivers excellent results but also reduces token usage by over 50% (65%) with only a ±2% (±4.3%) difference in accuracy on PoG (PoG-E) compared to the best-performing strategy. Furthermore, the Fuzzy Selection method, which employs lightweight models instead of relying solely on LLMs, also demonstrates strong performance. These results validate the effectiveness of our beam search strategies and underscore the importance of structure-based faithful path reasoning.
Table 4. Performance comparison of PoG with different beam search methods on CWQ and WebQSP.
| PoG | Evaluation | CWQ | WebQSP |
| --- | --- | --- | --- |
| w/ Fuzzy Selection | Accuracy | 57.1 | 86.4 |
| Token Input | - | - | |
| LLM Calls | 6.8 | 6.5 | |
| w/ Fuzzy and | Accuracy | 79.3 | 93.0 |
| BranchReduced Selection | Token Input | 101,455 | 328,742 |
| LLM Calls | 9.7 | 9.3 | |
| w/ Fuzzy and | Accuracy | 81.4 | 93.9 |
| Precise Path Selection | Token Input | 216,884 | 617,448 |
| LLM Calls | 9.1 | 7.5 | |
| w/ 3-Step Beam Search | Accuracy | 79.8 | 91.9 |
| Token Input | 102,036 | 369,175 | |
| LLM Calls | 8.8 | 9.0 | |
How do summary prompts affect? Inspired by GoT (Besta et al., 2024), we utilize summary prompts to reduce LLM hallucinations and decrease computational costs. To evaluate their impact, we conduct an ablation study comparing PoG and PoG-E with and without path summarization. We measure both accuracy and average token input to the LLM API during the path pruning phase to measure efficiency and effectiveness. The results, present in Tabel 6, show that using graph summaries increases accuracy by up to 10% on the CWQ dataset with PoG-E, while reducing token input by up to 36% on WebQSP. These results indicate hat path summarization effectively minimizes LLM hallucinations, enhances the LLM’s understanding of the explored paths, facilitates answer retrieval, enables earlier termination of the reasoning process, and reduces costs.
Table 5. Performance comparison of PoG-E with different beam search methods among CWQ and WebQSP datasets.
| PoG-E | Evaluation | CWQ | WebQSP |
| --- | --- | --- | --- |
| w/ FuzzySelect | Accuracy | 62.31 | 82.3 |
| Token Input | - | - | |
| Ave LLM Calls | 6 | 6.3 | |
| w/ Fuzzy and | Accuracy | 71.9 | 88.4 |
| BranchReduced Selection | Token Input | 128,407 | 371,083 |
| Ave LLM Calls | 9.4 | 9.1 | |
| w/ Fuzzy and | Accuracy | 80.4 | 91.4 |
| Precise Path Selection | Token Input | 344,747 | 603,261 |
| Ave LLM Calls | 8.3 | 7.4 | |
| w/ 3-Step Beam Search | Accuracy | 73.87 | 89.4 |
| Token Input | 120,159 | 411,283 | |
| Ave LLM Calls | 8.3 | 9.1 | |
Table 6. Performance comparison of PoG and PoG-E with and without path summarizing on CWQ and WebQSP datasets.
| Method | Evaluation | CWQ | WebQSP |
| --- | --- | --- | --- |
| PoG | | | |
| w/ Path Summarizing | Accuracy | 81.4 | 93.9 |
| Token Input | 216,884 | 297,359 | |
| w/o Path Summarizing | Accuracy | 74.7 | 91.9 |
| Token Input | 273,447 | 458,545 | |
| PoG-E | | | |
| w/ Path Summarizing | Accuracy | 80.4 | 91.4 |
| Token Input | 314,747 | 273,407 | |
| w/o Path Summarizing | Accuracy | 70.4 | 90.4 |
| Token Input | 419,679 | 428,545 | |
### B.2. Reasoning Faithfulness Analysis
Overlap ratio between explored paths and ground-truth paths. We analyzed correctly answered samples from three datasets to investigate the overlap ratio between the paths $P$ explored by PoG and the ground-truth paths $S$ in SPARQL queries. The overlap ratio is defined as the proportion of overlapping relations to the total number of relations in the ground-truth SPARQL path:
$$
Ratio(P)=\frac{|Relation(P)\cap Relation(S)|}{|Relation(S)|},
$$
where $Relation(P)$ denotes the set of relations in path $P$ . Figure 7 illustrates the distribution of questions across different overlap ratios. For the WebQSP dataset, PoG achieves the highest proportion of fully overlapping paths with the ground truth, reaching approximately 60% accuracy. In contrast, PoG-E applied to the GrailQA dataset shows the highest proportion of paths with up to 70% non-overlapping relations, indicating that PoG-E explores novel paths to derive the answers. The different results between PoG and PoG-E are due to PoG-E’s strategy of randomly selecting one related edge from each clustered edge. This approach highlights the effectiveness of our structure-based path exploration method in generating diverse and accurate reasoning paths.
<details>
<summary>x11.png Details</summary>
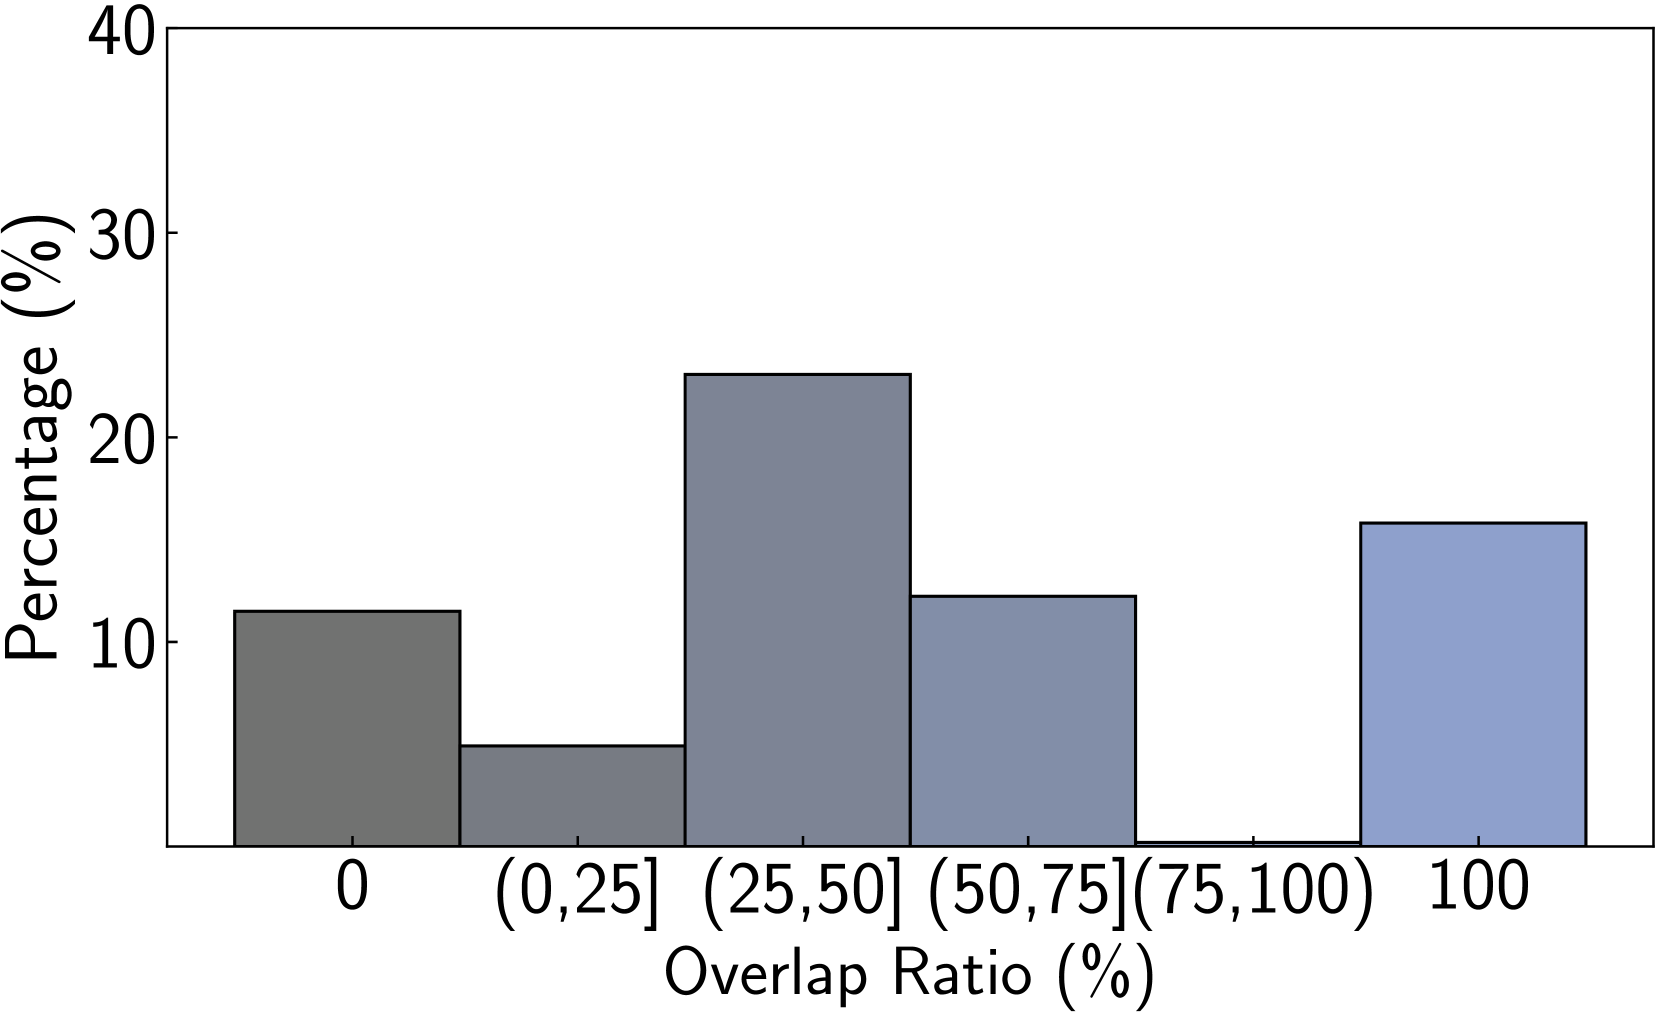
### Visual Description
## Bar Chart: Percentage Distribution by Overlap Ratio
### Overview
This image displays a bar chart illustrating the percentage distribution across different overlap ratio ranges. The x-axis represents the "Overlap Ratio (%)", and the y-axis represents the "Percentage (%)". The chart shows five distinct bars, each corresponding to a specific range of overlap ratios, with varying heights indicating their respective percentages.
### Components/Axes
* **X-axis Title:** "Overlap Ratio (%)"
* **X-axis Labels:**
* "0"
* "(0,25]"
* "(25,50]"
* "(50,75]"
* "100"
* **Y-axis Title:** "Percentage (%)"
* **Y-axis Labels:** 0, 10, 20, 30, 40. The scale increments by 10.
### Content Details
The chart displays the following bars, from left to right:
1. **Bar 1 (Dark Grey):** Corresponds to an overlap ratio of "0".
* **Height:** Approximately 12%.
2. **Bar 2 (Light Grey):** Corresponds to an overlap ratio range of "(0,25]".
* **Height:** Approximately 5%.
3. **Bar 3 (Medium Grey/Blue):** Corresponds to an overlap ratio range of "(25,50]".
* **Height:** Approximately 23%.
4. **Bar 4 (Light Blue/Grey):** Corresponds to an overlap ratio range of "(50,75]".
* **Height:** Approximately 12%.
5. **Bar 5 (Light Blue):** Corresponds to an overlap ratio of "100".
* **Height:** Approximately 16%.
**Note:** The x-axis labels are not perfectly aligned with the bars. The first bar appears to be centered around "0", the second bar between "0" and "25", the third between "25" and "50", the fourth between "50" and "75", and the fifth bar is labeled "100" and appears to represent the range up to and including 100%. There is a gap between the "(50,75]" label and the "100" label, suggesting a missing category or a different representation for the "100" value. However, the bar labeled "100" is positioned to the right of the "(50,75]" range, and its height is clearly depicted.
### Key Observations
* The highest percentage (approximately 23%) is observed for the overlap ratio range of (25,50]%.
* The lowest percentage (approximately 5%) is observed for the overlap ratio range of (0,25]%.
* There are significant variations in percentages across the different overlap ratio categories.
* The overlap ratio of 0% and the range (50,75]% have similar percentages (approximately 12%).
* The overlap ratio of 100% has a percentage of approximately 16%.
### Interpretation
This bar chart suggests a distribution of data points or occurrences based on their overlap ratio. The peak at the (25,50]% range indicates that this particular overlap ratio is the most common or significant in the dataset being represented. The low percentage at (0,25]% suggests that very low overlap ratios are less frequent. The distribution shows a bimodal tendency, with peaks around (25,50]% and a secondary, smaller peak at 100%. The presence of distinct bars for "0" and "100" suggests these are specific, discrete values of interest, while the bracketed ranges represent intervals. The chart effectively visualizes how the frequency or proportion of data varies with the degree of overlap. Without further context, it's difficult to determine the exact nature of what is being measured (e.g., image segmentation accuracy, text similarity, object detection performance), but the pattern implies that moderate to high overlap ratios are generally more prevalent than very low ones, with a notable concentration in the mid-range.
</details>
(a) CWQ (PoG)
<details>
<summary>x12.png Details</summary>
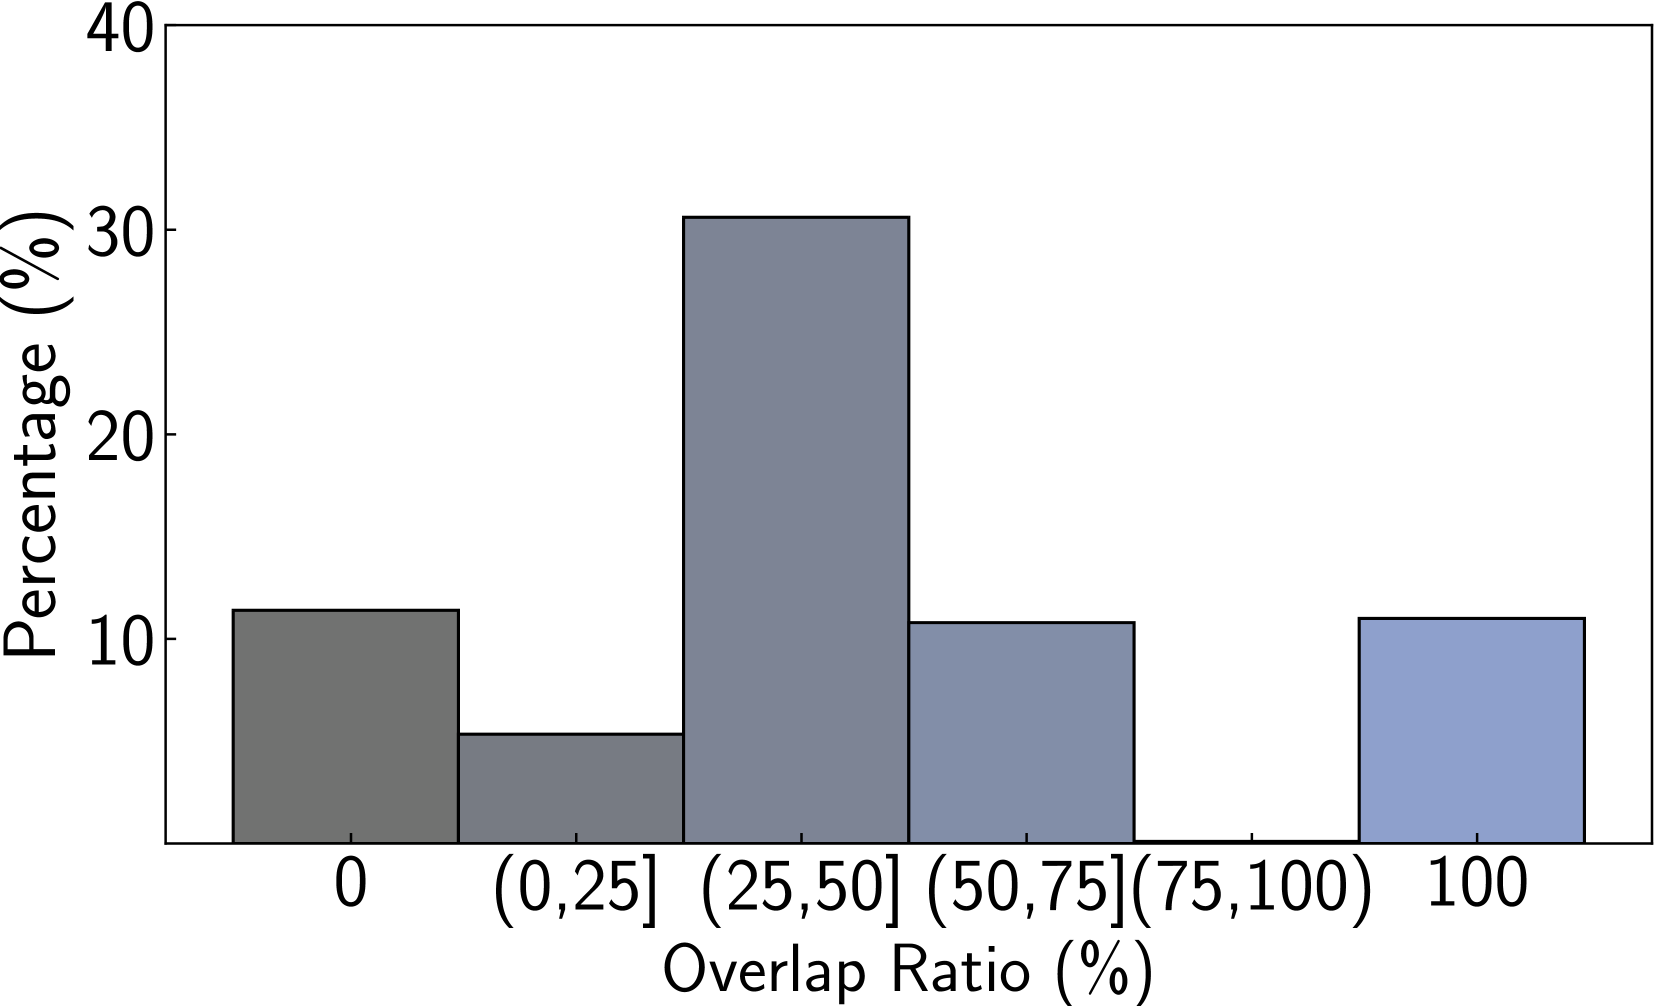
### Visual Description
## Bar Chart: Percentage Distribution of Overlap Ratio
### Overview
This image is a bar chart displaying the percentage distribution of an "Overlap Ratio (%)" across different ranges. The chart has a vertical axis representing "Percentage (%)" and a horizontal axis representing the "Overlap Ratio (%)".
### Components/Axes
* **Vertical Axis (Y-axis):**
* **Title:** "Percentage (%)"
* **Scale:** Ranges from 0 to 40, with major tick marks at 0, 10, 20, 30, and 40. Minor tick marks are present between the major ones, indicating increments of 5.
* **Horizontal Axis (X-axis):**
* **Title:** "Overlap Ratio (%)"
* **Categories:** The axis is divided into bins representing ranges of the overlap ratio. These are:
* `0`
* `(0, 25]` (Overlap ratio from greater than 0% to 25%)
* `(25, 50]` (Overlap ratio from greater than 25% to 50%)
* `(50, 75]` (Overlap ratio from greater than 50% to 75%)
* `100`
### Detailed Analysis
The chart displays five distinct bars, each representing a category on the horizontal axis and its corresponding percentage on the vertical axis.
1. **Bar 1 (Dark Grey):**
* **Category:** `0`
* **Value:** Approximately 11.5% (with an uncertainty of +/- 0.5%).
2. **Bar 2 (Medium Grey):**
* **Category:** `(0, 25]`
* **Value:** Approximately 5% (with an uncertainty of +/- 0.5%).
3. **Bar 3 (Blue-Grey):**
* **Category:** `(25, 50]`
* **Value:** Approximately 30.5% (with an uncertainty of +/- 0.5%). This is the tallest bar in the chart.
4. **Bar 4 (Light Blue-Grey):**
* **Category:** `(50, 75]`
* **Value:** Approximately 10.5% (with an uncertainty of +/- 0.5%).
5. **Bar 5 (Light Blue):**
* **Category:** `100`
* **Value:** Approximately 11% (with an uncertainty of +/- 0.5%).
**Note on X-axis Categories:** The categories `0` and `100` are presented as single points, but visually they correspond to bars. It's possible these represent specific values or bins that are not explicitly defined as ranges like the others. The bin `(0, 25]` implies that values greater than 0 and up to and including 25 are grouped. Similarly for `(25, 50]` and `(50, 75]`. The category `(75, 100]` appears to be missing a bar.
### Key Observations
* The most significant percentage of the "Overlap Ratio" falls within the `(25, 50]` range, accounting for approximately 30.5%.
* The categories `0`, `(50, 75]`, and `100` have relatively similar percentage distributions, ranging from approximately 10.5% to 11.5%.
* The category `(0, 25]` has the second lowest percentage, at approximately 5%.
* There is a noticeable gap in the data presentation, as there is no bar corresponding to the `(75, 100]` range.
### Interpretation
This bar chart visually represents the distribution of data points based on their overlap ratio. The dominant presence of data in the `(25, 50]` range suggests that this is the most common or significant overlap ratio observed in the dataset. The relatively uniform distribution across the `0`, `(50, 75]`, and `100` categories indicates a secondary tier of common overlap ratios. The low percentage in the `(0, 25]` range suggests that very low overlap ratios are less frequent.
The absence of a bar for the `(75, 100]` range is a notable anomaly. This could imply that no data points fell within this specific overlap ratio range, or it could be an omission in the chart's presentation. Further investigation would be needed to confirm the reason for this missing category.
In essence, the data demonstrates a unimodal distribution with a peak in the mid-range overlap ratios, suggesting a tendency for moderate overlap rather than very low or very high overlap, with the exception of the `100` category which is similar to the `0` and `(50, 75]` ranges.
</details>
(b) CWQ (PoG-E)
<details>
<summary>x13.png Details</summary>
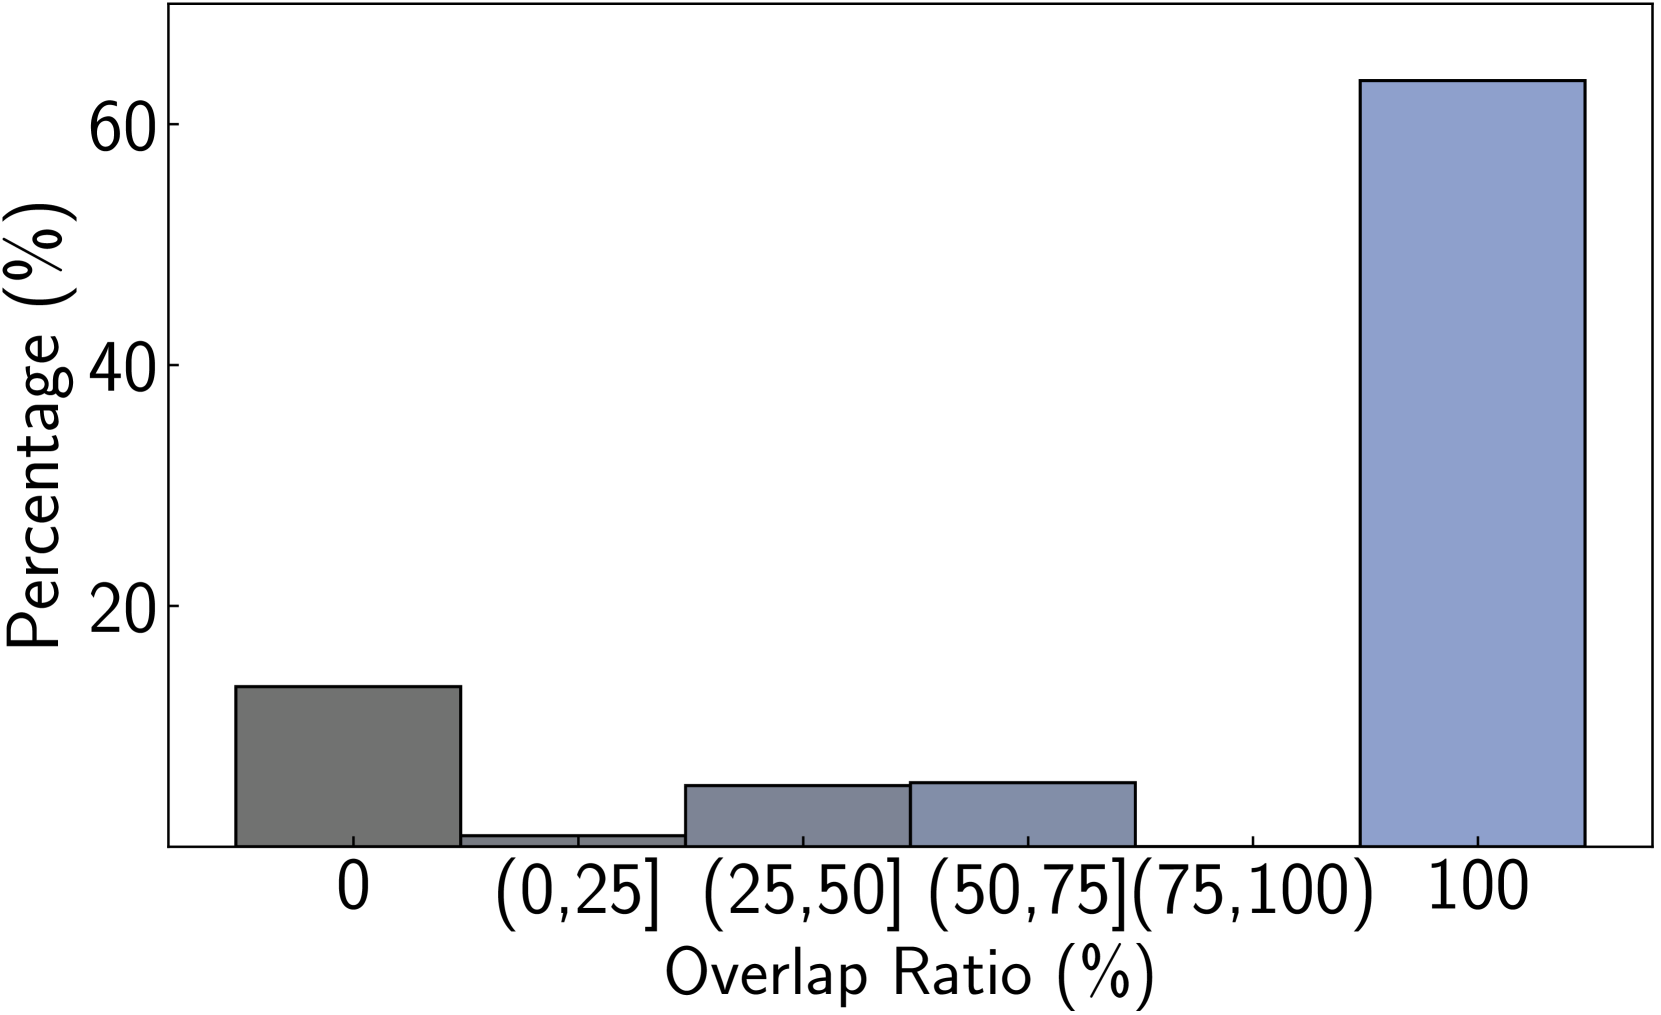
### Visual Description
## Bar Chart: Distribution of Overlap Ratio (%)
### Overview
This image is a bar chart displaying the distribution of an "Overlap Ratio (%)" across different categories. The y-axis represents "Percentage (%)", and the x-axis represents the "Overlap Ratio (%)" categorized into bins.
### Components/Axes
* **Y-axis Title**: "Percentage (%)"
* **Scale**: Increments of 20, ranging from 0 to 60. Markers are at 0, 20, 40, and 60.
* **X-axis Title**: "Overlap Ratio (%)"
* **Categories/Bins**:
* 0
* (0, 25]
* (25, 50]
* (50, 75]
* 100
### Detailed Analysis or Content Details
The chart displays five bars, each representing a category on the x-axis and its corresponding percentage on the y-axis.
1. **Category '0'**:
* **Color**: Dark Grey.
* **Height**: The bar reaches approximately the 15% mark on the y-axis.
* **Approximate Value**: 15% (with an uncertainty of +/- 1%).
2. **Category '(0, 25]'**:
* **Color**: Light Blue/Grey.
* **Height**: The bar reaches approximately the 5% mark on the y-axis.
* **Approximate Value**: 5% (with an uncertainty of +/- 1%).
3. **Category '(25, 50]'**:
* **Color**: Light Blue/Grey.
* **Height**: The bar reaches approximately the 7% mark on the y-axis.
* **Approximate Value**: 7% (with an uncertainty of +/- 1%).
4. **Category '(50, 75]'**:
* **Color**: Light Blue/Grey.
* **Height**: The bar reaches approximately the 7% mark on the y-axis.
* **Approximate Value**: 7% (with an uncertainty of +/- 1%).
5. **Category '100'**:
* **Color**: Medium Blue.
* **Height**: The bar reaches approximately the 63% mark on the y-axis.
* **Approximate Value**: 63% (with an uncertainty of +/- 1%).
### Key Observations
* The most significant portion of the data falls into the '100' overlap ratio category, accounting for approximately 63%.
* The '0' overlap ratio category is the second largest, representing approximately 15%.
* The overlap ratio categories between 0% and 75% (specifically (0, 25], (25, 50], and (50, 75]) have relatively small and similar percentages, each around 5-7%.
* There is a clear bimodal distribution, with peaks at 0% and 100% overlap.
### Interpretation
This bar chart suggests a strong tendency for items or entities being analyzed to either have no overlap (0%) or complete overlap (100%). The intermediate overlap ratios are significantly less common. This pattern could indicate a binary outcome in the process being measured, where results are either entirely distinct or entirely identical, with few cases of partial similarity. For example, this could represent the results of a comparison algorithm where matches are either perfect or non-existent, or a classification task where items are clearly one category or another, with no ambiguity. The dominance of the '100' category suggests that in most instances, the overlap is complete.
</details>
(c) WebQSP (PoG)
<details>
<summary>x14.png Details</summary>
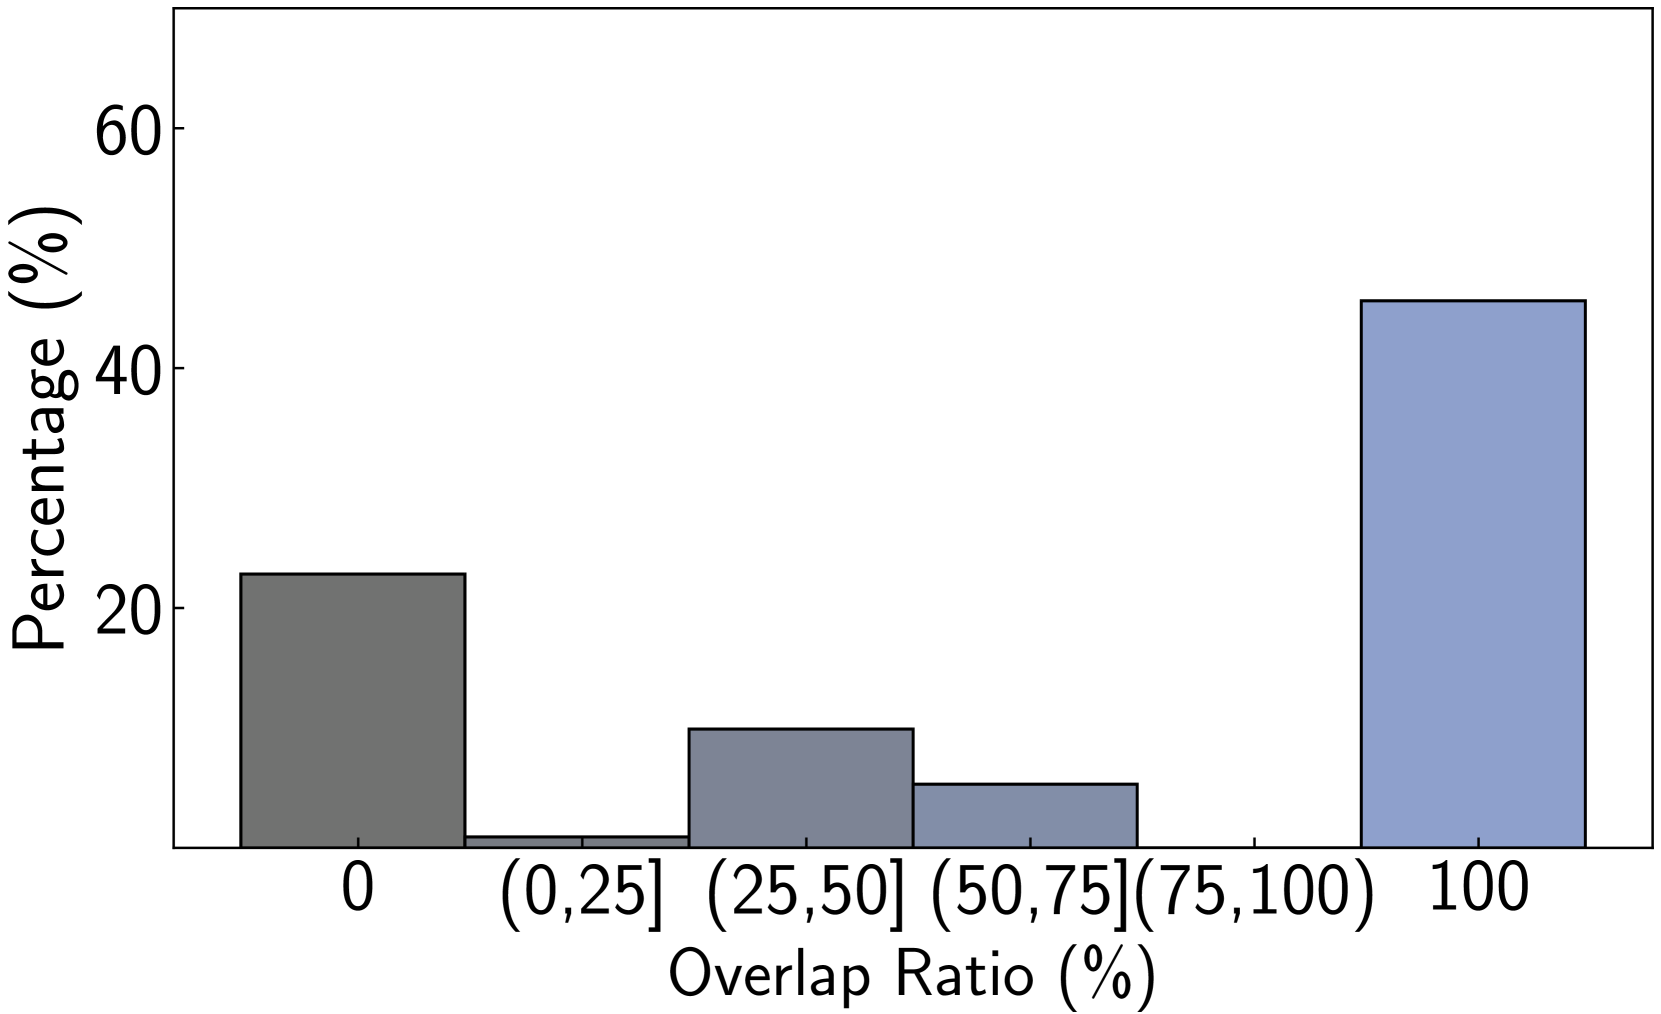
### Visual Description
## Bar Chart: Distribution of Overlap Ratio (%)
### Overview
This image is a bar chart displaying the distribution of an "Overlap Ratio (%)" across different categories. The y-axis represents the "Percentage (%)", and the x-axis represents the "Overlap Ratio (%)" categorized into bins.
### Components/Axes
* **Y-axis Title**: "Percentage (%)"
* **Scale**: Increments of 20, with markers at 0, 20, 40, and 60. The scale appears to extend slightly beyond 60.
* **X-axis Title**: "Overlap Ratio (%)"
* **Categories/Bins**:
* `0` (represented by a single bar)
* `(0,25]` (represented by a single bar)
* `(25,50]` (represented by a single bar)
* `(50,75]` (represented by a single bar)
* `(75,100]` (This bin appears to be empty or has a value of 0, as no bar is present)
* `100` (represented by a single bar)
### Detailed Analysis
The chart displays five distinct bars, each representing a specific range or value of the Overlap Ratio.
1. **Overlap Ratio = 0 (%)**:
* **Color**: Dark Grey
* **Trend**: This is the first bar on the left.
* **Value**: The top of the bar aligns with the `20` mark on the y-axis. Therefore, the percentage is approximately **22%** (slightly above 20%).
2. **Overlap Ratio = (0,25] (%)**:
* **Color**: Medium Grey
* **Trend**: This bar is positioned to the right of the first bar.
* **Value**: The top of the bar aligns with a value slightly above the `10` mark on the y-axis, approximately **12%**.
3. **Overlap Ratio = (25,50] (%)**:
* **Color**: Medium Grey
* **Trend**: This bar is positioned to the right of the previous bar.
* **Value**: The top of the bar aligns with a value slightly below the `10` mark on the y-axis, approximately **8%**.
4. **Overlap Ratio = (50,75] (%)**:
* **Color**: Medium Grey
* **Trend**: This bar is positioned to the right of the previous bar.
* **Value**: The top of the bar aligns with a value slightly above the `0` mark and below the `10` mark, approximately **4%**.
5. **Overlap Ratio = 100 (%)**:
* **Color**: Light Blue
* **Trend**: This bar is positioned to the far right, separated from the other bars.
* **Value**: The top of the bar aligns with the `40` mark and extends slightly above it, approximately **45%**.
**Note on Colors**: The bars for overlap ratios `(0,25]`, `(25,50]`, and `(50,75]` share a similar medium grey color. The bar for `0` is a darker grey, and the bar for `100` is a distinct light blue.
### Key Observations
* The highest percentage of overlap ratio is observed at **100%**, accounting for approximately **45%**.
* The second highest percentage is for an overlap ratio of **0%**, accounting for approximately **22%**.
* The overlap ratios between **0% and 75%** (excluding 0% and 100%) show a decreasing trend in percentage as the ratio increases. Specifically:
* `(0,25]` has ~12%
* `(25,50]` has ~8%
* `(50,75]` has ~4%
* There is a significant gap in the data between the `(50,75]` bin and the `100` bin, with no data represented for the `(75,100]` range.
### Interpretation
This bar chart suggests a bimodal distribution of the "Overlap Ratio (%)". There are two prominent peaks: one at an overlap ratio of **0%** (approximately 22%) and another at an overlap ratio of **100%** (approximately 45%). The intermediate overlap ratios between 0% and 75% show a declining frequency.
The data implies that the observed phenomena or entities tend to either have no overlap or a complete overlap. The low percentages in the intermediate ranges suggest that partial overlaps are less common. The distinct separation of the dark grey bar (0%) and the light blue bar (100%) from the medium grey bars (intermediate ranges) might indicate different underlying mechanisms or categories contributing to these specific overlap ratios. The absence of data for the `(75,100]` range is notable and could be an artifact of the data collection or represent a genuine lack of occurrences in that specific interval.
</details>
(d) WebQSP (PoG-E)
<details>
<summary>x15.png Details</summary>
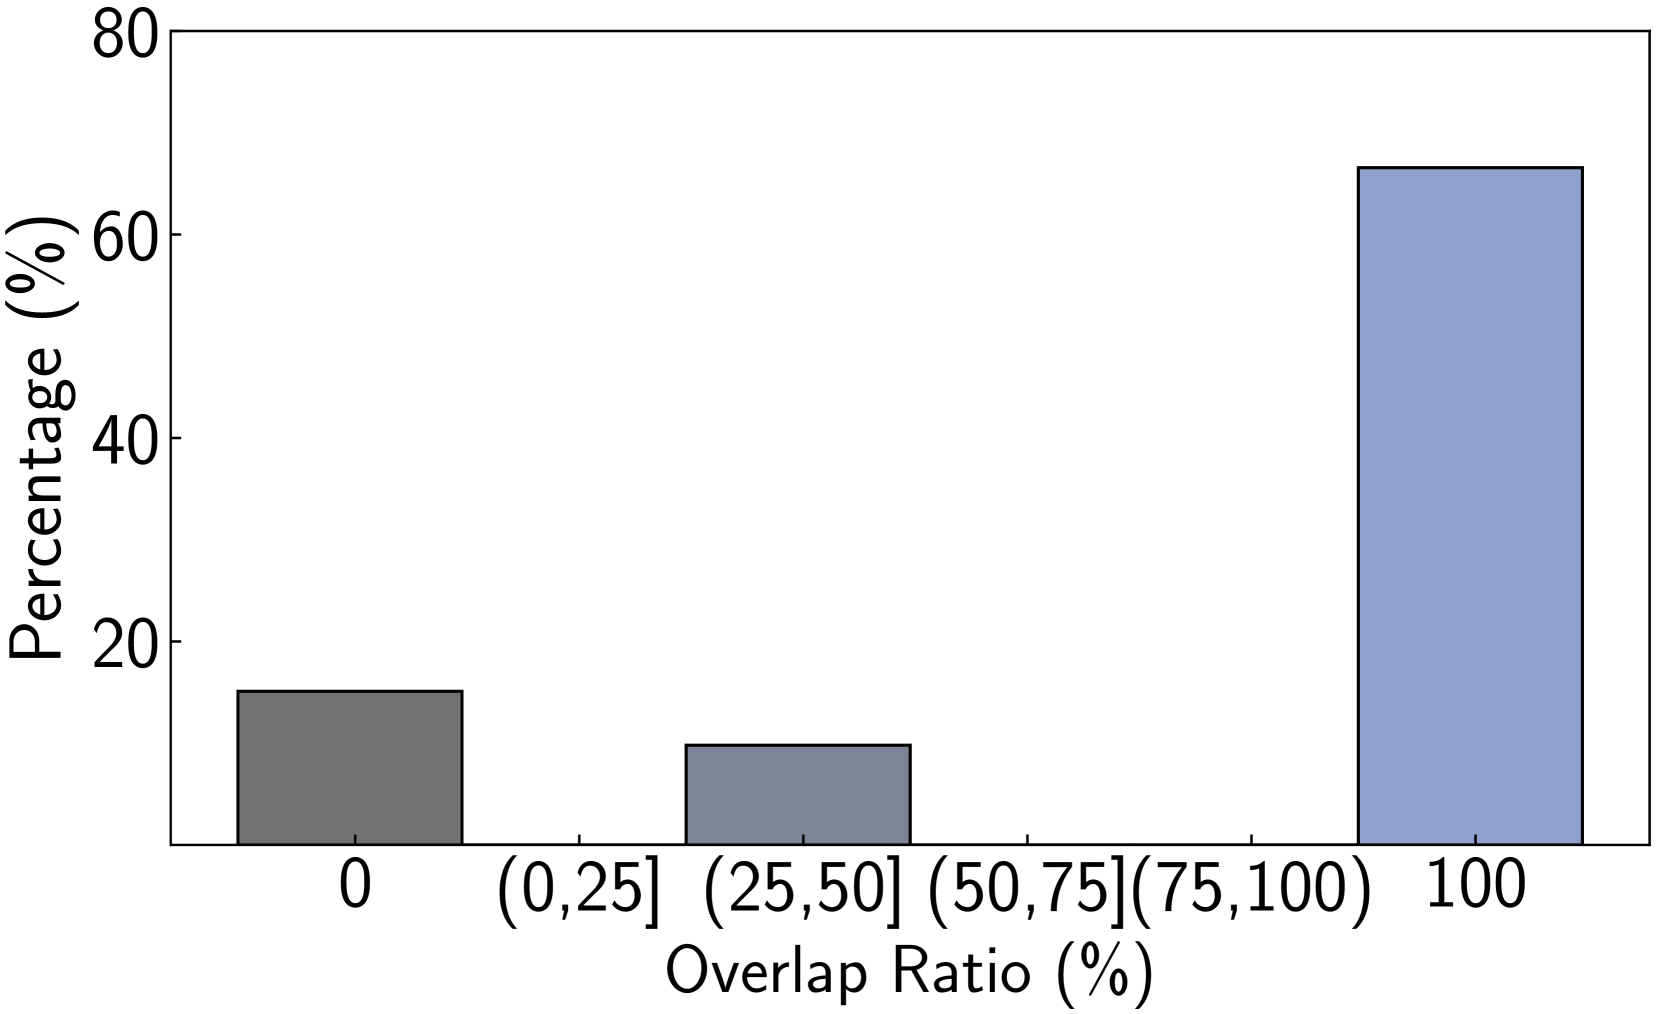
### Visual Description
## Bar Chart: Percentage Distribution by Overlap Ratio
### Overview
This bar chart displays the percentage distribution across different ranges of "Overlap Ratio (%)". The chart features distinct bars, each representing a specific overlap ratio category, and their corresponding heights indicate the percentage.
### Components/Axes
* **Y-axis Title**: "Percentage (%)"
* **Scale**: Ranges from 0 to 80, with major tick marks at 20, 40, 60, and 80.
* **X-axis Title**: "Overlap Ratio (%)"
* **Categories**:
* `0` (represented by a dark gray bar)
* `(0,25]` (represented by a medium-dark gray bar)
* `(25,50]` (represented by a medium-dark gray bar)
* `(50,75]` (represented by no visible bar)
* `(75,100]` (represented by a light blue bar)
### Detailed Analysis or Content Details
The chart presents the following data points:
1. **Overlap Ratio `0`**:
* **Color**: Dark gray.
* **Value**: The bar reaches approximately **17%**.
2. **Overlap Ratio `(0,25]`**:
* **Color**: Medium-dark gray.
* **Value**: The bar reaches approximately **12%**.
3. **Overlap Ratio `(25,50]`**:
* **Color**: Medium-dark gray.
* **Value**: The bar reaches approximately **10%**.
4. **Overlap Ratio `(50,75]`**:
* **Color**: Not explicitly represented by a bar. This category appears to have a value of 0% or is not present in the data.
5. **Overlap Ratio `(75,100]`**:
* **Color**: Light blue.
* **Value**: The bar reaches approximately **65%**.
### Key Observations
* The highest percentage is observed for the overlap ratio range of `(75,100]`, which is approximately 65%.
* The overlap ratio of `0` has the second-highest percentage, around 17%.
* The overlap ratios `(0,25]` and `(25,50]` have significantly lower percentages, approximately 12% and 10% respectively.
* There is no visible bar for the `(50,75]` category, suggesting a percentage of 0% or that this category was not sampled.
* The distribution is heavily skewed towards higher overlap ratios, particularly the `(75,100]` range.
### Interpretation
This bar chart demonstrates a strong correlation between higher overlap ratios and a greater percentage of occurrences. The data suggests that scenarios with an overlap ratio between 75% and 100% are the most prevalent, accounting for the largest proportion of the measured data. Conversely, lower overlap ratios, especially those between 25% and 50%, are less common. The presence of a bar for `0` overlap ratio indicates that complete absence of overlap is also a notable category, though less frequent than the highest overlap range. The absence of data for the `(50,75]` range might imply that this specific intermediate overlap range is either rare or was not considered in the analysis. Overall, the chart indicates a trend where increased overlap is associated with higher frequency.
</details>
(e) GrailQA (PoG)
<details>
<summary>x16.png Details</summary>
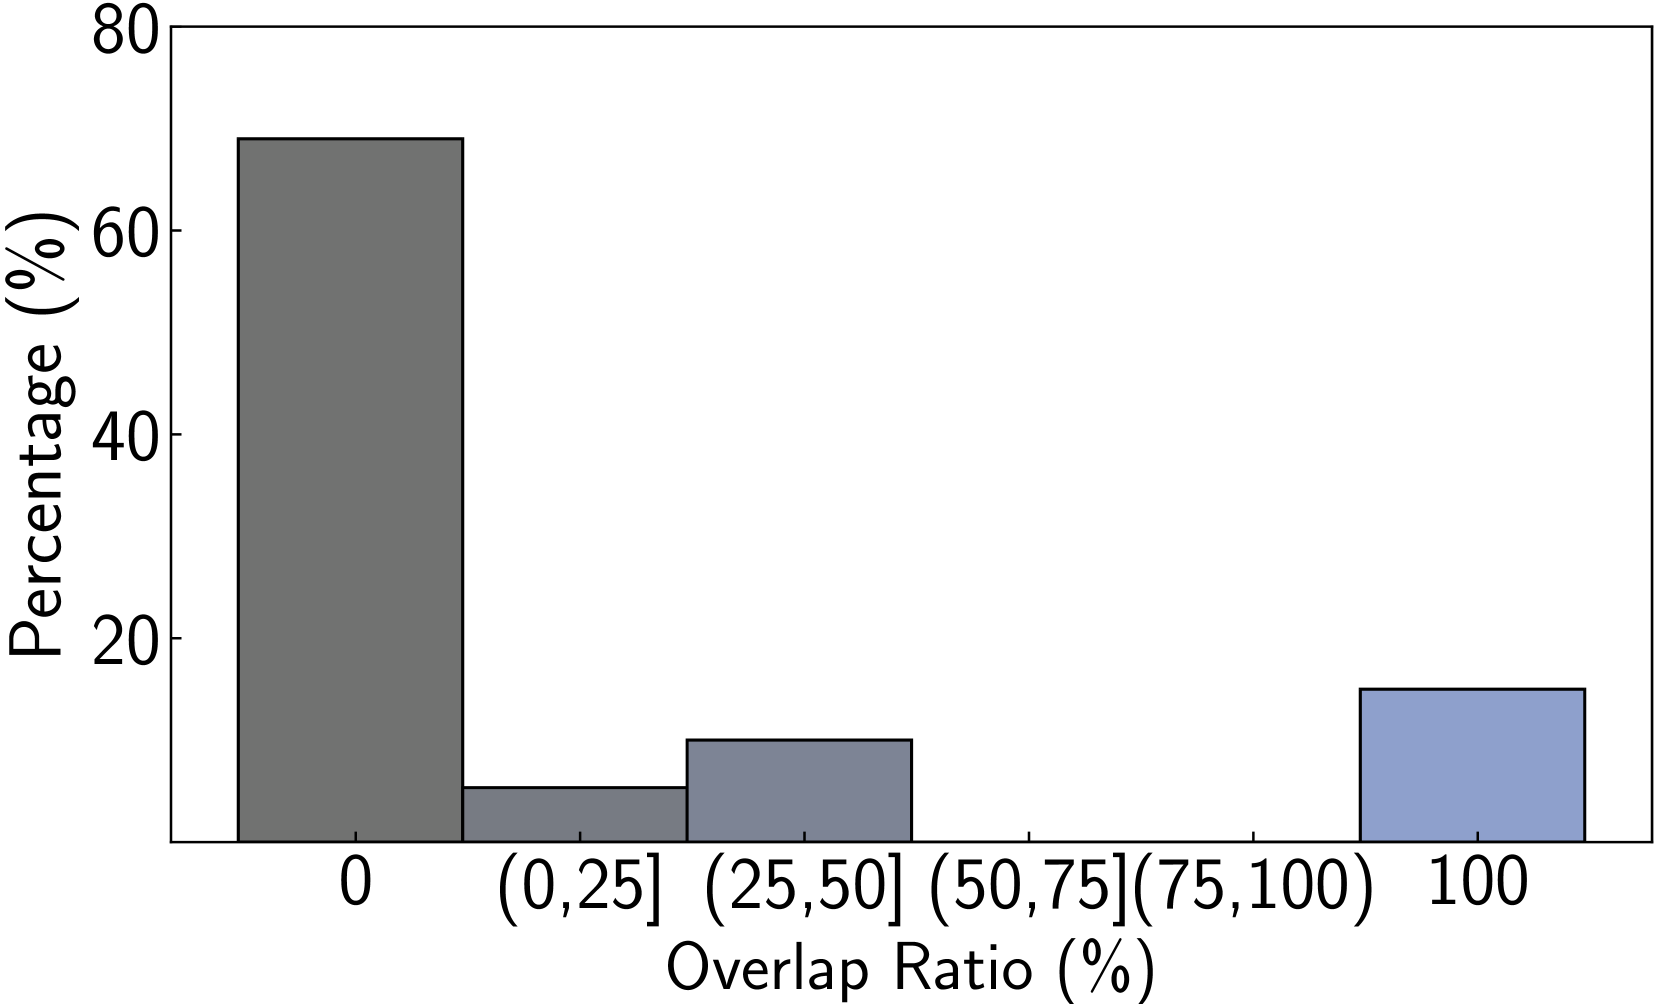
### Visual Description
## Bar Chart: Percentage Distribution of Overlap Ratio
### Overview
This image displays a bar chart illustrating the percentage distribution of an "Overlap Ratio (%)". The x-axis represents different ranges of overlap ratios, and the y-axis represents the percentage. There are four distinct bars, each representing a specific range of overlap ratios and its corresponding percentage.
### Components/Axes
* **X-axis Title:** "Overlap Ratio (%)"
* **X-axis Labels:**
* "0"
* "(0, 25]"
* "(25, 50]"
* "(50, 75]"
* "(75, 100)"
* "100"
* **Y-axis Title:** "Percentage (%)"
* **Y-axis Labels:** 0, 20, 40, 60, 80
### Detailed Analysis
The chart displays the following bars:
1. **Bar 1 (Dark Grey):**
* **X-axis Category:** "0"
* **Visual Trend:** This bar is the tallest, indicating the highest percentage.
* **Data Point:** The top of the bar aligns with approximately 68% on the y-axis.
* **Approximate Value:** 68% (with an uncertainty of +/- 2%)
2. **Bar 2 (Medium Grey):**
* **X-axis Category:** "(0, 25]"
* **Visual Trend:** This bar is significantly shorter than the first bar.
* **Data Point:** The top of the bar aligns with approximately 7% on the y-axis.
* **Approximate Value:** 7% (with an uncertainty of +/- 1%)
3. **Bar 3 (Light Blue-Grey):**
* **X-axis Category:** "(25, 50]"
* **Visual Trend:** This bar is taller than the second bar but much shorter than the first.
* **Data Point:** The top of the bar aligns with approximately 12% on the y-axis.
* **Approximate Value:** 12% (with an uncertainty of +/- 1%)
4. **Bar 4 (Light Blue):**
* **X-axis Category:** "100"
* **Visual Trend:** This bar is of moderate height, taller than the second bar but shorter than the third.
* **Data Point:** The top of the bar aligns with approximately 16% on the y-axis.
* **Approximate Value:** 16% (with an uncertainty of +/- 1%)
**Note:** The x-axis labels "(50, 75]" and "(75, 100)" are present but have no corresponding bars, indicating that the percentage for these overlap ratio ranges is 0% or negligible.
### Key Observations
* The most significant portion of the data falls within the "0" overlap ratio category, accounting for approximately 68% of the total.
* There is a sharp decrease in percentage from an overlap ratio of 0 to the range of (0, 25].
* The percentage increases slightly for the (25, 50] and then further for the "100" overlap ratio categories.
* The overlap ratio ranges between (50, 75] and (75, 100) have no observed data points represented by bars.
### Interpretation
This bar chart suggests a distribution where a very high percentage of observations have an overlap ratio of zero. This could imply that in the context being measured, a significant majority of items or events do not overlap at all. Following this, there are smaller, but notable, percentages for overlap ratios of (0, 25%], (25, 50%], and a peak at 100%. The presence of a bar at "100" suggests a distinct category of complete overlap. The absence of bars for the intermediate ranges (50, 75] and (75, 100) indicates that these specific overlap ratios are either not present in the dataset or occur with a frequency too low to be represented on this chart. The data demonstrates a strong tendency towards either no overlap or complete overlap, with a moderate presence of partial overlap in the lower to mid-range.
</details>
(f) GrailQA (PoG-E)
Figure 7. The path overlap ratio of PoG and PoG-E among CWQ, WebQSP, and GrailQA datasets.
Evidence of answer exploration sources. We conduct an analysis of correctly answered samples from three datasets to investigate the sources of evidence used by the LLM in generating answers, as illustrated in Figure 8. Specifically, we categorize all generated answers into three cases: KG only, LLM-inspired KG, and KG-inspired LLM. In the KG only scenario, answers are generated solely based on KG paths. The LLM-inspired KG case involves the LLM predicting an answer using its inherent knowledge and subsequently using the KG to verify its correctness. Conversely, in the KG-inspired LLM case, the paths generated by the KG are insufficient to reach the answer, and the LLM supplements the reasoning using its inherent knowledge. As shown in the figure, up to 14% of answers are generated through the KG-inspired LLM approach, and up to 9% involve LLM-inspired KG path supplementation. Compared to previous work that integrates LLM inherent knowledge with KG data (Sun et al., 2024), PoG more effectively leverages the strengths of both sources. These results demonstrate that PoG is a faithful reasoning method that primarily relies on KG-based reasoning while being supplemented by the LLM, ensuring both accuracy and interpretability in answer generation.
<details>
<summary>x17.png Details</summary>

### Visual Description
## Pie Charts: Distribution of Approaches for CWQ, WebQSP, and GrailQA
### Overview
This image displays three pie charts, each representing the percentage distribution of different approaches used for three distinct tasks: CWQ (Complex Question Answering), WebQSP (Web Question Answering with Semantic Parsing), and GrailQA (Question Answering over Knowledge Graphs). The approaches are categorized as "KG Only", "LLM Inspired KG", and "KG Inspired LLM".
### Components/Axes
* **Chart Titles:**
* CWQ(%)
* WebQSP(%)
* GrailQA(%)
* **Legend:** Located in the bottom-right quadrant of the image, it defines the color mapping for the categories:
* Blue: KG Only
* Light Green: LLM Inspired KG
* Light Gray: KG Inspired LLM
* **Data Labels:** Numerical percentages are displayed within each slice of the pie charts.
### Detailed Analysis
**1. CWQ (%)**
* **KG Only:** Represented by the largest blue slice, it accounts for **78%**.
* **LLM Inspired KG:** Represented by the light green slice, it accounts for **9%**.
* **KG Inspired LLM:** Represented by the light gray slice, it accounts for **12%**.
* *Sum Check:* 78 + 9 + 12 = 99%. There is a slight discrepancy, likely due to rounding or a minor omission in the visual representation.
**2. WebQSP (%)**
* **KG Only:** Represented by the largest blue slice, it accounts for **86%**.
* **LLM Inspired KG:** Represented by the light green slice, it accounts for **4%**.
* **KG Inspired LLM:** Represented by the light gray slice, it accounts for **9%**.
* *Sum Check:* 86 + 4 + 9 = 99%. Similar to CWQ, there is a slight discrepancy.
**3. GrailQA (%)**
* **KG Only:** Represented by the largest blue slice, it accounts for **95%**.
* **LLM Inspired KG:** Represented by the light green slice, it accounts for **1%**.
* **KG Inspired LLM:** Represented by the light gray slice, it accounts for **3%**.
* *Sum Check:* 95 + 1 + 3 = 99%. Again, a slight discrepancy is observed.
### Key Observations
* **Dominance of "KG Only":** Across all three tasks (CWQ, WebQSP, and GrailQA), the "KG Only" approach is overwhelmingly dominant, representing the largest proportion of the distribution. This proportion increases from CWQ (78%) to WebQSP (86%) and further to GrailQA (95%).
* **Low Adoption of Hybrid Approaches:** The "LLM Inspired KG" and "KG Inspired LLM" approaches, which combine knowledge graph (KG) and large language model (LLM) techniques, represent a significantly smaller portion of the distribution in all cases.
* **Trend in "KG Only":** There is a clear upward trend in the percentage of "KG Only" usage as we move from CWQ to WebQSP to GrailQA.
* **Trend in Hybrid Approaches:** Conversely, the combined percentage of "LLM Inspired KG" and "KG Inspired LLM" decreases as we move from CWQ (9% + 12% = 21%) to WebQSP (4% + 9% = 13%) to GrailQA (1% + 3% = 4%).
* **GrailQA's Specialization:** GrailQA shows the most pronounced reliance on "KG Only", with hybrid approaches being minimal.
### Interpretation
The data presented in these pie charts suggests a strong preference and established effectiveness of using knowledge graphs exclusively for the tasks of CWQ, WebQSP, and GrailQA. The increasing dominance of "KG Only" from CWQ to GrailQA indicates that for tasks that are more directly aligned with structured knowledge representation (like GrailQA, which is explicitly about question answering over knowledge graphs), purely KG-based methods are considered the most robust or efficient.
The low percentages for "LLM Inspired KG" and "KG Inspired LLM" could imply several things:
1. **Maturity of KG-based methods:** Existing KG-based solutions might be highly optimized and performant for these specific question-answering tasks, making the integration of LLMs less critical or even detrimental if not implemented carefully.
2. **Challenges in integration:** Effectively combining LLMs with KGs might still be an active area of research and development, with practical implementations not yet widespread or superior to standalone KG approaches.
3. **Task specificity:** The nature of these question-answering tasks might inherently favor structured, symbolic reasoning provided by KGs over the more probabilistic and pattern-based reasoning of LLMs, especially when dealing with factual queries.
The observed trend suggests that as the task becomes more focused on structured knowledge retrieval and reasoning (moving towards GrailQA), the reliance on pure KG approaches intensifies, while the utility of LLM-inspired methods diminishes. This could indicate that for highly structured domains, LLMs might be more useful for tasks like natural language understanding or generation *around* the KG, rather than for core reasoning or retrieval within it. The slight discrepancies in the sums (99%) are likely due to rounding in the original data or visualization.
</details>
(a) PoG
<details>
<summary>x18.png Details</summary>
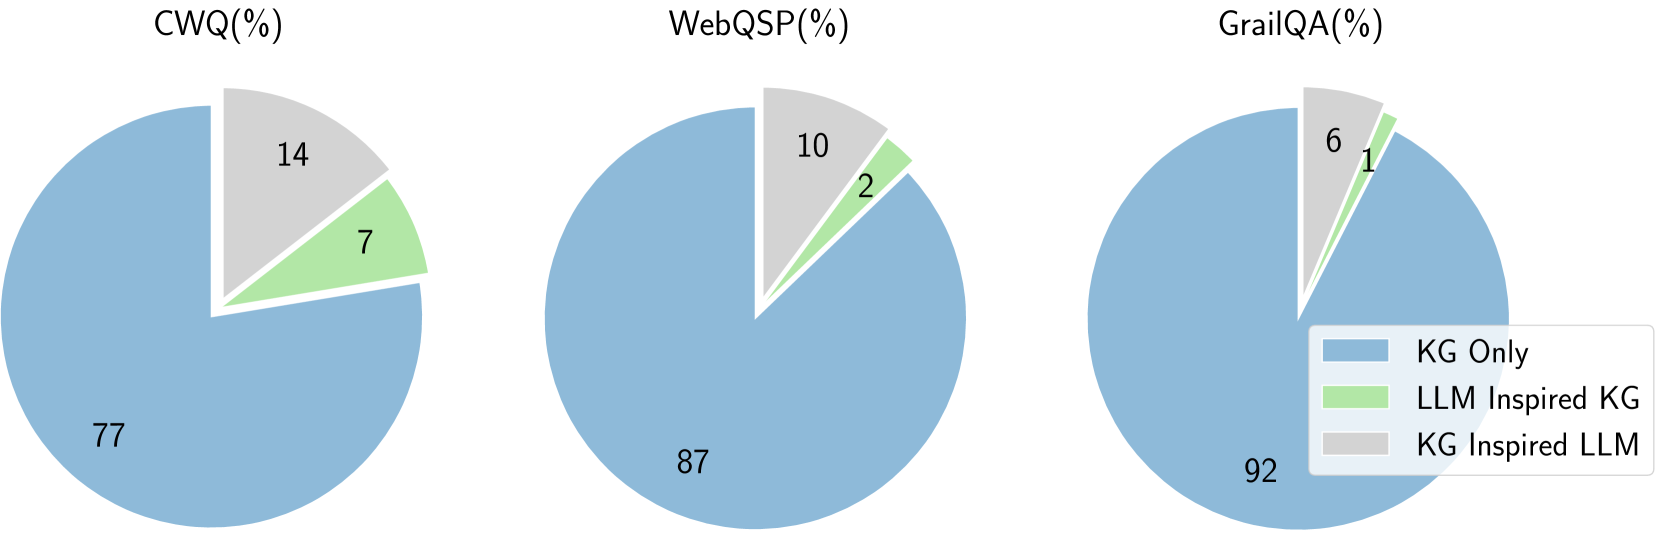
### Visual Description
## Pie Charts: Distribution of Categories Across Datasets
### Overview
The image displays three pie charts, each representing a different dataset: CWQ, WebQSP, and GrailQA. Each pie chart is segmented into three categories, indicated by different colors and labeled with percentages. A legend is provided to identify the categories. The percentages within each slice represent the proportion of that category within the respective dataset.
### Components/Axes
* **Titles:**
* CWQ(%)
* WebQSP(%)
* GrailQA(%)
* **Legend:** Located in the bottom-right quadrant of the image.
* Blue swatch: KG Only
* Light green swatch: LLM Inspired KG
* Light grey swatch: KG Inspired LLM
### Detailed Analysis
**1. CWQ (%)**
* **Title:** CWQ(%)
* **Legend Mapping:**
* Blue slice (77%): KG Only
* Light green slice (7%): LLM Inspired KG
* Light grey slice (14%): KG Inspired LLM
* **Data Points:**
* KG Only: 77% (approximately)
* LLM Inspired KG: 7% (approximately)
* KG Inspired LLM: 14% (approximately)
* **Visual Trend:** The blue slice ("KG Only") is the largest, occupying the majority of the pie. The light grey slice ("KG Inspired LLM") is the second largest, and the light green slice ("LLM Inspired KG") is the smallest.
**2. WebQSP (%)**
* **Title:** WebQSP(%)
* **Legend Mapping:**
* Blue slice (87%): KG Only
* Light green slice (2%): LLM Inspired KG
* Light grey slice (10%): KG Inspired LLM
* **Data Points:**
* KG Only: 87% (approximately)
* LLM Inspired KG: 2% (approximately)
* KG Inspired LLM: 10% (approximately)
* **Visual Trend:** The blue slice ("KG Only") is overwhelmingly the largest. The light grey slice ("KG Inspired LLM") is the second largest, and the light green slice ("LLM Inspired KG") is the smallest.
**3. GrailQA (%)**
* **Title:** GrailQA(%)
* **Legend Mapping:**
* Blue slice (92%): KG Only
* Light green slice (1%): LLM Inspired KG
* Light grey slice (6%): KG Inspired LLM
* **Data Points:**
* KG Only: 92% (approximately)
* LLM Inspired KG: 1% (approximately)
* KG Inspired LLM: 6% (approximately)
* **Visual Trend:** The blue slice ("KG Only") is the dominant segment. The light grey slice ("KG Inspired LLM") is the second largest, and the light green slice ("LLM Inspired KG") is the smallest.
### Key Observations
* Across all three datasets (CWQ, WebQSP, and GrailQA), the "KG Only" category consistently represents the largest proportion, with percentages ranging from 77% to 92%.
* The "LLM Inspired KG" category consistently represents the smallest proportion in all three datasets, with percentages ranging from 1% to 7%.
* The "KG Inspired LLM" category consistently falls between "KG Only" and "LLM Inspired KG" in terms of proportion, ranging from 6% to 14%.
* The GrailQA dataset shows the highest dominance of "KG Only" (92%) and the lowest proportion for "LLM Inspired KG" (1%).
* The CWQ dataset has the most balanced distribution among the three categories compared to the other two datasets, although "KG Only" still dominates.
### Interpretation
The data presented in these pie charts suggests a strong reliance on "KG Only" (Knowledge Graph Only) approaches for the tasks represented by CWQ, WebQSP, and GrailQA. This indicates that traditional Knowledge Graph-based methods are the most prevalent or effective for these specific datasets.
The significantly smaller proportions of "LLM Inspired KG" and "KG Inspired LLM" suggest that hybrid approaches, or those that solely leverage LLMs for KG-related tasks, are less common or less successful in these contexts. The very low percentage for "LLM Inspired KG" in GrailQA (1%) is particularly noteworthy, implying that directly inspiring a KG with LLM outputs might not be a common or effective strategy for that particular dataset. Conversely, "KG Inspired LLM" shows a slightly higher presence, suggesting that using LLMs to enhance or guide KG construction or usage might be more explored than the other way around, though still a minority approach.
Overall, the charts demonstrate that for these specific question-answering or knowledge-related tasks, established Knowledge Graph methodologies remain the primary approach, with LLM-integrated or LLM-inspired methods playing a more supplementary or nascent role. The variation in proportions across the datasets might reflect differences in the complexity of the questions, the nature of the underlying knowledge, or the specific evaluation metrics used for each dataset.
</details>
(b) PoG-E
Figure 8. The proportions of answer evidence of PoG and PoG-E among CWQ, WebQSP, and GrailQA datasets.
### B.3. Error Analysis
To further analyze the integration of LLMs and KGs, we conduct an error analysis on the CWQ, WebQSP, and GrailQA datasets. We categoriz errors into four types: (1) answer generation error, (2) refuse error, (3) format error, and (4) other hallucination errors. Note that answer generation error occurs when PoG provides an accurate reasoning path, but the LLM fails to extract the correct answer from it. The distribution of these error types is illustrated in Figure 9. The results indicate that using more powerful LLMs reduces the number of ”other hallucination errors,” ”refuse errors,” and ”answer generation errors,” as the model offers enhanced reasoning capabilities based on the retrieved data. Specifically, the reduction in ”answer generation errors” shows the reasoning paths provided by PoG are effectively utilized by more advanced LLMs. However, we observe an increase in ”format errors” with more powerful LLMs, which may be attributed to their greater creative flexibility.
<details>
<summary>x19.png Details</summary>
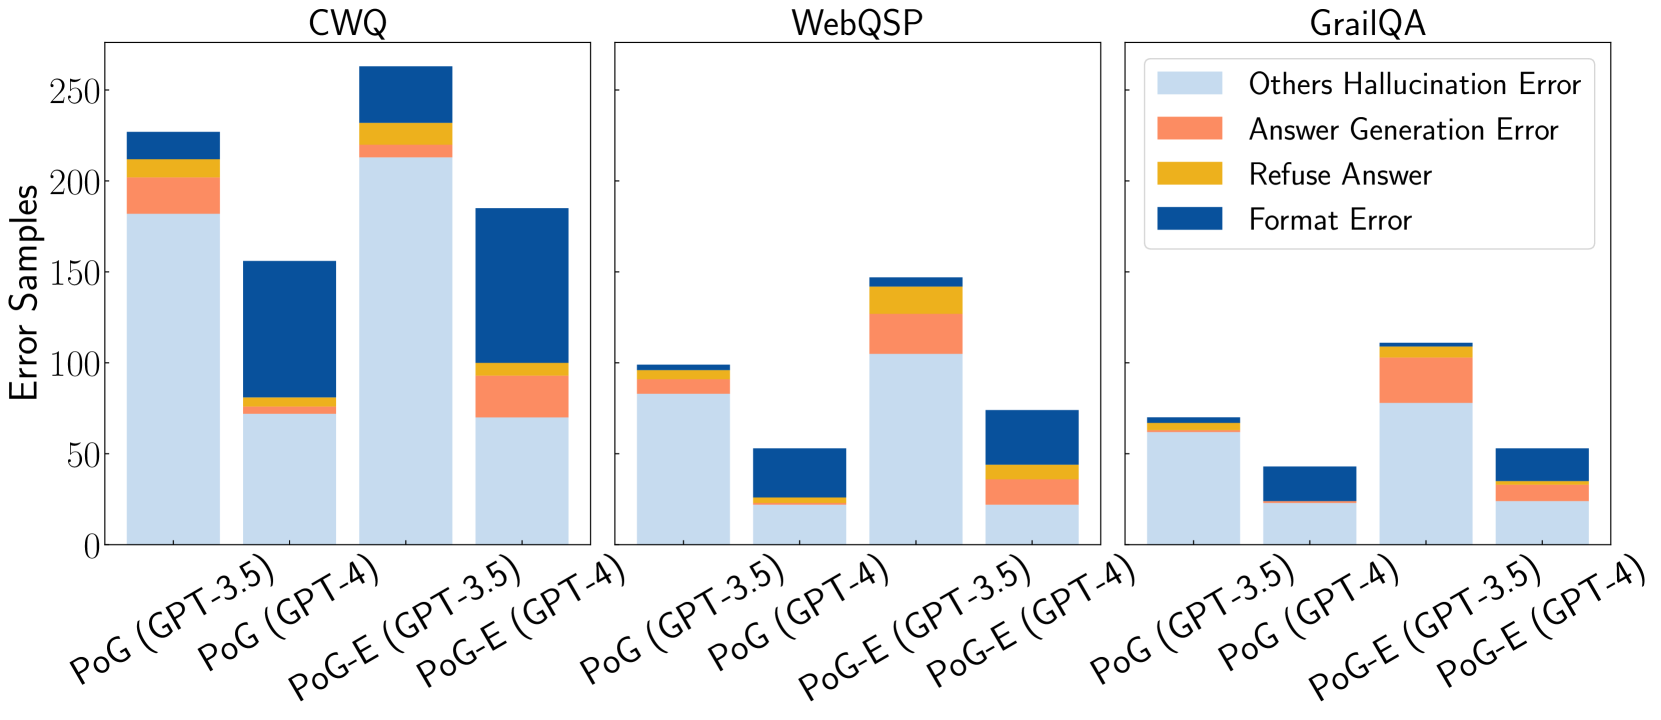
### Visual Description
## Stacked Bar Chart: Error Samples by Dataset and Model Configuration
### Overview
This image displays a set of three stacked bar charts, each representing a different dataset: CWQ, WebQSP, and GrailQA. Within each dataset, there are four bars, representing different model configurations: PoG (GPT-3.5), PoG (GPT-4), PoG-E (GPT-3.5), and PoG-E (GPT-4). Each bar is segmented to show the breakdown of error samples into four categories: "Others Hallucination Error", "Answer Generation Error", "Refuse Answer", and "Format Error". The y-axis represents the "Error Samples".
### Components/Axes
**Global Elements:**
* **Y-axis Title:** "Error Samples" (positioned vertically on the left side of the chart area).
* **Y-axis Scale:** Ranges from 0 to 250, with major tick marks at 0, 50, 100, 150, 200, and 250.
* **Legend:** Located in the top-right quadrant of the overall image. It maps colors to error categories:
* Light Blue: "Others Hallucination Error"
* Coral/Light Orange: "Answer Generation Error"
* Yellow/Gold: "Refuse Answer"
* Dark Blue: "Format Error"
**Chart Titles (from left to right):**
1. CWQ
2. WebQSP
3. GrailQA
**X-axis Labels (common across all charts, rotated for readability):**
* PoG (GPT-3.5)
* PoG (GPT-4)
* PoG-E (GPT-3.5)
* PoG-E (GPT-4)
### Detailed Analysis
**Chart 1: CWQ**
* **PoG (GPT-3.5):**
* Others Hallucination Error (light blue): Approximately 175 samples.
* Answer Generation Error (coral): Approximately 25 samples (total ~200).
* Refuse Answer (yellow): Approximately 5 samples (total ~205).
* Format Error (dark blue): Approximately 20 samples (total ~225).
* **Total:** Approximately 225 samples.
* **PoG (GPT-4):**
* Others Hallucination Error (light blue): Approximately 75 samples.
* Answer Generation Error (coral): Approximately 5 samples (total ~80).
* Refuse Answer (yellow): Approximately 0 samples (total ~80).
* Format Error (dark blue): Approximately 75 samples (total ~155).
* **Total:** Approximately 155 samples.
* **PoG-E (GPT-3.5):**
* Others Hallucination Error (light blue): Approximately 210 samples.
* Answer Generation Error (coral): Approximately 15 samples (total ~225).
* Refuse Answer (yellow): Approximately 5 samples (total ~230).
* Format Error (dark blue): Approximately 20 samples (total ~250).
* **Total:** Approximately 250 samples.
* **PoG-E (GPT-4):**
* Others Hallucination Error (light blue): Approximately 85 samples.
* Answer Generation Error (coral): Approximately 5 samples (total ~90).
* Refuse Answer (yellow): Approximately 0 samples (total ~90).
* Format Error (dark blue): Approximately 100 samples (total ~190).
* **Total:** Approximately 190 samples.
**Chart 2: WebQSP**
* **PoG (GPT-3.5):**
* Others Hallucination Error (light blue): Approximately 95 samples.
* Answer Generation Error (coral): Approximately 5 samples (total ~100).
* Refuse Answer (yellow): Approximately 0 samples (total ~100).
* Format Error (dark blue): Approximately 0 samples (total ~100).
* **Total:** Approximately 100 samples.
* **PoG (GPT-4):**
* Others Hallucination Error (light blue): Approximately 20 samples.
* Answer Generation Error (coral): Approximately 0 samples (total ~20).
* Refuse Answer (yellow): Approximately 0 samples (total ~20).
* Format Error (dark blue): Approximately 30 samples (total ~50).
* **Total:** Approximately 50 samples.
* **PoG-E (GPT-3.5):**
* Others Hallucination Error (light blue): Approximately 100 samples.
* Answer Generation Error (coral): Approximately 25 samples (total ~125).
* Refuse Answer (yellow): Approximately 5 samples (total ~130).
* Format Error (dark blue): Approximately 0 samples (total ~130).
* **Total:** Approximately 130 samples.
* **PoG-E (GPT-4):**
* Others Hallucination Error (light blue): Approximately 45 samples.
* Answer Generation Error (coral): Approximately 5 samples (total ~50).
* Refuse Answer (yellow): Approximately 0 samples (total ~50).
* Format Error (dark blue): Approximately 30 samples (total ~80).
* **Total:** Approximately 80 samples.
**Chart 3: GrailQA**
* **PoG (GPT-3.5):**
* Others Hallucination Error (light blue): Approximately 60 samples.
* Answer Generation Error (coral): Approximately 5 samples (total ~65).
* Refuse Answer (yellow): Approximately 0 samples (total ~65).
* Format Error (dark blue): Approximately 0 samples (total ~65).
* **Total:** Approximately 65 samples.
* **PoG (GPT-4):**
* Others Hallucination Error (light blue): Approximately 30 samples.
* Answer Generation Error (coral): Approximately 0 samples (total ~30).
* Refuse Answer (yellow): Approximately 0 samples (total ~30).
* Format Error (dark blue): Approximately 20 samples (total ~50).
* **Total:** Approximately 50 samples.
* **PoG-E (GPT-3.5):**
* Others Hallucination Error (light blue): Approximately 110 samples.
* Answer Generation Error (coral): Approximately 30 samples (total ~140).
* Refuse Answer (yellow): Approximately 5 samples (total ~145).
* Format Error (dark blue): Approximately 0 samples (total ~145).
* **Total:** Approximately 145 samples.
* **PoG-E (GPT-4):**
* Others Hallucination Error (light blue): Approximately 25 samples.
* Answer Generation Error (coral): Approximately 5 samples (total ~30).
* Refuse Answer (yellow): Approximately 0 samples (total ~30).
* Format Error (dark blue): Approximately 25 samples (total ~55).
* **Total:** Approximately 55 samples.
### Key Observations
* **Dominant Error Type:** Across all datasets and configurations, "Others Hallucination Error" (light blue) is consistently the largest component of the total error samples.
* **Dataset Variation:** The total number of error samples varies significantly by dataset. CWQ generally shows the highest total error samples, followed by WebQSP and then GrailQA.
* **Model Configuration Impact:**
* Within each dataset, the "PoG-E (GPT-3.5)" configuration often exhibits a higher total number of error samples compared to "PoG (GPT-3.5)".
* The "GPT-4" models ("PoG (GPT-4)" and "PoG-E (GPT-4)") generally show fewer total error samples than their GPT-3.5 counterparts, particularly in the CWQ and WebQSP datasets.
* **Format Error:** "Format Error" (dark blue) is a significant contributor in some specific cases, notably for "PoG (GPT-4)" in CWQ and WebQSP, and "PoG-E (GPT-4)" in GrailQA.
* **Refuse Answer and Answer Generation Error:** These categories ("Refuse Answer" - yellow, "Answer Generation Error" - coral) are generally much smaller components of the total errors, often appearing as thin slices or being absent in many bars.
### Interpretation
This chart visually demonstrates the error distribution across different datasets and model configurations. The data suggests that:
1. **Hallucination is a Pervasive Issue:** The consistent dominance of "Others Hallucination Error" indicates that generating factually incorrect or fabricated information is a primary challenge for these models, regardless of the dataset or specific configuration. This points to a fundamental limitation in their knowledge grounding or reasoning capabilities.
2. **Dataset Complexity and Model Performance:** The variation in total error samples across datasets (CWQ > WebQSP > GrailQA) implies that the complexity or nature of the questions in these datasets impacts model performance. CWQ, with the highest errors, might pose more challenging reasoning or knowledge retrieval tasks.
3. **GPT-4's Potential Improvement:** The trend of lower total errors for GPT-4 models compared to GPT-3.5 models, especially in CWQ and WebQSP, suggests that GPT-4 offers an improvement in reducing overall errors. This could be attributed to enhanced reasoning, better knowledge recall, or improved generation capabilities.
4. **Configuration-Specific Trade-offs:** The "PoG-E" configuration, while sometimes leading to higher total errors with GPT-3.5, might be designed for different objectives or have different architectural properties that influence error types. The data suggests that "PoG-E (GPT-3.5)" might be more prone to hallucination or other errors than the base "PoG (GPT-3.5)".
5. **Specific Error Bottlenecks:** The presence of significant "Format Error" in certain configurations (e.g., PoG (GPT-4) in CWQ) highlights that while GPT-4 might reduce general errors, specific issues like output formatting can still be problematic depending on the task and model. The relative scarcity of "Refuse Answer" and "Answer Generation Error" suggests these are less common failure modes compared to hallucination.
In essence, the chart provides a comparative analysis of model robustness and error profiles. It underscores the ongoing challenge of factual accuracy (hallucination) in large language models and highlights the potential benefits of newer model versions (GPT-4) and specific configurations in mitigating these issues, while also revealing dataset-dependent performance variations.
</details>
Figure 9. The error instances and categories of PoG and PoG-E in the CWQ, WebQSP, and GrailQA datasets.
### B.4. Efficiency Analysis
LLM calls cost analysis. To evaluate the cost and efficiency of utilizing LLMs, we conducted an analysis of LLM calls on the CWQ, WebQSP, and GrailQA datasets. Initially, we examined the proportion of questions answered with varying numbers of LLM calls, as depicted in Figure 10. The results indicate that the majority of questions are answered within nine LLM calls across all datasets, with approximately 80% and 50% of questions being resolved within six calls on CWQ and WebQSP, respectively. These findings demonstrate PoG’s efficiency in minimizing LLM usage costs. Furthermore, we compared the average number of LLM calls required by PoG with the current SOTA method, ToG (Sun et al., 2024), as shown in Table 7. Since we utilized identical datasets for WebQSP, GrailQA, Simple Questions, and WebQuestions, we report the ToG results from their paper. The comparison reveals that PoG achieves comparable or superior accuracy while reducing the number of LLM calls by up to 40% on the GrailQA dataset compared to ToG. This improvement is attributed to PoG’s dynamic exploration strategy, which avoids starting from scratch, and its effective use of graph structures to prune irrelevant information, thereby significantly decreasing computational costs.
<details>
<summary>x20.png Details</summary>
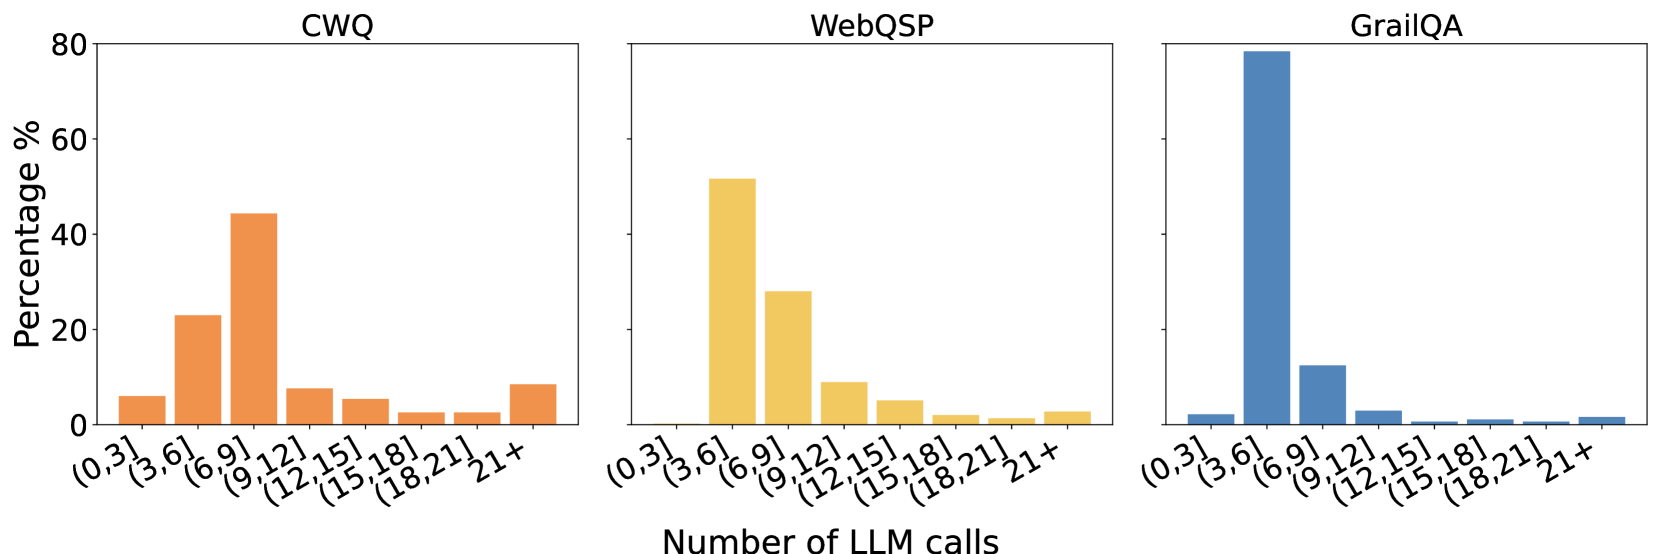
### Visual Description
## Bar Charts: Distribution of LLM Calls Across Datasets
### Overview
The image displays three bar charts side-by-side, each representing the distribution of "Number of LLM calls" for a different dataset: CWQ, WebQSP, and GrailQA. The y-axis of each chart indicates the "Percentage %", ranging from 0 to 80. The x-axis for all charts shows bins representing the number of LLM calls, from (0,3] to 21+. The charts use distinct colors for each dataset: orange for CWQ, yellow for WebQSP, and blue for GrailQA.
### Components/Axes
**Common Elements:**
* **Y-axis Title:** "Percentage %"
* **Y-axis Scale:** 0, 20, 40, 60, 80
* **X-axis Title:** "Number of LLM calls"
* **X-axis Categories (Bins):** (0,3], (3,6], (6,9], (9,12], (12,15], (15,18], (18,21], 21+
**Individual Chart Titles:**
* **Left Chart:** CWQ
* **Middle Chart:** WebQSP
* **Right Chart:** GrailQA
### Detailed Analysis
**CWQ (Orange Bars):**
* **(0,3]:** Approximately 8%
* **(3,6]:** Approximately 23%
* **(6,9]:** Approximately 10%
* **(9,12]:** Approximately 44% (Peak)
* **(12,15]:** Approximately 8%
* **(15,18]:** Approximately 4%
* **(18,21]:** Approximately 2%
* **21+:** Approximately 5%
**WebQSP (Yellow Bars):**
* **(0,3]:** Approximately 2%
* **(3,6]:** Approximately 50% (Peak)
* **(6,9]:** Approximately 27%
* **(9,12]:** Approximately 8%
* **(12,15]:** Approximately 4%
* **(15,18]:** Approximately 2%
* **(18,21]:** Approximately 1%
* **21+:** Approximately 1%
**GrailQA (Blue Bars):**
* **(0,3]:** Approximately 1%
* **(3,6]:** Approximately 80% (Peak)
* **(6,9]:** Approximately 13%
* **(9,12]:** Approximately 3%
* **(12,15]:** Approximately 1%
* **(15,18]:** Approximately 0.5%
* **(18,21]:** Approximately 0.5%
* **21+:** Approximately 0.5%
### Key Observations
* **GrailQA:** Exhibits a highly skewed distribution, with an overwhelming majority of instances (approximately 80%) requiring between 3 and 6 LLM calls. The number of calls drops sharply for higher bins.
* **WebQSP:** Shows a peak in the (3,6] bin (approximately 50%), followed by a significant secondary peak in the (6,9] bin (approximately 27%). The distribution tapers off more gradually than GrailQA.
* **CWQ:** Has its highest peak in the (9,12] bin (approximately 44%), with a notable secondary peak in the (3,6] bin (approximately 23%). The distribution is more spread out compared to the other two datasets.
* **Common Trend:** All three datasets show a general decreasing trend in the percentage of LLM calls as the number of calls increases beyond the primary peak.
### Interpretation
These bar charts illustrate the varying complexity of questions or tasks across different datasets, as measured by the number of Language Model (LLM) calls required for their resolution.
* **GrailQA** appears to be the "simplest" or most direct dataset in terms of LLM interaction, with most instances requiring a very small, consistent number of calls (3-6). This suggests that the tasks in GrailQA are relatively straightforward and can be answered with minimal iterative LLM engagement.
* **WebQSP** presents a moderate level of complexity. While a significant portion of tasks are resolved within 3-6 calls, there's a substantial secondary group that requires more calls (6-9). This indicates a mix of simpler and moderately complex tasks.
* **CWQ** demonstrates the highest complexity among the three. Its distribution is more spread out, with a substantial number of instances requiring a higher number of LLM calls (9-12). This suggests that tasks in CWQ might involve more intricate reasoning, multi-step processes, or require more refinement through LLM interactions.
In essence, the charts provide a quantitative measure of the "effort" or "computational cost" (in terms of LLM calls) associated with processing data from each dataset. This information is crucial for understanding the performance characteristics and resource requirements of LLM-based systems when applied to these different domains. The distinct distributions highlight that a one-size-fits-all approach to LLM interaction might not be optimal across all datasets.
</details>
Figure 10. The proportion of question of PoG and PoG-E by different LLM Calls among CWQ, WebQSP, and GrailQA datasets
Table 7. Average LLM calls per question of PoG and ToG among all datasets.
| Method | CWQ | WebQSP | GrailQA | Simple Questions | WebQuestions |
| --- | --- | --- | --- | --- | --- |
| PoG | 10.7 | 8.3 | 6.5 | 6.1 | 9.3 |
| ToG | - | 11.2 | 10.6 | 8.7 | 10.5 |
Running time analysis. To further evaluate the processing efficiency of PoG, we conducted extensive evaluations focusing on average accuracy, LLM call frequency, and running time on multi-hop question datasets GrailQA and CWQ. The results, presented in Table 8, compare the performance of ToG and PoG across various beam search strategies. The data indicate that while higher accuracy slightly increases runtime, PoG effectively balances accuracy with reduced LLM call costs. Specifically, PoG reduces LLM call costs by up to 53.5% while increasing accuracy by up to 33.4%. This allows users to tailor the PoG framework to their specific needs regarding accuracy, cost, and runtime. All PoG setting provide significantly lower costs. For instance, on the GrailQA dataset, PoG with 3-step beam search reduces LLM call costs by 39.6% and improves accuracy by 33.1%, with only a 1.14% increase in runtime. A similar trend is also observed in the CWQ dataset.
Table 8. Running time evaluation of ToG and PoG with different beam search methods on CWQ and GrailQA.
| Model | Evaluation | CWQ | GrailQA |
| --- | --- | --- | --- |
| ToG | Accuracy | 53.1 | 59.3 |
| Time (s) | 78.7 | 14.8 | |
| LLM Calls | 21.3 | 10.1 | |
| PoG | Accuracy | 81.4 | 92.7 |
| Time (s) | 118.9 | 21.4 | |
| LLM Calls | 9.1 | 6.5 | |
| PoG | Accuracy | 79.8 | 92.4 |
| w/ 3-Step Beam Search | Time (s) | 87.5 | 15.0 |
| LLM Calls | 8.8 | 6.1 | |
| PoG | Accuracy | 57.1 | 83.0 |
| w/ Fuzzy Selection | Time (s) | 109.7 | 15.7 |
| LLM Calls | 6.8 | 4.7 | |
### B.5. Case Study
Case study: graph reduction and path pruning. We conducted a case study using the example question presented in Figure 2 to illustrate the effects of graph pruning and path pruning on the graph structure. Figure 11 (a) shows the results of graph pruning, where vertices in blue are selected as part of the question subgraph, and vertices in black are pruned. In this sample, the number of entities is reduced from 16,740 to 1,245, resulting in a 92% reduction of vertices. Figures 11 (b) and 11 (c) demonstrate the question subgraph induced by the blue vertices in Figure 11 (a) and the results after applying fuzzy and precise path selection. In these figures, vertices in blue represent the selected entity after each pruning, vertices in yellow represent the topic entities, and the vertex in red denotes the final answer entity. From these graphs, we observe that utilizing the graph structure allows for the rapid pruning of irrelevant vertices, ensuring that the reasoning paths remain faithful and highly relevant to the question since all vertices within the question subgraph are interconnected with all topic entities, thereby maintaining the integrity and relevance of the reasoning process.
<details>
<summary>x21.png Details</summary>
### Visual Description
## Network Graph: Node and Edge Visualization
### Overview
The image displays a complex network graph. It consists of numerous nodes, represented by black and blue circles, connected by a dense web of thin lines (edges). The nodes are distributed across the entire canvas, with a noticeable concentration of edges in the central and lower-central regions, creating a gradient effect from dark blue to black towards the center. There is no explicit legend or axis information provided, making it impossible to determine the exact meaning of the node colors or their spatial arrangement.
### Components/Axes
* **Nodes:** Two distinct types of nodes are visible:
* **Black Circles:** These are smaller in diameter compared to the blue circles. They are scattered throughout the network.
* **Blue Circles:** These are larger in diameter than the black circles. They are also distributed throughout the network, but appear to be more concentrated in certain areas, particularly towards the periphery and in clusters within the denser central region.
* **Edges:** Thin, light gray to dark blue lines connecting the nodes. The density of these edges is highest in the central and lower-central areas, creating a visual "core" or "hub" effect. The color of the edges appears to transition from lighter gray at the periphery to darker blue/black towards the center, possibly indicating a density or strength attribute.
* **Background:** The background is white, with a subtle dark blue to black gradient emanating from the center of the graph.
### Detailed Analysis or Content Details
Due to the absence of labels, axes, or a legend, a precise quantitative analysis of data points or trends is not possible. However, qualitative observations can be made:
* **Node Distribution:** Both black and blue nodes are present across the entire graph. There isn't a clear separation of node types into distinct regions.
* **Edge Density:** The edges are most densely packed in the central and lower-central areas of the graph. This suggests a high degree of connectivity or interaction within this region. The density decreases towards the edges of the graph.
* **Color Gradient:** The dark blue/black gradient in the center, coinciding with the high edge density, might represent a region of high activity, importance, or a specific characteristic of the network.
### Key Observations
* The network exhibits a non-uniform distribution of connectivity, with a clear central cluster of high-density connections.
* The presence of two distinct node types (black and blue) suggests a categorization or differentiation of network elements. The larger size of the blue nodes might indicate a higher degree of importance or a different attribute compared to the black nodes.
* The visual density of edges, particularly in the center, implies a core structure or a highly interconnected subgraph.
### Interpretation
This network graph likely represents a system with interconnected entities. The two types of nodes (black and blue) could represent different categories of elements within this system, such as users and content, different types of servers, or distinct communities. The larger blue nodes might represent more significant entities or those with a higher number of connections.
The dense central region with a dark blue/black gradient and numerous edges strongly suggests a core or hub within the network. This could be a central server, a critical piece of infrastructure, or a highly active group of interconnected entities. The sparser connections at the periphery indicate that entities further from this core are less interconnected or interact with fewer other entities.
Without further context or a legend, it is speculative to assign specific meanings. However, the visualization effectively communicates the structure and connectivity of a complex system, highlighting areas of high interaction and potential central importance. The visual design itself, with the gradient and varying node sizes, is used to convey information about the network's topology and potentially the attributes of its components. The lack of explicit labels or scales means this is a qualitative representation of network structure rather than a quantitative data display.
</details>
(a) Graph pruning
<details>
<summary>x22.png Details</summary>
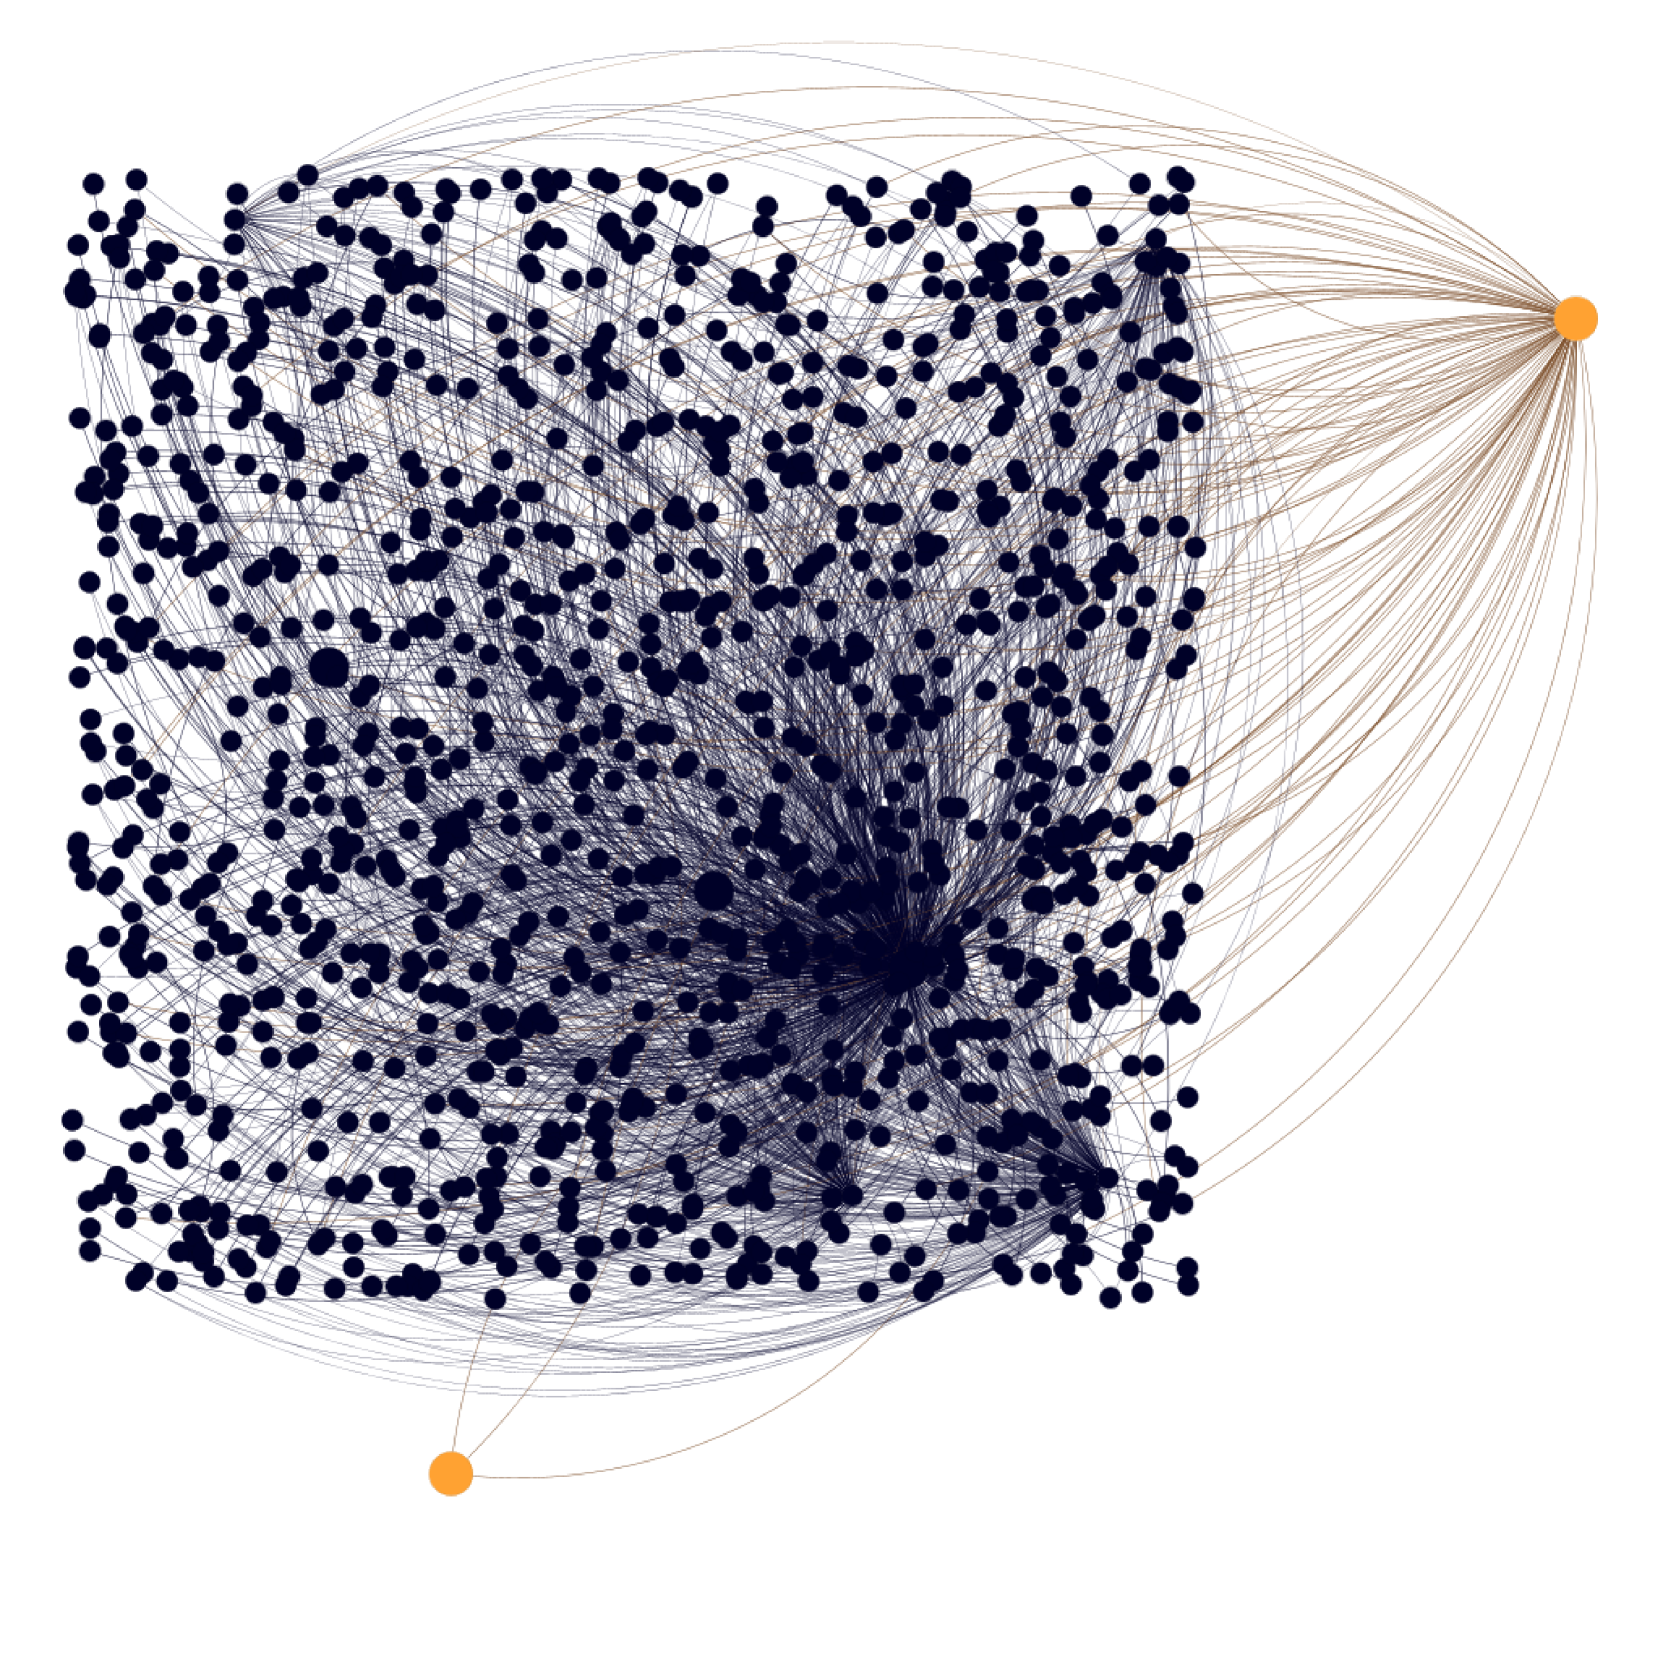
### Visual Description
## Network Graph: Interconnected Nodes
### Overview
The image displays a network graph consisting of numerous nodes and edges. The majority of nodes are represented by small, dark blue circles, densely clustered in the left and central portions of the image. Two larger, orange circles are positioned on the right and bottom-left edges of the graph. The edges, which connect the nodes, are predominantly thin, dark blue lines, suggesting connections within the main cluster. However, a significant number of thin, light brown lines emanate from the two orange nodes, connecting them to many of the dark blue nodes.
### Components/Axes
This image is a network graph and does not have traditional axes or legends with numerical scales. The components are:
* **Nodes:**
* **Dark Blue Circles:** These are the most numerous nodes, appearing as small, dark blue dots. They are densely packed in the left and central areas, with a particularly high concentration in the center-left, forming a radial pattern.
* **Orange Circles:** Two larger, distinct orange circles are present. One is located on the far right side of the graph, and the other is on the bottom-left edge.
* **Edges (Connections):**
* **Dark Blue Lines:** These are thin lines connecting many of the dark blue nodes to each other. They form a dense web within the main cluster of dark blue nodes.
* **Light Brown Lines:** These are also thin lines, but they are distinctly lighter in color. They originate from the two orange nodes and extend outwards to connect with a large number of the dark blue nodes.
### Detailed Analysis or Content Details
* **Dark Blue Nodes:** There are approximately 1000-1200 dark blue nodes visible. Their distribution is not uniform; they are heavily concentrated in the left and central regions, with a clear radial structure emanating from a central point within this cluster.
* **Orange Nodes:** There are exactly 2 orange nodes.
* **Dark Blue Edges:** The dark blue edges form a complex network among the dark blue nodes. Many nodes appear to have multiple connections to other dark blue nodes. The density of these connections is highest in the central part of the dark blue cluster.
* **Light Brown Edges:** The light brown edges originate from the two orange nodes.
* The orange node on the right appears to be connected to approximately 100-150 dark blue nodes. These connections fan out from the orange node.
* The orange node on the bottom-left appears to be connected to a smaller number of dark blue nodes, estimated to be around 20-30. These connections are more spread out.
### Key Observations
* **Centralized Clustering:** The dark blue nodes form a dense cluster, with a noticeable hub-like structure in the center-left, suggesting a core group with many internal connections.
* **External Influence/Connection:** The two orange nodes act as distinct points of connection to the larger cluster of dark blue nodes. The orange node on the right has a significantly higher number of connections to the dark blue nodes compared to the orange node on the bottom-left.
* **Divergent Connection Patterns:** The light brown lines originating from the orange nodes suggest a different type of relationship or influence compared to the internal connections of the dark blue nodes. The radial fanning of these lines from the orange nodes indicates they are acting as sources or hubs for these connections.
### Interpretation
This network graph visually represents a system with two distinct types of entities or states. The large cluster of dark blue nodes likely represents a primary group or set of elements that are highly interconnected among themselves. The radial pattern within this cluster suggests a potential hierarchy or a central core from which connections spread.
The two orange nodes appear to be external entities or special nodes that interact with the main cluster. The significantly higher number of connections from the orange node on the right suggests it plays a more prominent role in influencing or connecting to the dark blue nodes compared to the orange node on the bottom-left. This could represent:
* **Hubs and Spokes:** The orange nodes could be central hubs, and the dark blue nodes are spokes, with the light brown lines representing the connections. The right orange node is a much larger hub.
* **Categorization:** The dark blue nodes might represent one category of items, and the orange nodes represent another, with specific interaction patterns between them.
* **Influence or Flow:** The light brown lines could represent a flow of information, resources, or influence originating from the orange nodes and directed towards the dark blue nodes. The asymmetry in connections suggests a directional or preferential interaction.
The overall structure implies a system where a large, internally connected component is influenced or connected to by two external points, one of which is a much stronger connector than the other. The visual density of connections suggests a complex and potentially dynamic system.
</details>
(b) Question subgraph
<details>
<summary>x23.png Details</summary>
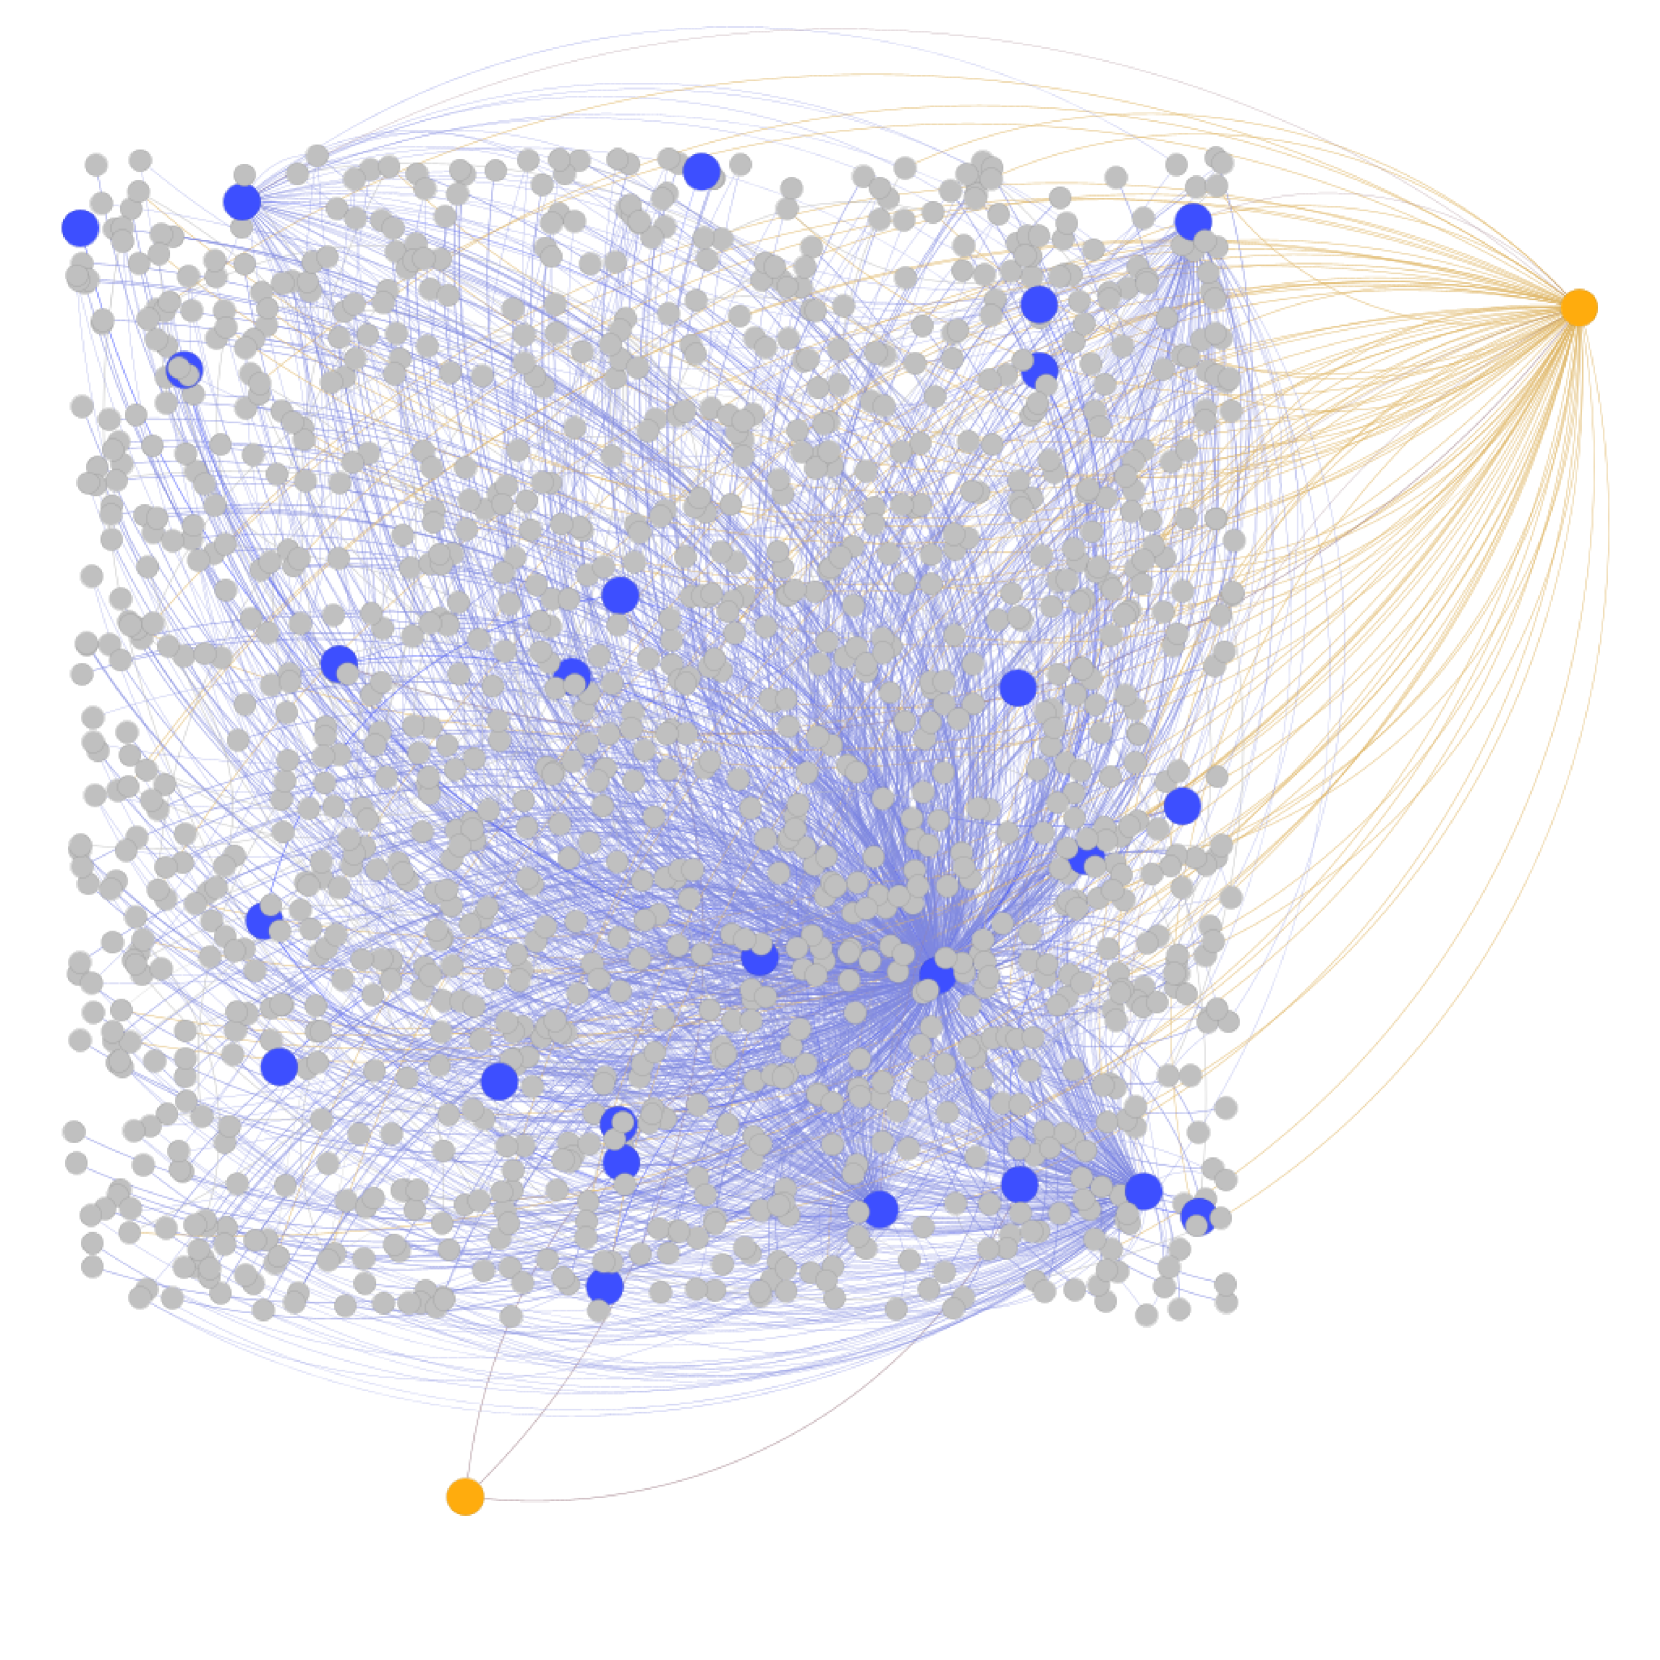
### Visual Description
## Network Graph: Interconnected Nodes
### Overview
This image displays a network graph, illustrating the relationships between various nodes. The nodes are represented by circles of different colors and sizes, and the connections between them are depicted by lines. The graph appears to be a visualization of a complex system with a central cluster of nodes and some peripheral nodes.
### Components/Axes
* **Nodes:**
* **Grey Nodes:** These are the most numerous nodes in the graph. They are generally smaller in size and are densely clustered in the central and left portions of the image.
* **Blue Nodes:** These nodes are larger than the grey nodes and are scattered throughout the central cluster. They appear to have a higher degree of connectivity within the blue and grey node groups.
* **Orange Nodes:** There are two distinct orange nodes. One is located in the far right of the image, and the other is in the bottom-left corner. These nodes appear to be highly connected to other nodes, particularly the orange node on the right.
* **Edges (Lines):**
* **Blue Lines:** These lines connect various nodes, predominantly linking blue nodes to other blue nodes and to the surrounding grey nodes. They form a dense web within the central cluster.
* **Orange Lines:** These lines emanate from the orange node on the right and connect to a large number of grey nodes, forming a fan-like structure. There are also a few thin grey lines connecting the orange node on the bottom-left to some grey nodes.
### Detailed Analysis or Content Details
* **Grey Nodes:** There are approximately 800-1000 grey nodes visible. They are distributed across the majority of the graph, with a high concentration in the central and left areas.
* **Blue Nodes:** There are approximately 20-25 blue nodes. They are larger than the grey nodes and are interspersed within the dense cluster of grey nodes.
* **Orange Nodes:** There are exactly 2 orange nodes.
* One orange node is positioned on the far right edge of the graph. It has a very high degree of connectivity, with numerous orange lines extending from it to many grey nodes.
* The second orange node is located in the bottom-left corner of the graph. It has a much lower degree of connectivity, with only a few thin grey lines connecting it to some grey nodes.
* **Connectivity:**
* The blue nodes appear to be highly interconnected with each other and with the surrounding grey nodes, forming a dense sub-network.
* The orange node on the right acts as a central hub for a significant portion of the grey nodes, indicated by the dense fan of orange lines.
* The orange node on the bottom-left seems to have a more isolated role, with limited connections.
### Key Observations
* **Centralized Clustering:** The majority of grey and blue nodes are clustered together in the center and left of the graph, suggesting a tightly knit community or system.
* **Hub-and-Spoke Structure:** The orange node on the right exhibits a clear hub-and-spoke pattern, connecting to a large number of other nodes. This suggests it might be a central source or influencer.
* **Differential Connectivity:** The two orange nodes have vastly different levels of connectivity, indicating distinct roles or importance within the network.
* **Color-Coded Significance:** The use of different colors (grey, blue, orange) likely signifies different types of nodes or categories within the network, with distinct interaction patterns.
### Interpretation
This network graph visually represents a system with distinct components and relationships. The dense cluster of grey and blue nodes suggests a core group with many internal connections. The blue nodes, being larger and interspersed within this cluster, might represent key entities or influencers within that core group.
The orange node on the right is a significant outlier, acting as a major connector to a large segment of the grey nodes. This could represent an external influence, a central server, a primary data source, or a critical point of interaction for a large part of the network. The sheer number of orange lines emanating from it strongly suggests a dominant role.
In contrast, the orange node on the bottom-left appears to be a minor or peripheral element, with very few connections. This could represent a less important entity, a newly added component, or a node with limited interaction scope.
The overall structure suggests a network that is not uniformly connected. There's a clear distinction between the densely interconnected core and the more peripheral elements, with the orange node on the right acting as a significant bridge or gateway. This visualization could be used to understand information flow, identify central points of control or influence, or analyze the structure of a complex system. The different node colors and line types likely represent different types of entities and the nature of their relationships (e.g., data flow, communication, dependency).
</details>
(c) Fuzzy selection
<details>
<summary>x24.png Details</summary>
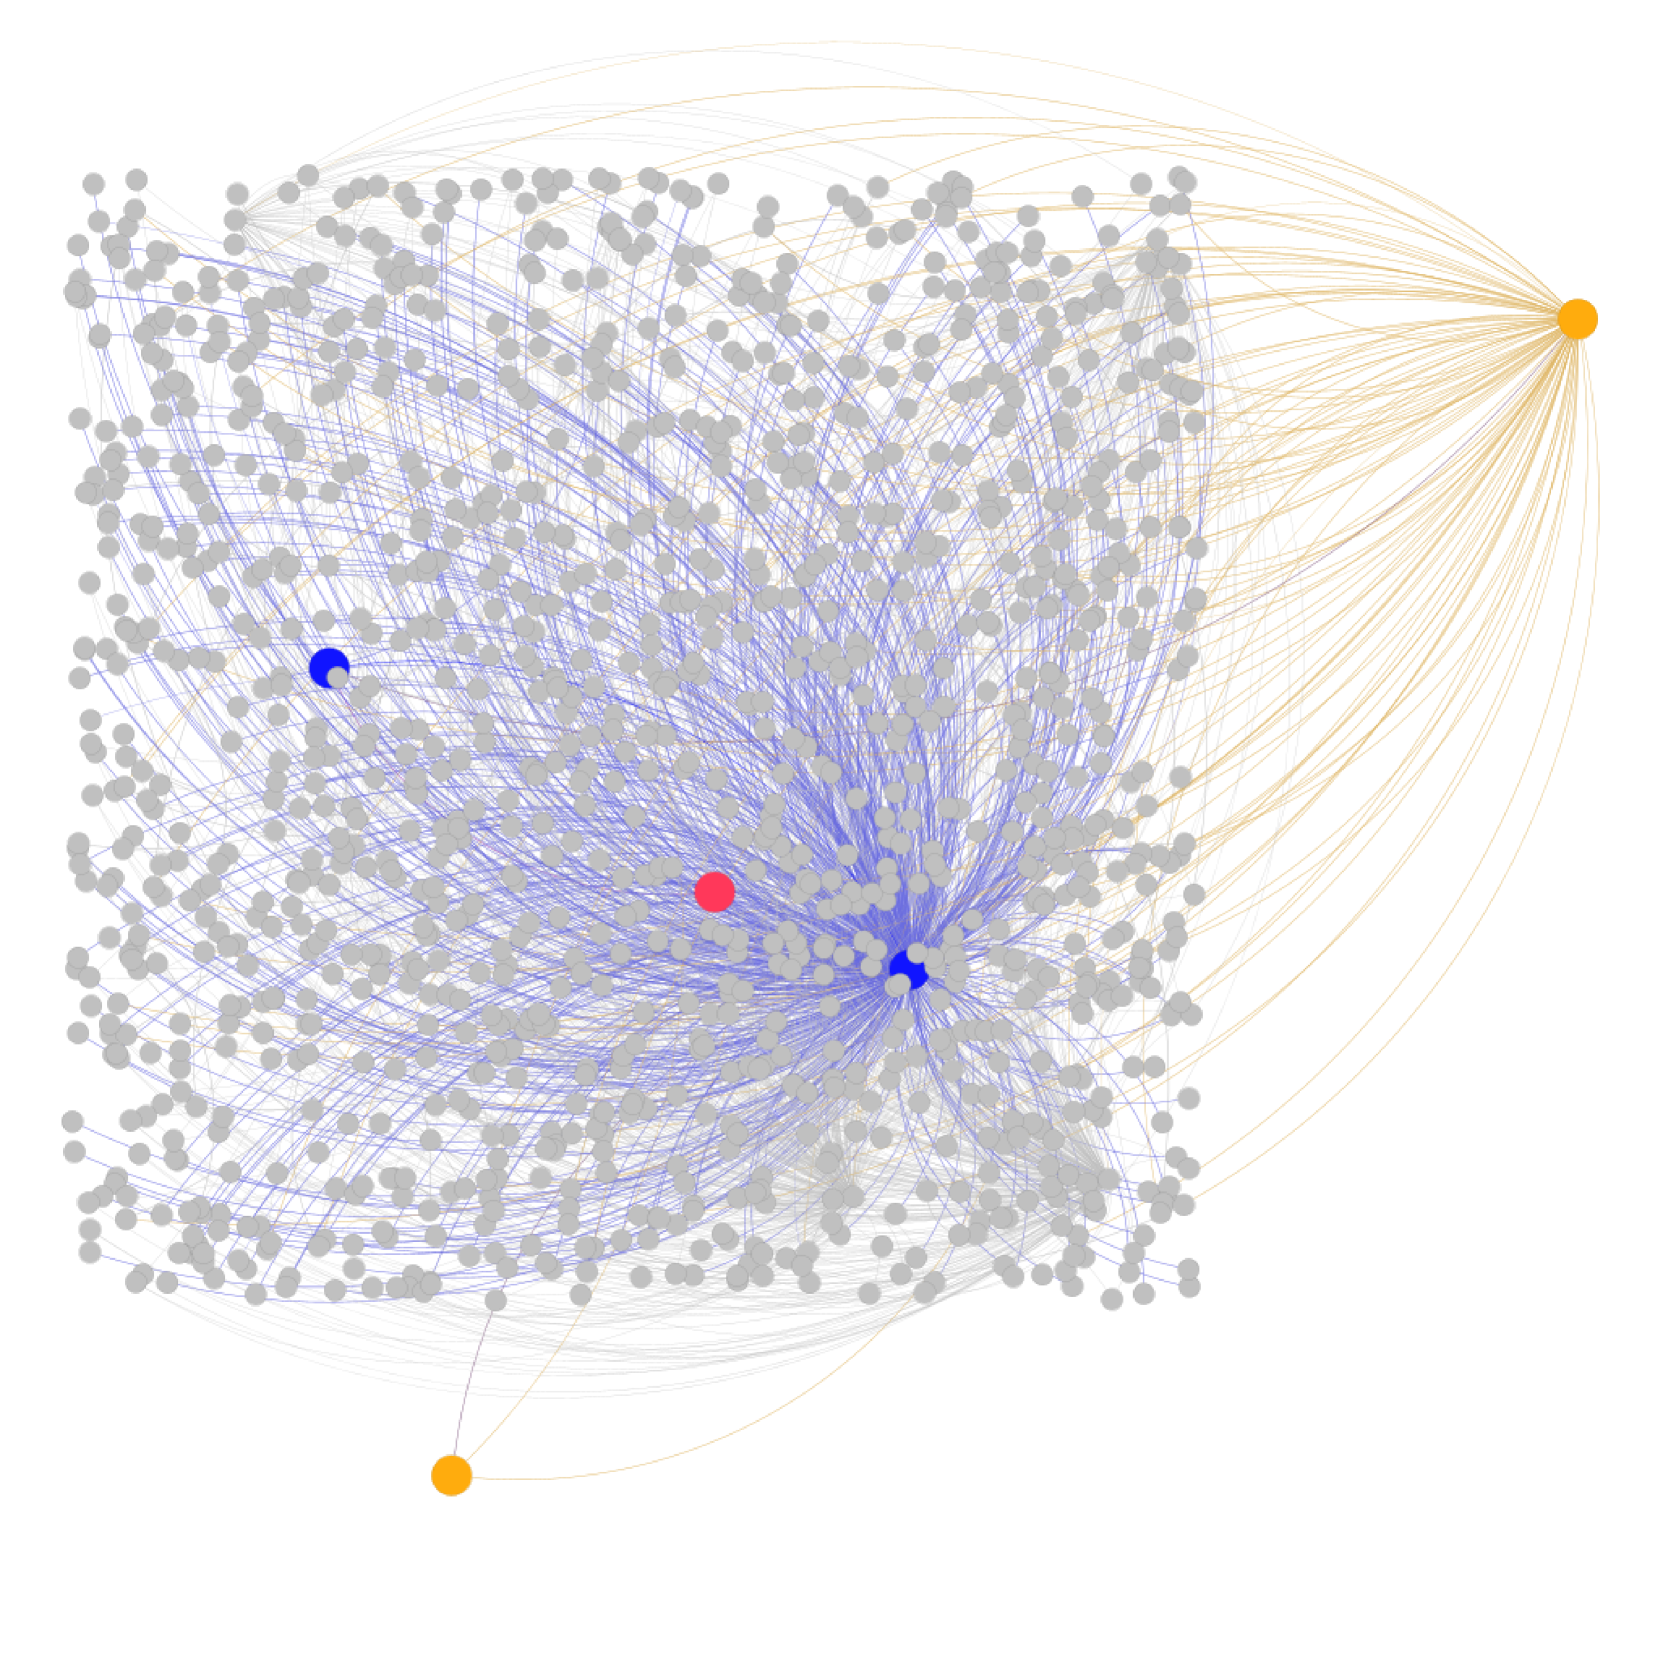
### Visual Description
## Network Graph: Unlabeled Network Visualization
### Overview
The image displays a network graph with a large number of nodes and edges. The nodes are colored in three distinct categories: grey, blue, and orange. The edges, representing connections between nodes, are also colored, primarily in blue and a lighter shade of orange/tan. The graph appears to be a visualization of relationships or connections within a system, with some nodes acting as central hubs or outliers. There are no explicit labels, titles, or legends present in the image.
### Components/Axes
* **Nodes:**
* **Grey Nodes:** The most numerous type of node, appearing in a dense cluster towards the left and center of the image. They are interconnected by blue and some tan edges.
* **Blue Nodes:** Two prominent blue nodes are visible. One is located within the dense cluster of grey nodes, appearing to be a central point for many blue edges. The second blue node is positioned further to the left and slightly above the main cluster.
* **Orange Nodes:** Two orange nodes are present. One is located in the far right of the image, acting as a focal point for a large number of tan edges. The second orange node is situated in the bottom-left corner, connected by a single tan edge to the main cluster of grey nodes.
* **Edges:**
* **Blue Edges:** These edges predominantly connect the grey nodes to each other and to the central blue node. They form a dense, fan-like structure emanating from the central blue node.
* **Tan/Orange Edges:** These edges connect the grey nodes to the orange node on the far right, and also connect the grey nodes to the orange node in the bottom-left. The edges connecting to the right orange node are numerous and spread out.
* **Axes/Scales:** There are no visible axes, scales, or grid lines. The positioning of nodes and edges is relative to each other within the image canvas.
### Detailed Analysis or Content Details
Due to the absence of labels and scales, precise numerical data extraction is not possible. However, visual estimations can be made:
* **Number of Nodes:**
* Grey Nodes: Estimated to be in the range of 1000-1500 nodes.
* Blue Nodes: 2 nodes.
* Orange Nodes: 2 nodes.
* **Number of Edges:**
* Blue Edges: A very large number, likely in the thousands, primarily originating from or connecting to the central blue node and the grey nodes.
* Tan/Orange Edges: A significant number, particularly those connecting to the orange node on the right, also likely in the thousands. The edges connecting to the bottom-left orange node are fewer, perhaps in the tens.
* **Node Distribution:**
* The majority of grey nodes are concentrated in a dense cluster in the left and central regions of the image.
* The central blue node is positioned within this dense cluster, suggesting it is a highly connected node within this group.
* The orange node on the right is an outlier, with a large number of connections radiating towards it from the main cluster.
* The orange node on the bottom-left is also an outlier, with fewer connections.
* **Edge Density:**
* The area around the central blue node and the grey nodes exhibits high edge density, indicating many interconnections.
* The connections to the right orange node are also dense, forming a distinct visual pattern.
### Key Observations
* **Centralization:** The network appears to have at least two potential central points: the central blue node, which is a hub for blue edges and grey nodes, and the orange node on the right, which is a hub for tan edges and grey nodes.
* **Clustering:** A significant cluster of grey nodes exists, suggesting a cohesive group or community within the network.
* **Outliers:** The two orange nodes, particularly the one on the far right, act as significant outliers, drawing connections from the main cluster. The bottom-left orange node is also an outlier but with fewer connections.
* **Color-Coded Relationships:** The distinct colors of nodes and edges suggest different types of entities or relationships. Blue edges and nodes might represent one category of interaction, while tan/orange edges and nodes represent another. The grey nodes appear to be a common element interacting with both.
### Interpretation
This network graph visualizes a system with distinct components and relationships. The presence of multiple colored nodes and edges suggests a classification of entities and their interactions.
The dense cluster of grey nodes, interconnected by blue edges and also linked to a central blue node, indicates a primary group or community where internal connections are prevalent, and the blue node might represent a key influencer, server, or focal point within this group.
The orange node on the right, with its numerous radiating tan edges connecting to the grey nodes, suggests it is a significant external entity or service that interacts with a large portion of the primary group. This could represent a popular platform, a widely used resource, or a central point of dissemination for information or services.
The orange node in the bottom-left, while also an outlier, has far fewer connections. This might represent a less influential external entity, a niche service, or a node with a specific, limited role.
The overall structure suggests a system where a core group (grey nodes) is influenced or connected to distinct external entities (blue and orange nodes) in varying degrees. The visualization could be used to understand network topology, identify central actors, analyze community structures, or map the flow of information or resources within a complex system. Without labels, the specific domain or meaning of these nodes and edges remains speculative, but the visual patterns strongly imply a structured set of relationships.
</details>
(d) Precise selection
Figure 11. Visualization of graph reduction and Path selection.
Case study: interpretable reasoning. In this section, we present Table 9, which illustrates PoG’s interpretability through case studies involving questions with one, two, and three entities. These examples demonstrate PoG’s effectiveness in handling multi-entity and multi-hop tasks by providing clear and understandable reasoning paths that lead to accurate answers.
Table 9. Examples of faithful and interpretable reasoning of PoG.
| Field | Content |
| --- | --- |
| Question | Lou Seal is the mascot for the team that last won the World Series when? |
| Answer | 2014 World Series |
| Topic Entity | Lou Seal |
| LLM indicator | ” Lou Seal ” - mascot for - team - last won - World Series - when |
| Split Question | split_question 1: What team is ”Lou Seal” the mascot for? |
| split_question 2: When did the last World Series win occur for the team with Lou Seal as the mascot? | |
| Reasoning Path | {Lou Seal} $\rightarrow$ sports.mascot.team $\rightarrow$ {San Francisco Giants} $\rightarrow$ sports.sports_team.championships $\rightarrow$ {2014 World Series, 2012 World Series, 2010 World Series} |
| PoG answer | answer: {2014 World Series} |
| reason: From the given path {Lou Seal} $\rightarrow$ sports.mascot.team $\rightarrow$ {San Francisco Giants}, {San Francisco Giants} is the team that ”Lou Seal” serves as the mascot for. From {San Francisco Giants} $\rightarrow$ sports.sports_team.championships $\rightarrow$ {2014 World Series, 2012 World Series, 2010 World Series}, the last World Series won by the {San Francisco Giants} is in {2014}. Therefore, the provided knowledge graph path is sufficient to answer the overall question, and the answer is {2014 World Series}. | |
| Question | What European Union country sharing borders with Germany contains the Lejre Municipality? |
| Answer | Denmark |
| Topic Entity | {Germany, Lejre Municipality} |
| LLM indicator | ” Lejre Municipality ” – contained by - European Union country (answer)- shares borders with-” Germany ” |
| Split Question | split_question 1: What European Union country shares borders with ”Germany”? |
| split_question 2: What country contains the Lejre Municipality? | |
| Reasoning Path | {Lejre Municipality} $\rightarrow$ location.administrative_division.country $\rightarrow$ {Denmark} $\rightarrow$ location.location.containedby $\rightarrow$ {Eurasia} $\rightarrow$ location.location.contains $\rightarrow$ {Germany}, |
| {Lejre Municipality} $\rightarrow$ location.administrative_division.country $\rightarrow$ {Denmark} $\rightarrow$ base.locations.countries. continent $\rightarrow$ {Europe} $\rightarrow$ location.location.contains $\rightarrow$ {Western Europe} $\rightarrow$ location.location.contains $\rightarrow$ {Germany} | |
| PoG answer | answer: {Denmark} |
| reason: From {Denmark} $\rightarrow$ location.location.containedby $\rightarrow$ {Eurasia} $\rightarrow$ location.location.contains $\rightarrow$ {Germany}, Denmark is European Union country shares borders with ”Germany”. From {Lejre Municipality} $\rightarrow$ location.administrative_division.country $\rightarrow$ {Denmark}, Denmark is a country contains the Lejre Municipality Both paths lead to Denmark, which is the European Union country sharing borders with Germany and containing the Lejre Municipality. Therefore, the provided knowledge graph path is sufficient to answer the main question, and the answer is {Denmark}. | |
| Question | What Central Tiem Zone continent do the Falkland Islands belong to? |
| Answer | Americas |
| Topic Entity | {Falkland Islands, Continent, Central Time Zone} |
| LLM indicator | answer(” Central Time Zone ”) – owns - answer(” Continent ”)- located contain -” Falkland Islands ” |
| Split Question | split_question 1:What continent do the Falkland Islands belong to? |
| split_question 2: What Central Time Zone does the continent belong to? | |
| Reasoning Path | {Central Time Zone} $\rightarrow$ time.time_zone.locations_in_this_time_zone $\rightarrow$ {Americas} $\rightarrow$ common.topic.not able_types $\rightarrow$ {Continent} $\rightarrow$ common.topic. notable_types $\rightarrow$ {Americas} $\rightarrow$ location.location.con tains $\rightarrow$ { Falkland Islands} |
| PoG answer | answer: {Americas} |
| reason: From {Continent} $\rightarrow$ common.topic.notable_types $\rightarrow$ {Americas} $\rightarrow$ location.location. contains $\rightarrow$ { Falkland Islands}, Americas is the continent Falkland Islands belong to. From {Central Time Zone} $\rightarrow$ time.time_zone.locations_in_this_time_zone $\rightarrow$ {Americas} $\rightarrow$ common.topic. notable_types $\rightarrow$ {Continent}. Americas is the Central Time Zone. Therefore, the provided knowledge graph path is sufficient to answer the overall question, and the answer is {Americas}. | |
## Appendix C Experiment Details
Experiment datasets. To evaluate PoG’s capability in multi-hop knowledge-intensive reasoning tasks, we assess it on four KBQA datasets: three multi-hop datasets (CWQ (Talmor and Berant, 2018), WebQSP (Yih et al., 2016), GrailQA (Gu et al., 2021)) and one single-hop dataset (SimpleQuestions (Petrochuk and Zettlemoyer, 2018)). Additionally, to examine PoG on more general tasks, we include an open-domain QA dataset, WebQuestions. For the evaluation of large datasets such as CWQ, GrailQA, and SimpleQuestions, we utilize a random sample of 1,000 test cases from CWQ and employ the 1,000 samples previously reported by ToG (Sun et al., 2024) to facilitate a comparison with the SOTA while also minimizing computational costs. Freebase serves as the background knowledge graph for all datasets, which encompasses approximately 88 million entities, 20,000 relations, and 126 million triples (Luo et al., 2024; Bollacker et al., 2008). The statistics of the datasets utilized in this study are detailed in Table 10. The source code has been publicly available https://github.com/SteveTANTAN/PoG.
Baselines. Inspired by ToG (Sun et al., 2024), we compare our method with standard prompting (IO), Chain-of-Thought (CoT), and Self-Consistency (SC) promptings with six in-context exemplars and ”step-by-step” reasoning chains. For each dataset, we also include previous SOTA works for comparison. For a fair play, we compare with previous SOTA among all prompting-based methods and previous SOTA among all methods respectively. Since ToG is the current SOTA prompting-based method, we directly refer to their results and those of other baselines reported in their paper for comparisons.
Experimental implementation. Leveraging the plug-and-play convenience of our framework, we experiment with two LLMs: GPT-3.5 and GPT-4. We use the OpenAI API to access GPT-3.5 (GPT-3.5-turbo) and GPT-4. Aligning with ToG, we set the temperature parameter to 0.4 during the exploration process (to increase diversity) and to 0 during the reasoning process (to ensure reproducibility). The maximum token length for generation is set to 256. In all experiments, we set both $W_{\max}$ and $D_{\max}$ to 3 for beam search. All the experiments are conducted on a machine with Intel Xeon Gold 6248R CPU, Nvidia A5000 GPU and 512GB memory.
Table 10. Statistics of the datasets used in this paper. † denotes we randomly select 1,000 samples from the CWQ test set to create the experiment testing set due to the abundance of test samples. ∗ denotes that we utilize the 1,000 samples reported by ToG (Sun et al., 2024) to compare with the state-of-the-art.
| Dataset | Answer Format | Test | Train |
| --- | --- | --- | --- |
| ComplexWebQuestions (CWQ) † | Entity | 1,000 | 27,734 |
| WebQSP | Entity/Number | 1,639 | 3,098 |
| GrailQA ∗ | Entity/Number | 1,000 | 44,337 |
| Simple Question ∗ | Entity/Number | 1,000 | 14,894 |
| WebQuestions | Entity/Number | 2,032 | 3,778 |
## Appendix D SPARQL
This section outlines the pre-defined SPARQL queries used for interacting with the knowledge graph and constructing graphs for our experiments.
### D.1. 1-hop Entity and Relation Search
To facilitate the retrieval of 1-hop neighbors of entities within the Freebase Knowledge Graph, we have predefined a SPARQL query. This query is designed to be executed by simply substituting the appropriate ID for the query entity ID. It returns the connected entities’ IDs and their associated relations’ IDs, indicating whether the connected entity is at the tail or the head of the relation.
⬇
PREFIX ns: < http:// rdf. freebase. com / ns />
SELECT ? relation ? connectedEntity ? direction
WHERE {
{
ns: ID ? relation ? connectedEntity .
BIND ("tail" AS ? direction)
}
UNION
{
? connectedEntity ? relation ns: ID .
BIND ("head" AS ? direction)
}
}
### D.2. Short Textual Description
The following predefined function implements the retrieval of short textual descriptions, $\mathcal{D}(.)$ , for converting the identifiers (IDs) of entities or relations into natural language descriptions.
⬇
PREFIX ns: < http:// rdf. freebase. com / ns />
SELECT DISTINCT ? tailEntity
WHERE {
{
? entity ns: type. object. name ? tailEntity .
FILTER (? entity = ns: ID)
}
UNION
{
? entity < http:// www. w3. org /2002/07/ owlsameAs > ? tailEntity .
FILTER (? entity = ns: ID)
}
}
### D.3. 1-hop Subgraph Search
To facilitate subgraph detection in Section 4.1, we implement the 1-hop subgraph detection feature by integrating SPARQL functions described in Appendix D.1 and D.2. The purpose of this function is to retrieve, in a single SPARQL query, the 1-hop neighbors of a given query with their IDs, natural language names, and connected relationships, specifying whether the connected entity is at the tail or the head of the relationship.
⬇
PREFIX ns: < http:// rdf. freebase. com / ns />
SELECT ? relation ? connectedEntity ? connectedEntityName ? direction
WHERE {
{
ns: ID ? relation ? connectedEntity .
OPTIONAL {
? connectedEntity ns: type. object. name ? name .
FILTER (lang (? name) = ’ en ’)
}
BIND (COALESCE (? name, "Unnamed Entity") AS ? connectedEntityName)
BIND ("tail" AS ? direction)
}
UNION
{
? connectedEntity ? relation ns: ID .
OPTIONAL {
? connectedEntity ns: type. object. name ? name .
FILTER (lang (? name) = ’ en ’)
}
BIND (COALESCE (? name, "Unnamed Entity") AS ? connectedEntityName)
BIND ("head" AS ? direction)
}
}
## Appendix E Prompts
In this section, we detail the prompts required for our main experimental procedures.
Question Analysis Prompt Template
You will receive a multi-hop question, which is composed of several interconnected queries, along with a list of topic entities that serve as the main keywords for the question. Your task is to break the question into simpler parts, using each topic entity once and provide a Chain of Thought (CoT) that shows how the topic entities are related. Note: Each simpler question should explore how one topic entity connects to others or the answer. The goal is to systematically address each entity to derive the final answer. In-Context Few-shot Q: {Query} Topic Entity: {Topic Entity} A:
LLM Supplement Prompt Template
Using the main question, a possibly uncertain chain of thought generated by a language model, some related split questions, paths from the ”Related_paths” section, and main topic entities: please first provide three predicted results, and second offer three possible chains of thought that could lead to these results, using the provided knowledge paths and your own knowledge. If any answers are unclear, suggest alternative answers to fill in the gaps in the chains of thought, following the same format as the provided examples. In-Context Few-shot Q: {Query} Topic Entity: {Topic Entity} Think Indicator:{Think Indicator} Split Question:{Split Question} A:
where {Think Indicator}, and {Split Question} are obtained in section 4.1. An indicator example is shown in Figure 2.
Precise Path Select Prompt Template
Given a main question, a LLM-generated thinking Cot that considers all the entities, a few split questions that you can use one by one and finally obtain the final answer, and the associated retrieved knowledge graph path, {set of entities (with id start with ”m.”)} -¿ {set of relationships} -¿ {set of entities(with id start with ”m.”)}, Please score and give me the top three lists from the candidate paths set can be highly to be the answer of the question. In-Context Few-shot Q: {Query} Think Indicator:{Think Indicator} Split Question:{Split Question} Candidate Paths:{Candidate Paths} A:
{Candidate Paths} denotes the retrieved reasoning paths $Final_{p}aths$ to be selected in this request which are formatted as a series of structural sentences:
$\{e_{0x},...,e_{0z}\}\to r_{1_{i}}\to\{e_{1x},...,e_{1z}\}\to\dots$ $\to r_{l_{j}}\to\{e_{lx},...,e_{lz}\}$
$\dots$
$\{e_{0x},...,e_{0z}\}\to r_{1_{i}}\to\{e_{1x},...,e_{1z}\}\to\dots$ $\to r_{l_{j}}\to\{e_{lx},...,e_{lz}\}$ ,
where, $i$ and $j$ in $r_{1_{i}},r_{1_{i}}$ represent the $i$ -th, $j$ -th relation from each relation edge in the clustered question subgraph. And $e$ is constructed by its ID and natural language name $\mathcal{D}(ID)$ .
Path Summarizing Prompt Template
Given a main question, an uncertain LLM-generated thinking Cot that considers all the entities, a few split questions that you can use one by one and finally obtain the final answer, the associated accuracy retrieved knowledge paths from the Related paths section, and main topic entities. Your task is to summarize the provided knowledge triple in the Related paths section and generate a chain of thoughts by the knowledge triple related to the main topic entities of the question, which will used for generating the answer for the main question and split question further. You have to make sure you summarize correctly by using the provided knowledge triple, you can only use the entity with id from the given path and you can not skip in steps. In-Context Few-shot Q: {Query} Think Indicator:{Think Indicator} Split Question:{Split Question} Related Paths:{Related Paths} A:
{Related_Paths} has the same format with the {Candidate_Paths} before.
Question Answering Evaluation Prompt Template
Given a main question, an uncertain LLM-generated thinking Cot that considers all the entities, a few split questions that you can use and finally obtain the final answer, and the associated retrieved knowledge graph path, {set of entities (with id start with ”m.”)} -¿ {set of relationships} -¿ {set of entities(with id start with ”m.”)}. Your task is to determine if this knowledge graph path is sufficient to answer the given split question first then the main question. If it’s sufficient, you need to respond {Yes} and provide the answer to the main question. If the answer is obtained from the given knowledge path, it should be the entity name from the path. Otherwise, you need to response {No}, then explain the reason. In-Context Few-shot Q: {Query} Think Indicator:{Think Indicator} Split Question:{Split Question} Related Paths:{Related Paths} A:
Question Answering Generation Prompt Template
Given a main question, an uncertain LLM-generated thinking Cot that considers all the entities, a few split questions that you can use one by one and finally obtain the final answer, and the associated retrieved knowledge graph path, {set of entities (with id start with ”m.”)} -¿ {set of relationships} -¿ {set of entities(with id start with ”m.”)}, Your task is to generate the answer based on the given knowledge graph path and your own knowledge. In-Context Few-shot Q: {Query} Think Indicator:{Think Indicator} Split Question:{Split Question} Related Paths:{Related Paths} A: