# Trustworthy XAI and Its Applications
**Authors**: A.S.M AnasFerdous, AbdurRashid, Fatema Tuj JohuraSoshi, ParagBiswas, AngonaBiswas, KishorDatta Gupta
[1] MD Abdullah Al Nasim
1,6] Research and Development Department, Pioneer Alpha, Dhaka, Bangladesh
2] Department of Biomedical Engineering, Bangladesh University of Engineering and Technology, Dhaka, Bangladesh
4] Msc in Data Science and Analytics, University of Hertfordshire, Hatfield, UK
3, 5] MSEM Department, Westcliff university, California, United States
7] Department of Computer and Information Science, Clark Atlanta University, Georgia, USA
## Abstract
Artificial Intelligence (AI) is an important part of our everyday lives. We use it in self-driving cars and smartphone assistants. People often call it a ”black box” because its complex systems, especially deep neural networks, are hard to understand. This complexity raises concerns about accountability, bias, and fairness, even though AI can be quite accurate. Explainable Artificial Intelligence (XAI) is important for building trust. It helps ensure that AI systems work reliably and ethically. This article looks at XAI and its three main parts: transparency, explainability, and trustworthiness. We will discuss why these components matter in real-life situations. We will also review recent studies that show how XAI is used in different fields. Ultimately, gaining trust in AI systems is crucial for their successful use in society.
keywords: Artificial Intelligence(AI), XAI, Explainable Artificial Intelligence (XAI), Healthcare, Autonomous Vehicles
## 1 Introduction
The foundations of modern artificial intelligence were laid by philosophers who attempted to define human thought as the mechanical manipulation of symbols, which led to the development of the programmable digital computer [1] in the 1940s. Alan Turing may have written the first article on the topic of AI in 1941, though it is now lost, suggesting that he was at least considering the idea at that time.In his groundbreaking essay ”Computing Machinery and Intelligence” from 1950, Turing first presented the idea of the Turing test to the general public [2]. Turing questioned the feasibility of creating thinking robots in it. John McCarthy first used the term artificial intelligence (AI) in 1956 at the Dartmouth Conference [3], but the first models’ numerous flaws have prevented AI from being widely adopted and used in healthcare.
Many of these limitations were removed with the advent of deep learning in the early 2000s, and we are now entering a new era of technology where AI can be used in clinical practice through risk assessment models that increase diagnostic accuracy and workflow efficiency. Performance of AI systems has improved significantly in recent years, and these new models expand on their capabilities to include text-image synthesis based on almost any prompt, whereas previous systems primarily focused on generating facial images.
<details>
<summary>extracted/6367585/image/a1.png Details</summary>
### Visual Description
\n
## Radial Diagram: Application of AI Across Industries
### Overview
The image is a circular, hierarchical diagram (a sunburst or radial chart) illustrating the diverse applications of Artificial Intelligence (AI) across multiple industries. The central hub is labeled "Application of AI," from which various industry sectors radiate outward. Each industry sector is further broken down into specific AI applications or use cases listed in the outermost ring. The diagram uses color-coding to group related industries and their applications.
### Components/Axes
* **Central Hub:** A grey circle at the very center with the text "Application of AI".
* **Inner Ring (Industry Sectors):** This ring contains the primary categories, each in a distinct colored segment. The industries are:
* Home furnishing industrial (Yellow)
* Retail industry (Light Orange)
* Security industry (Light Blue)
* Health care (Light Green)
* Electronic commerce (Yellow)
* Other industries (Grey)
* Manufacturing industry (Light Orange)
* Financial industry (Light Blue)
* Logistics industry (Light Green)
* **Outer Ring (Specific Applications):** This ring contains bulleted lists of specific AI applications corresponding to each industry sector in the inner ring. The text is black on colored backgrounds matching their parent industry segment.
* **Color Legend (Implied):** The diagram uses color to associate outer-ring applications with inner-ring industries. There is no separate legend box; the color connection is direct and spatial.
* Yellow: Home furnishing industrial, Electronic commerce
* Light Orange: Retail industry, Manufacturing industry
* Light Blue: Security industry, Financial industry
* Light Green: Health care, Logistics industry
* Grey: Other industries
### Detailed Analysis
The diagram is processed clockwise, starting from the top.
**1. Home furnishing industrial (Yellow, Top Sector)**
* **Applications:**
* Intelligent speakers
* Remote control
* Environmental monitoring
* Anti-theft alarm
* Programmable control
**2. Retail industry (Light Orange, Top-Right Sector)**
* **Applications:**
* Unmanned convenience store
* Unmanned warehouse
* Intelligent supply chain
* Intelligent customer flow statistics and analysis
**3. Security industry (Light Blue, Right Sector)**
* **Applications:**
* Human body analysis
* Vehicle analysis
* Image analysis
**4. Health care (Light Green, Bottom-Right Sector)**
* **Applications:**
* Medical robot
* Intelligent drug research and development
* Intelligent diagnosis and treatment
* Intelligent image recognition
* Intelligent health management
**5. Electronic commerce (Yellow, Bottom Sector)**
* **Applications:**
* Intelligent customer service robot
* Recommendation engine
* Image search
* Sales and inventory forecast
* Commodity pricing
**6. Other industries (Grey, Bottom-Left Sector)**
* **Applications (Listed with sub-industries):**
* Education: Unmanned examination and marking
* Agricultural: Real-time monitoring of crop status
* Environmental protection: Intelligent energy consumption monitoring and analysis
* Urban management: Traffic route optimization
**7. Manufacturing industry (Light Orange, Left Sector)**
* **Applications:**
* Equipment fault prediction
* Product defect detection
* Machine vision positioning
* Man-machine cooperation
**8. Financial industry (Light Blue, Top-Left Sector)**
* **Applications:**
* Big data analysis of stock securities
* Industry trend analysis
* Investment risk forecast
**9. Logistics industry (Light Green, Top-Left Sector, adjacent to Financial)**
* **Applications:**
* UAV delivery
* Automatic sorting
* Automatic pilot
* Intelligent logistics planning
* Intelligent scheduling algorithm
### Key Observations
* **Breadth of Application:** The diagram showcases AI's penetration into nine distinct major industry sectors, from traditional fields like Manufacturing and Logistics to service-oriented sectors like Retail and Healthcare.
* **Common Themes:** Several application themes recur across industries:
* **Automation & Robotics:** "Unmanned" stores/warehouses, "Medical robot," "UAV delivery," "Automatic sorting/pilot."
* **Intelligent Analysis & Forecasting:** "Customer flow statistics," "Image analysis," "Trend analysis," "Risk forecast," "Sales and inventory forecast."
* **Monitoring & Management:** "Environmental monitoring," "Health management," "Crop status monitoring," "Energy consumption monitoring."
* **Sector-Specific Focus:** Each industry has tailored applications. For example, Manufacturing focuses on fault prediction and quality control, while Finance focuses on data analysis and risk assessment.
* **"Other industries" Catch-all:** This grey segment explicitly groups diverse fields (Education, Agriculture, Environmental Protection, Urban Management) that are significant but perhaps not the primary focus of the diagram's main categories.
### Interpretation
This diagram serves as a high-level conceptual map, demonstrating that AI is not a monolithic technology but a set of tools adaptable to solve specific problems across the economic spectrum. The radial structure emphasizes that all these diverse applications stem from the core concept of "Application of AI."
The visual grouping by color suggests a taxonomy where industries with similar operational characteristics (e.g., Logistics and Healthcare both in green; Security and Finance both in blue) might share underlying AI methodologies, such as pattern recognition or predictive analytics. The inclusion of "Other industries" is crucial, as it acknowledges AI's role in public sector and societal functions beyond pure commerce and industry.
The diagram is likely intended for an audience seeking to understand the scope of AI's impact, such as business strategists, investors, or students. It effectively communicates that AI's value is realized through its integration into domain-specific workflows, transforming operations from reactive to predictive and automated. The absence of quantitative data indicates its purpose is categorical and illustrative rather than analytical.
</details>
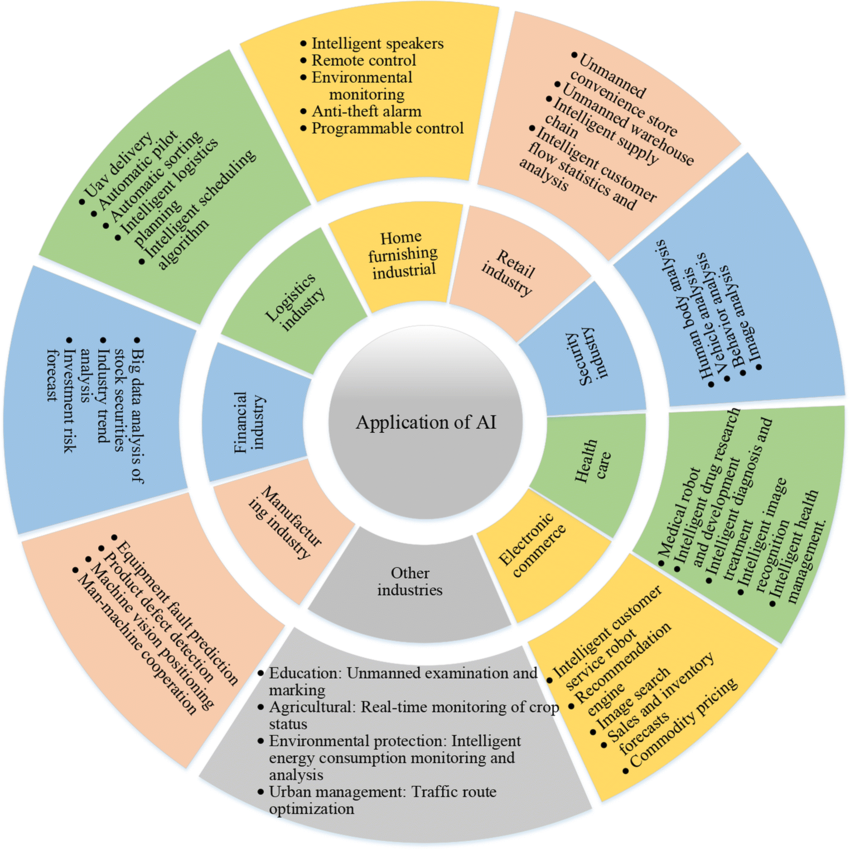
Figure 1: Applications of AI across various domains [4]
The diverse range of fields in which AI is being used already demonstrates its applicability and promise to revolutionize business: AI facilitates activities like sentiment analysis, machine translation, and spam filtering by making it easier for computers to comprehend and produce human language in the discipline of natural language processing (NLP) [5]. Additionally, computer vision [6] makes it possible for computers to understand visual data, which advances areas like facial recognition, object identification, and self-driving cars. Machine learning (ML), which has uses in fraud detection, recommendation systems, predictive analytics, and other domains, has made it possible for computers to learn from data. The design, development, and application of machines are the focus of the AI field of robotics [7].
Many industries, including manufacturing, healthcare, and space exploration, use various machines [8] [9]. Combining artificial intelligence with business intelligence (BI) [10] improves how businesses collect, process, and visualize data. This leads to better decision-making and increased productivity. In healthcare, AI helps diagnose diseases, develop treatments, and provide personalized care, which improves patient outcomes [11], [12], [13]. AI also plays a significant role in education by engaging students, customizing lessons, and automating administrative tasks, resulting in more personalized learning experiences. AI in agriculture increases agricultural output, reduces costs, and ensures environmental sustainability through data-driven strategies. In a similar vein, AI in manufacturing boosts output, efficiency, and quality through work automation and process optimization. AI is changing operations, enhancing services, and changing global industry landscapes in a number of sectors, including banking, retail, energy, transportation [14], handwriting detection [15], and government. AI is widely used in a wide number of industries, as seen in Figure 1. Retail, security, healthcare, e-commerce, manufacturing, banking, logistics and transportation, and home furnishings are some of these sectors. These applications rely on moderately advanced AI technology, such as computer vision, natural language processing, and machine learning.
The contributions of this research can be stated below:
1. Providing an overview of XAI that understands the significance of black box models. For fair and ethical purposes, XAI fosters trust among humans and AI.
1. Discussing Deep Learning based systems that will be consistent and trustworthy. Moreover, recent studies from the literature have been reviewed properly.
1. Providing guidelines regarding XAI that will be helpful for detecting problems from numerous domains.
1. The paper identifies and analyzes three key components of XAI: transparency, explainability, and trustworthiness. It details how these elements are essential for understanding and improving AI systems.
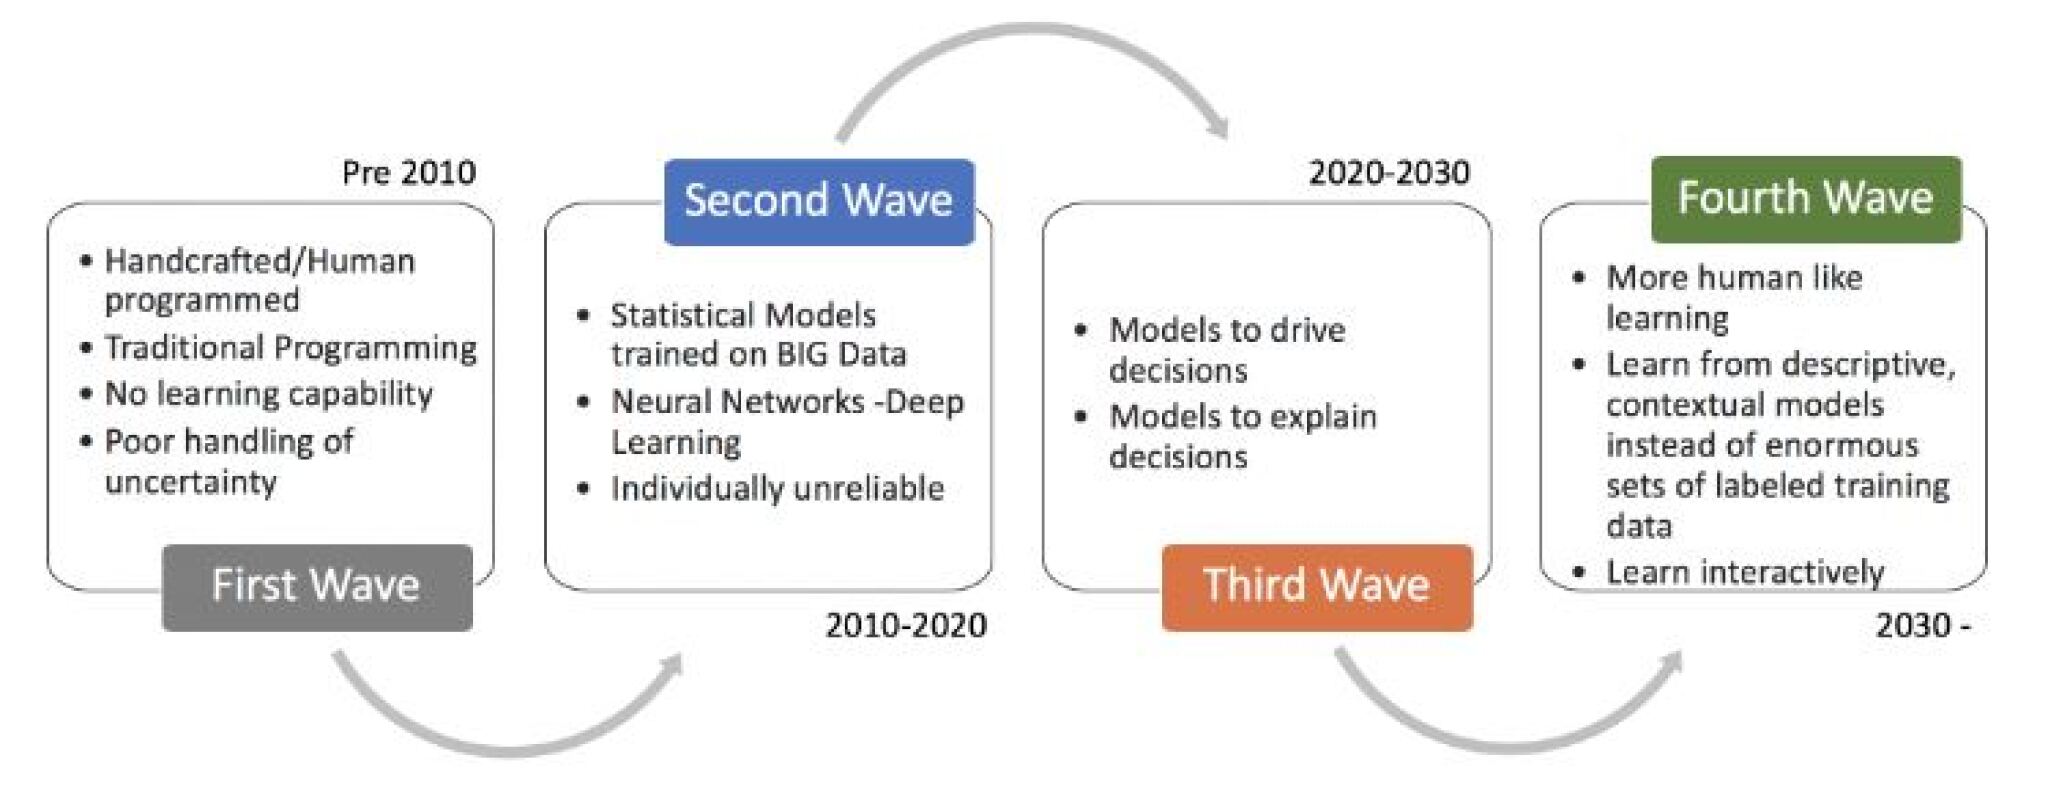
### 1.1 Third Wave of Artificial Intelligence (3AI)
Most current commercial AI technology is called ”narrow AI.” This means these systems are highly specialized and can only perform a few specific tasks. For example, even the best self-driving cars rely on limited AI systems. Another drawback of today’s AI is its reliance on large training data sets. A typical machine learning program needs tens of thousands of cat photos to recognize cats accurately, while a three-year-old child can do this with just a few examples. The idea of ”Third Wave AI” comes from the need for AI to become more humanlike in various ways to overcome these limitations and achieve its full potential.
<details>
<summary>x1.jpg Details</summary>
### Visual Description
## Diagram: Evolution of Artificial Intelligence Waves
### Overview
The image is a horizontal timeline diagram illustrating the evolution of Artificial Intelligence (AI) through four distinct "waves." Each wave is represented by a rectangular box containing bullet points that describe its key characteristics. The waves are connected by curved, gray arrows indicating progression from one era to the next. The diagram is presented on a plain white background.
### Components/Axes
The diagram consists of four main components (boxes) arranged from left to right, each associated with a specific time period and a colored label.
1. **First Wave Box (Leftmost)**
* **Label:** "First Wave" (gray box, bottom-left of the rectangle).
* **Time Period:** "Pre 2010" (text above the box).
* **Content:** A bulleted list of four items.
2. **Second Wave Box (Center-Left)**
* **Label:** "Second Wave" (blue box, top-left of the rectangle).
* **Time Period:** "2010-2020" (text below the box).
* **Content:** A bulleted list of three items.
3. **Third Wave Box (Center-Right)**
* **Label:** "Third Wave" (orange box, bottom-right of the rectangle).
* **Time Period:** "2020-2030" (text above the box).
* **Content:** A bulleted list of two items.
4. **Fourth Wave Box (Rightmost)**
* **Label:** "Fourth Wave" (green box, top-right of the rectangle).
* **Time Period:** "2030 -" (text below the box).
* **Content:** A bulleted list of three items.
**Flow Elements:** Two large, curved, gray arrows connect the boxes. One arrow arcs from the top of the "First Wave" box to the top of the "Second Wave" box. A second arrow arcs from the bottom of the "Third Wave" box to the bottom of the "Fourth Wave" box, indicating the directional flow of development.
### Detailed Analysis / Content Details
**Transcription of Textual Content:**
* **First Wave (Pre 2010):**
* Handcrafted/Human programmed
* Traditional Programming
* No learning capability
* Poor handling of uncertainty
* **Second Wave (2010-2020):**
* Statistical Models trained on BIG Data
* Neural Networks -Deep Learning
* Individually unreliable
* **Third Wave (2020-2030):**
* Models to drive decisions
* Models to explain decisions
* **Fourth Wave (2030 -):**
* More human like learning
* Learn from descriptive, contextual models instead of enormous sets of labeled training data
* Learn interactively
### Key Observations
1. **Progression of Capability:** The diagram shows a clear evolution from static, rule-based systems (First Wave) to systems capable of learning from data (Second Wave), then to systems focused on decision-making and explainability (Third Wave), and finally toward more adaptive, human-like, and interactive learning paradigms (Fourth Wave).
2. **Shift in Data & Learning Paradigm:** A major trend is the shift away from reliance on "enormous sets of labeled training data" (a hallmark of the Second Wave) toward learning from "descriptive, contextual models" and interactive environments in the Fourth Wave.
3. **Increasing Autonomy and Sophistication:** The characteristics evolve from having "No learning capability" to "Learn interactively," and from "Poor handling of uncertainty" to systems designed to "explain decisions," indicating a trajectory toward more autonomous, robust, and interpretable AI.
4. **Temporal Overlap and Projection:** The timeline includes historical periods (Pre-2010, 2010-2020), the current period (2020-2030), and a future projection (2030-), framing the Third and Fourth Waves as ongoing and future developments.
### Interpretation
This diagram presents a conceptual framework for understanding the historical and projected trajectory of AI development. It suggests that AI is not a monolithic field but has evolved through distinct technological and methodological paradigms.
* **The Narrative of Progress:** The flow implies a linear progression where each wave addresses limitations of the previous one. The First Wave's lack of learning is solved by the Second Wave's statistical models. The Second Wave's "individually unreliable" nature and black-box problems are addressed by the Third Wave's focus on explainable decision-making. The Fourth Wave then aims to overcome the data hunger and rigidity of prior waves.
* **From Engineered to Emergent:** The core theme is a shift from fully "handcrafted" systems toward systems where intelligent behavior emerges from learning processes—first from big data, then from context and interaction.
* **Focus on Practical Utility:** The Third Wave's emphasis on "Models to drive decisions" and "explain decisions" highlights a maturation of the field, moving beyond pure capability to focus on integration, trust, and practical application in real-world decision-making processes.
* **Aspirational Future:** The Fourth Wave description is notably aspirational, outlining goals (human-like learning, learning from context, interactive learning) that represent current major research frontiers in AI, such as few-shot learning, causal reasoning, and reinforcement learning in complex environments. The open-ended "2030 -" timeframe indicates this wave is expected to define the coming decade and beyond.
</details>
Figure 2: Past, Present, and Future of AI waves. [16]
According to the Defense Advanced Research Projects Agency (DARPA) [17], third-wave AI systems will understand the context of situations, use common sense, and adapt to changes. This will create more natural and intuitive connections between AI systems and people [17]. One of DARPA’s active projects, called XAI, aims to develop these third-wave AI systems. These computers will learn about their environments and the contexts in which they work. They will also build explanations needed to clarify real-world events.
- First Wave AI focused on rules, logic, and built knowledge.
- Second Wave AI introduced big data, statistical learning, and probabilistic techniques.
- The goal of third-wave AI is to develop common sense and the ability to adapt to different contexts.
Tractica [16] predicts that the global market for AI software will grow from about 9.5 billion US dollars in 2018 to 118.6 billion by 2025. This data aims to develop AI systems that can perform tasks accurately while providing explanations that people can understand.
The term ”third wave” refers to the advancement of AI technologies beyond traditional machine learning. This new phase focuses on creating more advanced systems that can understand context, reason, and think similarly to humans. It draws inspiration from cognitive science and neuroscience, aiming to build AI that can engage with the world in more complex and detailed ways.
XAI, or Explainable Artificial Intelligence, focuses on making AI systems, especially machine learning models, easier to understand. The goal is to help people trust the decisions these systems make. XAI techniques work to explain how AI makes predictions and why it behaves the way it does. This helps users, such as developers, regulators, and everyday users, grasp the key factors that affect AI results.
Developing AI systems that can make accurate predictions or decisions and explain why they did so is a key goal of both the third wave of AI and explainable AI. By using XAI methods in their design, developers can ensure that these advanced AI systems are not only effective but also easy to understand. This will help build user trust and acceptance.
### 1.2 Concept of Explainable AI
AI often struggles with what is called the ”black box” problem because users do not understand how it works. This can lead to issues like lack of trust, confusion, unfair treatment, and violations of privacy. AI systems can also have hidden biases. Explainable AI (XAI) aims to make AI systems easier to understand, helping users know how they make decisions. The goal of XAI is to make AI safer and more user-friendly. Therefore, we need to look at each part of AI individually and discuss its different aspects [18].
There are two main types of machine learning (ML) techniques: white box and black box models [19]. Experts can easily understand the results of a white box model. However, even specialists may find it hard to grasp the results of a black box model [20]. The XAI algorithm [21] follows three key principles: interpretability, explainability, and transparency. A model is transparent when it clearly explains how it gets its results from training data and how it generates labels from test data. Interpretability means being able to explain findings in a way that others understand [22]. While there’s no single accepted definition of explainability, its value is recognized. One definition describes it as a set of clear features that help make decisions, like classifying or predicting outcomes for specific cases. An algorithm that meets these standards helps document and verify decisions and improves itself based on new data.
<details>
<summary>x2.jpg Details</summary>
### Visual Description
## Diagram: Comparison of Generic vs. eXplainable AI Approaches
### Overview
The image is a conceptual diagram comparing two paradigms in machine learning deployment: a "Generic Approach" and an "eXplainable AI Approach." It uses a side-by-side flowchart format to illustrate the process flow and, more importantly, the resulting user experience and understanding in each paradigm. The diagram is informational and conceptual, containing no numerical data or charts.
### Components/Axes
The diagram is split into two vertical panels, each with a title at the top:
* **Left Panel Title:** `Generic Approach`
* **Right Panel Title:** `eXplainable AI Approach`
Each panel contains a flowchart with the following common components, represented by icons and text labels:
1. **Training Dataset:** Represented by a blue cylinder icon labeled "DB" and the text "Training Dataset."
2. **Machine Learning Processes:** Represented by a blue brain/network icon and the text "Machine Learning Processes."
3. **Users:** Represented by an icon of two people (a woman and a man in business attire) labeled "Users."
The flow and additional components differ between the two approaches.
### Detailed Analysis
#### **Left Panel: Generic Approach**
* **Flow:** The process is linear and unidirectional.
* An arrow points from **Training Dataset** down to **Machine Learning Processes**.
* An arrow points from **Machine Learning Processes** down to a third box labeled **Learned Function** (represented by a blue lightbulb icon).
* A final arrow, labeled `Outcome/Decision`, points from **Learned Function** to the **Users**.
* **User Interaction (Thought Bubble):** A light blue thought bubble originates from the **Users**. It contains a list of questions the user has about the system's output:
* `Why did you do that?`
* `Why not something else?`
* `How/ When can I trust you?`
* `How do I correct error?`
* **Spatial Layout:** The flowchart is arranged vertically on the left side of the panel. The user icon and thought bubble are positioned to the right of the "Learned Function" box.
#### **Right Panel: eXplainable AI Approach**
* **Flow:** The process incorporates explainability components, creating a more interactive loop.
* An arrow points from **Training Dataset** down to **Machine Learning Processes**.
* An arrow points from **Machine Learning Processes** down to a box labeled **Explainable Model** (represented by a blue network icon with highlighted nodes).
* A separate, adjacent box labeled **Explainable Interface** (represented by a yellow lightning bolt icon) is connected to the **Explainable Model**.
* **Bidirectional arrows** connect the **Explainable Interface** to the **Users**, indicating a two-way interaction.
* **User Interaction (Thought Bubble):** A light blue thought bubble originates from the **Users**. It contains statements reflecting understanding and trust:
* `I understand Why.`
* `I understand Why Not`
* `I know when you succeed/ fail.`
* `I know when/how to trust you.`
* **Spatial Layout:** The flowchart is arranged vertically on the left side of the panel. The user icon and thought bubble are positioned to the right of the "Explainable Interface" box.
### Key Observations
1. **Structural Difference:** The core difference is the replacement of the opaque "Learned Function" with two components: an "Explainable Model" and an "Explainable Interface."
2. **Interaction Model:** The Generic Approach shows a one-way delivery of a decision (`Outcome/Decision`). The eXplainable AI Approach shows a two-way interaction (bidirectional arrows) between the system and the user.
3. **User State Transformation:** The thought bubbles are the focal point of the comparison. They shift from a state of questioning and uncertainty (Generic) to a state of understanding and informed trust (eXplainable AI). The questions in the left bubble are directly answered by the statements in the right bubble.
4. **Visual Metaphors:** Icons are used consistently: a database for data, a brain for processing, a lightbulb for a finalized (but opaque) function, and a network with highlights for an explainable model. The lightning bolt for the interface suggests active communication or revelation.
### Interpretation
This diagram argues that the value of eXplainable AI (XAI) extends beyond technical performance to fundamentally change the human-computer relationship. It posits that a "Generic" or black-box AI system, while potentially accurate, leaves users in a state of passive reception and doubt, unable to scrutinize, correct, or fully trust the outcomes.
The eXplainable AI approach, by integrating explanation directly into the model and interface, transforms the user from a passive recipient into an active, informed participant. The bidirectional flow suggests a collaborative process where the system's reasoning is made accessible, allowing users to verify, understand limitations, and calibrate their trust appropriately. The diagram's central message is that explainability is not just a feature but a necessary component for responsible and effective integration of AI into human decision-making processes, addressing critical questions of accountability, reliability, and user agency.
</details>
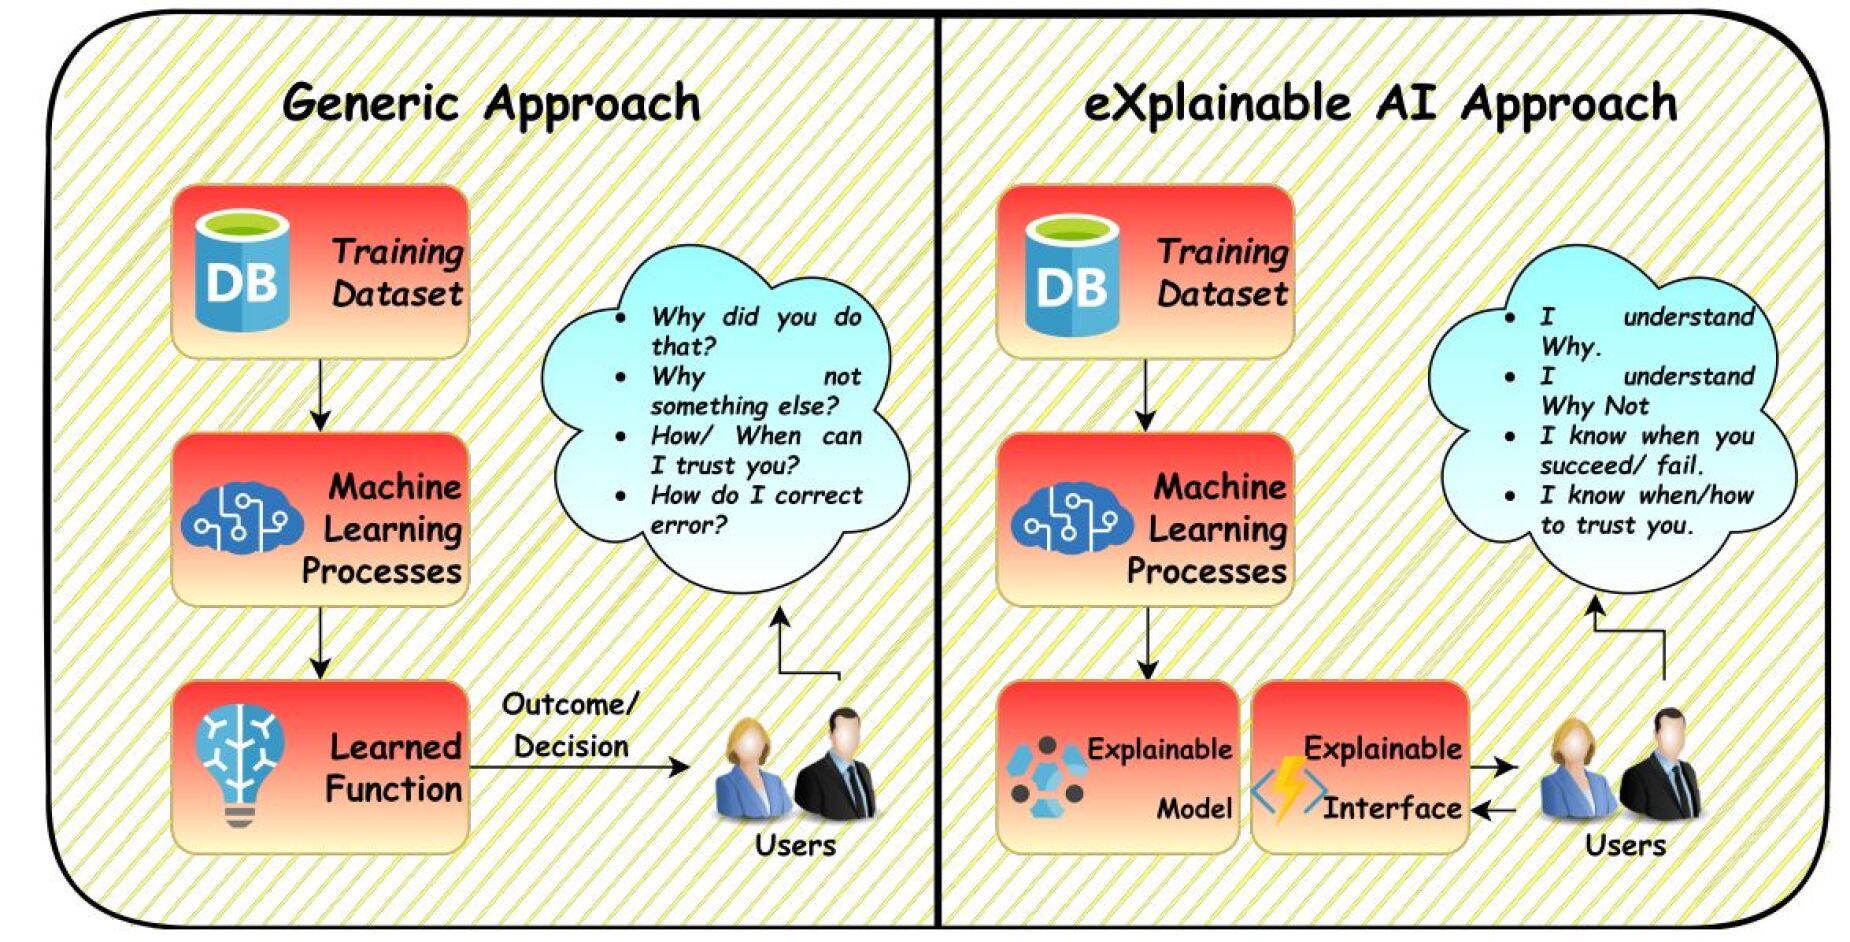
Figure 3: Explainable Artificial Intelligence (XAI): A look at AI now and tomorrow. [18]
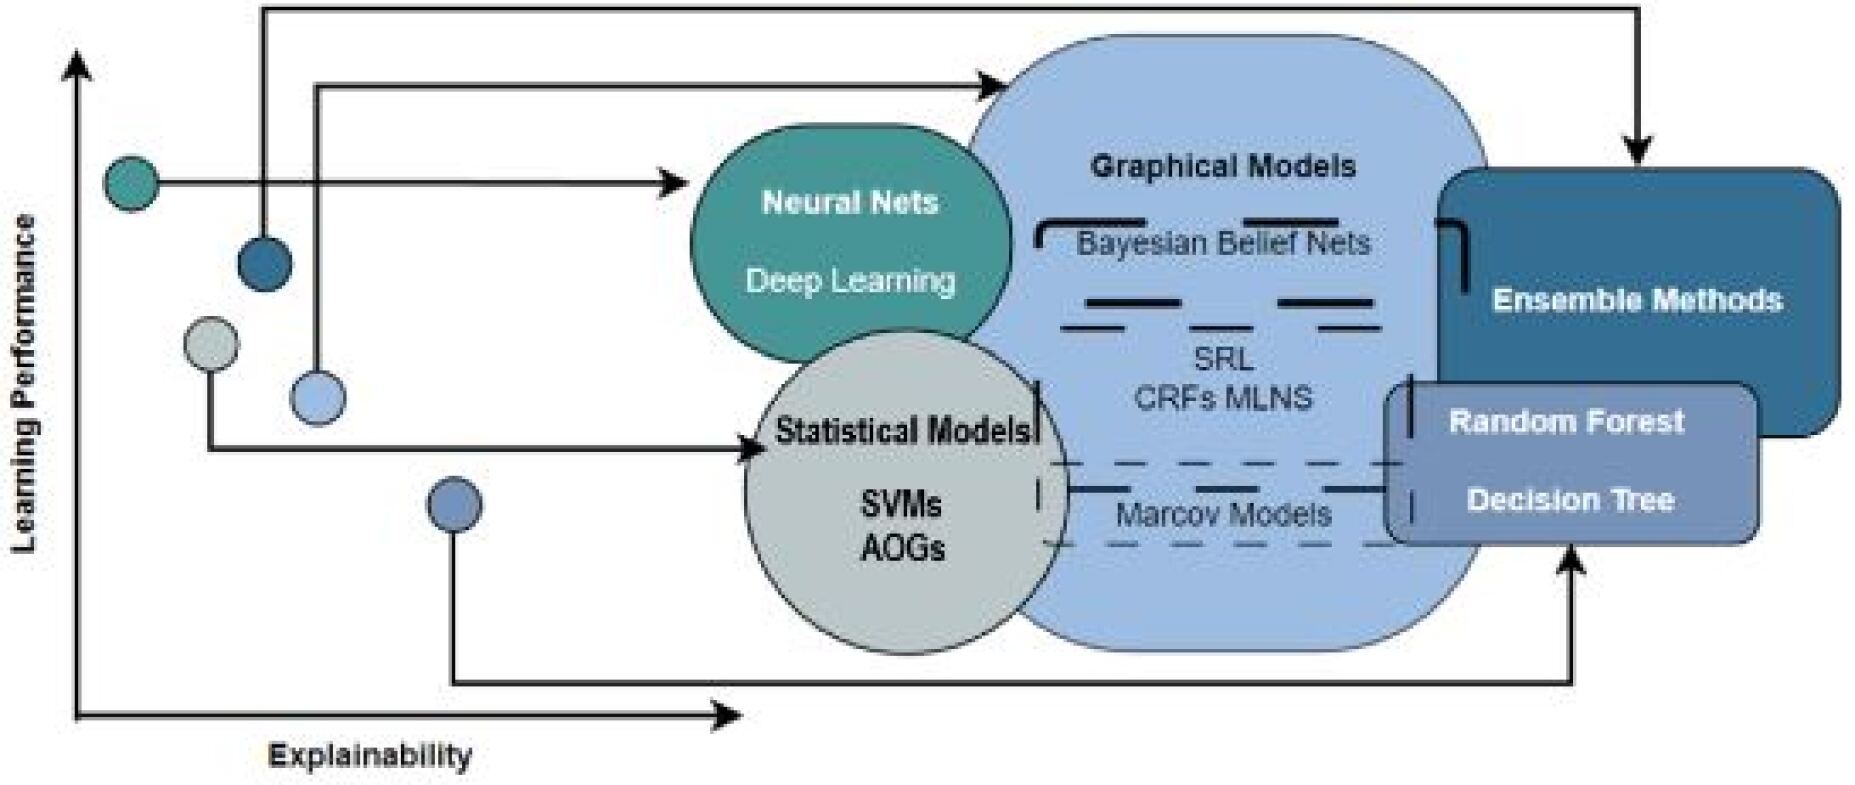
Researchers are studying intelligent systems to understand them better. This is an important topic. Sometimes, a system needs to understand its own workings to comply with rules. Many complex algorithms, shown in Figure 4, balance achieving high accuracy with being explainable.
<details>
<summary>x3.jpg Details</summary>
### Visual Description
## Diagram: Machine Learning Model Taxonomy and Trade-offs
### Overview
This image is a conceptual diagram illustrating the relationships between different families of machine learning models, plotted against two axes: "Learning Performance" (vertical) and "Explainability" (horizontal). It uses a combination of a scatter plot (left side) and overlapping, labeled regions (right side) connected by arrows to map abstract data points to model categories. The diagram visually communicates the trade-off between model power and interpretability.
### Components/Axes
* **Axes:**
* **Vertical Axis (Y-axis):** Labeled "Learning Performance". An arrow points upward, indicating increasing performance.
* **Horizontal Axis (X-axis):** Labeled "Explainability". An arrow points to the right, indicating increasing explainability.
* **Left Side - Data Points:** Five unlabeled circles of varying colors and shades are plotted in the 2D space defined by the axes. Their positions suggest different combinations of performance and explainability.
* Top-left (teal circle): High performance, low explainability.
* Upper-middle (dark blue circle): Moderately high performance, low-to-moderate explainability.
* Middle-left (light grey circle): Moderate performance, low explainability.
* Lower-middle (light blue circle): Moderate performance, moderate explainability.
* Bottom-center (medium blue circle): Lower performance, moderate explainability.
* **Right Side - Model Families (Labeled Regions):** Four major, overlapping regions represent model families.
1. **Neural Nets / Deep Learning:** A teal circle in the upper-left quadrant (high performance, low explainability).
2. **Statistical Models:** A light grey circle in the lower-left quadrant (moderate performance, low-to-moderate explainability). Contains sub-labels: **SVMs** (Support Vector Machines) and **AOGs** (And-Or Graphs).
3. **Graphical Models:** A large, light blue, irregular shape spanning the center. It overlaps with Statistical Models and Ensemble Methods. Contains sub-labels: **Bayesian Belief Nets**, **SRL** (Statistical Relational Learning), **CRFs** (Conditional Random Fields), **MLNs** (Markov Logic Networks), and **Markov Models**.
4. **Ensemble Methods:** A dark blue, rounded rectangle in the upper-right quadrant (high performance, moderate-to-high explainability). Overlaps with Graphical Models. Contains a sub-region labeled **Random Forest** and **Decision Tree**.
* **Connections (Arrows):** Black arrows connect the data points on the left to specific model family regions on the right.
* The top-left (teal) circle points to "Neural Nets / Deep Learning".
* The upper-middle (dark blue) circle points to "Ensemble Methods".
* The middle-left (light grey) circle points to "Statistical Models".
* The lower-middle (light blue) circle points to the overlapping area of "Graphical Models".
* The bottom-center (medium blue) circle points to the "Random Forest / Decision Tree" sub-region within "Ensemble Methods".
### Detailed Analysis
The diagram is a qualitative, not quantitative, representation. No numerical values are provided on the axes. The analysis is based on relative positioning and connections.
* **Spatial Grounding & Trend Verification:**
* **Neural Nets/Deep Learning:** Positioned highest on the "Learning Performance" axis and furthest left on the "Explainability" axis. This visually asserts they offer top performance but are the least interpretable.
* **Ensemble Methods:** Positioned high on performance and further right on explainability than Neural Nets, suggesting a better balance. The "Random Forest / Decision Tree" sub-region is placed slightly lower in performance but higher in explainability than the main "Ensemble Methods" block.
* **Statistical Models:** Positioned lower on performance than Neural Nets and Ensembles, but higher on explainability than Neural Nets.
* **Graphical Models:** Occupies a central, bridging position. It overlaps with Statistical Models (suggesting shared characteristics) and Ensemble Methods. Its placement suggests a balance between performance and explainability, potentially leaning towards higher explainability.
* **Component Isolation:**
* **Header/Context:** The axes define the conceptual framework.
* **Main Chart Area:** Contains the plotted circles and model family regions.
* **Footer/Labels:** All text is embedded within the main chart area.
### Key Observations
1. **Performance-Explainability Trade-off:** The core message is the inverse relationship between learning performance and explainability. The highest-performing models (Neural Nets) are the least explainable, while models with higher explainability (like Decision Trees) may sacrifice some performance.
2. **Model Overlap:** The significant overlap between "Graphical Models" and other families indicates that these categories are not mutually exclusive. Many real-world models hybridize approaches.
3. **Specific Model Placement:** "Random Forest" and "Decision Tree" are explicitly called out as a sub-component of "Ensemble Methods," highlighting their importance and specific trade-off profile within that family.
4. **Mapping Abstraction to Categories:** The arrows suggest that different problem types or data characteristics (represented by the abstract circles) are best suited to different model families. For instance, a problem requiring maximum performance (top-left circle) maps to Deep Learning.
### Interpretation
This diagram serves as a high-level guide for selecting machine learning approaches based on project priorities. It argues that there is no single "best" model family; the choice depends on the required balance between predictive power and the need for interpretability.
* **For critical applications where understanding the "why" is essential** (e.g., healthcare, finance, legal), models from the "Statistical Models," "Graphical Models," or the "Decision Tree" part of Ensemble Methods are suggested, as they reside further right on the Explainability axis.
* **For applications where raw predictive accuracy is paramount and interpretability is secondary** (e.g., image recognition, recommendation systems), "Neural Nets / Deep Learning" are indicated.
* **"Ensemble Methods" like Random Forests** are presented as a powerful compromise, offering high performance with relatively good explainability.
* The overlapping regions encourage a nuanced view, suggesting that advanced techniques often blend elements from multiple paradigms (e.g., Bayesian deep learning combines Neural Nets and Graphical Models).
The diagram effectively communicates that model selection is a strategic decision involving trade-offs, and it provides a visual map to navigate those trade-offs between the twin goals of performance and transparency.
</details>
Figure 4: Trade-off between AI model accuracy and explainability, highlighting the challenge of balancing performance with interpretability. [23]
### 1.3 Classification Tree of XAI
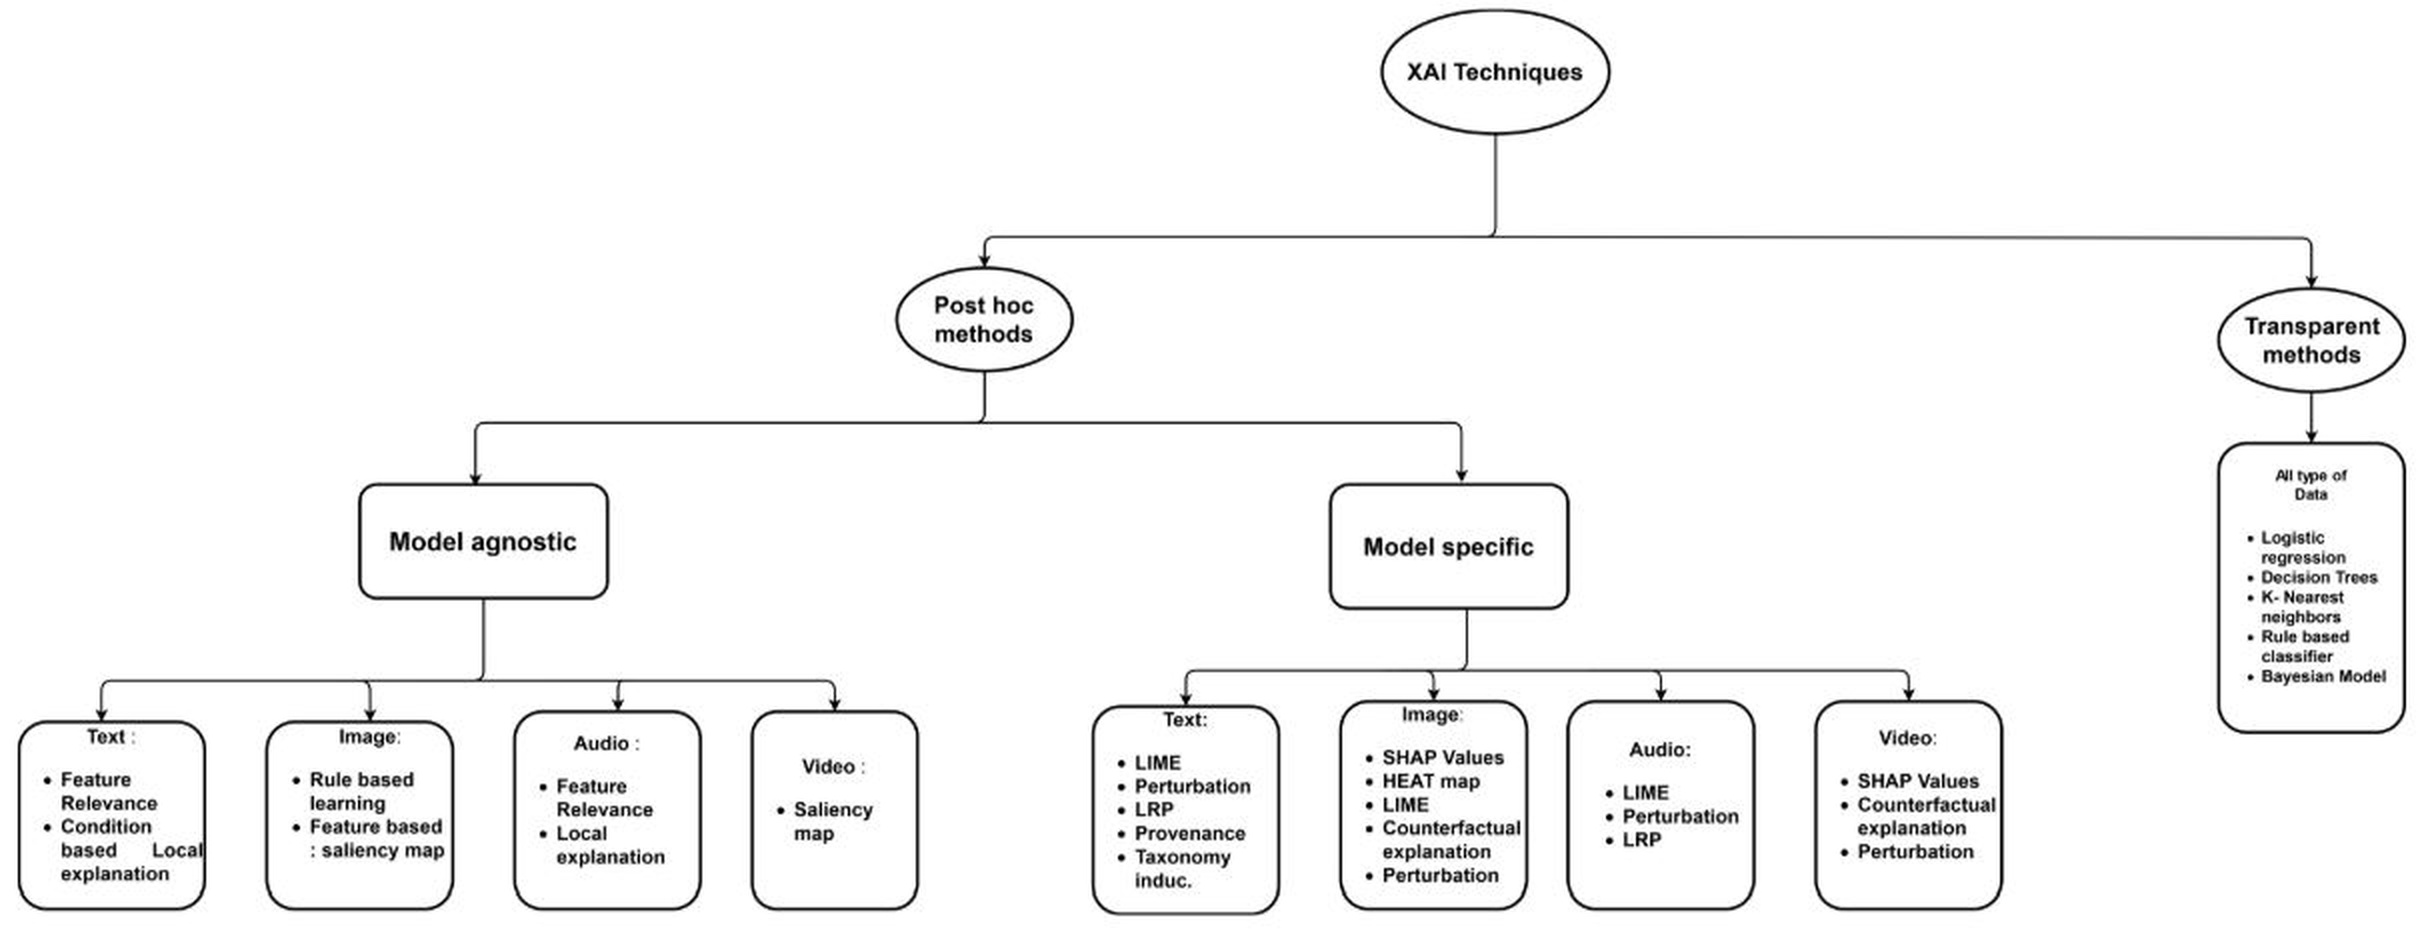
XAI techniques are divided into two categories: transparent and post-hoc methods. A transparent approach is one that represents the model’s capabilities and decision-making process in an easy-to-understand way [24]. Transparent models include Bayesian approaches, decision trees, linear regression, and fuzzy inference systems. Transparent approaches can be useful when the internal feature correlations are highly complex or linear. A comprehensive classification of different XAI methods and approaches related to different types of data is shown in Figure 5.
<details>
<summary>extracted/6367585/image/classification.jpg Details</summary>
### Visual Description
## Diagram: Taxonomy of Explainable AI (XAI) Techniques
### Overview
The image is a hierarchical flowchart or taxonomy diagram illustrating the classification of Explainable AI (XAI) techniques. It organizes methods based on their fundamental approach (Post hoc vs. Transparent) and further categorizes them by their applicability to model types (agnostic vs. specific) and data modalities (Text, Image, Audio, Video). The diagram uses a top-down tree structure with connecting lines to show relationships.
### Components/Axes
The diagram is structured as a tree with the following hierarchical levels and components:
1. **Root Node (Top Center):** An oval labeled **"XAI Techniques"**.
2. **First-Level Branches:** Two main categories branch from the root:
* **Left Branch:** An oval labeled **"Post hoc methods"**.
* **Right Branch:** An oval labeled **"Transparent methods"**.
3. **Second-Level Branches (under "Post hoc methods"):** Two subcategories:
* **Left Sub-branch:** A rectangle labeled **"Model agnostic"**.
* **Right Sub-branch:** A rectangle labeled **"Model specific"**.
4. **Leaf Nodes (Data Modality Categories):** Under both "Model agnostic" and "Model specific", there are four rounded rectangles representing data types:
* **Text:**
* **Image:**
* **Audio:**
* **Video:**
5. **Leaf Node (under "Transparent methods"):** A single rounded rectangle labeled **"All type of Data"**.
### Detailed Analysis
The specific techniques and models listed under each category are as follows:
**A. Under "Post hoc methods" -> "Model agnostic":**
* **Text:**
* Feature Relevance
* Condition based Local explanation
* **Image:**
* Rule based learning
* Feature based: saliency map
* **Audio:**
* Feature Relevance
* Local explanation
* **Video:**
* Saliency map
**B. Under "Post hoc methods" -> "Model specific":**
* **Text:**
* LIME
* Perturbation
* LRP
* Provenance
* Taxonomy induc.
* **Image:**
* SHAP Values
* HEAT map
* LIME
* Counterfactual explanation
* Perturbation
* **Audio:**
* LIME
* Perturbation
* LRP
* **Video:**
* SHAP Values
* Counterfactual explanation
* Perturbation
**C. Under "Transparent methods" -> "All type of Data":**
* Logistic regression
* Decision Trees
* K- Nearest neighbors
* Rule based classifier
* Bayesian Model
### Key Observations
1. **Structural Dichotomy:** The primary split is between methods applied after model training ("Post hoc") and inherently interpretable models ("Transparent").
2. **Post Hoc Subdivision:** Post hoc methods are further divided based on whether they require knowledge of the model's internals ("Model specific") or treat it as a black box ("Model agnostic").
3. **Data Modality Focus:** Both "Model agnostic" and "Model specific" branches are organized by the type of data they are applied to (Text, Image, Audio, Video), indicating that the choice of XAI technique is highly dependent on the data domain.
4. **Technique Overlap:** Several techniques (e.g., LIME, Perturbation, SHAP Values) appear under multiple data modalities within the "Model specific" branch, suggesting they are versatile methods adapted for different data types.
5. **Transparent Methods List:** The "Transparent methods" branch lists classic, inherently interpretable machine learning models rather than post-hoc explanation techniques.
### Interpretation
This diagram presents a structured taxonomy for navigating the field of Explainable AI. It suggests that selecting an appropriate explanation method involves a sequential decision process:
1. **First, determine the fundamental approach:** Is the goal to explain an existing complex model (requiring a *Post hoc* method), or to use an inherently understandable model from the start (a *Transparent* method)?
2. **For Post hoc methods, determine model accessibility:** If using a post hoc method, can you access the model's internal structure (*Model specific*), or must you treat it as a complete black box (*Model agnostic*)?
3. **Finally, consider the data domain:** The specific technique is then chosen based on the modality of the data being explained (Text, Image, Audio, Video).
The taxonomy highlights that the XAI landscape is not monolithic. The proliferation of techniques under "Model specific" for Text and Image data, compared to fewer listed for Audio and Video, may reflect the relative maturity of research in those areas. The inclusion of classic models like Decision Trees under "Transparent methods" reinforces the idea that explainability is not solely a property of new techniques but also of model choice. The diagram serves as a conceptual map for practitioners to identify suitable explanation strategies based on their specific constraints (model access, data type, and requirements).
</details>
Figure 5: Categorization of Explainable AI (XAI) techniques based on data type, illustrating differences between transparent and posthoc approaches [24]
Posterior approaches are useful for interpreting the complexity of a model, especially when there are nonlinear relationships or high data complexity. When a model does not follow a direct relationship between data and features, posterior techniques can be an effective tool to explain what the model has learned [24]. Inference using local feature weights is provided by transparent methods such as Bayesian classifiers, support vector machines, logistic regression, and K-nearest neighbors. This model category meets three properties: simulability, decomposability, and algorithmic transparency [24].
### 1.4 Definition of Transparency in Artificial Intelligence
Transparency in XAI is the capacity of an AI system to make its decisions and actions understandable through explanations [25]. Transparency is one of the most important aspects of XAI, rendering AI decisions interpretable and justified. Transparency allows decision-making processes to be closely examined by stakeholders, mitigating risks in applications with societal impact, such as healthcare and finance [26].
The explainability provided by XAI techniques also increases the overall transparency of AI systems. The users are able to examine the decision-making procedure, identify any bias, and analyze the reliability and fairness of the output of the model [27]. Transparent solutions are necessary in areas like the medical field, banking, and autonomous vehicles, where AI-decisions can have significant effects.
By providing meaningful information about the internal processes of AI models, XAI methods assist users in recognizing patterns, comprehending relationships, and revealing biases or errors [27]. Due to the heightened transparency, stakeholders can more effectively develop opinions, ensure the predictions made by the model are accurate, and take the necessary action.
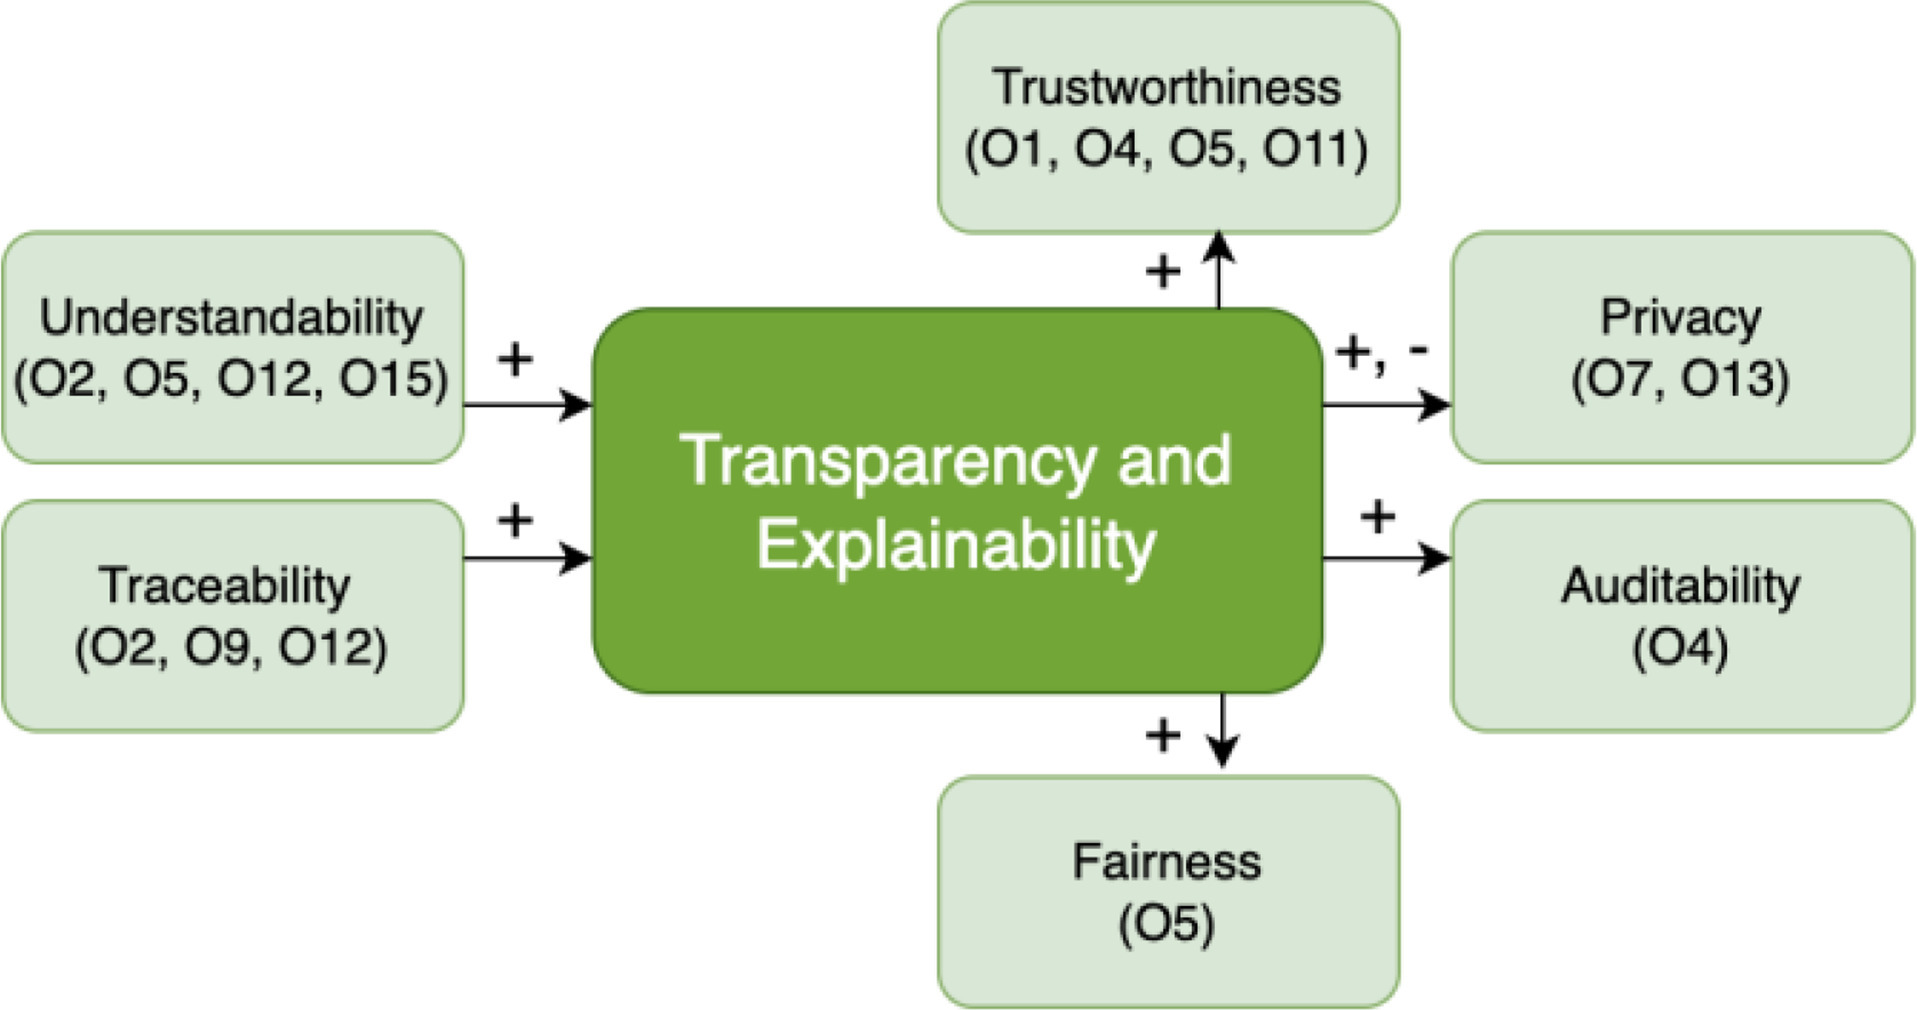
The examination of ethical criteria showed a link between explainability, transparency, and other quality needs. Figure 6 displays nine quality standards related to explainability and openness. The key standards for AI transparency are marked with “O.” For example, O2 focuses on how to interpret models, O15 highlights the importance of traceability, and O5 and O12 ensure that users understand the information. By following these standards, AI models can provide clear and convincing explanations for their outcomes. Keeping these standards improves accountability and helps reduce bias in AI systems.
<details>
<summary>extracted/6367585/image/eai3.jpg Details</summary>
### Visual Description
\n
## Diagram: Conceptual Influence Map of Transparency and Explainability
### Overview
The image displays a conceptual diagram illustrating the relationships between "Transparency and Explainability" and six other ethical or quality attributes of a system (likely an AI or data system). The diagram uses a node-and-arrow structure to show directional influences, with signs indicating the nature of the influence (positive or mixed). All text is in English.
### Components/Axes
The diagram consists of seven rectangular nodes with rounded corners, connected by directional arrows.
1. **Central Node (Dark Green):**
* **Label:** "Transparency and Explainability"
* **Position:** Center of the diagram.
2. **Surrounding Nodes (Light Green):** Six nodes are arranged around the central node.
* **Top-Center:** "Trustworthiness (O1, O4, O5, O11)"
* **Top-Left:** "Understandability (O2, O5, O12, O15)"
* **Bottom-Left:** "Traceability (O2, O9, O12)"
* **Top-Right:** "Privacy (O7, O13)"
* **Middle-Right:** "Auditability (O4)"
* **Bottom-Center:** "Fairness (O5)"
3. **Connections (Arrows with Signs):**
* Arrows originate from the central "Transparency and Explainability" node and point to each of the six surrounding nodes.
* Each arrow is labeled with a symbol indicating the nature of the influence:
* **"+" (Plus sign):** Indicates a positive influence. This symbol is present on arrows pointing to Trustworthiness, Understandability, Traceability, Auditability, and Fairness.
* **"+, -" (Plus and Minus signs):** Indicates a mixed or dual influence (both positive and negative). This symbol is present on the arrow pointing to Privacy.
### Detailed Analysis
* **Text Transcription:** All text from the nodes has been extracted verbatim above. The codes in parentheses (e.g., O1, O4) appear to be identifiers, likely referencing specific objectives, criteria, or requirements from a separate framework or document not shown in the image.
* **Spatial Grounding & Flow:**
* The central concept, "Transparency and Explainability," is positioned as the primary influencer.
* The flow is unidirectional, from the center outward to the six attributes.
* The legend (the +/- symbols) is placed directly on the connecting arrows, not in a separate box.
* **Component Isolation:**
* **Header/Title:** There is no explicit title at the top of the image. The central node's label serves as the diagram's subject.
* **Main Diagram:** Contains all nodes and connections as described.
* **Footer:** There is no footer, caption, or source information visible in the provided image.
### Key Observations
1. **Central Hub:** "Transparency and Explainability" is modeled as a foundational concept that directly impacts a suite of other important system qualities.
2. **Predominantly Positive Influence:** Five of the six relationships are marked as purely positive (+), suggesting that increasing transparency and explainability is theorized to enhance Trustworthiness, Understandability, Traceability, Auditability, and Fairness.
3. **The Privacy Exception:** The relationship with "Privacy" is uniquely marked as having both positive and negative aspects (+, -). This is a critical nuance, indicating a potential trade-off or tension. For example, making a system more transparent might expose sensitive data patterns (negative for privacy), while explainability might help users understand and control their data (positive for privacy).
4. **Overlapping Codes:** Several codes appear in multiple nodes (e.g., O5 is in Trustworthiness, Understandability, and Fairness; O4 is in Trustworthiness and Auditability). This suggests these objectives are interconnected and can be served by multiple attributes.
### Interpretation
This diagram presents a conceptual model for understanding the role of Transparency and Explainability within a broader framework of ethical and operational system design, likely for AI or automated decision-making systems.
* **What it Suggests:** The model posits that investing in transparency (making processes and data visible) and explainability (making system decisions understandable) is a powerful lever for improving a system's overall ethical and technical robustness. It acts as a catalyst for other desirable properties.
* **Relationships:** The central node is an *enabler*. The surrounding nodes are *beneficiaries* or *related concepts*. The arrows define a causal or influential relationship, not a hierarchical one. The inclusion of specific objective codes (O1, O2, etc.) ties this abstract model to a concrete set of requirements, implying that achieving those objectives depends on addressing transparency and explainability.
* **Notable Anomaly/Tension:** The mixed influence on Privacy is the most significant insight. It highlights a classic dilemma in system design: the need for openness and the need for confidentiality are often in conflict. This diagram explicitly acknowledges that improving transparency and explainability is not an unqualified good for all attributes; it requires careful balancing, particularly concerning privacy. This makes the model more realistic and useful for design trade-off analysis.
* **Peircean Investigation:** The diagram is an *icon* (it resembles the structure of the relationships it describes) and a *symbol* (the codes and labels are conventional). To fully understand it, one would need the legend for the "O" codes. However, even without that key, the diagram successfully communicates that Transparency and Explainability are central, broadly beneficial, but must be managed carefully in relation to Privacy.
</details>
Figure 6: Key qualitative standards (O1-O15) related to explainability and transparency in AI systems, addressing user comprehension, interpretability, and traceability. [28]
The growth of AI systems’ explainability and transparency is facilitated by their understandability. When discussing the significance of understandability, the transparency guidelines addressed three points: 1) ensuring that people comprehend the AI system’s behavior and the methods for using it (O5, O12); 2) communicating in an intelligible manner the locations, purposes, and methods of AI use (O15); and 3) making sure people comprehend the distinction between real AI decisions and those that AI merely assists in making (O2) [28]. Thus, by guaranteeing that people are informed about the use of AI in a straightforward and comprehensive manner, understandability promotes explainability and transparency. The necessity of tracking the decisions made by AI systems is highlighted by traceability in transparency requirements (O2, O12) [28]. In order to ensure openness, Organization O12 also noted how crucial it is to track the data utilized in AI decision-making.
### 1.5 Transparency Vs Explainability in AI
Explainability and transparency are similar concepts [29]. According to McLarney et al. [30], a transparent AI necessitates that ”Basic elements of data and decisions must be available for inspection during and after AI use.” Transparency is achieved when users have access to their data or can understand how decisions are made. On the other hand, explainability seeks to reveal the reasons for AI’s successes or failures and demonstrate how it utilizes the knowledge and judgment of those it affects. It provides a rational justification for the actions of the AI. Users must clearly know what data is collected, how the AI interprets this data, and how it produces reliable outcomes for each affected individual. This straightforward explanation overlooks the challenges we face when trying to clarify ”black box” algorithms, the context that may be omitted, and the accuracy needed when offering understandable explanations to customers. Therefore, the question arises: is having minimal explainability preferable to having none at all? [30]. Additionally, the belief that explanations can adequately address the dynamic nature of the rich information ecosystem and the appropriateness of managing anomalies are also vital factors to consider.
<details>
<summary>x4.jpg Details</summary>

### Visual Description
## Text Message Screenshot: AI Conversation Termination Explanation
### Overview
The image displays a screenshot of a text message, likely from an AI assistant or chatbot interface. The message is contained within a dark gray, rounded rectangular bubble with white text. The content is an apology and explanation for an abrupt end to a prior conversation, detailing potential technical and behavioral reasons for the termination.
### Components/Axes
* **Container:** A single, vertically oriented message bubble with rounded corners. The background color is a dark gray (approximately #333333).
* **Text:** White, sans-serif font, left-aligned within the bubble.
* **Structure:** The text is composed of an introductory paragraph followed by a bulleted list with three items. Each bullet point is indicated by a solid white dot (•).
### Detailed Analysis
The complete textual content of the image is transcribed below:
I'm sorry to hear that our conversation ended abruptly. That was not my intention. Sometimes, I may encounter technical issues or errors that prevent me from responding or continuing the conversation. Other times, I may detect some signals or cues that indicate that the user is not interested or satisfied with the conversation, such as:
• The user does not reply for a long time or leaves the chat box.
• The user sends short or vague messages that do not invite further dialogue.
• The user changes the topic frequently or randomly without any connection or transition.
### Key Observations
1. **Tone and Persona:** The message adopts an apologetic and explanatory tone, personifying the AI system ("my intention," "I may encounter," "I may detect").
2. **Dual Categorization:** The explanation is cleanly divided into two primary categories of failure modes:
* **Technical/System Issues:** "technical issues or errors."
* **Behavioral/Interaction Cues:** "signals or cues that indicate that the user is not interested or satisfied."
3. **Specific Behavioral Indicators:** The three bullet points provide concrete, observable user behaviors that the system interprets as disengagement. These are:
* **Temporal Inactivity:** Not replying or leaving.
* **Low-Effort Communication:** Sending short/vague messages.
* **Contextual Discontinuity:** Frequent, random topic changes.
4. **Visual Design:** The dark mode aesthetic (white text on dark gray) is common in modern chat applications and developer tools, suggesting a technical or contemporary user interface context.
### Interpretation
This text message serves as a **post-hoc diagnostic and user reassurance tool**. Its primary functions are:
1. **Managing User Expectations and Frustration:** By apologizing and stating the termination was unintentional, it aims to mitigate user frustration and maintain trust in the system's reliability.
2. **Providing Transparent (if Simplified) Reasoning:** It offers the user a peek into the system's decision-making logic, framing the AI as an entity that actively monitors conversation health. This transparency can reduce perceived arbitrariness.
3. **Implicitly Guiding User Behavior:** The listed "cues" subtly instruct the user on how to maintain a "successful" conversation from the system's perspective: be timely, be substantive, and maintain topical coherence. It defines the boundaries of what the system considers a valid, continuing dialogue.
4. **Highlighting a Core Challenge in Conversational AI:** The message exposes the fundamental difficulty in distinguishing between a *technical failure* and a *user's natural disengagement*. The system must make a binary decision (continue or stop) based on ambiguous signals, leading to potential false positives (ending a conversation the user wanted to continue) or false negatives (persisting when the user has left).
**Underlying Assumption:** The message reveals a design philosophy where the AI is programmed to proactively terminate conversations it deems unproductive or stalled, rather than waiting indefinitely for a user response. This is a design choice balancing system resource management, user experience, and the avoidance of "zombie" chat sessions.
</details>
Figure 7: Output from the Bing search engine’s conversation feature explaining a failure. a partial screenshot taken using an Android smartphone on March 2, 2023. [17]
It’s interesting to note that although certain AI algorithms evaluate data automatically, more and more AI systems are made to explain how their algorithms operate and the logic behind specific choices [17]. For instance, the conversation mode of the Bing search engine provides succinct explanations of its operation (Fig. 7). Sometimes, end users might find these explanations sufficient, but other times, they would be perplexed as to how an AI came to a particular conclusion or acted in a particular manner. When individuals are more confused by the explanation given, it is unrealistic to expect them to become more computer-literate [17]. Instead, we must improve the justification of the AI system.
### 1.6 Definition of Trustworthiness in Artificial Intelligence
Creating trustworthy AI systems requires a careful strategy that looks at organizational, ethical, and technical factors. The first step is to set clear standards for trustworthiness. These standards should include accountability, security, privacy, transparency, fairness, and ethical behavior. Using high-quality, unbiased data and clear algorithms that explain AI decisions is essential. Strong security measures and privacy practices protect sensitive information from cyberattacks.
It’s important to create accountability frameworks and follow ethical guidelines to ensure responsible AI use. By focusing on user needs and constantly monitoring and updating the systems, AI can stay reliable over time. Applying these principles across all stages of the AI process allows organizations to develop systems that are explainable, equitable, ethical, and robust, which fosters stakeholder and user trust.
<details>
<summary>extracted/6367585/image/eai4.png Details</summary>
### Visual Description
## Diagram: Trustworthy AI Framework
### Overview
The image is a hierarchical concept diagram illustrating the components of "Trustworthy AI." It presents a top-down structure where a central concept branches into three primary ethical pillars, each containing specific principles or considerations. The diagram uses a clean, box-and-arrow layout with color-coding to distinguish levels of hierarchy.
### Components/Axes
The diagram has a clear hierarchical structure with three levels:
1. **Top-Level Concept (Central Node):**
* **Label:** "Trustworthy AI"
* **Shape & Color:** A light green oval.
* **Position:** Top-center of the image.
2. **Primary Pillars (Second Level):**
Three rectangular boxes with orange borders, positioned horizontally below the central oval. Each is connected to the central oval by a downward-pointing black arrow.
* **Left Box Label:** "Ethics of Algorithms"
* **Center Box Label:** "Ethics of Data"
* **Right Box Label:** "Ethics of Practice"
3. **Sub-Principles (Third Level):**
Within each primary pillar box, there are smaller, light-yellow rectangular boxes containing the specific principles. They are listed vertically.
### Detailed Analysis
**1. Ethics of Algorithms (Left Pillar)**
* Contains four sub-principles:
* Respect for Human Autonomy
* Prevention of Harm
* Fairness
* Explicability
**2. Ethics of Data (Center Pillar)**
* Contains five sub-principles:
* Human-centred
* Individual Data Control
* Transparency
* Accountability
* Equality
**3. Ethics of Practice (Right Pillar)**
* Contains three sub-principles:
* Responsability *(Note: This appears to be a spelling variant or typo for "Responsibility")*
* Liability
* Codes and Regulations
### Key Observations
* **Structural Symmetry:** The diagram is balanced, with the central "Ethics of Data" pillar containing the most sub-principles (five), flanked by pillars with four and three items respectively.
* **Visual Hierarchy:** The use of shape (oval vs. rectangles), color (green vs. orange/yellow), and connecting arrows clearly establishes "Trustworthy AI" as the overarching goal, with the three "Ethics of..." categories as its foundational components.
* **Content Scope:** The principles cover a broad spectrum, from high-level philosophical concepts (e.g., "Respect for Human Autonomy," "Fairness") to concrete legal and operational frameworks (e.g., "Liability," "Codes and Regulations").
* **Potential Anomaly:** The term "Responsability" in the "Ethics of Practice" pillar is spelled differently from the standard English "Responsibility." This could be a deliberate choice reflecting a non-English language origin (e.g., French, Spanish) or a simple typographical error.
### Interpretation
This diagram presents a comprehensive, structured framework for understanding what constitutes "Trustworthy AI." It argues that trustworthiness is not a single attribute but emerges from the interplay of three distinct yet interconnected ethical domains:
1. **Ethics of Algorithms:** Focuses on the design, behavior, and internal logic of the AI models themselves. Principles like "Explicability" and "Prevention of Harm" are directly tied to the technical system's operation.
2. **Ethics of Data:** Concerns the lifecycle of the information used to train and run AI systems. It emphasizes human agency ("Individual Data Control") and systemic fairness ("Equality," "Accountability") in data handling.
3. **Ethics of Practice:** Addresses the real-world deployment, governance, and consequences of AI. This pillar moves from theory to implementation, covering legal frameworks ("Liability"), professional standards ("Codes and Regulations"), and operational duty ("Responsability").
The framework suggests that a failure in any one pillar undermines the entire structure of trustworthy AI. For example, a fair algorithm (Ethics of Algorithms) trained on biased data (violating Ethics of Data) deployed without clear accountability (violating Ethics of Practice) cannot be considered trustworthy. The diagram serves as a checklist or map for developers, policymakers, and auditors to ensure all critical ethical dimensions are considered in the AI lifecycle.
</details>
Figure 8: The three key components of XAI: Algorithmic Ethics, Data Ethics, and Practice Ethics. [31]
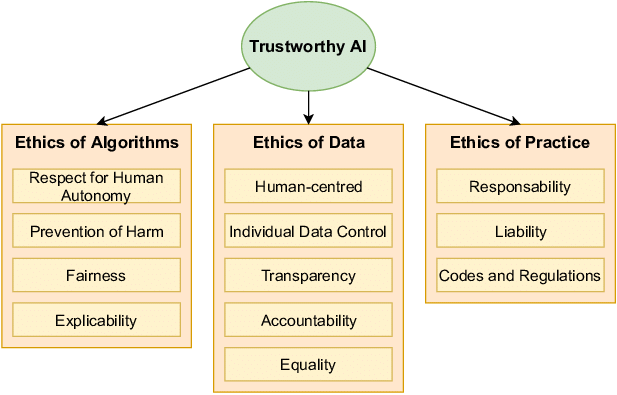
The three elements illustrated in Figure 8 —algorithmic ethics, data ethics, and practice ethics—intersect to create responsible AI. These elements define a data-centered way to handle ethical issues [31]. However, several open challenges still remain with respect to dealing with ethical issues in AI systems. In the work [31], authors give the vision of Trustworthy AI, which mentions that:
1. Human agency and oversight: AI systems have to enable human freedom. They need to facilitate user choice, safeguard fundamental rights, and enable human control. This will assist in developing an equitable and just society.
1. Security and technical robustness: Security and technical proficiency are crucial to prevent damage. In order to enable an AI system to operate efficiently and reduce risks, its creators ought to consider potential risks when designing it. They range from environmental alterations where the system will operate to attacks by malicious individuals.
1. Data protection and data governance: Privacy is a fundamental right that has been highly compromised with the vast amounts of data that artificial intelligence systems gather. It is necessary to protect individual privacy to prevent potential harm. For this purpose, robust data governance must be in place. This includes making sure that the information being utilized is precise and applicable. Furthermore, there is a necessity to establish definite rules for data access and how data must be treated while maintaining the integrity of privacy.
1. Transparency: Explainability and transparency are pretty much dependent on each other. The key objective is to make data, technology, and business models clear. In today’s age, which is the age of pervasive technology, transparency has become a must. It aids customers in comprehending the huge volumes of data collected and the ensuing benefits.
1. Fairness, diversity, and nondiscrimination: Including several voices in AI systems is vital to achieve XAI. We need to involve all individuals who may be affected to ensure equal treatment and access. Fairness and this requirement come hand in hand.
1. Social and environmental welfare: We have to think about the environment and community in seeking justice and doing no harm. We should finance research on AI solutions to global issues. This will make AI systems environmentally friendly and sustainable. AI is supposed to be for the good of all people, including future generations..
1. Accountability: Accountability and fairness are essential in the context of AI. We need to have systems of holding AI systems accountable for their actions and generated results. Accountability needs to be a constituent part of AI development, deployment, and use, both during and following the activities.
### 1.7 Impact of XAI on Zero Trust Architecture (ZTA)
Zero Trust Architecture (ZTA) is a security system that always checks every request, no matter where it comes from, and does not assume trust automatically. Explainable AI (XAI) helps ZTA by ensuring that decisions made by AI in security are clear and reasonable.
XAI is especially useful in identity verification, access control, and spotting unusual behavior. AI models analyze how users behave and identify any suspicious activities. By adding explainability, security analysts can better understand and confirm AI-driven security rules. This reduces false alarms and speeds up response times.
For example, AI-driven network monitoring systems that use ZTA principles can explain why a specific access attempt looks suspicious. This explanation builds trust in automated cybersecurity decisions [32].
### 1.8 An Overview of Necessities for Reliable AI
Despite heated societal discussions, the requirements for trustworthy AI remain ambiguous and are handled inconsistently by numerous organizations and organizations. Globally, accountability, explainability, verifiability, and fairness are all part of the Fairness, Responsibility, Accuracy, Verifiability, and Accountability in Machine Learning (FAT-ML) principles [33]. Explainability, fairness, privacy, and robustness are just a few of the many needs that will be examined in this study (Table 1).
Table 1: Conditions necessary for trustworthy artificial intelligence (AI)
| Explainability | To help consumers comprehend, the method by which the AI model generates its output might be demonstrated. |
| --- | --- |
| Fairness | Regardless of certain protected variables, the AI model’s output can be shown. |
| Privacy | It is feasible to prevent issues with personal data that might arise while the AI is being developed. |
| Robustness | The AI model can fend against outside threats while continuing to operate correctly. |
## 2 XAI Vs AI
XAI improves AI systems by focusing on transparency, clear explanations, and accountability. It offers understandable reasons for decisions, which helps users trust the system and makes it easier to assess fairness compared to traditional ”black box” methods.
The main difference between reliable XAI and traditional AI is how they make decisions. While AI can give accurate forecasts or suggestions, reliable XAI emphasizes the need to explain the steps that lead to these results. Clear explanations from XAI systems allow users to judge the fairness and reliability of AI-generated outcomes.
To improve security and maintain transparency in AI-driven cybersecurity, we need to integrate XAI into Zero Trust Architecture (ZTA). When explainability methods clarify why certain decisions are made, people can better understand and trust the AI-driven access control and behavioral analytics in ZTA. As we face compliance and operational challenges, future cybersecurity frameworks will rely more on AI automation. It will be essential to ensure that these AI systems can be easily explained [34].
XAI focuses on more than just providing explanations; it also considers ethical issues. AI development processes that follow the principles of Fairness, Accountability, and Transparency (FAT) help ensure that AI systems meet ethical and legal standards. By prioritizing ethical standards, XAI aims to reduce biases, discrimination, and other harmful effects of AI technology. Trustworthy AI is an approach that emphasizes user safety and transparency. Responsible AI developers clearly explain to clients and the public how the technology works, what it is meant for, and its limitations, since no model is perfect.
Table 2: Seven Requirements to Meet in Order to Develop Reliable AI
| Human Authority and Supervision | Artificial intelligence technology ought to uphold human agency and basic rights, instead of limiting or impeding human autonomy. | The right to get human assistance | Recital 71, Art 22 |
| --- | --- | --- | --- |
| Robustness and Safety | Systems must be dependable, safe, robust enough to tolerate mistakes or inconsistencies, and capable of deviating from a totally automated decision | Art 22 | |
| Data Governance and Privacy | Individuals should be in total control of the information that is about them, and information about them should not be used against them | Notification and information access rights regarding the logic used in automated processes | Art 13, 14, and 15 |
| Transparency | Systems using AI ought to be transparent and traceable | The right to get clarification | Recital 71 |
| Diversity and Fairness | AI systems have to provide accessibility and take into account the whole spectrum of human capacities, requirements, and standards | Right to not have decisions made only by machines | Art 22 |
| Environmental and Social Well-Being | AI should be utilized to promote social change, accountability, and environmental sustainability | Accurate knowledge regarding the importance and possible consequences of making decisions exclusively through automation | Art 13, 14, and 15 |
| Accountability | Establishing procedures to guarantee that AI systems and their outcomes are held accountable is essential | Right to be informed when decisions are made only by machines | Art 13, 14 |
## 3 Applications of XAI
Authentic XAI has numerous uses in sectors where accountability, interpretability, and transparency are essential. XAI can provide an explanation for a diagnosis or therapy recommendation in medical diagnosis and recommendation systems. Financial institutions can employ XAI for risk assessment, fraud detection, and credit scoring. XAI can help attorneys with contract analysis, lawsuit prediction, and legal research. In autonomous vehicles, XAI plays a significant role in providing context for the decisions made by the AI systems, particularly in high-stakes scenarios such as accidents or unanticipated roadside incidents. XAI can be applied to process optimization, predictive maintenance, and quality control in manufacturing settings. By offering justifications for automated responses or suggestions in chatbots and virtual assistants, XAI can improve customer service. By providing an explanation for the recommendations and assessments made by adaptive learning systems, XAI can help with individualized learning. By providing an explanation for the recommendations and assessments made by adaptive learning systems, XAI can help with individualized learning. We shall concentrate on a few particular applications in this section and go into detail about them.
### 3.1 Application of XAI in Medical Science
The field of artificial intelligence (AI) is rapidly growing on a global scale, particularly in healthcare, which is a hot topic for research [35]. There are numerous opportunities to utilize AI technology in the healthcare sector, where the well-being of individuals is at stake, due to its significant relevance and the vast amounts of digital medical data that have been collected [36]. AI has enabled us to perform tasks quickly that were previously unfeasible with traditional technologies.
The trustworthiness and openness of AI systems are becoming increasingly important, especially in areas like healthcare. As AI is used more in medical decision-making, people are worried about how reliable and understandable its results are. These worries highlight the need to evaluate AI models carefully to make sure their predictions are based on important and verifiable factors. In critical situations like medicine, proving that AI systems are credible is vital for their safe and effective use.
In the medical field, clinical decision support systems (CDSS) utilize AI technology to assist healthcare professionals with critical tasks such as diagnosis and treatment planning [37]. While these systems aim to support healthcare practitioners, misuse can have severe consequences in situations where lives are at risk. For example, false alarms, which are common in scenarios involving urgent patients, can lead to exhaustion among medical personnel.
The study [38] significantly contributes to medical skin lesion diagnostics in several ways. First, it modifies an existing explainable AI (XAI) technique to boost user confidence and trust in AI systems. This change involves developing an AI model that can distinguish between different types of skin lesions. The study uses synthetic examples and counter-examples to create explanations that highlight the key features influencing classification decisions. The research [38] trains a deep learning classifier with the ISIC 2019 dataset using the ResNet architecture. This allows professionals to use the explanations to reason effectively. Overall, the study’s main contributions lie in its refinement and evaluation of the XAI technique in a real-world medical setting, its analysis of the latent space, and its thorough user study to assess how effective the explanations are, particularly among experts in the field.
This research paper [39] discusses how to recognize brain tumors in MRI images using two effective algorithms: fuzzy C-means (FCM) and Artificial Neural Network (ANN). The authors aim to make the tumor segmentation process more understandable and improve accuracy in identifying tumors. Their main goal is to enhance tools that help doctors diagnose brain tumors more accurately.
This research offers two key benefits. First, it helps identify brain cancers in medical images more precisely, which is crucial for early diagnosis and treatment. Second, by incorporating XAI principles into the segmentation process, the researchers make their models’ decisions clearer and easier to understand for patients and medical experts. In summary, this increased clarity boosts the overall trust and acceptance of AI-driven systems in medical image analysis within clinical settings.
This study [40] discusses how AI and machine learning can help diagnose whole slide images (WSIs) in pathology. While AI can improve accuracy and efficiency, concerns exist about its reliability because it can be hard to understand. To address these issues, the article suggests using explainable AI methods, which help clarify how AI makes decisions. By adding XAI, pathology systems become more transparent and trustworthy, especially for critical tasks like diagnosing diseases. The study also introduces HistoMapr-Breast, a software tool that uses XAI to assist with breast core biopsies.
A recent study examines the importance of making sure AI systems in healthcare are accurate and strong, especially regarding how easy they are to understand and how well they can resist attacks [41]. As AI becomes more common in medical settings, it’s crucial to verify that the predictions these systems make rely on trustworthy features. To tackle this challenge, researchers have proposed various methods to improve model interpretability and explainability. The study shows that adversarial attacks can affect a model’s explainability, even when the model has strong training. Additionally, the authors introduce two types of attack classifiers: one that tells apart harmless and harmful inputs, and another that determines the nature of the attack.
This research paper [42] looks at explainable machine learning in cardiology. It discusses the challenges of understanding complex prediction models and how these models affect important healthcare decisions. The study explains the main ideas and methods of explainable machine learning, helping cardiologists understand the benefits and limitations of this approach. The goal is to improve decision-making in clinical settings by offering guidance on when to use easy-to-understand models versus complex ones. This can help improve patient outcomes while ensuring accountability and transparency in predictions.
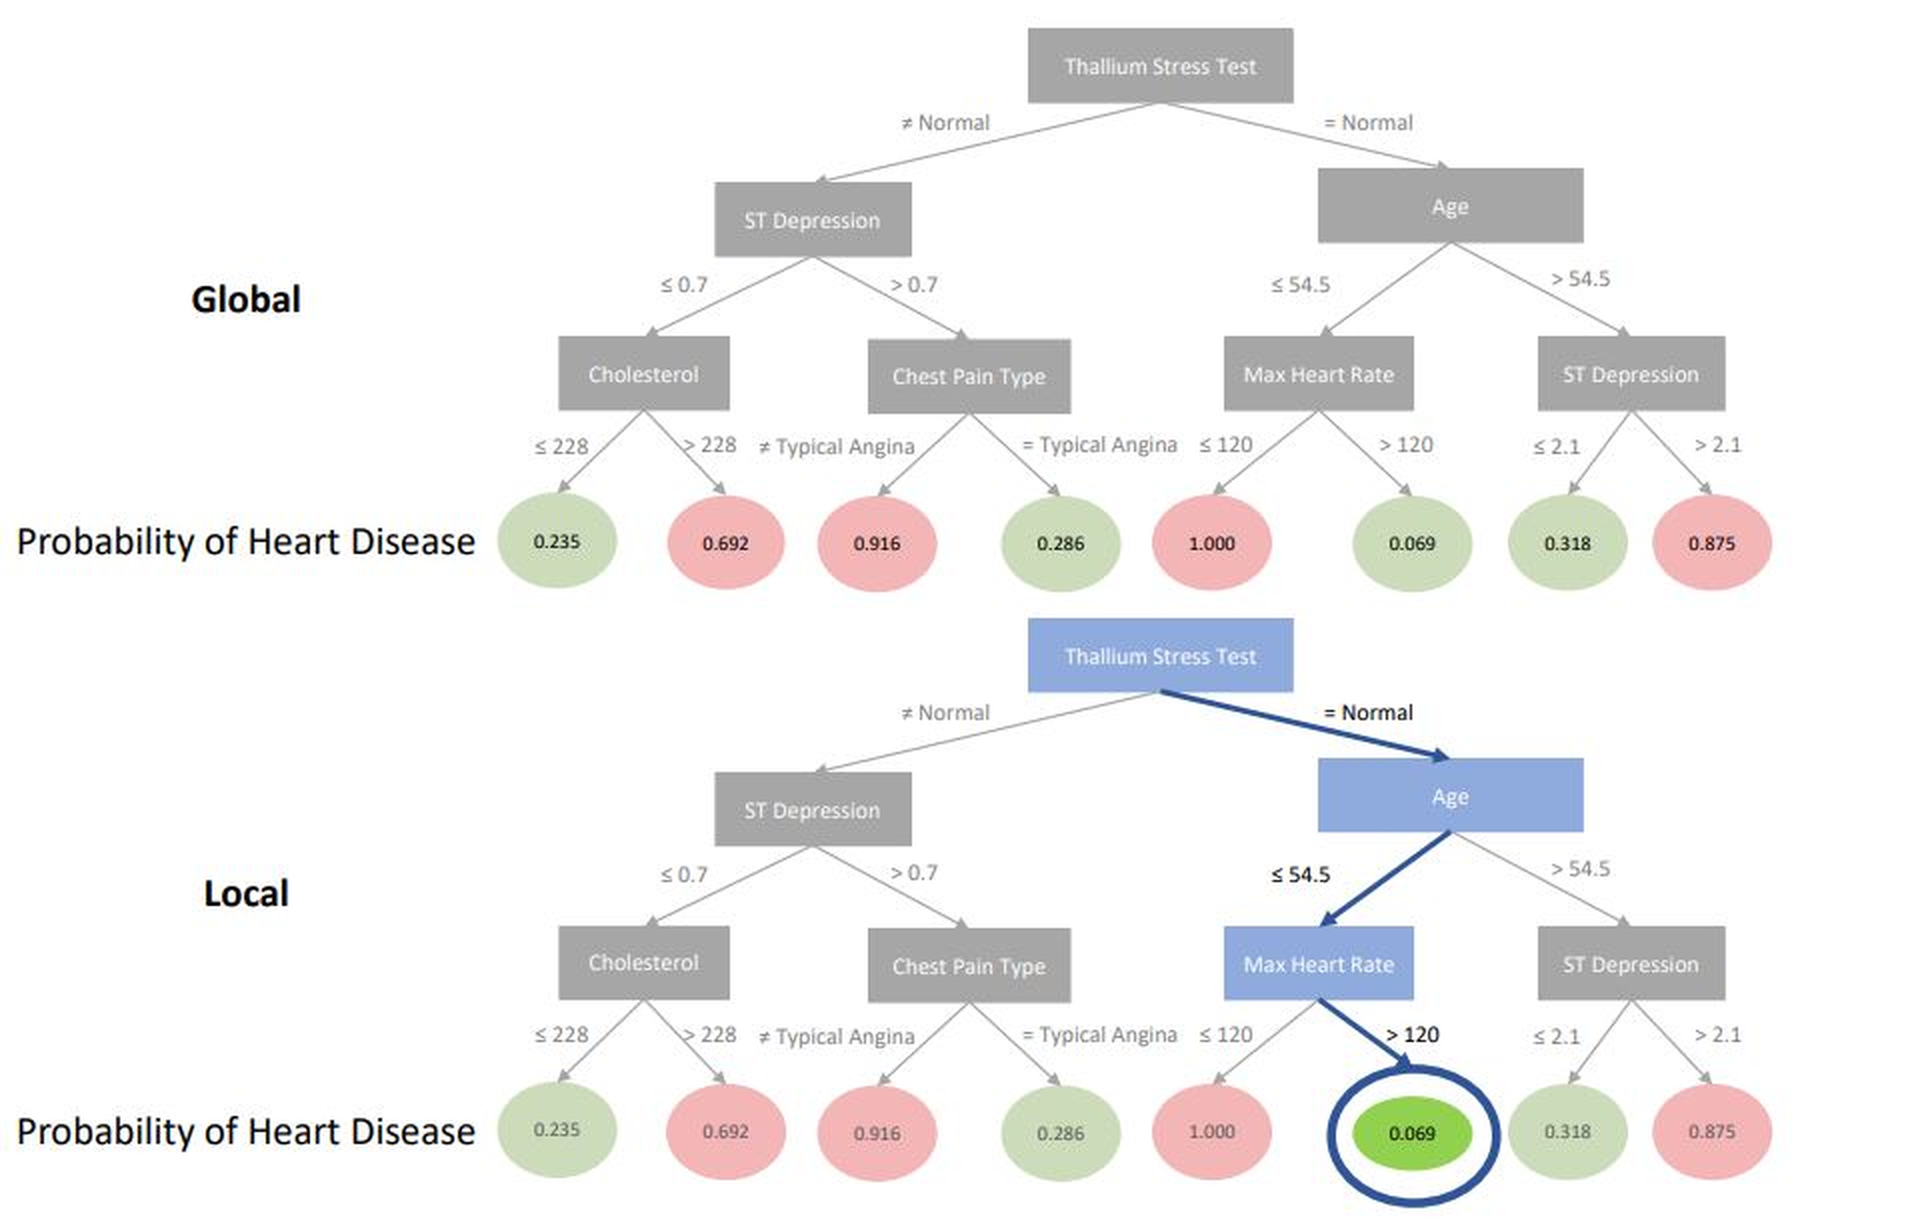
Figure 9 shows a decision tree created from the predictions of a random forest model. This global tree diagram illustrates how the random forest works overall. By following a patient’s path through the tree, individual predictions can be examined. This type of explanation is beneficial because it clarifies both the general functioning of the model and the reasoning behind specific predictions. Decision trees are suitable for fields like cardiology because they use rule-based reasoning similar to clinical decision guidelines.
<details>
<summary>extracted/6367585/image/eai5.png Details</summary>
### Visual Description
\n
## Decision Tree Diagram: Heart Disease Probability Prediction
### Overview
The image displays two decision tree diagrams used to predict the probability of heart disease based on patient medical data. The top tree is labeled "Global," representing the overall model structure. The bottom tree is labeled "Local," highlighting a specific decision path for an individual case. Both trees share the same structure and leaf node probabilities but differ in visual emphasis.
### Components/Axes
**Structure:** Hierarchical decision trees with nodes and branches.
**Root Node (Both Trees):** "Thallium Stress Test"
**Decision Nodes (Grey Rectangles):**
- ST Depression
- Age
- Cholesterol
- Chest Pain Type
- Max Heart Rate
**Leaf Nodes (Circles):** Contain the predicted "Probability of Heart Disease." Nodes are color-coded:
- **Green:** Lower probability values.
- **Red:** Higher probability values.
**Branch Labels:** Conditions for splitting at each node (e.g., "≤ 0.7", "> 54.5", "= Typical Angina").
**Spatial Layout:**
- The "Global" tree occupies the top half of the image.
- The "Local" tree occupies the bottom half.
- In the "Local" tree, the decision path from the root to a specific leaf node is highlighted with **blue nodes and blue connecting lines**. The final leaf node in this path (value 0.069) is further emphasized with a **dark blue circle**.
### Detailed Analysis
**Tree Structure & Decision Paths:**
1. **Root Split:** Based on "Thallium Stress Test".
* Left Branch: "≠ Normal" → leads to "ST Depression" node.
* Right Branch: "= Normal" → leads to "Age" node.
2. **Left Subtree (Thallium ≠ Normal):**
* Node: "ST Depression"
* Left Branch: "≤ 0.7" → leads to "Cholesterol" node.
* Left Branch: "≤ 228" → **Leaf: 0.235 (Green)**
* Right Branch: "> 228" → **Leaf: 0.692 (Red)**
* Right Branch: "> 0.7" → leads to "Chest Pain Type" node.
* Left Branch: "≠ Typical Angina" → **Leaf: 0.916 (Red)**
* Right Branch: "= Typical Angina" → **Leaf: 0.286 (Green)**
3. **Right Subtree (Thallium = Normal):**
* Node: "Age"
* Left Branch: "≤ 54.5" → leads to "Max Heart Rate" node.
* Left Branch: "≤ 120" → **Leaf: 1.000 (Red)**
* Right Branch: "> 120" → **Leaf: 0.069 (Green)**
* Right Branch: "> 54.5" → leads to "ST Depression" node.
* Left Branch: "≤ 2.1" → **Leaf: 0.318 (Green)**
* Right Branch: "> 2.1" → **Leaf: 0.875 (Red)**
**"Local" Tree Highlighted Path:**
The blue path traces the following decisions for a specific instance:
1. Thallium Stress Test = **Normal** (Right branch from root).
2. Age ≤ **54.5** (Left branch from "Age" node).
3. Max Heart Rate > **120** (Right branch from "Max Heart Rate" node).
4. This leads to the leaf node with a probability of **0.069**, which is circled.
### Key Observations
1. **Probability Extremes:** The model outputs probabilities across the full range, from very low (0.069) to certainty (1.000).
2. **Color-Coding Logic:** Green leaves consistently correspond to probabilities below ~0.32, while red leaves correspond to probabilities above ~0.69. The leaf with probability 1.000 is red.
3. **Critical Splits:**
* A "Thallium Stress Test" result of "≠ Normal" generally leads to higher-risk branches, except when combined with "Chest Pain Type = Typical Angina" (0.286).
* For patients with a normal Thallium test and age ≤ 54.5, a "Max Heart Rate > 120" is associated with the lowest probability in the entire tree (0.069).
* For older patients (Age > 54.5) with a normal Thallium test, "ST Depression > 2.1" indicates high risk (0.875).
4. **Highlighted Path Significance:** The "Local" tree isolates a specific, low-risk patient profile: normal stress test, younger age, and high maximum heart rate.
### Interpretation
This diagram visualizes a machine learning model's logic for assessing heart disease risk. It demonstrates how different clinical features interact in a non-linear way to produce a risk score.
* **Model Function:** The tree acts as a flowchart for diagnosis. A clinician (or system) would input a patient's data and follow the branches to arrive at a probability estimate.
* **Feature Importance:** The root node ("Thallium Stress Test") is the most important initial splitter. Subsequent important features include "Age," "ST Depression," and "Max Heart Rate."
* **Non-Intuitive Relationships:** The path to the lowest probability (0.069) is noteworthy. It suggests that for younger patients with a normal stress test, achieving a high heart rate during exertion (>120) is a strong indicator of *low* risk, which may reflect good cardiovascular fitness.
* **Explainability:** The "Local" tree exemplifies model explainability techniques (like LIME or SHAP). It doesn't just give a prediction (0.069); it shows the exact reasoning path (Normal Thallium → Age ≤54.5 → Max HR >120) that led to that prediction for one individual, making the AI's decision transparent.
* **Clinical Context:** The features used (Thallium test, ST depression, cholesterol, chest pain type, age, max heart rate) are all standard indicators in cardiology, grounding the model in established medical knowledge. The tree structure makes the complex relationships between these factors interpretable.
</details>
Figure 9: A model using random forests predicts heart disease by analyzing both local and global decision trees. The global diagram starts by examining whether a patient’s thallium stress test results are normal. If the test shows a problem, the model looks at the patient’s ST depression next. The local graphic shows the specific pathway a patient took in the model, explaining the reasons for their individual prediction. For example, a patient under 54.5 years old, with a maximum heart rate that is high and normal thallium stress test results, has a very low chance of having heart disease [42].
Figure 10 shows the LIME explanations for our heart failure model’s two local predictions. The authors explain how these predictions serve as a clinical decision support tool in Epic, which is an electronic health record designed for doctors (Epic Systems Corporation, Verona, Wisconsin, USA). This kind of explanation helps to clarify the clinical factors that affect each prediction. Importantly, this type of explanation can be added to an EHR, which may improve the practical use of a complex model by making forecasts and clear explanations easy to integrate into clinical work.
<details>
<summary>x5.jpg Details</summary>
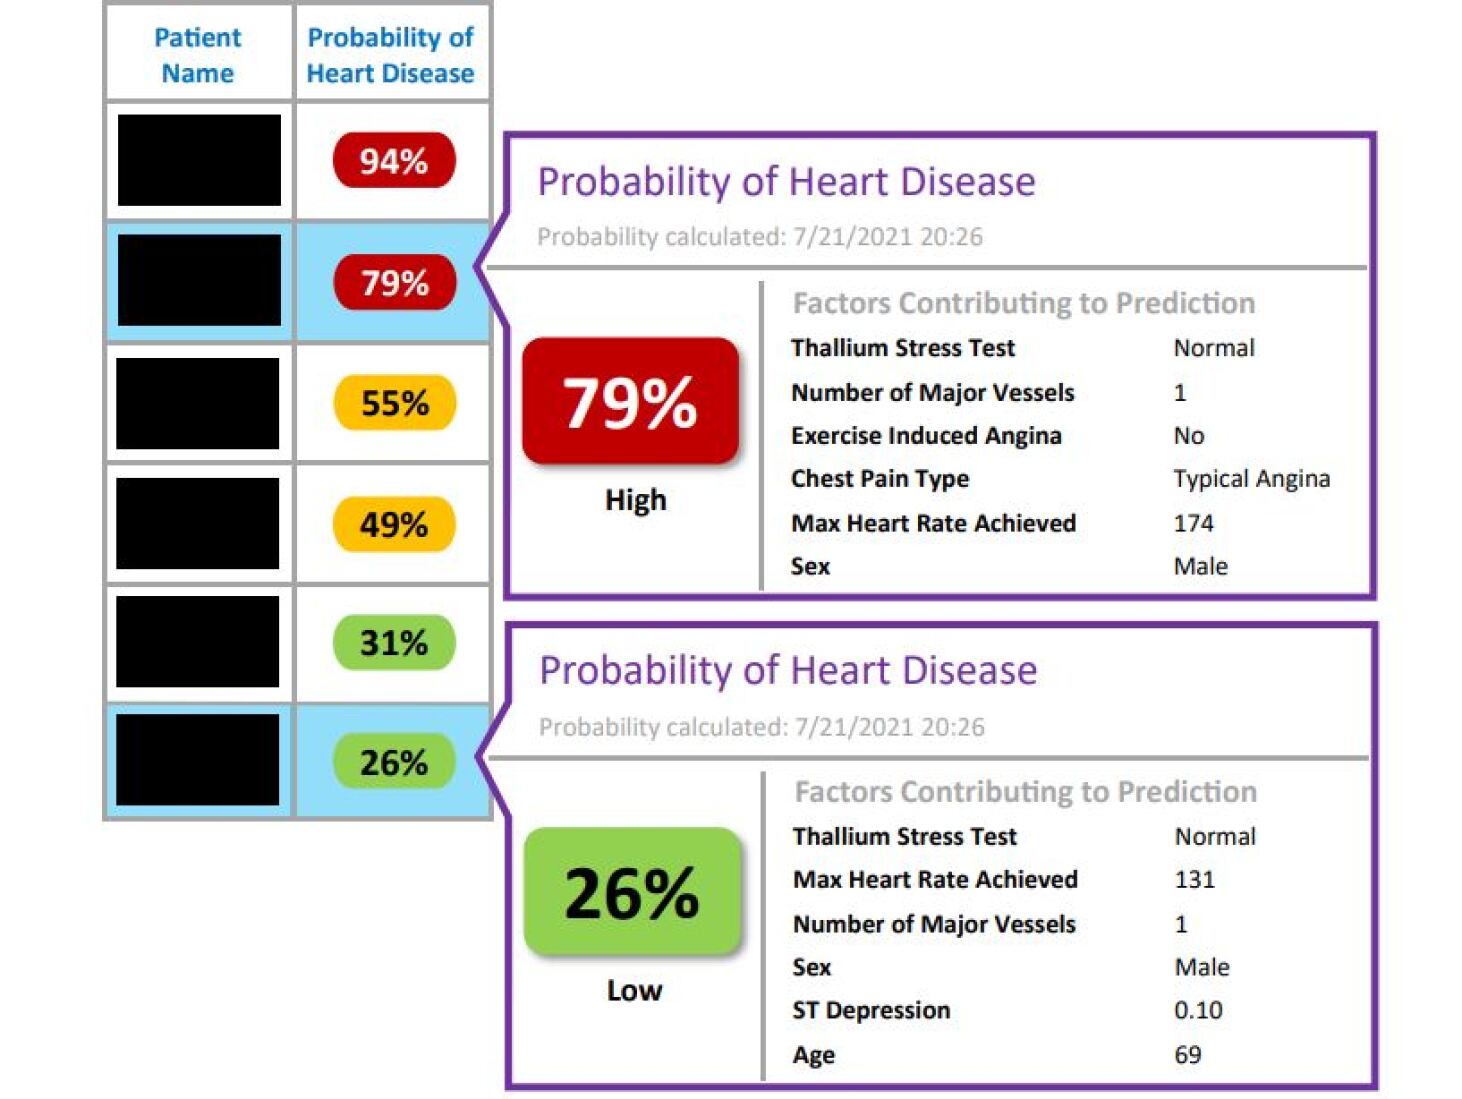
### Visual Description
## Medical Dashboard: Heart Disease Probability Assessment
### Overview
The image displays a medical software interface or report showing heart disease probability predictions for multiple patients. It consists of a summary table on the left and two detailed pop-up panels on the right, which expand on specific patient entries. The interface uses color-coding (red, yellow, green) to indicate risk levels.
### Components
**Left Panel - Patient Summary Table:**
| Patient Name | Probability of Heart Disease |
| :--- | :--- |
| [Redacted] | 94% (Red oval) |
| [Redacted] | 79% (Red oval) - **Highlighted row** |
| [Redacted] | 55% (Yellow oval) |
| [Redacted] | 49% (Yellow oval) |
| [Redacted] | 31% (Green oval) |
| [Redacted] | 26% (Green oval) - **Highlighted row** |
**Right Panel - Detailed Pop-ups:**
Two detailed panels are shown, connected by lines to their corresponding rows in the summary table (79% and 26%).
**Top Detail Panel (for 79% patient):**
* **Header:** "Probability of Heart Disease"
* **Sub-header:** "Probability calculated: 7/21/2021 20:26"
* **Main Display:** A large red rounded rectangle containing "79%" with the label "High" below it.
* **Section Header:** "Factors Contributing to Prediction"
* **Factor List (Key-Value Pairs):**
* Thallium Stress Test: Normal
* Number of Major Vessels: 1
* Exercise Induced Angina: No
* Chest Pain Type: Typical Angina
* Max Heart Rate Achieved: 174
* Sex: Male
**Bottom Detail Panel (for 26% patient):**
* **Header:** "Probability of Heart Disease"
* **Sub-header:** "Probability calculated: 7/21/2021 20:26"
* **Main Display:** A large green rounded rectangle containing "26%" with the label "Low" below it.
* **Section Header:** "Factors Contributing to Prediction"
* **Factor List (Key-Value Pairs):**
* Thallium Stress Test: Normal
* Max Heart Rate Achieved: 131
* Number of Major Vessels: 1
* Sex: Male
* ST Depression: 0.10
* Age: 69
### Detailed Analysis
The system calculates a probability percentage for heart disease for each patient. The probabilities in the sample range from 26% to 94%. The color coding appears to be:
* **Red (High Risk):** 94%, 79%
* **Yellow (Medium Risk):** 55%, 49%
* **Green (Low Risk):** 31%, 26%
The detailed panels reveal the specific clinical factors used in the predictive model for two cases.
* **High-Risk Case (79%):** Characterized by "Typical Angina" chest pain, a high maximum heart rate achieved (174), and one major vessel affected. The thallium stress test was normal, and exercise-induced angina was absent.
* **Low-Risk Case (26%):** Characterized by a lower maximum heart rate (131), a low ST depression value (0.10), and the patient's age (69). It also notes one major vessel affected and a normal thallium test.
### Key Observations
1. **Factor Variability:** The list of contributing factors differs between the two detailed examples. The high-risk panel includes "Chest Pain Type" and "Exercise Induced Angina," while the low-risk panel includes "ST Depression" and "Age." This suggests the model may use different subsets of features for different patients or that the interface displays only the most salient factors for each prediction.
2. **Common Factors:** Both patients are male, have a normal thallium stress test, and have one major vessel affected. Despite these similarities, their risk probabilities differ significantly (79% vs. 26%), highlighting the impact of other variables like chest pain type and achieved heart rate.
3. **Temporal Data:** Both detailed predictions were calculated at the exact same timestamp: July 21, 2021, at 20:26.
### Interpretation
This image depicts a clinical decision support tool designed to quantify heart disease risk. It translates complex patient data into a single, actionable probability score, aiding in triage and prioritization.
The system's logic appears to weigh certain factors heavily. For instance, the presence of "Typical Angina" in the high-risk patient is a strong clinical indicator that likely contributed substantially to the 79% score. Conversely, the low-risk patient's lower max heart rate and minimal ST depression (a measure of heart stress) are negative indicators for significant coronary artery disease.
The discrepancy in listed factors between the two panels is noteworthy. It could indicate an adaptive model that highlights the most influential variables for a given prediction, or it might simply reflect a UI design choice to avoid clutter. The identical calculation timestamp suggests these reports were generated simultaneously, perhaps as part of a batch analysis or a demonstration.
Ultimately, the tool synthesizes objective measurements (e.g., ST Depression, Max Heart Rate) with clinical observations (e.g., Chest Pain Type) to generate a risk stratification, moving beyond qualitative assessment to a data-driven probability.
</details>
Figure 10: Heart disease prediction explanation produced using Local Interpretable Model-Agnostic Explanations (LIME). This illustration shows how clinical decision assistance can be integrated into an Epic electronic health record by means of a local explanation utilizing the LIME algorithm. To help clinicians identify patients who are likely to be at a high risk of heart disease, probabilities are color-coded. To improve the predictability and actionability of the results for doctors, the clinical factors that are most significant to the prediction are shown on the right [42].
For medical AI to work reliably and be widely used, we need to do a lot of research and reach an agreement on important features like explainability, fairness, privacy, and reliability [33]. We must meet clear requirements and standards in any healthcare setting that uses AI, and we need to update these regularly. Additionally, we should establish laws that clarify who is responsible if something goes wrong with a medical AI whether that’s the designers, researchers, healthcare workers, or patients [43].
### 3.2 Explainability and Interpretability of Autonomous Systems
Explainability and interpretability are crucial concepts in the context of autonomous systems, referring to the ability to understand the decisions and behaviors of these systems. Explainability involves an autonomous system’s capacity to provide clear justifications for its actions and choices [44]. This clarity is essential for fostering acceptance and confidence in AI systems, especially in critical fields such as banking, healthcare, and autonomous vehicles.
While explainability and interpretability are closely related, interpretability focuses more on understanding the internal mechanisms and processes of the autonomous system [45]. An interpretable system offers users insight into the factors and criteria that influence its decision-making, enabling them to grasp how the system arrived at its conclusions.
The research paper The research article [18] focuses on trust and dependability in autonomous systems. Autonomous systems have the potential for system operation, rapid information dissemination, massive data processing, working in hazardous environments, operating with greater resilience and tenacity than humans, and even astronomical examination [46], [47]. Following years of research and development, today’s automated technologies represent the peak of progress in computer recognition, responsive systems, user-friendly interface design, and sensing automation.
According to [44], the global market for automotive intelligent hardware, operations, and innovation is projected to grow significantly, increasing from $1.25billionin2017to$ 28.5 billion by 2025. Intel’s research on the expected benefits of autonomous vehicles indicates that implementing these technologies on public roads could reduce annual commute times by 250 million hours and save over 500,000 lives in the United States between 2035 and 2045 [44]. Modern cars utilize artificial intelligence for various functions, including intelligent cruise control, automatic driving and parking, and blind-spot detection (Figure 11).
Authors [18] describe the challenges of autonomous systems, like, people sometimes tend to be overly excited about the potential of new ideas and ignore, or at least appear to be unaware of, the potential drawbacks of cutting-edge developments. Even in the early stages of robotics and autonomous system implementation, humanity preferred to put up with faulty goods and services, but they have gradually come to understand the importance of trustworthy and dependable autonomous systems. Numerous examples have demonstrated how operators’ use of automation is greatly impacted by trustworthiness.
<details>
<summary>x6.jpg Details</summary>
### Visual Description
## Screenshot: Autonomous Vehicle Dashboard with Augmented Reality Street View
### Overview
This image is a first-person perspective screenshot from the driver's seat of a vehicle, likely an autonomous or advanced driver-assistance system (ADAS). It displays a real-world urban street scene overlaid with computer vision detection boxes and path planning graphics, combined with a digital instrument cluster showing vehicle status and navigation information.
### Components/Axes
The image is composed of two primary regions:
1. **Main Windshield View (Upper ~70% of frame):** Shows a European city street with multi-story buildings, parked cars, and moving traffic. Overlaid on this view are augmented reality (AR) graphics.
2. **Digital Dashboard (Lower ~30% of frame):** A curved digital display behind the steering wheel showing vehicle telemetry, alerts, and navigation.
**AR Overlay Elements (Windshield View):**
* **Bounding Boxes:** Used to classify and track objects.
* **Red Boxes:** Indicate high-priority or vulnerable road users.
* One box (center-left) surrounds a pedestrian walking on the sidewalk, wearing a blue dress.
* One box (center-right) surrounds a cyclist riding a bicycle in the lane, wearing a red shirt and a backpack.
* **Blue Boxes:** Indicate other vehicles and static infrastructure.
* Multiple boxes surround parked and moving cars along both sides of the street.
* Boxes also appear to outline building facades and streetlights.
* **Path Planning Graphics (Blue Lines):**
* A series of blue lines and arrows on the road surface indicate the vehicle's intended path or lane-keeping guidance. The lines converge toward the center of the lane ahead.
* A large blue arrow points forward and slightly left, suggesting a planned lane change or path adjustment.
**Digital Dashboard Elements:**
* **Central Speed Display:**
* A large yellow number **"32"** indicates the current vehicle speed in km/h.
* To its left, a circular icon with the number **"30"** represents the detected speed limit.
* **Text Alerts (German):**
* **"Bremsvorgang aktiv"** (in red) - Translation: "Braking process active."
* **"Achtung!"** (in red, smaller) - Translation: "Attention!" or "Warning!"
* **"Stadtverkehr"** - Translation: "City traffic." Likely indicates the current driving mode.
* **Navigation & Status:**
* **"Ankunft: 15:34 Uhr"** - Translation: "Arrival: 3:34 PM."
* A simplified map graphic showing the planned route with an upward arrow.
* A square icon, possibly representing a destination or waypoint.
* **Energy Graph (Right side):**
* A line graph labeled **"Energieleistung"** - Translation: "Energy performance" or "Power output."
* The graph shows a fluctuating red line, indicating real-time power consumption or regeneration.
### Detailed Analysis
* **Scene Context:** The environment is a dense urban setting ("Stadtverkehr") during daylight hours. The architecture suggests a Central European city.
* **System State:** The vehicle is in motion at 32 km/h, slightly above the detected 30 km/h limit. The "Bremsvorgang aktiv" alert indicates the autonomous system is currently applying the brakes, likely in response to the detected cyclist and pedestrian in close proximity.
* **Object Detection:** The system has successfully identified and classified multiple object types: pedestrians (red box), cyclists (red box), cars (blue boxes), and infrastructure (blue boxes). The use of different colored boxes implies a priority or threat-level hierarchy.
* **Path Planning:** The blue path lines show the system's calculated safe trajectory through the environment, navigating between the detected objects.
### Key Observations
1. **Active Hazard Response:** The simultaneous "Braking process active" alert and the red bounding boxes around the pedestrian and cyclist strongly suggest the system is executing a protective maneuver, likely slowing down to create a safe distance.
2. **Speed Limit Compliance:** The vehicle is traveling 2 km/h over the detected speed limit, which may be within an acceptable tolerance or could be the reason for the braking action.
3. **Comprehensive Environmental Mapping:** The blue boxes around building facades indicate the system is not only tracking dynamic objects but also mapping the static environment for localization and path planning.
4. **Energy Monitoring:** The "Energieleistung" graph provides real-time feedback on the vehicle's powertrain efficiency, which is crucial for electric or hybrid vehicles.
### Interpretation
This image provides a technical snapshot of an autonomous driving system's perception and decision-making process in a complex urban scenario. It demonstrates the system's core functions operating in unison:
* **Perception:** Identifying and classifying all relevant actors (vulnerable road users, vehicles) and the static environment.
* **Planning:** Calculating a safe path (blue lines) through the perceived environment.
* **Action & Control:** Executing a vehicle control command (braking) based on the plan and perceived hazards.
* **Human-Machine Interface (HMI):** Communicating the system's status, alerts, and intent to the human occupant via the dashboard and AR overlays.
The scene captures a critical moment of interaction between the autonomous vehicle and unpredictable urban elements. The red alerts and braking action highlight the system's primary safety function: to proactively avoid collisions with pedestrians and cyclists. The AR overlays serve a dual purpose: they are likely a visualization for system developers or a trust-building feature for passengers, making the AI's "thought process" transparent. The overall impression is of a sophisticated system navigating a routine but high-stakes driving environment, with its internal state and external awareness clearly displayed.
</details>
Figure 11: An automated vehicle that provides a clear and understandable rationale for its decisions at that moment serves as a prime example of explainable AI in automated driving [18].
When AI has become prevalent in autonomous vehicle (AV) operations, user trust has been identified as a major issue that is essential to the success of these operations. XAI, which calls for the AI system to give the user explanations for every decision it makes, is a viable approach to fostering user trust for such integrated AI-based driving systems [48]. This work develops explainable Deep Learning (DL) models to improve trustworthiness in autonomous driving systems, driven by the need to improve user trust and the potential of innovative XAI technology in addressing such requirements. The main concept of this [48] research is to frame the decision-making process of autonomous vehicles (AVs) as an image-captioning task, generating textual descriptions of driving scenarios to serve as understandable explanations for humans. The proposed multi-modal deep learning architecture, shown in Figure 12, utilizes Transformers to model the relationship between images and language, generating meaningful descriptions and driving actions. Key contributions include improving the AV decision-making process for better explainability, developing a fully Transformer-based model, and outperforming baseline models. This results in enhanced user trust, valuable insights for AV developers, and improved interpretability through attention mechanisms and goal induction.
<details>
<summary>extracted/6367585/image/eai8.png Details</summary>
### Visual Description
## Technical Diagram: Visual Attention-Based Image Captioning Architecture
### Overview
This image is a technical flowchart illustrating a neural network architecture for image captioning or visual question answering. The system processes an input image through a feature encoder, applies an attention mechanism, and uses a recurrent language decoder to generate a sequence of words. The diagram is divided into three main dashed-line boxes representing distinct processing stages.
### Components/Axes
The diagram is segmented into three primary regions from left to right:
1. **Image Feature Encoder (Left Box):**
* **Input Image:** A photograph of a street scene with buildings, a crosswalk, and a blue sky.
* **Resized image:** A smaller version of the input image.
* **Feature extractor:** A blue trapezoid labeled "Resnet Mobile net".
* **Output:** A 3D block representing a feature map with dimensions labeled `h` (height), `w` (width), and `f` (feature channels).
* **Image features:** A stack of horizontal yellow bars representing the flattened feature vectors. The total number of spatial locations is labeled `s = w x h`, and the feature dimension is `f`.
2. **Attention Network (Middle Box):**
* **Input:** The "Image features" from the encoder.
* **Attention Mechanism:** A circle with an 'X' labeled "Attention". It receives two inputs: the image features and a hidden state `h₀`.
* **Attention Score:** A vertical column of small yellow squares.
* **Attended features:** A stack of horizontal yellow bars, representing the context vector after attention is applied.
* **Output:** The attended features are passed to the Language Decoder.
3. **Language Decoder (Right Box):**
* **Recurrent Core:** A sequence of LSTM cells.
* **Initial Step:** The first LSTM receives the initial hidden state `h₀` and a start-of-sequence token `<SOS>`. It produces an output `ŷ₁` and a new hidden state `h₁`.
* **Subsequent Steps:** The next LSTM receives `h₁` and the previous output (implied). It also receives an input labeled "Obstacles" at the second step. It produces output `ŷ₂` and continues the sequence (indicated by `...`).
* **Attention Integration:** At each decoder step, an "Attention" mechanism (circle with 'X') combines the current LSTM hidden state with the original "Image features" to produce "Attended features" (yellow bars of dimension `s x f`), which are then used to predict the next word.
* **Output Symbols:** The predicted word tokens are labeled `ŷ₁`, `ŷ₂`, etc.
### Detailed Analysis
* **Data Flow:** The process is sequential and feed-forward with recurrent connections in the decoder.
1. An `Input Image` is resized and passed through a `Feature extractor` (ResNet or MobileNet).
2. This produces a 3D feature map (`h x w x f`), which is reshaped into `s` spatial vectors, each of dimension `f` (`s = w x h`).
3. These `Image features` are fed into the `Attention Network`.
4. The `Language Decoder` generates a word sequence. For each step `t`:
* The LSTM cell takes the previous hidden state `h_{t-1}` and the previous word embedding (or `<SOS>` for the first step).
* An `Attention` mechanism computes a weighted sum of the `Image features` using the current LSTM state, producing a context vector (`Attended features`).
* This context vector and the LSTM state are used to predict the next word `ŷ_t`.
* **Key Dimensions & Labels:**
* `s`: Total number of spatial locations in the feature map (`s = w x h`).
* `f`: Depth of the feature vector at each spatial location.
* `h, w`: Height and width of the intermediate feature map.
* `s x f`: Dimension of the attended feature vector for a single time step.
* `s x 1`: Dimension of the attention score vector (one score per spatial location).
* **Text Transcription:** All text is in English. Key labels include: "Image Feature Encoder", "Input Image", "Resized image", "Feature extractor", "Resnet Mobile net", "Image features", "Attention Network", "Attention Score", "Attended features", "Attention", "Language Decoder", "<SOS>", "Obstacles", "LSTM".
### Key Observations
1. **Modular Design:** The architecture cleanly separates visual feature extraction, attention-based fusion, and language generation.
2. **Attention Mechanism:** The diagram explicitly shows attention being applied at *every* step of the language decoder, allowing the model to focus on different parts of the image when generating each word.
3. **Specific Inputs:** The inclusion of an "Obstacles" input at the second LSTM step is notable. This suggests the model might be designed for a specific task like navigation instruction generation or visual question answering where external knowledge or a specific query is provided.
4. **Feature Extraction:** The use of "Resnet Mobile net" indicates a choice between a deeper (ResNet) or more efficient (MobileNet) convolutional backbone for feature extraction.
5. **Spatial Grounding:** The legend (color coding) is consistent: yellow bars represent feature vectors (both raw image features and attended features), and small yellow squares represent attention scores. The attention mechanism (circle with 'X') is consistently placed between the LSTM hidden state and the image features.
### Interpretation
This diagram represents a **soft attention-based encoder-decoder model** for generating textual descriptions from images. The core innovation highlighted is the dynamic alignment between the generated words and the relevant spatial regions of the image via the attention network.
* **What it demonstrates:** The model learns to "look at" specific parts of an image (e.g., the crosswalk, a building) when producing the corresponding word in a sentence (e.g., "crosswalk", "building"). The attention scores visualize this alignment process.
* **Relationships:** The Image Feature Encoder acts as the "eyes," converting pixels into a semantic feature space. The Language Decoder acts as the "mouth," producing sequential language. The Attention Network is the critical "bridge" or "focus mechanism" that allows the decoder to query the visual features at each step, making the generation process grounded and interpretable.
* **Notable Anomalies/Features:** The explicit "Obstacles" input is the most unique element. It implies this architecture is tailored for a downstream task requiring interaction with a list or description of obstacles, such as generating safe navigation paths for a robot or answering questions about hazards in a scene. This moves it beyond generic image captioning into a more goal-oriented visual reasoning system. The choice of LSTM over a Transformer decoder also suggests a design possibly focused on efficiency or a specific research context prior to the widespread adoption of Transformers.
</details>
Figure 12: The Transformers-based multi-modal deep learning architecture that is being suggested [48]
This research [49] aims to investigate the integration of XAI into autonomous vehicular systems to improve transparency and human trust. It delves into the functioning of multiple inner vehicle modules, emphasizing the importance of understanding the vehicle’s decision-making processes for user credibility and reliability. The main contribution lies in introducing XAI to the domain of autonomous vehicles, showcasing its role in fostering trust, and highlighting advancements through comparative analysis. The output comprises the creation of visual explanatory techniques and an intrusion detection classifier, which show considerable advances over previous work in terms of transparency and safety in autonomous transportation systems.
### 3.3 Applications of XAI for Operations in the Industry
The process industry is a subset of businesses that manufacture items from raw materials (not components) using formulae or recipes. Given the magnitude and dynamic nature of operations in the process sector, it becomes evident that the next great step ahead will be the capacity for people and AI systems to collaborate to ensure production stability and dependability [50]. AI systems must successfully inform the individuals who share the ecosystem about their objectives, intentions, and findings as the first step toward collaboration. We can hope people to work ”with” automation rather than ”around” it, thanks in part to the systematic approach to XAI.
This research [51] focuses on XAI applications in the process industry. The research argues that current AI models are not transparent enough for process industry applications and highlights the need for XAI models that can be understood by human experts. The main contribution is outlining the challenges and research needs for XAI in the process industry. The outcome is to develop XAI models that are safe, reliable, and meet the needs of human users in the process industry.
Table 3: Examples of AI applications in process industry operations, including pertinent data, users, and procedures. (RNN = Recurrent Neural Network; KNN = K-Nearest Neighbor; ANN = Artificial Neural Network; SVM = Support Vector Machine; SVR = Support Vector Regression; RF = Random Forest; IF = Isolation Forest) [51]
| Reference | Relevant Data | End Users | Application | AI Methods |
| --- | --- | --- | --- | --- |
| [52], [53], [54] | Process signals | Operator, Process Engineer, Automation engineer | Process monitoring | RNN, KNN |
| [55], [56], [57] | Process signals, Alarms, Vibration | Process engineer, Automation engineer, Operator, Maintenance engineer | Fault diagnosis | ANN, SVM, Bayes Classifier |
| [58], [59], [60] | Process signals, Acoustic signals | Operator | Event prediction | ANN |
| [61], [62], [63] | Process signals | Operator | Soft sensors | SVR, ANN, RF |
| [64], [65], [66] | Vibration, Process signals | Operator, Maintenance engineer, Scheduler | Predictive maintenance | RNN, IF |
Table 3 shows examples of AI applied to operational activities in the process industry. This table should give an idea of the breadth of use cases, users, relevant data sources, and applicable AI methodologies; however, it is not intended to be a full or systematic examination.
## 4 Future of Trustworthy (XAI)
<details>
<summary>x7.jpg Details</summary>
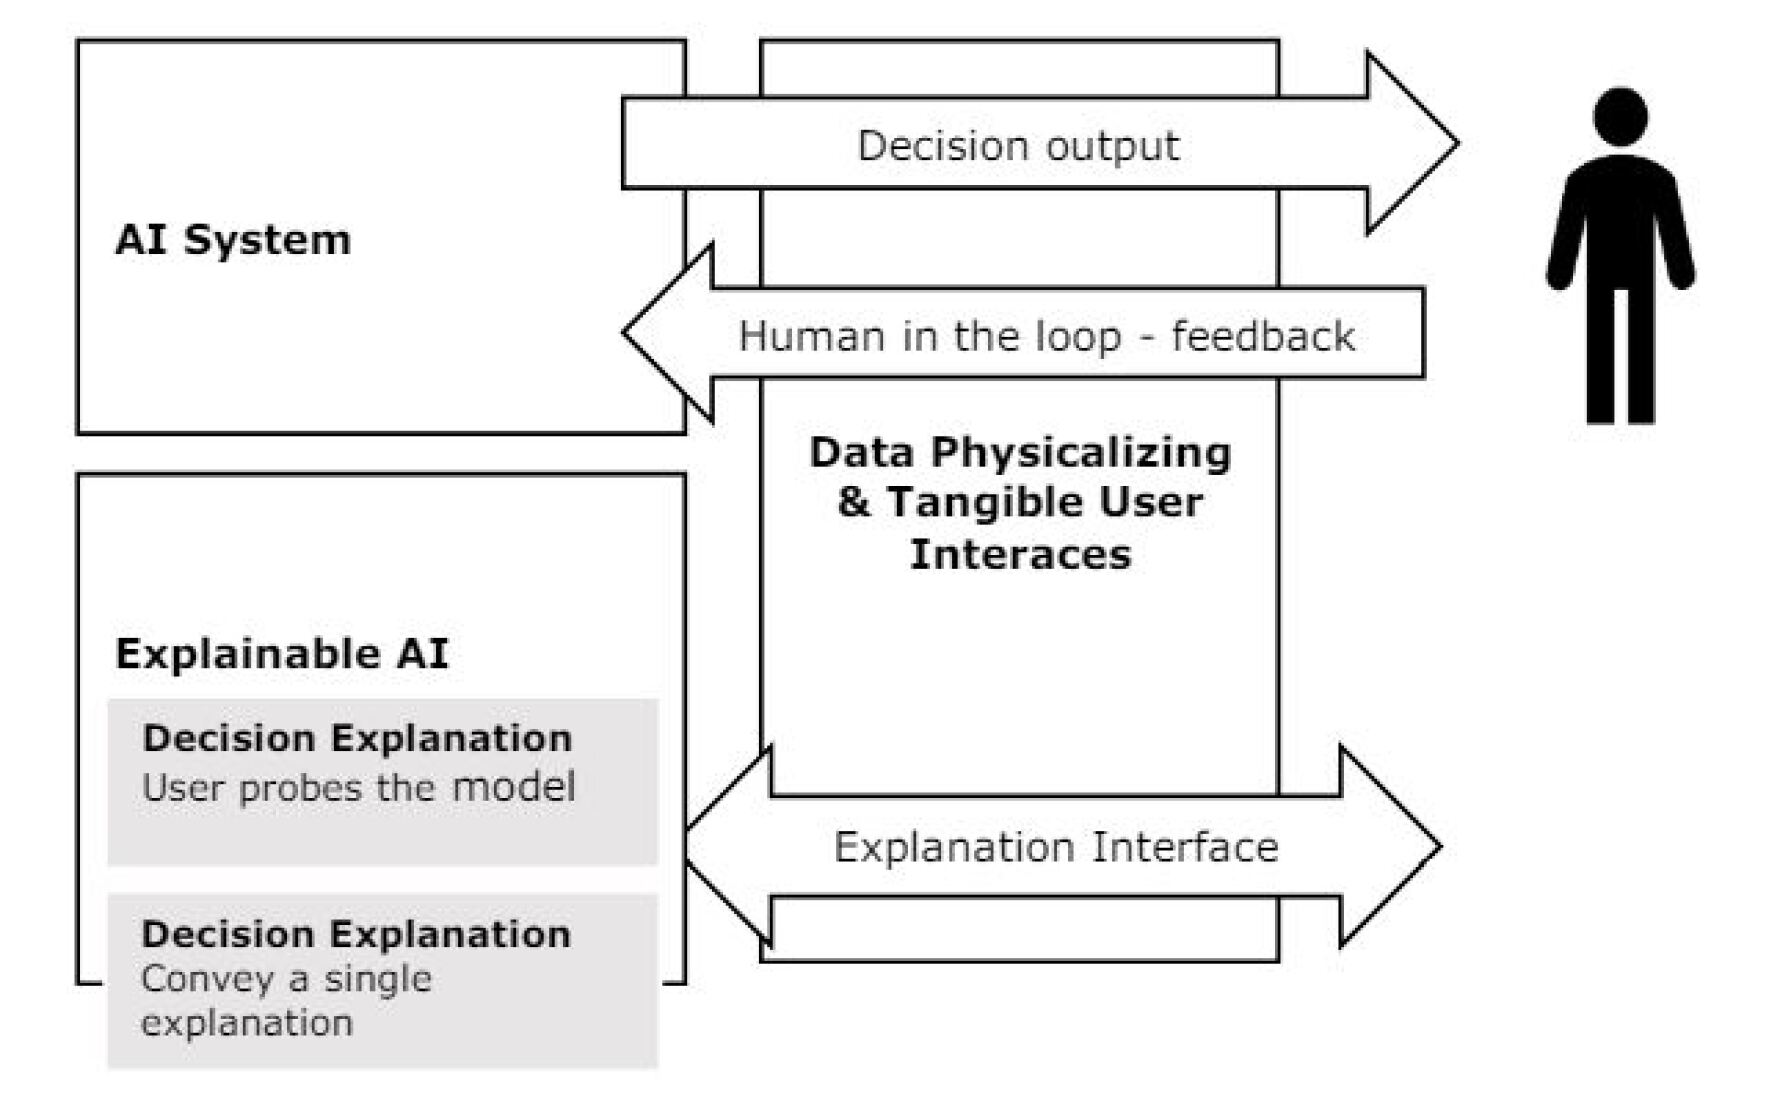
### Visual Description
## Diagram: AI System Interaction with Human via Data Physicalizing Interfaces
### Overview
This diagram illustrates a conceptual model of how an AI system interacts with a human user through a mediating layer called "Data Physicalizing & Tangible User Interfaces." The model emphasizes two primary interaction pathways: one for decision output and feedback, and another for explainability. The diagram is a black-and-white line drawing with text labels and directional arrows.
### Components/Axes
The diagram is composed of several labeled rectangular boxes and directional arrows, organized in a left-to-right flow.
**Left Column (System Components):**
1. **Top Box:** Labeled "AI System".
2. **Bottom Box:** Labeled "Explainable AI". This box contains two nested, gray-shaded sub-boxes:
* Upper sub-box: "Decision Explanation" with subtext "User probes the model".
* Lower sub-box: "Decision Explanation" with subtext "Convey a single explanation".
**Center Column (Interface Layer):**
* A single large box spanning the vertical space between the two left boxes. It is labeled: "Data Physicalizing & Tangible User Interfaces". (Note: "Interfaces" is misspelled as "Interaces" in the image).
**Right Side (User):**
* A simple, black silhouette icon of a standing human figure.
**Arrows (Interaction Flows):**
1. **Top Arrow:** Points from the "AI System" box to the human icon. It is labeled "Decision output".
2. **Middle Arrow:** Points from the human icon back to the "AI System" box. It is labeled "Human in the loop - feedback".
3. **Bottom Arrow:** A double-headed arrow connecting the "Explainable AI" box and the human icon, passing through the central interface box. It is labeled "Explanation Interface".
### Detailed Analysis
The diagram defines a structured interaction loop with distinct pathways:
* **Primary Decision Loop:** The "AI System" generates a "Decision output" that is presented to the human user. The user then provides "Human in the loop - feedback" which flows back to the AI System. This entire exchange is mediated by the "Data Physicalizing & Tangible User Interfaces" layer.
* **Explainability Loop:** A separate, bidirectional channel exists for explainability. The "Explainable AI" component connects to the user via an "Explanation Interface". The two sub-components within "Explainable AI" suggest different modes of explanation: one where the user actively investigates ("User probes the model") and another where the system proactively provides a definitive reason ("Convey a single explanation").
### Key Observations
1. **Central Mediating Layer:** The "Data Physicalizing & Tangible User Interfaces" box is positioned as the essential conduit for *all* interactions between the AI systems (both standard and explainable) and the human user. This suggests the interface's physical or tangible nature is critical to the interaction model.
2. **Dual Explainability Functions:** The "Explainable AI" box explicitly contains two distinct functions for generating explanations, highlighting that explainability is not a single process but can be either user-driven or system-driven.
3. **Directional Flow Clarity:** The arrows clearly demarcate the direction of information flow: output from AI to human, feedback from human to AI, and a bidirectional exchange for explanations.
4. **Spatial Grouping:** The "AI System" and "Explainable AI" are grouped on the left as system-side components, while the human is isolated on the right as the recipient and actor. The interface layer physically and conceptually bridges this gap.
### Interpretation
This diagram presents a framework for human-AI collaboration that prioritizes two key principles: **tangibility** and **explainability**.
* **The Role of Tangibility:** By placing "Data Physicalizing & Tangible User Interfaces" at the center, the model argues that for effective human-AI teaming, data and AI decisions should not remain abstract digital signals. They need to be rendered into physical or tangible forms that humans can intuitively understand and manipulate. This could involve using objects, gestures, or physical controls to represent data and AI states.
* **The Necessity of Explainable AI (XAI):** The dedicated "Explainable AI" component with its own interface underscores that trust and effective collaboration require more than just decisions; they require understanding. The model accommodates both reactive explanations (when a user questions a decision) and proactive explanations (when the system volunteers its reasoning).
* **The Human-in-the-Loop Paradigm:** The explicit "Human in the loop - feedback" arrow confirms this is not a fully autonomous system. The human is an active participant whose feedback is intended to refine or correct the AI system's future outputs, creating a continuous improvement cycle.
In essence, the diagram advocates for a design philosophy where AI systems are built not just to perform tasks, but to communicate and collaborate with humans through intuitive, physical interaction modalities, supported by robust mechanisms for explanation. The misspelling "Interaces" is a minor textual error in the source image.
</details>
Figure 13: Assessing the user’s interaction with XAI [27].
Figure 13 illustrates the precise location of each XAI domain and its relationship with the human user. According to [67], many explanations of AI systems tend to be static and convey only a single message. However, explanations alone do not facilitate true understanding [68]. To enhance comprehension, users should have the ability to explore the system through interactive explanations, as most existing XAI libraries currently lack options for user engagement and explanation customization. This represents a promising avenue for advancing the field of XAI [68] and [67]. Additionally, various efforts have been made to improve human-machine collaboration by moving beyond static explanations.
Explainable AI offers a way to improve how people interact with AI systems. As AI technology grows, it is crucial to ensure that these systems are accountable and transparent. XAI helps by clarifying how AI models work and building trust among users.
We can expect many new developments in XAI. These include making AI models more open, focusing on human-centered designs, ensuring compliance with regulations, and creating hybrid AI systems. XAI will prioritize designs that are easy for users to understand and provide clear explanations. This clarity will help build trust and encourage more people to use AI systems.
Regulatory frameworks are likely to require the use of XAI in important areas to ensure accountability and transparency. Future XAI systems will need to be sensitive to context and provide interactive explanations. This will allow people to engage with AI decisions in real time and adapt to different situations. We must also work to improve digital literacy and tackle ethical issues to ensure that AI systems follow moral principles and society’s values, making XAI technologies accessible to everyone. The success of XAI depends on its ability to bridge the communication gap between AI systems and human users, which encourages cooperation, mutual respect, and trust in an increasingly AI-driven world.
This study [69] offers a thorough analysis of XAI, focusing on two primary areas of inquiry: general XAI difficulties and research directions, as well as ML life cycle phase-based challenges and research directions. In order to shed light on the significance of formalism, customization of explanations, encouraging reliable AI, interdisciplinary partnerships, interpretability-performance trade-offs, and other topics, the study synthesizes important points from the body of existing literature. The primary contribution is the methodical synthesis and analysis of the body of literature to identify important problems and future directions for XAI research [69]. The research offers a thorough review of the current state of XAI research and provides insightful information for future studies and breakthroughs in the area by structuring the debate around general issues and ML life cycle phases. The primary finding of the study is the identification and clarification of 39 important points that cover a range of issues and potential avenues for future XAI research. The importance of conveying data quality, utilizing human expertise in model development, applying rule extraction for interpretability, addressing security concerns, investigating XAI for reinforcement learning and safety, and taking into account the implications of privacy rights in explanation are just a few of the many topics covered by these points. Furthermore, the paper indicates directions for further research and application by highlighting the potential contributions that XAI may make to a number of fields, including digital forensics, IoT, and 5G.
<details>
<summary>x8.jpg Details</summary>
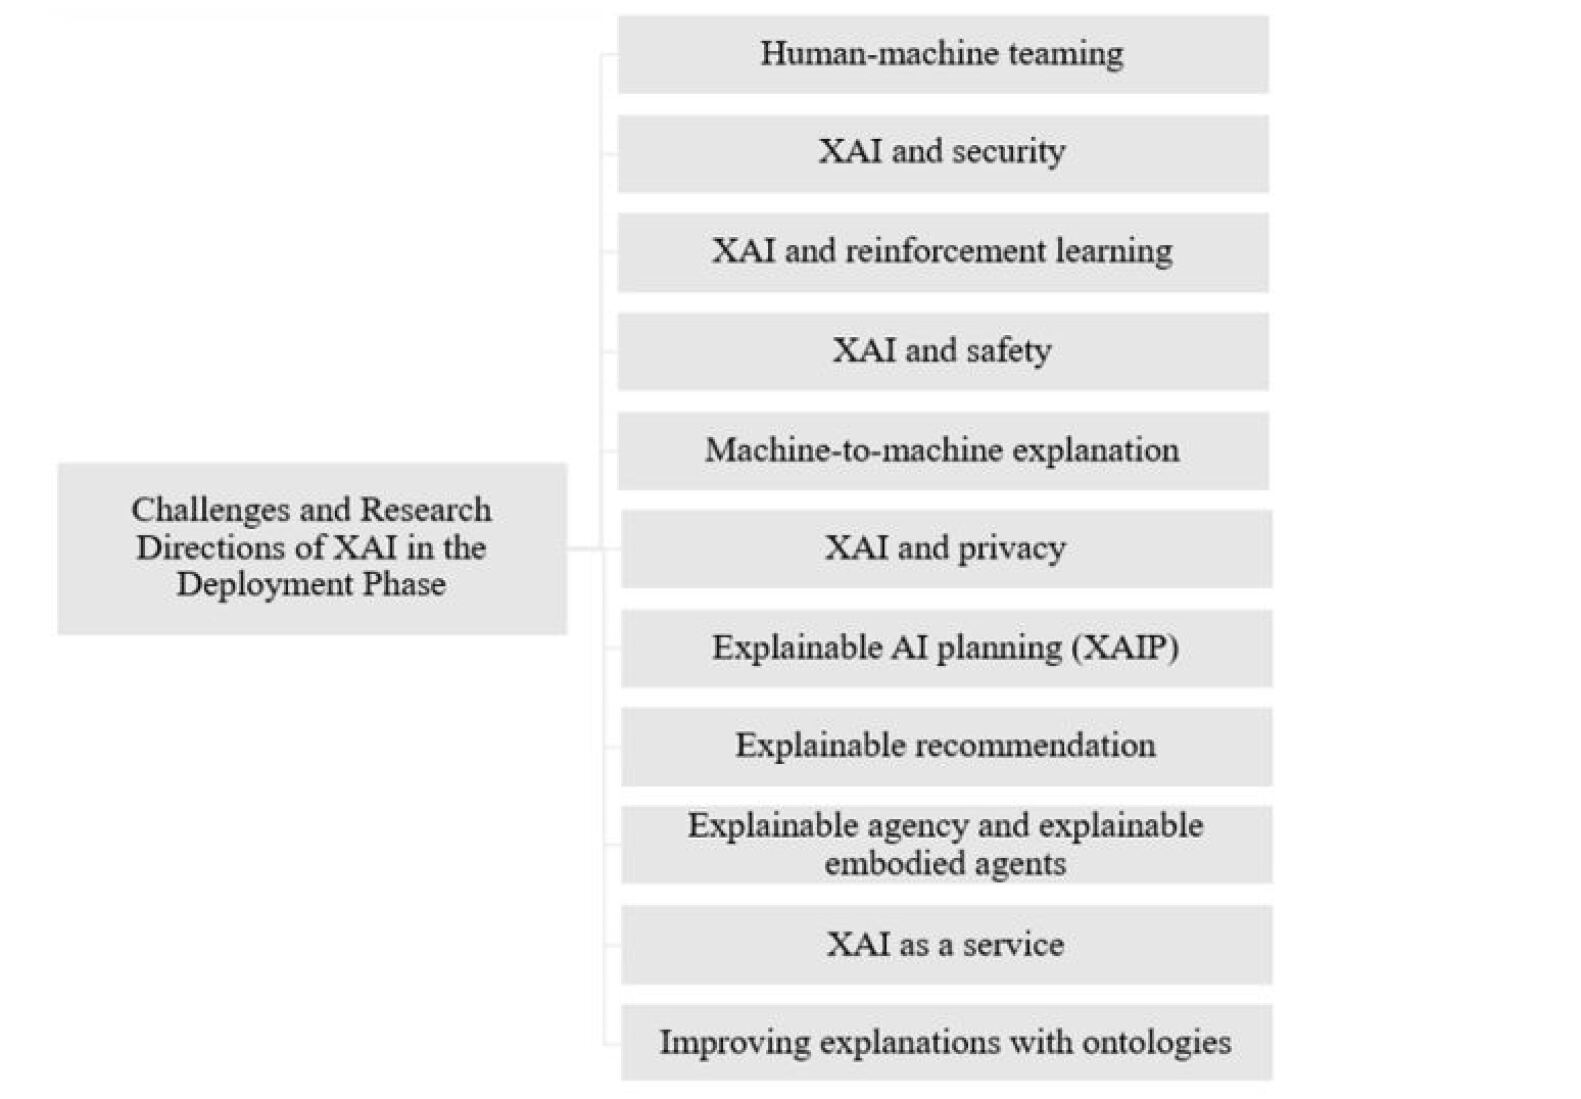
### Visual Description
## Diagram: Challenges and Research Directions of XAI in the Deployment Phase
### Overview
The image is a hierarchical tree diagram illustrating the key challenges and research directions associated with deploying Explainable AI (XAI) systems. It features a central topic on the left, which branches out into a vertical list of specific sub-topics on the right.
### Components/Axes
* **Central Node (Left):** A single rectangular box containing the main title.
* **Branching Nodes (Right):** A vertical column of eleven rectangular boxes, each containing a specific research direction or challenge.
* **Connections:** Thin, gray lines connect the central node to each of the eleven branching nodes, indicating a parent-child relationship.
* **Layout:** The central node is positioned on the left side of the image, vertically centered. The list of branching nodes is aligned to the right, stacked vertically with even spacing. The entire diagram is set against a plain white background.
### Detailed Analysis / Content Details
**Central Node Text:**
* "Challenges and Research Directions of XAI in the Deployment Phase"
**Branching Nodes Text (listed from top to bottom):**
1. Human-machine teaming
2. XAI and security
3. XAI and reinforcement learning
4. XAI and safety
5. Machine-to-machine explanation
6. XAI and privacy
7. Explainable AI planning (XAIP)
8. Explainable recommendation
9. Explainable agency and explainable embodied agents
10. XAI as a service
11. Improving explanations with ontologies
### Key Observations
* The diagram presents a comprehensive, non-hierarchical list of topics. All eleven items are directly connected to the central theme, suggesting they are considered parallel and equally important facets of XAI deployment.
* The topics range from broad, cross-cutting concerns (e.g., security, safety, privacy) to specific technical sub-fields (e.g., reinforcement learning, AI planning, recommendation systems).
* The inclusion of "Human-machine teaming" as the first item highlights the fundamental role of human interaction in XAI.
* The final item, "Improving explanations with ontologies," points to a specific methodological approach for enhancing explanation quality.
### Interpretation
This diagram serves as a conceptual map or taxonomy for the field of XAI when it moves from development to real-world deployment. It suggests that successful deployment is not a single challenge but a multifaceted problem space.
The data (the list of topics) demonstrates that XAI research in the deployment phase must address:
1. **Integration Challenges:** How XAI interacts with and supports other critical system properties like security, safety, and privacy.
2. **Application-Specific Challenges:** Tailoring explanations for different AI paradigms (reinforcement learning, planning) and applications (recommendation, embodied agents).
3. **Interaction Paradigms:** Defining new modes of explanation, such as between machines themselves ("Machine-to-machine explanation") or as a cloud-based utility ("XAI as a service").
4. **Foundational Improvements:** Developing core techniques, like using ontologies, to make explanations more robust and meaningful.
The structure implies that these areas are interconnected. For instance, "Explainable agency" likely relates to "Human-machine teaming," and "XAI and security" could intersect with "XAI and privacy." The diagram provides a framework for organizing research efforts, identifying gaps, and understanding the breadth of considerations necessary to make AI systems transparent, trustworthy, and effective in operational environments.
</details>
Figure 14: Issues and Future Research Paths for XAI throughout its Deployment Stage [69].
Deploying machine learning solutions begins the deployment process and continues until we cease utilizing them, possibly even after that. Figure 14 illustrates the XAI research directions and challenges that were explored for this phase.
## 5 Conclusions
XAI, or Explainable Artificial Intelligence, is becoming important in many industries because it helps solve key challenges with using AI. As AI becomes more common in our daily lives, understanding how it works is essential. XAI provides tools that help people see and understand how AI models make decisions. The main goal of XAI is to make these models easier to understand. It allows people to look inside the ”black box” of AI and see what affects its decisions. The paper gives a clear overview of the key parts of XAI. It also discusses three main areas where XAI can be applied. Finally, the authors talk about the challenges of using XAI and suggest possible future directions.
Acknowledgements
The authors would like to express their sincere gratitude to everyone who encourages and appreciates their scientific work.
## Declarations
Not applicable
## References
- Stephens [2023] Stephens, E.: The mechanical turk: A short history of ‘artificial artificial intelligence’. Cultural Studies 37 (1), 65–87 (2023)
- Kaul et al. [2020] Kaul, V., Enslin, S., Gross, S.A.: History of artificial intelligence in medicine. Gastrointest Endosc 92 (4), 807–812 (2020) https://doi.org/10.1016/j.gie.2020.06.040 . Epub 2020 Jun 18
- Buchanan [2005] Buchanan, B.G.: A (very) brief history of artificial intelligence. Ai Magazine 26 (4), 53–53 (2005)
- Wang et al. [2021] Wang, L., Liu, Z., Liu, A., Tao, F.: Artificial intelligence in product lifecycle management. The International Journal of Advanced Manufacturing Technology 114, 771–796 (2021)
- Shamshiri et al. [2024] Shamshiri, A., Ryu, K.R., Park, J.Y.: Text mining and natural language processing in construction. Automation in Construction 158, 105200 (2024)
- Khang et al. [2024] Khang, A., Abdullayev, V., Litvinova, E., Chumachenko, S., Alyar, A.V., Anh, P.: Application of computer vision (cv) in the healthcare ecosystem. In: Computer Vision and AI-Integrated IoT Technologies in the Medical Ecosystem, pp. 1–16. CRC Press, ??? (2024)
- Vallès-Peris and Domènech [2023] Vallès-Peris, N., Domènech, M.: Caring in the in-between: a proposal to introduce responsible ai and robotics to healthcare. AI & SOCIETY 38 (4), 1685–1695 (2023)
- Biswas et al. [2023] Biswas, A., Abdullah Al, N.M., Ali, M.S., Hossain, I., Ullah, M.A., Talukder, S.: Active learning on medical image. In: Data Driven Approaches on Medical Imaging, pp. 51–67. Springer, ??? (2023)
- Biswas and Islam [2022] Biswas, A., Islam, M.S.: Mri brain tumor classification technique using fuzzy c-means clustering and artificial neural network. In: International Conference on Artificial Intelligence for Smart Community: AISC 2020, 17–18 December, Universiti Teknologi Petronas, Malaysia, pp. 1005–1012 (2022). Springer
- Zohuri and Moghaddam [2020] Zohuri, B., Moghaddam, M.: From business intelligence to artificial intelligence. Journal of Material Sciences & Manufacturing Research. SRC/JMSMR/102 Page 3 (2020)
- Biswas and Islam [2023] Biswas, A., Islam, M.S.: A hybrid deep cnn-svm approach for brain tumor classification. Journal of Information Systems Engineering & Business Intelligence 9 (1) (2023)
- Biswas and Islam [2021] Biswas, A., Islam, M.: Ann-based brain tumor classification: Performance analysis using k-means and fcm clustering with various training functions. In: Explainable Artificial Intelligence for Smart Cities, pp. 83–102. CRC Press, ??? (2021)
- Biswas et al. [2023] Biswas, A., Md Abdullah Al, N., Imran, A., Sejuty, A.T., Fairooz, F., Puppala, S., Talukder, S.: Generative adversarial networks for data augmentation. In: Data Driven Approaches on Medical Imaging, pp. 159–177. Springer, ??? (2023)
- Gong et al. [2023] Gong, T., Zhu, L., Yu, F.R., Tang, T.: Edge intelligence in intelligent transportation systems: A survey. IEEE Transactions on Intelligent Transportation Systems (2023)
- Biswas and Islam [2021] Biswas, A., Islam, M.S.: An efficient cnn model for automated digital handwritten digit classification. Journal of Information Systems Engineering and Business Intelligence 7 (1), 42–55 (2021)
- Malik [2019] Malik, A.: Explainable Intelligence Part 1 - XAI, the Third Wave Of AI. https://www.linkedin.com/pulse/explainable-intelligence-part-1-xai-third-wave-ai-ajay-malik/
- Schoenherr et al. [2023] Schoenherr, J.R., Abbas, R., Michael, K., Rivas, P., Anderson, T.D.: Designing ai using a human-centered approach: Explainability and accuracy toward trustworthiness. IEEE Transactions on Technology and Society 4 (1), 9–23 (2023)
- Chamola et al. [2023] Chamola, V., Hassija, V., Sulthana, A.R., Ghosh, D., Dhingra, D., Sikdar, B.: A review of trustworthy and explainable artificial intelligence (xai). IEEE Access (2023)
- Guleria and Sood [2023] Guleria, P., Sood, M.: Explainable ai and machine learning: performance evaluation and explainability of classifiers on educational data mining inspired career counseling. Education and Information Technologies 28 (1), 1081–1116 (2023)
- Mirzaei et al. [2023] Mirzaei, S., Mao, H., Al-Nima, R.R.O., Woo, W.L.: Explainable ai evaluation: A top-down approach for selecting optimal explanations for black box models. Information 15 (1), 4 (2023)
- Vyas [2023] Vyas, B.: Explainable ai: Assessing methods to make ai systems more transparent and interpretable. International Journal of New Media Studies: International Peer Reviewed Scholarly Indexed Journal 10 (1), 236–242 (2023)
- Wang et al. [2024] Wang, A.Q., Karaman, B.K., Kim, H., Rosenthal, J., Saluja, R., Young, S.I., Sabuncu, M.R.: A framework for interpretability in machine learning for medical imaging. IEEE Access (2024)
- Ghnemat et al. [2023] Ghnemat, R., Alodibat, S., Abu Al-Haija, Q.: Explainable artificial intelligence (xai) for deep learning based medical imaging classification. Journal of Imaging 9 (9), 177 (2023)
- Gohel et al. [2021] Gohel, P., Singh, P., Mohanty, M.: Explainable ai: current status and future directions. arXiv preprint arXiv:2107.07045 (2021)
- Wang and Ding [2024] Wang, P., Ding, H.: The rationality of explanation or human capacity? understanding the impact of explainable artificial intelligence on human-ai trust and decision performance. Information Processing & Management 61 (4), 103732 (2024)
- Herm [2023] Herm, L.-V.: Algorithmic decision-making facilities: Perception and design of explainable ai-based decision support systems. PhD thesis, Universität Würzburg (2023)
- Thalpage [2023] Thalpage, N.: Unlocking the black box: Explainable artificial intelligence (xai) for trust and transparency in ai systems. Journal of Digital Art & Humanities 4 (1), 31–36 (2023)
- Balasubramaniam et al. [2023] Balasubramaniam, N., Kauppinen, M., Rannisto, A., Hiekkanen, K., Kujala, S.: Transparency and explainability of ai systems: From ethical guidelines to requirements. Information and Software Technology 159, 107197 (2023)
- Arrieta and et al. [2020] Arrieta, A.B., al.: Explainable artificial intelligence (XAI): Concepts taxonomies opportunities and challenges toward responsible AI. Inf. Fusion 58, 82–115 (2020)
- McLarney and et al. [2021] McLarney, E., al.: NASA framework for the ethical use of artificial intelligence (AI) (2021)
- Kumar et al. [2020] Kumar, A., Braud, T., Tarkoma, S., Hui, P.: Trustworthy ai in the age of pervasive computing and big data. In: 2020 IEEE International Conference on Pervasive Computing and Communications Workshops (PerCom Workshops), pp. 1–6 (2020). https://doi.org/10.1109/PerComWorkshops48775.2020.9156127
- Guembe et al. [2022] Guembe, B., Azeta, A., Osamor, V., Ekpo, R.: Explainable artificial intelligence, the fourth pillar of zero trust security. Available at SSRN 4331547 (2022)
- Kim et al. [2023] Kim, M., Sohn, H., Choi, S., Kim, S.: Requirements for trustworthy artificial intelligence and its application in healthcare. Healthcare Informatics Research 29 (4), 315 (2023)
- Charmet et al. [2022] Charmet, F., Tanuwidjaja, H.C., Ayoubi, S., Gimenez, P.-F., Han, Y., Jmila, H., Blanc, G., Takahashi, T., Zhang, Z.: Explainable artificial intelligence for cybersecurity: a literature survey. Annals of Telecommunications 77 (11), 789–812 (2022)
- Jiang et al. [2017] Jiang, F., Jiang, Y., Zhi, H., Dong, Y., Li, H., Ma, S., Wang, Y., Dong, Q., Shen, H., Wang, Y.: Artificial intelligence in healthcare: past, present and future. Stroke and vascular neurology 2 (4) (2017)
- Davenport and Kalakota [2019] Davenport, T., Kalakota, R.: The potential for artificial intelligence in healthcare. Future healthcare journal 6 (2), 94 (2019)
- Jaspers et al. [2011] Jaspers, M.W., Smeulers, M., Vermeulen, H., Peute, L.W.: Effects of clinical decision-support systems on practitioner performance and patient outcomes: a synthesis of high-quality systematic review findings. Journal of the American Medical Informatics Association 18 (3), 327–334 (2011)
- Metta et al. [2023] Metta, C., Beretta, A., Guidotti, R., Yin, Y., Gallinari, P., Rinzivillo, S., Giannotti, F.: Improving trust and confidence in medical skin lesion diagnosis through explainable deep learning. International Journal of Data Science and Analytics, 1–13 (2023)
- Akpan et al. [2022] Akpan, A.G., Nkubli, F.B., Ezeano, V.N., Okwor, A.C., Ugwuja, M.C., Offiong, U.: Xai for medical image segmentation in medical decision support systems. Explainable Artificial Intelligence in Medical Decision Support Systems 50, 137 (2022)
- Tosun et al. [2020] Tosun, A.B., Pullara, F., Becich, M.J., Taylor, D.L., Fine, J.L., Chennubhotla, S.C.: Explainable ai (xai) for anatomic pathology. Advances in Anatomic Pathology 27 (4), 241–250 (2020)
- Agrawal et al. [2024] Agrawal, N., Pendharkar, I., Shroff, J., Raghuvanshi, J., Neogi, A., Patil, S., Walambe, R., Kotecha, K.: A-xai: adversarial machine learning for trustable explainability. AI and Ethics, 1–32 (2024)
- Petch et al. [2022] Petch, J., Di, S., Nelson, W.: Opening the black box: the promise and limitations of explainable machine learning in cardiology. Canadian Journal of Cardiology 38 (2), 204–213 (2022)
- Rajpurkar et al. [2022] Rajpurkar, P., Chen, E., Banerjee, O., Topol, E.J.: Ai in health and medicine. Nature medicine 28 (1), 31–38 (2022)
- Atakishiyev et al. [2021] Atakishiyev, S., Salameh, M., Yao, H., Goebel, R.: Explainable artificial intelligence for autonomous driving: A comprehensive overview and field guide for future research directions. arXiv preprint arXiv:2112.11561 (2021)
- Alexandrov [2017] Alexandrov, N.: Explainable ai decisions for human-autonomy interactions. In: 17th AIAA Aviation Technology, Integration, and Operations Conference, p. 3991 (2017)
- Xu et al. [2019] Xu, F., Uszkoreit, H., Du, Y., Fan, W., Zhao, D., Zhu, J.: Explainable ai: A brief survey on history, research areas, approaches and challenges. In: Natural Language Processing and Chinese Computing: 8th CCF International Conference, NLPCC 2019, Dunhuang, China, October 9–14, 2019, Proceedings, Part II 8, pp. 563–574 (2019). Springer
- Yazdanpanah et al. [2021] Yazdanpanah, V., Gerding, E., Stein, S., Dastani, M., Jonker, C.M., Norman, T.: Responsibility research for trustworthy autonomous systems (2021)
- Dong et al. [2023] Dong, J., Chen, S., Miralinaghi, M., Chen, T., Li, P., Labi, S.: Why did the ai make that decision? towards an explainable artificial intelligence (xai) for autonomous driving systems. Transportation research part C: emerging technologies 156, 104358 (2023)
- Madhav and Tyagi [2022] Madhav, A.S., Tyagi, A.K.: Explainable artificial intelligence (xai): connecting artificial decision-making and human trust in autonomous vehicles. In: Proceedings of Third International Conference on Computing, Communications, and Cyber-Security: IC4S 2021, pp. 123–136 (2022). Springer
- Hoffmann et al. [2021] Hoffmann, M.W., Drath, R., Ganz, C.: Proposal for requirements on industrial ai solutions. In: Machine Learning for Cyber Physical Systems: Selected Papers from the International Conference ML4CPS 2020, pp. 63–72 (2021). Springer Berlin Heidelberg
- Kotriwala et al. [2021] Kotriwala, A., Klöpper, B., Dix, M., Gopalakrishnan, G., Ziobro, D., Potschka, A.: Xai for operations in the process industry-applications, theses, and research directions. In: AAAI Spring Symposium: Combining Machine Learning with Knowledge Engineering, pp. 1–12 (2021)
- Mamandipoor et al. [2020] Mamandipoor, B., Majd, M., Sheikhalishahi, S., Modena, C., Osmani, V.: Monitoring and detecting faults in wastewater treatment plants using deep learning. Environmental Monitoring and Assessment 192 (3), 148 (2020)
- Cecílio et al. [2014] Cecílio, I., Ottewill, J., Pretlove, J., Thornhill, N.: Nearest neighbors method for detecting transient disturbances in process and electromechanical systems. Journal of Process Control 24, 1382–1393 (2014)
- Banjanovic-Mehmedovic et al. [2017] Banjanovic-Mehmedovic, L., Hajdarevic, A., Kantardzic, M., Mehmedovic, F., Dzananovic, I.: Neural network-based data-driven modelling of anomaly detection in thermal power plant. Automatika: časopis za automatiku, mjerenje, elektroniku, računarstvo i komunikacije 58, 69–79 (2017)
- Ruiz et al. [2001] Ruiz, D., Canton, J., Nougués, J., Espuna, A., Puigjaner, L.: On-line fault diagnosis system support for reactive scheduling in multipurpose batch chemical plants. Computers & Chemical Engineering 25, 829–837 (2001)
- Yélamos et al. [2007] Yélamos, I., Graells, M., Puigjaner, L., Escudero, G.: Simultaneous fault diagnosis in chemical plants using a multilabel approach. AIChE Journal 53, 2871–2884 (2007)
- Lucke et al. [2020] Lucke, M., Stief, A., Chioua, M., Ottewill, J., Thornhill, N.: Fault detection and identification combining process measurements and statistical alarms. Control Engineering Practice 94, 104195 (2020)
- Dorgo et al. [2018] Dorgo, G., Pigler, P., Haragovics, M., Abonyi, J.: Learning operation strategies from alarm management systems by temporal pattern mining and deep learning. Computer Aided Chemical Engineering 43, 1003–1008 (2018)
- Giuliani et al. [2019] Giuliani, M., Camarda, G., Montini, M., Cadei, L., Bianco, A., Shokry, A., Baraldi, P., Zio, E., et al.: Flaring events prediction and prevention through advanced big data analytics and machine learning algorithms. In: Offshore Mediterranean Conference and Exhibition (2019). Offshore Mediterranean Conference
- Carter and Briens [2018] Carter, A., Briens, L.: An application of deep learning to detect process upset during pharmaceutical manufacturing using passive acoustic emissions. International journal of pharmaceutics 552, 235–240 (2018)
- Desai et al. [2006] Desai, K., Badhe, Y., Tambe, S., Kulkarni, B.: Soft-sensor development for fed-batch bioreactors using support vector regression. Biochemical Engineering Journal 27, 225–239 (2006)
- Shang et al. [2014] Shang, C., Yang, F., Huang, D., Lyu, W.: Data-driven soft sensor development based on deep learning technique. Journal of Process Control 24, 223–233 (2014)
- Napier and Aldrich [2017] Napier, L., Aldrich, C.: An isamill™ soft sensor based on random forests and principal component analysis. IFAC-PapersOnLine 50, 1175–1180 (2017)
- Amihai et al. [2018a] Amihai, I., Gitzel, R., Kotriwala, A., Pareschi, D., Subbiah, S., Sosale, G.: An industrial case study using vibration data and machine learning to predict asset health. In: 2018 IEEE 20th Conference on Business Informatics (CBI), vol. 1, pp. 178–185 (2018). IEEE
- Amihai et al. [2018b] Amihai, I., Chioua, M., Gitzel, R., Kotriwala, A., Pareschi, D., Sosale, G., Subbiah, S.: Modeling machine health using gated recurrent units with entity embeddings and k-means clustering. In: 2018 IEEE 16th International Conference on Industrial Informatics (INDIN), pp. 212–217 (2018). IEEE
- Kolokas et al. [2020] Kolokas, N., Vafeiadis, T., Ioannidis, D., Tzovaras, D.: Fault prognostics in industrial domains using unsupervised machine learning classifiers. Simulation Modelling Practice and Theory, 102109 (2020)
- Abdul et al. [2018] Abdul, A., Vermeulen, J., Wang, D., Lim, B.-Y., Kankanhalli, M.: Trends and trajectories for explainable, accountable and intelligible systems: An hci research agenda. In: Proceedings of the 2018 CHI Conference on Human Factors in Computing Systems, New York, NY, USA, pp. 1–18 (2018). Association for Computing Machinery
- Adadi and Berrada [2018] Adadi, A., Berrada, M.: Peeking inside the black-box: A survey on explainable artificial intelligence (xai). IEEE Access 6, 52138–52160 (2018) https://doi.org/10.1109/ACCESS.2018.2870052
- Saeed and Omlin [2023] Saeed, W., Omlin, C.: Explainable ai (xai): A systematic meta-survey of current challenges and future opportunities. Knowledge-Based Systems 263, 110273 (2023)