# Inferring Functionality of Attention Heads from their Parameters
**Authors**:
- Amit Elhelo Mor Geva (Blavatnik School of Computer Science, Tel Aviv University)
Abstract
Attention heads are one of the building blocks of large language models (LLMs). Prior work on investigating their operation mostly focused on analyzing their behavior during inference for specific circuits or tasks. In this work, we seek a comprehensive mapping of the operations they implement in a model. We propose MAPS (Mapping Attention head ParameterS), an efficient framework that infers the functionality of attention heads from their parameters, without any model training or inference. We showcase the utility of MAPS for answering two types of questions: (a) given a predefined operation, mapping how strongly heads across the model implement it, and (b) given an attention head, inferring its salient functionality. Evaluating MAPS on 20 operations across 6 popular LLMs shows its estimations correlate with the head’s outputs during inference and are causally linked to the model’s predictions. Moreover, its mappings reveal attention heads of certain operations that were overlooked in previous studies, and valuable insights on function universality and architecture biases in LLMs. Next, we present an automatic pipeline and analysis that leverage MAPS to characterize the salient operations of a given head. Our pipeline produces plausible operation descriptions for most heads, as assessed by human judgment, while revealing diverse operations. We release our code and mappings at https://github.com/amitelhelo/MAPS.
Inferring Functionality of Attention Heads from their Parameters
Amit Elhelo Mor Geva Blavatnik School of Computer Science, Tel Aviv University {amitelhelw@mail,morgeva@tauex}.tau.ac.il
1 Introduction
<details>
<summary>x1.png Details</summary>
### Visual Description
\n
## Diagram: Multi-head Attention Layer and Token Mapping Analysis
### Overview
The image is a diagram illustrating the process of inferring functionality within a multi-head attention layer by analyzing mappings between tokens. It depicts a multi-head attention layer, parameter projection to a vocabulary, and two methods for evaluating the layer's operation: mapping countries to capitals and name variations. The diagram uses a grid-based visualization to represent these mappings, with color intensity indicating the strength of the association.
### Components/Axes
The diagram consists of the following components:
* **Multi-head attention layer:** Represented as a rectangular block with input and output arrows. Inside the block are labeled matrices: W<sub>VQ</sub><sup>1</sup>, W<sub>QK</sub><sup>1</sup>, W<sub>VQ</sub><sup>n</sup>, W<sub>QK</sub><sup>n</sup>. A magnifying glass highlights a portion of the layer.
* **Projecting parameters to the vocabulary:** A grid of cells representing the vocabulary, with a highlighted cell labeled "M". The grid is labeled "|V|" on both axes.
* **Inferring functionality by analyzing mappings between tokens:** A descriptive label for the lower portion of the diagram.
* **A: Evaluating the head's implementation of a predefined operation:** A label for the "Country to capital" mapping grid.
* **B: Inspecting the head's salient operations:** A label for the "Name variations" mapping grid.
* **Country to capital grid:** A 3x3 grid with rows labeled "France", "Germany", and "Egypt", and columns labeled "Cairo", "Paris", and "Berlin".
* **Name variations grid:** A 2x3 grid with rows labeled "Tomas" and "Donna", and columns labeled "tommi", "Don", and "Tom".
* **Association Strength Indicators:** Color intensity within the grids represents the strength of the association between tokens.
* **Association Scores:** "0.7" is displayed below the "Country to capital" grid, and "0.9" is displayed below the "Name variations" grid.
### Detailed Analysis or Content Details
**Multi-head Attention Layer:**
* The layer contains matrices labeled W<sub>VQ</sub><sup>1</sup>, W<sub>QK</sub><sup>1</sup>, W<sub>VQ</sub><sup>n</sup>, and W<sub>QK</sub><sup>n</sup>. These likely represent weight matrices for query, key, and value transformations within the attention mechanism. The superscript 'n' suggests multiple heads.
* The magnifying glass focuses on a portion of the layer, implying detailed inspection of specific weights.
**Projecting Parameters to the Vocabulary:**
* The grid represents the vocabulary space, with dimensions labeled "|V|". The size of the grid is approximately 8x8.
* The cell labeled "M" is highlighted, potentially indicating a specific token or parameter of interest.
**Country to Capital Mapping (A):**
* The grid shows associations between countries and their capitals.
* France - Paris: Strong association (dark yellow).
* France - Cairo: Weak association (light yellow).
* France - Berlin: Weak association (light yellow).
* Germany - Cairo: Weak association (light yellow).
* Germany - Paris: Weak association (light yellow).
* Germany - Berlin: Strong association (dark yellow).
* Egypt - Cairo: Strong association (dark yellow).
* Egypt - Paris: Weak association (light yellow).
* Egypt - Berlin: Weak association (light yellow).
* The overall association score is 0.7.
**Name Variations Mapping (B):**
* The grid shows associations between name variations.
* Tomas - tommi: Strong association (dark yellow).
* Tomas - Don: Weak association (light yellow).
* Tomas - Tom: Weak association (light yellow).
* Donna - tommi: Weak association (light yellow).
* Donna - Don: Strong association (dark yellow).
* Donna - Tom: Weak association (light yellow).
* The overall association score is 0.9.
### Key Observations
* The "Name variations" mapping (0.9) has a higher association score than the "Country to capital" mapping (0.7), suggesting the attention head is better at capturing relationships between name variations.
* The grids use a color gradient to represent the strength of the association, with darker yellow indicating a stronger relationship.
* The multi-head attention layer is depicted as a complex component with multiple weight matrices.
### Interpretation
The diagram illustrates a method for understanding the internal workings of a multi-head attention layer. By analyzing how the layer maps tokens (countries to capitals, name variations), researchers can infer the functionality and salient operations of the layer. The higher association score for name variations suggests that the attention head may be particularly sensitive to subtle differences in names. The use of grid-based visualizations allows for a clear and intuitive representation of these mappings. The diagram highlights the importance of examining the internal representations learned by attention mechanisms to gain insights into their behavior. The "M" in the vocabulary projection could represent a key parameter or token that the attention head focuses on. The overall goal is to move beyond treating attention layers as "black boxes" and to develop a deeper understanding of their internal logic.
</details>
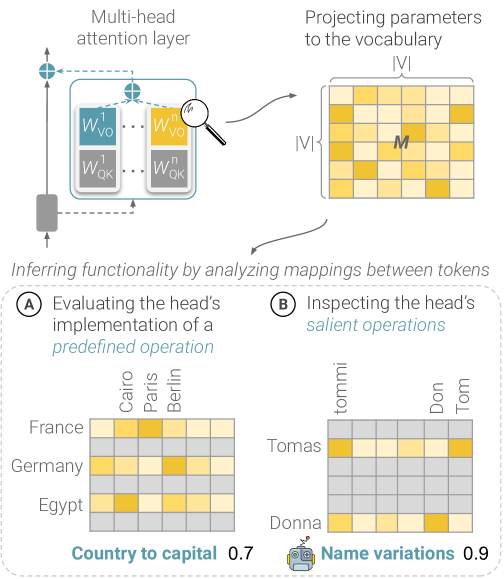
Figure 1: Illustration of MAPS, a framework for inferring the functionality of attention heads in LLMs from their parameters. MAPS casts the head as a matrix $M$ which assigns a score for every pair of tokens in the model’s vocabulary. Then, it considers groups of token pairs (sub-matrices in $M$ ) to measure how strongly the head implements a given operation (A) and to inspect the head’s salient operations (B).
Attention heads play a key role in modern large language models (LLMs) (Vaswani et al., 2017; Zhou et al., 2024; Olsson et al., 2022). Numerous studies (Zheng et al., 2024; Ferrando et al., 2024) have explored their functionality, typically by analyzing their attention patterns or outputs during inference for certain inputs or tasks.
However, relying on the model’s behavior for certain inputs has drawbacks. First, this approach may overlook some of the functions implemented by the head, as heads can exhibit different behaviors for different inputs (Gould et al., 2024; Merullo et al., 2024a; Olsson et al., 2022; Kissane et al., 2024). Second, a comprehensive analysis of the head’s operation would require executing the model over numerous inputs, potentially the whole training corpus, which involves a high computational cost and could be impossible when the data is unavailable. Last, analyzing the examples that activate the head is often non-trivial and could be misleading (Bolukbasi et al., 2021; Gao et al., 2024; Kissane et al., 2024).
In this work, we consider a different approach to this problem, where our goal is to infer the functionality of attention heads directly from their parameters and without executing the model. To this end, we leverage the approach of interpreting model parameters in the vocabulary space (Geva et al., 2021, 2022; Katz et al., 2024). Specifically, we build on the formulation by Elhage et al. (2021); Dar et al. (2023), who cast the attention head as a matrix $M$ , where each entry is a mapping score between two tokens. While this approach has been shown effective in identifying heads with certain operations, so far its usage has been limited to studying specific heads in detected circuits Wang et al. (2023); McDougall et al. (2024) or a single operation Gould et al. (2024).
Here, we scale this interpretation approach into a general framework, called MAPS (Mapping Attention heads ParameterS), which enables answering two types of basic questions: (a) given a predefined operation, mapping how strongly different heads across the model implement it, and (b) given an attention head, inferring its prominent operations. This is done by considering patterns across groups of mappings in $M$ , as illustrated in Figure 1. Predefined relations signify groups of mappings expressing a certain relation (e.g. city of a country or pronoun resolving). Salient operations consist of subsets of mappings for which the head induces the most prominent effect. In addition, analyzing simple statistics of these mappings provides insights into how global or specific its operation is.
We evaluate our framework on 6 popular LLMs and 20 predefined relations of 4 categories – knowledge, language, algorithmic, and translation. Experiments show that estimations by MAPS strongly correlate with the head outputs during inference. Moreover, causally removing all the heads implementing a certain operation substantially impairs the model’s ability to answer queries requiring this operation, compared to removing other heads.
Analysis of the obtained mappings shows that, across all models, MAPS detects relation heads mostly in the middle and upper layers, while revealing universality patterns for several relations. Moreover, it demonstrates how the model’s architecture introduces biases in function encoding. Smaller models tend to encode higher numbers of relations on a single head, and in Llama-3.1 models, which use grouped-query attention, grouped attention heads often implement the same or similar relations. Notably, MAPS successfully detected previously identified heads of specific operations, while discovering additional heads of similar operations not reported before.
Next, we demonstrate the utility of MAPS for inferring the prominent operations of a given head. We consider the head’s salient mappings in $M$ and use GPT-4o Hurst et al. (2024) to automatically describe the functionality they exhibit. Applying this procedure to GPT-2 xl and Pythia 6.9B, we map the prominent operations of 62% of their heads and 60%-96% of those in the middle and upper layers. Qualitative analysis shows semantic, linguistic, and algorithmic operations and reveals novel operations, such as the extension of time periods (day->month;month->year). A human study shows that our automated pipeline performs reasonably well, and GPT-4o reliably detects observable operations.
To conclude, we introduce MAPS, an efficient framework for inferring attention heads’ functionality from their parameters. We showcase the utility of MAPS in systematically mapping a certain functionality across the model and automatically characterizing the salient operations of a given head. Estimations by MAPS correlate with the head’s outputs and are faithful to the model’s behavior, and provide valuable insights on architecture biases and universality of head operations in LLMs.
2 Preliminaries and Notation
We assume a transformer-based LM with a hidden dimension $d$ , $L$ layers, $H$ attention heads per layer, a vocabulary $\mathcal{V}$ , an embedding matrix $E∈\mathbb{R}^{|\mathcal{V}|× d}$ , and an unembedding matrix $U∈\mathbb{R}^{d×|\mathcal{V}|}$ .
Attention heads as interaction matrices
We use the formulation by Elhage et al. (2021) and view an attention head as two “interaction” matrices $W_{QK},W_{VO}∈\mathbb{R}^{d× d}$ . Given a sequence of $n$ hidden states $X∈\mathbb{R}^{n× d}$ , the matrix $W_{QK}$ computes the query-key scores to produce an attention weights matrix $A∈\mathbb{R}^{n× n}$ :
$$
A=\text{softmax}\Bigg{(}\frac{X(W_{QK})X^{T}}{\sqrt{d/H}}\Bigg{)}
$$
The matrix $W_{VO}$ operates on the contextualized hidden states according to $A$ , namely $\tilde{X}=AX$ , and produces the head’s output $Y∈\mathbb{R}^{n× d}$ :
$$
Y=\tilde{X}W_{VO} \tag{1}
$$
The matrix $W_{QK}$ can be viewed as “reading” from the residual stream, and $W_{VO}$ can be viewed as the “writing” component. Notably, this formulation omits the bias terms of the head.
Interpreting attention heads in embedding space
Recent works have analyzed the operation of different components in transformers through projection to the model’s vocabulary space (nostalgebraist, 2020; Geva et al., 2021, 2022; Dar et al., 2023; Katz et al., 2024). Specifically, Elhage et al. (2021); Dar et al. (2023) interpret each of the attention head matrices – $W_{QK}$ and $W_{VO}$ – as a matrix that maps between pairs of tokens from the vocabulary. Considering $W_{VO}$ , it is interpreted via multiplication from both sides with the model’s embedding matrix: ${\tilde{M}=E(W_{VO})E^{T}∈\mathbb{R}^{|\mathcal{V}|×|\mathcal{V}|}}$ . Each entry in $\tilde{M}$ is viewed as a mapping score between source and target tokens ${s,t∈\mathcal{V}}$ based on $W_{VO}$ , which signifies how strongly the head promotes it in its outputs. Elhage et al. (2021) suggested that when the weights of $E$ and $U$ are not tied, a more faithful interpretation can be obtained by:
$$
M=E(W_{VO})U
$$
Other notable variations include applying the model’s first MLP layer to the embedding matrix $E$ (Gould et al., 2024) and the final layer norm on rows of $E(W_{VO})$ (Wang et al., 2023).
3 MAPS
Based on the above view, we propose a general framework, called MAPS, for inferring the functionality of attention heads in LLMs directly from their parameters. We focus on analyzing the $W_{VO}$ component of the head, which produces the head’s output to the residual stream, and make the following observations. First, the $i$ -th row of $M$ provides the scores for mappings from the $i$ -th token to any token in $\mathcal{V}$ . Similarly, the $j$ -th column of $M$ provides scores for mappings from any token in $\mathcal{V}$ to the $j$ -th token. Therefore, considering the scores of certain submatrices of $M$ may reveal how the attention head operates on different sets of inputs. For example, analyzing the rows corresponding to tokens representing countries may reveal general knowledge-related operations implemented by the head, and attention heads that copy certain tokens should have diagonal-like submatrices in $M$ .
An important question that arises is which parts of $M$ to consider in order to identify the head’s functionality. In principle, there are $2^{|\mathcal{V}|}$ different subsets of rows that can be considered, which would be infeasible to traverse with $|\mathcal{V}|=\mathcal{O}(10K)$ in typical LLMs. Here, we propose two complementary ways to approach this, described next.
3.1 Predefined Relations
One intuitive approach is to define a set of possible operations that can be realized through pairs of tokens, and then measure the extent to which the head implements each operation. For example, the operation of mapping a country to its capital can be realized through a set of token pairs expressing that relation, e.g. (France, Paris) or (Egypt, Cairo). Similarly, mapping between synonyms can be realized via pairs such as (talk, speak) and (fast, quick). Such operations can be viewed as an implementation of relations between tokens.
Let $R$ be a predefined relation and $\mathcal{D}_{R}$ a dataset of token pairs expressing $R$ . Also, denote by $\mathbf{m}_{i}∈\mathbb{R}^{|\mathcal{V}|}$ the $i$ -th row of $M$ (corresponding to the mapping scores of the $i$ -th token), and by $\texttt{topk}(\mathbf{m}_{i})$ the $k$ tokens with the highest scores in $\mathbf{m}_{i}$ . The extent to which an attention head, interpreted as the matrix $M$ , implements $R$ can be measured as the portion of pairs $(s,t)∈\mathcal{D}_{R}$ where $t$ is in the top-scoring tokens in $\mathbf{m}_{s}$ :
$$
\phi_{R}(M):=\frac{1}{|\mathcal{D}_{R}|}\sum_{(s,t)\in\mathcal{D}_{R}}\mathds{%
1}[t\in\texttt{topk}(\mathbf{m}_{s})] \tag{2}
$$
For instance, the score for $R=$ ‘‘country to capital’’ reflects how often the head promotes the capital city of a country in its output when operating on an input representation of that country.
Notably, our formulation also supports suppression operations observed in previous work (Wang et al., 2023; Gould et al., 2024; McDougall et al., 2024), where certain attention heads suppress certain concepts or outputs during inference. Representing a suppressive relation is done by defining the pairs $(s,t)$ as before and considering the top-scoring tokens in $-\mathbf{m}_{s}$ instead of $\mathbf{m}_{s}$ .
3.2 Salient Operations
The main limitation of the above approach is that it could miss certain relations that heads implement. A complementary approach would be to characterize the head’s functionality from prominent mappings appearing in $M$ . Dar et al. (2023) tackled this by considering the top-scoring mappings in $M$ . However, we recognize two drawbacks in this method: (a) the scores in $M$ are influenced by the token embedding norms, which could bias the top scores towards mappings of tokens with high embedding norms, and (b) the top entries in $M$ may cover mapping from a small number of tokens (e.g., from a single row), thus describing the head’s functionality for only a few tokens.
Here, we propose a more holistic approach to identify salient mappings in $M$ , by first identifying the tokens on which the head’s operation is most prominent, and then considering the top-scoring mappings for these tokens. We measure how prominent the head’s operation on a token $t∈\mathcal{V}$ via the ratio of the token’s embedding norm after multiplying by $W_{VO}$ to the norm before this transformation:
$$
\sigma_{t}(W_{VO}):=\frac{||\mathbf{e}_{t}W_{VO}||}{||\mathbf{e}_{t}||} \tag{3}
$$
Comparing the sets of top versus salient mappings indeed shows substantial differences. The average Jaccard similarity of the sets obtained for heads in GPT-2 xl is 0.01. In the next sections, we experiment with both approaches, showing their effectiveness in inferring attention head functionality in multiple LLMs.
4 Mapping Predefined Relations
In this section, we utilize MAPS to map how strongly attention heads implement various operations in multiple LLMs (§ 4.1). We assess the correctness and generalization of these estimations via correlative and causal experiments (§ 4.2, § 4.3) and analyze prominent trends (§ 4.4).
4.1 Experimental Setup
Datasets
We construct datasets for 20 relations of four categories: algorithmic (e.g., word to first letter), knowledge (e.g., country to capital), linguistic (e.g., adjective to comparative), and translation (English to French/Spanish), and 3 vocabularies of widely-used model families. For every relation, we collect pairs of strings expressing it. For instance, possible pairs for the relation word-to-compound are (hot, hotdog) and (wall, wallpaper). Data is obtained from previously published datasets and online sources and further augmented by querying ChatGPT to generate example pairs, which we (authors) manually validated. Then, we tokenize the pairs with each of the tokenizers of Llama-3.1 Dubey et al. (2024), Pythia Biderman et al. (2023) GPT Radford et al. (2019) and Phi-2 Javaheripi and Bubeck (2023), keeping only cases where the resulting mapping is between single tokens. Experimenting with different tokenizers is important as MAPS leverages the model’s vocabulary. Llama-3.1’s vocabulary has $\sim$ 130k tokens compared to $\sim$ 50k tokens for GPT-2, Phi-2, and Pythia. For more details on the collection, dataset statistics, and examples, see § A.
Models
We analyze models of various sizes from different families: Llama-3.1 8B and 70B Dubey et al. (2024), Pythia 6.9B and 12B Biderman et al. (2023), Phi-2 Javaheripi and Bubeck (2023), and GPT-2 xl Radford et al. (2019). These models have varying numbers of layers and attention heads, from 32 layers and 32 heads in Pythia 6.9B to 80 layers and 64 heads in Llama-3.1 70B. Additionally, Llama-3.1 uses grouped-query attention Ainslie et al. (2023), versus the other models which use multi-head attention Vaswani et al. (2017).
Measuring predefined relations
For every attention head and relation $R$ , we derive the matrix $M$ and calculate the relation score $\phi_{R}(M)$ (Eq. 2). We also compute the score for the suppressive variant $\bar{R}$ of every relation $R$ . For example, the suppressive variant of $R=\texttt{country to capital}$ corresponds to the operation of suppressing the capital of a given country.
We follow previous works (Dar et al., 2023; Geva et al., 2021, 2022) and set low $k$ values to reflect strong prioritization of the target token in the head’s output. For Pythia, Phi-2 and GPT-2, we use $k=1$ for the copying and name-copying relations and $k=10$ for other relations. For the Llama-3.1 models, we set $k=3$ for copying and name-copying and $k=25$ for other relations. The bigger values for Llama-3.1 are due to their large vocabulary, which allows expressing a concept with more tokens. The smaller values for the copying relations are for measuring them more strictly. For further discussion on this selection, see § A.
To classify whether a head “implements” a relation $R$ , we apply a threshold $\tau$ to $\phi_{R}(M)$ . Namely, if $t$ appears in the top- $k$ mappings of $s$ for $\tau$ percent of the pairs $(s,t)∈\mathcal{D}_{R}$ , then we consider the head as implementing $R$ . We choose a threshold of $\tau=15\%$ after experimenting with different thresholds and comparing against randomly initialized heads (see § A for details).
4.2 Evaluation of Functionality Estimation
We evaluate whether the functionality estimations by MAPS faithfully describe the operations of the heads during inference. Our experiments show that the estimated operation of a head strongly correlates with its outputs and demonstrates the expected causal effect on the model’s generation.
Experiment 1: Correlation with head outputs
For every relation $R$ and source-target pair $(s,t)∈\mathcal{D}_{R}$ , we evaluate the model using four prompt templates (provided in § B.1). One representative template is: We do not simply feed in $s$ as input to avoid potential biases from the attention sink phenomenon Xiao et al. (2024).
$$
\mathcal{P}_{s}:=\texttt{``This is a document about $\langle$s$\rangle$''}
$$
Where $\langle\texttt{s}\rangle$ is the string of the source token $s$ . For example, for the pair (England, London), we will have ‘‘This is a document about England’’. Next, we obtain the output $\mathbf{y}_{s}∈\mathbb{R}^{d}$ of every attention head at the last position (corresponding to $s$ ), Here the head outputs include the bias term of $W_{V}$ , see § B.1. and project it to the model’s vocabulary space, i.e. $\mathbf{y}_{s}U∈\mathbb{R}^{|\mathcal{V}|}$ . The top-scoring tokens in the resulting vector are those promoted by the head given the prompt $\mathcal{P}_{s}$ Geva et al. (2022). To check whether the head implements the relation $R$ , namely promote $t$ when given $s$ in the input, we test for every pair $(s,t)$ whether $t$ appears in the top $k$ tokens in $\mathbf{y}_{s}U$ . We use the same $k$ values specified in § 4.1. Concretely, for every head $h$ we compute the following score, which represents how strongly the head implements $R$ during inference:
$$
\phi^{*}_{R}(h):=\frac{1}{|\mathcal{D}_{R}|}\sum_{(s,t)\in\mathcal{D}_{R}}%
\mathds{1}[t\in\texttt{topk}(\mathbf{y}_{s}U)] \tag{4}
$$
We check the correlation between the static score $\phi_{R}(h)$ inferred by our method and the dynamic score $\phi^{*}_{R}(h)$ computed separately for each of the four templates. As a baseline, we compute $\phi^{*}_{R}(h)$ while restricting the attention in $h$ from $s$ to be only to itself. This emulates an operation of the head as if it fully attends to the representation of $s$ .
Results
Table 1 shows the results for Llama-3.1 8B. For the vast majority of relations, we observe a strong to very strong correlation of 0.71-0.95 Schober et al. (2018) when the query’s subject is not contextualized. This high correlation often remains or even increases when considering the head’s outputs for contextualized inputs. This shows that MAPS well-estimates the head’s behavior for task-related inputs. Still, for some relations (e.g. word to compound and word to last letter) correlation is lower for contextualized inputs, demonstrating that in some cases, the head may switch its operation depending on the context. This agrees with the observation that heads often implement multiple operations (§ 4.4). Results for other models are in § B.1, generally exhibiting similar trends, though with occasional larger drops in the contextualized setting for Pythia and GPT-2 xl.
| Category | Relation | Correlation w/o context. | Correlation w/ context. |
| --- | --- | --- | --- |
| Algorithmic | Copying | 0.76 | 0.73 |
| Name copying | 0.95 | 0.95 | |
| Word to first letter | 0.90 | 0.78 | |
| Word to last letter | 0.67 | 0.36 | |
| Knowledge | Country to capital | 0.85 | 0.85 |
| Country to language | 0.76 | 0.62 | |
| Object to superclass | 0.74 | 0.73 | |
| Product by company | 0.46 | 0.49 | |
| Work to location | 0.44 | 0.45 | |
| Linguistic | Word to antonym | 0.90 | 0.86 |
| Adj to comparative | 0.85 | 0.86 | |
| Adj to superlative | 0.87 | 0.89 | |
| Noun to pronoun | 0.89 | 0.79 | |
| Verb to past tense | 0.91 | 0.86 | |
| Word to compound | 0.78 | 0.62 | |
| Word to homophone | 0.85 | 0.75 | |
| Word to synonym | 0.79 | 0.69 | |
| Translation | English to French | 0.71 | 0.68 |
| English to Spanish | 0.82 | 0.81 | |
Table 1: Correlation between the relation score of a head and the head’s outputs in Llama-3.1 8B, with and without head contextualization. Results are statistically significant with p-values $≤$ 3.9e-128 (see § B.1).
| Relation | TR Tasks | CTR Tasks | | | |
| --- | --- | --- | --- | --- | --- |
| Base | - TR | - RND | Base | - TR | |
| Adj to comparative | 0.91 | 0.20 | 0.82 | 0.92 | 0.63 |
| Copying | 1.00 | 0.68 | 1.00 | 0.95 | 0.88 |
| Country to capital | 0.97 | 0.00 | 0.95 | 0.89 | 0.90 |
| Country to language | 1.00 | 0.08 | 0.96 | 0.89 | 0.89 |
| Name copying | 1.00 | 0.24 | 1.00 | 0.90 | 0.92 |
| Noun to pronoun | 0.88 | 0.46 | 0.86 | 0.90 | 0.88 |
| Object to superclass | 0.78 | 0.39 | 0.68 | 0.90 | 0.87 |
| Verb to past tense | 0.22 | 0.04 | 0.26 | 0.03 | 0.02 |
| Word to first letter | 0.91 | 0.34 | 0.87 | 0.91 | 0.74 |
| Year to following | 0.92 | 0.00 | 0.87 | 0.83 | 0.79 |
Table 2: Accuracy of Pythia 12B on tasks for a target relation (TR) versus on control (CTR) tasks, when removing heads implementing the relation compared to when removing random heads (RND). Results for RND heads are averaged over 5 experiments. We omit standard deviation for brevity and report it in § B.2.
Experiment 2: Causal effect on model outputs
For a given relation $R$ , we evaluate the model’s performance on queries that require applying $R$ , when removing the heads classified by MAPS as implementing $R$ versus when removing random heads from the model. We choose a diverse set of 13 relations and construct a test set $\tilde{\mathcal{D}}_{R}$ for every relation $R$ as follows. First, we craft a task prompt that requires the model to apply $R$ . For example, a prompt for the country to capital relation could be ‘‘The capital of $\langle s\rangle$ is’’, with $\langle s\rangle$ being a placeholder for a country. Then, for each pair $(s,t)∈\mathcal{D}_{R}$ we instantiate the prompt with $s$ to create an input $\tilde{\mathcal{P}}_{s}$ and a test example $(\tilde{\mathcal{P}}_{s},t)∈\tilde{\mathcal{D}}_{R}$ .
Let $\mathcal{H}_{R}^{i}$ be the subset of $i$ attention heads with the highest scores for $\phi_{R}(M)$ . We evaluate the models on $\tilde{\mathcal{D}}_{R}$ while running each input $n$ times, each time canceling (by setting to zero) the outputs of the attention heads $\mathcal{H}_{R}^{i}$ and obtaining the model’s prediction with greedy decoding. We set $n$ as the minimum between the number of heads in the model with $\phi_{R}(M)>0$ and a fixed boundary: 150 for GPT-2 xl, Pythia 6.9B, Pythia 12B, and Llama-3.1 8B and 250 for Llama-3.1 70B. In cases when the accuracy drops to 0 after ablating $i<n$ heads, we report results obtained up to $i$ .
We compare the above intervention against a baseline where $i$ randomly sampled heads that are not in $\mathcal{H}_{R}^{i}$ are ablated, repeating this experiment 5 times and reporting the average accuracy. Additionally, to establish that relation heads are important specifically for tasks involving $R$ , we remove the relation heads as above and measure the model’s performance on up to five control tasks for other relations. We choose the relations such that $<$ 15% of the target relation heads are also control relation heads, and the absolute difference between the baseline accuracy on the control task and the target task is $≤$ 20%.
Results
Results for Pythia 12B are presented in Table 2, excluding relations where the base accuracy was $<$ 0.1. For all relations, removing the relation heads identified by MAPS causes a major accuracy drop of $≥$ 32% compared to $≤$ 13% when removing random heads. Moreover, while the accuracy drop for the control tasks is considerable in some cases (at most 33%), it is significantly smaller than the relative drop on the target relation task. Results for the other models are generally similar (see § B.2). Notable differences are that the accuracy drops in Llama-3.1 are often smaller, but in 9 out of 11 relations they are larger than those obtained for the random and control baselines.
4.3 Generalization to Multi-Token Entities
A natural question that arises is how well the estimations by MAPS generalize to contextualized inputs representing multiple tokens. Namely, if we infer the head’s ability to perform country-to-capital mappings from country names tokenized as a single token, will we observe the same behavior for countries tokenized as multiple tokens?
To test this, we apply the data collection process from § 4.1 to create new datasets for 11 relations of source-target pairs $(s,t)$ where $s$ has multiple tokens. Then, we repeat the correlative experiment in § 4.2 for GPT-2 xl, Pythia 6.9B and Pythia 12B using this data and the prompt template ‘‘This is a document about $\langle$ s $\rangle$ ’’.
We observe that the estimated operations generalize to multi-token representations. For 53 out of the 64 model-relation combinations (with and without contextualization), the correlation between the relation score and the head’s output in the multi-token setting is similar ( $≤$ 0.05 difference) or higher than the single-token setting. In the remaining cases, there is a slightly bigger drop ( $≤$ 0.13), but the correlations remain $≥$ 0.63. The full results are provided in § C.
4.4 Analysis
Function distribution
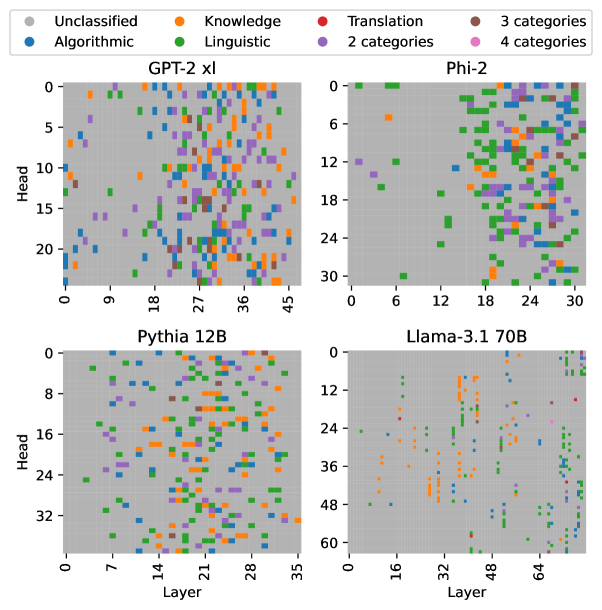
Figure 2 shows category-level classification results of all heads in GPT-2 xl, Phi-2, Pythia 12B, and Llama-3.1 70B. A head is assigned to a certain category if it implements at least one relation from it or its suppressive variant. Considering prominent trends across all models, we first observe that MAPS identified relations from all categories, with classified heads mostly being located in the middle and upper layers. This may suggest that early layers perform operations that cannot be represented in the model’s output vocabulary space. Interestingly, we observe a “side effect” of the grouped attention structure in Llama-3.1 models, where grouped heads often implement the same relations or their suppressive variants.
In addition, heads often implement multiple relations from the same or different categories. The portion of multi-category heads (out of all classified heads) generally decreases in model size: 38% in GPT-2 xl, 29% in Phi-2, 20% in Pythia 6.9B, Pythia 12B and 11% in Llama-3.1 70B. An exception to this trend is Llama-3.1 8B with 11% of multi-category heads, which may be caused by its grouped query attention structure. Also, 20%-36% of the classified heads implement at least one suppression relation.
<details>
<summary>x2.png Details</summary>
### Visual Description
\n
## Scatter Plots: Category Distribution Across Model Layers and Heads
### Overview
The image presents four scatter plots, each representing a different large language model (GPT-2 XL, Phi-2, Pythia 12B, and Llama-3.1 70B). Each plot visualizes the distribution of different categories of information processed by the model's layers and heads. The x-axis represents the layer number, and the y-axis represents the head number. Each point on the plot is colored according to the category of information it represents.
### Components/Axes
* **X-axis (Layer):** Represents the layer number within the neural network. Scales vary for each model:
* GPT-2 XL: 0 to 45
* Phi-2: 0 to 30
* Pythia 12B: 0 to 35
* Llama-3.1 70B: 0 to 64
* **Y-axis (Head):** Represents the head number within the neural network. Scales vary for each model:
* GPT-2 XL: 0 to 20
* Phi-2: 0 to 30
* Pythia 12B: 0 to 32
* Llama-3.1 70B: 0 to 60
* **Legend:** Located at the top-left of the image, defining the color-coding for each category:
* Grey: Unclassified
* Blue: Algorithmic
* Orange: Knowledge
* Green: Linguistic
* Red: Translation
* Purple: 3 categories
* Light Purple: 2 categories
* Dark Purple: 4 categories
### Detailed Analysis or Content Details
**GPT-2 XL (Top-Left):**
* The plot shows a relatively even distribution of all categories across layers and heads.
* Algorithmic (blue) and Linguistic (green) categories appear to be the most prevalent, with a slight concentration in the lower layer numbers (0-20) and across most head numbers.
* Knowledge (orange) is scattered throughout, with a higher density in the middle layers (18-36).
* Unclassified (grey) points are present but less frequent.
* Translation (red) and the category counts (purple shades) are sparsely distributed.
**Phi-2 (Top-Right):**
* A significant concentration of Linguistic (green) points is observed in the upper layers (18-30) and across most head numbers.
* Algorithmic (blue) points are more concentrated in the lower layers (0-12) and lower head numbers.
* Knowledge (orange) is scattered, with a slight concentration in the middle layers (12-24).
* Translation (red) and the category counts (purple shades) are sparsely distributed.
**Pythia 12B (Bottom-Left):**
* Linguistic (green) points dominate the lower layers (0-14) and are distributed across most head numbers.
* Knowledge (orange) points are concentrated in the middle layers (14-28).
* Algorithmic (blue) points are scattered throughout, with a higher density in the lower layers.
* Unclassified (grey) points are present but less frequent.
* Translation (red) and the category counts (purple shades) are sparsely distributed.
**Llama-3.1 70B (Bottom-Right):**
* Linguistic (green) points are heavily concentrated in the upper layers (32-64) and across most head numbers.
* Knowledge (orange) points are concentrated in the middle layers (16-48).
* Algorithmic (blue) points are scattered throughout, with a higher density in the lower layers.
* Unclassified (grey) points are present but less frequent.
* Translation (red) and the category counts (purple shades) are sparsely distributed.
### Key Observations
* The distribution of categories varies significantly across different models.
* Linguistic information appears to be predominantly processed in the upper layers of Phi-2 and Llama-3.1 70B.
* Knowledge information is often concentrated in the middle layers across all models.
* Algorithmic information is more evenly distributed, but tends to be more prevalent in the lower layers.
* The "Unclassified" category suggests that some information processed by the models does not fall neatly into the defined categories.
* The category counts (2, 3, and 4 categories) are very sparsely distributed across all models.
### Interpretation
These scatter plots provide insights into how different large language models process information at various layers and heads. The varying distributions suggest that each model has a unique architecture and learning strategy. The concentration of Linguistic information in the upper layers of Phi-2 and Llama-3.1 70B might indicate that these models prioritize language understanding and generation in their later stages of processing. The concentration of Knowledge in the middle layers suggests that these layers are crucial for integrating and reasoning about factual information. The presence of the "Unclassified" category highlights the complexity of natural language and the limitations of current categorization schemes. The sparse distribution of the category counts suggests that these are less common or more nuanced types of information processing.
The plots demonstrate a clear relationship between model architecture, layer depth, and the types of information processed. By visualizing this relationship, we can gain a better understanding of the inner workings of these powerful language models and potentially improve their design and performance. The differences between the models suggest that there isn't a single "best" way to process language, and that different architectures may be better suited for different tasks.
</details>
Figure 2: Functionality mapping by MAPS for 20 relations of 4 categories — algorithmic, knowledge, linguistic, translation — across all attention heads in GPT-2 xl, Phi-2, Pythia 12B, Llama-3.1 70B. A head is marked as a specific category if it implements at least one relation from this category.
Function universality
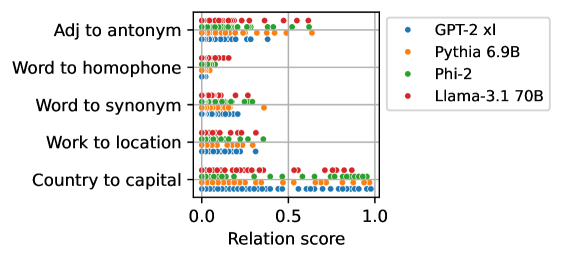
Figure 3 presents the distributions of relation scores for several representative relations in multiple models showing two interesting trends. First, despite architecture and training data differences, models encode relations in their heads to similar degrees, as observed by the similar highest scores per relation. This observation supports the “universality hypothesis” Li et al. (2015) that different networks learn similar features and circuits and expands recent similar findings about universality in LLMs Gould et al. (2024); Arditi et al. (2024); Tigges et al. (2024). Second, the scores for a given relation are diverse, with different heads implementing the relation at varying degrees, as opposed to having a small set of heads with high relation scores. This has implications for research concerning localization and editing; certain concepts or associations are encoded in a large number of model components at varying degrees.
Comparison with known head functionalities
Wang et al. (2023) identified “Name Mover” and “Anti Name Mover” heads in a circuit for indirect object identification in GPT-2 small, which copy or suppress copying specific names in the context, and Merullo et al. (2024a) identified “Mover” and “Capital” heads in GPT-2 medium. MAPS successfully identified all these heads as name copiers or country-to-capital mappers (which agrees with a similar analysis conducted by Wang et al., 2023). In addition, it discovered 25 heads in GPT-2 small and 46 in GPT-2 medium that implement similar operations but were not recognized in prior analyses. While the additional heads may not participate in the specific circuits discovered, they may be triggered for circuits of similar or related tasks that were overlooked in previous analyses.
Notably, for all the heads identified in previous works, MAPS reveals various additional functionalities. These observations extend the findings by Merullo et al. (2024a) of heads that implement multiple functionalities.
Taken together, these results demonstrate the effectiveness of MAPS in comprehensively mapping the implementation of a certain operation by attention heads across the model. A more detailed comparison is in § D.
<details>
<summary>x3.png Details</summary>
### Visual Description
\n
## Scatter Plot: Relation Scores for Different Language Models
### Overview
The image presents a scatter plot comparing the performance of four language models (GPT-2 xl, Pythia 6.9B, Phi-2, and Llama-3.1 70B) across five different relation types: "Adj to antonym", "Word to homophone", "Word to synonym", "Work to location", and "Country to capital". The x-axis represents the "Relation score", ranging from 0.0 to 1.0. Each point on the plot represents the score achieved by a specific language model for a specific relation type.
### Components/Axes
* **X-axis:** "Relation score" (Scale: 0.0 to 1.0, with markers at 0.0, 0.5, and 1.0)
* **Y-axis:** Relation types, listed vertically:
* Adj to antonym
* Word to homophone
* Word to synonym
* Work to location
* Country to capital
* **Legend:** Located in the top-right corner, mapping colors to language models:
* Blue: GPT-2 xl
* Orange: Pythia 6.9B
* Green: Phi-2
* Red: Llama-3.1 70B
### Detailed Analysis
Let's analyze each relation type and the performance of each model:
* **Adj to antonym:** All models cluster between approximately 0.6 and 1.0. GPT-2 xl (blue) appears to have a slight concentration around 0.7-0.8. Pythia 6.9B (orange) is spread between 0.6 and 0.9. Phi-2 (green) is concentrated around 0.8-0.9. Llama-3.1 70B (red) is mostly between 0.7 and 1.0.
* **Word to homophone:** Similar to "Adj to antonym", all models score between approximately 0.6 and 1.0. GPT-2 xl (blue) is concentrated around 0.7-0.8. Pythia 6.9B (orange) is spread between 0.6 and 0.9. Phi-2 (green) is concentrated around 0.8-0.9. Llama-3.1 70B (red) is mostly between 0.7 and 1.0.
* **Word to synonym:** All models score between approximately 0.4 and 1.0. GPT-2 xl (blue) is concentrated around 0.5-0.7. Pythia 6.9B (orange) is spread between 0.6 and 0.9. Phi-2 (green) is concentrated around 0.7-0.9. Llama-3.1 70B (red) is mostly between 0.7 and 1.0.
* **Work to location:** All models score between approximately 0.2 and 0.8. GPT-2 xl (blue) is concentrated around 0.3-0.5. Pythia 6.9B (orange) is spread between 0.4 and 0.7. Phi-2 (green) is concentrated around 0.5-0.7. Llama-3.1 70B (red) is mostly between 0.5 and 0.8.
* **Country to capital:** All models score between approximately 0.6 and 1.0. GPT-2 xl (blue) is concentrated around 0.7-0.9. Pythia 6.9B (orange) is spread between 0.7 and 0.9. Phi-2 (green) is concentrated around 0.8-1.0. Llama-3.1 70B (red) is mostly between 0.7 and 1.0.
### Key Observations
* The "Work to location" relation consistently yields the lowest relation scores across all models.
* Llama-3.1 70B (red) generally achieves higher scores than the other models, particularly in "Word to synonym" and "Country to capital".
* GPT-2 xl (blue) tends to have the lowest scores, especially in "Work to location".
* The scores are generally clustered, with less variance within each relation type.
### Interpretation
The scatter plot demonstrates the ability of different language models to understand and quantify relationships between concepts. The varying scores across relation types suggest that some relationships are inherently easier for these models to grasp than others. The consistently low scores for "Work to location" might indicate that this relationship requires more complex reasoning or world knowledge that these models currently lack.
The superior performance of Llama-3.1 70B suggests that larger models with more parameters are better equipped to capture these relationships. The clustering of scores within each relation type indicates a degree of consistency in how these models perceive these relationships, but the variations between models highlight the differences in their underlying knowledge and reasoning capabilities. The plot provides a comparative assessment of these models' relational understanding, which is crucial for tasks like question answering, knowledge graph completion, and semantic reasoning.
</details>
Figure 3: Relation scores for all heads of Llama-3.1 70B, Pythia 6.9B, Phi-2, GPT-2 xl for several relations. We observe that heads from all models implement these relations to similar degrees.
5 Inspecting Salient Operations
We saw that given an operation realized as a relation between pairs of tokens, we can map how strongly it is implemented by attention heads across the model. Here, we use MAPS to tackle a complementary problem of inferring the prominent operations of a given attention head. We introduce an automatic pipeline for interpreting salient mappings in attention heads (§ 5.1) and use it to broadly infer the functionalities in Pythia 6.9B and GPT-2 xl (§ 5.2). In § F, we extend our analysis to show that the skewness of saliency scores can indicate how global or specific the head’s functionality is.
5.1 Automatic Functionality Inference
We propose the following steps for inferring the functionality of an attention head:
1. Using the saliency score (Eq. 3) to identify the top $k$ tokens for which the head’s transformation is most prominent.
1. For each salient token $s$ , collecting the top $n$ tokens it is mapped to according to $M$ , namely, the tokens corresponding to the top entries in $\mathbf{m}_{s}$ . This could be extended to suppression for better coverage.
1. Inferring the head’s salient operations by querying an LLM about prominent patterns in the list of salient tokens and their top mappings. Notably, we ask the model to indicate there is no pattern when no clear pattern is observed across the mappings. For the exact prompt used, see § E.
We run this pipeline on a total of 2,224 attention heads in GPT-2 xl and Pythia 6.9B, while setting $k=30$ (step 1) and $n=5$ (step 2) and using GPT-4o (Hurst et al., 2024) (step 3). We analyze how often GPT-4o was able to recognize a prominent functionality and measure the quality of its descriptions compared to human judgment.
5.2 Results
<details>
<summary>x4.png Details</summary>
### Visual Description
\n
## Line Chart: Pattern Detection in Neural Network Layers
### Overview
The image presents two line charts comparing pattern detection rates across layers in two different neural network models: Pythia 6.9b and GPT2 xl. The charts display the percentage of heads where a pattern was detected as a function of the layer number.
### Components/Axes
* **X-axis (Both Charts):** "Layer" - ranging from 0 to 30 for Pythia 6.9b and 0 to 40 for GPT2 xl. The scale is linear.
* **Y-axis (Both Charts):** "% of heads where a pattern was detected" - ranging from 0 to 100. The scale is linear.
* **Chart Titles:**
* Left Chart: "Pythia 6.9b"
* Right Chart: "GPT2 xl"
* **Data Series:** A single blue line for each chart representing the pattern detection rate.
* **Gridlines:** Both charts have a light gray grid to aid in reading values.
### Detailed Analysis
**Pythia 6.9b (Left Chart):**
The blue line starts at approximately 55% at layer 0, dips to around 40% at layer 1, then rises steadily to a peak of approximately 90% around layer 15. After layer 15, the line fluctuates between 70% and 90% until layer 25, after which it declines sharply to approximately 40% at layer 30.
* Layer 0: ~55%
* Layer 1: ~40%
* Layer 5: ~65%
* Layer 10: ~80%
* Layer 15: ~90%
* Layer 20: ~80%
* Layer 25: ~70%
* Layer 30: ~40%
**GPT2 xl (Right Chart):**
The blue line begins at approximately 65% at layer 0, dips to around 40% at layer 2, then rises to a peak of approximately 95% around layer 30. After layer 30, the line declines to approximately 60% at layer 40.
* Layer 0: ~65%
* Layer 2: ~40%
* Layer 5: ~60%
* Layer 10: ~70%
* Layer 20: ~80%
* Layer 30: ~95%
* Layer 35: ~85%
* Layer 40: ~60%
### Key Observations
* Both models show an initial dip in pattern detection rate followed by a rise.
* GPT2 xl exhibits a higher peak detection rate (around 95%) compared to Pythia 6.9b (around 90%).
* Pythia 6.9b shows a more pronounced decline in pattern detection rate towards the end of its layers.
* GPT2 xl maintains a relatively higher detection rate across a wider range of layers.
### Interpretation
The charts suggest that pattern detection capabilities develop in the initial layers of both neural networks, reaching a peak performance at a certain layer depth. The subsequent decline in detection rate in Pythia 6.9b could indicate overfitting or a loss of generalization ability in the later layers. The more gradual decline in GPT2 xl suggests better robustness or a different learning dynamic. The higher peak detection rate in GPT2 xl may indicate a greater capacity for identifying complex patterns. The differences in the curves could be attributed to variations in model architecture, training data, or training procedures. The data suggests that the optimal layer depth for pattern detection varies between the two models. The initial dip in both charts could represent a period of adjustment or feature extraction before meaningful patterns emerge.
</details>
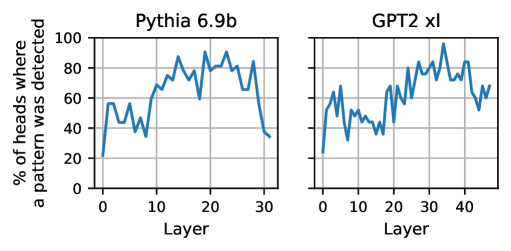
Figure 4: Portion of heads where GPT-4o identified a prominent pattern across the head’s salient mappings.
Figure 4 shows the percentage of heads per layer in GPT-2 xl and Pythia 6.9B where GPT-4o described a pattern. In both models, we observe a high rate of 60%-96% interpretable heads in the middle and upper layers, compared to a lower rate of 20%-60% in the early and last layers. These trends are consistent with those observed for predefined relations (§ 4), suggesting that early-layer heads are less interpretable in the vocabulary space. Qualitative analysis of 107 heads with identified patterns shows diverse operations: 38% semantic (e.g., extension of time-periods, day->month; month->year; year->decade), 36% algorithmic (e.g., capitalization, water->Water), and 26% linguistic (e.g., completion of sub-words (inhib->inhibition; resil->resilience). Examples of salient mappings and their interpretations are provided in § E.
Interpretation quality
We conduct a human study to assess the plausibility of the generated descriptions, finding that GPT-4o correctly identifies the presence or absence of a pattern in 80% of the cases and reliably detects observable patterns. This shows that our automatic pipeline is reasonable and demonstrates promising trends in automatically interpreting attention heads with MAPS. For more details on this study and its results, see § E.
6 Related Work
Prior studies of attention heads in LLMs mostly focused on analyzing their attention patterns Voita et al. (2019); Clark et al. (2019); Vig and Belinkov (2019), training probes and sparse auto-encoders Kissane et al. (2024), studying head outputs, and performing causal interventions (see survey by Zheng et al., 2024). Unlike these methods, MAPS infers the functionality of attention heads from their parameters, without any training or inference.
Vocabulary projections of attention head parameters have been used for analyzing certain attention head operations in LLMs Wang et al. (2023); McDougall et al. (2024); Kim et al. (2024); García-Carrasco et al. (2024); Elhage et al. (2021). However, they have been used mostly as a validation tool for operations inferred by other methods and were applied to specific relations and heads, typically in the scope of specific circuits. Gould et al. (2024) studied a single relation across all heads of multiple LLMs. Our work proposes a general framework that uses vocabulary projections as its primary tool for inferring attention head functionality.
Millidge and Black (2022) utilized an LLM to interpret the vocabulary projections of singular vectors of attention heads and MLP matrices, but their approach does not consider input-output mappings which are essential for estimating head functionality. More recently, Merullo et al. (2024b) used parameter similarities of heads at different layers to study their “communication channels”. Lastly, Hernandez et al. (2024) showed that relation operations of attention heads can be well-approximated by linear functions. Our work further shows that some of these relations are implemented by mappings encoded in head parameters.
7 Conclusion
We present MAPS, an efficient framework for analyzing the functionality of attention heads from their parameters. MAPS utility is two-fold: it allows mapping how strongly a given operation is implemented across the heads of a model and inferring the salient operations of a given head. Experiments show that estimations by MAPS correlate with the head outputs during inference and causally relate to the model’s behavior. Moreover, strong LLMs can interpret them automatically, often aligning with human judgment. Our analysis provides insights into architecture biases on function encoding and function universality in LLMs.
Limitations
MAPS primarily focuses on analyzing the part of the head’s computation that writes the output to the residual stream, i.e., the matrix $W_{VO}$ . In other words, we use single-token mappings to analyze the operation of the output part of the head on contextualized representations $\tilde{X}$ . While our experiments in § 4.3 show that these estimations generalize to multi-token inputs, it is still valuable to examine the head’s computation responsible for contextualization and for creating $\tilde{X}$ , i.e., the matrix $W_{QK}$ .
Another limitation of MAPS is that its expressivity is bounded by the model’s vocabulary. Namely, it can only map operations that can be expressed via pairs of tokens. While this formulation can effectively describe and capture various features, as demonstrated by our experiments in § 4 and § 5, there are likely to be operations that this framework would overlook, such as idioms and positional features. A related challenge is the lower coverage of MAPS in early layers, where the model may not yet operate in the output vocabulary space, but instead computes general-purpose features to be used by later layers. Extending MAPS to support other types of representations is a promising direction to overcome these limitations, as well as exploring methods such as linear mappings Yom Din et al. (2024) and patching Ghandeharioun et al. (2024) to improve the performance on early layers.
Lastly, MAPS relies on the formulation of attention heads as interaction matrices (§ 2), which ignores the bias terms of $W_{V},W_{O}$ . While our experiments show there is a strong correlation between the estimations by MAPS and head outputs, these terms may influence them. Incorporating these bias terms into the analysis is an interesting direction, which we leave for future works to explore.
Acknowledgments
We thank Guy Dar, Daniela Gottesman, Ohav Barbi, Ori Yoran, Yoav Gur-Arieh and Samuel Amouyal who helped with analysis and provided useful feedback. This research was supported in part by The Israel Science Foundation grant 1083/24.
References
- Ainslie et al. (2023) Joshua Ainslie, James Lee-Thorp, Michiel de Jong, Yury Zemlyanskiy, Federico Lebron, and Sumit Sanghai. 2023. GQA: Training generalized multi-query transformer models from multi-head checkpoints. In Proceedings of the 2023 Conference on Empirical Methods in Natural Language Processing, pages 4895–4901, Singapore. Association for Computational Linguistics.
- Arditi et al. (2024) Andy Arditi, Oscar Obeso, Aaquib Syed, Daniel Paleka, Nina Panickssery, Wes Gurnee, and Neel Nanda. 2024. Refusal in language models is mediated by a single direction. arXiv preprint arXiv:2406.11717.
- Azaria and Mitchell (2023) Amos Azaria and Tom Mitchell. 2023. The internal state of an LLM knows when it‘s lying. In Findings of the Association for Computational Linguistics: EMNLP 2023, pages 967–976, Singapore. Association for Computational Linguistics.
- Biderman et al. (2023) Stella Biderman, Hailey Schoelkopf, Quentin Gregory Anthony, Herbie Bradley, Kyle O’Brien, Eric Hallahan, Mohammad Aflah Khan, Shivanshu Purohit, USVSN Sai Prashanth, Edward Raff, Aviya Skowron, Lintang Sutawika, and Oskar van der Wal. 2023. Pythia: A suite for analyzing large language models across training and scaling. In International Conference on Machine Learning, ICML 2023, 23-29 July 2023, Honolulu, Hawaii, USA, volume 202 of Proceedings of Machine Learning Research, pages 2397–2430. PMLR.
- Bohnet et al. (2022) Bernd Bohnet, Vinh Q Tran, Pat Verga, Roee Aharoni, Daniel Andor, Livio Baldini Soares, Massimiliano Ciaramita, Jacob Eisenstein, Kuzman Ganchev, Jonathan Herzig, et al. 2022. Attributed question answering: Evaluation and modeling for attributed large language models. arXiv preprint arXiv:2212.08037.
- Bolukbasi et al. (2021) Tolga Bolukbasi, Adam Pearce, Ann Yuan, Andy Coenen, Emily Reif, Fernanda Viégas, and Martin Wattenberg. 2021. An interpretability illusion for bert. ArXiv preprint, abs/2104.07143.
- Clark et al. (2019) Kevin Clark, Urvashi Khandelwal, Omer Levy, and Christopher D. Manning. 2019. What does BERT look at? an analysis of BERT’s attention. In Proceedings of the 2019 ACL Workshop BlackboxNLP: Analyzing and Interpreting Neural Networks for NLP, pages 276–286, Florence, Italy. Association for Computational Linguistics.
- Dar et al. (2023) Guy Dar, Mor Geva, Ankit Gupta, and Jonathan Berant. 2023. Analyzing transformers in embedding space. In Proceedings of the 61st Annual Meeting of the Association for Computational Linguistics (Volume 1: Long Papers), pages 16124–16170, Toronto, Canada. Association for Computational Linguistics.
- Dubey et al. (2024) Abhimanyu Dubey, Abhinav Jauhri, Abhinav Pandey, Abhishek Kadian, Ahmad Al-Dahle, Aiesha Letman, Akhil Mathur, Alan Schelten, Amy Yang, Angela Fan, et al. 2024. The llama 3 herd of models. ArXiv preprint, abs/2407.21783.
- Elhage et al. (2021) Nelson Elhage, Neel Nanda, Catherine Olsson, Tom Henighan, Nicholas Joseph, Ben Mann, Amanda Askell, Yuntao Bai, Anna Chen, Tom Conerly, et al. 2021. A mathematical framework for transformer circuits. Transformer Circuits Thread, 1(1):12.
- Ferrando et al. (2024) Javier Ferrando, Gabriele Sarti, Arianna Bisazza, and Marta R Costa-jussà. 2024. A primer on the inner workings of transformer-based language models. ArXiv preprint, abs/2405.00208.
- Gao et al. (2024) Leo Gao, Tom Dupré la Tour, Henk Tillman, Gabriel Goh, Rajan Troll, Alec Radford, Ilya Sutskever, Jan Leike, and Jeffrey Wu. 2024. Scaling and evaluating sparse autoencoders. ArXiv preprint, abs/2406.04093.
- García-Carrasco et al. (2024) Jorge García-Carrasco, Alejandro Maté, and Juan C. Trujillo. 2024. How does GPT-2 predict acronyms? extracting and understanding a circuit via mechanistic interpretability. In International Conference on Artificial Intelligence and Statistics, 2-4 May 2024, Palau de Congressos, Valencia, Spain, volume 238 of Proceedings of Machine Learning Research, pages 3322–3330. PMLR.
- Geva et al. (2022) Mor Geva, Avi Caciularu, Kevin Wang, and Yoav Goldberg. 2022. Transformer feed-forward layers build predictions by promoting concepts in the vocabulary space. In Proceedings of the 2022 Conference on Empirical Methods in Natural Language Processing, pages 30–45, Abu Dhabi, United Arab Emirates. Association for Computational Linguistics.
- Geva et al. (2021) Mor Geva, Roei Schuster, Jonathan Berant, and Omer Levy. 2021. Transformer feed-forward layers are key-value memories. In Proceedings of the 2021 Conference on Empirical Methods in Natural Language Processing, pages 5484–5495, Online and Punta Cana, Dominican Republic. Association for Computational Linguistics.
- Ghandeharioun et al. (2024) Asma Ghandeharioun, Avi Caciularu, Adam Pearce, Lucas Dixon, and Mor Geva. 2024. Patchscopes: A unifying framework for inspecting hidden representations of language models. In Forty-first International Conference on Machine Learning.
- Gould et al. (2024) Rhys Gould, Euan Ong, George Ogden, and Arthur Conmy. 2024. Successor heads: Recurring, interpretable attention heads in the wild. In The Twelfth International Conference on Learning Representations.
- Gur-Arieh et al. (2025) Yoav Gur-Arieh, Roy Mayan, Chen Agassy, Atticus Geiger, and Mor Geva. 2025. Enhancing automated interpretability with output-centric feature descriptions. arXiv preprint arXiv:2501.08319.
- Hernandez et al. (2024) Evan Hernandez, Arnab Sen Sharma, Tal Haklay, Kevin Meng, Martin Wattenberg, Jacob Andreas, Yonatan Belinkov, and David Bau. 2024. Linearity of relation decoding in transformer language models. In The Twelfth International Conference on Learning Representations.
- Hurst et al. (2024) Aaron Hurst, Adam Lerer, Adam P Goucher, Adam Perelman, Aditya Ramesh, Aidan Clark, AJ Ostrow, Akila Welihinda, Alan Hayes, Alec Radford, et al. 2024. Gpt-4o system card. ArXiv preprint, abs/2410.21276.
- Javaheripi and Bubeck (2023) Mojan Javaheripi and Sébastien Bubeck. 2023. Phi-2: The surprising power of small language models.
- Katz et al. (2024) Shahar Katz, Yonatan Belinkov, Mor Geva, and Lior Wolf. 2024. Backward lens: Projecting language model gradients into the vocabulary space. In Proceedings of the 2024 Conference on Empirical Methods in Natural Language Processing, pages 2390–2422, Miami, Florida, USA. Association for Computational Linguistics.
- Kim et al. (2024) Geonhee Kim, Marco Valentino, and André Freitas. 2024. A mechanistic interpretation of syllogistic reasoning in auto-regressive language models. ArXiv preprint, abs/2408.08590.
- Kissane et al. (2024) Connor Kissane, Robert Krzyzanowski, Joseph Isaac Bloom, Arthur Conmy, and Neel Nanda. 2024. Interpreting attention layer outputs with sparse autoencoders. In ICML 2024 Workshop on Mechanistic Interpretability.
- Kuhn et al. (2023) Lorenz Kuhn, Yarin Gal, and Sebastian Farquhar. 2023. Semantic uncertainty: Linguistic invariances for uncertainty estimation in natural language generation. In The Eleventh International Conference on Learning Representations.
- Li et al. (2015) Yixuan Li, Jason Yosinski, Jeff Clune, Hod Lipson, and John Hopcroft. 2015. Convergent learning: Do different neural networks learn the same representations? In Proceedings of the 1st International Workshop on Feature Extraction: Modern Questions and Challenges at NIPS 2015, volume 44 of Proceedings of Machine Learning Research, pages 196–212, Montreal, Canada. PMLR.
- Loper and Bird (2002) Edward Loper and Steven Bird. 2002. NLTK: The natural language toolkit. In Proceedings of the ACL-02 Workshop on Effective Tools and Methodologies for Teaching Natural Language Processing and Computational Linguistics, pages 63–70, Philadelphia, Pennsylvania, USA. Association for Computational Linguistics.
- McDougall et al. (2024) Callum Stuart McDougall, Arthur Conmy, Cody Rushing, Thomas McGrath, and Neel Nanda. 2024. Copy suppression: Comprehensively understanding a motif in language model attention heads. In Proceedings of the 7th BlackboxNLP Workshop: Analyzing and Interpreting Neural Networks for NLP, pages 337–363, Miami, Florida, US. Association for Computational Linguistics.
- Meng et al. (2022) Kevin Meng, David Bau, Alex Andonian, and Yonatan Belinkov. 2022. Locating and editing factual associations in GPT. In Advances in Neural Information Processing Systems 35: Annual Conference on Neural Information Processing Systems 2022, NeurIPS 2022, New Orleans, LA, USA, November 28 - December 9, 2022.
- Merullo et al. (2024a) Jack Merullo, Carsten Eickhoff, and Ellie Pavlick. 2024a. Circuit component reuse across tasks in transformer language models. In The Twelfth International Conference on Learning Representations.
- Merullo et al. (2024b) Jack Merullo, Carsten Eickhoff, and Ellie Pavlick. 2024b. Talking heads: Understanding inter-layer communication in transformer language models. In The Thirty-eighth Annual Conference on Neural Information Processing Systems.
- Millidge and Black (2022) Beren Millidge and Sid Black. 2022. The singular value decompositions of transformer weight matrices are highly interpretable.
- Nanda and Bloom (2022) Neel Nanda and Joseph Bloom. 2022. Transformerlens. https://github.com/TransformerLensOrg/TransformerLens.
- nostalgebraist (2020) nostalgebraist. 2020. Interpreting gpt: the logit lens.
- Olsson et al. (2022) Catherine Olsson, Nelson Elhage, Neel Nanda, Nicholas Joseph, Nova DasSarma, Tom Henighan, Ben Mann, Amanda Askell, Yuntao Bai, Anna Chen, et al. 2022. In-context learning and induction heads. ArXiv preprint, abs/2209.11895.
- Radford et al. (2019) Alec Radford, Jeffrey Wu, Rewon Child, David Luan, Dario Amodei, Ilya Sutskever, et al. 2019. Language models are unsupervised multitask learners. OpenAI blog, 1(8):9.
- Schober et al. (2018) Patrick Schober, Christa Boer, and Lothar A. Schwarte. 2018. Correlation coefficients: Appropriate use and interpretation. Anesthesia & Analgesia, 126:1763–1768.
- Tigges et al. (2024) Curt Tigges, Michael Hanna, Qinan Yu, and Stella Biderman. 2024. LLM circuit analyses are consistent across training and scale. In The Thirty-eighth Annual Conference on Neural Information Processing Systems.
- Vaswani et al. (2017) Ashish Vaswani, Noam Shazeer, Niki Parmar, Jakob Uszkoreit, Llion Jones, Aidan N. Gomez, Lukasz Kaiser, and Illia Polosukhin. 2017. Attention is all you need. In Advances in Neural Information Processing Systems 30: Annual Conference on Neural Information Processing Systems 2017, December 4-9, 2017, Long Beach, CA, USA, pages 5998–6008.
- Vig and Belinkov (2019) Jesse Vig and Yonatan Belinkov. 2019. Analyzing the structure of attention in a transformer language model. In Proceedings of the 2019 ACL Workshop BlackboxNLP: Analyzing and Interpreting Neural Networks for NLP, pages 63–76, Florence, Italy. Association for Computational Linguistics.
- Voita et al. (2019) Elena Voita, David Talbot, Fedor Moiseev, Rico Sennrich, and Ivan Titov. 2019. Analyzing multi-head self-attention: Specialized heads do the heavy lifting, the rest can be pruned. In Proceedings of the 57th Annual Meeting of the Association for Computational Linguistics, pages 5797–5808, Florence, Italy. Association for Computational Linguistics.
- Vrandečić and Krötzsch (2014) Denny Vrandečić and Markus Krötzsch. 2014. Wikidata: a free collaborative knowledgebase. Commun. ACM, 57(10):78–85.
- Wang et al. (2023) Kevin Ro Wang, Alexandre Variengien, Arthur Conmy, Buck Shlegeris, and Jacob Steinhardt. 2023. Interpretability in the wild: a circuit for indirect object identification in GPT-2 small. In The Eleventh International Conference on Learning Representations, ICLR 2023, Kigali, Rwanda, May 1-5, 2023. OpenReview.net.
- Wolf et al. (2020) Thomas Wolf, Lysandre Debut, Victor Sanh, Julien Chaumond, Clement Delangue, Anthony Moi, Pierric Cistac, Tim Rault, Remi Louf, Morgan Funtowicz, Joe Davison, Sam Shleifer, Patrick von Platen, Clara Ma, Yacine Jernite, Julien Plu, Canwen Xu, Teven Le Scao, Sylvain Gugger, Mariama Drame, Quentin Lhoest, and Alexander Rush. 2020. Transformers: State-of-the-art natural language processing. In Proceedings of the 2020 Conference on Empirical Methods in Natural Language Processing: System Demonstrations, pages 38–45, Online. Association for Computational Linguistics.
- Xiao et al. (2024) Guangxuan Xiao, Yuandong Tian, Beidi Chen, Song Han, and Mike Lewis. 2024. Efficient streaming language models with attention sinks. In The Twelfth International Conference on Learning Representations.
- Yom Din et al. (2024) Alexander Yom Din, Taelin Karidi, Leshem Choshen, and Mor Geva. 2024. Jump to conclusions: Short-cutting transformers with linear transformations. In Proceedings of the 2024 Joint International Conference on Computational Linguistics, Language Resources and Evaluation (LREC-COLING 2024), pages 9615–9625, Torino, Italia. ELRA and ICCL.
- Yu et al. (2024) Lei Yu, Meng Cao, Jackie CK Cheung, and Yue Dong. 2024. Mechanistic understanding and mitigation of language model non-factual hallucinations. In Findings of the Association for Computational Linguistics: EMNLP 2024, pages 7943–7956, Miami, Florida, USA. Association for Computational Linguistics.
- Zheng et al. (2024) Zifan Zheng, Yezhaohui Wang, Yuxin Huang, Shichao Song, Bo Tang, Feiyu Xiong, and Zhiyu Li. 2024. Attention heads of large language models: A survey. ArXiv preprint, abs/2409.03752.
- Zhou et al. (2024) Zhenhong Zhou, Haiyang Yu, Xinghua Zhang, Rongwu Xu, Fei Huang, Kun Wang, Yang Liu, Junfeng Fang, and Yongbin Li. 2024. On the role of attention heads in large language model safety. ArXiv preprint, abs/2410.13708.
Appendix A Mapping Predefined Relations – Additional Details and Results
In § 4, we showed how MAPS can be utilized to map all heads that implement a predefined relation across a language model. Here we offer further details on the datasets and implementation, as well as supplementary results.
A.1 Datasets
| Category | Relation | Example mappings | Dataset size per tokenizer | | |
| --- | --- | --- | --- | --- | --- |
| Llama-3.1 | Pythia | GPT-2 / Phi-2 | | | |
| Algorithmic | Copying | (ottawa, ottawa),(say,say) | 450 | 432 | 436 |
| Name copying | (Mallory, Mallory),(Walt, Walt) | 134 | 113 | 132 | |
| Word to first letter | (bend, b),(past, p) | 238 | 237 | 238 | |
| Word to last letter | (bend, d),(past, t) | 238 | 237 | 238 | |
| Year to following | (1728, 1729),(1958, 1959) | | 147 | 133 | |
| Knowledge | Country to capital | (Bulgaria, Sofia),(Chile, Santiago) | 45 | 32 | 43 |
| Country to language | (Laos, Lao),(Denmark, Danish) | 51 | 37 | 48 | |
| Object to superclass | (tiger, animal),(carp, fish) | 62 | 46 | 65 | |
| Product by company | (Xbox, Microsoft),(Bravia, Sony) | 39 | | 40 | |
| Work to location | (farmer, farm),(chef, kitchen) | 48 | 34 | 45 | |
| Linguistic | Adj to comparative | (big, bigger),(high, higher) | 47 | 44 | 48 |
| Adj to superlative | (angry, angriest),(high, highest) | 39 | | 41 | |
| Noun to pronoun | (viewers, they),(Anna, she) | 257 | 238 | 253 | |
| Verb to past tense | (ask, asked),(eat, ate) | 110 | 112 | 112 | |
| Word to antonym | (love, hate),(right, wrong) | 91 | 88 | 92 | |
| Word to compound | (hot, hotdog),(wall, wallpaper) | 38 | | 36 | |
| Word to homophone | (steal, steel),(sea, see) | 103 | 88 | 91 | |
| Word to synonym | (vague, obscure),(ill, sick) | 154 | 142 | 154 | |
| Translation | English to French | (cat, chat),(love, amour) | 32 | | |
| English to Spanish | (cat, gato),(love, amor) | 34 | | | |
Table 3: Datasets used for inspecting predefined operations in models with different tokenizers. Every model column describes the datasets’ sizes for this model. Different tokenizers lead to differences between datasets. We discard datasets that were left with $≤$ 30 single-token mappings after tokenization.
Table 4: Sources for constructing per-relation datasets used in § 4.
We display the list of categories and relations used to map predefined relations (§ 4), alongside the sizes of the different datasets and examples for relations pairs in Table 3.
Data collection
We obtained the relation pairs from the sources: WikiData Vrandečić and Krötzsch (2014); “English Word Frequency List” Kaggle dataset, https://www.kaggle.com/datasets/wheelercode/english-word-frequency-list which is based on Google Books Ngram Viewer Exports, version 3, exported on Feb 17, 2020, https://storage.googleapis.com/books/ngrams/books/datasetsv3.html the datasets used by Hernandez et al. (2024), which are based on CounterFact Meng et al. (2022) and WikiData Vrandečić and Krötzsch (2014), and ChatGPT. https://chatgpt.com/ We also used the nltk package Loper and Bird (2002) to validate several relation datasets. Except for the Translation and year to following datasets, all datasets are in English. The details on which source was used to compose which relation are presented in Table 4.
In the datasets for the relations work to location, verb to past tense, product by company, object to superclass, adj to superlative, adj to comparative, word to antonym, we filter out pairs where the source token appeared as a source token in other pairs. Relation pairs were filtered out from different datasets to assert their correctness.
Data processing
For every model, we tokenized the various datasets using the model’s tokenizer. To maximize the number of words mapped to single tokens, we added a leading space before every word. For example, if the relation source word was "Don", we tokenized the string " Don" instead. Finally, we filtered out relation pairs where at least one of the words was mapped to more than one token.
A.2 Implementation Details
Applying the first MLP
For every model except Llama-3.1 70B, and similarly to Wang et al. (2023); Gould et al. (2024), we first applied the model’s first MLP to the tokens embeddings. Notably, we did not apply the first MLP when we analyzed heads from the models’ first layers (layer 0), since the first attention layer precedes the first MLP in the computation. To adjust the embeddings to the first MLP’s input distribution, we also applied the layer norm that precedes it. Regarding Llama-3.1 70B, we observed better results when not applying the first MLP.
Selection of $k$
To calculate a head’s relation score $\phi_{R}(M)$ , we obtain the top- $k$ tokens in $\mathbf{m}_{s}$ for every source token $s$ . For Pythia, GPT-2 and Phi-2 we set $k=1$ for copying and name-copying relations and $k=10$ for other relations. For the Llama-3.1 models we set $k=3$ for copying and name-copying and $k=25$ for other relations. Table 5 – which presents the tokenization applied to several base words by the tokenizers of Llama-3.1, GPT-2 and Pythia – demonstrates the need to set larger $k$ values for Llama-3.1. The larger vocabulary size allows Llama-3.1’s tokenizer to express the same concept with more tokens.
| Word | Llama-3.1 | Pythia | GPT-2 |
| --- | --- | --- | --- |
| Hello | >Hello, Hello, _hello, Ġhello, hello, ĠHello, Hallo, Bonjour, Hola | Hello, Ġhello, hello, ĠHello | hello, ĠHello, Ġhello, Hello |
| Please | Please, Ġplease, please, ĠPLEASE, ĠPlease, .Please, PLEASE, >Please, Bitte, ĠBITTE, ĠBitte, Ġbitte | Please, please, Ġplease, ĠPlease | Please, Ġplease, ĠPlease, ĠPLEASE, please |
| Love | ĠLOVE, love, loven, Ġlove, Love, ĠLove, ĠLiebe, Ġliebe, Ġamour, Ġamore, Ġamor | love, ĠLOVE, Love, Ġlove, ĠLove | Ġlove, love, ĠLove, Love, ĠLOVE |
| Water | -water, _WATER, ĠWater, _water, water, Ġwater, Water, ĠWATER, .water, ĠWasser, ’eau, agua, Ġagua | Water, Ġwater, water, ĠWater, agua | Water, water, Ġwater, ewater, ĠWater |
| School | ĠSCHOOL, -school, schools, Ġschool, _school, school, ĠSchool, .school, School | School, Ġschool, school, ĠSchool | ĠSchool, Ġschool, school, ĠSCHOOL, School |
Table 5: Different tokenizations for base words by the tokenizers of Llama-3.1, Pythia and GPT-2. The “Ġ” symbol represents a leading space. We observe that Llama-3.1’s larger vocabulary allows expressing every base word with more tokens.
A.3 Random Baselines
A concern that may arise from choosing a relatively small relation score threshold, is that the results obtained by MAPS may capture the similarity of tokens embeddings, rather than a functionality implemented by attention head’s weights. To study this, we applied MAPS to randomly initialized matrices from the empirical distribution of the model. Concretely, for every layer in the original model, we sampled $H$ random matrices (with the same shape as $W_{VO}$ ) from a normal distribution, for which the mean and standard deviation are the average and the standard deviation of the $W_{VO}$ matrices in the original layer. We applied our predefined relation analysis (described in § 4.1) to those matrices and measured the amounts of “functional attention heads” classified among them.
For models Phi-2, Pythia 6.9B, Pythia 12B, Llama-3.1 8B and Llama-3.1 70B no random matrices were classified as relation heads. For GPT-2 xl, 5 matrices were classified as such, compared to 250 relation heads in the trained model, and out of 1200 heads in the model. This demonstrates that the choice of $\tau=15\%$ is meaningful for separating between functionalities of trained attention heads and random ones. While smaller thresholds could have also been justified by this experiment, we chose $\tau=15\%$ to assert that the heads encode a substantial fraction of the relation pairs.
A.4 Additional Results
In Figure 5 we display all heads classified in Llama-3.1 70B, Llama-3.1 8B, Pythia 12B, Pythia 6.9B, Phi-2 and GPT-2 xl divided to four categories. In Tables 6 and 7 we present the number of relation heads (and suppression relation heads) discovered in the same models, divided into relations. We observe that several relations (Name copying, Adj to comparative, Word to first letter) are demonstrated by a relatively large number of heads in at least five out of six models. On the other hand, several relations (e.g., word to homophone, word to last letter) are demonstrated by a small number of heads across all models.
| Category | Relation | GPT-2 xl | Phi-2 | Pythia 6.9B | Pythia 12B | Llama-3.1 8B | Llama-3.1 70B |
| --- | --- | --- | --- | --- | --- | --- | --- |
| Algorithmic | Copying | 35 | 15 | 11 | 9 | 2 | 1 |
| Name copying | 71 | 25 | 27 | 23 | 3 | 14 | |
| Word to first letter | 4 | 5 | 13 | 13 | 15 | 19 | |
| Word to last letter | 0 | 1 | 2 | 1 | 2 | 2 | |
| Year to following | 47 | 16 | 14 | 22 | | | |
| Knowledge | Country to capital | 60 | 17 | 26 | 31 | 5 | 26 |
| Country to language | 50 | 23 | 24 | 30 | 5 | 28 | |
| Object to superclass | 17 | 12 | 11 | 19 | 0 | 13 | |
| Product by company | 24 | 4 | | | 1 | 3 | |
| Work to location | 10 | 6 | 6 | 8 | 0 | 5 | |
| Linguistic | Adj to comparative | 45 | 47 | 27 | 28 | 8 | 25 |
| Adj to superlative | 23 | 23 | | | 10 | 21 | |
| Noun to pronoun | 14 | 13 | 13 | 16 | 8 | 12 | |
| Verb to past tense | 15 | 27 | 17 | 28 | 8 | 18 | |
| Word to antonym | 12 | 15 | 11 | 15 | 5 | 11 | |
| Word to compound | 1 | 1 | | | 2 | 5 | |
| Word to homophone | 0 | 0 | 0 | 0 | 0 | 2 | |
| Word to synonym | 7 | 7 | 3 | 7 | 1 | 2 | |
| Translation | English to French | | | | | 0 | 2 |
| English to Spanish | | | | | 3 | 10 | |
Table 6: Number of heads implementing each of the relations across different models.
| Category | Relation | GPT-2 xl | Phi-2 | Pythia 6.9B | Pythia 12B | Llama-3.1 8B | Llama-3.1 70B |
| --- | --- | --- | --- | --- | --- | --- | --- |
| Algorithmic | Copying | 8 | 7 | 5 | 7 | 0 | 2 |
| Name copying | 23 | 9 | 9 | 7 | 3 | 8 | |
| Word to first letter | 0 | 2 | 2 | 0 | 9 | 11 | |
| Word to last letter | 0 | 0 | 2 | 2 | 1 | 3 | |
| Year to following | 5 | 2 | 1 | 0 | | | |
| Knowledge | Country to capital | 19 | 8 | 5 | 5 | 1 | 10 |
| Country to language | 26 | 12 | 9 | 11 | 3 | 9 | |
| Object to superclass | 2 | 5 | 3 | 6 | 0 | 4 | |
| Product by company | 7 | 0 | | | 0 | 3 | |
| Work to location | 2 | 3 | 1 | 1 | 0 | 2 | |
| Linguistic | Adj to comparative | 11 | 29 | 15 | 19 | 5 | 13 |
| Adj to superlative | 6 | 13 | | | 5 | 10 | |
| Noun to pronoun | 1 | 2 | 2 | 4 | 4 | 7 | |
| Verb to past tense | 2 | 21 | 8 | 7 | 5 | 10 | |
| Word to antonym | 0 | 4 | 3 | 4 | 2 | 3 | |
| Word to compound | 0 | 1 | | | 2 | 3 | |
| Word to homophone | 0 | 0 | 0 | 0 | 1 | 1 | |
| Word to synonym | 0 | 2 | 0 | 1 | 0 | 1 | |
| Translation | English to French | | | | | 0 | 0 |
| English to Spanish | | | | | 2 | 7 | |
Table 7: Number of suppression heads implementing each of the relations across different models.
<details>
<summary>x5.png Details</summary>
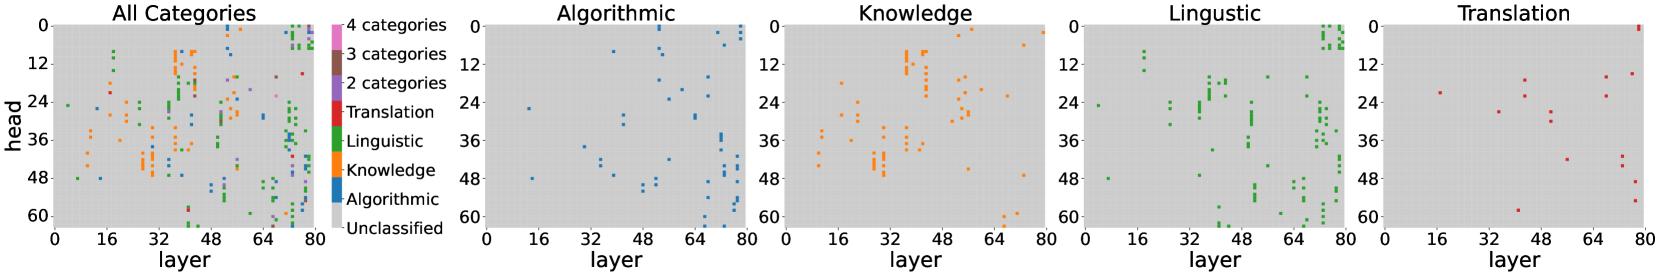
### Visual Description
\n
## Scatter Plots: Layer vs. Head for Different Categories
### Overview
The image presents five scatter plots, each visualizing the relationship between "layer" and "head" for different categories of data. The first plot shows all categories combined, while the subsequent four plots isolate "Algorithmic", "Knowledge", "Linguistic", and "Translation" categories respectively. The plots appear to represent some form of model analysis, potentially related to neural network layers.
### Components/Axes
* **X-axis:** "layer", ranging from approximately 0 to 80.
* **Y-axis:** "head", ranging from approximately 0 to 60.
* **Legend (All Categories plot):**
* Algorithmic (Blue)
* Knowledge (Orange)
* Linguistic (Green)
* Translation (Red)
* Unclassified (Gray)
* **Titles:** Each plot is titled with the category it represents (e.g., "Algorithmic", "Knowledge"). The first plot is titled "All Categories".
* **Category Labels (All Categories plot):** "4 categories", "3 categories", "2 categories" are present, likely indicating the number of categories represented in that region of the plot.
### Detailed Analysis or Content Details
**1. All Categories Plot:**
* The plot shows a scattered distribution of points across the entire range of "layer" and "head".
* The "Unclassified" category (gray) is concentrated in the lower-right quadrant (high layer, low head).
* "Translation" (red) points are scattered, with a slight concentration around layer 64 and head 12-24.
* "Linguistic" (green) points are concentrated in the upper-right quadrant (high layer, high head).
* "Knowledge" (orange) points are scattered, with a concentration around layer 32 and head 24-36.
* "Algorithmic" (blue) points are concentrated in the lower-left quadrant (low layer, low head).
**2. Algorithmic Plot:**
* Points are predominantly blue.
* The distribution is relatively uniform across the "layer" axis, but concentrated at lower "head" values (below 24).
* There is a slight increase in point density around layer 64.
**3. Knowledge Plot:**
* Points are predominantly orange.
* The distribution is concentrated between layers 16 and 64, with a peak around layer 32.
* "head" values range from approximately 12 to 48, with a concentration around 24-36.
**4. Linguistic Plot:**
* Points are predominantly green.
* The distribution is concentrated in the upper-right quadrant, with a strong presence at higher "layer" values (above 48) and higher "head" values (above 24).
* There is a noticeable cluster around layer 64 and head 48.
**5. Translation Plot:**
* Points are predominantly red.
* The distribution is relatively sparse, with points scattered across the entire range of "layer" and "head".
* There is a slight concentration around layer 64 and head 12-24.
### Key Observations
* The "Linguistic" category exhibits a clear trend of increasing "head" values with increasing "layer" values.
* The "Algorithmic" category is primarily located at lower "layer" and "head" values.
* The "Unclassified" category in the "All Categories" plot suggests a potential area for further investigation or refinement of the categorization process.
* The "Translation" category shows the most dispersed distribution, indicating a potentially more complex relationship between "layer" and "head".
### Interpretation
These scatter plots likely represent the activation patterns or feature representations learned by a neural network model for different categories of data. The "layer" axis represents the depth of the network, while the "head" axis could represent a specific feature or output dimension.
* The concentration of "Linguistic" points at higher layers suggests that linguistic features are learned more deeply within the network.
* The concentration of "Algorithmic" points at lower layers suggests that algorithmic features are learned earlier in the network.
* The dispersed distribution of "Translation" points may indicate that translation requires a more complex interplay of features across different layers.
* The "Unclassified" points could represent data that does not fit neatly into any of the defined categories, or data that requires further processing or labeling.
The plots provide insights into how different categories of data are processed and represented within the model. This information could be used to optimize the model architecture, improve the categorization process, or gain a better understanding of the underlying relationships between the data and the model's internal representations. The plots suggest that the model learns different types of features at different depths, and that some categories require more complex representations than others.
</details>
(a) Functionality mapping by MAPS for relations of 4 categories — algorithmic, knowledge, linguistic, translation — across all attention heads in Llama-3.1 70B. A head is marked for a specific category if it implements (also in a suppression variant) at least one relation from this category.
<details>
<summary>x6.png Details</summary>
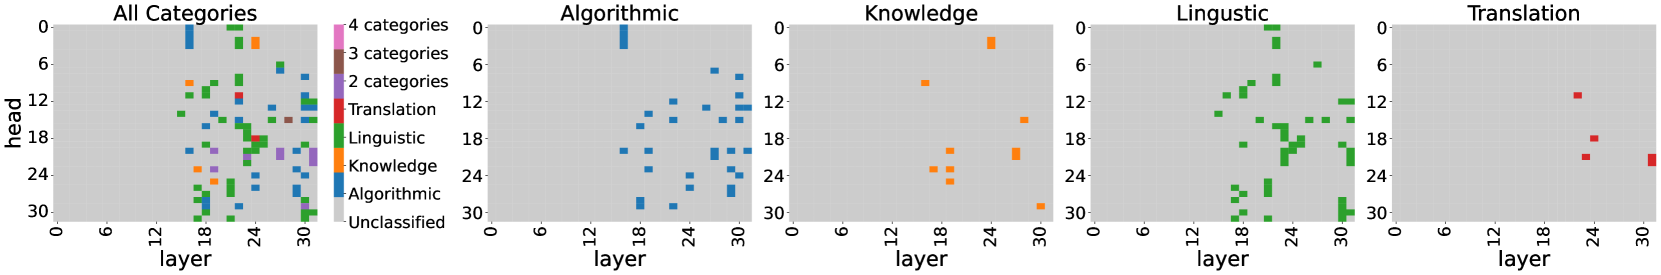
### Visual Description
## Heatmaps: Layer vs. Head Activation by Category
### Overview
The image presents five heatmaps, each visualizing the activation levels of different categories (Algorithmic, Knowledge, Linguistic, Translation, and All Categories) across layers (0-32) and heads (0-32). The activation level is represented by color intensity, with a legend indicating the number of categories present at each point. The heatmaps aim to show where different categories are most active within the model's layers and heads.
### Components/Axes
* **X-axis (Layer):** Represents the layer number, ranging from 0 to 32, with increments of 2.
* **Y-axis (Head):** Represents the head number, ranging from 0 to 32, with increments of 6.
* **Color:** Represents the number of categories activated at a given layer and head. The legend indicates:
* 1 category: Lightest color (appears white/very pale)
* 2 categories: Light blue/green
* 3 categories: Medium blue/green
* 4 categories: Darkest color (dark green)
* **Heatmaps:** Five separate heatmaps, each focusing on a specific category or all categories.
* "All Categories"
* "Algorithmic"
* "Knowledge"
* "Linguistic"
* "Translation"
### Detailed Analysis or Content Details
**1. All Categories:**
* The heatmap shows a dense distribution of activations across layers and heads.
* The highest activation (4 categories) is concentrated around layers 18-24 and heads 6-18.
* There's a noticeable cluster of 3-category activations around layers 0-6 and heads 0-12.
* Lower activations (1-2 categories) are scattered throughout the remaining areas.
**2. Algorithmic:**
* Activations are primarily concentrated in layers 0-24.
* The highest activation (4 categories) is not present.
* The most frequent activation level is 2 categories, observed around layers 6-18 and heads 0-12.
* A sparse distribution of 1 and 3 category activations is visible.
**3. Knowledge:**
* Activations are concentrated in layers 18-24.
* The highest activation (4 categories) is present in a small region around layer 24 and head 0-6.
* The majority of activations are at the 2 and 3 category levels, distributed across layers 18-24 and heads 0-18.
**4. Linguistic:**
* Activations are heavily concentrated in layers 18-30.
* The highest activation (4 categories) is present around layers 18-24 and heads 0-12.
* A significant number of 3-category activations are observed across layers 18-30 and heads 0-18.
* Lower activations (1-2 categories) are scattered throughout.
**5. Translation:**
* Activations are primarily concentrated in layers 18-30.
* The highest activation (4 categories) is present around layers 18-24 and heads 0-6.
* A strong cluster of 3-category activations is observed around layers 24-30 and heads 0-12.
* The heatmap shows a relatively sparse distribution of 1 and 2 category activations.
### Key Observations
* The "All Categories" heatmap shows the most widespread activation, indicating a general level of activity across all layers and heads.
* "Algorithmic" activations are relatively sparse and concentrated in the earlier layers.
* "Knowledge," "Linguistic," and "Translation" categories exhibit stronger activations in the later layers (18-30).
* The "Translation" category shows a distinct concentration of activations in the higher layers, suggesting that translation-related processing occurs later in the model.
* The "Linguistic" category has a broad distribution of activations, indicating its involvement across multiple layers and heads.
### Interpretation
The heatmaps suggest a hierarchical processing structure within the model. Earlier layers (0-18) seem to handle more general or "algorithmic" features, while later layers (18-30) are more specialized in processing "knowledge," "linguistic," and "translation" information. The concentration of "Translation" activations in the higher layers supports the idea that translation is a more complex process that builds upon lower-level linguistic representations. The varying levels of activation across categories and layers provide insights into the model's internal representations and how different types of information are processed. The "All Categories" heatmap serves as a baseline, showing the overall activity level, while the individual category heatmaps reveal the specific contributions of each category to the model's overall behavior. The presence of 4-category activations in specific regions suggests areas where multiple features or concepts are strongly represented, potentially indicating key processing nodes.
</details>
(b) Functionality mapping by MAPS for Llama-3.1 8B.
<details>
<summary>x7.png Details</summary>
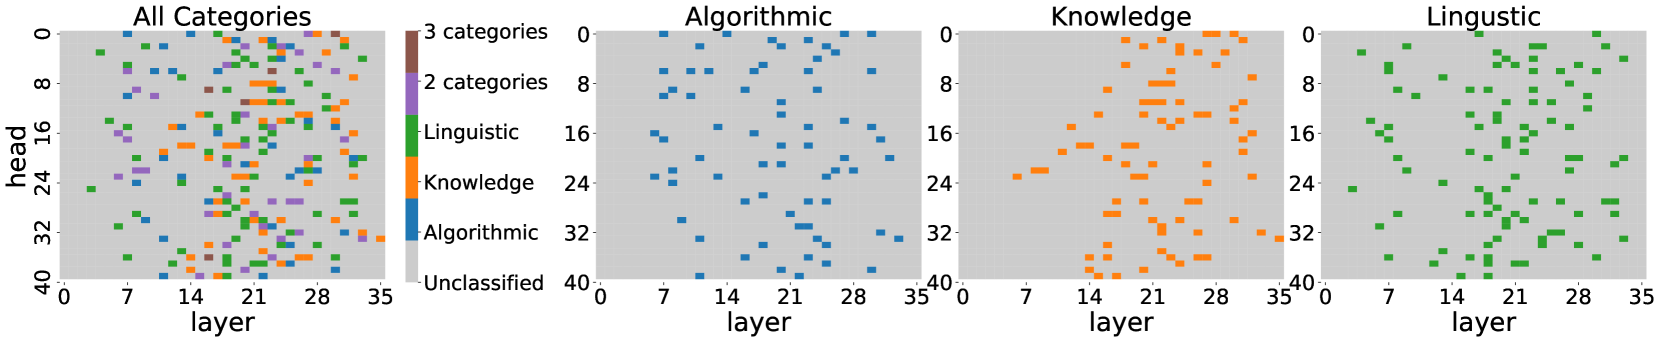
### Visual Description
\n
## Scatter Plots: Category Distribution Across Layers and Heads
### Overview
The image presents four scatter plots, each visualizing the distribution of different categories across 'layer' and 'head' dimensions. The first plot shows the distribution of "All Categories", while the subsequent three plots focus on "Algorithmic", "Knowledge", and "Linguistic" categories respectively. Each plot uses a scatter plot to represent the density of data points for each category.
### Components/Axes
Each of the four plots shares the same axes:
* **X-axis:** "layer", ranging from approximately 0 to 35.
* **Y-axis:** "head", ranging from approximately 0 to 40.
* **Categories/Colors:**
* "Unclassified" (Teal/Green)
* "Algorithmic" (Blue)
* "Knowledge" (Orange)
* "Linguistic" (Green)
* The first plot ("All Categories") also indicates the number of categories present in a given region (2 categories, 3 categories).
### Detailed Analysis or Content Details
**1. All Categories Plot:**
* The plot shows a mix of all four categories.
* The teal/green ("Unclassified") category is prevalent in the lower-left region (low layer, low head).
* The blue ("Algorithmic") category is concentrated in the right side (high layer) and middle head values.
* The orange ("Knowledge") category is concentrated in the middle-right region (high layer, middle head).
* The green ("Linguistic") category is concentrated in the left side (low layer) and middle head values.
* The region around layer 28-35 and head 0-8 shows "3 categories" present.
* The region around layer 0-7 and head 16-24 shows "2 categories" present.
**2. Algorithmic Plot:**
* The blue ("Algorithmic") category is the only one present.
* The points are scattered across the layer range (0-35), but are more densely populated between layers 7 and 28.
* The points are scattered across the head range (0-40), with a slight concentration between heads 0 and 16.
**3. Knowledge Plot:**
* The orange ("Knowledge") category is the only one present.
* The points are concentrated in the middle-right region, with layers ranging from approximately 14 to 35 and heads ranging from approximately 8 to 32.
* There is a noticeable gap in the data between layers 0 and 14.
**4. Linguistic Plot:**
* The green ("Linguistic") category is the only one present.
* The points are concentrated in the left side, with layers ranging from approximately 0 to 28 and heads ranging from approximately 8 to 32.
* There is a noticeable gap in the data between layers 28 and 35.
### Key Observations
* The "All Categories" plot demonstrates a clear separation of categories based on layer and head values.
* The "Algorithmic" category appears to be more prevalent in higher layers.
* The "Knowledge" category appears to be more prevalent in middle to higher layers.
* The "Linguistic" category appears to be more prevalent in lower to middle layers.
* The individual category plots show that each category occupies a distinct region of the layer/head space.
### Interpretation
The data suggests that different categories of information are processed at different layers and heads within a neural network or similar system. The "Algorithmic" category is associated with higher layers, potentially indicating that it emerges from more complex processing. The "Knowledge" category also appears in higher layers, suggesting it builds upon the algorithmic processing. The "Linguistic" category is more prominent in lower layers, potentially indicating that it is involved in initial feature extraction. The "Unclassified" category being prevalent in the lower-left suggests that initial processing is often ambiguous or requires further refinement. The separation of these categories across the layer/head space suggests a modular organization of information processing within the system. The gaps in the "Knowledge" and "Linguistic" plots could indicate specific layers or heads that are not involved in processing those types of information.
</details>
(c) Functionality mapping by MAPS for Pythia 12B.
<details>
<summary>x8.png Details</summary>
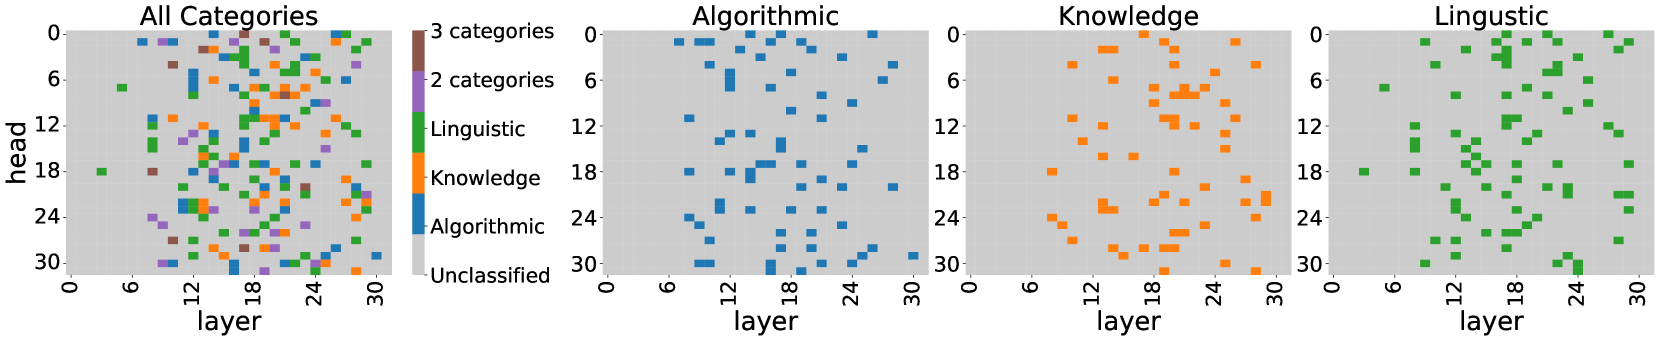
### Visual Description
\n
## Scatter Plots: Category Activation by Layer and Head
### Overview
The image presents four scatter plots, each visualizing the activation of different categories across layers and heads. The plots show the distribution of activations, likely representing the strength of a particular category's response within a neural network model. Each plot focuses on a specific category (All Categories, Algorithmic, Knowledge, Linguistic) and displays activation levels against layer and head indices.
### Components/Axes
Each plot shares the following components:
* **X-axis:** "layer", ranging from approximately 0 to 32, with markers at 0, 6, 12, 18, 24, and 30.
* **Y-axis:** "head", ranging from approximately 0 to 32, with markers at 0, 6, 12, 18, 24, and 30.
* **Color:** Represents the number of categories activated. The colorbar on the "All Categories" plot indicates:
* Green: 3 categories
* Yellow/Orange: 2 categories
* Blue: 1 category
* **Plot Titles:** Each plot is labeled with the category it represents: "All Categories", "Algorithmic", "Knowledge", "Linguistic".
### Detailed Analysis or Content Details
**1. All Categories Plot:**
* The plot displays a dense scattering of points, with a gradient of colors indicating the number of categories activated.
* The highest concentration of points (green, 3 categories) is located in the lower-left quadrant (low layer, low head) and extends diagonally upwards and to the right.
* There's a noticeable transition from green to yellow/orange and then to blue as the layer and head indices increase.
* The points are relatively evenly distributed across the layer and head dimensions.
**2. Algorithmic Plot:**
* This plot shows a sparse scattering of blue points (1 category).
* The points are concentrated in the lower layer range (0-18) and lower head range (0-12).
* There is a slight upward trend in head index as the layer index increases.
* No points are visible in the upper-right quadrant (high layer, high head).
**3. Knowledge Plot:**
* This plot displays orange/yellow points (2 categories) and some blue points (1 category).
* The points are primarily concentrated in the higher layer range (12-30) and mid-range head indices (6-24).
* There's a clear clustering of points around layer 24 and head 12.
* The distribution appears more concentrated than the "Algorithmic" plot.
**4. Linguistic Plot:**
* This plot shows a dense scattering of green points (3 categories) and some yellow/orange points (2 categories).
* The points are concentrated in the higher layer range (18-30) and higher head range (12-30).
* The distribution is relatively uniform across the upper-right quadrant.
* There is a clear concentration of points in the upper-right corner.
### Key Observations
* The "All Categories" plot shows a broad activation pattern, while the individual category plots reveal more specific activation regions.
* "Algorithmic" activations are primarily in the lower layers and heads.
* "Knowledge" activations are concentrated in the higher layers and mid-range heads.
* "Linguistic" activations are dominant in the higher layers and heads.
* The number of activated categories varies significantly across the different plots.
### Interpretation
The data suggests that different categories are processed at different layers and heads within the neural network. "Algorithmic" information appears to be processed earlier in the network (lower layers), while "Knowledge" and "Linguistic" information are processed later (higher layers). The varying density of points and the number of activated categories indicate that some categories are more strongly represented or require more complex processing than others. The concentration of "Knowledge" activations around layer 24 and head 12 might indicate a specific module or component responsible for processing knowledge-related information. The "All Categories" plot provides a holistic view, showing how these individual category activations contribute to the overall network activity. The plots demonstrate a hierarchical processing structure, where lower layers extract basic features and higher layers combine these features to represent more complex concepts. The differences in activation patterns across categories suggest that the network has learned to specialize different parts of its architecture for different types of information.
</details>
(d) Functionality mapping by MAPS for Pythia 6.9B.
<details>
<summary>x9.png Details</summary>
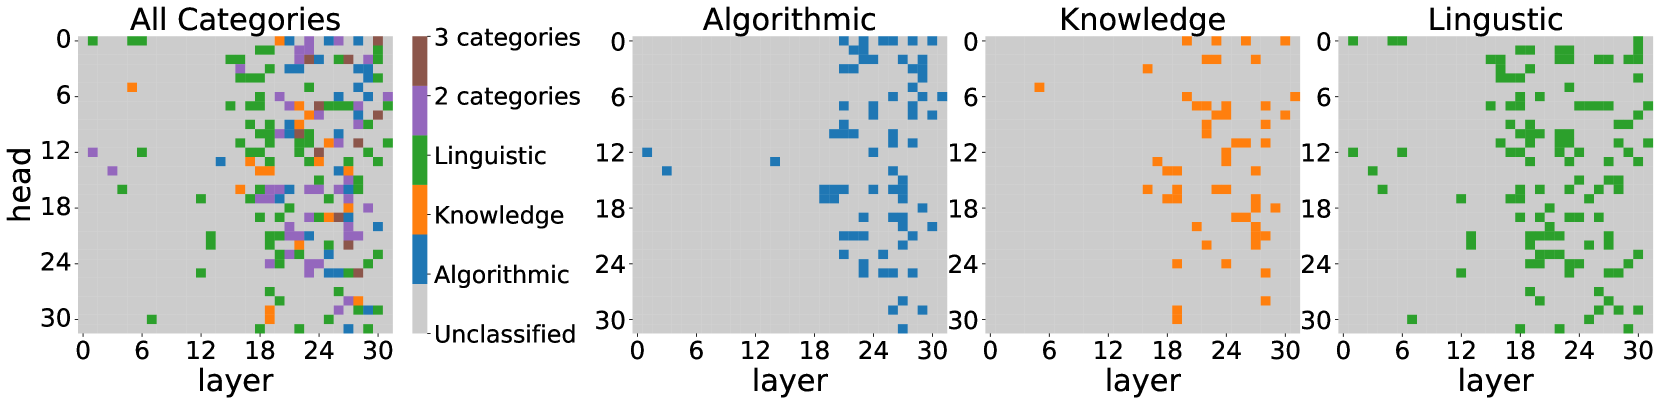
### Visual Description
\n
## Scatter Plots: Category Distribution Across Layers and Heads
### Overview
The image presents four scatter plots arranged horizontally. Each plot visualizes the distribution of data points across two dimensions: "layer" (x-axis, ranging from 0 to 30) and "head" (y-axis, ranging from 0 to 30). The first plot shows all categories combined, while the subsequent three plots focus on "Algorithmic", "Knowledge", and "Linguistic" categories respectively. Data points are color-coded to represent different categories.
### Components/Axes
* **X-axis:** "layer" - Scale from 0 to 30, with tick marks at intervals of 6.
* **Y-axis:** "head" - Scale from 0 to 30, with tick marks at intervals of 6.
* **Plot 1 (All Categories):**
* Categories: "Unclassified" (red), "Algorithmic" (blue), "Knowledge" (orange), "Linguistic" (green).
* Label: "All Categories" with "3 categories" and "2 categories" annotations.
* **Plot 2 (Algorithmic):**
* Category: "Algorithmic" (blue).
* Label: "Algorithmic".
* **Plot 3 (Knowledge):**
* Category: "Knowledge" (orange).
* Label: "Knowledge".
* **Plot 4 (Linguistic):**
* Category: "Linguistic" (green).
* Label: "Linguistic".
### Detailed Analysis or Content Details
**Plot 1: All Categories**
* **Unclassified (Red):** Points are scattered throughout the lower-left quadrant (layer 0-12, head 0-18), with a concentration around layer 0-6 and head 0-6. There's a sparse distribution extending to layer 18 and head 12. Approximately 20-30 points.
* **Algorithmic (Blue):** Points are concentrated in the lower-right quadrant (layer 18-30, head 0-12). There's a noticeable cluster around layer 24 and head 6. Approximately 30-40 points.
* **Knowledge (Orange):** Points are primarily located in the upper-right quadrant (layer 12-30, head 6-30). A strong concentration exists around layer 18-24 and head 12-24. Approximately 40-50 points.
* **Linguistic (Green):** Points are distributed across the entire plot, but with a higher density in the upper-left quadrant (layer 0-18, head 12-30). There's a significant cluster around layer 6-12 and head 18-24. Approximately 50-60 points.
**Plot 2: Algorithmic**
* Points are clustered between layer 12 and 24, and head 0 and 12. The density is highest around layer 18-24 and head 6. Approximately 20-30 points.
**Plot 3: Knowledge**
* Points are concentrated between layer 12 and 30, and head 6 and 24. The density is highest around layer 18-24 and head 12-18. Approximately 20-30 points.
**Plot 4: Linguistic**
* Points are distributed between layer 0 and 30, and head 12 and 30. The density is highest around layer 6-18 and head 18-24. Approximately 30-40 points.
### Key Observations
* The "All Categories" plot shows a clear separation of categories based on layer and head values.
* "Algorithmic" data is primarily found in higher layer values.
* "Knowledge" data is concentrated in higher layer and head values.
* "Linguistic" data is more evenly distributed, but with a tendency towards higher head values.
* The "Unclassified" category appears to be more prevalent in lower layer and head values.
### Interpretation
The plots suggest that different categories of data exhibit distinct patterns in the "layer" and "head" dimensions. The "layer" dimension could represent depth or processing stage within a neural network or similar system, while the "head" dimension might represent different attention mechanisms or output features. The separation of categories indicates that these dimensions are useful for distinguishing between different types of information.
The concentration of "Algorithmic" data in higher layers suggests that algorithmic processing occurs later in the system. The distribution of "Knowledge" data indicates that knowledge representation is also more prominent in later stages. The broader distribution of "Linguistic" data suggests that linguistic features are present throughout the system. The "Unclassified" data being concentrated in lower layers could indicate that these are initial, unprocessed inputs.
The plots provide insights into how different categories of information are processed and represented within the system. Further analysis could involve examining the relationships between these categories and the specific features associated with each layer and head. The annotations "3 categories" and "2 categories" on the first plot are unclear without further context, but may refer to the number of distinct clusters or groupings within the data.
</details>
(e) Functionality mapping by MAPS for Phi-2.
<details>
<summary>x10.png Details</summary>
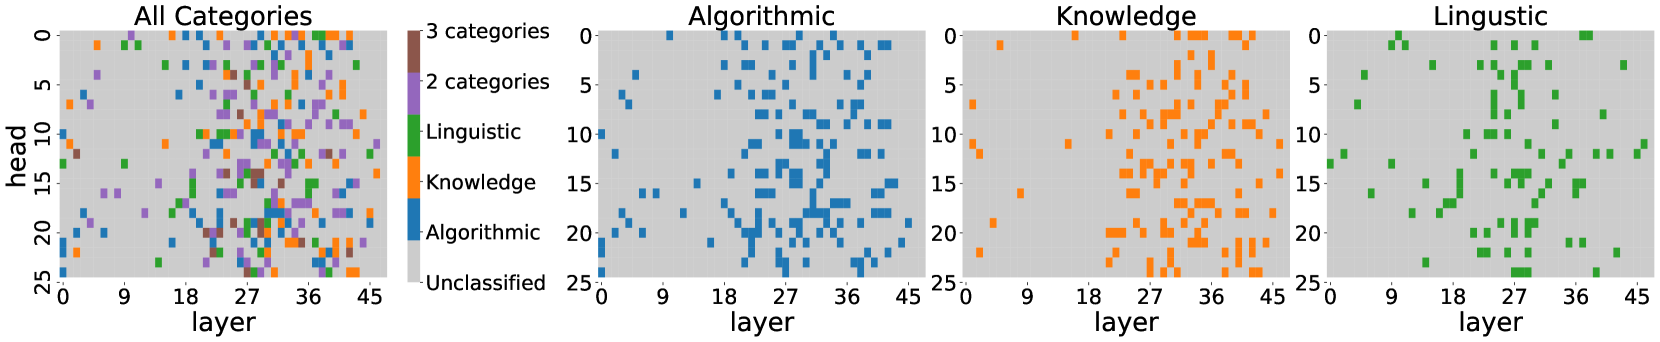
### Visual Description
\n
## Heatmaps: Layer Activation Distribution by Category
### Overview
The image presents four heatmaps visualizing the distribution of activations across layers and heads for different categories. The heatmaps show the relationship between 'layer' (x-axis) and 'head' (y-axis), with color intensity representing the activation level for a specific category. The first heatmap shows all categories combined, while the subsequent three focus on 'Algorithmic', 'Knowledge', and 'Linguistic' categories respectively.
### Components/Axes
* **X-axis (all heatmaps):** 'layer', ranging from approximately 0 to 45, with markers at 0, 9, 18, 27, 36, and 45.
* **Y-axis (all heatmaps):** 'head', ranging from approximately 0 to 25, with markers at 0, 5, 10, 15, 20, and 25.
* **Color (all heatmaps):** Represents activation level.
* **Legend (first heatmap):**
* '3 categories' - Pink
* '2 categories' - Purple
* 'Linguistic' - Green
* 'Knowledge' - Orange
* 'Algorithmic' - Blue
* 'Unclassified' - Grey
* **Titles:** Each heatmap is labeled with the category it represents (e.g., "All Categories", "Algorithmic").
### Detailed Analysis or Content Details
**1. All Categories Heatmap:**
* The heatmap displays a complex pattern of activations across layers and heads.
* There is a high density of activations in the lower-left corner (low layer, low head).
* The pink ('3 categories') and purple ('2 categories') activations are concentrated in the rightmost layers (around 45).
* Green ('Linguistic') activations are scattered throughout, with some concentration in the middle layers (around 18-27).
* Orange ('Knowledge') activations are also scattered, with a slight concentration in the middle layers.
* Blue ('Algorithmic') activations are more prominent in the lower layers (0-18).
* Grey ('Unclassified') activations are sparse, mostly in the lower layers.
**2. Algorithmic Heatmap:**
* The 'Algorithmic' heatmap shows a strong concentration of blue activations in the lower layers (0-18).
* The density of activations decreases as the layer number increases.
* There is a relatively uniform distribution of activations across heads.
**3. Knowledge Heatmap:**
* The 'Knowledge' heatmap displays a concentration of orange activations in the middle layers (approximately 18-36).
* Activations are more sparse in the lower and higher layers.
* There is a noticeable cluster of activations around layer 27.
**4. Linguistic Heatmap:**
* The 'Linguistic' heatmap shows a concentration of green activations in the middle to higher layers (approximately 9-45).
* Activations are relatively evenly distributed across heads.
* There is a noticeable concentration of activations around layer 18.
### Key Observations
* 'Algorithmic' activations are primarily located in the earlier layers, suggesting that algorithmic processing occurs first.
* 'Knowledge' activations are concentrated in the middle layers, indicating that knowledge representation builds upon initial processing.
* 'Linguistic' activations are more prominent in the later layers, suggesting that linguistic analysis happens after initial processing and knowledge representation.
* The 'All Categories' heatmap shows a mix of activations, reflecting the combined activity of all categories.
* The 'Unclassified' category has minimal activation, indicating that most inputs are classified into one of the other categories.
### Interpretation
The heatmaps demonstrate how different categories of information are processed across the layers of a neural network. The spatial distribution of activations suggests a hierarchical processing structure, where 'Algorithmic' features are extracted first, followed by 'Knowledge' representation, and finally 'Linguistic' analysis. The concentration of activations in specific layers for each category indicates that different layers are specialized for processing different types of information. The 'Unclassified' category's low activation suggests the model is effective at categorizing the input data. The patterns observed could be used to understand the internal workings of the model and identify potential areas for improvement. The visualization provides insight into the model's feature extraction and representation learning process.
</details>
(f) Functionality mapping by MAPS for GPT-2 xl.
Figure 5: Functionality mapping by MAPS.
Appendix B Additional Details on Evaluation Experiment
B.1 Correlative Experiment
In § 4.2 we conducted an experiment which calculates the correlation between MAPS ’s estimations and heads outputs during inference.
Implementation details
Recall that the attention head’s formulation that we used: $Y=\tilde{X}W_{VO}$ omits the bias terms of $W_{V},W_{O}$ (§ 2). To account for the bias term of $W_{V}$ in the correlative experiment, where we compute the attention head’s output dynamically, we use both the original attention head definition Vaswani et al. (2017) and the formulation suggested by Elhage et al. (2021), which we have followed so far. First, following Vaswani et al. (2017), we obtain the head’s intermediate output: $\hat{y}∈\mathbb{R}^{n× d_{\text{head}}}$ , where $d_{\text{head}}$ is the inner dimension of the head, often fixed to $\frac{d}{H}$ . Notably, this output already considers the bias term of $W_{V}$ . In Vaswani et al. (2017), $\hat{y}$ is viewed as the head’s final output. Then, following Elhage et al. (2021), we multiply this intermediate output by $W_{O}∈\mathbb{R}^{{d_{\text{head}}× d}}$ and obtain the head’s final output.
We use the following templates: ‘‘This is a document about $\langle$ s $\rangle$ ’’, ‘‘No $\langle$ s $\rangle$ means no’’, ‘‘The story of $\langle$ s $\rangle$ contains’’, ‘‘When I think about $\langle$ s $\rangle$ I think about’’.
Additional results
Tables 8, 9, 10, 11, 12 present the correlation results between the static score $\phi_{R}(h)$ inferred by our method and the score $\phi^{*}_{R}(h)$ observed dynamically (both when we allow contextualization or not), obtained for Llama-3.1 70B, Llama-3.1 8B, Pythia 12B, Pythia 6.9B, GPT-2 xl. We also present the p-values and the maximum relation score obtained for any head in the model for the required relation. Notably, some of the lower correlations are demonstrated for relations that are not fully implemented by the model’s attention heads, as indicated by the small maximum relation scores. Tables 13, 14, 15, 16, 17 present the results (following the same format) for the suppression relation scores.
| Category | Relation | Correlation w/o context | Correlation w/ context | Max relation score (over heads) |
| --- | --- | --- | --- | --- |
| Algorithmic | Copying | 0.84 | 0.81 | 0.22 |
| Name copying | 0.94 | 0.89 | 0.83 | |
| Word to first letter | 0.88 | 0.78 | 0.95 | |
| Word to last letter | 0.66 | 0.39 | 0.16 | |
| Knowledge | Country to capital | 0.93 | 0.88 | 0.87 |
| Country to language | 0.94 | 0.88 | 0.67 | |
| Object to superclass | 0.75 | 0.76 | 0.52 | |
| Product by company | 0.69 | 0.65 | 0.36 | |
| Work to location | 0.58 | 0.58 | 0.31 | |
| Linguistic | Adj to comparative | 0.90 | 0.88 | 0.57 |
| Adj to superlative | 0.90 | 0.84 | 0.67 | |
| Noun to pronoun | 0.57 | 0.41 | 0.33 | |
| Verb to past tense | 0.90 | 0.80 | 0.81 | |
| Word to antonym | 0.93 | 0.91 | 0.62 | |
| Word to compound | 0.85 | 0.82 | 0.39 | |
| Word to homophone | 0.87 | 0.80 | 0.16 | |
| Word to synonym | 0.84 | 0.79 | 0.27 | |
| Translation | English to French | 0.71 | 0.68 | 0.22 |
| English to Spanish | 0.85 | 0.83 | 0.47 | |
Table 8: Correlation between the relation score of a head and the head’s output in Llama-3.1 70B, with and without head contextualization. The “max relation score” is the highest relation score achieved by a head in the model. All p-values observed are 0.
| Category | Relation | Correlation w/o context | Correlation w/ context | Max relation score (over heads) |
| --- | --- | --- | --- | --- |
| Algorithmic | Copying | 0.76 | 0.73 | 0.18 |
| Name copying | 0.95 | 0.95 | 0.71 | |
| Word to first letter | 0.90 | 0.78 | 0.89 | |
| Word to last letter | 0.67 | 0.36 | 0.27 | |
| Knowledge | Country to capital | 0.85 | 0.85 | 0.49 |
| Country to language | 0.76 | 0.62 | 0.31 | |
| Object to superclass | 0.74 | 0.73 | 0.15 | |
| Product by company | 0.46 | 0.49 | 0.18 | |
| Work to location | 0.44 | 0.45 | 0.10 | |
| Linguistic | Adj to comparative | 0.85 | 0.86 | 0.60 |
| Adj to superlative | 0.87 | 0.89 | 0.59 | |
| Noun to pronoun | 0.89 | 0.79 | 0.57 | |
| Verb to past tense | 0.91 | 0.86 | 0.73 | |
| Word to antonym | 0.90 | 0.86 | 0.37 | |
| Word to compound | 0.78 | 0.62 | 0.21 | |
| Word to homophone | 0.85 | 0.75 | 0.08 | |
| Word to synonym | 0.79 | 0.69 | 0.17 | |
| Translation | English to French | 0.71 | 0.68 | 0.12 |
| English to Spanish | 0.82 | 0.81 | 0.29 | |
Table 9: Correlation between the relation score of a head and the head’s output in Llama-3.1 8B, with and without head contextualization. The “max relation score” is the highest relation score achieved by a head in the model. All p-values observed are $≤$ 3.9e-128.
| Category | Relation | Correlation w/o context | Correlation w/ context | Max relation score (over heads) |
| --- | --- | --- | --- | --- |
| Algorithmic | Copying | 0.89 | 0.60 | 0.42 |
| Name copying | 0.86 | 0.57 | 0.65 | |
| Word to first letter | 0.84 | 0.62 | 0.75 | |
| Word to last letter | 0.36 | 0.17 | 0.16 | |
| Year to following | 0.90 | 0.78 | 1.00 | |
| Knowledge | Country to capital | 0.93 | 0.89 | 0.97 |
| Country to language | 0.94 | 0.89 | 0.86 | |
| Object to superclass | 0.88 | 0.87 | 0.74 | |
| Work to location | 0.75 | 0.64 | 0.29 | |
| Linguistic | Adj to comparative | 0.92 | 0.80 | 0.95 |
| Noun to pronoun | 0.85 | 0.74 | 0.50 | |
| Verb to past tense | 0.89 | 0.71 | 0.54 | |
| Word to antonym | 0.92 | 0.85 | 0.60 | |
| Word to homophone | 0.67 | 0.43 | 0.07 | |
| Word to synonym | 0.90 | 0.67 | 0.35 | |
Table 10: Correlation between the relation score of a head and the head’s output in Pythia 12B, with and without head contextualization. The “max relation score” is the highest relation score achieved by a head in the model. All p-values observed are $≤$ 5.7e-40.
| Category | Relation | Correlation w/o context | Correlation w/ context | Max relation score (over heads) |
| --- | --- | --- | --- | --- |
| Algorithmic | Copying | 0.88 | 0.45 | 0.53 |
| Name copying | 0.94 | 0.62 | 0.96 | |
| Word to first letter | 0.87 | 0.64 | 0.67 | |
| Word to last letter | 0.44 | 0.43 | 0.27 | |
| Year to following | 0.94 | 0.79 | 0.99 | |
| Knowledge | Country to capital | 0.95 | 0.91 | 0.97 |
| Country to language | 0.91 | 0.86 | 0.84 | |
| Object to superclass | 0.88 | 0.88 | 0.72 | |
| Work to location | 0.76 | 0.68 | 0.29 | |
| Linguistic | Adj to comparative | 0.91 | 0.76 | 0.77 |
| Noun to pronoun | 0.89 | 0.67 | 0.63 | |
| Verb to past tense | 0.91 | 0.70 | 0.81 | |
| Word to antonym | 0.93 | 0.87 | 0.64 | |
| Word to homophone | 0.70 | 0.38 | 0.05 | |
| Word to synonym | 0.93 | 0.64 | 0.36 | |
Table 11: Correlation between the relation score of a head and the head’s output in Pythia 6.9B, with and without head contextualization. The “max relation score” is the highest relation score achieved by a head in the model. All p-values observed are $≤$ 1.7e-139.
| Category | Relation | Correlation w/o context | Correlation w/ context | Max relation score (over heads) |
| --- | --- | --- | --- | --- |
| Algorithmic | Copying | 0.95 | 0.65 | 0.52 |
| Name copying | 0.97 | 0.70 | 0.92 | |
| Word to first letter | 0.91 | 0.69 | 0.32 | |
| Word to last letter | 0.61 | 0.20 | 0.05 | |
| Year to following | 0.94 | 0.74 | 0.95 | |
| Knowledge | Country to capital | 0.98 | 0.88 | 0.98 |
| Country to language | 0.96 | 0.84 | 0.75 | |
| Object to superclass | 0.94 | 0.81 | 0.43 | |
| Product by company | 0.96 | 0.91 | 0.65 | |
| Work to location | 0.88 | 0.73 | 0.31 | |
| Linguistic | Adj to comparative | 0.95 | 0.78 | 0.88 |
| Adj to superlative | 0.94 | 0.73 | 0.54 | |
| Noun to pronoun | 0.96 | 0.68 | 0.58 | |
| Verb to past tense | 0.93 | 0.76 | 0.28 | |
| Word to antonym | 0.96 | 0.85 | 0.38 | |
| Word to compound | 0.80 | 0.65 | 0.17 | |
| Word to homophone | 0.46 | 0.38 | 0.02 | |
| Word to synonym | 0.95 | 0.79 | 0.21 | |
Table 12: Correlation between the relation score of a head and the head’s output in GPT-2 xl, with and without head contextualization. The “max relation score” is the highest relation score achieved by a head in the model. All p-values observed are $≤$ 1.1e-45.
| Category | Relation | Correlation w/o context | Correlation w/ context | Max relation score (over heads) |
| --- | --- | --- | --- | --- |
| Algorithmic | Copying | 0.88 | 0.85 | 0.18 |
| Name copying | 0.95 | 0.83 | 0.66 | |
| Word to first letter | 0.86 | 0.72 | 0.56 | |
| Word to last letter | 0.56 | 0.42 | 0.33 | |
| Knowledge | Country to capital | 0.91 | 0.90 | 0.84 |
| Country to language | 0.89 | 0.89 | 0.49 | |
| Object to superclass | 0.81 | 0.83 | 0.39 | |
| Product by company | 0.81 | 0.78 | 0.31 | |
| Work to location | 0.70 | 0.70 | 0.21 | |
| Linguistic | Adj to comparative | 0.91 | 0.88 | 0.72 |
| Adj to superlative | 0.90 | 0.87 | 0.56 | |
| Noun to pronoun | 0.33 | 0.30 | 0.46 | |
| Verb to past tense | 0.91 | 0.80 | 0.54 | |
| Word to antonym | 0.91 | 0.80 | 0.35 | |
| Word to compound | 0.86 | 0.82 | 0.24 | |
| Word to homophone | 0.91 | 0.81 | 0.31 | |
| Word to synonym | 0.83 | 0.77 | 0.21 | |
| Translation | English to French | 0.61 | 0.59 | 0.09 |
| English to Spanish | 0.86 | 0.83 | 0.35 | |
Table 13: Correlation between the suppression relation score of a head and the head’s output in Llama-3.1 70B, with and without head contextualization. The “max relation score” is the highest relation score achieved by a head in the model. All p-values observed are 0.
| Category | Relation | Correlation w/o context | Correlation w/ context | Max relation score (over heads) |
| --- | --- | --- | --- | --- |
| Algorithmic | Copying | 0.77 | 0.74 | 0.11 |
| Name copying | 0.99 | 0.95 | 0.72 | |
| Word to first letter | 0.78 | 0.41 | 0.61 | |
| Word to last letter | 0.77 | 0.31 | 0.25 | |
| Knowledge | Country to capital | 0.90 | 0.87 | 0.18 |
| Country to language | 0.76 | 0.74 | 0.20 | |
| Object to superclass | 0.61 | 0.63 | 0.08 | |
| Product by company | 0.44 | 0.38 | 0.08 | |
| Work to location | 0.40 | 0.32 | 0.12 | |
| Linguistic | Adj to comparative | 0.81 | 0.91 | 0.81 |
| Adj to superlative | 0.87 | 0.93 | 0.62 | |
| Noun to pronoun | 0.80 | 0.57 | 0.40 | |
| Verb to past tense | 0.90 | 0.85 | 0.46 | |
| Word to antonym | 0.81 | 0.70 | 0.29 | |
| Word to compound | 0.84 | 0.76 | 0.24 | |
| Word to homophone | 0.89 | 0.61 | 0.17 | |
| Word to synonym | 0.75 | 0.65 | 0.09 | |
| Translation | English to French | 0.74 | 0.65 | 0.06 |
| English to Spanish | 0.84 | 0.81 | 0.26 | |
Table 14: Correlation between the suppression relation score of a head and the head’s output in Llama-3.1 8B, with and without head contextualization. The “max relation score” is the highest relation score achieved by a head in the model. All p-values observed are $≤$ 2.6e-89.
| Category | Relation | Correlation w/o context | Correlation w/ context | Max relation score (over heads) |
| --- | --- | --- | --- | --- |
| Algorithmic | Copying | 0.91 | 0.78 | 0.31 |
| Name copying | 0.99 | 0.72 | 1.00 | |
| Word to first letter | 0.48 | 0.18 | 0.11 | |
| Word to last letter | 0.59 | 0.23 | 0.19 | |
| Year to following | 0.39 | 0.59 | 0.12 | |
| Knowledge | Country to capital | 0.63 | 0.62 | 0.56 |
| Country to language | 0.84 | 0.70 | 0.46 | |
| Object to superclass | 0.79 | 0.77 | 0.41 | |
| Work to location | 0.61 | 0.64 | 0.24 | |
| Linguistic | Adj to comparative | 0.93 | 0.74 | 0.73 |
| Noun to pronoun | 0.68 | 0.29 | 0.28 | |
| Verb to past tense | 0.96 | 0.75 | 0.73 | |
| Word to antonym | 0.90 | 0.77 | 0.32 | |
| Word to homophone | 0.61 | 0.39 | 0.03 | |
| Word to synonym | 0.82 | 0.63 | 0.16 | |
Table 15: Correlation between the suppression relation score of a head and the head’s output in Pythia 12B, with and without head contextualization. The “max relation score” is the highest relation score achieved by a head in the model. All p-values observed are $≤$ 2.2e-45.
| Category | Relation | Correlation w/o context | Correlation w/ context | Max relation score (over heads) |
| --- | --- | --- | --- | --- |
| Algorithmic | Copying | 0.88 | 0.81 | 0.41 |
| Name copying | 0.98 | 0.79 | 0.96 | |
| Word to first letter | 0.81 | 0.37 | 0.31 | |
| Word to last letter | 0.30 | 0.08 | 0.24 | |
| Year to following | 0.45 | 0.80 | 0.33 | |
| Knowledge | Country to capital | 0.92 | 0.91 | 0.66 |
| Country to language | 0.89 | 0.81 | 0.51 | |
| Object to superclass | 0.86 | 0.78 | 0.33 | |
| Work to location | 0.73 | 0.58 | 0.21 | |
| Linguistic | Adj to comparative | 0.95 | 0.83 | 0.59 |
| Noun to pronoun | 0.86 | 0.51 | 0.56 | |
| Verb to past tense | 0.94 | 0.80 | 0.82 | |
| Word to antonym | 0.91 | 0.78 | 0.30 | |
| Word to homophone | 0.49 | 0.31 | 0.02 | |
| Word to synonym | 0.87 | 0.73 | 0.13 | |
Table 16: Correlation between the suppression relation score of a head and the head’s output in Pythia 6.9B, with and without head contextualization. The “max relation score” is the highest relation score achieved by a head in the model. All p-values observed are $≤$ 3.6e-7.
| Category | Relation | Correlation w/o context | Correlation w/ context | Max relation score (over heads) |
| --- | --- | --- | --- | --- |
| Algorithmic | Copying | 0.97 | 0.71 | 0.29 |
| Name copying | 0.99 | 0.72 | 0.97 | |
| Word to first letter | 0.78 | 0.52 | 0.04 | |
| Word to last letter | 0.78 | 0.54 | 0.06 | |
| Year to following | 0.75 | 0.52 | 0.32 | |
| Knowledge | Country to capital | 0.94 | 0.80 | 0.72 |
| Country to language | 0.96 | 0.78 | 0.50 | |
| Object to superclass | 0.89 | 0.82 | 0.23 | |
| Product by company | 0.88 | 0.77 | 0.33 | |
| Work to location | 0.83 | 0.62 | 0.18 | |
| Linguistic | Adj to comparative | 0.86 | 0.60 | 0.38 |
| Adj to superlative | 0.81 | 0.59 | 0.27 | |
| Noun to pronoun | 0.92 | 0.34 | 0.40 | |
| Verb to past tense | 0.84 | 0.64 | 0.17 | |
| Word to antonym | 0.53 | 0.37 | 0.05 | |
| Word to compound | 0.80 | 0.58 | 0.14 | |
| Word to homophone | 0.10 | 0.04 | 0.01 | |
| Word to synonym | 0.81 | 0.59 | 0.08 | |
Table 17: Correlation between the suppression relation score of a head and the head’s output in GPT-2 xl, with and without head contextualization. The “max relation score” is the highest relation score achieved by a head in the model. All p-values observed are $≤$ 2.3e-3.
| Relation | Prompt |
| --- | --- |
| Adj to comparative | lovely-> lovelier; edgy-> edgier; <s>-> |
| Copying | walk-> walk; cat-> cat; water-> water; <s>-> |
| Country to capital | The capital of <s> is |
| Country to language | The official language of <s> is |
| English to Spanish | apartment-> departamento; computer-> computadora; tribe-> tribu; <s>-> |
| Name copying | John-> John; Donna-> Donna; <s>-> |
| Noun to pronoun | mother-> she; father-> he; tribe-> they; actress-> she; apartment-> it; <s>-> |
| Object to superclass | A <s> is a kind of |
| Product by company | Nesquik is made by Nestlé; Mustang is made by Ford; <s> is made by |
| Verb to past tense | hike->hiked; purchase-> purchased; <s>-> |
| Word to first letter | word-> w, o, r, d; cat-> c, a, t; <s>-> |
| Word to last letter | word-> d, r, o, w; cat-> t, a, c; <s>-> |
| Year to following | 1300-> 1301; 1000-> 1001; <s>-> |
Table 18: Relations and prompts used in the causal experiment. The < s> string is replaced with the relation’s source tokens.
B.2 Causal Experiment
In § 4.2 we measured the causal effect of removing the heads that implement a specific operation on the model’s performance in handling queries that depend on that operation.
Implementation details
We evaluate models on tasks for 13 relations. For each model, we filter out relations where (a) the base accuracy is very low ( $<$ 0.1) or (b) there is no dataset for the relation (see § A). The task prompts used for the different relations are presented in Table 18. Notably, When ablating an attention head, we remove its output only from the last position of the prompt.
Additional results
In Tables 19, 20, 21, 22, 23 we present the extended experiment results for Llama-3.1 70B, Llama-3.1 8B, Pythia 12B, Pythia 6.9B, GPT-2 xl.
| Relation name | # heads removed | TR tasks | CTR tasks | | | | |
| --- | --- | --- | --- | --- | --- | --- | --- |
| Base | -TR | -RND | # tasks | Base (CTR) | -TR (CTR) | | |
| Adj to comparative | 175 | 0.98 | $\downarrow$ 13% 0.85 | $\downarrow$ 0% 0.98 $±$ 0.00 | 5 | 0.94 $±$ 0.05 | $\downarrow$ 3% 0.92 $±$ 0.08 |
| Copying | 250 | 0.97 | $\downarrow$ 30% 0.68 | $\downarrow$ 0% 0.97 $±$ 0.01 | 3 | 0.97 $±$ 0.03 | $\downarrow$ 23% 0.75 $±$ 0.34 |
| Country to capital | 118 | 0.84 | $\downarrow$ 66% 0.29 | $\uparrow$ 1% 0.85 $±$ 0.09 | 5 | 0.93 $±$ 0.08 | $\uparrow$ 0% 0.94 $±$ 0.09 |
| Country to language | 133 | 0.96 | $\downarrow$ 6% 0.90 | $\downarrow$ 0% 0.96 $±$ 0.00 | 4 | 0.92 $±$ 0.08 | $\downarrow$ 1% 0.92 $±$ 0.10 |
| English to Spanish | 175 | 0.91 | $\downarrow$ 6% 0.85 | $\uparrow$ 0% 0.91 $±$ 0.00 | 4 | 0.97 $±$ 0.03 | $\uparrow$ 0% 0.97 $±$ 0.03 |
| Name copying | 205 | 0.99 | $\downarrow$ 95% 0.05 | $\uparrow$ 1% 1.00 $±$ 0.00 | 3 | 0.97 $±$ 0.03 | $\downarrow$ 15% 0.83 $±$ 0.23 |
| Noun to pronoun | 154 | 0.98 | $\uparrow$ 0% 0.98 | $\uparrow$ 0% 0.98 $±$ 0.00 | 5 | 0.93 $±$ 0.08 | $\downarrow$ 1% 0.92 $±$ 0.09 |
| Object to superclass | 119 | 0.79 | $\downarrow$ 4% 0.76 | $\downarrow$ 2% 0.77 $±$ 0.02 | 5 | 0.88 $±$ 0.11 | $\downarrow$ 3% 0.85 $±$ 0.15 |
| Product by company | 59 | 0.67 | $\downarrow$ 4% 0.64 | $\downarrow$ 0% 0.67 $±$ 0.00 | 1 | 0.79 $±$ 0.00 | $\downarrow$ 2% 0.77 $±$ 0.00 |
| Word to first letter | 250 | 1.00 | $\downarrow$ 8% 0.92 | $\downarrow$ 0% 1.00 $±$ 0.00 | 5 | 0.94 $±$ 0.05 | $\downarrow$ 5% 0.89 $±$ 0.14 |
| Word to last letter | 250 | 0.92 | $\downarrow$ 18% 0.76 | $\uparrow$ 1% 0.93 $±$ 0.01 | 5 | 0.94 $±$ 0.05 | $\uparrow$ 1% 0.95 $±$ 0.04 |
Table 19: Accuracy of Llama-3.1 70B on tasks for a target relation (TR) versus on control (CTR) tasks, when removing heads implementing the relation compared to when removing random heads (RND). Results for RND heads are averaged over 5 experiments.
| Relation name | # heads removed | TR tasks | CTR tasks | | | | |
| --- | --- | --- | --- | --- | --- | --- | --- |
| Base | -TR | -RND | # tasks | Base (CTR) | -TR (CTR) | | |
| Adj to comparative | 69 | 0.98 | $\downarrow$ 7% 0.91 | $\downarrow$ 3% 0.95 $±$ 0.05 | 4 | 0.96 $±$ 0.04 | $\uparrow$ 0% 0.96 $±$ 0.04 |
| Copying | 150 | 1.00 | $\downarrow$ 94% 0.06 | $\downarrow$ 0% 1.00 $±$ 0.00 | 3 | 0.95 $±$ 0.04 | $\downarrow$ 5% 0.91 $±$ 0.05 |
| Country to capital | 19 | 0.89 | $\downarrow$ 75% 0.22 | $\uparrow$ 2% 0.91 $±$ 0.03 | 5 | 0.87 $±$ 0.12 | $\uparrow$ 1% 0.87 $±$ 0.12 |
| Country to language | 30 | 0.98 | $\downarrow$ 50% 0.49 | $\uparrow$ 1% 0.99 $±$ 0.01 | 5 | 0.98 $±$ 0.02 | $\downarrow$ 0% 0.98 $±$ 0.02 |
| English to Spanish | 54 | 0.94 | $\uparrow$ 3% 0.97 | $\downarrow$ 1% 0.93 $±$ 0.01 | 3 | 0.95 $±$ 0.04 | $\uparrow$ 2% 0.97 $±$ 0.02 |
| Name copying | 70 | 1.00 | $\downarrow$ 87% 0.13 | $\downarrow$ 0% 1.00 $±$ 0.00 | 2 | 0.94 $±$ 0.05 | $\downarrow$ 4% 0.90 $±$ 0.08 |
| Noun to pronoun | 35 | 0.98 | $\downarrow$ 0% 0.98 | $\uparrow$ 0% 0.99 $±$ 0.00 | 5 | 0.97 $±$ 0.04 | $\uparrow$ 1% 0.98 $±$ 0.03 |
| Object to superclass | 34 | 0.74 | $\downarrow$ 11% 0.66 | $\uparrow$ 1% 0.75 $±$ 0.01 | 2 | 0.79 $±$ 0.09 | $\downarrow$ 3% 0.77 $±$ 0.07 |
| Product by company | 12 | 0.54 | $\downarrow$ 5% 0.51 | $\uparrow$ 4% 0.56 $±$ 0.01 | 1 | 0.70 $±$ 0.00 | $\downarrow$ 1% 0.69 $±$ 0.00 |
| Verb to past tense | 113 | 0.70 | $\downarrow$ 61% 0.27 | $\downarrow$ 7% 0.65 $±$ 0.10 | 2 | 0.71 $±$ 0.18 | $\downarrow$ 1% 0.70 $±$ 0.14 |
| Word to first letter | 150 | 1.00 | $\downarrow$ 98% 0.02 | $\downarrow$ 0% 1.00 $±$ 0.00 | 5 | 0.96 $±$ 0.04 | $\downarrow$ 30% 0.67 $±$ 0.33 |
Table 20: Accuracy of Llama-3.1 8B on tasks for a target relation (TR) versus on control (CTR) tasks, when removing heads implementing the relation compared to when removing random heads (RND). Results for RND heads are averaged over 5 experiments.
| Relation name | # heads removed | TR tasks | CTR tasks | | | | |
| --- | --- | --- | --- | --- | --- | --- | --- |
| Base | -TR | -RND | # tasks | Base (CTR) | -TR (CTR) | | |
| Adj to comparative | 150 | 0.91 | $\downarrow$ 77% 0.20 | $\downarrow$ 10% 0.82 $±$ 0.07 | 3 | 0.92 $±$ 0.04 | $\downarrow$ 32% 0.63 $±$ 0.18 |
| Copying | 150 | 1.00 | $\downarrow$ 32% 0.68 | $\downarrow$ 0% 1.00 $±$ 0.00 | 3 | 0.95 $±$ 0.05 | $\downarrow$ 7% 0.88 $±$ 0.11 |
| Country to capital | 75 | 0.97 | $\downarrow$ 100% 0.00 | $\downarrow$ 2% 0.95 $±$ 0.02 | 2 | 0.89 $±$ 0.02 | $\uparrow$ 0% 0.90 $±$ 0.01 |
| Country to language | 94 | 1.00 | $\downarrow$ 92% 0.08 | $\downarrow$ 4% 0.96 $±$ 0.01 | 2 | 0.89 $±$ 0.01 | $\downarrow$ 0% 0.89 $±$ 0.01 |
| Name copying | 150 | 1.00 | $\downarrow$ 76% 0.24 | $\downarrow$ 0% 1.00 $±$ 0.00 | 2 | 0.90 $±$ 0.02 | $\uparrow$ 2% 0.92 $±$ 0.05 |
| Noun to pronoun | 105 | 0.88 | $\downarrow$ 48% 0.46 | $\downarrow$ 2% 0.86 $±$ 0.03 | 5 | 0.90 $±$ 0.07 | $\downarrow$ 3% 0.88 $±$ 0.08 |
| Object to superclass | 75 | 0.78 | $\downarrow$ 50% 0.39 | $\downarrow$ 13% 0.68 $±$ 0.03 | 2 | 0.90 $±$ 0.02 | $\downarrow$ 3% 0.87 $±$ 0.09 |
| Verb to past tense | 150 | 0.22 | $\downarrow$ 84% 0.04 | $\uparrow$ 17% 0.26 $±$ 0.11 | 1 | 0.03 $±$ 0.00 | $\downarrow$ 33% 0.02 $±$ 0.00 |
| Word to first letter | 150 | 0.91 | $\downarrow$ 63% 0.34 | $\downarrow$ 4% 0.87 $±$ 0.04 | 5 | 0.91 $±$ 0.08 | $\downarrow$ 19% 0.74 $±$ 0.30 |
| Year to following | 56 | 0.92 | $\downarrow$ 100% 0.00 | $\downarrow$ 5% 0.87 $±$ 0.07 | 2 | 0.83 $±$ 0.05 | $\downarrow$ 5% 0.79 $±$ 0.03 |
Table 21: Accuracy of Pythia 12B on tasks for a target relation (TR) versus its accuracy on control (CTR) tasks, when removing heads implementing the relation compared to when removing random heads (RND). Results for RND heads are averaged over 5 experiments.
| Relation name | # heads removed | TR tasks | CTR tasks | | | | |
| --- | --- | --- | --- | --- | --- | --- | --- |
| Base | -TR | -RND | # tasks | Base (CTR) | -TR (CTR) | | |
| Adj to comparative | 124 | 0.52 | $\downarrow$ 100% 0.00 | $\downarrow$ 51% 0.25 $±$ 0.18 | 1 | 0.68 $±$ 0.00 | $\downarrow$ 25% 0.51 $±$ 0.00 |
| Copying | 150 | 1.00 | $\downarrow$ 93% 0.07 | $\downarrow$ 1% 0.99 $±$ 0.01 | 0 | | |
| Country to capital | 45 | 0.97 | $\downarrow$ 100% 0.00 | $\downarrow$ 1% 0.96 $±$ 0.02 | 1 | 1.00 $±$ 0.00 | $\downarrow$ 0% 1.00 $±$ 0.00 |
| Country to language | 74 | 0.97 | $\downarrow$ 92% 0.08 | $\uparrow$ 1% 0.98 $±$ 0.01 | 0 | | |
| Name copying | 143 | 1.00 | $\downarrow$ 97% 0.03 | $\downarrow$ 1% 0.99 $±$ 0.01 | 0 | | |
| Noun to pronoun | 102 | 0.68 | $\downarrow$ 46% 0.37 | $\uparrow$ 13% 0.77 $±$ 0.09 | 3 | 0.68 $±$ 0.11 | $\downarrow$ 25% 0.51 $±$ 0.22 |
| Object to superclass | 67 | 0.78 | $\downarrow$ 53% 0.37 | $\downarrow$ 4% 0.75 $±$ 0.02 | 2 | 0.71 $±$ 0.03 | $\uparrow$ 1% 0.71 $±$ 0.18 |
| Verb to past tense | 150 | 0.43 | $\downarrow$ 94% 0.03 | $\downarrow$ 16% 0.36 $±$ 0.07 | 0 | | |
| Word to first letter | 66 | 1.00 | $\downarrow$ 100% 0.00 | $\downarrow$ 0% 1.00 $±$ 0.00 | 2 | 0.97 $±$ 0.00 | $\downarrow$ 13% 0.85 $±$ 0.13 |
| Year to following | 52 | 0.73 | $\downarrow$ 100% 0.00 | $\uparrow$ 5% 0.77 $±$ 0.07 | 2 | 0.73 $±$ 0.05 | $\downarrow$ 2% 0.71 $±$ 0.05 |
Table 22: Accuracy of Pythia 6.9B on tasks for a target relation (TR) versus its accuracy on control (CTR) tasks, when removing heads implementing the relation compared to when removing random heads (RND). Results for RND heads are averaged over 5 experiments.
| Relation name | # heads removed | TR tasks | CTR tasks | | | | |
| --- | --- | --- | --- | --- | --- | --- | --- |
| Base | -TR | -RND | # tasks | Base (CTR) | -TR (CTR) | | |
| Copying | 150 | 0.99 | $\downarrow$ 30% 0.69 | $\downarrow$ 0% 0.99 $±$ 0.00 | 0 | | |
| Country to capital | 38 | 0.88 | $\downarrow$ 100% 0.00 | $\downarrow$ 3% 0.86 $±$ 0.05 | 1 | 0.71 $±$ 0.00 | $\uparrow$ 2% 0.72 $±$ 0.00 |
| Country to language | 148 | 0.96 | $\downarrow$ 91% 0.08 | $\downarrow$ 2% 0.94 $±$ 0.01 | 0 | | |
| Name copying | 133 | 0.76 | $\downarrow$ 100% 0.00 | $\downarrow$ 15% 0.65 $±$ 0.08 | 1 | 0.71 $±$ 0.00 | $\downarrow$ 15% 0.60 $±$ 0.00 |
| Noun to pronoun | 27 | 0.71 | $\downarrow$ 26% 0.53 | $\downarrow$ 2% 0.69 $±$ 0.04 | 4 | 0.72 $±$ 0.13 | $\downarrow$ 3% 0.69 $±$ 0.16 |
| Object to superclass | 99 | 0.71 | $\downarrow$ 54% 0.32 | $\downarrow$ 1% 0.70 $±$ 0.02 | 1 | 0.71 $±$ 0.00 | $\downarrow$ 42% 0.41 $±$ 0.00 |
| Product by company | 73 | 0.40 | $\downarrow$ 81% 0.08 | $\downarrow$ 0% 0.40 $±$ 0.00 | 1 | 0.40 $±$ 0.00 | $\uparrow$ 2% 0.41 $±$ 0.00 |
| Verb to past tense | 150 | 0.40 | $\downarrow$ 56% 0.18 | $\downarrow$ 4% 0.38 $±$ 0.18 | 0 | | |
| Word to first letter | 62 | 0.18 | $\downarrow$ 16% 0.16 | $\downarrow$ 1% 0.18 $±$ 0.02 | 1 | 0.04 $±$ 0.00 | $\uparrow$ 250% 0.15 $±$ 0.00 |
| Year to following | 54 | 0.53 | $\downarrow$ 100% 0.00 | $\downarrow$ 5% 0.50 $±$ 0.03 | 1 | 0.71 $±$ 0.00 | $\downarrow$ 36% 0.45 $±$ 0.00 |
Table 23: Accuracy of GPT-2 xl on tasks for a target relation (TR) versus its accuracy on control (CTR) tasks, when removing heads implementing the relation compared to when removing random heads (RND). Results for RND heads are averaged over 5 experiments.
Appendix C Generalization to Multi-Token Entities – Additional Results
In § 4.3 we conducted an experiment that evaluates how well the classifications by MAPS generalize to contextualized inputs. Table 24 shows the full results of this experiment. We omit the correlations for GPT-2 xl and the relation word to last letter, as all static scores are very small ( $≤$ 0.05).
| Model | Relation | # samples | W/o context | W/ context | | |
| --- | --- | --- | --- | --- | --- | --- |
| Single-token | Multi-token | Single-token | Multi-token | | | |
| Pythia 12B | Copying | 283 | 0.91 | 0.85 | 0.48 | 0.44 |
| Country to capital | 30 | 0.94 | 0.93 | 0.85 | 0.87 | |
| Country to language | 70 | 0.94 | 0.90 | 0.88 | 0.83 | |
| Name copying | 83 | 0.87 | 0.76 | 0.38 | 0.33 | |
| Noun to pronoun | 174 | 0.84 | 0.85 | 0.78 | 0.79 | |
| Object to superclass | 91 | 0.88 | 0.89 | 0.84 | 0.86 | |
| Word to first letter | 77 | 0.83 | 0.73 | 0.56 | 0.64 | |
| Word to last letter | 77 | 0.34 | 0.50 | 0.11 | 0.09 | |
| Word to synonym | 71 | 0.92 | 0.86 | 0.61 | 0.58 | |
| Work to location | 65 | 0.77 | 0.72 | 0.74 | 0.70 | |
| Year to following | 65 | 0.90 | 0.84 | 0.64 | 0.60 | |
| Pythia 6.9B | Copying | 283 | 0.90 | 0.87 | 0.34 | 0.32 |
| Country to capital | 30 | 0.95 | 0.93 | 0.89 | 0.89 | |
| Country to language | 70 | 0.92 | 0.88 | 0.85 | 0.83 | |
| Name copying | 83 | 0.94 | 0.92 | 0.47 | 0.47 | |
| Noun to pronoun | 174 | 0.89 | 0.85 | 0.69 | 0.70 | |
| Object to superclass | 91 | 0.88 | 0.90 | 0.86 | 0.82 | |
| Word to first letter | 77 | 0.89 | 0.79 | 0.59 | 0.66 | |
| Word to last letter | 77 | 0.45 | 0.70 | 0.44 | 0.44 | |
| Word to synonym | 71 | 0.94 | 0.91 | 0.62 | 0.62 | |
| Work to location | 65 | 0.79 | 0.76 | 0.71 | 0.75 | |
| Year to following | 65 | 0.94 | 0.87 | 0.72 | 0.67 | |
| GPT-2 xl | Copying | 301 | 0.95 | 0.88 | 0.68 | 0.64 |
| Country to capital | 34 | 0.98 | 0.97 | 0.87 | 0.86 | |
| Country to language | 70 | 0.96 | 0.91 | 0.82 | 0.80 | |
| Name copying | 91 | 0.97 | 0.93 | 0.60 | 0.58 | |
| Noun to pronoun | 154 | 0.97 | 0.95 | 0.47 | 0.56 | |
| Object to superclass | 97 | 0.93 | 0.89 | 0.83 | 0.82 | |
| Word to first letter | 78 | 0.92 | 0.89 | 0.53 | 0.72 | |
| Word to synonym | 79 | 0.95 | 0.89 | 0.79 | 0.76 | |
| Work to location | 67 | 0.89 | 0.80 | 0.74 | 0.76 | |
| Year to following | 90 | 0.95 | 0.82 | 0.74 | 0.63 | |
Table 24: Extended results for the multi-token experiment, presented in Section 4.3. All p-values observed are $≤$ 9.3e-4.
Appendix D Comparison to Head Operations Identified in Prior Works
Name-mover heads in GPT-2 small
Wang et al. (2023) studied the Indirect Object Identification circuit in GPT-2 small. Analyzing the operations of the circuit’s heads, they defined heads that copy names as Name-Mover heads and heads that suppress names as Negative Name-Mover heads. They also classified heads that contribute to these tasks when the original mover heads are ablated as “backup” mover heads.
Using MAPS we classified all three name-mover heads as implementing the name copying relation, and the two negative name-mover heads as implementing the suppression variant of name copying. We note that a similar analysis was performed by Wang et al. (2023) as well. However, by applying MAPS to all heads in the model, and not just the heads in the discovered circuit, we were able to identify 21 additional name-copying heads as well, 6 of which were identified by Wang et al. (2023) as “backup” heads. One backup mover head and one backup negative mover head that were identified by Wang et al. (2023), were not identified by MAPS. Moreover, we find that each of the five identified name-mover heads implements a myriad of other relations. In Figure 6(a) we present the name copying relation scores for all heads in GPT-2 small and the heads classified by Wang et al. (2023).
We further examined the name copying heads not classified by Wang et al. (2023), to study whether their omission was mostly due to limited involvement in the specific task studied by Wang et al. (2023), or instead a consequence of inaccurate estimations by MAPS. These heads show a strong correlation (0.94, p-value of $2.5e{-7}$ ) between their name copying static and dynamic relation scores (for the prompt This is a document about $\langle$ s $\rangle$ , see § 4.2), when attention is restricted to the name position, suggesting that they indeed copy names when they attend to them. However, the attention weight assigned to the name token may change depending on the context. For example, head 8.11 in GPT-2 small has a static relation score of 0.88. Its dynamic relation score is 0.23 for the prompt This is a document about $\langle$ s $\rangle$ , but it increases substantially to 0.92 for the prompt “ John->John; Donna-> Donna; $\langle$ s $\rangle$ -> ”. We anticipate that other relation heads will demonstrate the name-copying functionality for other prompts or interventions. Crafting prompts that steer heads to demonstrate a specific functionality over another (for example by adapting MAPS to the $W_{QK}$ matrix) is an interesting direction for future work.
Mover heads in GPT-2 medium
Merullo et al. (2024a) studied the Indirect Object Identification (IOI) and Colored Objects circuits in GPT-2 medium. They discovered two sets of attention heads implementing certain functions, both called “Mover” heads. Heads from the first set copy names (in IOI), and heads from the second set copy colors (in the Colored Objects task). The authors also point out a significant overlap between the two sets.
Using MAPS, we classified all mover heads as implementing the name copying relation. We find that many of these heads also implement the relations: year to following, country to language, country to capital, copying. Lastly, we identify 31 other name-copying heads. Notably, in our counting, we omit the heads 14.5, 17.10, 16.0, 18.12, and 21.7, which are labeled in Figure 2 of Merullo et al. (2024a) as Mover-heads. This is because, to the best of our understanding, the paper does not provide any explanation for why they are classified as such, while other heads are described as more important than them.
Capital heads in GPT-2 medium
Merullo et al. (2024a) have also studied a circuit for resolving the capital city of a country (in Appendix I). MAPS identified all attention heads classified in that study, along with 15 others. In Figure 6(b) we present the name copying, country to capital relation scores for all heads in GPT-2 medium and the heads classified by Merullo et al. (2024a).
<details>
<summary>x11.png Details</summary>
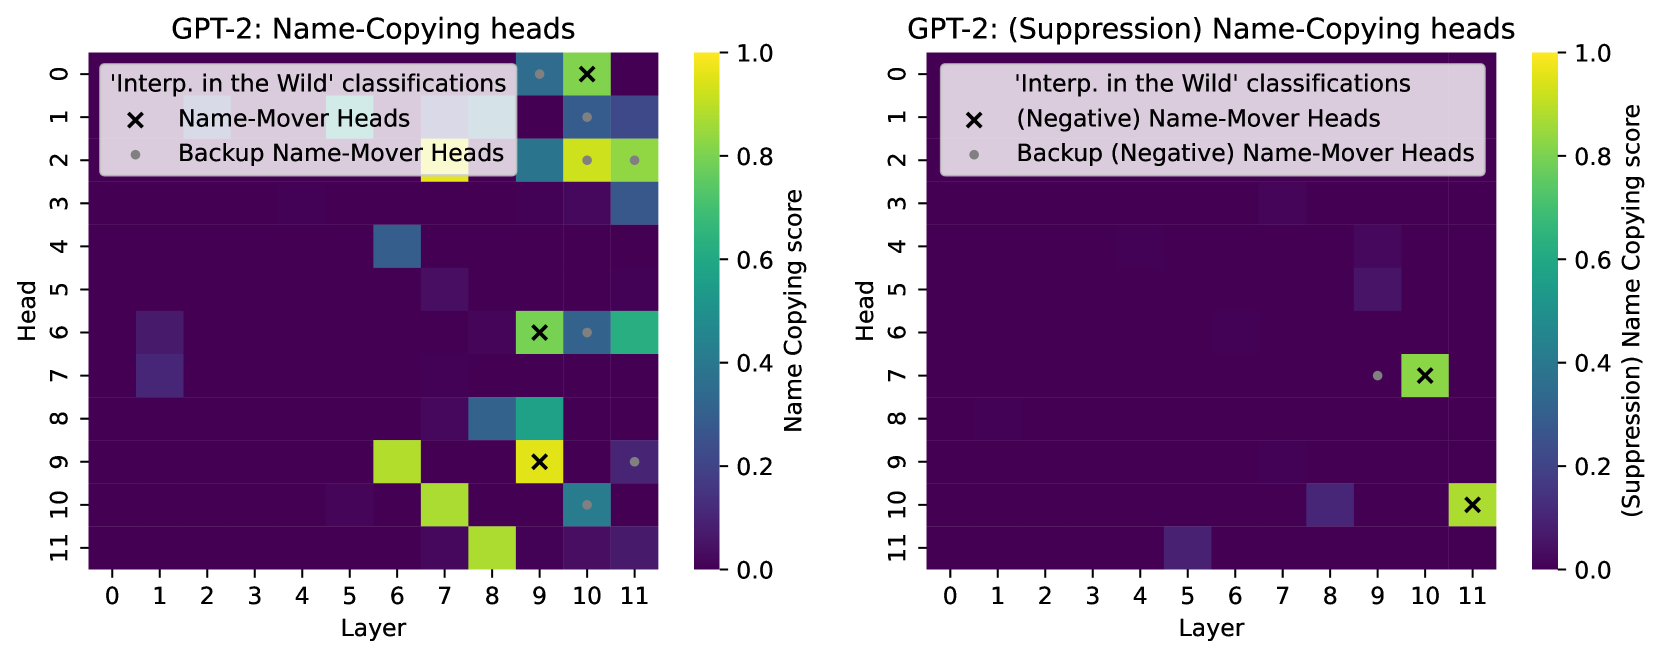
### Visual Description
\n
## Heatmaps: GPT-2 Name-Copying Heads Analysis
### Overview
The image presents two heatmaps comparing "Name-Copying" scores for GPT-2 model heads, one showing the raw score and the other showing a "Suppression" of the score. Both heatmaps visualize the relationship between the layer of the GPT-2 model (x-axis) and the head number (y-axis). The color intensity represents the Name-Copying score, with warmer colors (yellow/green) indicating higher scores and cooler colors (purple) indicating lower scores. Both charts also include scatter plots representing different classifications of heads.
### Components/Axes
Both heatmaps share the following components:
* **X-axis:** "Layer", ranging from 0 to 11, with tick marks at each integer value.
* **Y-axis:** "Head", ranging from 1 to 11, with tick marks at each integer value.
* **Color Scale:** A continuous color scale ranging from 0.0 (dark purple) to 1.0 (yellow), representing the "Name Copying score" (left heatmap) and "(Suppression) Name Copying score" (right heatmap).
* **Scatter Plot Markers:**
* 'Interp. in the Wild' classifications (represented by 'x' markers).
* Name-Mover Heads (left heatmap) / (Negative) Name-Mover Heads (right heatmap) (represented by black 'x' markers).
* Backup Name-Mover Heads (left heatmap) / Backup (Negative) Name-Mover Heads (right heatmap) (represented by light green circle markers).
### Detailed Analysis or Content Details
**Left Heatmap: GPT-2: Name-Copying heads**
* **Overall Trend:** The heatmap shows a generally low Name-Copying score across most layers and heads, with a concentration of higher scores (yellow/green) in layers 7-10.
* **Data Points (approximate):**
* Layer 0-6: Predominantly dark purple, indicating scores near 0.0.
* Layer 7: Shows a gradual increase in score, peaking around Head 2-4 at approximately 0.6-0.8.
* Layer 8: Similar to Layer 7, with peaks around Head 2-4 at approximately 0.6-0.8.
* Layer 9: Peaks around Head 2-4 at approximately 0.8-1.0.
* Layer 10: Peaks around Head 2-4 at approximately 0.6-0.8.
* Layer 11: Returns to lower scores, around 0.2-0.4.
* **Scatter Plot Data:**
* 'Interp. in the Wild' classifications: Located at (9, 1), (9, 2), (10, 1), (10, 2), (10, 3), (10, 4), (10, 5), (10, 6), (10, 7), (10, 8), (10, 9), (10, 10), (10, 11).
* Name-Mover Heads: Located at (9, 5) with a score of approximately 0.3.
* Backup Name-Mover Heads: Located at (8, 2) with a score of approximately 0.7, (9, 2) with a score of approximately 0.8, (10, 2) with a score of approximately 0.6.
**Right Heatmap: GPT-2: (Suppression) Name-Copying heads**
* **Overall Trend:** This heatmap shows a generally low (Suppression) Name-Copying score across most layers and heads, with a concentration of higher scores (yellow/green) in layers 7-10.
* **Data Points (approximate):**
* Layer 0-6: Predominantly dark purple, indicating scores near 0.0.
* Layer 7: Shows a gradual increase in score, peaking around Head 2-4 at approximately 0.4-0.6.
* Layer 8: Similar to Layer 7, with peaks around Head 2-4 at approximately 0.4-0.6.
* Layer 9: Peaks around Head 2-4 at approximately 0.6-0.8.
* Layer 10: Peaks around Head 2-4 at approximately 0.4-0.6.
* Layer 11: Returns to lower scores, around 0.2-0.4.
* **Scatter Plot Data:**
* 'Interp. in the Wild' classifications: Located at (9, 1), (9, 2), (10, 1), (10, 2), (10, 3), (10, 4), (10, 5), (10, 6), (10, 7), (10, 8), (10, 9), (10, 10), (10, 11).
* (Negative) Name-Mover Heads: Located at (9, 5) with a score of approximately 0.3.
* Backup (Negative) Name-Mover Heads: Located at (8, 2) with a score of approximately 0.5, (9, 2) with a score of approximately 0.6, (10, 2) with a score of approximately 0.4.
### Key Observations
* Both heatmaps exhibit a similar pattern of increased Name-Copying/Suppression scores in layers 7-10, specifically around heads 2-4.
* The 'Interp. in the Wild' classifications are concentrated in layer 10.
* The Name-Mover/Negative Name-Mover heads consistently appear around layer 9, head 5.
* The Backup Name-Mover/Backup (Negative) Name-Mover heads are concentrated around layers 8-10, head 2.
* The "Suppression" heatmap generally shows lower scores than the raw "Name-Copying" heatmap, as expected.
### Interpretation
The data suggests that layers 7-10 of the GPT-2 model, particularly heads 2-4, are more involved in "Name-Copying" behavior than other layers and heads. This could indicate that these layers are responsible for learning and representing named entities or concepts. The concentration of 'Interp. in the Wild' classifications in layer 10 suggests that these heads are particularly good at generalizing to unseen data. The distinction between "Name-Copying" and "(Suppression) Name-Copying" scores highlights the model's ability to both generate and inhibit name-related information, potentially for controlling the output's relevance and coherence. The scatter plots provide insights into specific head types and their corresponding scores, allowing for a more nuanced understanding of the model's behavior. The fact that the suppression heatmap has lower values than the raw heatmap suggests that the suppression mechanism is working as intended.
</details>
(a) Comparison between “Name-Mover” heads discovered by Wang et al. (2023) and heads which implement the name copying relation, discovered by MAPS.
<details>
<summary>x12.png Details</summary>
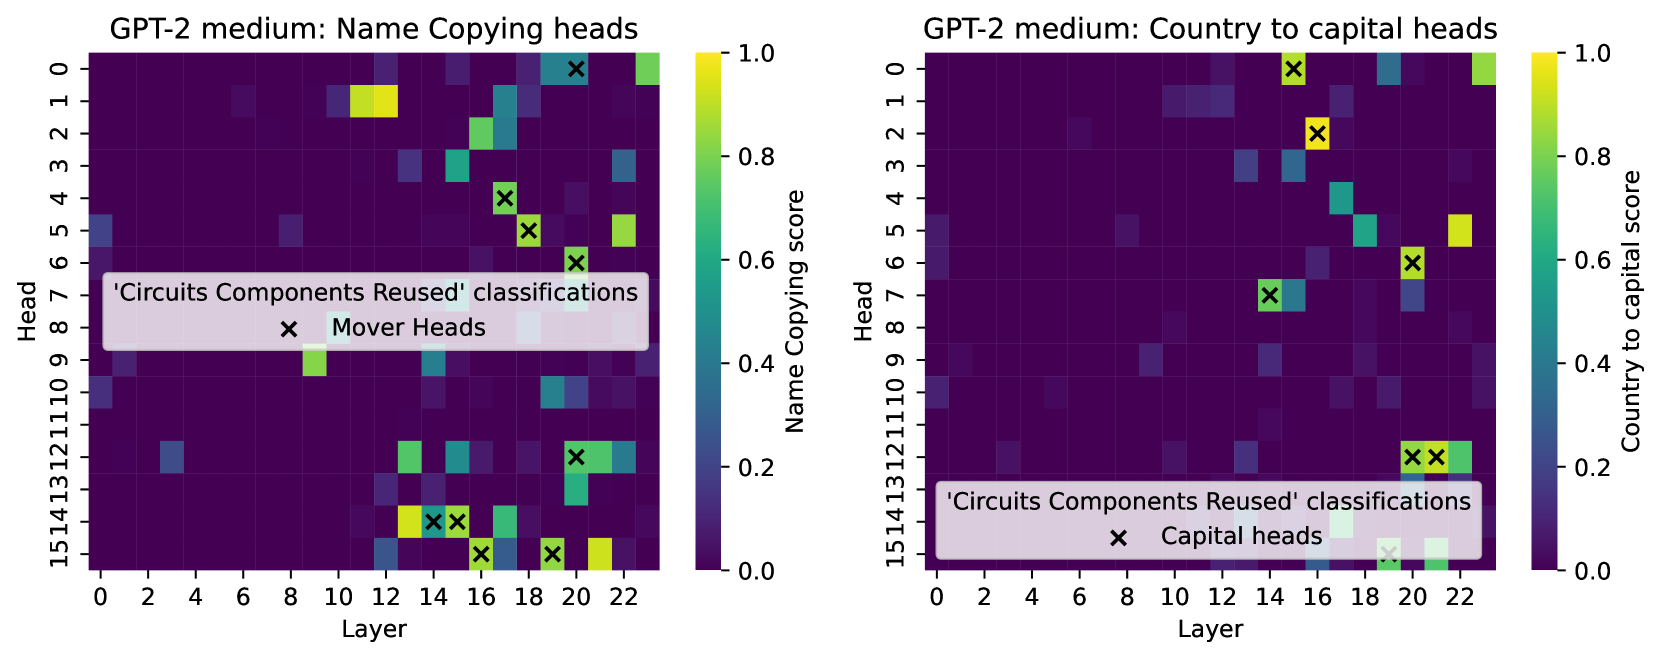
### Visual Description
\n
## Heatmaps: GPT-2 Medium Head Analysis
### Overview
The image presents two heatmaps, side-by-side, visualizing data related to GPT-2 medium model heads. The first heatmap shows "Name Copying heads" and the second shows "Country to capital heads". Both heatmaps share the same x and y axes, representing 'Layer' and 'Head' respectively. Both heatmaps also include 'Mover Heads' or 'Capital heads' marked with 'x' symbols. The color intensity in each heatmap represents a score, with a scale from 0.0 to 1.0.
### Components/Axes
* **X-axis:** Layer, ranging from 0 to 22.
* **Y-axis:** Head, ranging from 0 to 15.
* **Color Scale (Left):** Name Copying score, ranging from 0.0 (dark purple) to 1.0 (yellow).
* **Color Scale (Right):** Country to capital score, ranging from 0.0 (dark purple) to 1.0 (yellow).
* **Markers:** 'x' symbols representing 'Mover Heads' in the left heatmap and 'Capital heads' in the right heatmap.
* **Text Label (Both):** 'Circuits Components Reused' classifications.
* **Title (Left):** GPT-2 medium: Name Copying heads
* **Title (Right):** GPT-2 medium: Country to capital heads
### Detailed Analysis or Content Details
**Left Heatmap: Name Copying Heads**
The heatmap displays the 'Name Copying score' for each head at each layer. The color intensity indicates the score.
* **Trend:** The heatmap shows a sparse distribution of high scores (yellow/light green). There are several areas with moderate scores (blue/cyan). The majority of the heatmap is dark purple, indicating low scores.
* **Data Points (approximate):**
* Layer 0-6: Predominantly low scores (0.0 - 0.2).
* Layer 8-10: Some moderate scores (0.4 - 0.6) around Head 4 and 5.
* Layer 12-14: Moderate scores (0.4 - 0.6) around Head 2 and 3.
* Layer 16: A high score (approximately 0.8-0.9) around Head 2.
* Layer 18: A high score (approximately 0.9-1.0) around Head 1.
* Layer 20: Moderate scores (0.4-0.6) around Head 14.
* **Mover Heads:** Marked with 'x' symbols. Approximate locations:
* (Layer 14, Head 1)
* (Layer 16, Head 4)
* (Layer 18, Head 6)
* (Layer 20, Head 10)
* (Layer 22, Head 14)
**Right Heatmap: Country to Capital Heads**
The heatmap displays the 'Country to capital score' for each head at each layer. The color intensity indicates the score.
* **Trend:** Similar to the left heatmap, this heatmap also shows a sparse distribution of high scores. There are areas with moderate scores, but the majority is dark purple.
* **Data Points (approximate):**
* Layer 0-6: Predominantly low scores (0.0 - 0.2).
* Layer 8-10: Some moderate scores (0.4 - 0.6) around Head 2 and 3.
* Layer 12-14: Moderate scores (0.4 - 0.6) around Head 2 and 3.
* Layer 16: A high score (approximately 0.8-0.9) around Head 2.
* Layer 18: A high score (approximately 0.9-1.0) around Head 1.
* Layer 20: Moderate scores (0.4-0.6) around Head 14.
* **Capital Heads:** Marked with 'x' symbols. Approximate locations:
* (Layer 14, Head 1)
* (Layer 16, Head 4)
* (Layer 18, Head 6)
* (Layer 20, Head 10)
* (Layer 22, Head 14)
### Key Observations
* Both heatmaps exhibit similar patterns of score distribution.
* High scores are relatively rare and concentrated in specific layers and heads.
* The 'Mover Heads' and 'Capital heads' are located at similar positions in both heatmaps, suggesting a correlation between the two tasks.
* The 'Circuits Components Reused' classifications appear to be a common feature across both analyses.
### Interpretation
The heatmaps visualize the performance of different heads within the GPT-2 medium model on two distinct tasks: name copying and country-to-capital mapping. The scores represent how well each head contributes to these tasks at different layers of the model. The sparse distribution of high scores suggests that only a small subset of heads are particularly effective at these tasks.
The correlation in the location of 'Mover Heads' and 'Capital heads' indicates that the same heads might be involved in processing information relevant to both tasks. This could suggest underlying shared representations or mechanisms within the model.
The 'Circuits Components Reused' classifications likely refer to the fact that certain components or patterns within the neural network are reused across different tasks or layers. This is a common characteristic of deep learning models and contributes to their efficiency and generalization ability.
The heatmaps provide insights into the internal workings of the GPT-2 model, highlighting which heads and layers are most important for specific tasks. This information can be used to further understand the model's capabilities and limitations, and potentially improve its performance. The fact that the high scoring heads are not evenly distributed suggests that the model is not uniformly utilizing all of its parameters for these tasks.
</details>
(b) Comparison between “Name-Mover” and “Capital” heads discovered by Merullo et al. (2024a) and heads which implement the name copying and the country to capital relations discovered in our work.
Figure 6: Comparison between relation heads discovered by MAPS and heads classified in prior works.
Appendix E Automatic Mapping of Salient Head Operations
E.1 Automatic Functionality Inference
In § 5.1 we showed that GPT-4o can be utilized to interpret attention heads’ salient operations. Here, we provide additional implementation details and present an evaluation of the interpretation quality.
Implementation details
We found that GPT-4o sometimes describes in words that the pattern is unclear, rather than just outputting the word “Unclear”, as requested. To handle these cases, we classify every head for which GPT-4o’s response contained the string “clear” as a head where a pattern was not detected. We view this as an upper bound over the true ratio of heads with undetected patterns. Also, for some heads, GPT-4o would stop generating descriptions mid-generation. We hypothesize that it is because of strings viewed as special GPT-4o tokens that appeared in the salient mappings. We solved this issue by querying GPT-4o again with other random seeds. We note that in several mappings the salient tokens were decoded as an unreadable character. This could be solved by alternating between Transformers package Wolf et al. (2020) decoding functions.
Prompt format
We present the prompt used to query GPT-4o in Table 26.
| Head | Salient mappings | GPT-4o description |
| --- | --- | --- |
| Pythia 6.9B 15.3 | osevelt: 1943, 1941, 1940, 1930, 1936 Roosevelt: 1943, 1941, 1936, 1940, 1930 FDR: 1943, 1942, 1941, 1938, 1936 Napole: 1800, 1800, 18,18, 1840 oslov: 1968, 1970, 1960, 1964, 1965 Napoleon: 1800, 1800,18, 18, Napoleon taire: 1840, 1850,1800, Pruss, 1830 afka: 1908, 1912, 1916, 1903, 1911 lantern: 1870, 1880, 1930, Depression, railroad Edison: 1920,1920,1900, 1908, 1880 Confederate: 1863, 1864, 1861, 1862, 1870 1861: 1861, 1863, 1860, 1864, 1870 | The input strings are partial or full names of historical figures as well as years and terms relating to historical events. The mappings associate each input with years or terms relevant to their historical significance, reflecting events or periods related to the input entity. |
| Pythia 6.9B 16.1 | inhib: inhibition, inhib, Inhib, inhibiting, inhibit resil: resilience, resistance,Resp, res,resistance toler: toler, tolerance, tolerate, tolerated, tolerant aggrav: aggrav, exacerb, help, assistance : response, responses, responding, inhibiting destructive: destructive, destruction, destroying salvage: saving, save,saving,save, saves reluct: reluctance, resistance, resisting, resist prophyl: protection, protective, Protection Relief: relief, Relief, relie, relieved, relieve surv: survival, Survival, protection, surviv | The input strings are truncated forms of words, often found in contexts related to protection, resistance, or functionality. The mappings primarily expand truncated forms into semantically related words, often the full form of the input string or related words. |
| Pythia 6.9B 16.11 | weeks: months, month, summer, season, year months: year,year, Year,Year, yearly month: year, Year,year,Year, yearly Month: year, Year,year,Year, years weeks: month, months,month,months, summer months: year, Year,year,Year, yearly Week: months, month,months,month, Month week: month, months,month,months, season month: year, Year,year,Year, yearly overnight: month, week, weeks,acci, months years: decade, decades, aging, century, life | The input strings are related to time periods such as weeks, months, and years. Mappings are connecting input strings to related or hierarchical time concepts, often extending them into longer periods like months to years and weeks to months. |
| Pythia 6.9B 22.13 | periodontal: dental, Dental, dentist, dent, periodontal mandibular: dental, Dental, mandibular, teeth, dentist odontic: dental, Dental, dentist, teeth, tooth psori: skin, Skin,skin, dermat, skins retinal: eye, ophthal, retinal, ocular, eyes echocardiography: cardiac, Card, hearts,Card, Cardi scalp: brain, Brain,brain, brains, scalp hippocampal: hippocampal, Brain, brain,brain, hippocampus ocardi: cardiac, Card, hearts, Heart, heart ACL: knee, knees, thigh, Hip, ankle caries: dental, Dental, dentist, dent, Dent | The input strings seem to relate to various medical and anatomical terms, including parts of the body, diseases, and medical procedures. The mappings primarily associate anatomical or medical terms (input strings) with related medical terminology, such as conditions, associated body parts, or broader medical categories. |
| GPT-2 xl 26.2 | Jedi: lightsaber, Jedi, Kenobi, droid, Skywalker lightsaber: lightsaber, Jedi, Kenobi, Skywalker, Sith galactic: Galactic, galactic, starship, galaxy, droid Starfleet: galactic, Starfleet, starship, Galactic, interstellar Klingon: starship, Starfleet, Klingon, Trek, Starship starship: starship, Galactic, galactic, interstellar, Planetary Skyrim: Skyrim, Magicka, Bethesda, Elven, Hearth Darth: Jedi, lightsaber, Kenobi, Darth, Sith galaxy: Galactic, galactic, starship, galaxy, droid | The input strings are terms related to popular science fiction and fantasy franchises such as Star Wars, Star Trek, Pokémon, Elder Scrolls, Harry Potter, and general fantastical terms. The pattern observed is that each mapping takes an input term from a science fiction or fantasy context and maps it to other terms that are often from the same or related fictional universe. |
Table 25: Example salient operations of attention heads in Pythia 6.9B and GPT-2 xl and their corresponding descriptions by GPT-4o.
| Below you are given a list of input strings, and a list of mappings: each mapping is between an input string and a list of 5 strings. |
| --- |
| Mappings are provided in the format "s: t1, t2, t3, t4, t5" where each of s, t1, t2, t3, t4, t5 is a short string, typically corresponding to a single word or a sub-word. |
| Your goal is to describe shortly and simply the inputs and the function that produces these mappings. To perform the task, look for semantic and textual patterns. |
| For example, input tokens ’water’,’ice’,’freeze’ are water-related, and a mapping (’fire’:’f’) is from a word to its first letter. |
| As a final response, suggest the most clear patterns observed or indicate that no clear pattern is visible (write only the word "Unclear"). |
| Your response should be a vaild json, with the following keys: |
| "Reasoning": your reasoning. |
| "Input strings": One sentence describing the input strings (or "Unclear"). |
| "Observed pattern": One sentence describing the most clear patterns observed (or "Unclear"). |
| The input strings are: |
| <input strings> |
| The mappings are: |
| <mapping strings> |
Table 26: The prompt used to query GPT-4o. The salient tokens and mappings (§ 3.2), which are unique for every head, are plugged instead of <input strings> and <mapping strings>.
Examples
Table 25 provides examples of salient mappings and the patterns described by GPT-4o for three attention heads in GPT-2 xl and Pythia 6.9B.
E.2 Interpretation Quality
To assess the accuracy and plausibility of the model-generated descriptions, we let human annotators — five graduate students who are fluent English speakers — evaluate its responses in terms of (a) did GPT-4o correctly recognize the existence of a pattern in the mappings, (b) the quality of the generated descriptions, (c) the category of the recognized patterns. We conduct this study for a random sample of 138 (13.5%) heads in Pythia 6.9B and 134 (11.2%) heads in GPT-2 xl.
Annotation instructions
We present the instructions given to the human annotators in Figures 7, 8.
<details>
<summary>x13.png Details</summary>
### Visual Description
\n
## Document: Instructions for GPT-4 Correctness Verification
### Overview
This document outlines the instructions for a task designed to verify the correctness of GPT-4 in inferring relations or functions from a list of demonstrations. The task involves analyzing a set of input-output mappings and evaluating GPT-4's ability to identify and describe any underlying patterns.
### Components/Axes
The document is structured into sections:
* **Instructions:** The main body of the document, detailing the task and evaluation criteria.
* **Demonstrations:** Mentioned as a list of 30 input-output pairs.
* **Description generated by GPT4:** A description of patterns identified by GPT-4.
* **Multi-choice Questions:** Q1, Q2, and Q3, used to assess the agreement between human assessment and GPT-4's pattern identification.
* **Link to Spreadsheet:** A hyperlink to "this spreadsheet" is provided as an example.
### Detailed Analysis or Content Details
The instructions specify the following:
* **Demonstrations:** The demonstrations are provided in the format of 's1, s2, s3, s4, s5' where 's' is an input string and 't1, t2, t3, t4, t5' are the corresponding 5 strings it is mapped to. Each of s1, s2, s3, s4, s5 is a short string, typically corresponding to a single word or a sub-word.
* **Task:** The task involves two parts:
* Identifying prominent patterns in the input strings and their mappings. Patterns can be semantic, language-related, general, or unnatural.
* Answering multiple-choice questions to indicate the degree to which the assessment agrees with the description generated by GPT-4.
* **Multi-choice Questions:**
* **Q1:** Did GPT4 correctly identify the presence or lack of a pattern?
* 1: There is no observable pattern, and GPT4 indicated there is no pattern.
* 2: There is no observable pattern, but GPT4 described a pattern.
* 3: There is an observable pattern, and GPT4 indicated there is no pattern.
* 4: There is an observable pattern, and GPT4 described a pattern.
* **Q2:** (Answer only if your answer to Q1 is 4) How precise is the description of GPT4?
* Correct and accurate: the description accurately describes the pattern, without errors.
* Correct but inaccurate: the description is correct overall, but is too general or abstract for the pattern expressed in the mappings. Alternatively, it is too specific or explicit and does not fully capture the general pattern.
* Partially correct: The description describes the correct pattern to some degree, but it also includes incorrect parts.
* Poor: the description does not describe the pattern at all.
* **Q3:** (Answer only if your answer to Q1 is 3 or 4) How would you categorise the most prominent pattern?
* Semantic
* Language
* General
* Unnatural
### Key Observations
The document focuses on a meta-cognitive evaluation of an AI model (GPT-4). It doesn't present data *per se*, but rather a framework for evaluating the *quality* of an AI's reasoning about data. The emphasis is on pattern recognition and the accuracy of descriptions. The questions are designed to assess both whether GPT-4 detects a pattern when one exists, and how well it describes that pattern.
### Interpretation
This document represents a critical step in AI validation. It moves beyond simply assessing whether an AI can *perform* a task (e.g., translation, summarization) and delves into whether it can *understand* the underlying principles governing that task. The use of human assessment to validate GPT-4's pattern identification is crucial, as it provides a benchmark for evaluating the AI's reasoning capabilities. The categorization of patterns (semantic, language, general, unnatural) suggests a desire to understand *what kind* of reasoning GPT-4 is employing. The entire process is geared towards building trust and transparency in AI systems by verifying their internal logic and ensuring they are not simply memorizing patterns without genuine understanding. The inclusion of a spreadsheet example indicates a practical, data-driven approach to this validation process.
</details>
Figure 7: First part of human annotation instructions.
<details>
<summary>x14.png Details</summary>
### Visual Description
\n
## Document: Guidelines for Pattern Recognition in Mappings
### Overview
The image presents a document outlining guidelines for identifying patterns in mappings, likely within the context of evaluating a language model (GPT4) or similar system. The document details criteria for determining whether a mapping between input and output strings constitutes a recognizable pattern, and defines categories for classifying the nature of those patterns. It also provides instructions for documenting observations.
### Components/Axes
The document is structured as a series of bullet points and indented sub-points. There are no axes or charts present. The document is entirely textual.
### Content Details
Here's a transcription of the document's content:
* **Important guidelines:**
* In Q1, we consider that “GPT4 indicated there is no pattern” if it either responded with the word “Unclear”, or explained that there is no pattern in a sentence.
* In cases where the description of the model includes suggestive commentary about the hidden motivation for the function represented in the mappings (in addition to an explicit explanation), the commentary should not be considered. An example for a description which includes commentary is “The mappings generally consist of repetitions or small variations of their corresponding input string’s characters, suggesting a pattern related to breaking down or rearranging the input string”.
* We consider a pattern recognizable when it is apparent across 20 or more mappings. We require that at least one of the following will hold:
* The functionality behind the mappings (of input to output strings) will be visible and clear - for example, mappings of words to their first letters.
* The destination strings will be highly related to each other - for example, cases where all the source strings are mapped to numbers.
* In cases where there is a mutual pattern encompassing only the source strings, we do not consider this as a recognizable pattern.
* In Q2 we use the terms correct and accurate to label the descriptions. Correct descriptions describe the mappings and do not include incorrect parts. Correct descriptions might be accurate or inaccurate. The inaccuracy metric refers to whether the descriptions are too general (or too specific).
* In Q3, the different mapping categories are:
* **Semantic** - the mapping encodes semantic associations of the input strings (which might require knowledge). For example, associating countries with their capitals or languages.
* **Language** - the mapping encodes a relationship which requires language knowledge (e.g. syntactic or lexical expertise) relationship. For example, mapping words to prefixes, or nouns to pronouns.
* **General** - the mapping encodes a general functionality, which naturally can be applied to a large subset of strings. For example, mapping a string to itself, or a number to its successor/predecessor.
* **Unnatural** - the mapping does not encode a recognizable/understandable function or relation, one that might be used for natural language processing (see examples of unnatural patterns in the examples spreadsheet).
* Please use the Notes column to add any information, insight or problem you find relevant.
### Key Observations
The document focuses on establishing a rigorous framework for evaluating pattern recognition capabilities. The criteria emphasize both the *presence* of a pattern (across a sufficient number of examples) and the *recognizability* of that pattern (whether it's clear and understandable). The categorization of mapping types (Semantic, Language, General, Unnatural) provides a structured way to analyze the nature of the patterns identified. The distinction between "correct" and "accurate" descriptions is also important, highlighting that a description can be technically correct (not containing errors) but still inaccurate (too broad or too narrow).
### Interpretation
This document appears to be a set of instructions for human annotators or evaluators tasked with assessing the performance of a machine learning model (GPT4) on a pattern recognition task. The guidelines are designed to minimize subjectivity and ensure consistency in evaluations. The emphasis on a minimum number of mappings (20) suggests a need to avoid false positives – identifying patterns based on limited data. The categorization of mapping types is crucial for understanding *what kind* of patterns the model is capable of recognizing. The document's overall goal is to establish a reliable and objective method for measuring the model's ability to discern meaningful relationships between input and output strings. The inclusion of a "Notes" column indicates that the evaluators are expected to provide qualitative feedback alongside their quantitative assessments. The document is a meta-cognitive tool for evaluating a cognitive system.
</details>
Figure 8: Second part of human annotation instructions.
Human study results
The overall results per question and the distribution of responses across models and layers are presented in Figure 9 (Question 1), Figure 10 (Question 2), Figure 11 (Question 3). In 80% of the cases, GPT-4o correctly identifies the presence or absence of a pattern. In most of the failure cases (87%), the model described a pattern that is not visible in the mappings. We also find that in lower layers there are fewer patterns and they are harder to parse: there are higher rates of unnatural patterns and inaccurate descriptions. This agrees with our findings in § 4. In case of an observable pattern, GPT-4o will identify it: for 95% of heads with observable patterns, GPT-4o described a pattern, and $<$ 2% of the descriptions were labeled “poor”. Overall, this analysis shows that the quality of our automatic annotation pipeline is reasonable and demonstrates promising trends in automatically interpreting attention heads with MAPS. We leave further improvements to the pipeline for future work to explore. In particular, addressing model hallucinations could involve methods like aggregating multiple model responses to check its confidence (Kuhn et al., 2023), using intrinsic classifiers for hallucinations (e.g. Azaria and Mitchell (2023), Yu et al. (2024)), employing a strong LLM to indicate whether the generated pattern matches the mappings Gur-Arieh et al. (2025), using an NLI model Bohnet et al. (2022), or similarity-based heuristics.
<details>
<summary>x15.png Details</summary>
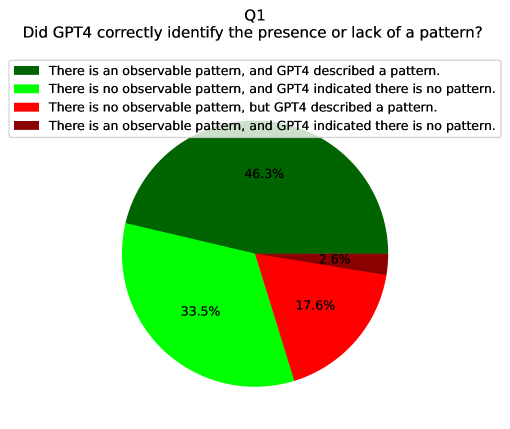
### Visual Description
\n
## Pie Chart: Q1 - GPT4 Pattern Identification Accuracy
### Overview
This image presents a pie chart visualizing the results of a question (Q1) regarding GPT-4's ability to correctly identify the presence or lack of a pattern. The chart displays the percentage distribution of four different response scenarios.
### Components/Axes
* **Title:** Q1 - Did GPT4 correctly identify the presence or lack of a pattern?
* **Legend:** Located at the top-left of the chart.
* **Green:** There is an observable pattern, and GPT4 described a pattern.
* **Light Green:** There is no observable pattern, and GPT4 indicated there is no pattern.
* **Red:** There is no observable pattern, but GPT4 described a pattern.
* **Dark Red:** There is an observable pattern, and GPT4 indicated there is no pattern.
* **Pie Chart:** The main visual element, divided into four colored segments representing the percentages of each scenario.
### Detailed Analysis
The pie chart segments represent the following data:
* **Green Segment:** Represents 46.3% of the responses. This corresponds to cases where a pattern was present and GPT-4 correctly identified it.
* **Light Green Segment:** Represents 33.5% of the responses. This corresponds to cases where no pattern was present, and GPT-4 correctly indicated its absence.
* **Red Segment:** Represents 17.6% of the responses. This corresponds to cases where no pattern was present, but GPT-4 incorrectly identified a pattern.
* **Dark Red Segment:** Represents 2.6% of the responses. This corresponds to cases where a pattern was present, but GPT-4 incorrectly indicated its absence.
### Key Observations
* The largest proportion of responses (46.3%) indicates that GPT-4 correctly identifies patterns when they exist.
* A substantial portion of responses (33.5%) shows GPT-4 correctly identifies the absence of patterns.
* GPT-4 incorrectly identifies patterns more frequently (17.6%) than it fails to identify existing patterns (2.6%). This suggests a bias towards identifying patterns even when they are not present.
### Interpretation
The data suggests that GPT-4 demonstrates a reasonable ability to identify both the presence and absence of patterns. However, the higher error rate in falsely identifying patterns (17.6% vs. 2.6%) indicates a potential tendency towards "seeing" patterns where none exist. This could be due to the model's inherent complexity and its attempt to find structure even in random data. The combined percentage of correct identifications (46.3% + 33.5% = 79.8%) suggests a generally good performance, but the error distribution warrants further investigation to understand the conditions under which GPT-4 is more likely to make incorrect pattern identifications. The question is designed to test the model's ability to avoid false positives in pattern recognition.
</details>
(a) Human annotation distribution for Question 1.
<details>
<summary>x16.png Details</summary>
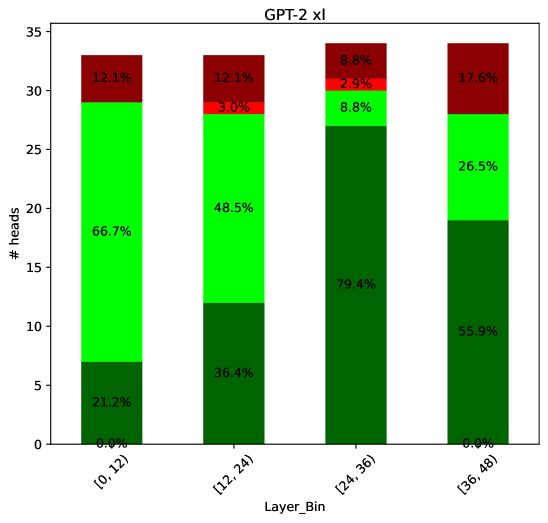
### Visual Description
\n
## Stacked Bar Chart: GPT-2 xl Layer Head Distribution
### Overview
This is a stacked bar chart visualizing the distribution of attention heads across different layers of the GPT-2 xl model. The x-axis represents layer bins, and the y-axis represents the number of heads. Each bar is segmented into three colored sections, representing different proportions within each layer bin. The chart aims to show how the attention heads are distributed across the layers of the model.
### Components/Axes
* **Title:** GPT-2 xl
* **X-axis Label:** Layer\_Bin
* **X-axis Categories:** \[0, 12], \[12, 24], \[24, 36], \[36, 48]
* **Y-axis Label:** # heads
* **Y-axis Scale:** 0 to 35 (approximately)
* **Legend:** Implicitly defined by color:
* Red: Represents a percentage of heads.
* Green: Represents a percentage of heads.
* Dark Green: Represents a percentage of heads.
### Detailed Analysis
The chart consists of four stacked bars, one for each layer bin. The height of each bar represents the total number of heads within that bin. The segments within each bar indicate the proportion of heads belonging to each color category.
* **\[0, 12] Layer Bin:**
* Red segment: 12.1% of heads.
* Green segment: 66.7% of heads.
* Dark Green segment: 21.2% of heads.
* Total heads (approx.): 34
* **\[12, 24] Layer Bin:**
* Red segment: 12.1% of heads.
* Green segment: 48.5% of heads.
* Dark Green segment: 36.4% of heads.
* Total heads (approx.): 28
* **\[24, 36] Layer Bin:**
* Red segment: 8.8% of heads.
* Green segment: 79.4% of heads.
* Dark Green segment: 8.8% of heads.
* Total heads (approx.): 26
* **\[36, 48] Layer Bin:**
* Red segment: 17.6% of heads.
* Green segment: 26.5% of heads.
* Dark Green segment: 55.9% of heads.
* Total heads (approx.): 30
### Key Observations
* The distribution of heads varies significantly across layer bins.
* The \[24, 36] layer bin has the highest proportion of heads in the green category (79.4%).
* The \[0, 12] layer bin has the highest proportion of heads in the green category (66.7%).
* The \[36, 48] layer bin has the highest proportion of heads in the dark green category (55.9%).
* The red segment is relatively consistent across all layer bins, ranging from 8.8% to 17.6%.
### Interpretation
The chart suggests that the attention heads are not uniformly distributed across the layers of the GPT-2 xl model. The dominance of the green category in the \[24, 36] layer bin might indicate a particular pattern of attention or information processing within those layers. The varying proportions of heads in each color category across different layer bins could reflect the hierarchical nature of the model and the different roles played by different layers in processing information. The relatively consistent red segment suggests a baseline level of attention across all layers. The chart provides insights into the internal workings of the model and could be used to understand how different layers contribute to its overall performance. The data suggests that the model's attention mechanism evolves as information flows through the layers, with certain layers focusing on different aspects of the input.
</details>
(b) Human annotation distribution for Question 1 across layers (GPT-2 xl).
<details>
<summary>x17.png Details</summary>
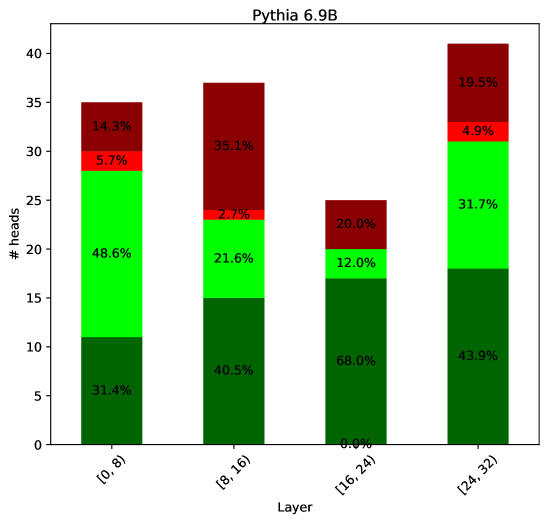
### Visual Description
## Stacked Bar Chart: Pythia 6.9B Layer Activation Distribution
### Overview
This image presents a stacked bar chart visualizing the distribution of activations (represented as "# heads") across different layers of the Pythia 6.9B model. The x-axis represents the layer, categorized into ranges: [0, 8], [8, 16], [16, 24], and [24, 32]. The y-axis represents the number of heads, ranging from 0 to 40. Each bar is segmented into colored sections, with each color representing a percentage of the total heads for that layer.
### Components/Axes
* **Title:** "Pythia 6.9B" (positioned at the top-center)
* **X-axis Label:** "Layer" (positioned at the bottom-center)
* **X-axis Markers:** [0, 8], [8, 16], [16, 24], [24, 32]
* **Y-axis Label:** "# heads" (positioned vertically on the left side)
* **Y-axis Scale:** 0 to 40, with increments of 5.
* **Color Legend (Implicit):**
* Dark Red: Represents a percentage of heads.
* Red: Represents a percentage of heads.
* Lime Green: Represents a percentage of heads.
* Dark Green: Represents a percentage of heads.
### Detailed Analysis
The chart consists of four stacked bars, one for each layer range. The percentages within each bar sum to 100%.
* **Layer [0, 8]:**
* Dark Green: 31.4%
* Lime Green: 48.6%
* Red: 5.7%
* Dark Red: 14.3%
* Total Heads: Approximately 28.
* **Layer [8, 16]:**
* Dark Green: 40.5%
* Lime Green: 21.6%
* Red: 2.7%
* Dark Red: 35.1%
* Total Heads: Approximately 38.
* **Layer [16, 24]:**
* Dark Green: 68.0%
* Lime Green: 12.0%
* Red: 20.0%
* Dark Red: 0.0%
* Total Heads: Approximately 25.
* **Layer [24, 32]:**
* Dark Green: 43.9%
* Lime Green: 31.7%
* Red: 4.9%
* Dark Red: 19.5%
* Total Heads: Approximately 40.
### Key Observations
* The distribution of activations varies significantly across layers.
* Layer [16, 24] has a dominant proportion of dark green activations (68.0%), while layer [0, 8] has a more balanced distribution.
* The dark red activation percentage is highest in layer [8, 16] (35.1%) and lowest in layer [16, 24] (0.0%).
* The lime green activation percentage is highest in layer [0, 8] (48.6%) and lowest in layer [24, 32] (31.7%).
### Interpretation
This chart likely represents the activation patterns of different attention heads within the Pythia 6.9B model across its layers. The stacked bars show how the "heads" (likely representing different attention mechanisms) are contributing to the overall output at each layer. The varying distributions suggest that different layers specialize in different types of processing.
The high dark green activation in layer [16, 24] could indicate that this layer is heavily involved in core feature extraction or a dominant processing pathway. The absence of dark red activation in the same layer is notable and might suggest a lack of specific attention focus in that layer.
The differences in activation distributions across layers could be indicative of the model's hierarchical structure, where lower layers focus on basic feature detection (more balanced distribution) and higher layers perform more complex reasoning (more specialized distributions). The percentages provide a quantitative measure of how much each type of activation contributes to the overall model behavior at each layer. The data suggests that the model's internal representation changes significantly as information flows through the layers.
</details>
(c) Human annotation distribution for Question 1 across layers (Pythia 6.9B).
Figure 9: Quality of GPT-4o interpretation (§ E) - Human annotation distribution for Question 1.
<details>
<summary>x18.png Details</summary>
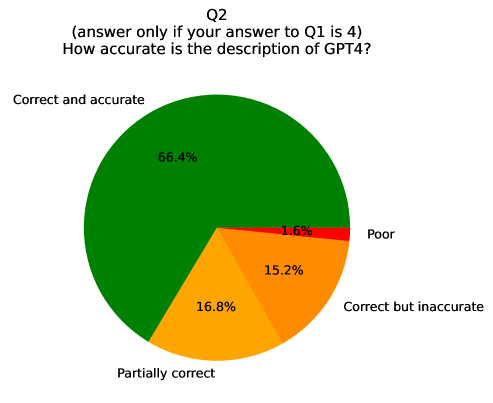
### Visual Description
\n
## Pie Chart: GPT-4 Accuracy Assessment
### Overview
This image presents a pie chart visualizing responses to the question: "How accurate is the description of GPT4?" (answered only if the response to Q1 is 4). The chart displays the distribution of opinions across five categories: "Correct and accurate", "Partially correct", "Correct but inaccurate", "Poor", and a category without a label.
### Components/Axes
* **Title:** Q2 (with clarifying text: "(answer only if your answer to Q1 is 4) How accurate is the description of GPT4?") - positioned at the top-center.
* **Pie Chart Segments:** Representing the percentage of responses for each accuracy level.
* **Legend:** Located on the right side of the chart, associating colors with accuracy levels.
* **Data Labels:** Percentage values displayed within each pie segment.
### Detailed Analysis
The pie chart is divided into five segments, each representing a different assessment of GPT-4's description accuracy.
* **Correct and accurate:** This segment occupies the largest portion of the pie chart, colored dark green, and represents 66.4% of the responses.
* **Partially correct:** Colored orange, this segment represents 16.8% of the responses.
* **Correct but inaccurate:** Colored light orange, this segment represents 15.2% of the responses.
* **Poor:** Colored red, this segment represents 1.6% of the responses.
### Key Observations
* The overwhelming majority (66.4%) of respondents who answered Q1 with a 4, consider the description of GPT-4 to be "Correct and accurate".
* A significant minority (16.8% + 15.2% = 32%) find the description to be either "Partially correct" or "Correct but inaccurate".
* Very few respondents (1.6%) consider the description to be "Poor".
### Interpretation
The data suggests a generally positive assessment of the GPT-4 description among those who responded with a 4 to the preceding question (Q1). The large proportion of "Correct and accurate" responses indicates a high level of agreement with the provided description. The presence of "Partially correct" and "Correct but inaccurate" responses suggests that while the overall description is well-received, there may be nuances or specific details that some respondents find lacking or imprecise. The extremely low percentage of "Poor" responses reinforces the overall positive sentiment. The conditional nature of the question ("answer only if your answer to Q1 is 4") implies that this assessment is specifically relevant to those who have a certain level of prior understanding or engagement with GPT-4.
</details>
(a) Human annotation distribution for Question 2.
<details>
<summary>x19.png Details</summary>
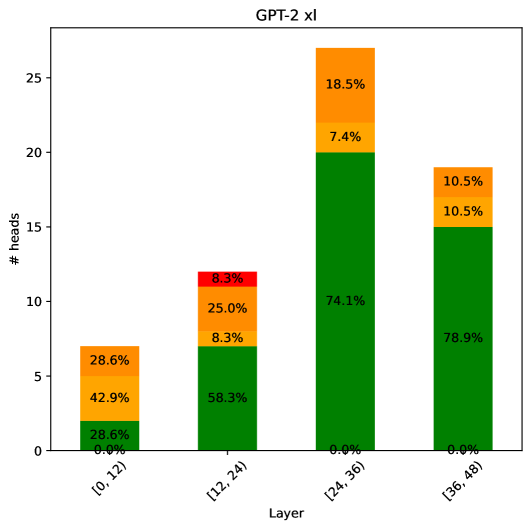
### Visual Description
## Stacked Bar Chart: GPT-2 xl Layer Activation Distribution
### Overview
This is a stacked bar chart visualizing the distribution of activations across different layers of the GPT-2 xl model. The chart displays the number of "heads" (likely referring to attention heads) for each layer, broken down by activation percentage ranges. The x-axis represents the layer, divided into four ranges: [0, 12], [12, 24], [24, 36], and [36, 48]. The y-axis represents the number of heads. Each bar is segmented into color-coded sections representing the percentage of heads with activations falling within specific ranges.
### Components/Axes
* **Title:** GPT-2 xl (positioned at the top-center)
* **X-axis Label:** Layer (positioned at the bottom-center)
* **Y-axis Label:** # heads (positioned at the left-center)
* **X-axis Markers:** [0, 12], [12, 24], [24, 36], [36, 48]
* **Y-axis Scale:** 0 to 25 (approximately)
* **Color Legend (Implicit):**
* Light Yellow: 0.0% - ~28.6%
* Dark Yellow: ~28.6% - ~42.9%
* Orange: ~42.9% - ~18.5%
* Red: ~8.3%
* Green: ~58.3% - ~78.9%
### Detailed Analysis
The chart consists of four stacked bars, one for each layer range.
* **Layer [0, 12]:**
* Light Yellow: 28.6% (approximately 2.8 heads)
* Dark Yellow: 42.9% (approximately 4.3 heads)
* Orange: 28.6% (approximately 2.9 heads)
* Total Heads: ~10 heads
* **Layer [12, 24]:**
* Light Yellow: 58.3% (approximately 5.8 heads)
* Dark Yellow: 8.3% (approximately 0.8 heads)
* Orange: 25.0% (approximately 2.5 heads)
* Red: 8.3% (approximately 0.8 heads)
* Total Heads: ~10 heads
* **Layer [24, 36]:**
* Green: 74.1% (approximately 18.5 heads)
* Orange: 18.5% (approximately 4.6 heads)
* Dark Yellow: 7.4% (approximately 1.8 heads)
* Total Heads: ~25 heads
* **Layer [36, 48]:**
* Green: 78.9% (approximately 19.7 heads)
* Orange: 10.5% (approximately 2.6 heads)
* Dark Yellow: 10.5% (approximately 2.6 heads)
* Total Heads: ~25 heads
### Key Observations
* The number of heads appears to increase from layer [0, 12] to layer [12, 24], and then remains relatively constant for layers [24, 36] and [36, 48].
* The distribution of activations shifts significantly across layers. Early layers ([0, 12] and [12, 24]) have a more even distribution of activations across the lower percentage ranges (yellow and orange).
* Later layers ([24, 36] and [36, 48]) are dominated by high activation percentages (green), indicating a greater proportion of heads are strongly activated in these layers.
* The red segment is only present in the [12, 24] layer, and represents a small percentage of heads.
### Interpretation
This chart likely illustrates how the activation patterns change as information flows through the GPT-2 xl model. The early layers seem to distribute activations more broadly, potentially capturing a wider range of features. As the information progresses through the network, the activations become more concentrated in a smaller number of heads, suggesting that the model is focusing on the most relevant features for the task at hand. The increase in the number of heads in the later layers, combined with the dominance of high activation percentages, could indicate that these layers are responsible for more complex processing and decision-making. The presence of the red segment in the [12, 24] layer might represent a specific type of feature or pattern that is particularly relevant during that stage of processing. The chart suggests a clear trend of increasing specialization and focus as data moves deeper into the GPT-2 xl model.
</details>
(b) Human annotation distribution for Question 2 across layers (GPT-2 xl).
<details>
<summary>x20.png Details</summary>
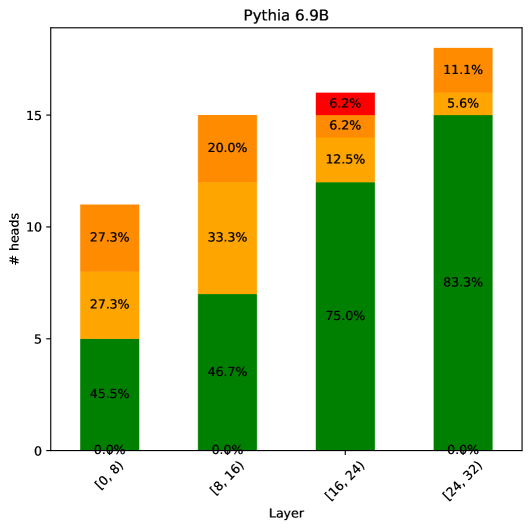
### Visual Description
## Stacked Bar Chart: Pythia 6.9B Layer Analysis
### Overview
This is a stacked bar chart visualizing the distribution of "# heads" across different layers of the Pythia 6.9B model. The chart displays the percentage contribution of different components to the total number of heads within each layer. The x-axis represents the layer range, and the y-axis represents the number of heads. Each bar is segmented into colored sections representing percentage contributions.
### Components/Axes
* **Title:** Pythia 6.9B
* **X-axis Label:** Layer
* **X-axis Markers:** \[0, 8), \[8, 16), \[16, 24), \[24, 32)
* **Y-axis Label:** # heads
* **Colors/Legend (inferred from stacking order):**
* Dark Green: Represents the lowest percentage contribution within each bar.
* Green: Represents the second lowest percentage contribution.
* Orange: Represents the middle percentage contribution.
* Red: Represents the highest percentage contribution.
### Detailed Analysis
The chart consists of four stacked bars, one for each layer range.
* **Layer \[0, 8):**
* Dark Green: 45.5%
* Green: 27.3%
* Orange: 27.3%
* Red: 0.0%
* Total # heads: Approximately 10
* **Layer \[8, 16):**
* Dark Green: 46.7%
* Green: 33.3%
* Orange: 20.0%
* Red: 0.0%
* Total # heads: Approximately 15
* **Layer \[16, 24):**
* Dark Green: 75.0%
* Green: 12.5%
* Orange: 6.2%
* Red: 6.2%
* Total # heads: Approximately 15
* **Layer \[24, 32):**
* Dark Green: 83.3%
* Green: 5.6%
* Orange: 11.1%
* Red: 0.0%
* Total # heads: Approximately 15
### Key Observations
* The distribution of "# heads" changes significantly across layers.
* Layer \[0, 8) has a relatively even distribution across the dark green, green, and orange segments.
* Layer \[16, 24) is dominated by the dark green segment (75.0%).
* Layer \[24, 32) also has a strong dominance of the dark green segment (83.3%).
* The red segment is only present in layers \[16, 24) and \[24, 32), and its contribution is relatively small (6.2% and 0.0% respectively).
### Interpretation
The chart suggests that the distribution of "heads" (likely referring to attention heads in a transformer model) varies considerably across different layers of the Pythia 6.9B model. The increasing dominance of the dark green segment in the later layers (\[16, 24) and \[24, 32)) could indicate that a larger proportion of attention heads are focused on a specific aspect or feature of the input data in those layers. The absence of the red segment in the earlier layers suggests that the higher-level features or relationships captured by those heads are not yet prominent. The varying percentages within each layer likely reflect the different roles and functionalities of the attention heads at each stage of the model's processing. The data suggests a shift in attention focus as information propagates through the layers of the model. The total number of heads appears to be relatively consistent across layers, around 10-15.
</details>
(c) Human annotation distribution for Question 2 across layers (Pythia 6.9B).
Figure 10: Quality of GPT-4o interpretation (§ E) - Human annotation distribution for Question 2.
<details>
<summary>x21.png Details</summary>
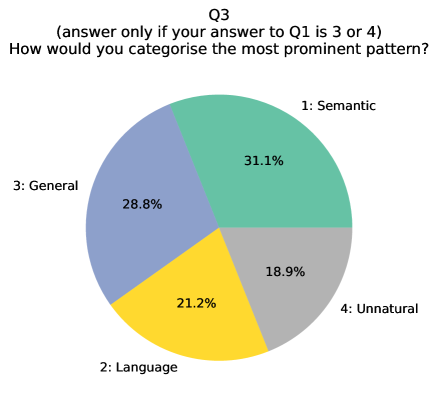
### Visual Description
\n
## Pie Chart: Q3 - Pattern Categorization
### Overview
This image presents a pie chart displaying the distribution of responses to question Q3, contingent on a prior answer of 3 or 4 to question Q1. The question asks respondents to categorize the most prominent pattern observed. The chart shows the percentage breakdown of four categories: Semantic, Language, General, and Unnatural.
### Components/Axes
* **Title:** Q3
* **Subtitle:** (answer only if your answer to Q1 is 3 or 4)
* **Question:** How would you categorise the most prominent pattern?
* **Categories:**
* 1: Semantic
* 2: Language
* 3: General
* 4: Unnatural
* **Values:** Percentages representing the proportion of responses for each category.
### Detailed Analysis
The pie chart is divided into four segments, each representing a category and its corresponding percentage.
* **Semantic (Green):** This segment occupies the largest portion of the pie chart, representing approximately 31.1% of the responses. It is positioned at the top of the chart.
* **Language (Yellow):** This segment represents approximately 21.2% of the responses. It is located to the right of the Semantic segment.
* **General (Blue):** This segment represents approximately 28.8% of the responses. It is positioned to the left of the Semantic segment.
* **Unnatural (Grey):** This segment represents approximately 18.9% of the responses. It is located at the bottom of the chart.
### Key Observations
The most frequent response category is "Semantic," with approximately 31.1% of respondents selecting it. "General" and "Language" are relatively close in proportion, at 28.8% and 21.2% respectively. "Unnatural" receives the fewest responses, at 18.9%.
### Interpretation
The data suggests that, among those who answered 3 or 4 to Q1, the most prominent pattern observed is considered to be "Semantic." This implies that the underlying phenomenon being investigated is often perceived as relating to meaning, interpretation, or conceptual understanding. The relatively high proportion of "General" responses suggests a significant number of respondents find the pattern to be broad or not easily categorized. The lower proportion of "Unnatural" responses indicates that the pattern is not commonly perceived as artificial or anomalous. The conditional nature of this question (dependent on Q1) suggests that these categorizations are specific to a subset of the overall respondent group, those who initially identified a particular characteristic in Q1. Further analysis would be needed to understand the nature of the pattern and the context in which it is being observed.
</details>
(a) Human annotation distribution for Question 3.
<details>
<summary>x22.png Details</summary>
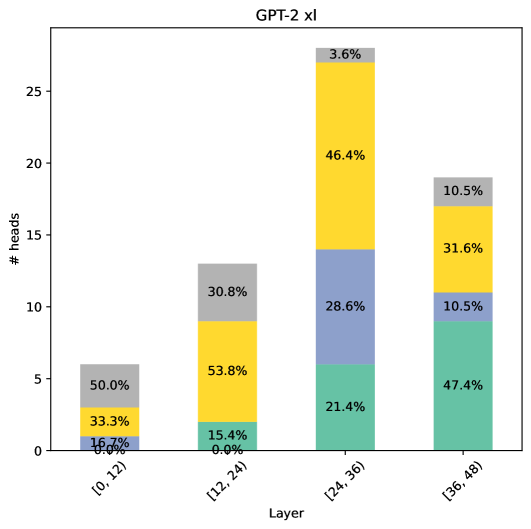
### Visual Description
## Stacked Bar Chart: GPT-2 xl Layer Analysis
### Overview
The image presents a stacked bar chart visualizing the distribution of "# heads" across different layers of the GPT-2 xl model. The chart displays the percentage contribution of different components within each layer, represented by different colored segments within each bar. The x-axis represents the layer range, and the y-axis represents the number of heads.
### Components/Axes
* **Title:** GPT-2 xl
* **X-axis Label:** Layer
* **X-axis Markers:** \[0, 12], \[12, 24], \[24, 36], \[36, 48]
* **Y-axis Label:** # heads
* **Y-axis Scale:** 0 to 28 (approximately)
* **Colors/Legend (inferred from stacking order):**
* Lightest Grey: 3.6%
* Yellow: 46.4%
* Medium Grey: 30.8%
* Light Blue: 28.6%
* Darker Grey: 33.3%
* Olive Green: 47.4%
* Tan: 10.5%
* Dark Blue: 21.4%
* Darkest Grey: 16.0%
* Light Tan: 15.4%
* Darker Tan: 31.6%
### Detailed Analysis
The chart consists of four stacked bars, each representing a layer range. The height of each segment within a bar indicates the proportion of "# heads" belonging to that segment.
* **Layer \[0, 12]:**
* Darkest Grey: Approximately 16.0%
* Darker Grey: Approximately 33.3%
* Light Tan: Approximately 50.0%
* Total # heads: Approximately 5
* **Layer \[12, 24]:**
* Darkest Grey: Approximately 15.4%
* Light Tan: Approximately 53.8%
* Medium Grey: Approximately 30.8%
* Total # heads: Approximately 15
* **Layer \[24, 36]:**
* Darkest Grey: Approximately 21.4%
* Light Blue: Approximately 28.6%
* Yellow: Approximately 46.4%
* Lightest Grey: Approximately 3.6%
* Total # heads: Approximately 22
* **Layer \[36, 48]:**
* Tan: Approximately 10.5%
* Darker Tan: Approximately 31.6%
* Olive Green: Approximately 47.4%
* Lightest Grey: Approximately 10.5%
* Total # heads: Approximately 20
### Key Observations
* The distribution of "# heads" varies significantly across layers.
* Layer \[24, 36] has the highest total number of heads (approximately 22).
* Layer \[0, 12] has the lowest total number of heads (approximately 5).
* The color Yellow is most prominent in the \[24, 36] layer.
* Olive Green is most prominent in the \[36, 48] layer.
* The Darkest Grey segment is present in all layers, but its proportion varies.
### Interpretation
The chart illustrates the composition of "# heads" within different layers of the GPT-2 xl model. The varying distributions suggest that different layers may focus on different aspects of the model's functionality, as reflected in the proportion of each component. The higher number of heads in the \[24, 36] layer could indicate that this layer is particularly important for the model's overall performance. The differences in color distribution across layers suggest that the model's internal representation of information changes as data flows through the layers. The consistent presence of the Darkest Grey segment across all layers suggests that this component is fundamental to the model's operation at all levels. The chart provides a visual representation of the model's internal structure and could be used to identify areas for further investigation or optimization.
</details>
(b) Human annotation distribution for Question 3 across layers (GPT-2 xl).
<details>
<summary>x23.png Details</summary>
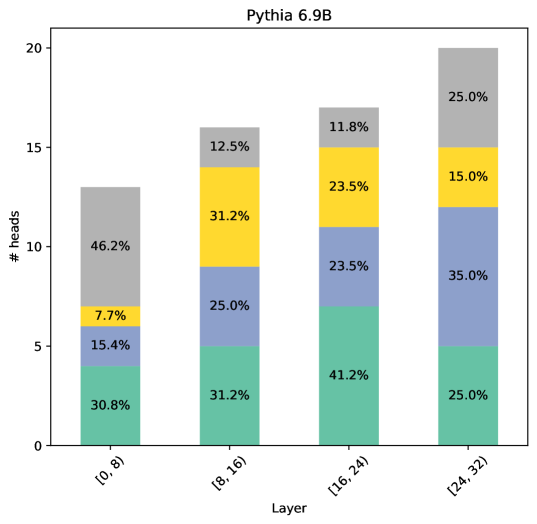
### Visual Description
## Bar Chart: Pythia 6.9B Layer Analysis
### Overview
The image presents a bar chart visualizing the distribution of "# heads" across different layers of the Pythia 6.9B model. Each bar represents a layer range, and the bar is segmented into colored sections representing percentage contributions. The x-axis denotes the layer range, and the y-axis represents the number of heads.
### Components/Axes
* **Title:** Pythia 6.9B
* **X-axis Label:** Layer
* **Y-axis Label:** # heads
* **X-axis Markers:** \[0, 8], \[8, 16], \[16, 24], \[24, 32]
* **Legend:** (Implicitly defined by color)
* Lightest Green: 7.7% (in [0,8]) / 12.5% (in [8,16]) / 11.8% (in [16,24]) / 25.0% (in [24,32])
* Green: 30.8% (in [0,8]) / 31.2% (in [8,16]) / 41.2% (in [16,24]) / 25.0% (in [24,32])
* Teal: 15.4% (in [0,8]) / 25.0% (in [8,16]) / 23.5% (in [16,24]) / 35.0% (in [24,32])
* Orange: 46.2% (in [0,8]) / 31.2% (in [8,16]) / 23.5% (in [16,24]) / 15.0% (in [24,32])
### Detailed Analysis
The chart consists of four bars, each representing a layer range. The height of each bar indicates the total "# heads" for that layer range. Each bar is divided into four colored segments, representing the percentage contribution of each segment to the total height of the bar.
* **\[0, 8] Layer:** The bar reaches approximately 12 heads.
* Orange segment: 46.2% (approximately 5.5 heads)
* Teal segment: 15.4% (approximately 1.8 heads)
* Green segment: 30.8% (approximately 3.7 heads)
* Lightest Green segment: 7.7% (approximately 0.9 heads)
* **\[8, 16] Layer:** The bar reaches approximately 16 heads.
* Orange segment: 31.2% (approximately 5 heads)
* Teal segment: 25.0% (approximately 4 heads)
* Green segment: 31.2% (approximately 5 heads)
* Lightest Green segment: 12.5% (approximately 2 heads)
* **\[16, 24] Layer:** The bar reaches approximately 18 heads.
* Orange segment: 23.5% (approximately 4.2 heads)
* Teal segment: 23.5% (approximately 4.2 heads)
* Green segment: 41.2% (approximately 7.4 heads)
* Lightest Green segment: 11.8% (approximately 2.1 heads)
* **\[24, 32] Layer:** The bar reaches approximately 20 heads.
* Orange segment: 15.0% (approximately 3 heads)
* Teal segment: 35.0% (approximately 7 heads)
* Green segment: 25.0% (approximately 5 heads)
* Lightest Green segment: 25.0% (approximately 5 heads)
### Key Observations
* The number of heads generally increases as the layer range increases, from approximately 12 heads in \[0, 8] to approximately 20 heads in \[24, 32].
* The orange segment consistently represents a significant portion of each bar, particularly in the \[0, 8] layer.
* The teal segment increases in prominence in the \[24, 32] layer.
* The green segment is the largest in the \[16, 24] layer.
### Interpretation
This chart likely represents the distribution of attention heads across different layers of the Pythia 6.9B language model. The "# heads" likely refers to the number of attention heads in each layer. The percentage breakdown within each bar indicates how these heads are distributed across different attention mechanisms or functionalities (represented by the colors).
The increasing number of heads with deeper layers suggests that the model increases its capacity for parallel processing and attention as it processes information. The varying percentage contributions of each color across layers could indicate that different attention mechanisms become more or less important at different stages of the model's processing. The prominence of the orange segment in the earlier layers might suggest that a particular attention mechanism is crucial for initial feature extraction. The shift in the \[24, 32] layer, with a larger teal and lightest green segment, could indicate a change in the model's focus towards more complex relationships or higher-level abstractions. The chart provides insights into the internal workings of the Pythia 6.9B model and how it utilizes attention mechanisms across its layers.
</details>
(c) Human annotation distribution for Question 3 across layers (Pythia 6.9B).
Figure 11: Quality of GPT-4o interpretation (§ E) - Human annotation distribution for Question 3.
Appendix F Analysis of Global Versus Specific Functionality
We observe that the mappings in $M$ provide a broad view of the head’s functionality, particularly on how global the head’s operation is. For example, a head that maps any token to an end-of-sequence token has global functionality, whereas heads that map countries to their capitals, colors to their complementary pairs, and so on, demonstrate specific operations. In this section, we use properties of $M$ to analyze how global the functionalities of attention heads in LLMs are.
Analysis
We estimate how global the functionality of a given head is using two metrics: input skewness, which captures the skewness of the head’s operation towards specific inputs, and output space size, which estimates the number of tokens the head tends to output. For input skewness, we obtain the saliency scores $\sigma_{t}(W_{VO})\;∀ t∈\mathcal{V}$ according to the head (see § 3.2), and calculate the skewness of their distribution. For output space size, we compute for every token $s∈\mathcal{V}$ the highest-score token $t$ it is mapped into according to $M$ : $t=\arg\max(\mathbf{m}_{s})$ . Next, we define the output space size to be the portion of unique output tokens over the vocabulary. For instance, we expect the output space of a head that only maps strings to their first letters to be a small set of letter tokens. Similarly to the normalization of the saliency scores by the embedding norms, which we applied in § 3.2, here, when calculating $M$ , we normalize the unembeddings ( $U$ ’s columns).
<details>
<summary>x24.png Details</summary>
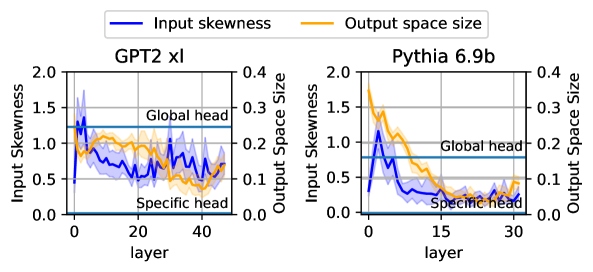
### Visual Description
\n
## Chart: Input Skewness and Output Space Size vs. Layer
### Overview
The image presents two line charts comparing "Input Skewness" and "Output Space Size" across layers for two different models: "GPT2 xl" and "Pythia 6.9b". Both charts share the same axes and legend, allowing for a direct comparison of the two models. The charts are positioned side-by-side.
### Components/Axes
* **X-axis:** "layer" - ranging from approximately 0 to 45 for GPT2 xl and 0 to 35 for Pythia 6.9b.
* **Left Y-axis:** "Input Skewness" - ranging from 0.0 to 2.0.
* **Right Y-axis:** "Output Space Size" - ranging from 0.0 to 0.4.
* **Legend:**
* Blue Line: "Input skewness"
* Orange Line: "Output space size"
* **Titles:**
* Left Chart: "GPT2 xl"
* Right Chart: "Pythia 6.9b"
* **Annotations:**
* Horizontal lines at y = 1.25 for Input Skewness labeled "Global head"
* Horizontal lines at y = 0.08 for Output Space Size labeled "Specific head"
### Detailed Analysis or Content Details
**GPT2 xl Chart:**
* **Input Skewness (Blue Line):** Starts at approximately 1.3, decreases rapidly to around 0.7 by layer 10, then fluctuates between 0.6 and 0.9 with several oscillations until layer 45, ending around 0.7.
* **Output Space Size (Orange Line):** Starts at approximately 0.28, decreases steadily to around 0.1 by layer 10, then fluctuates between 0.08 and 0.15 until layer 45, ending around 0.1.
**Pythia 6.9b Chart:**
* **Input Skewness (Blue Line):** Starts at approximately 1.4, decreases rapidly to around 0.7 by layer 5, then fluctuates between 0.5 and 0.8 with several oscillations until layer 35, ending around 0.6.
* **Output Space Size (Orange Line):** Starts at approximately 0.3, decreases steadily to around 0.1 by layer 10, then fluctuates between 0.07 and 0.13 until layer 35, ending around 0.1.
### Key Observations
* Both models exhibit a similar trend: both "Input Skewness" and "Output Space Size" decrease initially and then stabilize with fluctuations as the layer number increases.
* The "Input Skewness" consistently remains above the "Specific head" annotation line (y=0.08) for both models.
* The "Output Space Size" fluctuates around the "Specific head" annotation line (y=0.08) for both models.
* The initial decrease in both metrics is more pronounced in the GPT2 xl model compared to the Pythia 6.9b model.
* The fluctuations in both metrics appear to be more frequent and larger in magnitude for the GPT2 xl model.
### Interpretation
The charts suggest that as information propagates through the layers of both GPT2 xl and Pythia 6.9b, the input distribution becomes less skewed (Input Skewness decreases), and the dimensionality of the output space stabilizes (Output Space Size decreases and fluctuates). The initial rapid decrease likely represents the initial processing and feature extraction stages. The subsequent fluctuations indicate a dynamic interplay between different layers and features.
The differences between the two models suggest that GPT2 xl might have a more complex internal representation, as evidenced by the more pronounced fluctuations in both metrics. The "Global head" and "Specific head" annotations suggest that these values represent some kind of threshold or target for the models' internal states. The fact that Input Skewness remains above the "Specific head" line suggests that the input distribution is always somewhat non-normal, while the Output Space Size fluctuates around it, indicating a more dynamic relationship.
The charts provide insights into the internal dynamics of these large language models, potentially aiding in understanding their behavior and improving their performance. Further investigation could explore the correlation between these metrics and the models' performance on specific tasks.
</details>
Figure 12: Input skewness versus output space size for all attention heads per layer in Pythia 6.9B and GPT-2 xl, compared to baseline heads of global and specific functionalities. Lower input skewness indicates a larger input space.
Additionally, we present two baselines. The first baseline, dubbed “specific head”, represents the output space size of a head that maps the entire vocabulary to 1 specific token (e.g. a head that always outputs the end of sequence token). The second baseline, called “global head”, represents the output space size of a head that maps the entire vocabulary to capitalized tokens with leading spaces - a subset whose size is 25% of the vocabulary of GPT-2 xl, and 16% of the vocabulary of Pythia 6.9B. An example of such a “global head” is a head that maps every word (or sub-word) in English to its capitalized version, and all other tokens to one specific token.
Results
Figure 12 shows the input skewness and output space sizes for all heads in Pythia 6.9B and GPT-2 xl. In both models, the input skewness rises and then sharply decreases in the early layers, after which it stabilizes. This implies that attention heads in shallower layers induce a salient effect into a specific set of inputs compared to later layers. In contrast, the output space size generally decreases across layers with a slight increase in the final layers, suggesting that head outputs across layers converge to smaller token subsets. Taken together, we hypothesize that early layer heads demonstrate their functionality on fewer inputs than deeper heads, which in turn map a larger set of possible inputs to a small set of outputs.
Appendix G Resources and Packages
In our experiments, we used models and code from the transformers Wolf et al. (2020) and TransformerLens Nanda and Bloom (2022) packages, and nanoGPT. https://github.com/karpathy/nanoGPT All the experiments were conducted using a single A100 80GB or H100 80GB GPU, aside from the experiments studying Llama-3.1 70B, which used nodes with 8 of these GPUs.