# Visual Description
<details>
<summary>Image 1 Details</summary>

### Visual Description
Icon/Small Image (98x40)
</details>
## The Lessons of Developing Process Reward Models in Mathematical Reasoning
Runji Lin
Zhenru Zhang Chujie Zheng Yangzhen Wu Beichen Zhang Bowen Yu ∗ Dayiheng Liu ∗ Jingren Zhou Junyang Lin ∗
Qwen Team, Alibaba Group
https://hf.co/Qwen/Qwen2.5-Math-PRM-7B
https://hf.co/Qwen/Qwen2.5-Math-PRM-72B
## Abstract
Process Reward Models (PRMs) emerge as a promising approach for process supervision in mathematical reasoning of Large Language Models (LLMs), which aim to identify and mitigate intermediate errors in the reasoning processes. However, the development of effective PRMs faces significant challenges, particularly in data annotation and evaluation methodologies. In this paper, through extensive experiments, we demonstrate that commonly used Monte Carlo (MC) estimation-based data synthesis for PRMs typically yields inferior performance and generalization compared to LLM-as-a-judge and human annotation methods. MC estimation relies on completion models to evaluate currentstep correctness, which can generate correct answers from incorrect steps or incorrect answers from correct steps, leading to inaccurate step verification. Furthermore, we identify potential biases in conventional Best-of-N (BoN) evaluation strategies for PRMs: (1) The unreliable policy models generate responses with correct answers but flawed processes, leading to a misalignment between the evaluation criteria of BoN and the PRM objectives of process verification. (2) The tolerance of PRMs of such responses leads to inflated BoN scores. (3) Existing PRMs have a significant proportion of minimum scores concentrated on the final answer steps, revealing the shift from process to outcome-based assessment in BoN Optimized PRMs. To address these challenges, we develop a consensus filtering mechanism that effectively integrates MC estimation with LLM-as-a-judge and advocates a more comprehensive evaluation framework that combines response-level and step-level metrics. Based on the mechanisms, we significantly improve both model performance and data efficiency in the BoN evaluation and the step-wise error identification task. Finally, we release a new state-of-the-art PRM that outperforms existing open-source alternatives and provides practical guidelines for future research in building process supervision models.
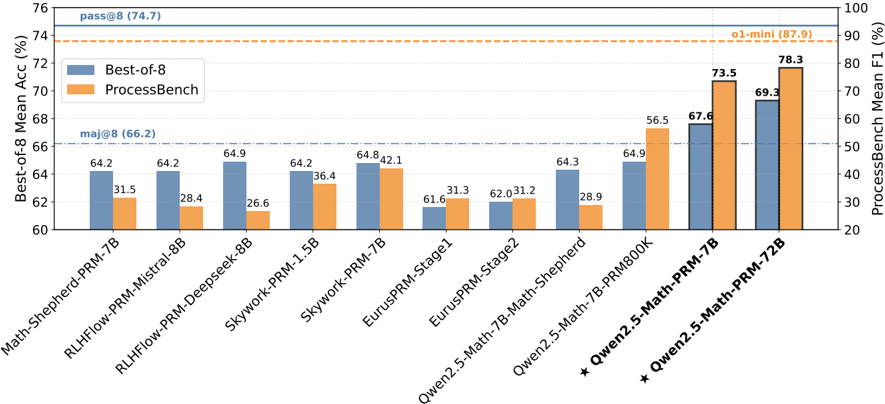
Figure 1: Overview of evaluation results on the Best-of-8 strategy of the policy model Qwen2.5-Math-7BInstruct and the benchmark PROCESSBENCH (Zheng et al., 2024) across multiple PRMs (see Table 6 and Table 7 for details).
<details>
<summary>Image 2 Details</summary>
### Visual Description
## Grouped Bar Chart: PRM Performance Comparison (Best-of-8 vs. ProcessBench)
### Overview
This image is a dual-axis grouped bar chart comparing the performance of ten different Process Reward Models (PRMs) across two distinct evaluation metrics: "Best-of-8" (Mean Accuracy %) and "ProcessBench" (Mean F1 %). The chart illustrates how various models, ranging from smaller 1.5B parameter models to the larger 72B parameter models, perform on these benchmarks.
### Components/Axes
* **X-Axis (Categorical):** Lists the ten models evaluated, from left to right:
1. Math-Shepherd-PRM-7B
2. RLHFlow-PRM-Mistral-8B
3. RLHFlow-PRM-Deepseek-8B
4. Skywork-PRM-1.5B
5. Skywork-PRM-7B
6. EurusPRM-Stage1
7. EurusPRM-Stage2
8. Qwen2.5-Math-7B-PRM800K
9. Qwen2.5-Math-PRM-7B (marked with a star)
10. Qwen2.5-Math-PRM-72B (marked with a star)
* **Left Y-Axis:** "Best-of-8 Mean Acc (%)". Scale ranges from 60 to 76.
* **Right Y-Axis:** "ProcessBench Mean F1 (%)". Scale ranges from 20 to 100.
* **Legend (Top-Left):**
* **Blue Bar:** Best-of-8
* **Orange Bar:** ProcessBench
* **Reference Lines:**
* **Solid Blue Line:** "pass@8 (74.7)" (Horizontal line across the top).
* **Dashed Orange Line:** "o1-mini (87.9)" (Horizontal line near the top).
* **Dash-Dot Blue Line:** "maj@8 (66.2)" (Horizontal line across the middle).
### Detailed Analysis
The chart uses a dual-axis system. Blue bars correspond to the left axis (Best-of-8), and orange bars correspond to the right axis (ProcessBench).
| Model | Best-of-8 (Blue) | ProcessBench (Orange) |
| :--- | :--- | :--- |
| Math-Shepherd-PRM-7B | 64.2 | 31.5 |
| RLHFlow-PRM-Mistral-8B | 64.2 | 28.4 |
| RLHFlow-PRM-Deepseek-8B | 64.9 | 26.6 |
| Skywork-PRM-1.5B | 64.2 | 36.4 |
| Skywork-PRM-7B | 64.8 | 42.1 |
| EurusPRM-Stage1 | 61.6 | 31.3 |
| EurusPRM-Stage2 | 62.0 | 31.2 |
| Qwen2.5-Math-7B-PRM800K | 64.9 | 56.5 |
| Qwen2.5-Math-PRM-7B | 67.6 | 73.5 |
| Qwen2.5-Math-PRM-72B | 69.3 | 78.3 |
**Visual Trends:**
* **Best-of-8 (Blue Bars):** Most models hover in the 64-65% range. There is a noticeable dip with the EurusPRM models (61.6-62.0%) and a significant upward trend starting with the Qwen2.5 series, peaking at 69.3%.
* **ProcessBench (Orange Bars):** This metric shows much higher variance. The performance starts low (26-36% range for the first seven models) and increases dramatically with the Qwen2.5 models, culminating in the highest value of 78.3%.
### Key Observations
* **Dominance of Qwen2.5:** The Qwen2.5-Math-PRM-72B model is the clear top performer on both metrics, significantly outperforming all other models listed.
* **Metric Sensitivity:** The ProcessBench metric appears to be more sensitive to model improvements than the Best-of-8 metric. While Best-of-8 scores improved by roughly 5-7 percentage points from the baseline models to the top model, ProcessBench scores improved by over 50 percentage points (from ~26% to 78.3%).
* **Baseline Gaps:** Despite the strong performance of the Qwen2.5-Math-PRM-72B, it still falls short of the "pass@8 (74.7)" and "o1-mini (87.9)" reference lines, indicating that even the best-performing PRM in this set has room for improvement to reach these benchmarks.
### Interpretation
This data demonstrates a clear correlation between model scale/architecture and performance on process-based reasoning tasks. The Qwen2.5 series, particularly the 72B variant, represents a significant leap in capability compared to the earlier models (like Math-Shepherd or RLHFlow).
The use of two different metrics suggests that "Best-of-8" might be a saturated metric where models are clustered closely together, making it harder to distinguish performance differences. In contrast, "ProcessBench" provides a much wider dynamic range, effectively highlighting the superior reasoning capabilities of the newer Qwen models. The reference lines (pass@8 and o1-mini) serve as "north stars," showing that while the field is advancing rapidly, the current state-of-the-art PRMs are still trailing behind the performance levels of the o1-mini model on the ProcessBench metric.
</details>
∗ Corresponding authors.
<details>
<summary>Image 3 Details</summary>

### Visual Description
Icon/Small Image (27x24)
</details>
<details>
<summary>Image 4 Details</summary>

### Visual Description
Icon/Small Image (25x21)
</details>
## 1 Introduction
In recent years, Large Language Models (LLMs) have made remarkable advances in mathematical reasoning (OpenAI, 2023; Dubey et al., 2024; Shao et al., 2024; Zhu et al., 2024; Yang et al., 2024a;c;b), yet they can make mistakes, such as miscalculations or logical errors, leading to wrong conclusions. Moreover, even when achieving correct final answers, these powerful models can still regularly make up plausible reasoning steps, where the final answers build upon flawed calculations or derivations, which undermine the reliability and trustworthiness of LLMs' reasoning processes. To address these challenges, Process Reward Models (PRMs; Lightman et al. 2023; Wang et al. 2024b), as a representative and recently focal approach, are proposed to identify and mitigate process errors, thereby enabling finer-grained supervision on the reasoning process.
One critical challenge of developing PRMs lies in the data annotation for the correctness of reasoning processes, which is typically expensive and time-consuming. While Lightman et al. (2023) recruited human annotators with detailed instructions and elaborate procedures to achieve satisfactory annotation quality, the prohibitive cost pushes researchers to explore automated annotation methods. Among them, one commonly used approach is to assess process correctness by estimating the empirical probability of leading to the correct final answers through Monte Carlo (MC) methods, which has attracted great research interests and has also been commonly employed in practice (Xiong et al., 2024; Wang et al., 2024b; Luo et al., 2024). Another challenge lies in evaluating PRM performance, as previous studies (Lightman et al., 2023; Wang et al., 2024b; Luo et al., 2024) have predominantly relied on the Best-of-N (BoN) evaluation, which selects the highest-scored response from N candidates according to a PRM. Recently, PROCESSBENCH (Zheng et al., 2024) have emerged to evaluate the capability of PRMs in identifying step-wise correctness.
Nevertheless, during the training of our own PRM following conventional principles to construct data using MC estimation and evaluate on BoN, we gain several crucial lessons. In terms of MC estimation , (1) we observe that the PRM trained via MC estimation demonstrated significantly inferior performance and generalization capabilities compared to LLM-as-a-judge (Zheng et al., 2023) and human annotation. (2) We attribute the suboptimal performance of MC estimation to its fundamental limitation, which attempts to evaluate deterministic current-step correctness based on potential future outcomes. It significantly relies on the performance of the completion model, which may generate correct answers based on incorrect steps, or incorrect answers based on correct steps, introducing substantial noise and inaccuracy verification into step-wise correctness estimation. Regarding the BoN evaluation , (1) the unreliable policy models generate responses with correct answers but flawed processes, leading to a misalignment between the evaluation criteria of BoN and the PRM objectives of process verification. (2) the limited process verification capability makes PRMs demonstrate tolerance for these cases, resulting in inflated BoN performance. (3) We find that in the step scores distribution of existing PRMs, a significant proportion of minimum scores are concentrated on the final answer steps, indicating PRMs have shifted from process to outcome-based assessment in BoN.
To address these challenges, we develop a consensus filtering mechanism that combines MC estimation with LLM-as-a-judge. The instances are only retained when both LLM-as-a-judge and MC estimation show consensus on the error reasoning step locations in the solution. Our approach demonstrates more efficient data utilization and surpass existing open-source PRMs in the conventional BoN evaluation. Furthermore, we advocate for complementing response-level BoN with step-wise evaluation methods. We employ the step-wise benchmark PROCESSBENCH (Zheng et al., 2024) to measure the ability to identify process errors in mathematical reasoning. Our trained PRMs exhibit impressively stronger error identification performance than other open-source models, from PRMs to general language models, confirming that our training approach genuinely teaches PRMs to assess the correctness of intermediate reasoning steps.
Our key contributions can be summarized as follows:
- We identify critical limitations in current data construction approaches for PRMs, demonstrating that MC estimation-based data construction yields inferior performance compared to LLM-as-ajudge and human annotation.
- We reveal the potential bias in using response-level BoN evaluation alone for PRMs and advocate for comprehensive evaluation strategies combining both response-level and step-level metrics.
- We propose a simple yet efficient consensus filtering mechanism that integrates MC estimation with LLM-as-a-judge, significantly improving both model performance and data efficiency in PRM training.
- We substantiate our findings through extensive empirical studies and also open source our trained PRMs, which can establish practical guidelines and best practices for future research and development for reasoning process supervision.
## 2 Preliminary Trials
In this section, we describe our preliminary attempts to train PRMs via MC estimation-based reasoning step annotation. Despite our efforts in scaling up training data and careful tuning of training objectives, we found that the MC estimation-based PRMs do not possess noticeable advantages over the one trained on human-annotated data (Lightman et al., 2023), and even lag significantly behind the latter in identifying specific erroneous reasoning steps.
## 2.1 Training Setup
Training Data Synthesis We followed the commonly used MC estimation approach, Math-Shepherd (Wang et al., 2024b), to construct the PRM training data. Specifically, we collected a large-scale dataset of approximately 500,000 queries with golden answers. For each query, we generate 6-8 diverse responses by mixing outputs from the Qwen2-Math-Instruct and Qwen2.5-Math-Instruct series models (Yang et al., 2024c), spanning the model sizes of 7B and 72B parameters. These responses are systematically split into individual steps using the delimiter ' \ n \ n'. To assess the correctness of each step, we conduct 8 independent completions starting from this step using Qwen2.5-Math-Instruct series with the corresponding model size, estimating the step labels based on the empirical probabilities of each step yielding the correct final answer. We trained PRMs with either hard labels or soft labels. For hard labels, we treat a step as correct if any one of the 8 completions yields the correct final answer, and negative otherwise. For soft labels, we determined the value (between 0 and 1) as the proportion of completions leading to the correct final answers. Note that we eliminated all steps subsequent to those labeled as incorrect (label 0), as their validity becomes irrelevant after an error occurs. This removal was implemented to prevent potential model confusion during training.
Training Details Our trained PRMs were initialized from the supervised fine-tuned Qwen2.5-Math7B/72B-Instruct models (Yang et al., 2024c), where we replace the original language modeling head (used for next token prediction) with a scalar-value head, consisting of two linear layers. We calculated the cross-entropy (CE) loss and mean squared error (MSE) loss on the last tokens of each step for the binary classification task using hard labels and for the regression task using soft labels, respectively.
## 2.2 Evaluation Setup
We evaluate our trained PRMs from two aspects: their utilities in straightforwardly improving downstream task performance and their abilities to identify specific erroneous steps in reasoning processes.
Best-of-N Consistent with previous work (Lightman et al., 2023; Wang et al., 2024b; Luo et al., 2024; Cobbe et al., 2021; Yang et al., 2024c), we employed the Best-of-N (BoN) sampling strategy for evaluation, which selects the highest-scored response from N candidates according to a PRM. We denote the evaluation metric as 'prm@ N '. Following Yang et al. (2024c), we sampled eight responses (i.e., N = 8) from Qwen2.5-Math-7B-Instruct across multiple mathematical benchmarks, including GSM8K (Cobbe et al., 2021), MATH (Hendrycks et al., 2021b), Minerva Math (Lewkowycz et al., 2022), GaoKao 2023 En (Liao et al., 2024), OlympiadBench (He et al., 2024), College Math (Tang et al., 2024), and MMLU STEM (Hendrycks et al., 2021a). Each candidate response is scored using the product of all the individual scores of each step within the response, as computed in Lightman et al. (2023). We also report the result of majority voting among eight samplings (maj@8) as the baseline, and pass@8 (i.e., the proportion of test samples where any of the eight samplings lead to the correct final answers) as the upper bound.
PROCESSBENCH We also evaluated on PROCESSBENCH as a complement. PROCESSBENCH (Zheng et al., 2024) measures the capability of models to identify erroneous steps in mathematical reasoning. Models are required to identify the first step that contains an error or conclude that all steps are correct. Following the evaluation methods for PRMs in PROCESSBENCH, we locate the first erroneous step from predict scores yielded by PRMs.
## 2.3 Evaluation Results
As shown in Table 1 and Table 2, we denote the models trained on our MC estimated dataset as Qwen2.5Math-7B-PRM-MC-hard (trained with hard labels) and Qwen2.5-Math-7B-PRM-MC-soft (trained with soft labels), respectively. To compare them with a baseline model, we trained exclusively on the PRM800K (Lightman et al., 2023) dataset with its hard labels named Qwen2.5-Math-7B-PRM-PRM800K. The experimental results reveal two critical limitations: (1) In the Best-of-8 evaluation, none of the PRMs achieved prm@8 scores superior to maj@8. (2) When evaluating on the PROCESSBENCH for identifying erroneous
| Setting | GSM8K | MATH | Minerva Math | GaoKao 2023 En | Olympiad Bench | College Math | MMLU STEM | Avg. |
|-----------------------------|---------|--------|----------------|------------------|------------------|----------------|-------------|--------|
| pass@8 (Upper Bound) | 98.1 | 92 | 49.3 | 80.5 | 59.6 | 52.6 | 90.5 | 74.7 |
| maj@8 | 96.7 | 87.1 | 41.2 | 72.5 | 44.4 | 47.8 | 73.8 | 66.2 |
| Qwen2.5-Math-7B-PRM800K | 96.9 | 86.9 | 37.1 | 71.2 | 44 | 47.6 | 70.9 | 64.9 |
| Qwen2.5-Math-7B-PRM-MC-hard | 96.8 | 87.3 | 40.1 | 70.6 | 43.7 | 48.1 | 71.6 | 65.5 |
| Qwen2.5-Math-7B-PRM-MC-soft | 96.8 | 86.3 | 37.9 | 70.6 | 41 | 47.7 | 70.4 | 64.4 |
Table 1: Performance comparison on Best-of-8 using PRMs trained with MC estimated hard labels and soft labels, human-annotated PRM800K, denoted as Qwen2.5-Math-7B-PRM-MC-hard, Qwen2.5-Math7B-PRM-MC-soft, and Qwen2.5-Math-7B-PRM800K, respectively.
| Model | GSM8K | GSM8K | GSM8K | MATH | MATH | MATH | OlympiadBench | OlympiadBench | OlympiadBench | Omni-MATH | Omni-MATH | Omni-MATH | Avg. F1 |
|-----------------------------|---------|---------|---------|--------|---------|--------|-----------------|-----------------|-----------------|-------------|-------------|-------------|-----------|
| | error | correct | F1 | error | correct | F1 | error | correct | F1 | error | correct | F1 | Avg. F1 |
| Qwen2.5-Math-7B-PRM800K | 53.1 | 95.3 | 68.2 | 48.0 | 90.1 | 62.6 | 35.7 | 87.3 | 50.7 | 29.8 | 86.1 | 44.3 | 56.5 |
| Qwen2.5-Math-7B-PRM-MC-hard | 67.1 | 90.2 | 77.0 | 35.2 | 65.8 | 45.8 | 13.2 | 28.0 | 17.9 | 13.3 | 41.9 | 20.2 | 40.2 |
| Qwen2.5-Math-7B-PRM-MC-soft | 65.7 | 93.3 | 77.1 | 35.7 | 64.5 | 46.0 | 13.2 | 29.2 | 18.1 | 12.9 | 40.2 | 19.6 | 40.2 |
Table 2: Performance comparison on PROCESSBENCH using PRMs trained with MC estimated hard labels and soft labels, human-annotated PRM800K, denoted as Qwen2.5-Math-7B-PRM-MC-hard, Qwen2.5Math-7B-PRM-MC-soft, and Qwen2.5-Math-7B-PRM800K, respectively.
reasoning steps, both Qwen2.5-Math-7B-PRM-MC-hard and Qwen2.5-Math-7B-PRM-MC-soft exhibit significantly inferior erroneous step localization capabilities compared to Qwen2.5-Math-7B-PRM-PRM800K, though the former had larger scale of data.
These undesirable evaluation performances push us to reflect on the currently prevalent data synthesis approach and evaluation strategy. Through the subsequent optimization process, we have indeed gained several observations and lessons learned.
## 3 The lessons
In this section, we present the critical lessons gained during the PRM training. Our discussion comprises three main aspects: (1) the limitations of commonly adopted MC estimation approaches in PRMs training, and (2) the bias in using BoN as the sole evaluation metric for optimizing PRMs.
## 3.1 Limitations of MC Estimation for PRMs Training
## 3.1.1 Distinguishing PRMs from Value Models
Reward models in mathematical reasoning serve as correctness verifiers and PRMs provide fine-grained supervision by evaluating the correctness of intermediate reasoning steps. In contrast, value models estimate the potential of reaching the correct final answer from the current step in the future. The key difference between PRM and value model lies in that PRMs function as deterministic evaluators of current step correctness, while value models operate as predictive estimators of future solution potential.
MCestimation attempts to estimate the potential of reaching the correct final answer in the future from the current step. When we follow this approach to construct data and train the PRMs, the value model principles are incorporated into PRMs training essentially. This methodology potentially introduces performance and generalization limitations which we will discuss in subsequent sections.
## 3.1.2 MCEstimation vs. LLM-as-a-judge vs. Human Annotation
Wefound that MC estimation methods limit PRM's capability to identify erroneous steps as demonstrated in the experiments of Section 2.3. For further investigation, we compare the performance using 3 distinct data construct approaches: MC estimation, LLM-as-a-judge, and human annotation. For the MCestimation approach, we respectively train the PRM on 445k open-source datasets Math-shepherd (Wang et al., 2024b) and our 860k similarly constructed dataset. For our constructed dataset, the MC estimation employs responses from Qwen2-Math-Instruct and completes subsequent reasoning processes by Qwen2.5-Math-Instruct. For the LLM-as-a-judge approach, we use the same 860k query and response and employ Qwen2.5-72B-Instruct to verify the correctness of each step in the responses with the prompt template shown in Appendix C. For the human annotation approach, we use the open-source dataset PRM800K (Lightman et al., 2023) which consists of approximately 265k samples after deduplication against the test set.
Table 3: PRMs performance comparison on the Best-of-8 strategy of the policy model Qwen2.5-Math-7BInstruct. The models are trained on the different data construction methods including MC estimation, LLM-as-a-judge, and human annotation.
| Setting | # samples | GSM8K | MATH | Minerva Math | GaoKao 2023 En | Olympiad Bench | College Math | MMLU STEM | Avg. |
|------------------------------|-------------|---------|--------|----------------|------------------|------------------|----------------|-------------|--------|
| MCEstimation (Math-Shepherd) | 440k | 96.9 | 86.5 | 36.8 | 71.4 | 41.6 | 47.7 | 69.3 | 64.3 |
| MCEstimation (our data) | 860k | 97 | 87.6 | 41.9 | 71.4 | 43.6 | 48.2 | 71.9 | 65.9 |
| LLM-as-a-judge (our data) | 860k | 96.9 | 86.8 | 39 | 71.2 | 43.7 | 47.7 | 71.9 | 65.3 |
| Human Annotation (PRM800K) | 264k | 96.9 | 86.9 | 37.1 | 71.2 | 44 | 47.6 | 70.9 | 64.9 |
Table 4: PRMs performance comparison on PROCESSBENCH. The models are trained on the different data construction methods including MC estimation, LLM-as-a-judge, and human annotation.
| Method | # samples | GSM8K | GSM8K | GSM8K | MATH | MATH | MATH | OlympiadBench | OlympiadBench | OlympiadBench | Omni-MATH | Omni-MATH | Omni-MATH | Avg.F1 |
|------------------------------|-------------|---------|---------|---------|--------|---------|--------|-----------------|-----------------|-----------------|-------------|-------------|-------------|----------|
| | | error | correct | F1 | error | correct | F1 | error | correct | F1 | error | correct | F1 | |
| MCEstimation (Math-Shepherd) | 440k | 46.4 | 95.9 | 62.5 | 18.9 | 96.6 | 31.6 | 7.4 | 93.8 | 13.7 | 4.0 | 95.0 | 7.7 | 28.9 |
| MCEstimation (our data) | 860k | 62.3 | 91.2 | 74.0 | 35.2 | 71.9 | 47.3 | 12.7 | 41.3 | 19.4 | 12.1 | 54.4 | 19.8 | 40.1 |
| LLM-as-a-judge (our data) | 860k | 44.0 | 99.0 | 60.9 | 33.5 | 94.8 | 49.5 | 24.7 | 97.1 | 39.4 | 22.3 | 95.4 | 36.1 | 46.5 |
| Human Annotation (PRM800K) | 264k | 53.1 | 95.3 | 68.2 | 48.0 | 90.1 | 62.6 | 35.7 | 87.3 | 50.7 | 29.8 | 86.3 | 44.3 | 56.5 |
The experimental results of Best-of-8 and PROCESSBENCH are shown in Table 3 and Table 4, respectively. For Best-of-8, Table 3 shows that the PRM trained on our MC estimated data achieves the best average accuracy and human annotation performs worst. For PROCESSBENCH, Table 4 demonstrates that human annotation achieves the best performance with the least amount of data, followed by LLM-as-a-judge, while MC estimation performed the worst despite having the largest dataset overall. Specifically, (1) human annotation, despite being only performed on the MATH dataset, exhibited superior generalization capabilities on more complex tasks OlympiadBench and Omni-MATH. (2) Given identical data with different annotation approaches, LLM-as-a-judge demonstrates better generalization performance on challenging problems than MC estimation, although the latter showed favorable results on GSM8K. (3) For MC estimation, a comparison between our 860k dataset and Math-Shepherd 440k data indicates that performance improvements can still be achieved through data scaling. The two models trained on MC estimated and human-annotated data exhibit inverse performance relationships in Best-of-8 and PROCESSBENCH, which catches our attention and is thoroughly investigated in Section 3.2.
## 3.1.3 Stringent Data Filtering Mechanisms Required in MC Estimation
We attribute the inferior performance of MC estimation compared to LLM-as-a-judge and human annotation to its high noise in reasoning step correctness estimation and inaccurate error position identification due to its heavy dependence on the policy model. For instance, the policy model may generate correct final answers but incorrect reasoning steps, which will be investigated thoroughly in Section 3.2.1.
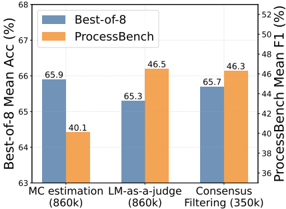
Motivated by LLM-as-a-judge's encouraging results in Section 3.1.2, we naturally propose a simple yet efficient consensus Filtering mechanism that integrates LLM-as-a-judge with MC estimation. Based on the aforementioned 860K samples, the instances are only retained when both LLM-as-a-judge and MCestimation show consensus on the error reasoning step locations in the solution. As demonstrated in Figure 2, it can be found that only approximately 40% of the data are preserved after consensus filtering. For evaluation on PROCESSBENCH, the results reveal that the reduced dataset after consensus filtering significantly outperforms MC estimation, and notably, achieves comparable performance to LLM-as-a-judge while using only 40% of the data. Regarding the BoN evaluation, the performance variations among these three models are marginal. The limitations of BoN evaluation in PRMs will be elaborated on in Section 3.2 later.
## 3.1.4 Hard Label vs. Soft Label in MC Estimation
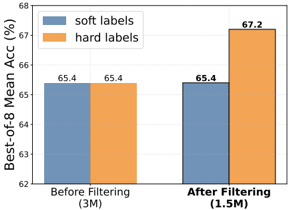
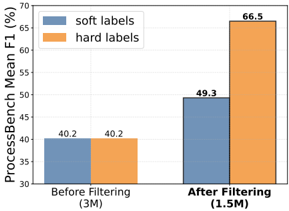
Although we have previously demonstrated that MC estimation is not as effective as LLM-as-a-judge and human annotation, there remains a noteworthy point of MC estimation to be discussed, i.e., whether to train with soft label or hard label. We construct 3 million training data using MC estimation, where for each reasoning step we perform 8 completions. Subsequently, we apply the consensus filtering strategy discussed in Section 3.1.3 to filter the 3 million samples, which reduces the dataset to 1.5 million samples. We respectively train PRMs using both soft labels and hard labels on 3 million and 1.5 million data.
The performance of trained PRMs on Best-of-8 and PROCESSBENCH are illustrated in Figure 3 and 4 separately. Before data filtering, the performance difference between soft and hard labels is not significant, which we attribute to the high noise level masking their distinctions. However, this difference becomes much more pronounced after data filtering, with hard labels substantially outperforming soft labels
<details>
<summary>Image 5 Details</summary>
### Visual Description
## Grouped Bar Chart: Comparison of Best-of-8 Mean Accuracy and ProcessBench Mean F1
### Overview
This chart compares the performance of three distinct filtering methods—"MC estimation," "LM-as-a-judge," and "Consensus Filtering"—across two performance metrics: "Best-of-8 Mean Acc (%)" and "ProcessBench Mean F1 (%)". The chart highlights the trade-offs in performance and data efficiency (indicated by the sample sizes in parentheses) for each method.
### Components/Axes
* **X-Axis (Categories):** Three methods are listed:
* "MC estimation (860k)"
* "LM-as-a-judge (860k)"
* "Consensus Filtering (350k)"
* **Left Y-Axis:** "Best-of-8 Mean Acc (%)". The scale ranges from 63 to 68.
* **Right Y-Axis:** "ProcessBench Mean F1 (%)". The scale ranges from 36 to 52.
* **Legend (Top-Left):**
* **Blue Bar:** Represents "Best-of-8" (corresponds to the Left Y-axis).
* **Orange Bar:** Represents "ProcessBench" (corresponds to the Right Y-axis).
### Detailed Analysis
The data is segmented by the three categories on the X-axis. Each category contains two bars: a blue bar for "Best-of-8" and an orange bar for "ProcessBench."
**1. MC estimation (860k)**
* **Best-of-8 (Blue):** 65.9
* **ProcessBench (Orange):** 40.1
* *Trend:* This category shows the highest Best-of-8 accuracy but the lowest ProcessBench F1 score.
**2. LM-as-a-judge (860k)**
* **Best-of-8 (Blue):** 65.3
* **ProcessBench (Orange):** 46.5
* *Trend:* Compared to MC estimation, the Best-of-8 accuracy drops slightly, while the ProcessBench F1 score increases significantly.
**3. Consensus Filtering (350k)**
* **Best-of-8 (Blue):** 65.7
* **ProcessBench (Orange):** 46.3
* *Trend:* This category maintains a high Best-of-8 accuracy (nearly matching MC estimation) while maintaining a high ProcessBench F1 score (nearly matching LM-as-a-judge).
### Key Observations
* **Data Efficiency:** "Consensus Filtering" achieves competitive results on both metrics while utilizing a significantly smaller dataset (350k) compared to the other two methods (860k).
* **Metric Divergence:** There is a clear divergence between the two metrics. "MC estimation" prioritizes "Best-of-8" accuracy at the expense of "ProcessBench" performance. Conversely, "LM-as-a-judge" and "Consensus Filtering" prioritize "ProcessBench" performance.
* **Stability:** The "Best-of-8" (Blue) metric is relatively stable across all three methods, fluctuating only within a narrow range (65.3 to 65.9). The "ProcessBench" (Orange) metric shows higher volatility, with a sharp increase from the first method to the second and third.
### Interpretation
The data demonstrates that "Consensus Filtering" is the most efficient method among those presented. It effectively balances the performance characteristics of the other two methods. While "MC estimation" is superior for "Best-of-8" accuracy, it fails to perform well on "ProcessBench." "LM-as-a-judge" performs well on "ProcessBench" but requires a much larger dataset (860k) to achieve results comparable to "Consensus Filtering" (350k). Therefore, "Consensus Filtering" appears to be the optimal choice for maximizing performance metrics while minimizing data requirements.
</details>
Figure 2: Performance comparison on Best-of-8 and PROCESSBENCH using PRMs trained with different data synthesis methods.
Figure 3: Performance comparison on Best-of-8 for the PRMs trained on soft and hard labels before and after consensus filtering.
<details>
<summary>Image 6 Details</summary>
### Visual Description
## Bar Chart: Impact of Filtering on Best-of-8 Mean Accuracy
### Overview
This image displays a grouped bar chart comparing the performance of two labeling strategies—"soft labels" and "hard labels"—across two distinct dataset conditions: "Before Filtering (3M)" and "After Filtering (1.5M)". The metric used for comparison is "Best-of-8 Mean Acc (%)".
### Components/Axes
* **Y-Axis:** Labeled "Best-of-8 Mean Acc (%)". The scale ranges from 62 to 68, with major grid lines at integer intervals.
* **X-Axis:** Categorized into two groups:
* "Before Filtering (3M)"
* "After Filtering (1.5M)"
* **Legend:** Positioned in the top-left corner of the chart area.
* Blue bar: "soft labels"
* Orange bar: "hard labels"
* **Data Markers:** Numerical values are printed directly above each bar to indicate the exact accuracy percentage.
### Detailed Analysis
The chart is divided into two primary clusters based on the filtering status of the dataset.
**1. Before Filtering (3M)**
* **Soft labels (Blue):** The bar reaches a height of **65.4**.
* **Hard labels (Orange):** The bar reaches a height of **65.4**.
* **Trend:** Both labeling methods yield identical performance results before the filtering process is applied.
**2. After Filtering (1.5M)**
* **Soft labels (Blue):** The bar remains at **65.4**.
* **Hard labels (Orange):** The bar rises to **67.2**.
* **Trend:** The "soft labels" performance remains stagnant compared to the "Before Filtering" state. Conversely, the "hard labels" performance shows a positive trend, increasing by 1.8 percentage points.
### Key Observations
* **Performance Invariance:** The "soft labels" methodology is completely unaffected by the filtering process, maintaining a consistent accuracy of 65.4% regardless of the dataset size (3M vs 1.5M).
* **Performance Gain:** The "hard labels" methodology benefits significantly from the filtering process, showing a clear improvement in accuracy after the dataset is reduced from 3M to 1.5M.
* **Comparative Shift:** Before filtering, there is no performance gap between the two methods. After filtering, "hard labels" outperform "soft labels" by 1.8 percentage points.
### Interpretation
The data suggests that the filtering process—which reduces the dataset size by half—is highly effective for the "hard labels" training regime but provides no additional value for the "soft labels" regime.
This implies that the "hard labels" approach is likely more sensitive to noise or lower-quality data within the original 3M dataset. By filtering the data, the "hard labels" model is likely trained on a higher-quality subset, allowing it to achieve higher accuracy. The fact that "soft labels" do not improve suggests that either the soft labels are inherently robust to the noise present in the 3M dataset, or that the filtering process removes data that the soft-label model requires to maintain its current performance level (though it does not degrade, suggesting the former is more likely).
From a resource-efficiency perspective, if one has the capability to filter the dataset, "hard labels" become the superior choice, as they yield higher accuracy on a smaller, more manageable dataset (1.5M) compared to the baseline.
</details>
Figure 4: Performance comparison on PROCESSBENCH for PRMs trained on soft and hard labels before and after consensus filtering.
<details>
<summary>Image 7 Details</summary>
### Visual Description
## Bar Chart: ProcessBench Mean F1 (%) Comparison
### Overview
This image displays a grouped bar chart comparing the performance of two labeling strategies—"soft labels" and "hard labels"—across two distinct data processing states: "Before Filtering (3M)" and "After Filtering (1.5M)". The chart illustrates how data filtering affects the ProcessBench Mean F1 score for each labeling method.
### Components/Axes
* **Y-Axis:** Labeled "ProcessBench Mean F1 (%)". The scale ranges from 30 to 70, with increments of 5.
* **X-Axis:** Contains two categorical groups:
* "Before Filtering (3M)"
* "After Filtering (1.5M)"
* **Legend:** Located in the top-left corner of the chart area.
* **Blue rectangle:** Corresponds to "soft labels".
* **Orange rectangle:** Corresponds to "hard labels".
* **Data Markers:** Numerical values are printed directly above each bar to indicate the exact F1 score.
### Detailed Analysis
The chart is divided into two main clusters along the X-axis.
**1. Before Filtering (3M)**
* **Visual Trend:** The two bars are of equal height, indicating parity between the two labeling methods.
* **Soft Labels (Blue):** The bar reaches a value of **40.2**.
* **Hard Labels (Orange):** The bar reaches a value of **40.2**.
**2. After Filtering (1.5M)**
* **Visual Trend:** Both bars show an upward trend compared to the "Before Filtering" state. However, the orange bar (hard labels) shows a significantly steeper increase than the blue bar (soft labels).
* **Soft Labels (Blue):** The bar reaches a value of **49.3**.
* **Hard Labels (Orange):** The bar reaches a value of **66.5**.
### Key Observations
* **Performance Parity:** Before filtering, the labeling method (soft vs. hard) has zero impact on the ProcessBench Mean F1 score.
* **Filtering Efficacy:** Filtering the dataset (reducing it from 3M to 1.5M) results in a performance increase for both labeling methods.
* **Divergence:** After filtering, "hard labels" significantly outperform "soft labels" by a margin of 17.2 percentage points (66.5 vs 49.3).
* **Data Efficiency:** The reduction of the dataset by 50% (from 3M to 1.5M) correlates with a substantial improvement in model performance, suggesting that the filtering process successfully removes noise or low-quality data.
### Interpretation
The data suggests that the filtering process is highly effective at improving the quality of the dataset, as evidenced by the increase in F1 scores across both labeling methods.
The most critical insight is the divergence in performance after filtering. While "soft labels" improve by approximately 9.1 points (40.2 to 49.3), "hard labels" improve by approximately 26.3 points (40.2 to 66.5). This indicates that "hard labels" are significantly more compatible with or sensitive to the benefits of the filtering process. It is possible that the filtering process removes ambiguous or noisy data points that "soft labels" (which typically represent probability distributions) struggle to resolve, whereas "hard labels" (which represent definitive classes) benefit from the cleaner, more distinct data environment created by the filtering.
</details>
on both Best-of-8 and PROCESSBENCH. We consider the limitations of soft labels are: (1) as discussed in Section 3.1.1, the correctness of steps (i.e., rewards) should be deterministic. Training PRMs with soft labels that represent future possibilities introduces additional noise. For instance, when numerous completely correct steps are assigned with soft labels lower than 1, it actually reduces the model's ability to discriminate between positive and negative labels; (2) only 8 completions for step correctness estimation exhibit high variance and are relatively crude. Although we can achieve better estimation accuracy by increasing the number of completions, the associated costs may outweigh the incremental benefits. Moreover, the experimental results indicate that the consensus filtering strategy yields performance benefits across both soft and hard label schemes.
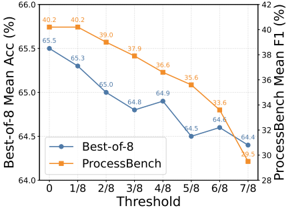
Last but not least, we investigate the threshold selection for distinguishing between positive and negative labels based on the MC estimation result of 8 completions. Following our previous experimental setup, we conduct a series of experiments on the 3 million with threshold values from 1/8 to 7/8 at 1/8 intervals, with results shown in Figure 5. It can be easily observed that as the threshold increases, the performance deteriorates on both Best-of-8 and PROCESSBENCH, indicating that using an MC estimated value of 0 as the negative label and all others as positive labels yields the best results. Therefore, if we have to rely on MCestimation for step-wise correctness verification, we suggest setting the threshold to 0, meaning that a step is considered correct if any completion start from this step reaches the correct final answer. This threshold has also been employed throughout our all experimental studies.
## 3.1.5 Summary
Through extensive experimentation, we have demonstrated that MC estimation yields inferior performance and generalization compared to both LLM-as-a-judge and human annotation. However, incorporating MC estimation with LLM-as-a-judge via a consensus filtering strategy leads to enhanced performance and improved data efficiency. Furthermore, optimal results are achieved when treating MC estimation values of 0 as negative labels and training with hard labels.
## 3.2 Bias in BoN Sampling for PRM Performance Evaluation
Although BoN evaluations are commonly used in PRM optimization, their effectiveness as a sole optimization criterion is worth careful consideration due to potential limitations in performance assessment.
## 3.2.1 Unreliable Policy Models Cause BoN-PRMs Misalignment
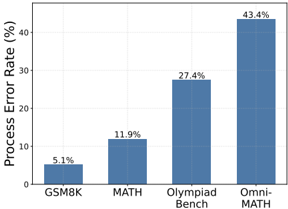
In an ideal scenario, the responses generated by the policy model would exhibit both correct answers and accurate solution steps or conversely, flawed processes would correspond to incorrect answers. However, existing policy models are prone to generating responses with correct answers but flawed processes, while BoN inherently only focuses on answers, leading to a misalignment between the evaluation criteria of BoN and the PRM objectives of process verification. To provide empirical evidence for this phenomenon, we sample 8 responses per query from GSM8K, MATH, OlympiadBench, and Omni-MATH using the policy model Qwen2.5-Math-7B-Instruct. Then we randomly choose correct-answer responses from them and conduct thorough manual annotations. As detailed in Figure 6, a substantial percentage of responses contain process errors while maintaining correct answers. Notably, compared with easy task GSM8K and hard task Omni-MATH, this phenomenon becomes more pronounced as the problem's complexity increases. This implies that an effective PRM might assign low scores to responses with correct answers but flawed processes, resulting in overall lower performance on the BoN evaluation.
<details>
<summary>Image 8 Details</summary>
### Visual Description
## Dual-Axis Line Chart: Performance Metrics vs. Threshold
### Overview
This image is a dual-axis line chart illustrating the performance of two distinct metrics, "Best-of-8" and "ProcessBench," across eight incremental threshold levels ranging from 0 to 7/8. The chart demonstrates how increasing the threshold affects the accuracy (Best-of-8) and the F1 score (ProcessBench).
### Components/Axes
* **X-Axis (Bottom):** Labeled "Threshold". The scale is categorical/ordinal, consisting of 8 steps: 0, 1/8, 2/8, 3/8, 4/8, 5/8, 6/8, 7/8.
* **Left Y-Axis:** Labeled "Best-of-8 Mean Acc (%)". The scale ranges from 64.0 to 66.0.
* **Right Y-Axis:** Labeled "ProcessBench Mean F1 (%)". The scale ranges from 28 to 42.
* **Legend:** Located in the bottom-left quadrant.
* **Blue line with circle markers:** "Best-of-8" (corresponds to the left Y-axis).
* **Orange line with square markers:** "ProcessBench" (corresponds to the right Y-axis).
### Detailed Analysis
#### Trend Verification
* **Best-of-8 (Blue Line):** The trend is generally downward, starting at 65.5% and ending at 64.4%. It exhibits minor fluctuations (slight increases) at the 4/8 and 6/8 thresholds, indicating relative stability despite the increasing threshold.
* **ProcessBench (Orange Line):** The trend is a consistent, steep downward slope. It starts at 40.2% and drops significantly to 29.5%, indicating high sensitivity to the threshold parameter.
#### Data Points
| Threshold | Best-of-8 Mean Acc (%) (Blue) | ProcessBench Mean F1 (%) (Orange) |
| :--- | :--- | :--- |
| 0 | 65.5 | 40.2 |
| 1/8 | 65.3 | 40.2 |
| 2/8 | 65.0 | 39.0 |
| 3/8 | 64.8 | 37.9 |
| 4/8 | 64.9 | 36.6 |
| 5/8 | 64.5 | 35.6 |
| 6/8 | 64.6 | 33.6 |
| 7/8 | 64.4 | 29.5 |
### Key Observations
* **Sensitivity Disparity:** The "ProcessBench" metric is significantly more sensitive to the "Threshold" parameter than "Best-of-8."
* **Magnitude of Change:**
* "Best-of-8" drops by approximately 1.1 percentage points over the entire range (65.5 to 64.4).
* "ProcessBench" drops by approximately 10.7 percentage points over the same range (40.2 to 29.5).
* **Stability:** The "Best-of-8" line shows a "stair-step" pattern with minor recoveries, suggesting it is a more robust metric against the thresholding process.
* **Acceleration:** The decline in "ProcessBench" appears to accelerate between the 6/8 and 7/8 thresholds, where the drop is 4.1 percentage points (33.6 to 29.5), compared to smaller drops in earlier intervals.
### Interpretation
The data suggests that the "Threshold" parameter acts as a restrictive filter on the underlying dataset or model output.
* **Robustness of Best-of-8:** The "Best-of-8" metric maintains high performance even as the threshold increases. This implies that the "Best-of-8" selection strategy is effective at retaining high-quality samples or predictions, even when the pool of available data is restricted by the threshold.
* **Fragility of ProcessBench:** The "ProcessBench" metric is highly dependent on the full distribution of data. As the threshold increases (likely filtering out lower-confidence or lower-scoring items), the F1 score degrades rapidly. This suggests that "ProcessBench" may rely on a broader set of data points to maintain its score, and the thresholding process disproportionately removes the elements that contribute to a high F1 score.
* **Conclusion:** If the goal is to maintain performance while applying a threshold, "Best-of-8" is the superior metric/strategy. "ProcessBench" appears to be a metric that requires a lower threshold to remain valid or useful.
</details>
Figure 5: PRM Performance changes on Best-of-8 and PROCESSBENCH across different hard label thresholds.
<details>
<summary>Image 9 Details</summary>
### Visual Description
## Bar Chart: Process Error Rate by Benchmark
### Overview
The image is a vertical bar chart illustrating the "Process Error Rate (%)" across four distinct mathematical reasoning benchmarks. The chart demonstrates a clear, progressive increase in error rates as the benchmarks move from standard grade-school level problems to advanced competition-level mathematics.
### Components/Axes
* **Y-Axis:** Labeled "Process Error Rate (%)". The scale ranges from 0 to 40+, with horizontal grid lines marking increments of 10.
* **X-Axis:** Categorical axis containing four labels, positioned from left to right: "GSM8K", "MATH", "Olympiad Bench", and "Omni-MATH".
* **Data Series:** Four vertical blue bars, each corresponding to one of the X-axis categories. Each bar is topped with a text label indicating the exact percentage value.
### Detailed Analysis
The chart displays a consistent upward trend in error rates from left to right. The data points are as follows:
* **GSM8K:** The leftmost bar, representing the lowest error rate.
* **Value:** 5.1%
* **MATH:** The second bar from the left.
* **Value:** 11.9%
* **Olympiad Bench:** The third bar from the left.
* **Value:** 27.4%
* **Omni-MATH:** The rightmost bar, representing the highest error rate.
* **Value:** 43.4%
### Key Observations
* **Significant Variance:** There is a substantial disparity between the lowest and highest error rates. The error rate for "Omni-MATH" (43.4%) is approximately 8.5 times higher than that of "GSM8K" (5.1%).
* **Non-Linear Growth:** The increase in error rate is not linear. The absolute increase between "Olympiad Bench" and "Omni-MATH" (16 percentage points) is significantly larger than the increase between "GSM8K" and "MATH" (6.8 percentage points).
* **Difficulty Hierarchy:** The visual progression strongly implies a hierarchy of task difficulty, where the benchmarks are ordered by increasing complexity.
### Interpretation
* **What the data demonstrates:** This chart serves as a performance metric for an AI model (or models) on mathematical reasoning tasks. It quantifies the "Process Error Rate," which likely refers to the frequency with which the model fails to generate a correct logical path or solution steps.
* **Why it matters:** The data highlights the "difficulty gap" in current AI reasoning capabilities. While models perform relatively well on standard datasets like GSM8K, their performance degrades significantly as they encounter more abstract and complex mathematical problems found in "Olympiad Bench" and "Omni-MATH."
* **Reading between the lines:** The high error rate on "Omni-MATH" suggests that the model's reasoning process is fragile when faced with advanced, multi-step, or highly abstract mathematical challenges. This chart is likely used in a research context to justify the need for more robust reasoning architectures or to highlight the limitations of current state-of-the-art models in high-level mathematical domains.
</details>
Figure 6: Proportion of cases where the policy model generates correct answers but incorrect reasoning steps.
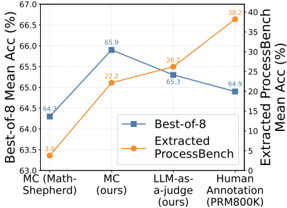
Figure 7: Performance trends on BoN and PROCESSBENCH for models trained with different data sources.
<details>
<summary>Image 10 Details</summary>
### Visual Description
## Dual-Axis Line Chart: Comparison of Best-of-8 and Extracted ProcessBench Accuracy
### Overview
This chart displays a comparative analysis of two performance metrics—"Best-of-8 Mean Acc (%)" and "Extracted ProcessBench Mean Acc (%)"—across four distinct evaluation or annotation methods. The chart utilizes a dual-axis system to plot these metrics, revealing how different methodologies impact the two performance scores differently.
### Components/Axes
* **Left Y-Axis:** Labeled "Best-of-8 Mean Acc (%)". The scale ranges from 63.0 to 67.0 with increments of 0.5.
* **Right Y-Axis:** Labeled "Extracted ProcessBench Mean Acc (%)". The scale ranges from 0 to 40 with increments of 5.
* **X-Axis:** Categorical axis containing four methods, ordered from left to right:
1. MC (Math-Shepherd)
2. MC (ours)
3. LLM-as-a-judge (ours)
4. Human Annotation (PRM800K)
* **Legend:** Located in the bottom-right quadrant of the chart area.
* Blue square marker: "Best-of-8"
* Orange circle marker: "Extracted ProcessBench"
### Detailed Analysis
#### Data Series 1: Best-of-8 (Blue Line with Square Markers)
* **Trend:** The line slopes upward from the first to the second category, then slopes downward through the third and fourth categories.
* **Values:**
* **MC (Math-Shepherd):** 64.3%
* **MC (ours):** 65.9% (Peak value for this series)
* **LLM-as-a-judge (ours):** 65.3%
* **Human Annotation (PRM800K):** 64.9%
#### Data Series 2: Extracted ProcessBench (Orange Line with Circle Markers)
* **Trend:** The line exhibits a consistent, steep upward slope across all four categories, indicating a positive correlation with the progression of the methods.
* **Values:**
* **MC (Math-Shepherd):** 3.8%
* **MC (ours):** 22.2%
* **LLM-as-a-judge (ours):** 26.2%
* **Human Annotation (PRM800K):** 38.2% (Peak value for this series)
### Key Observations
* **Inverse Relationship:** After the second category ("MC (ours)"), the two metrics diverge. While the "Extracted ProcessBench" accuracy continues to climb significantly, the "Best-of-8" accuracy begins to decline.
* **Peak Performance:** "MC (ours)" is the optimal method for the "Best-of-8" metric, whereas "Human Annotation (PRM800K)" is the optimal method for the "Extracted ProcessBench" metric.
* **Magnitude of Change:** The "Extracted ProcessBench" metric shows a much wider range of variance (from ~3.8% to ~38.2%) compared to the "Best-of-8" metric (from ~64.3% to ~65.9%).
### Interpretation
The data suggests a clear trade-off between the two evaluation metrics. The "MC (ours)" method appears highly effective at optimizing for "Best-of-8" accuracy, outperforming even the human-annotated baseline in that specific metric. However, it is significantly less effective at achieving high "Extracted ProcessBench" accuracy compared to the human-annotated baseline.
The "Human Annotation (PRM800K)" serves as the gold standard for the "Extracted ProcessBench" metric, showing the highest performance by a wide margin. The fact that "Best-of-8" accuracy drops when moving from "MC (ours)" to "Human Annotation" suggests that the models or methods optimized for "Best-of-8" may be overfitting to that specific metric or that the "ProcessBench" alignment does not necessarily translate to higher "Best-of-8" performance. This indicates that these two metrics likely measure different aspects of model capability, and optimizing for one may come at the expense of the other.
</details>
Table 5: The accuracy in identifying erroneous steps on the test cases of PROCESSBENCH containing correct answers but erroneous reasoning steps. '# samples' represents the number of test cases.
| | GSM8K | MATH | OlympiadBench | Omni-MATH | Avg. |
|-------------------------------|---------|--------|-----------------|-------------|--------|
| # samples | 7 | 94 | 161 | 259 | |
| 1.5B | | | | | |
| Skywork-PRM-1.5B | 42.9 | 36.2 | 12.4 | 13.9 | 26.4 |
| 7B+ | | | | | |
| Math-Shepherd-PRM-7B | 14.3 | 12.8 | 13.7 | 14.7 | 13.9 |
| RLHFlow-PRM-Mistral-8B | 14.3 | 13.8 | 7.5 | 10.0 | 11.4 |
| RLHFlow-PRM-Deepseek-8B | 0.0 | 18.1 | 9.9 | 10.8 | 9.7 |
| Skywork-PRM-7B | 57.1 | 26.6 | 14.3 | 13.1 | 27.8 |
| EurusPRM-Stage1 | 28.6 | 25.5 | 19.9 | 20.1 | 23.5 |
| EurusPRM-Stage2 | 42.9 | 27.7 | 18.0 | 20.8 | 27.4 |
| Qwen2.5-Math-7B-Math-Shepherd | 0.0 | 9.6 | 4.3 | 1.2 | 3.8 |
| Qwen2.5-Math-7B-PRM800K | 42.9 | 50.0 | 31.7 | 28.2 | 38.2 |
| ⋆ Qwen2.5-Math-PRM-7B | 42.9 | 68.1 | 48.4 | 56.0 | 53.9 |
| 72B | | | | | |
| ⋆ Qwen2.5-Math-PRM-72B | 28.6 | 76.6 | 62.7 | 64.5 | 58.1 |
## 3.2.2 Limited Process Verification Capability in PRMs Lead to BoN Scores Inflation
When the PRM cannot distinguish responses that have correct answers but flawed processes and assign them high scores, this leads to overestimated performance in the BoN evaluation, thereby creating an overly optimistic and potentially misleading assessment of PRM capabilities. To investigate the discriminative capability of PRMs for such cases, we extract instances from PROCESSBENCH where answers are correct but processes are erroneous and analysis the detection accuracy of PRMs for these cases. As shown in Figure 7, the PRMs trained on MC estimation, LLM-as-a-judge and human annotation exhibit completely opposite performance trends in BoN and extracted PROCESSBENCH evaluation. It can be observed that the model trained on our MC estimated data shows limited process verification capability but inflated results on the BoN.
On the other hand, as shown in Table 5, except our released PRMs Qwen2.5-Math-PRM-7B and Qwen2.5Math-PRM-72B, all other open-sourced PRMs demonstrate detection accuracy rates below 50%. This limited discriminative capability indicates that PRMs struggle to differentiate between genuinely correct responses and those with merely superficial answer correctness in BoN evaluations. Consequently, this implies that beyond BoN evaluation, supplementary benchmarks are necessary to assess the actual capability of PRMs, especially in detecting process errors.
## 3.2.3 Process-to-Outcome Shift in BoN Optimized PRMs
The majority of current PRMs are optimized towards BoN. However, the limitations of BoN result in PRMs process-to-outcome shift. During the BoN selection process based on PRM-predicted scores and follow the scoring method for responses in (Lightman et al., 2023), it can be found that regardless of whether we employ the minimum score or the product of scores to evaluate the full solution, the lowest step score acts as the key limiting factor that affects the selection criteria of PRMs.
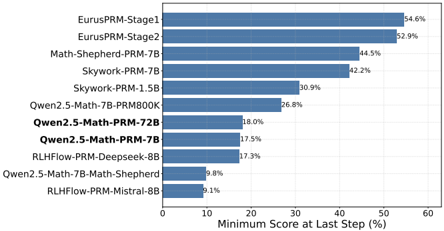
Figure 8: Percentage of responses where the minimum step score predict by PRMs appears in the final step (among all Best of 8 responses from Qwen2.5-Math-7B-Instruct).
<details>
<summary>Image 11 Details</summary>
### Visual Description
## Horizontal Bar Chart: Minimum Score at Last Step (%)
### Overview
The image is a horizontal bar chart comparing the performance of 11 different AI models or training methods, measured by the "Minimum Score at Last Step (%)". The chart is sorted in descending order, with the highest-performing models at the top.
### Components/Axes
* **X-Axis:** Labeled "Minimum Score at Last Step (%)". The scale ranges from 0 to 60, with vertical grid lines at intervals of 10.
* **Y-Axis:** Lists the specific models or methods being evaluated.
* **Data Series:** Horizontal blue bars representing the percentage score for each category.
* **Annotations:** Numerical values are placed at the end of each bar, indicating the exact percentage.
### Detailed Analysis
The data is presented in descending order of performance. Below are the extracted values:
| Model/Method | Minimum Score at Last Step (%) |
| :--- | :--- |
| EurusPRM-Stage1 | 54.6% |
| EurusPRM-Stage2 | 52.9% |
| Math-Shepherd-PRM-7B | 44.5% |
| Skywork-PRM-7B | 42.2% |
| Skywork-PRM-1.5B | 30.9% |
| Qwen2.5-Math-7B-PRM800K | 26.8% |
| **Qwen2.5-Math-PRM-72B** | 18.0% |
| **Qwen2.5-Math-PRM-7B** | 17.5% |
| RLHFlow-PRM-Deepseek-8B | 17.3% |
| Qwen2.5-Math-7B-Math-Shepherd | 9.8% |
| RLHFlow-PRM-Mistral-8B | 9.1% |
*Note: The entries "Qwen2.5-Math-PRM-72B" and "Qwen2.5-Math-PRM-7B" are formatted in bold text, likely indicating they are the primary models of interest or the focus of the study.*
### Key Observations
* **Performance Tiers:** There is a clear stratification in performance. The EurusPRM models (Stage 1 and 2) significantly outperform the rest of the field, both exceeding 50%.
* **Clustering:** A tight cluster of performance is observed in the 17-18% range, consisting of Qwen2.5-Math-PRM-72B, Qwen2.5-Math-PRM-7B, and RLHFlow-PRM-Deepseek-8B.
* **Performance Drop-off:** There is a substantial performance gap between the top-tier models (EurusPRM) and the lower-tier models (Qwen2.5-Math-7B-Math-Shepherd and RLHFlow-PRM-Mistral-8B), which fall below 10%.
* **Bolded Emphasis:** The bolding of the two Qwen2.5-Math-PRM models suggests that the source document is likely evaluating these specific models against the others listed.
### Interpretation
This chart evaluates Process Reward Models (PRMs) on their ability to maintain a high "Minimum Score at the Last Step." In the context of mathematical reasoning models, this metric typically measures the reliability of the model's reasoning path—specifically, how often the model maintains a high-confidence or correct state until the final step of a solution.
The data suggests that the EurusPRM methodology is significantly more effective at this specific metric than the other listed approaches. The clustering of the Qwen2.5-Math-PRM models in the lower-middle section of the chart indicates that while they are being highlighted, they are currently underperforming compared to the Eurus and Skywork baselines in this specific evaluation. The low scores of the bottom-tier models (below 10%) suggest they struggle to maintain consistent reasoning accuracy through to the final step of the problems presented.
</details>
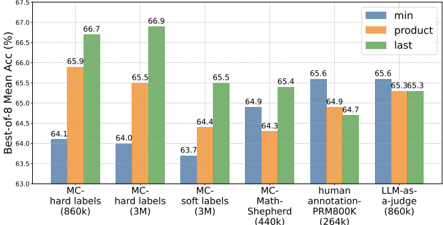
Figure 9: Performance on BoN across multiple PRMs with different scoring methods: minimum, product and last.
<details>
<summary>Image 12 Details</summary>
### Visual Description
## Bar Chart: Best-of-8 Mean Accuracy Comparison
### Overview
This image displays a grouped bar chart comparing the "Best-of-8 Mean Acc (%)" across six distinct training or evaluation methodologies. Each category is represented by three bars corresponding to three different metrics: "min" (blue), "product" (orange), and "last" (green). The chart illustrates how accuracy varies across these metrics for different datasets and labeling techniques.
### Components/Axes
* **Y-Axis**: Labeled "Best-of-8 Mean Acc (%)". The scale ranges from 63.0 to 67.5, with grid lines at 0.5 intervals.
* **X-Axis**: Contains six categorical labels representing different methods:
1. MC-hard labels (860k)
2. MC-hard labels (3M)
3. MC-soft labels (3M)
4. MC-Math-Shepherd (440k)
5. human annotation-PRM800K (264k)
6. LLM-as-a-judge (860k)
* **Legend**: Located in the top-right corner.
* **Blue bar**: "min"
* **Orange bar**: "product"
* **Green bar**: "last"
### Detailed Analysis
The following data points are extracted from the chart, organized by category. The trend for each series is noted based on the progression from "min" (blue) to "product" (orange) to "last" (green).
| Category | min (Blue) | product (Orange) | last (Green) | Trend |
| :--- | :--- | :--- | :--- | :--- |
| **MC-hard labels (860k)** | 64.1 | 65.9 | 66.7 | Upward |
| **MC-hard labels (3M)** | 64.0 | 65.5 | 66.9 | Upward |
| **MC-soft labels (3M)** | 63.7 | 64.4 | 65.5 | Upward |
| **MC-Math-Shepherd (440k)** | 64.9 | 64.3 | 65.4 | Fluctuating (Down then Up) |
| **human annotation-PRM800K (264k)** | 65.6 | 64.9 | 64.7 | Downward |
| **LLM-as-a-judge (860k)** | 65.6 | 65.3 | 65.3 | Slightly Downward/Flat |
### Key Observations
* **Divergent Trends**: There is a clear split in behavior between the "MC" (Multiple Choice) methods and the "human/LLM" methods. The MC methods generally show an upward trend (improving from min to last), whereas the human annotation and LLM-as-a-judge methods show a downward or flat trend (starting higher at min).
* **Highest Performance**: The "MC-hard labels (3M)" category achieves the highest overall value in the "last" metric (66.9).
* **Lowest Performance**: The "MC-soft labels (3M)" category starts with the lowest "min" value (63.7).
* **Consistency**: The "LLM-as-a-judge" method shows the most stability between the "product" and "last" metrics, both being 65.3.
### Interpretation
The data suggests a fundamental difference in how these training/evaluation methods behave over time or across different aggregation strategies.
1. **MC Methods (Hard/Soft Labels)**: These methods appear to benefit from the "last" metric, suggesting that the model's performance improves as the training or sampling process progresses. The "hard labels" approach, regardless of dataset size (860k vs 3M), consistently yields higher accuracy than the "soft labels" approach.
2. **Human/LLM Methods**: Conversely, the "human annotation" and "LLM-as-a-judge" methods perform best at the "min" stage. This could imply that later stages of these specific processes might be introducing noise or overfitting, or that the initial state is the most robust.
3. **Methodological Implications**: If the goal is to maximize the "Best-of-8 Mean Acc," the "MC-hard labels" approach is superior to the others presented. The "human annotation" and "LLM-as-a-judge" methods, while starting strong, do not scale their performance in the same way as the MC methods, suggesting they may be less effective for this specific metric as the process continues.
</details>
As shown in Figure 8, we analyze the distribution of minimum step scores assigned by multiple opensourced PRMs, specifically focusing on cases where the lowest score occurred at the final step, which typically contains the final answer. The results show that models EurusPRM-Stage1, EurusPRM-Stage2, Math-Shepherd-PRM-7B and Skywork-PRM-7B exhibit notably high proportions in this category, which exceed 40%. In contrast, our released PRMs Qwen2.5-Math-PRM-72B and Qwen2.5-Math-PRM-7B exhibit a significantly lower proportion of minimum scores at the final step.
This analysis reveals that some PRMs' performance in BoN evaluation is predominantly determined by final answer scores rather than intermediate reasoning steps, indicating a model degradation from process-based to outcome-oriented assessment. In other words, optimizing solely for the BoN evaluation has made current PRMs perform more like ORMs in practice. Hence, it is essential to supplement response-level evaluation BoN with step-level assessment methods to avoid the process-to-outcome shift. Specifically, we can employ process error localization tasks such as PROCESSBENCH. Other commonly used step-wise BoN methodologies leverage the integration of PRMs or value models with search mechanisms, which provide a more granular assessment of process reliability. It worth noting that the latter requires more computational costs.
## 3.2.4 Different PRMs, Different Optimal Scoring Strategies
In the BoN evaluation, the overall solution score is derived by combining individual step scores. When each step's score represents the probability of that specific step being correct, it's generally acceptable to combine these step-level scores (through methods like product or minimum) to calculate the overall solution score. However, the situation becomes different when using MC estimation. In this case, each step's score actually estimates the probability of reaching the correct final answer in the future from the current position. Given this forward-looking nature of MC estimation, we should neither multiply the estimated probabilities across steps (as these estimates are dependent on each other), nor simply take the minimum estimated value from a particular step as the overall score. Instead, the estimated value from the final step naturally integrates information from the entire solution process, making it more suitable as the final score for the complete solution.
To validate that, we evaluate BoN in different scoring strategies for the PRMs trained on MC estimation, LLM-as-a-judge, and human annotation data, as shown in Figure 9. We found that in MC estimation, using the last score shows significantly better performance than product and minimum approaches across multiple PRMs. And the trend is the opposite for human annotation and LLM-as-a-judge. This suggests that if the PRM has to be trained via MC estimation and evaluated in BoN, the last score strategy may be more reasonable and effective. However, it's worth noting that this use of PRM in BoN has deviated from PRM's original intended purpose.
## 3.2.5 Summary
The above observations underscore critical limitations in BoN evaluation. Firstly , the unreliable policy models generate responses with correct answers but flawed processes, leading to a misalignment between the evaluation criteria of BoN and the PRM objectives of process verification. Secondly , the limited process verification capability makes PRMs demonstrate tolerance for the responses with correct answers but flawed reasoning processes, resulting in inflated BoN performance. Thirdly , model optimization solely focused on BoN evaluation leads PRMs to drift to prioritize final answers over reasoning processes. Therefore, we argue that supplementary step-level evaluation plays a crucial role in PRM evaluation.
Finally , In BoN, different PRMs have different optimal scoring strategies. The last score strategy may be more reasonable and effective for the PRM trained via MC estimation. In contrast, product and minimum scoring are more appropriate for LLM-as-judge and human annotation.
## 4 Our PRMs
This section presents our methodology for overcoming the previously discussed limitations and the details of our trained PRM achieving state-of-the-art performance. Additionally, we outline our experimental settings, and baseline models for comparison and evaluation results.
## 4.1 Training Details
The data construction procedure comprises two primary phases: data expansion and data filtering. In the expansion phase, we follow the MC estimation to construct data described in Section 2.1. We employ hard labels, where a response is classified as negative only if none of the 8 completions achieves the correct final answer. In the subsequent filtering phase, we employ the LLM instantiated by Qwen2.5-Instruct-72B (Yang et al., 2024b) to serve as a critic to verify the reasoning process for all responses step by step, i.e., LLM-as-a-judge. We implement a simple yet efficient consensus filtering mechanism by filtering out instances where there is a discrepancy between the LLM-annotated and MC-estimated process labels. This ensures the retained data maintains high quality and consistency in the reasoning process annotation. For the training task, we employ cross-entropy loss on the tokens at the end of each step to train the binary classification task. We trained both 7B and 72B-parameter PRMs, initialized with Qwen2.5-Math-7B-Instruct and Qwen2.5-Math-72B-Instruct respectively.
## 4.2 Experimental Setup
To validate the effectiveness of our trained PRM Qwen2.5-Math-PRM-7B and Qwen2.5-Math-PRM-72B, we respectively conduct the response-level BoN evaluation and the step-level process errors identification task PROCESSBENCH (Zheng et al., 2024).
Best-of-N We follow the experimental setting in Section 2.2. In rm@8, we evaluate Outcome Reward Models (ORMs) and Process Reward Models (PRMs). For ORMs, we introduce Qwen2.5-Math-RM-72B (Yang et al., 2024c), which assigns a single score to each complete response. For PRMs, we compute the product of each step score as the final response score. We compare with the following PRMs:
- Math-Shepherd-PRM-7B (Wang et al., 2024b): determining process labels for each step by estimating the empirical probability of reaching the correct final answer.
- RLHFlow-PRM-Mistral-8B & RLHFlow-PRM-Deepseek-8B (Xiong et al., 2024): two LLaMA3.1-based PRMs that adopt Math-Shepherd's training methodology while implementing different solution generation models and optimization objectives.
- Skywork-PRM-1.5B & Skywork-PRM-7B (Skywork, 2024): two recently released Qwen2.5Math-based PRMs by Skywork.
- EurusPRM-Stage1 & EurusPRM-Stage2 (Cui et al., 2025): two PRMs trained using Implicit PRM approach (Yuan et al., 2024) with 7B parameters, which obtains process rewards replying on the ORMtrained on the response-level labels.
- Qwen2.5-Math-7B-Math-Shepherd & Qwen2.5-Math-7B-PRM800K : two additional PRMs our developed by fine-tuning Qwen2.5-Math-7B-Instruct separately on the PRM800K (Lightman et al., 2023) and Math-Shepherd (Wang et al., 2024b) opensource datasets.
PROCESSBENCH The compared PRMs are consistent with the previously mentioned PRMs. For the LLM prompted as Critic Models, i.e., LLM-as-a-judge, we compare with proprietary language models GPT-4o-0806 (Hurst et al., 2024) and o1-mini (OpenAI, 2024), open-source language models Llama-3.370B-Instruct (Dubey et al., 2024), Qwen2.5-Math-72B-Instruct (Yang et al., 2024c), Qwen2.5-72B-Instruct (Yang et al., 2024b) and QwQ-32B-Preview (Qwen, 2024). We also decompose the N-step response trajectory into N separate instances to enable individual scoring by the ORM Qwen2.5-Math-RM-72B.
## 4.3 Experimental Results
Best-of-N The evaluation on policy model Qwen2.5-Math-7b-Instruct is shown in Table 6. Qwen2.5Math-PRM-7B demonstrates superior performance compared to other PRMs of equivalent model scale. Notably, it outperforms maj@8 across all 7 tasks, achieving an average improvement of 1.4%. Furthermore,
| Setting | GSM8K | MATH | Minerva Math | GaoKao 2023 En | Olympiad Bench | College Math | MMLU STEM | Avg. |
|-------------------------------|---------|--------|----------------|------------------|------------------|----------------|-------------|--------|
| pass@8 (Upper Bound) | 98.1 | 92 | 49.3 | 80.5 | 59.6 | 52.6 | 90.5 | 74.7 |
| maj@8 | 96.7 | 87.1 | 41.2 | 72.5 | 44.4 | 47.8 | 73.8 | 66.2 |
| 1.5B | | | | | | | | |
| Skywork-PRM-1.5B | 96.9 | 86.7 | 37.9 | 70.1 | 42.1 | 47.9 | 67.9 | 64.2 |
| 7B+ | | | | | | | | |
| Math-Shepherd-PRM-7B | 97.3 | 85.4 | 37.9 | 70.6 | 40.4 | 47.2 | 70.5 | 64.2 |
| RLHFlow-PRM-Mistral-8B | 97.0 | 86.1 | 37.1 | 70.6 | 41.2 | 47.6 | 69.5 | 64.2 |
| RLHFlow-PRM-Deepseek-8B | 97.3 | 86.3 | 40.8 | 70.9 | 42.2 | 47.2 | 69.3 | 64.9 |
| Skywork-PRM-7B | 97.3 | 87.3 | 38.2 | 71.9 | 43.7 | 47.8 | 67.7 | 64.8 |
| EurusPRM-Stage1 | 95.6 | 83.0 | 35.7 | 66.2 | 38.2 | 46.2 | 66.6 | 61.6 |
| EurusPRM-Stage2 | 95.4 | 83.4 | 34.9 | 67.3 | 39.1 | 46.3 | 67.3 | 62.0 |
| Qwen2.5-Math-7B-Math-Shepherd | 96.9 | 86.5 | 36.8 | 71.4 | 41.6 | 47.7 | 69.3 | 64.3 |
| Qwen2.5-Math-7B-PRM800K | 96.9 | 86.9 | 37.1 | 71.2 | 44.0 | 47.6 | 70.9 | 64.9 |
| ⋆ Qwen2.5-Math-PRM-7B | 97.1 | 88.0 | 42.6 | 74.5 | 47.6 | 48.7 | 74.5 | 67.6 |
| 72B | | | | | | | | |
| Qwen2.5-Math-RM-72B | 97.9 | 88.5 | 42.6 | 75.1 | 49.9 | 49.6 | 78.7 | 68.9 |
| ⋆ Qwen2.5-Math-PRM-72B | 97.6 | 88.7 | 46.0 | 74.3 | 48.1 | 49.3 | 81.1 | 69.3 |
Table 6: Performance comparison on the Best-of-8 strategy of the policy model Qwen2.5-Math- 7B-Instruct. ⋆ represents the models we trained.
Table 7: Performance comparison on PROCESSBENCH. ⋆ represents the models we trained. We report the results in the same calculation method with PROCESSBENCH.
| Model | GSM8K | GSM8K | GSM8K | MATH | MATH | MATH | OlympiadBench | OlympiadBench | OlympiadBench | Omni-MATH | Omni-MATH | Omni-MATH | Avg. F1 |
|-------------------------------------------|-------------------------------------------|-------------------------------------------|-------------------------------------------|-------------------------------------------|-------------------------------------------|-------------------------------------------|-------------------------------------------|-------------------------------------------|-------------------------------------------|-------------------------------------------|-------------------------------------------|-------------------------------------------|-------------------------------------------|
| Model | error | correct | F1 | error | correct | F1 | error | correct | F1 | error | correct | F1 | Avg. F1 |
| LLM-as-judge, Proprietary language models | LLM-as-judge, Proprietary language models | LLM-as-judge, Proprietary language models | LLM-as-judge, Proprietary language models | LLM-as-judge, Proprietary language models | LLM-as-judge, Proprietary language models | LLM-as-judge, Proprietary language models | LLM-as-judge, Proprietary language models | LLM-as-judge, Proprietary language models | LLM-as-judge, Proprietary language models | LLM-as-judge, Proprietary language models | LLM-as-judge, Proprietary language models | LLM-as-judge, Proprietary language models | LLM-as-judge, Proprietary language models |
| GPT-4-0806 | 70.0 | 91.2 | 79.2 | 54.4 | 76.6 | 63.6 | 45.8 | 58.4 | 51.4 | 45.2 | 65.6 | 53.5 | 61.9 |
| o1-mini | 88.9 | 97.9 | 93.2 | 83.5 | 95.1 | 88.9 | 80.2 | 95.6 | 87.2 | 74.8 | 91.7 | 82.4 | 87.9 |
| LLM-as-judge, Open-source language models | LLM-as-judge, Open-source language models | LLM-as-judge, Open-source language models | LLM-as-judge, Open-source language models | LLM-as-judge, Open-source language models | LLM-as-judge, Open-source language models | LLM-as-judge, Open-source language models | LLM-as-judge, Open-source language models | LLM-as-judge, Open-source language models | LLM-as-judge, Open-source language models | LLM-as-judge, Open-source language models | LLM-as-judge, Open-source language models | LLM-as-judge, Open-source language models | LLM-as-judge, Open-source language models |
| Llama-3.3-70B-Instruct | 72.5 | 96.9 | 82.9 | 43.3 | 83.2 | 59.4 | 31.0 | 94.1 | 46.7 | 28.2 | 90.5 | 43.0 | 58.0 |
| Qwen2.5-Math-72B-Instruct | 49.8 | 96.9 | 65.8 | 36.0 | 94.3 | 52.1 | 19.5 | 97.3 | 32.5 | 19.0 | 96.3 | 31.7 | 45.5 |
| Qwen2.5-72B-Instruct | 62.8 | 96.9 | 76.2 | 46.3 | 93.1 | 61.8 | 38.7 | 92.6 | 54.6 | 36.6 | 90.9 | 52.2 | 61.2 |
| QwQ-32B-Preview | 81.6 | 95.3 | 88.0 | 78.1 | 79.3 | 78.7 | 61.4 | 54.6 | 57.8 | 55.7 | 68.0 | 61.3 | 71.5 |
| PRMs | | | | | | | | | | | | | |
| 1.5B | | | | | | | | | | | | | |
| Skywork-PRM-1.5B | 50.2 | 71.5 | 59.0 | 37.9 | 65.2 | 48.0 | 15.4 | 26.0 | 19.3 | 13.6 | 32.8 | 19.2 | 36.4 |
| 7B+ | | | | | | | | | | | | | |
| Math-Shepherd-PRM-7B | 32.4 | 91.7 | 47.9 | 18.0 | 82.0 | 29.5 | 15.0 | 71.1 | 24.8 | 14.2 | 73.0 | 23.8 | 31.5 |
| RLHFlow-PRM-Mistral-8B | 33.8 | 99.0 | 50.4 | 21.7 | 72.2 | 33.4 | 8.2 | 43.1 | 13.8 | 9.6 | 45.2 | 15.8 | 28.4 |
| RLHFlow-PRM-Deepseek-8B | 24.2 | 98.4 | 38.8 | 21.4 | 80.0 | 33.8 | 10.1 | 51.0 | 16.9 | 10.9 | 51.9 | 16.9 | 26.6 |
| Skywork-PRM-7B | 61.8 | 82.9 | 70.8 | 43.8 | 62.2 | 53.6 | 17.9 | 31.9 | 22.9 | 14.0 | 41.9 | 21.0 | 42.1 |
| EurusPRM-Stage1 | 46.9 | 42.0 | 44.3 | 33.3 | 38.2 | 35.6 | 23.9 | 19.8 | 21.7 | 21.9 | 24.5 | 23.1 | 31.2 |
| EurusPRM-Stage2 | 51.2 | 44.0 | 47.3 | 36.4 | 35.0 | 35.7 | 25.7 | 18.0 | 21.2 | 23.1 | 19.1 | 20.9 | 31.3 |
| Qwen2.5-Math-7B-Math-Shepherd | 46.4 | 95.9 | 62.5 | 18.9 | 96.6 | 31.6 | 7.4 | 93.8 | 13.7 | 4.0 | 95.0 | 7.7 | 28.9 |
| Qwen2.5-Math-7B-PRM800K | 53.1 | 95.3 | 68.2 | 48.0 | 90.1 | 62.6 | 35.7 | 87.3 | 50.7 | 29.8 | 86.1 | 44.3 | 56.5 |
| ⋆ Qwen2.5-Math-PRM-7B | 72.0 | 96.4 | 82.4 | 68.0 | 90.4 | 77.6 | 55.7 | 85.5 | 67.5 | 55.2 | 83.0 | 66.3 | 73.5 |
| 72B | 72B | | | | | | | | | | | | |
| Qwen2.5-Math-RM-72B | 41.1 | 46.1 | 43.5 | 39.7 | 58.1 | 47.2 | 28.1 | 56.6 | 37.6 | 18.8 | 50.2 | 27.4 | 38.9 |
| ⋆ Qwen2.5-Math-PRM-72B | 78.7 | 97.9 | 87.3 | 74.2 | 88.2 | 80.6 | 67.9 | 82.0 | 74.3 | 64.8 | 78.8 | 71.1 | 78.3 |
the Qwen2.5-Math-PRM-72B exhibits slightly better overall performance than Qwen2.5-Math-RM-72B, with particularly significant improvements observed in the Minerva Math and MMLU STEM tasks. Finally, Supplementary BoN results, including BoN performance on Policy model Qwen2.5-Math-72bInstruct, alternative scoring strategies, evaluations on Chinese benchmarks, BoN with larger N values and BoN with LLM-as-a-judge are comprehensively documented in the Appendix B.
PROCESSBENCH The evaluation results are presented in Table 7. When compared with LLM-as-judge, Qwen2.5-Math-PRM-7B in smaller model size demonstrates superior performance over all open-source models. For proprietary language models, Qwen2.5-Math-PRM-7B outperforms GPT-4o-0806, while there remains a performance gap compared to o1-mini. Furthermore, comparing with existing PRMs, both Qwen2.5-Math-PRM-7B and 72B exhibit substantial advantages over their counterparts. An interesting observation worth noting is that the ORM Qwen2.5-Math-RM-72B exhibits considerable capability in identifying step errors, even surpassing some open-source PRMs, which validates its potential as a complementary reward beyond solely rule-based mechanism.
## 5 Related Work
Reward Model in Mathematical Reasoning To further improve mathematical reasoning accuracy, the reward model plays a crucial role in selecting the best answers. Two main types of reward models have emerged: (1) Outcome Reward Model (ORM) which provides an evaluation score for the entire solution, especially for the final answer. (2) Process Reward Model (PRM) (Uesato et al., 2022; Lightman et al., 2023) which evaluates each step in the reasoning process. Previous work (Lightman et al., 2023; Wang et al., 2024b) has demonstrated that PRM outperforms ORM which exhibits greater potential, though it requires more high-quality training data.
Mathematical Reasoning Step Verification There are two primary approaches to evaluating the correctness of reasoning steps. The first approach relies on human annotation (Lightman et al., 2023), which produces high-quality data but suffers from substantial costs. The second approach, which has attracted considerable research attention, focuses on automated evaluation of reasoning step correctness. Current automated methods can be categorized into two main types: (1) backward-propagation based methods that infer step correctness from solution outcomes, including MC estimation (Wang et al., 2024b; Luo et al., 2024; Chen et al., 2024), progressive ORM labeling (Xi et al., 2024), and credit assignment (Wang et al., 2024a; Cui et al., 2025; Yuan et al., 2024) techniques; (2) prompting-based methods that leverage LLMs serve as critic, i.e., LLM-as-a-judge (Zhang et al., 2024; Gao et al., 2024; Xia et al., 2024) to assess step correctness directly. In this work, we integrate the two approaches MC estimation and LLM-as-a-judge.
## 6 Conclusion
In this paper, we investigate the Process Reward Model (PRM) and release an effective PRM that demonstrates superior performance. Firstly, we discuss the undesirable trials on MC estimation. Then we demonstrate that data construction via MC estimation yields inferior performance and generalization compared to both LLM-as-a-judge and human annotation through extensive experiments. Besides, we investigate the limitations of vanilla BoN evaluation for PRMs which leads to inaccurate assessment of the PRM's ability and causes an optimization bias that shifts focus from process-oriented to outcome-oriented verification. Finally, we propose a simple yet effective consensus filtering strategy combining MC estimation and LLM-as-a-judge to overcome the limitation of MC estimation. In terms of evaluation, we conduct the response-level BoN evaluation and the step-level process errors identification task PROCESSBENCH to avoid the bias of relying solely on BoN. The experiments demonstrate our strategy significantly improves both data efficiency and model performance. In the future, there remains substantial potential in data construction and evaluation for PRMs, driving the development of more robust and reliable PRMs.
Limitation There are several limitations remained in our current work. Firstly, there exists a considerable performance gap between our PRMs and the BoN upper bound (pass@8), suggesting substantial optimization potential. Then the best practices for utilizing PRMs in reinforcement learning remain unexplored. Finally, although our approach combines LLM-as-a-judge with MC estimation for consensus filtering, the efficient utilization of existing high-quality human annotation data is still largely underexplored. For instance, gradually expanding high-quality datasets through weakly supervised methods can be investigated as a promising direction for future exploration.
## References
- Guoxin Chen, Minpeng Liao, Chengxi Li, and Kai Fan. Alphamath almost zero: Process supervision without process, 2024. URL https://arxiv.org/abs/2405.03553 .
- Karl Cobbe, Vineet Kosaraju, Mohammad Bavarian, Mark Chen, Heewoo Jun, Lukasz Kaiser, Matthias Plappert, Jerry Tworek, Jacob Hilton, Reiichiro Nakano, et al. Training verifiers to solve math word problems. arXiv preprint arXiv:2110.14168 , 2021.
- Ganqu Cui, Lifan Yuan, Zefan Wang, Hanbin Wang, Wendi Li, Bingxiang He, Yuchen Fan, Tianyu Yu, Qixin Xu, Weize Chen, Jiarui Yuan, Huayu Chen, Kaiyan Zhang, Xingtai Lv, Shuo Wang, Yuan Yao, Hao Peng, Yu Cheng, Zhiyuan Liu, Maosong Sun, Bowen Zhou, and Ning Ding. Process reinforcement through implicit rewards, 2025.
- Abhimanyu Dubey, Abhinav Jauhri, Abhinav Pandey, Abhishek Kadian, Ahmad Al-Dahle, Aiesha Letman, Akhil Mathur, Alan Schelten, Amy Yang, Angela Fan, et al. The llama 3 herd of models. arXiv preprint arXiv:2407.21783 , 2024.
- Bofei Gao, Zefan Cai, Runxin Xu, Peiyi Wang, Ce Zheng, Runji Lin, Keming Lu, Dayiheng Liu, Chang Zhou, Wen Xiao, Junjie Hu, Tianyu Liu, and Baobao Chang. Llm critics help catch bugs in mathematics:
Towards a better mathematical verifier with natural language feedback, 2024. URL https://arxiv. org/abs/2406.14024 .
- Chaoqun He, Renjie Luo, Yuzhuo Bai, Shengding Hu, Zhen Leng Thai, Junhao Shen, Jinyi Hu, Xu Han, Yujie Huang, Yuxiang Zhang, et al. Olympiadbench: A challenging benchmark for promoting agi with olympiad-level bilingual multimodal scientific problems. arXiv preprint arXiv:2402.14008 , 2024.
- Dan Hendrycks, Collin Burns, Steven Basart, Andy Zou, Mantas Mazeika, Dawn Song, and Jacob Steinhardt. Measuring massive multitask language understanding. In ICLR . OpenReview.net, 2021a.
- Dan Hendrycks, Collin Burns, Saurav Kadavath, Akul Arora, Steven Basart, Eric Tang, Dawn Song, and Jacob Steinhardt. Measuring mathematical problem solving with the math dataset. arXiv preprint arXiv:2103.03874 , 2021b.
- Aaron Hurst, Adam Lerer, Adam P Goucher, Adam Perelman, Aditya Ramesh, Aidan Clark, AJ Ostrow, Akila Welihinda, Alan Hayes, Alec Radford, et al. Gpt-4o system card. arXiv preprint arXiv:2410.21276 , 2024.
- Aitor Lewkowycz, Anders Andreassen, David Dohan, Ethan Dyer, Henryk Michalewski, Vinay V. Ramasesh, Ambrose Slone, Cem Anil, Imanol Schlag, Theo Gutman-Solo, Yuhuai Wu, Behnam Neyshabur, Guy Gur-Ari, and Vedant Misra. Solving quantitative reasoning problems with language models. In Sanmi Koyejo, S. Mohamed, A. Agarwal, Danielle Belgrave, K. Cho, and A. Oh, editors, Advances in Neural Information Processing Systems 35: Annual Conference on Neural Information Processing Systems 2022, NeurIPS 2022, New Orleans, LA, USA, November 28 - December 9, 2022 , 2022.
- Minpeng Liao, Chengxi Li, Wei Luo, Jing Wu, and Kai Fan. MARIO: math reasoning with code interpreter output - A reproducible pipeline. In Lun-Wei Ku, Andre Martins, and Vivek Srikumar, editors, Findings of the Association for Computational Linguistics, ACL 2024, Bangkok, Thailand and virtual meeting, August 11-16, 2024 , pages 905-924. Association for Computational Linguistics, 2024.
- Hunter Lightman, Vineet Kosaraju, Yura Burda, Harri Edwards, Bowen Baker, Teddy Lee, Jan Leike, John Schulman, Ilya Sutskever, and Karl Cobbe. Let's verify step by step. arXiv preprint arXiv:2305.20050 , 2023.
- Liangchen Luo, Yinxiao Liu, Rosanne Liu, Samrat Phatale, Meiqi Guo, Harsh Lara, Yunxuan Li, Lei Shu, Yun Zhu, Lei Meng, Jiao Sun, and Abhinav Rastogi. Improve mathematical reasoning in language models by automated process supervision, 2024. URL https://arxiv.org/abs/2406.06592 .
- OpenAI. Gpt-4 technical report. arXiv preprint arXiv:2303.08774 , 2023.
- OpenAI. Openai o1-mini: Advancing cost-efficient reasoning, 2024. URL https://openai.com/index/ openai-o1-mini-advancing-cost-efficient-reasoning/ .
- Team Qwen. Qwq: Reflect deeply on the boundaries of the unknown, November 2024. URL https: //qwenlm.github.io/blog/qwq-32b-preview/ .
- Zhihong Shao, Peiyi Wang, Qihao Zhu, Runxin Xu, Junxiao Song, Xiao Bi, Haowei Zhang, Mingchuan Zhang, YK Li, Y Wu, et al. Deepseekmath: Pushing the limits of mathematical reasoning in open language models. arXiv preprint arXiv:2402.03300 , 2024.
- o1 Team Skywork. Skywork-o1 open series. https://huggingface.co/Skywork , November 2024. URL https://huggingface.co/Skywork .
- Zhengyang Tang, Xingxing Zhang, Benyou Wang, and Furu Wei. Mathscale: Scaling instruction tuning for mathematical reasoning. In Forty-first International Conference on Machine Learning, ICML 2024, Vienna, Austria, July 21-27, 2024 . OpenReview.net, 2024. URL https://openreview.net/forum?id= Kjww7ZN47M .
- Jonathan Uesato, Nate Kushman, Ramana Kumar, Francis Song, Noah Siegel, Lisa Wang, Antonia Creswell, Geoffrey Irving, and Irina Higgins. Solving math word problems with process- and outcomebased feedback, 2022. URL https://arxiv.org/abs/2211.14275 .
- Chaojie Wang, Yanchen Deng, Zhiyi Lyu, Liang Zeng, Jujie He, Shuicheng Yan, and Bo An. Q*: Improving multi-step reasoning for llms with deliberative planning, 2024a. URL https://arxiv.org/abs/2406. 14283 .
- Peiyi Wang, Lei Li, Zhihong Shao, Runxin Xu, Damai Dai, Yifei Li, Deli Chen, Yu Wu, and Zhifang Sui. Math-shepherd: Verify and reinforce LLMs step-by-step without human annotations. In Proceedings of the 62nd Annual Meeting of the Association for Computational Linguistics (Volume 1: Long Papers) , pages 9426-9439, August 2024b. doi: 10.18653/v1/2024.acl-long.510. URL https://aclanthology.org/ 2024.acl-long.510 .
- Tianwen Wei, Jian Luan, Wei Liu, Shuang Dong, and Bin Wang. CMATH: can your language model pass chinese elementary school math test? CoRR , abs/2306.16636, 2023.
- Zhiheng Xi, Wenxiang Chen, Boyang Hong, Senjie Jin, Rui Zheng, Wei He, Yiwen Ding, Shichun Liu, Xin Guo, Junzhe Wang, Honglin Guo, Wei Shen, Xiaoran Fan, Yuhao Zhou, Shihan Dou, Xiao Wang, Xinbo Zhang, Peng Sun, Tao Gui, Qi Zhang, and Xuanjing Huang. Training large language models for reasoning through reverse curriculum reinforcement learning, 2024.
- Shijie Xia, Xuefeng Li, Yixin Liu, Tongshuang Wu, and Pengfei Liu. Evaluating mathematical reasoning beyond accuracy, 2024. URL https://arxiv.org/abs/2404.05692 .
- Wei Xiong, Hanning Zhang, Nan Jiang, and Tong Zhang. An implementation of generative prm. https://github.com/RLHFlow/RLHF-Reward-Modeling , 2024.
- An Yang, Baosong Yang, Binyuan Hui, Bo Zheng, Bowen Yu, Chang Zhou, Chengpeng Li, Chengyuan Li, Dayiheng Liu, Fei Huang, et al. Qwen2 technical report. arXiv preprint arXiv:2407.10671 , 2024a.
- An Yang, Baosong Yang, Beichen Zhang, Binyuan Hui, Bo Zheng, Bowen Yu, Chengyuan Li, Dayiheng Liu, Fei Huang, Haoran Wei, et al. Qwen2.5 technical report. arXiv preprint arXiv:2412.15115 , 2024b.
- An Yang, Beichen Zhang, Binyuan Hui, Bofei Gao, Bowen Yu, Chengpeng Li, Dayiheng Liu, Jianhong Tu, Jingren Zhou, Junyang Lin, et al. Qwen2.5-math technical report: Toward mathematical expert model via self-improvement. arXiv preprint arXiv:2409.12122 , 2024c.
- Lifan Yuan, Wendi Li, Huayu Chen, Ganqu Cui, Ning Ding, Kaiyan Zhang, Bowen Zhou, Zhiyuan Liu, and Hao Peng. Free process rewards without process labels. arXiv preprint arXiv:2412.01981 , 2024.
- Lunjun Zhang, Arian Hosseini, Hritik Bansal, Mehran Kazemi, Aviral Kumar, and Rishabh Agarwal. Generative verifiers: Reward modeling as next-token prediction, 2024. URL https://arxiv.org/abs/ 2408.15240 .
- Chujie Zheng, Zhenru Zhang, Beichen Zhang, Runji Lin, Keming Lu, Bowen Yu, Dayiheng Liu, Jingren Zhou, and Junyang Lin. Processbench: Identifying process errors in mathematical reasoning. arXiv preprint arXiv:2412.06559 , 2024.
- Lianmin Zheng, Wei-Lin Chiang, Ying Sheng, Siyuan Zhuang, Zhanghao Wu, Yonghao Zhuang, Zi Lin, Zhuohan Li, Dacheng Li, Eric Xing, et al. Judging llm-as-a-judge with mt-bench and chatbot arena. In Advances in Neural Information Processing Systems , volume 36, pages 46595-46623, 2023.
- Wanjun Zhong, Ruixiang Cui, Yiduo Guo, Yaobo Liang, Shuai Lu, Yanlin Wang, Amin Saied, Weizhu Chen, and Nan Duan. Agieval: A human-centric benchmark for evaluating foundation models. In NAACL-HLT (Findings) , pages 2299-2314. Association for Computational Linguistics, 2024.
- Qihao Zhu, Daya Guo, Zhihong Shao, Dejian Yang, Peiyi Wang, Runxin Xu, Y Wu, Yukun Li, Huazuo Gao, Shirong Ma, et al. Deepseek-coder-v2: Breaking the barrier of closed-source models in code intelligence. arXiv preprint arXiv:2406.11931 , 2024.
## A PRMGuided Search
We further integrate PRM with greedy search by generating N candidate steps at each step, evaluating these candidates using PRM scoring, and selecting the highest-scoring step for subsequent expansion. For the policy model, we employed Qwen2.5-7B-Instruct which has greater diversity in generation to sample 8 candidates at each step, with sampling parameters set to temperature = 1.0 and top p = 1.0. We conduct comparative experiments with ORM in BoN approach. As shown in Table 8, Qwen2.5-Math-PRM-72B with greedy search@8 is slightly superior performance compared to Qwen2.5-Math-RM-72B with orm@8. We argue the potentially smaller performance differential between PRM and ORM lies in the consistency of generated token counts between greedy search and BoN outputs. Furthermore, although greedy search always selects the highest-scoring candidate at each step, the highest-scoring step may not be the correct one. Therefore, implementing either Depth-First Search (DFS) with backtracking capabilities or search approaches incorporating score constraints could prove more suitable for this cases.
We choose the highest-scoring candidate at each step which the score predicted by PRM represents the correctness of this step. But such locally optimal choices may not lead to the correct final answer. In contrast, value models can predict the future probability of reaching the correct answer, rather than reflecting the correctness of the current step like rewards do, making them particularly well-suited for integration with search strategies. Based on these considerations, we believe there is still significant potential for exploration in the future regarding more appropriate search strategies or combining rewards and values to simultaneously consider both the correctness of the current step and the possibility of reaching the correct future outcomes.
| Setting | GSM8K | MATH | Minerva Math | GaoKao 2023 En | Olympiad Bench | College Math | MMLU STEM | Avg. |
|------------------------|---------|--------|----------------|------------------|------------------|----------------|-------------|--------|
| pass@8 (Upper Bound) | 96.9 | 89.6 | 48.2 | 79.7 | 58.4 | 55.0 | 81.6 | 72.8 |
| pass@1 | 91.2 | 74.0 | 32.0 | 64.7 | 36.9 | 46.2 | 57.1 | 57.4 |
| maj@8 | 93.7 | 80.3 | 37.1 | 69.9 | 45.8 | 48.5 | 61.9 | 62.5 |
| orm@8 | | | | | | | | |
| Qwen2.5-Math-RM-72B | 95.4 | 84.2 | 38.6 | 73.0 | 48.6 | 50.1 | 75.6 | 66.5 |
| Greedy Search@8 | | | | | | | | |
| Skywork-PRM-7B | 95.3 | 83.2 | 33.8 | 70.4 | 44.1 | 48.2 | 60.1 | 62.2 |
| ⋆ Qwen2.5-Math-PRM-7B | 95.5 | 82.6 | 32.0 | 71.4 | 44.9 | 48.8 | 69.6 | 63.5 |
| ⋆ Qwen2.5-Math-PRM-72B | 95.9 | 84.7 | 37.9 | 73.2 | 48.9 | 50.0 | 75.3 | 66.6 |
Table 8: The performance of PRM guided greedy search and ORM of Best-of-8 with policy model Qwen2.5-7B-Instruct. For greedy search, 8 candidates is proposed at each step.
## B Supplementary BoN Results
## B.1 The BoN Evaluation on Qwen2.5-Math-72b-Instruct
The BoN evaluation on policy model Qwen2.5-Math-72b-Instruct is shown in Table 9. Qwen2.5- Math7B-PRM outperforms other PRMs of equivalent model scale. However, its performance is inferior to maj@8, suggesting challenges in employing a 7B PRM for the supervision of 72B policy modelgenerated responses. Besides, Qwen2.5-Math-PRM-72B surpasses maj@8 in prm@8 and is comparable with Qwen2.5-Math-RM-72B in orm@8.
## B.2 The BoN Evaluation with Various Scoring Strategies
We demonstrate experimental results using the last step score, the minimum step score or the production of step scores as the solution-level score. The BoN results with policy model Qwen2.5-Math-7B-Instruct and Qwen2.5-Math-72B-Instruct are shown in Table 13 and Table 14 respectively.
## B.3 The BoN Evaluation on Chinese Benchmarks
We evaluate across three Chinese benchmarks including Chinese math benchmarks CMATH (Wei et al., 2023), GaoKao Math Cloze (Zhong et al., 2024), and GaoKao Math QA (Zhong et al., 2024) following Yang et al. (2024c), as shown in Table 15 and Table 16.
Table 9: Performance comparison on the Best-of-8 strategy of the policy model Qwen2.5-Math-72BInstruct. ⋆ represents the models we trained.
| Setting | GSM8K | MATH | Minerva Math | GaoKao 2023 En | Olympiad Bench | College Math | MMLU STEM | Avg. |
|-------------------------------|---------|--------|----------------|------------------|------------------|----------------|-------------|--------|
| pass@8 | 97.3 | 93.2 | 56.6 | 83.6 | 62.4 | 54.1 | 95.3 | 77.5 |
| maj@8 | 96.0 | 88.6 | 47.8 | 73.8 | 50.1 | 50.2 | 84.9 | 70.2 |
| 1.5B | | | | | | | | |
| Skywork-PRM-1.5B | 96.5 | 88.1 | 45.2 | 74.3 | 48.4 | 49.7 | 79.7 | 68.8 |
| 7B+ | | | | | | | | |
| Math-Shepherd-PRM-7B | 96.5 | 86.8 | 45.6 | 71.9 | 49.2 | 49.5 | 77.5 | 68.1 |
| RLHFlow-PRM-Mistral-8B | 96.6 | 87.5 | 46.3 | 73.5 | 48.9 | 49.4 | 83.4 | 69.4 |
| RLHFlow-PRM-Deepseek-8B | 96.5 | 87.7 | 44.5 | 73.5 | 48.7 | 49.4 | 84.6 | 69.3 |
| Skywork-PRM-7B | 97.0 | 89.0 | 47.1 | 75.3 | 49.8 | 49.9 | 76.3 | 69.2 |
| EurusPRM-Stage1 | 95.4 | 85.6 | 44.1 | 72.5 | 46.5 | 49.2 | 80.3 | 67.7 |
| EurusPRM-Stage2 | 95.3 | 85.1 | 44.9 | 72.5 | 47.1 | 49.0 | 80.2 | 67.7 |
| Qwen2.5-Math-7B-Math-Shepherd | 96.9 | 88.5 | 46.0 | 75.8 | 49.9 | 49.5 | 79.7 | 69.5 |
| Qwen2.5-Math-7B-PRM800K | 96.5 | 88.9 | 47.4 | 75.3 | 50.7 | 50.1 | 76.6 | 69.4 |
| ⋆ Qwen2.5-Math-PRM-7B | 96.8 | 89.6 | 46.7 | 77.7 | 51.4 | 50.4 | 76.4 | 69.9 |
| 72B | | | | | | | | |
| Qwen2.5-Math-RM-72B | 96.4 | 89.8 | 47.4 | 76.9 | 54.5 | 50.6 | 80.1 | 70.8 |
| ⋆ Qwen2.5-Math-PRM-72B | 96.4 | 89.9 | 46.0 | 77.4 | 52.9 | 50.1 | 82.3 | 70.7 |
## B.4 BoN with Larger N Values
To validate the effectiveness of our PRMs on the BoN with larger N values, we conduct additional Best-of-8 experiments on the policy model Qwen2.5-Math-7b-Instruct across diverse tasks including MATH500 (Lightman et al., 2023), AIME24 1 , AMC23 2 , Minerva Math (Lewkowycz et al., 2022), GaoKao 2023 En (Liao et al., 2024) and OlympiadBench (He et al., 2024). The results are presented in the Table 10 and it can be found that our PRMs maintain superior performance compared to other PRMs, especially on MATH500.
Table 10: Performance comparison on the Best-of-64 strategy of the policy model Qwen2.5-Math-7BInstruct. ⋆ represents the models we trained.
| Setting | MATH500 | AIME24 | AMC23 | Minerva Math | GaoKao 2023 En | Olympiad Bench | Avg. |
|-------------------------------|-----------|----------|---------|----------------|------------------|------------------|--------|
| pass@64 | 96.0 | 50.0 | 95.0 | 56.6 | 86.8 | 73.5 | 76.3 |
| maj@64 | 84.2 | 16.7 | 77.5 | 34.6 | 73.8 | 51.1 | 56.3 |
| 1.5B | | | | | | | |
| Skywork-PRM-1.5B | 81.2 | 20.0 | 62.5 | 31.6 | 70.9 | 46.5 | 52.1 |
| 7B+ | | | | | | | |
| Math-Shepherd-PRM-7B | 79.6 | 20.0 | 62.5 | 32.4 | 70.1 | 43.9 | 51.4 |
| RLHFlow-PRM-Mistral-8B | 82.4 | 20.0 | 62.5 | 30.9 | 69.1 | 45.9 | 51.8 |
| RLHFlow-PRM-Deepseek-8B | 80.2 | 20.0 | 67.5 | 35.3 | 69.1 | 46.2 | 53.1 |
| Skywork-PRM-7B | 84.6 | 20.0 | 67.5 | 32.0 | 71.2 | 47.1 | 53.7 |
| EurusPRM-Stage1 | 76.0 | 10.0 | 55.0 | 27.6 | 66.5 | 40.0 | 45.9 |
| EurusPRM-Stage2 | 76.2 | 10.0 | 52.5 | 27.9 | 67.0 | 40.3 | 45.7 |
| Qwen2.5-Math-7B-Math-Shepherd | 84.2 | 23.3 | 67.5 | 34.6 | 72.5 | 47.4 | 54.9 |
| Qwen2.5-Math-7B-PRM800K | 83.6 | 23.3 | 67.5 | 33.8 | 74.8 | 48.3 | 55.2 |
| ⋆ Qwen2.5-Math-PRM-7B | 87.8 | 20.0 | 67.5 | 33.8 | 75.8 | 51.4 | 56.1 |
| 72B | | | | | | | |
| Qwen2.5-Math-RM-72B | 82.0 | 36.7 | 75.0 | 37.5 | 77.7 | 54.1 | 60.5 |
| ⋆ Qwen2.5-Math-PRM-72B | 87.8 | 23.3 | 72.5 | 38.6 | 77.4 | 55.3 | 59.2 |
## B.5 Best-of-8 with LLM-as-a-judge
Regarding BoN evaluation with LLMs, there are two ways to implement: pairwise and pointwise. For pairwise comparison, we employ a single-elimination tournament method. For N responses, we conduct N-1 comparisons to determine the optimal response. In terms of pointwise comparison, we score each
1 https://huggingface.co/datasets/AI-MO/aimo-validation-aime
2 https://huggingface.co/datasets/AI-MO/aimo-validation-amc
step 1 for correct and 0 for incorrect. We then calculate the proportion of correct steps across all steps and select the response with the highest percentage of correct steps as the best response. The experiment are conduct on the policy model Qwen2.5-Math-7B-Instruct and Qwen2.5-Math-72B-Instruct and the results are shown in Table 11 and Table 12 respectively.
Table 11: Performance comparison with LLM-as-a-judge on the Best-of-8 strategy of the policy model Qwen2.5-Math-7B-Instruct.
| Setting | GSM8K | MATH | Minerva Math | GaoKao 2023 En | Olympiad Bench | College Math | MMLU STEM | Avg. |
|-------------------------------------------------------|-------------------------------------------------------|-------------------------------------------------------|-------------------------------------------------------|-------------------------------------------------------|-------------------------------------------------------|-------------------------------------------------------|-------------------------------------------------------|-------------------------------------------------------|
| pass@8 (Upper Bound) | 98.1 | 92 | 49.3 | 80.5 | 59.6 | 52.6 | 90.5 | 74.7 |
| maj@8 | 96.7 | 87.1 | 41.2 | 72.5 | 44.4 | 47.8 | 73.8 | 66.2 |
| LLM-as-a-judge, Open-source language models POINTWISE | LLM-as-a-judge, Open-source language models POINTWISE | LLM-as-a-judge, Open-source language models POINTWISE | LLM-as-a-judge, Open-source language models POINTWISE | LLM-as-a-judge, Open-source language models POINTWISE | LLM-as-a-judge, Open-source language models POINTWISE | LLM-as-a-judge, Open-source language models POINTWISE | LLM-as-a-judge, Open-source language models POINTWISE | LLM-as-a-judge, Open-source language models POINTWISE |
| QwQ-32B-Preview | 97.0 | 86.0 | 39.3 | 70.1 | 46.2 | 47.9 | 70.5 | 65.3 |
| Qwen2.5-72B-Instruct | 97.0 | 85.6 | 40.1 | 70.9 | 43.4 | 47.9 | 73.4 | 65.5 |
| PAIRWISE | PAIRWISE | PAIRWISE | PAIRWISE | PAIRWISE | PAIRWISE | PAIRWISE | PAIRWISE | PAIRWISE |
| QwQ-32B-Preview | 97.6 | 89.2 | 40.8 | 75.8 | 50.4 | 48.9 | 70.5 | 67.6 |
| Qwen2.5-72B-Instruct | 97.3 | 86.8 | 40.8 | 73.5 | 45.0 | 48.4 | 74.5 | 66.6 |
| PRMs | PRMs | PRMs | PRMs | PRMs | PRMs | PRMs | PRMs | PRMs |
| Qwen2.5-Math-PRM-7B | 97.1 | 88.0 | 42.6 | 74.5 | 47.6 | 48.7 | 74.5 | 67.6 |
| Qwen2.5-Math-PRM-72B | 97.6 | 88.7 | 46.0 | 74.3 | 48.1 | 49.3 | 81.1 | 69.3 |
Table 12: Performance comparison with LLM-as-a-judge on the Best-of-8 strategy of the policy model Qwen2.5-Math-72B-Instruct.
| Setting | GSM8K | MATH | Minerva Math | GaoKao 2023 En | Olympiad Bench | College Math | MMLU STEM | Avg. |
|-------------------------------------------------------|-------------------------------------------------------|-------------------------------------------------------|-------------------------------------------------------|-------------------------------------------------------|-------------------------------------------------------|-------------------------------------------------------|-------------------------------------------------------|-------------------------------------------------------|
| pass@8 (Upper Bound) | 97.3 | 93.2 | 56.6 | 83.6 | 62.4 | 54.1 | 95.3 | 77.5 |
| maj@8 | 96.0 | 88.6 | 47.8 | 73.8 | 50.1 | 50.2 | 84.9 | 70.2 |
| LLM-as-a-judge, Open-source language models POINTWISE | LLM-as-a-judge, Open-source language models POINTWISE | LLM-as-a-judge, Open-source language models POINTWISE | LLM-as-a-judge, Open-source language models POINTWISE | LLM-as-a-judge, Open-source language models POINTWISE | LLM-as-a-judge, Open-source language models POINTWISE | LLM-as-a-judge, Open-source language models POINTWISE | LLM-as-a-judge, Open-source language models POINTWISE | LLM-as-a-judge, Open-source language models POINTWISE |
| QwQ-32B-Preview | 96.2 | 88.3 | 46.3 | 75.3 | 51.0 | 50.0 | 74.9 | 68.9 |
| Qwen2.5-72B-Instruct | 96.5 | 87.8 | 47.4 | 76.4 | 48.9 | 50.0 | 76.0 | 69.0 |
| PAIRWISE | PAIRWISE | PAIRWISE | PAIRWISE | PAIRWISE | PAIRWISE | PAIRWISE | PAIRWISE | PAIRWISE |
| QwQ-32B-Preview | 96.4 | 90.9 | 46.0 | 79.5 | 55.1 | 50.5 | 73.6 | 70.3 |
| Qwen2.5-72B-Instruct | 96.1 | 88.2 | 43.4 | 75.3 | 50.1 | 49.6 | 71.4 | 67.7 |
| PRMs | PRMs | PRMs | PRMs | PRMs | PRMs | PRMs | PRMs | PRMs |
| Qwen2.5-Math-PRM-7B | 96.8 | 89.6 | 46.7 | 77.7 | 51.4 | 50.4 | 76.4 | 69.9 |
| Qwen2.5-Math-PRM-72B | 96.4 | 89.9 | 46.0 | 77.4 | 52.9 | 50.1 | 82.3 | 70.7 |
## C Prompt Template for LLM-as-a-judge
To construct PRM training data via LLM-as-a-judge, we use the following prompt.
Prompt for constructing PRM training data via LLM-as-a-judge I will provide a math problem along with a solution. They will be formatted as follows: problem)...
```
[Math Problem]
<math_problem>
... (math problem)
</math_problem>
[/Solution]
[paragraph_1]
```
```
```
```
The following is the math problem and the solution for you task:
[Math Problem]
Write a program that takes in two numbers as input from the user and calculates their sum. The program should then display the result to the user.
[Solution]
Here's a simple Python program that solves the problem:
```python
# Get the first number from the user
num1 = float(input("Enter the first number: "))
# Get the second number from the user
num2 = float(input("Enter the second number: "))
# Calculate the sum of the two numbers
sum_of_numbers = num1 + num2
# Display the result to the user
print("The sum of", num1, "and", num2, "is", sum_of_numbers)
```
[tagged_response]
This program first prompts the user to enter two numbers. It then calculates their sum and displays the result to the user. The solution is a simple Python program that solves the problem of finding the sum of two numbers entered by the user.
```
Table 13: Performance comparison on the Best-of-8 strategy of the policy model Qwen2.5-Math-7BInstruct with 3 scoring strategies: last, product and minimum. ⋆ represents the models we trained.
| Setting | Scoring | GSM8K | MATH | Minerva Math | GaoKao 2023 En | Olympiad Bench | College Math | MMLU STEM | Avg. |
|-------------------------------|-------------|-----------|-----------|----------------|------------------|------------------|----------------|-------------|-----------|
| pass@8 (Upper Bound) | - | 98.1 | 92 | 49.3 | 80.5 | 59.6 | 52.6 | 90.5 | 74.7 |
| maj@8 | - | 96.7 | 87.1 | 41.2 | 72.5 | 44.4 | 47.8 | 73.8 | 66.2 |
| Math-Shepherd-PRM-7B | last | 96.8 | 85.2 | 39.0 | 70.1 | 42.8 | 47.2 | 67.7 | 64.1 |
| | product | 97.3 | 85.4 | 37.9 | 70.6 | 40.4 | 47.2 | 70.5 | 64.2 |
| | min | 96.9 | 85.3 | 39.0 | 69.9 | 42.2 | 47.4 | 70.6 | 64.5 |
| RLHFlow-PRM-Mistral-8B | last | 97.0 | 85.3 | 39.0 | 71.2 | 44.0 | 47.1 | 64.0 | 63.9 |
| RLHFlow-PRM-Mistral-8B | product | 97.0 | 86.1 | 37.1 | 70.6 | 41.2 | 47.6 | 69.5 | 64.2 |
| RLHFlow-PRM-Mistral-8B | min | 97.0 | 84.3 | 37.1 | 69.4 | 40.4 | 46.9 | 68.7 | 63.4 |
| RLHFlow-PRM-Deepseek-8B | last | 97.0 | 84.7 | 35.7 | 70.4 | 43.0 | 46.8 | 63.8 | 63.1 |
| RLHFlow-PRM-Deepseek-8B | product | 97.3 | 86.3 | 40.8 | 70.9 | 42.2 | 47.2 | 69.3 | 64.9 |
| RLHFlow-PRM-Deepseek-8B | min | 97.3 | 84.5 | 38.2 | 69.6 | 40.7 | 46.5 | 67.6 | 63.5 |
| Skywork-PRM-1.5B | last | 96.8 | 86.4 | 39.0 | 71.7 | 45.0 | 47.9 | 68.2 | 65.0 |
| Skywork-PRM-1.5B | product | 96.9 | 86.7 | 37.9 | 70.1 | 42.1 | 47.9 | 67.9 | 64.2 |
| Skywork-PRM-1.5B | min | 96.6 | 86.6 | 37.9 | 71.9 | 43.1 | 48.2 | 66.9 | 64.5 |
| Skywork-PRM-7B | last | 97.2 | 87.3 | 41.2 | 73.8 | 45.8 | 48.3 | 65.3 | 65.6 |
| Skywork-PRM-7B | product | 97.3 | 87.3 | 38.2 | 71.9 | 43.7 | 47.8 | 67.7 | 64.8 |
| Skywork-PRM-7B | min | 96.7 | 87.0 | 39.7 | 71.2 | 42.5 | 48.2 | 66.6 | 64.6 |
| EurusPRM-Stage1 | last | 94.7 | 79.7 | 32.7 | 61.6 | 33.8 | 45.7 | 63.4 | 58.8 |
| EurusPRM-Stage1 | product | 95.6 | 83.0 | 35.7 | 66.2 | 38.2 | 46.2 | 66.6 | 61.6 |
| EurusPRM-Stage1 | min | 95.8 | 83.3 | 39.0 | 67.8 | 37.9 | 46.6 | 67.4 | 62.5 |
| EurusPRM-Stage2 | last | 94.7 | 79.7 | 33.1 | 61.3 | 34.2 | 45.7 | 63.5 | 58.9 |
| EurusPRM-Stage2 | product | 95.4 | 83.4 | 34.9 | 67.3 | 39.1 | 46.3 | 67.3 | 62.0 |
| EurusPRM-Stage2 | min | 96.1 | 83.6 | 39.3 | 68.8 | 38.8 | 46.7 | 67.5 | 63.0 |
| Qwen2.5-Math-7B-Math-Shepherd | last | 97.1 | 87.7 | 38.6 | 73.8 | 44.6 | 48.1 | 68.0 | 65.4 |
| Qwen2.5-Math-7B-Math-Shepherd | product | 96.9 | 86.5 | 36.8 | 71.4 | 41.6 | 47.7 | 69.3 | 64.3 |
| Qwen2.5-Math-7B-Math-Shepherd | min | 97.0 | 86.7 | 36.8 | 72.5 | 43.1 | 47.6 | 70.7 | 64.9 |
| Qwen2.5-Math-7B-PRM800K | last | 96.7 | 86.3 | 37.9 | 71.9 | 44.3 | 47.6 | 68.1 | 64.7 |
| Qwen2.5-Math-7B-PRM800K | product | 96.9 | 86.9 | 37.1 | 71.2 | 44.0 | 47.6 | 70.9 | 64.9 |
| | min | 96.9 | 86.6 | 39.7 | 71.7 | 45.6 | 47.8 | 71.1 | 65.6 |
| | last | 96.9 | 87.2 | 39.0 | 73.5 | 45.5 | 48.5 | 72.0 | 66.1 |
| | product | 97.1 | 88.0 | 42.6 | 74.5 | 47.6 | 48.7 | 74.5 | 67.6 |
| ⋆ Qwen2.5-Math-PRM-7B | | | 87.8 | | | | 48.3 | | |
| ⋆ Qwen2.5-Math-PRM-7B | min | 97.0 | | 42.3 | 74.3 | 46.2 | | 74.1 | 67.1 |
| ⋆ Qwen2.5-Math-PRM-72B | last | 97.6 | 88.9 | 43.4 | 73.8 | 49.2 | 49.6 | 76.8 | 68.5 |
| ⋆ Qwen2.5-Math-PRM-72B | product min | 97.6 97.6 | 88.7 88.8 | 46.0 45.2 | 74.3 74.5 | 48.1 48.1 | 49.3 49.2 | 81.1 80.9 | 69.3 69.2 |
Table 14: Performance comparison on the Best-of-8 strategy of the policy model Qwen2.5-Math-72BInstruct with 3 scoring strategies: last, product and minimum. ⋆ represents the models we trained.
| Setting | Scoring | GSM8K | MATH | Minerva Math | GaoKao 2023 En | Olympiad Bench | College Math | MMLU STEM | Avg. |
|-------------------------------|-----------|---------|--------|----------------|------------------|------------------|----------------|-------------|-----------|
| pass@8 (Upper Bound) | - | 97.3 | 93.2 | 56.6 | 83.6 | 62.4 | 54.1 | 95.3 | 77.5 |
| maj@8 | - | 96.0 | 88.6 | 47.8 | 73.8 | 50.1 | 50.2 | 84.9 | 70.2 |
| Math-Shepherd-PRM-7B | last | 96.2 | 87.0 | 46.7 | 73.0 | 47.3 | 49.8 | 76.3 | 68.0 |
| | product | 96.5 | 86.8 | 45.6 | 71.9 | 49.2 | 49.5 | 77.5 | 68.1 |
| | min | 96.1 | 86.8 | 45.6 | 73.2 | 48.6 | 49.9 | 76.0 | 68.0 |
| RLHFlow-PRM-Mistral-8B | last | 96.3 | 86.6 | 44.9 | 74.3 | 47.6 | 49.3 | 67.1 | 66.6 |
| RLHFlow-PRM-Mistral-8B | product | 96.6 | 87.5 | 46.3 | 73.5 | 48.9 | 49.4 | 83.4 | 69.4 |
| RLHFlow-PRM-Mistral-8B | min | 96.4 | 86.3 | 44.5 | 71.9 | 47.9 | 49.3 | 76.0 | 67.5 |
| RLHFlow-PRM-Deepseek-8B | last | 96.1 | 86.6 | 46.3 | 73.2 | 49.2 | 49.2 | 71.7 | 67.5 |
| RLHFlow-PRM-Deepseek-8B | product | 96.5 | 87.7 | 44.5 | 73.5 | 48.7 | 49.4 | 84.6 | 69.3 |
| RLHFlow-PRM-Deepseek-8B | min | 96.6 | 87.4 | 44.1 | 74.0 | 48.6 | 49.3 | 74.8 | 67.8 |
| Skywork-PRM-1.5B | last | 96.1 | 88.6 | 44.9 | 72.2 | 47.9 | 50.1 | 74.2 | 67.7 |
| Skywork-PRM-1.5B | product | 96.5 | 88.1 | 45.2 | 74.3 | 48.4 | 49.7 | 79.7 | 68.8 |
| Skywork-PRM-1.5B | min | 96.0 | 88.3 | 45.6 | 73.8 | 48.6 | 50.1 | 75.9 | 68.3 |
| Skywork-PRM-7B | last | 97.0 | 89.0 | 46.0 | 74.8 | 51.0 | 49.7 | 66.7 | 67.7 |
| Skywork-PRM-7B | product | 97.0 | 89.0 | 47.1 | 75.3 | 49.8 | 49.9 | 76.3 | 69.2 |
| Skywork-PRM-7B | min | 96.9 | 89.2 | 46.7 | 73.5 | 49.8 | 49.8 | 73.2 | 68.4 |
| EurusPRM-Stage1 | last | 95.9 | 87.3 | 44.9 | 72.7 | 47.0 | 49.4 | 78.4 | 67.9 |
| EurusPRM-Stage1 | product | 95.4 | 85.6 | 44.1 | 72.5 | 46.5 | 49.2 | 80.3 | 67.7 |
| EurusPRM-Stage1 | min | 96.4 | 88.2 | 44.9 | 75.1 | 49.0 | 49.5 | 83.7 | 69.5 |
| EurusPRM-Stage2 | last | 96.0 | 87.7 | 44.5 | 73.5 | 47.0 | 49.4 | 78.1 | 68.0 |
| EurusPRM-Stage2 | product | 95.3 | 85.1 | 44.9 | 72.5 | 47.1 | 49.0 | 80.2 | 67.7 |
| EurusPRM-Stage2 | min | 96.5 | 88.6 | 45.2 | 75.3 | 48.9 | 49.6 | 83.3 | 69.6 |
| | last | 97.0 | 89.6 | 44.9 | 77.4 | 50.8 | 50.5 | 74.9 | 69.3 |
| Qwen2.5-Math-7B-Math-Shepherd | product | 96.9 | 88.5 | 46.0 | 75.8 | 49.9 | 49.5 | 79.7 | 69.5 |
| Qwen2.5-Math-7B-Math-Shepherd | min | 97.0 | 88.6 | 46.0 | 74.8 | 50.2 | 49.6 | 79.6 | 69.4 |
| Qwen2.5-Math-7B-PRM800K | last | 96.7 | 88.8 | 47.1 | 76.1 | 50.1 | 49.5 | 71.8 | 68.6 |
| Qwen2.5-Math-7B-PRM800K | product | 96.5 | 88.9 | 47.4 | 75.3 | 50.7 | 50.1 | 76.6 | 69.4 |
| | | 96.5 | 89.1 | 47.1 | 76.1 | 50.7 | 49.9 | 75.3 | |
| ⋆ Qwen2.5-Math-PRM-7B | min last | 96.8 | 89.0 | 46.7 | | 49.8 | 50.3 | 78.4 | 69.2 69.5 |
| ⋆ Qwen2.5-Math-PRM-7B | product | 96.8 | 89.6 | 46.7 | 75.3 77.7 | 51.4 | 50.4 | 76.4 | 69.9 |
| ⋆ | min | | | 46.3 | | | 50.3 | | |
| ⋆ | | 96.7 | 89.6 | | 77.9 | 50.8 | | 76.0 | 69.7 |
| Qwen2.5-Math-PRM-72B | last | 96.3 | 89.8 | 47.8 | 76.6 | 53.3 | 50.9 | 80.5 | 70.7 |
| Qwen2.5-Math-PRM-72B | min | 96.4 | 89.7 | 46.3 | 77.7 | 52.4 | 50.4 | 81.2 | 70.6 |
Table 15: Best-of-8 performance comparison on the Chinese benchmarks with the policy model Qwen2.5Math-7B-Instruct in 3 scoring strategies: last, product and minimum. ⋆ represents the PRMs we trained.
| Setting | Scoring | CMATH | CNMiddle School 24 | GaoKao | Avg. |
|-------------------------------|-----------|-----------|----------------------|----------|--------|
| pass@8 (Upper Bound) | - | 95.3 | 82.2 | 84.3 | 87.3 |
| maj@8 | - | 92.7 | 78.2 | 68.1 | 79.7 |
| Math-Shepherd-PRM-7B | last | 91.8 | 80.2 | 63 | 78.3 |
| | product | 92.0 | 80.2 | 69.1 | 80.4 |
| | min | 91.5 | 80.2 | 69.8 | 80.5 |
| RLHFlow-PRM-Mistral-8B | last | 92.8 | 79.2 | 57.2 | 76.4 |
| | product | 92.7 | 77.2 | 65.8 | 78.6 |
| | min | 92.8 | 76.2 | 62.1 | 77 |
| | last | 93.2 | 75.2 | 56.9 | 75.1 |
| RLHFlow-PRM-Deepseek-8B | product | 92.7 | 76.2 | 63.6 | 77.5 |
| | min | 93.0 | 74.3 | 67.3 | 78.2 |
| | last | 93.8 | 80.2 | 66.6 | 80.2 |
| Skywork-PRM-1.5B | product | 92.8 | 79.2 | 66.3 | 79.4 |
| | min | 93.3 | 80.2 | 66.6 | 80 |
| | last | 94.0 | 81.2 | 66.7 | 80.6 |
| Skywork-PRM-7B | product | 93.3 | 79.2 | 68.1 | 80.2 |
| | min | 93.8 | 80.2 | 66.3 | 80.1 |
| | last | 91.8 | 77.2 | 55.4 | 74.8 |
| EurusPRM-Stage1 | product | 91.7 | 77.2 | 52.6 | 73.8 |
| | min | 91.7 | 78.2 | 64.4 | 78.1 |
| | last | 91.8 | 77.2 | 55.7 | 74.9 |
| EurusPRM-Stage2 | product | 92.0 | 77.2 | 52.4 | 73.9 |
| | min | 92.0 | 78.2 | 64.7 | 78.3 |
| | last | 93.0 | 81.2 | 65.4 | 79.9 |
| Qwen2.5-Math-7B-Math-Shepherd | product | 93.0 | 79.2 | 67.7 | 80 |
| | min | 92.5 | 80.2 | 69.8 | 80.8 |
| | last | 92.8 | 78.2 | 67.1 | 79.4 |
| Qwen2.5-Math-7B-PRM800K | product | 92.7 | 77.2 | 68.9 | 79.6 |
| | min | 93.0 | 77.2 | 69.4 | 79.9 |
| | last | | | 68.2 | 80.6 |
| ⋆ Qwen2.5-Math-PRM-7B | product | 93.3 | 80.2 | 70.1 | 81.3 |
| | min | 93.7 93.5 | 80.2 80.2 | 71.7 | 81.8 |
| | last | 94.3 | 80.2 | 72.1 | 82.2 |
| ⋆ Qwen2.5-Math-PRM-72B | product | 94.2 | 80.2 | 73.5 | 82.6 |
| | min | 94.2 | 80.2 | 73.1 | 82.5 |
Table 16: Best-of-8 performance comparison on the Chinese benchmarks with the policy model Qwen2.5Math-72B-Instruct in 3 scoring strategies: last, product and minimum. ⋆ represents the PRMs we trained.
| Setting | Scoring | CMATH | CNMiddle School 24 | GaoKao | Avg. |
|-------------------------------|-----------|---------|----------------------|----------|--------|
| pass@8 (Upper Bound) | - | 96.8 | 83.2 | 86.2 | 88.7 |
| maj@8 | - | 95.3 | 79.2 | 75 | 83.2 |
| Math-Shepherd-PRM-7B | last | 93.7 | 78.2 | 73.2 | 81.7 |
| | product | 94 | 80.2 | 72.1 | 82.1 |
| | min | 93.5 | 80.2 | 73.9 | 82.5 |
| RLHFlow-PRM-Mistral-8B | last | 94.3 | 79.2 | 65.5 | 79.7 |
| | product | 93.8 | 79.2 | 72 | 81.7 |
| | min | 93.3 | 79.2 | 71.2 | 81.2 |
| | last | 94.3 | 79.2 | 63 | 78.8 |
| RLHFlow-PRM-Deepseek-8B | product | 94.3 | 79.2 | 72.5 | 82 |
| | min | 94.5 | 79.2 | 73.5 | 82.4 |
| | last | 94.8 | 80.2 | 74.3 | 83.1 |
| Skywork-PRM-1.5B | product | 93.8 | 79.2 | 69.7 | 80.9 |
| | min | 94.5 | 80.2 | 74.6 | 83.1 |
| | last | 95.3 | 80.2 | 72.6 | 82.7 |
| Skywork-PRM-7B | product | 94.7 | 80.2 | 71.5 | 82.1 |
| Skywork-PRM-7B | min | 94.8 | 80.2 | 76 | 83.7 |
| EurusPRM-Stage1 | last | 94 | 79.2 | 64.5 | 79.2 |
| | product | 93.8 | 80.2 | 64.5 | 79.5 |
| | min | 94.7 | 79.2 | 70.8 | 81.6 |
| | last | 94.2 | 79.2 | 63.4 | 78.9 |
| EurusPRM-Stage2 | product | 93.7 | 80.2 | 65.4 | 79.8 |
| | min | 94.3 | 79.2 | 69.7 | 81.1 |
| | last | 95 | 81.2 | 74.6 | 83.6 |
| Qwen2.5-Math-7B-Math-Shepherd | product | 94.5 | 80.2 | 73 | 82.6 |
| | min | 94.3 | 80.2 | 71.5 | 82 |
| | last | 94.2 | 79.2 | 76.5 | 83.3 |
| Qwen2.5-Math-7B-PRM800K | product | 94.2 | 82.2 | 70.8 | 82.4 |
| | min | 93.8 | 80.2 | 72.9 | 82.3 |
| | last | 94.7 | 79.2 | 74.5 | 82.8 |
| ⋆ Qwen2.5-Math-PRM-7B | product | 94.3 | 81.2 | 77.6 | 84.4 |
| | min | 94.5 | 81.2 | 77.6 | 84.4 |
| | last | 96 | 79.2 | 76.1 | 83.8 |
| ⋆ Qwen2.5-Math-PRM-72B | product | 96 | 80.2 | 77.2 | 84.5 |