# Does Functional Package Management Enable Reproducible Builds at Scale? Yes.
**Authors**: Julien Malka, Stefano Zacchiroli, Théo Zimmermann
> LTCI, Télécom Paris Institut Polytechnique de Paris Palaiseau, France
swhid=true bibliography.bib
## Abstract
Reproducible Builds (R-B) guarantee that rebuilding a software package from source leads to bitwise identical artifacts. R-B is a promising approach to increase the integrity of the software supply chain, when installing open source software built by third parties. Unfortunately, despite success stories like high build reproducibility levels in Debian packages, uncertainty remains among field experts on the scalability of R-B to very large package repositories.
In this work, we perform the first large-scale study of bitwise reproducibility, in the context of the Nix functional package manager, rebuilding $709 816$ packages from historical snapshots of the nixpkgs repository, the largest cross-ecosystem open source software distribution, sampled in the period 2017–2023.
We obtain very high bitwise reproducibility rates, between 69 and 91% with an upward trend, and even higher rebuildability rates, over 99%. We investigate unreproducibility causes, showing that about 15% of failures are due to embedded build dates. We release a novel dataset with all build statuses, logs, as well as full “diffoscopes”: recursive diffs of where unreproducible build artifacts differ.
Index Terms: reproducible builds, functional package management, software supply chain, reproducibility, security
## I Introduction
Free and open source software (FOSS) is a great asset to build trust in a computing system, because one can audit the source code of installed components to determine if their security is up to one’s standards. However trusting the source code of the components making up a system is not enough to trust the system itself: before a program can be run on a user machine, it is typically built A term that we will also use in this work for interpreted programs, where it is the runtime environment that has to be built. to obtain an executable artifact, and then distributed onto the target system, involving a set of processes and actors generally referred to as the software supply chain. In recent years, large scale attacks like Solarwinds [alkhadra_solar_2021] or the xz backdoor [noauthor_nvd_nodate] have specifically targeted the software supply chain, underlying the importance of measures to increase its security and also triggering policy response in the European Union and the United States of America [noauthor_cyber_2022, house_executive_2021]. The particular effectiveness of these attacks is due to the difficulty to analyze binary artifacts in order to understand how they might act on the system, hence increasing the need for tooling that provide traceability from executable binaries to their source code.
Reproducible builds (R-B) —the property of being able to obtain the same, bitwise identical, artifacts from two independent builds of a software component—is recognized as a promising way to increase trust in the distribution phase of binary artifacts [lamb_reproducible_2022]. Indeed, if a software is bitwise reproducible, a user may require several independent parties to reach a consensus on the result of a compilation before downloading the built artifacts from one of them, effectively distributing the trust in these artifacts between those parties. For an attacker wanting to compromise the supply chain of that component, it is no longer sufficient to compromise only one of the involved parties. Build reproducibility is however not easy to obtain in general, due to non-determinism in the build processes, documented both by practitioners and researchers [lamb_reproducible_2022, bajaj_unreproducible_2023]. The Reproducible Builds [noauthor_reproducible_2023] project has since 2015 worked to increase bitwise reproducibility throughout the FOSS ecosystems, by coming up with fixes for compilers and other toolchain components, working closely with upstream projects to integrate them.
Unfortunately, a recent study [fourne_its_2023] which interviewed 24 R-B experts still concluded that there is “ a perceived impracticality of fully reproducible builds due to workload, missing organizational buy-in, unhelpful communication with upstream projects, or the goal being perceived as only theoretically achievable ” and that “ much of the industry believes [R-B] is out of reach ”. While there exist some successful examples of package sets with high reproducibility levels like Debian, which consistently achieves a reproducibility rate of more than 95% [noauthor_overview_nodate], those good performances should be put in perspective with the strict quality policies applied in Debian and the relatively limited size of the package set. Uncertainty remains among field experts about the scalability of this approach to larger software distributions.
Nixpkgs is the largest cross-ecosystem FOSS distribution, totaling as of October 2024 about $100 000$ packages. Based on the Repology rankings https://repology.org, accessed Oct. 2024. It includes components from a large variety of software ecosystems, making it an interesting target to study bitwise reproducibility at scale. Nixpkgs is built upon Nix, the seminal implementation of the functional package management (FPM) model [dolstra_purely_2006]. It is generally believed that the FPM model is effective to obtain R-B: FPM packages are pure functions (in the mathematical sense) from build- and run-time dependencies to build artifacts, described as “build recipe”s that can be executed locally by the package manager. Components are built in a sandboxed environment, disallowing access to unspecified dependencies, even if they are present on the system. Previous work has highlighted that this model allows to reproduce build environments both in space and time [malka_reproducibility_2024], a necessary property for build reproducibility. Additionally, nixpkgs’ predefined build processes implement best practices to ensure build reproducibility, like setting the SOURCE_DATE_EPOCH environment variable [noauthor_source_date_epoch_nodate] or automatically verifying that the build path does not appear in the built artifacts [noauthor_build_nodate]. Despite the potential for insightful distribution-wide build reproducibility metrics, nixpkgs limits its monitoring to the narrow set of packages included in the minimal and gnome-based ISO images [noauthor_nixos_nodate], where a reproducibility rate higher than 95% is consistently reported.
Contributions
In this work, we perform the first ever large scale empirical study of bitwise reproducibility of FOSS going back in time, rebuilding historical packages from evenly spaced snapshots of the nixpkgs package repository taken every 4.1 months from 2017 to 2023. With this experiment, we answer the following research questions:
- RQ1: What is the evolution of bitwise reproducible packages in nixpkgs between 2017 and 2023? How does the reproducibility rate evolve over time? Are unreproducible packages eventually fixed? Do reproducible packages remain reproducible?
- RQ2: What are the unreproducible packages? Are they concentrated in specific ecosystems? Are critical packages more likely to be reproducible?
- RQ3: Why are packages unreproducible? Is large-scale identification of common causes possible?
- RQ4: How are unreproducibilities fixed? Are they fixed by specific patches or as part of larger package updates? Are the fixes intentional or accidental?
Besides, we use our experiment to replicate and extend previous results [malka_reproducibility_2024], leading to an additional research question:
- RQ0: Does Nix allow rebuilding past packages reliably (even if not bitwise reproducibly)?
Results
Thanks to this large-scale experiment, we are able to establish for the first time that bitwise reproducibility is achievable at scale, with reproducibility rates ranging from 69% to 91% over the period 2017–2023, despite a continuous increase in the number of packages in nixpkgs. We highlight the wide variability in reproducibility rates across ecosystems packaged in nixpkgs, and show the significant impact that some core packages can have on the overall reproducibility rate of an ecosystem.
We estimate the prevalence of some common causes of non-reproducibility at a large scale for the first time, showing that about 15% of failures are due to embedded build dates.
As part of this work, we introduce a novel dataset containing build logs and metadata of over $709 000$ package builds, and more than $114 000$ occurrences of non-reproducibility with full artifacts including “diffoscopes”, i.e., recursive diffs of where unreproducible build artifacts differ. Ample room for further research is left open by the dataset, including exploiting the build logs, or applying more complex heuristics or qualitative research to the diffoscopes.
Paper structure
Section II presents the related work. Section III gives some background that is required to understand the experiment, whose methodology is then presented in Section IV. Some descriptive statistics about the dataset are presented in Section V, and the results to our RQs in Section VI. We discuss them in Section VII, and the threats to validity in Section VIII, concluding in Section IX.
## II Related work
### II-A Reproducible builds (R-B)
R-B are a relatively recent concept, which has been picked up and developed mostly by practitioners from Linux distributions and upstream maintainers. The Reproducible Builds project [noauthor_reproducible_2023] has been the main actor in the area. The project has produced a definition of R-B, best practices to achieve them, and tools to monitor the reproducibility of software distributions, and debug unreproducibilities (the diffoscope).
Besides, R-B have picked the interest of the academic community, with a growing number of papers on the topic.
R-B for the security of the software supply chain
R-B are often seen as a way to increase the security of the software supply chain [lamb_reproducible_2022]. Torres-Arias et al. provide a framework to enforce the integrity of the software supply chain for which they demonstrate an application to enforce R-B [torres-arias_-toto_2019]. Our paper does not contribute directly to this line of research but, by demonstrating the feasibility of R-B at scale, it strengthens the case of the approach.
Techniques for build reproducibility
In a series of articles [ren_automated_2018, ren_root_2020, ren_automated_2022], Ren et al. devised a methodology to automate the localization of sources of non-reproducibility in build processes and to automatically fix them, using a database of common patches that are then automatically adapted and applied.
An alternative technique to achieve build reproducibility is proposed by Navarro et al. [navarro_leija_reproducible_2020]. They propose “reproducible containers” that are built in a way that makes the build process fully deterministic, at the expense of performance.
FPMs such as Nix [dolstra_purely_2006] and Guix [courtes_functional_2013] are also presented as a way to achieve R-B. Malka et al. [malka_reproducibility_2024] showed that Nix allows reproducing past build environment reliably, as well as rebuilding old packages with high confidence, but they do not address the question of bitwise reproducibility, which we do with this work.
Relaxing the bitwise reproducibility criterion
Because of the difficulty (real or perceived) to achieve bitwise reproducibility, some authors have proposed to relax the criterion to a more practical one. For instance, accountable builds [poll_analyzing_2021] aim to distinguish between differences that can be explained (accountable differences) or not (unaccountable differences). Our work highlights that bitwise reproducibility is achievable at scale in practice, and thus that relaxing the reproducibility criterion may not be necessary after all.
Empirical studies of R-B
Some other recent academic works have empirically studied R-B in the wild. Two papers from 2023 [butler_business_2023, fourne_its_2023] looked into business adoption of R-B and perceived effectiveness through interviews.
Bajaj et al. [bajaj_unreproducible_2023] mined historical results from R-B tracking in Debian to investigate causes, fix time, and other properties of unreproducibility in the distribution. Our work is similar, but instead of relying on historical R-B tracking, we actually rebuild packages and compare them bitwise to historical build results. When we report on packages being reproducible, it means they have stood the test of time. It also allows us to provide more detailed information on the causes of unreproducibility, in particular by generating diffoscopes and saving them for future research as part of our dataset; whereas diffoscopes from the Debian R-B tracking are not preserved in the long-term. Finally, Bajaj et al. used issue tracker data from the R-B project to identify the most common causes of non-reproducibility, possibly introducing a sampling bias since only root causes that were identified by Debian developers are counted in their statistics. In our work, we try to avoid this bias by performing a large-scale automatic analysis of diffoscopes to automatically identify the prevalence of a selection of causes of non-reproducibility. While we present heuristics comparable to some of the causes identified in Bajaj et al. ’s taxonomy, we derive them from empirical data rather than relying on pre-labeled data from the Debian issue tracker.
The only other work that performed an experimental study of R-B investigated the impact of configuration options [randrianaina_options_2024]. Contrary to them, we rebuild historical versions of packages in their default configuration. Combining the historical snapshot approach of our work with their approach of varying the configuration options could be an interesting future work.
### II-B Linux distributions and package ecosystems
Besides R-B, our work also relates to the literature on Linux distributions and package ecosystems. The nixpkgs repository being the largest cross-ecosystem software distribution, we are able to compare properties of packages across ecosystems. Several previous works have compared package ecosystems (e.g., [decan_empirical_2019]). For an overview of recent research on package ecosystems, see Mens and Decan [mens_overview_2024].
More specifically, nixpkgs is the basis of the NixOS Linux distribution. Linux distributions have a long history of being studied by the research community. Recently, Legay et al. [legay_quantitative_2021] measured the package freshness in Linux distributions. While this is not the topic of this work, our dataset could be used, e.g., to study how frequently packages are updated in nixpkgs.
## III Background
We provide in this section some background knowledge about Nix and R-B, which is required to understand the details of our experiments.
### III-A The FPM model and the Nix store
The FPM model applies the idea of functional programming to package management. Nix packages are viewed as pure functions from their inputs (source code, dependencies, build scripts) to their outputs (binaries, documentation, etc.). Any change to the inputs should produce a different package version. Nix allows multiple versions of the same package to be built and coexist on the same system. To that end, Nix stores build outputs in input-addressed directories (using a hashing function of the inputs) in the Nix store, usually located in the /nix/store directory on disk. Figure 1 shows an example of a Nix packaging expression (a Nix recipe) for the htop package.
⬇ {stdenv, fetchFromGitHub, ncurses, autoreconfHook}: stdenv. mkDerivation rec { pname = "htop"; version = "3.2.1"; src = fetchFromGitHub { owner = "htop-dev"; repo = "htop"; rev = version; sha256 = "sha256-MwtsvdPHcUdegsYj9NGyded5XJQxXri1IM1j4gef1Xk="; }; nativeBuildInputs = [ autoreconfHook ]; buildInputs = [ ncurses ]; }; }
Figure 1: Example Nix expression for the htop package.
### III-B Nix evaluation-build pipeline
Building binary outputs from a Nix package recipe is a two-step process. First, Nix evaluates the expression and transforms it into a derivation, an intermediary representation in the Nix store containing all the necessary information to run the build process. In particular, the derivation contains ahead of time the (input-addressed) output path, that is the exact location in the Nix store where the build artifacts will be stored if that derivation were to be built.
Then, given the derivation file as input, the nix-build command performs the build, creating the pre-computed output path in the Nix store upon completion.
In the same fashion as other Linux distributions, Nix packages may produce multiple outputs (a main output with binaries, one with documentation, etc.). Each output has its own directory in the Nix store, and building the derivation from source systematically produces all its outputs.
### III-C Path substitution and binary caches
Alternatively to building from source, Nix offers the option to download prebuilt artifacts from third party binary caches, which are databases populated with build outputs generated by Nix. Binary caches are indexed by output paths, making it possible for Nix to check for the presence of a precompiled package in a configured cache after the evaluation phase. https://cache.nixos.org is the official cache for the Nix community and most Nix installations come configured to use it as a trusted cache.
### III-D The nixpkgs continuous integration
Hydra [dolstra_nix_nodate] is the continuous integration (CI) platform for the nixpkgs project. At regular intervals in time, it fetches the latest version of nixpkgs’ git master branch and evaluates the pkgs/top-level/release.nix file embedded in the repository. This evaluation yields a list of derivations (or jobs) that are then built by Hydra: one derivation for each of the $≈$ $100 000$ packages contained in nixpkgs nowadays. Upon success of a predefined subset of these jobs, the revision is deemed valid and all the built artifacts are uploaded to the official binary cache to be available to end users.
### III-E Testing bitwise reproducibility with Nix
Nix embarks some minimal tooling to test the reproducibility of a given derivation in the form of a --check flag passed to the nix-build command. To check for bitwise reproducibility, Nix needs a reference that it will try to acquire from one of the configured caches, or fail if not possible. Nix then acquires the build environment of the derivation under consideration, builds the derivation, and compares each of the outputs of the derivation against the local version. The --keep-failed flag can be used to instruct Nix to keep the unreproducible outputs locally for further processing. For our experiment, we alter the behavior of nix-build --check to prevent it from failing early as soon as one unreproducible output is detected.
### III-F Diffoscope
Diffoscope [noauthor_diffoscope_nodate] is a tool developed and maintained by the Reproducible Builds project that aims to simplify the analysis of differences between software artifacts. It is able to recursively unpack binary archives and automatically use ecosystem specific diffing tools to allow for better understanding of what makes two software artifacts different. It generates HTML or JSON artifacts—also called diffoscopes —that can be either interpreted by humans or automatically processed.
## IV Methodology
<details>
<summary>extracted/6418685/medias/pipelinev2.png Details</summary>
### Visual Description
## Diagram: Nixpkgs Reproducibility Analysis Pipeline
### Overview
This diagram illustrates a technical workflow for analyzing the reproducibility of software packages within the Nixpkgs ecosystem. It compares historical Continuous Integration (CI) builds against fresh rebuilds to determine if package artifacts are identical, thereby assessing reproducibility. The process involves sampling revisions from a git repository, executing parallel build pipelines, and performing comparative analysis with follow-up diagnostic steps.
### Components/Axes
The diagram is structured into three primary colored regions and two input nodes, connected by directional arrows indicating data and process flow.
**Input Nodes (Left Side):**
1. **Nixpkgs git repository** (Purple box, bottom-left): The source of package definitions.
2. **Nixpkgs revision** (Purple rounded rectangle, center-left): A specific point-in-time snapshot of the repository. An arrow labeled "Sample 17 revisions" points from the repository to this node, indicating the sampling process.
**Process Regions:**
1. **Historical CI Builds** (Red dashed-border region, top-left): Represents the existing, official build process.
2. **Our Rebuilds** (Green dashed-border region, bottom-left): Represents a parallel, independent rebuild process for comparison.
3. **Our Analysis** (Blue dashed-border region, right): The core analysis engine that compares outputs from the two build processes.
**Legend/Status Indicators:**
* **Status: reproducible** (Green text): Outcome when compared artifacts are identical.
* **Status: buildable but not reproducible** (Orange text): Outcome when compared artifacts are different.
* **Status: failure** (Red text): Outcome when a rebuild fails.
### Detailed Analysis
**Flow from Input:**
The "Nixpkgs revision" node feeds into both the "Historical CI Builds" and "Our Rebuilds" regions simultaneously.
**1. Historical CI Builds (Red Region) - Top-Left Quadrant:**
* **Step 1:** "Evaluation of release.nix by Hydra" (Red box).
* **Step 2:** Arrow leads to "Build all packages using Hydra builders" (Red box).
* **Conditional Step:** A dashed arrow labeled "If build succeeds" and "upload artifacts" leads to "Nixpkgs' binary cache" (Red box). This represents the storage of official build artifacts.
**2. Our Rebuilds (Green Region) - Bottom-Left Quadrant:**
* **Step 1:** "Evaluation of release.nix by nix-eval-jobs" (Green box).
* **Step 2:** Arrow leads to "Computation of evaluation closure and filtering out packages not in cache" (Green box).
* **Step 3:** Arrow leads to "Build all packages using our Buildbot infrastructure" (Green box).
* **Conditional Outcomes:**
* A green arrow labeled "Success" leads to "Store artifacts" (Green box).
* A red arrow labeled "Failure" leads to the status "Status: failure".
**3. Our Analysis (Blue Region) - Right Half:**
* **Input:** Dotted arrows from both "Nixpkgs' binary cache" (Historical) and "Store artifacts" (Rebuilds) converge on the "Compare artifacts" node (Blue box).
* **Comparison Logic:**
* A green arrow labeled "Identical" leads to "Status: reproducible".
* An orange arrow labeled "Different" leads to "Status: buildable but not reproducible".
* **Diagnostic Path (for "Different" outcome):** An arrow from the "Different" status leads to a decision point labeled "If the package is fixed later on". This branches into two parallel diagnostic workflows:
* **Left Branch:** "Bisect to find fixing commit" (Blue box) -> "Manually analyze commit to infer intent" (Blue box).
* **Right Branch:** "Generate Diffoscopes" (Blue box) -> "Run heuristics to categorize them" (Blue box).
### Key Observations
1. **Parallel Process Design:** The core methodology is a side-by-side comparison between a trusted historical build (Hydra) and an independent rebuild (Buildbot). This is a standard approach for testing reproducibility.
2. **Tool Differentiation:** The diagram specifies different tools for each pipeline: "Hydra" for historical builds and "nix-eval-jobs" + "Buildbot" for rebuilds. This independence is crucial for a valid reproducibility test.
3. **Filtering Step:** The rebuild process includes an explicit step to filter out packages not present in the cache, suggesting the analysis focuses on packages that were successfully built historically.
4. **Multi-faceted Diagnostics:** When a package is not reproducible, the workflow doesn't stop. It includes sophisticated follow-up actions: bisecting git history to find fixes and using "Diffoscopes" (a tool for comparing binary files) with heuristics to categorize differences.
5. **Clear Status Taxonomy:** The system defines three clear, mutually exclusive outcomes for any given package build: reproducible, buildable but not reproducible, or failure.
### Interpretation
This diagram outlines a rigorous, automated methodology for auditing software supply chain security and reliability within the Nix package manager ecosystem. Reproducibility is a critical property ensuring that the same source code always produces bit-for-bit identical binaries, which is foundational for security verification, trust, and debugging.
The process demonstrates a **Peircean investigative approach**:
* **Abduction:** The initial hypothesis is that packages *should* be reproducible. The comparison test is designed to probe this.
* **Deduction:** If the hypothesis is true (artifacts are identical), the status is confirmed ("reproducible"). If false (artifacts differ), it triggers a specific diagnostic routine.
* **Induction:** The diagnostic steps (bisecting, diffoscope analysis) gather new evidence to understand *why* reproducibility failed, potentially leading to generalizable rules about common failure modes (categorized by heuristics).
The "If the package is fixed later on" branch is particularly insightful. It shows the system is designed not just to detect problems, but to investigate their resolution, turning a failure into a learning opportunity to understand what kinds of changes break reproducibility and how they are fixed. This moves beyond simple monitoring into active forensic analysis of the build process's integrity.
</details>
Figure 2: Description of our build and analysis pipeline.
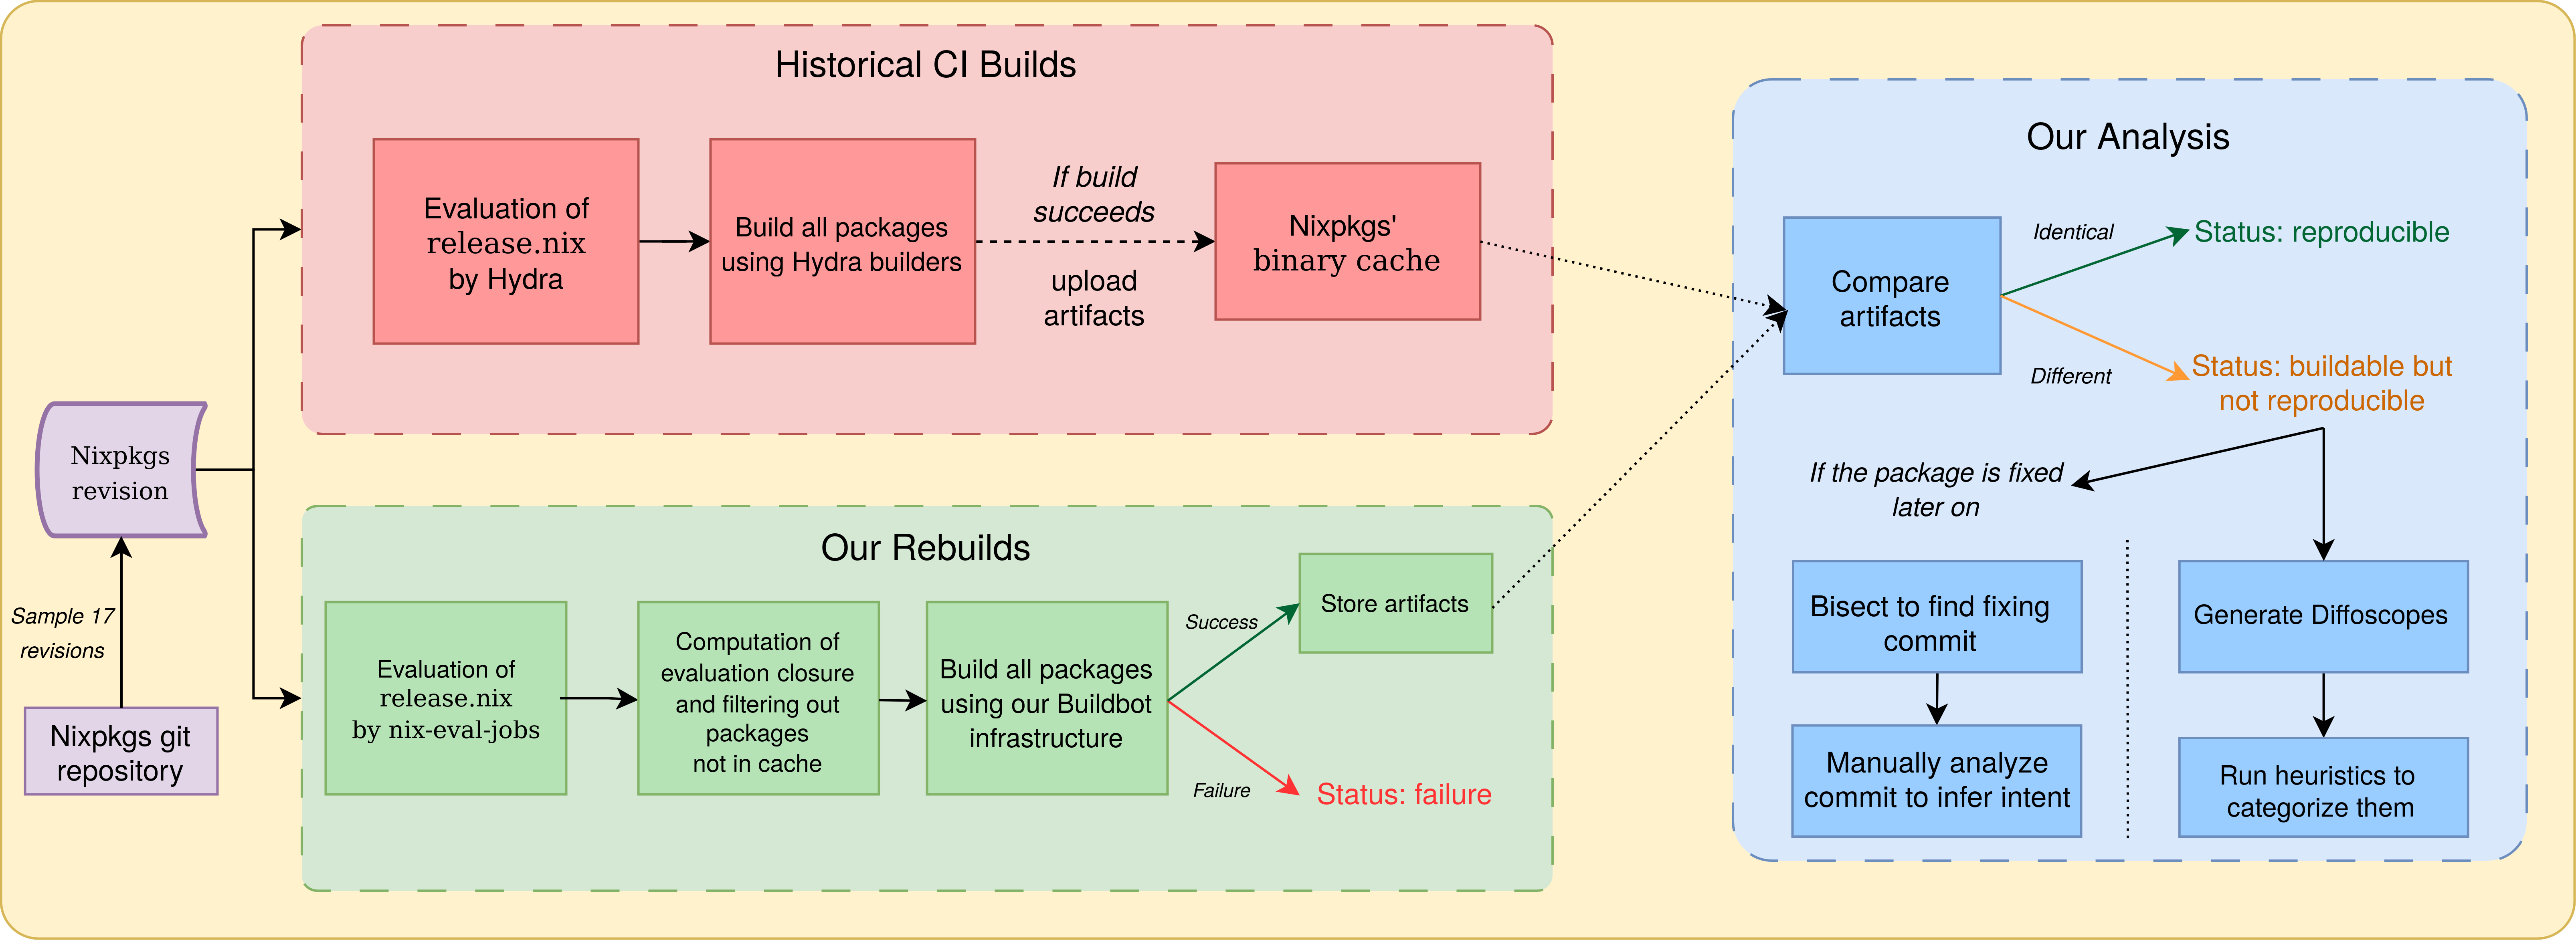
Our build and analysis pipeline is summarized in Figure 2.
### IV-A Reproducibility experiments
#### IV-A 1 Revision sampling
We start from the 200 nixpkgs revisions selected by Malka et al. [malka_reproducibility_2024] in the period July 2017–April 2023. Since building revisions, as opposed to just evaluating them, is very computationally intensive, it was not feasible to build all 200 revisions. Also, it was difficult to correctly estimate how many revisions we could build, due to the ever-growing number of packages in each revision. We hence applied dichotomic sampling: we first build the most recent revision, then the oldest one, then the one in the middle of them, and so on always picking the one in the middle of the largest time interval when choosing. After 17 revisions built, we obtain a regularly spaced sample set of nixpkgs revisions, with one sampled revision every 4.1 months. On average, each revision corresponds to building more than 41 thousand packages (see Figure 3 for details, discussed later).
To perform our builds, we used a distributed infrastructure based on Buildbot [noauthor_buildbot_nodate], a Python CI pipeline framework. Our infrastructure has two types of machines: a coordinator and multiple builders. The coordinator is in charge of distributing the workload and storing data that must be persisted, while the builders are stateless and perform workloads sent by the coordinator. During the course of the experiment (from June to October 2024) the set of builders we used was composed of shared bare-metal machines running various versions of Ubuntu and Fedora and our coordinator was a virtual machine running Ubuntu. Note that to perform our bitwise reproducibility checks, we compare to the historical results coming from Hydra, that uses builders that, at the time, ran older versions of Nix than the ones we used on our builders. Further details on the operating systems, Nix versions and kernel versions that we used on builders can be found in the replication package.
#### IV-A 2 Evaluation and preprocessing
For each revision considered, the coordinator first evaluates pkgs/top-level/release.nix (containing the list of jobs built by Hydra for this revision) using nix-eval-jobs, a standalone and parallel Nix evaluator similar to the one used on Hydra. The outcome of this operation is a list of derivations. The release.nix file is human crafted and does not contain all the dependencies of the listed packages, even though they are built by Hydra along the way. Since we are interested in testing the reproducibility of the entire package graph built by Hydra, we post-process the list of jobs obtained after the evaluation phase to include all intermediary derivations by walking through the dependency graph of each derivation. During this post-processing, we also check that the derivation outputs are present in the official Nix binary cache. This is required to compare our build outputs with historical results for bitwise reproducibility. Derivations missing from the cache can indicate that they historically failed to build, although there can be other reasons for their absence.
#### IV-A 3 Building
To build a job $A$ and test the reproducibility of its build outputs, the builder uses the nix-build --check command, as described in Section III-E. This means that we always assume that $A$ ’s build environment is buildable and always fetch it from the cache. This allows all the derivations in the sample set to be built and checked independently and in parallel, irrespective of where they are located in the package dependency graph. Note that the source code of packages to build is part of the build environment. Relying on the NixOS cache hence avoids incurring into issues such as source code disappearing from the original upstream distribution place. Investigating how much of NixOS can be rebuilt without relying on the cache is an interesting research question, recently explored for Guix [courtes-2024-guix-archiving], but out of scope for this paper.
After each build, we classify the derivation as either building reproducibly, building but not reproducibly or not building. We save the build metadata and the logs, and when available we download and store the historical build logs from the nixpkgs binary cache. Finally, for every unreproducible output path, we store both the historical artifacts and our locally built ones, for comparison purposes.
### IV-B Ecosystem identification and package tracking
To answer RQ1, RQ2 and RQ4, we need to be able to discriminate packages by provenance ecosystem, and track them over time to follow their evolution. To categorize packages by ecosystem, we rely on the first component of the package name when it has several components (for example a package named haskellPackages.network is sorted into the Haskell ecosystem). Sometimes, there are several co-existing versions of an ecosystem in a given nixpkgs revision (for example python37Packages and python38Packages being present in the same revision), and sometimes the name of the ecosystem is modified between successive nixpkgs revisions. Therefore, some deduplication step is necessary. The first and last authors performed this step manually by inspecting the 144 ecosystems from the 17 nixpkgs revisions considered, ordered alphabetically, and deciding which ones to merge independently, then checking the consistency of their results, discussing the few differences (missed merges, or false positives) and reaching a consensus. For instance, the following ecosystems were merged into a single one: php56Packages, php70Packages, …, php82Packages, phpExtensions, phpPackages and phpPackages-unit.
To deduplicate packages appearing in several versions of the same ecosystem, we order by version (favoring the most recent one) and consider any package set without a version number as having a higher priority (since it is the default one in the considered revision, as chosen by the nixpkgs maintainers).
### IV-C Comparison with the minimal ISO image
As part of RQ2, we investigate the difference of reproducibility rate between critical packages whose reproducibility is monitored and the rest of the package set. We are also interested in knowing whether observing the reproducibility health of this subset of packages gives a good enough information on the state of the rest of the project. The minimal and gnome-based ISO images are considered critical subsets of packages and benefit from a community-maintained reproducibility monitoring. We study the minimal ISO image because it contains a limited amount of core packages. We evaluate the Nix expression associated with the image, compute its runtime closure (the set of packages included in the image) and match it with the packages of our dataset to infer their reproducibility statuses.
### IV-D Analyzing causes of unreproducibility using diffoscopes
Analyzing causes of unreproducibility is a tricky debugging activity, usually carried out by practitioners (in particular, by Linux distribution maintainers and members of the Reproducible Builds project). Some automatic fault localization methods have been proposed [ren_root_2020], but they rely on instrumenting the build, while we have to run the Nix builds unchanged to avoid introducing biases.
For each unreproducible output, we run diffoscope with a 5-minute timeout, yielding a dataset of $86 476$ diffoscopes. We then investigate whether we can use our large dataset of diffoscopes for automatic detection of causes of non-reproducibility. The diffoscope tool was mainly designed to help human debugging, but it also supports producing a JSON output, which can then be machine processed.
We wish to explore heuristics that can be applied at the line level, so we recurse through diffoscope structures until leaf nodes, which are diffs in unified diff format. We randomly draw one added line from $10 000$ diffoscopes, sort them by similarity to ease visual inspection, and manually inspect them to derive relevant heuristics. We then run these heuristics on the full diffoscope dataset to determine the proportion of packages impacted by each cause (multiple causes can apply to the same package). The first and last author then evaluate the precision of each these heuristics by manually counting false positives in samples of matched lines for each heuristic.
### IV-E Automatic identification of reproducibility fixes
To investigate fixes to unreproducibilities, for each unreproducible package that becomes reproducible, we run an automatic bisection process to find the first commit that fixes the reproducibility. By looking into the corresponding pull request on GitHub, we check if the maintainers provide information on why this fixes a reproducibility issue, or link to a corresponding bug report. In particular, we are interested to check how often the maintainers are aware that their commit is a reproducibility fix (as opposed to a routine package update, which embeds a reproducibility fix that would have been crafted by the upstream maintainers).
We start from the set of packages from all revisions, and we look specifically at packages that change status from unreproducible to reproducible in two successive revisions. These are our candidate packages (and “old” and “new” commits) for the bisection process.
Since we perform the bisection process on a different runner and at a different time compared to the dataset creation, it can happen that we cannot reproduce the status (reproducible or unreproducible) of some builds. Therefore, before starting the bisection, we verify that we obtain consistent results on the “old” and the “new” revision. Then, for those which behave as expected, we start an automatic git bisect process.
The script used for the automatic git bisect checks for the reproducibility status of the build to mark the selected commit as “old” or “new”. Commits that fail to build or are not available in cache are marked as “skipped”. We use git bisect with the --first-parent flag because intermediate pull request commits are typically not in cache.
For the qualitative analysis, we first group packages by fixing commit, as seeing all packages fixed by a given commit gives valuable information that might help to understand the reproducibility failure being fixed. We then randomly sample fixes and open their commit page on GitHub, locating the corresponding pull request. We manually inspect the pull request (description, commit log, code changes) to first confirm that the bisect phase successfully identified the commit that fixed the reproducibility failure. It may be the case that after careful inspection, the change looks unrelated to the package being fixed (the bisection process can give incoherent results in case of a flaky reproducibility issue or because the package changed status several times between two data points) in which case we discard it. Once we have confirmed that the identified commit is correct, we check whether the commit authors indicate that they are fixing a reproducibility issue and if the commit is a package update or another change. We analyze 100 randomly sampled reproducibility fixes and report our findings. Additionally, we perform the same analysis on the 15 commits that fix the most packages (from $3052$ down to 27 packages fixed) to find potential differences of behavior of the contributors for those larger-scale fixes.
## V Dataset
The main result of running the pipeline of Figure 2 is a large-scale dataset of historical package rebuilds, including (re)build information, bitwise reproducibility status and, in case of non-reproducibility, generated diffoscopes. In this paper, we use the dataset to answer our stated research questions, but many other research questions could be addressed using the dataset, including more in-depth analysis of non-reproducibility causes. We make the dataset available to the research and technical community to foster further exploration on the topic. In the remainder of this section, we provide some descriptive statistics of the dataset.
<details>
<summary>extracted/6418685/paper-images/package-evolution.png Details</summary>
### Visual Description
## Stacked Area Chart: Nix Package Evaluation Growth (2018-2023)
### Overview
This is a stacked area chart illustrating the growth in the number of packages evaluated by three different methods within the Nix ecosystem from early 2018 to mid-2023. The chart shows a consistent upward trend for all metrics, with a particularly sharp increase in 2023.
### Components/Axes
* **Chart Type:** Stacked Area Chart.
* **X-Axis (Horizontal):** Labeled "Date". It displays years from 2018 to 2023, with tick marks at the start of each year. The data appears to be plotted at regular intervals (likely quarterly or bi-annually) within each year.
* **Y-Axis (Vertical):** Labeled "Number of packages". The scale is linear, ranging from 0 to over 70,000, with major gridlines at 10,000 increments (0, 10k, 20k, ..., 70k).
* **Legend:** Positioned at the bottom center of the chart, below the x-axis label. It defines three data series:
1. **Deduplicated evaluation:** Represented by a blue line and area.
2. **Evaluation of release.nix:** Represented by an orange/red line and area.
3. **Evaluation closure of release.nix:** Represented by a green/teal line and area.
* **Data Series Order (from bottom to top in the stack):** Blue (Deduplicated), then Orange (Evaluation of release.nix), then Green (Evaluation closure). The total height of the stacked areas represents the cumulative count for the top series (Green).
### Detailed Analysis
**Trend Verification & Data Points (Approximate Values):**
* **Deduplicated evaluation (Blue - Bottom Layer):**
* **Trend:** Shows a steady, near-linear increase throughout the period.
* **Data Points:**
* Early 2018: ~13,000
* Early 2019: ~19,000
* Early 2020: ~22,000
* Early 2021: ~26,000
* Early 2022: ~31,000
* Early 2023: ~45,000 (sharp increase)
* Mid-2023: ~43,000 (slight dip from peak)
* **Evaluation of release.nix (Orange - Middle Layer):**
* **Trend:** Increases steadily, with a slight plateau/dip around 2019, followed by consistent growth and a sharp rise in 2023.
* **Data Points (Cumulative, i.e., Blue + Orange):**
* Early 2018: ~18,000 (Orange layer adds ~5k)
* Early 2019: ~25,000 (Orange layer adds ~6k)
* Early 2020: ~31,000 (Orange layer adds ~9k)
* Early 2021: ~37,000 (Orange layer adds ~11k)
* Early 2022: ~41,000 (Orange layer adds ~10k)
* Early 2023: ~55,000 (Orange layer adds ~10k)
* Mid-2023: ~54,000 (Orange layer adds ~11k)
* **Evaluation closure of release.nix (Green - Top Layer):**
* **Trend:** Shows the most pronounced growth, especially after 2020. It exhibits a significant jump in early 2023.
* **Data Points (Cumulative Total, i.e., Blue + Orange + Green):**
* Early 2018: ~20,000 (Green layer adds ~2k)
* Early 2019: ~31,000 (Green layer adds ~6k)
* Early 2020: ~37,000 (Green layer adds ~6k)
* Early 2021: ~45,000 (Green layer adds ~8k)
* Early 2022: ~50,000 (Green layer adds ~9k)
* Early 2023: ~76,000 (Green layer adds ~21k - massive increase)
* Mid-2023: ~75,000 (Green layer adds ~21k)
### Key Observations
1. **Consistent Hierarchy:** The "Evaluation closure of release.nix" (Green) always represents the largest number of packages, followed by "Evaluation of release.nix" (Orange), with "Deduplicated evaluation" (Blue) being the smallest subset. This hierarchy is maintained throughout the entire timeline.
2. **Accelerated Growth in 2023:** All three metrics show a dramatic, simultaneous increase in early 2023. The slope of the green line is particularly steep, indicating a major expansion in the evaluation closure.
3. **Steady Underlying Growth:** Prior to 2023, the growth was more gradual and linear, especially for the deduplicated evaluation (blue).
4. **Proportional Relationship:** The gaps between the lines (representing the size of each layer) generally widen over time, suggesting that the more comprehensive evaluation methods (Orange and Green) are growing at a faster rate than the deduplicated core (Blue).
### Interpretation
This chart demonstrates the significant and accelerating growth of the Nix package ecosystem over a five-year period. The data suggests:
* **Ecosystem Expansion:** The total number of packages being evaluated (as shown by the top green line) has more than tripled from ~20,000 in 2018 to over 75,000 in 2023. This indicates a healthy, rapidly expanding repository.
* **Evaluation Complexity:** The consistent gap between the "Deduplicated evaluation" and the other two series highlights that a substantial portion of the evaluated packages are not unique to a specific release file but are part of a larger dependency closure. The widening gap implies that the dependency trees or the scope of what is considered part of a "release" is growing.
* **Major Event in 2023:** The sharp, concurrent spike in all metrics in early 2023 points to a specific event—likely a major repository restructuring, a change in evaluation methodology, or the integration of a very large new set of packages or dependencies. The fact that the green "closure" layer saw the largest absolute increase suggests this event particularly impacted the broader dependency graph.
* **Peircean Insight:** The chart doesn't just show growth; it shows *structured* growth. The maintained hierarchy acts as a sign that the fundamental relationship between these evaluation methods is stable, even as the scale changes. The 2023 anomaly is an index of a significant underlying change in the system being measured.
</details>
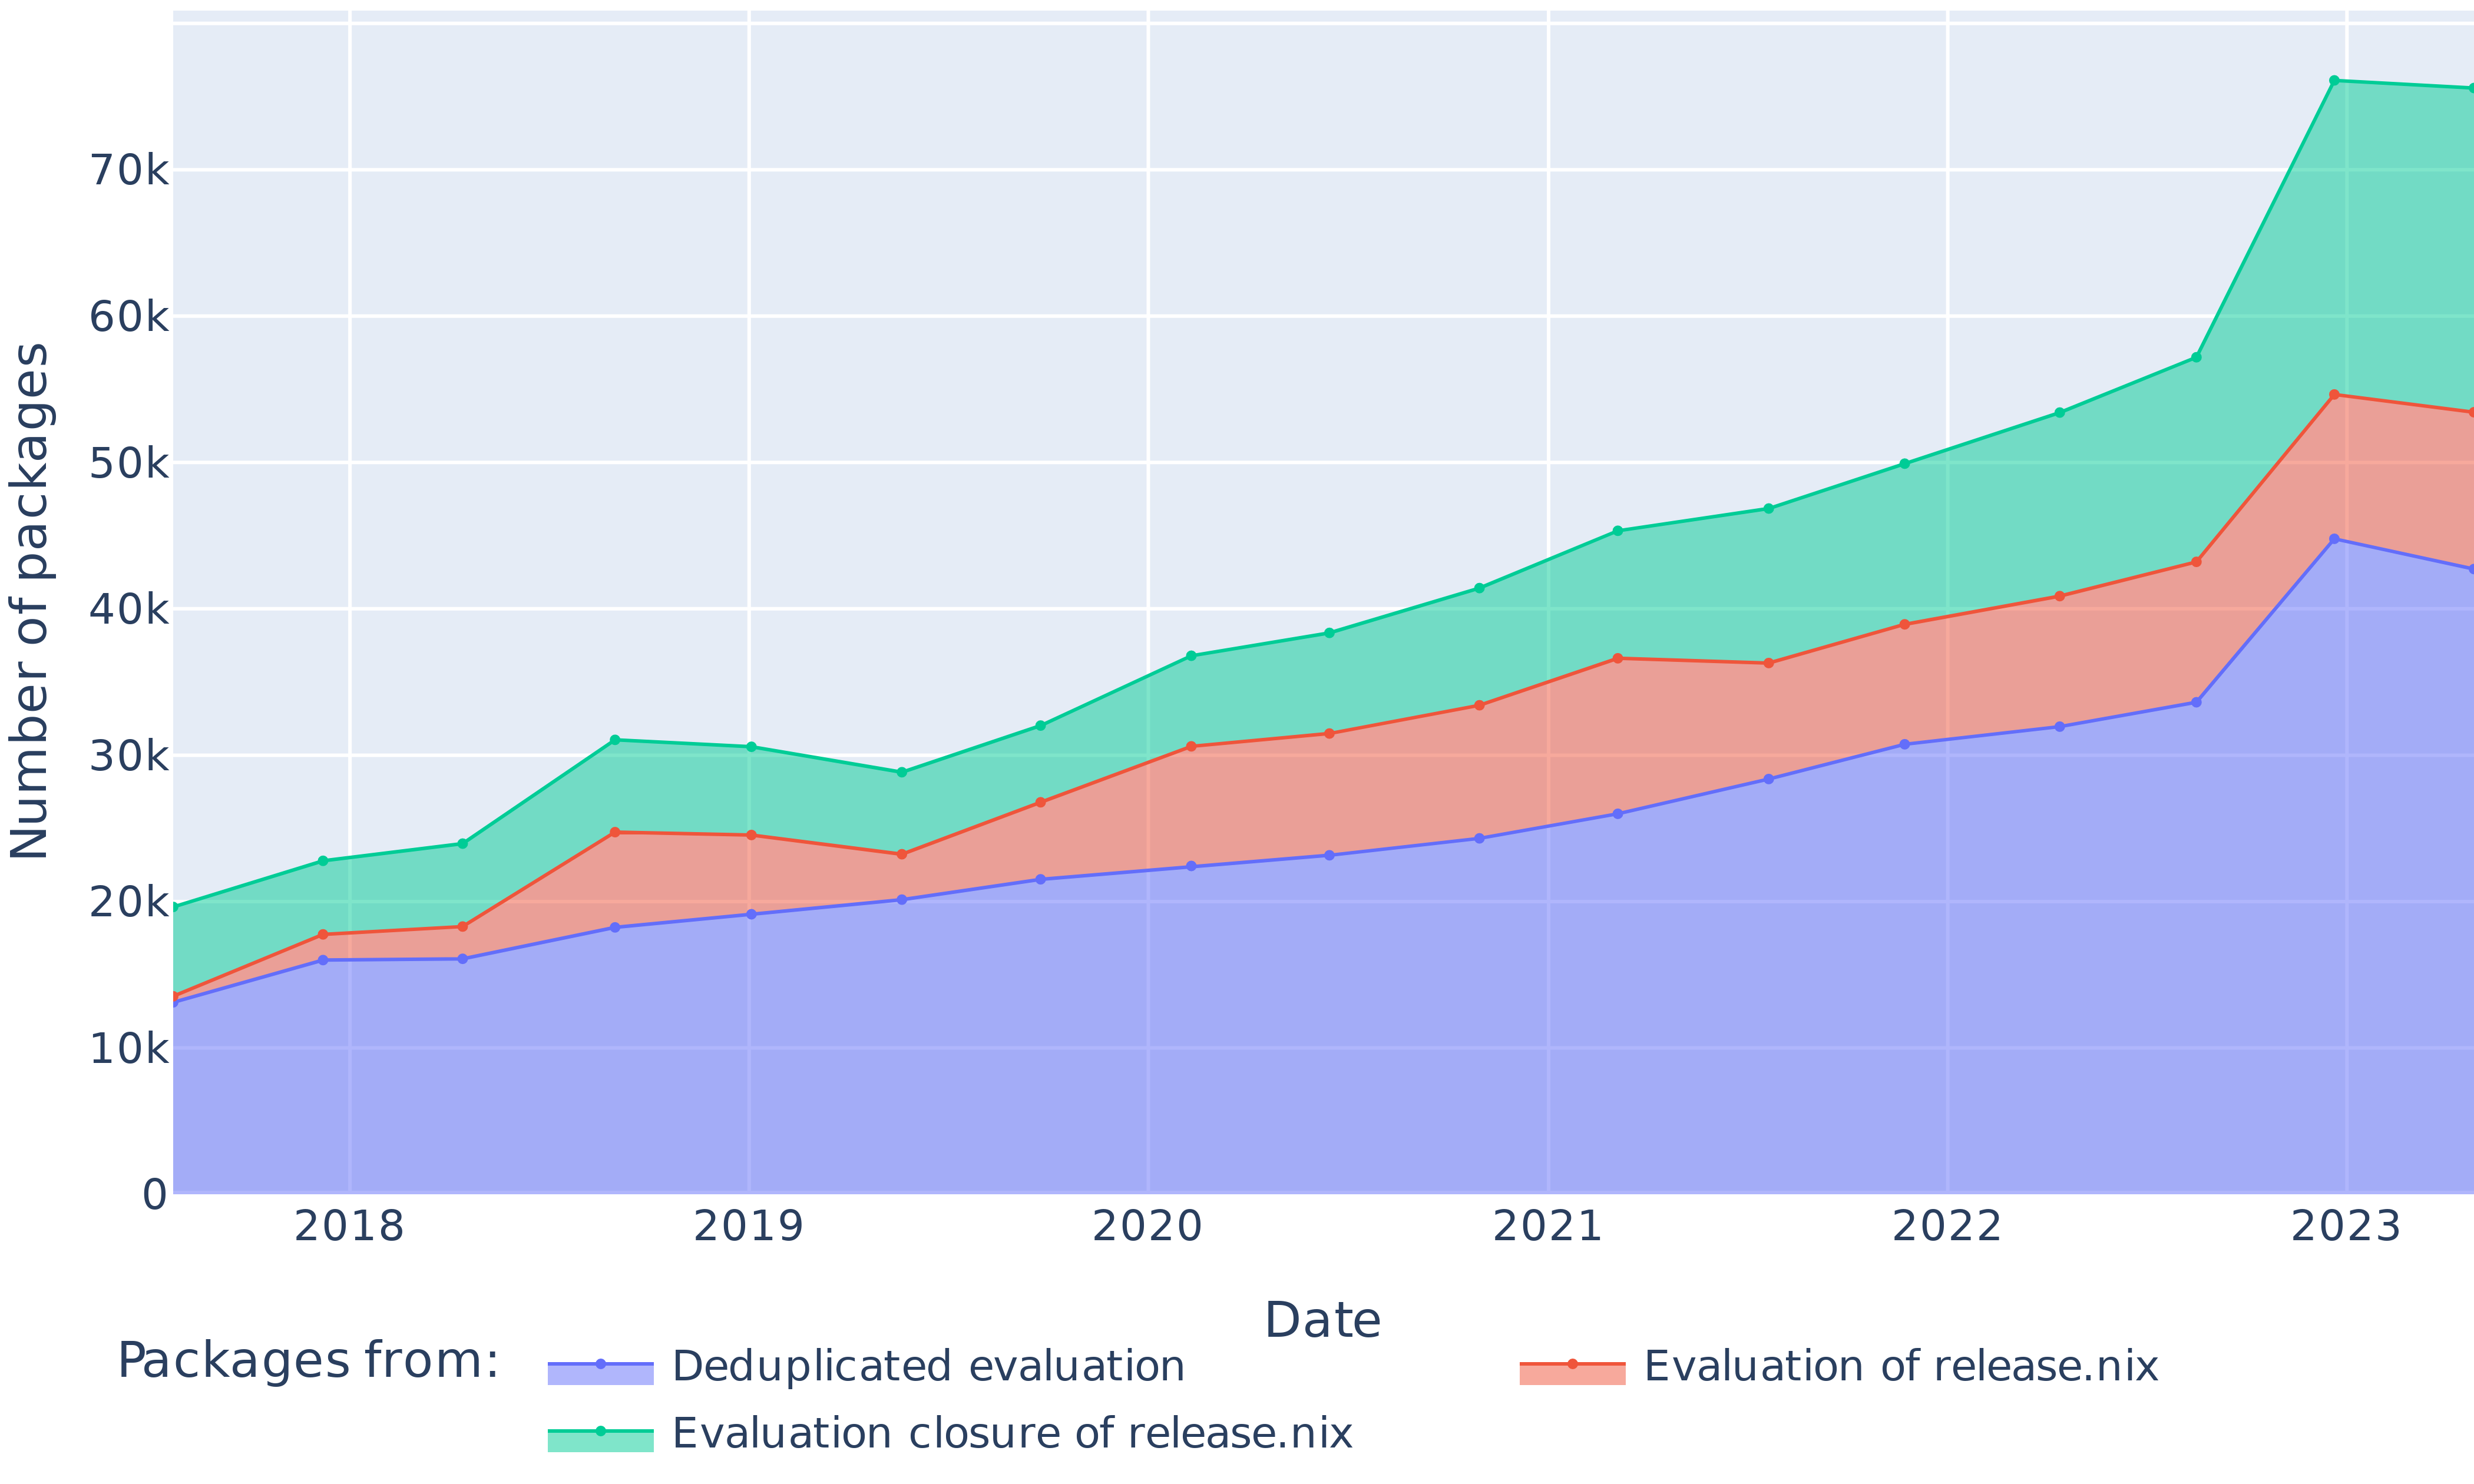
Figure 3: Evolution of the number of packages in each nixpkgs revision (as defined by release.nix), in their evaluation closure and after deduplicating ecosystem copies.
The dataset spans $709 816$ package builds coming from 17 nixpkgs revisions, built over a total of $14 296$ hours. From those builds, $548 390$ are coming directly from the release.nix file and can be tracked by name. They correspond to $58 103$ unique packages that appear over the span of sampled revisions. As can be seen on Figure 3, the number of packages listed to be built by Hydra increased from $13 527$ in 2017 to $53 432$ in 2023. Ecosystems can be present in multiple versions. On average, deduplicating packages in multiple ecosystem copies decreases their number by 21% while adding the evaluation closure of the release.nix file increases the number of jobs by 29%.
<details>
<summary>extracted/6418685/paper-images/ecosystems.png Details</summary>
### Visual Description
## Stacked Area Chart: Growth of Job Numbers Across Software Ecosystems (2018-2023)
### Overview
This is a stacked area chart illustrating the growth in the "Number of jobs" associated with various software ecosystems over a period from early 2018 to mid-2023. The chart shows a consistent upward trend in total jobs, with a particularly sharp increase occurring in 2023. Each colored band represents the contribution of a specific ecosystem to the total job count.
### Components/Axes
* **Chart Type:** Stacked Area Chart.
* **X-Axis (Horizontal):** Labeled "Date". Major tick marks denote the start of each year: 2018, 2019, 2020, 2021, 2022, 2023. Data points appear to be plotted quarterly or bi-annually.
* **Y-Axis (Vertical):** Labeled "Number of jobs". Scale ranges from 0 to 45,000 (45k), with major gridlines at 5k increments (0, 5k, 10k, 15k, 20k, 25k, 30k, 35k, 40k, 45k).
* **Legend:** Positioned at the bottom center of the chart, below the x-axis label. It lists 11 ecosystems with corresponding color swatches. The order in the legend (left to right, top to bottom) is:
1. `other ecosystems` (Light blue-purple)
2. `base` (Salmon/Red-orange)
3. `haskell` (Teal/Green)
4. `python` (Light purple)
5. `perl` (Light orange)
6. `emacsPackages` (Cyan/Light blue)
7. `vimPlugins` (Pink)
8. `lisp` (Light green)
9. `gnome` (Light pink)
10. `xorg` (Yellow)
11. `linux` (Darker blue-purple)
### Detailed Analysis
The chart is stacked, meaning the height of each colored band at a given time represents its individual contribution, and the top line represents the cumulative total. The stacking order from bottom to top is: `other ecosystems`, `base`, `haskell`, `python`, `perl`, `emacsPackages`, `vimPlugins`, `lisp`, `gnome`, `xorg`, `linux`.
**Trend Verification & Data Points (Approximate):**
* **Total Jobs (Top Line):** Shows a steady, near-linear increase from ~13k in early 2018 to ~34k by late 2022. In 2023, there is a dramatic spike, peaking at approximately 45k before a slight decline to ~43k by the chart's end.
* **Ecosystem Breakdown (Bottom to Top):**
* **`other ecosystems` (Light blue-purple):** Forms the base layer. Grows slowly and steadily from ~1k (2018) to ~5k (2023).
* **`base` (Salmon):** The largest single contributor throughout. Grows consistently from ~6.5k (2018, total ~7.5k) to ~15k (2022, total ~20k). In 2023, its contribution expands sharply to ~17k (total ~22k).
* **`haskell` (Teal):** The second-largest contributor. Grows from ~5k (2018, total ~12.5k) to ~7k (2022, total ~27k). In 2023, it expands to ~8k (total ~30k).
* **`python` (Light purple):** Shows significant growth. Starts at ~2k (2018, total ~14.5k), grows to ~4k (2022, total ~31k), and expands to ~5k in the 2023 spike (total ~35k).
* **`perl` (Light orange):** Moderate, steady growth. Contributes ~1k in 2018, ~2k in 2022, and ~2.5k during the 2023 peak.
* **`emacsPackages` (Cyan):** Similar growth pattern to perl. Contributes ~0.5k in 2018, ~1.5k in 2022, and ~2k in the 2023 spike.
* **`vimPlugins` (Pink):** Shows a very sharp increase in 2023. Was a thin band (~0.5k) for years, but during the 2023 spike, its contribution expands dramatically to ~4k.
* **`lisp` (Light green):** Also shows a dramatic 2023 expansion. Was minimal (~0.2k) pre-2023, but during the spike, it becomes a major contributor, adding ~4k.
* **`gnome` (Light pink), `xorg` (Yellow), `linux` (Darker blue-purple):** These form the top three thin bands. Their individual contributions remain relatively small and stable (each <1k) throughout the period, with slight increases visible during the 2023 total spike.
### Key Observations
1. **Dominant Ecosystems:** The `base` and `haskell` ecosystems are the foundational and largest contributors to job numbers throughout the entire period.
2. **Steady Growth Phase (2018-2022):** All ecosystems show gradual, consistent growth, leading to a total job count that more than doubled from ~13k to ~34k.
3. **2023 Anomaly/Surge:** There is a pronounced, simultaneous expansion in the contribution of nearly all ecosystems in 2023, causing the total to jump from ~34k to a peak of ~45k. This surge is most visually dramatic for `vimPlugins` and `lisp`, which transition from minor to major contributors in this short period.
4. **Stacking Clarity:** The chart effectively shows both the total growth and the changing composition of that total over time.
### Interpretation
This chart likely visualizes data from a package repository or job market platform tracking software development activity. The "Number of jobs" probably refers to build jobs, dependency resolution tasks, or job postings requiring specific ecosystem skills.
* **What the data suggests:** The consistent growth from 2018-2022 indicates a healthy, expanding overall ecosystem. The dramatic 2023 spike is the most significant feature. It could represent:
* A major platform or repository update that reclassified or massively increased the count of certain package types (especially `vimPlugins` and `lisp`).
* A viral trend or technological shift that caused a sudden, massive influx of activity or job demand in those specific areas.
* A change in data collection methodology.
* **Relationships:** The stacked nature shows that growth is broad-based; no single ecosystem is solely responsible for the overall trend. However, the `base` ecosystem acts as the stable core, while others like `python`, `vimPlugins`, and `lisp` show more variable, explosive growth potential.
* **Anomalies:** The 2023 spike is the primary anomaly. The near-simultaneous surge across disparate ecosystems (`vimPlugins`, `lisp`, `emacsPackages`) suggests a systemic cause rather than independent, coincidental growth. The slight decline after the peak in 2023 may indicate the initial surge stabilizing.
</details>
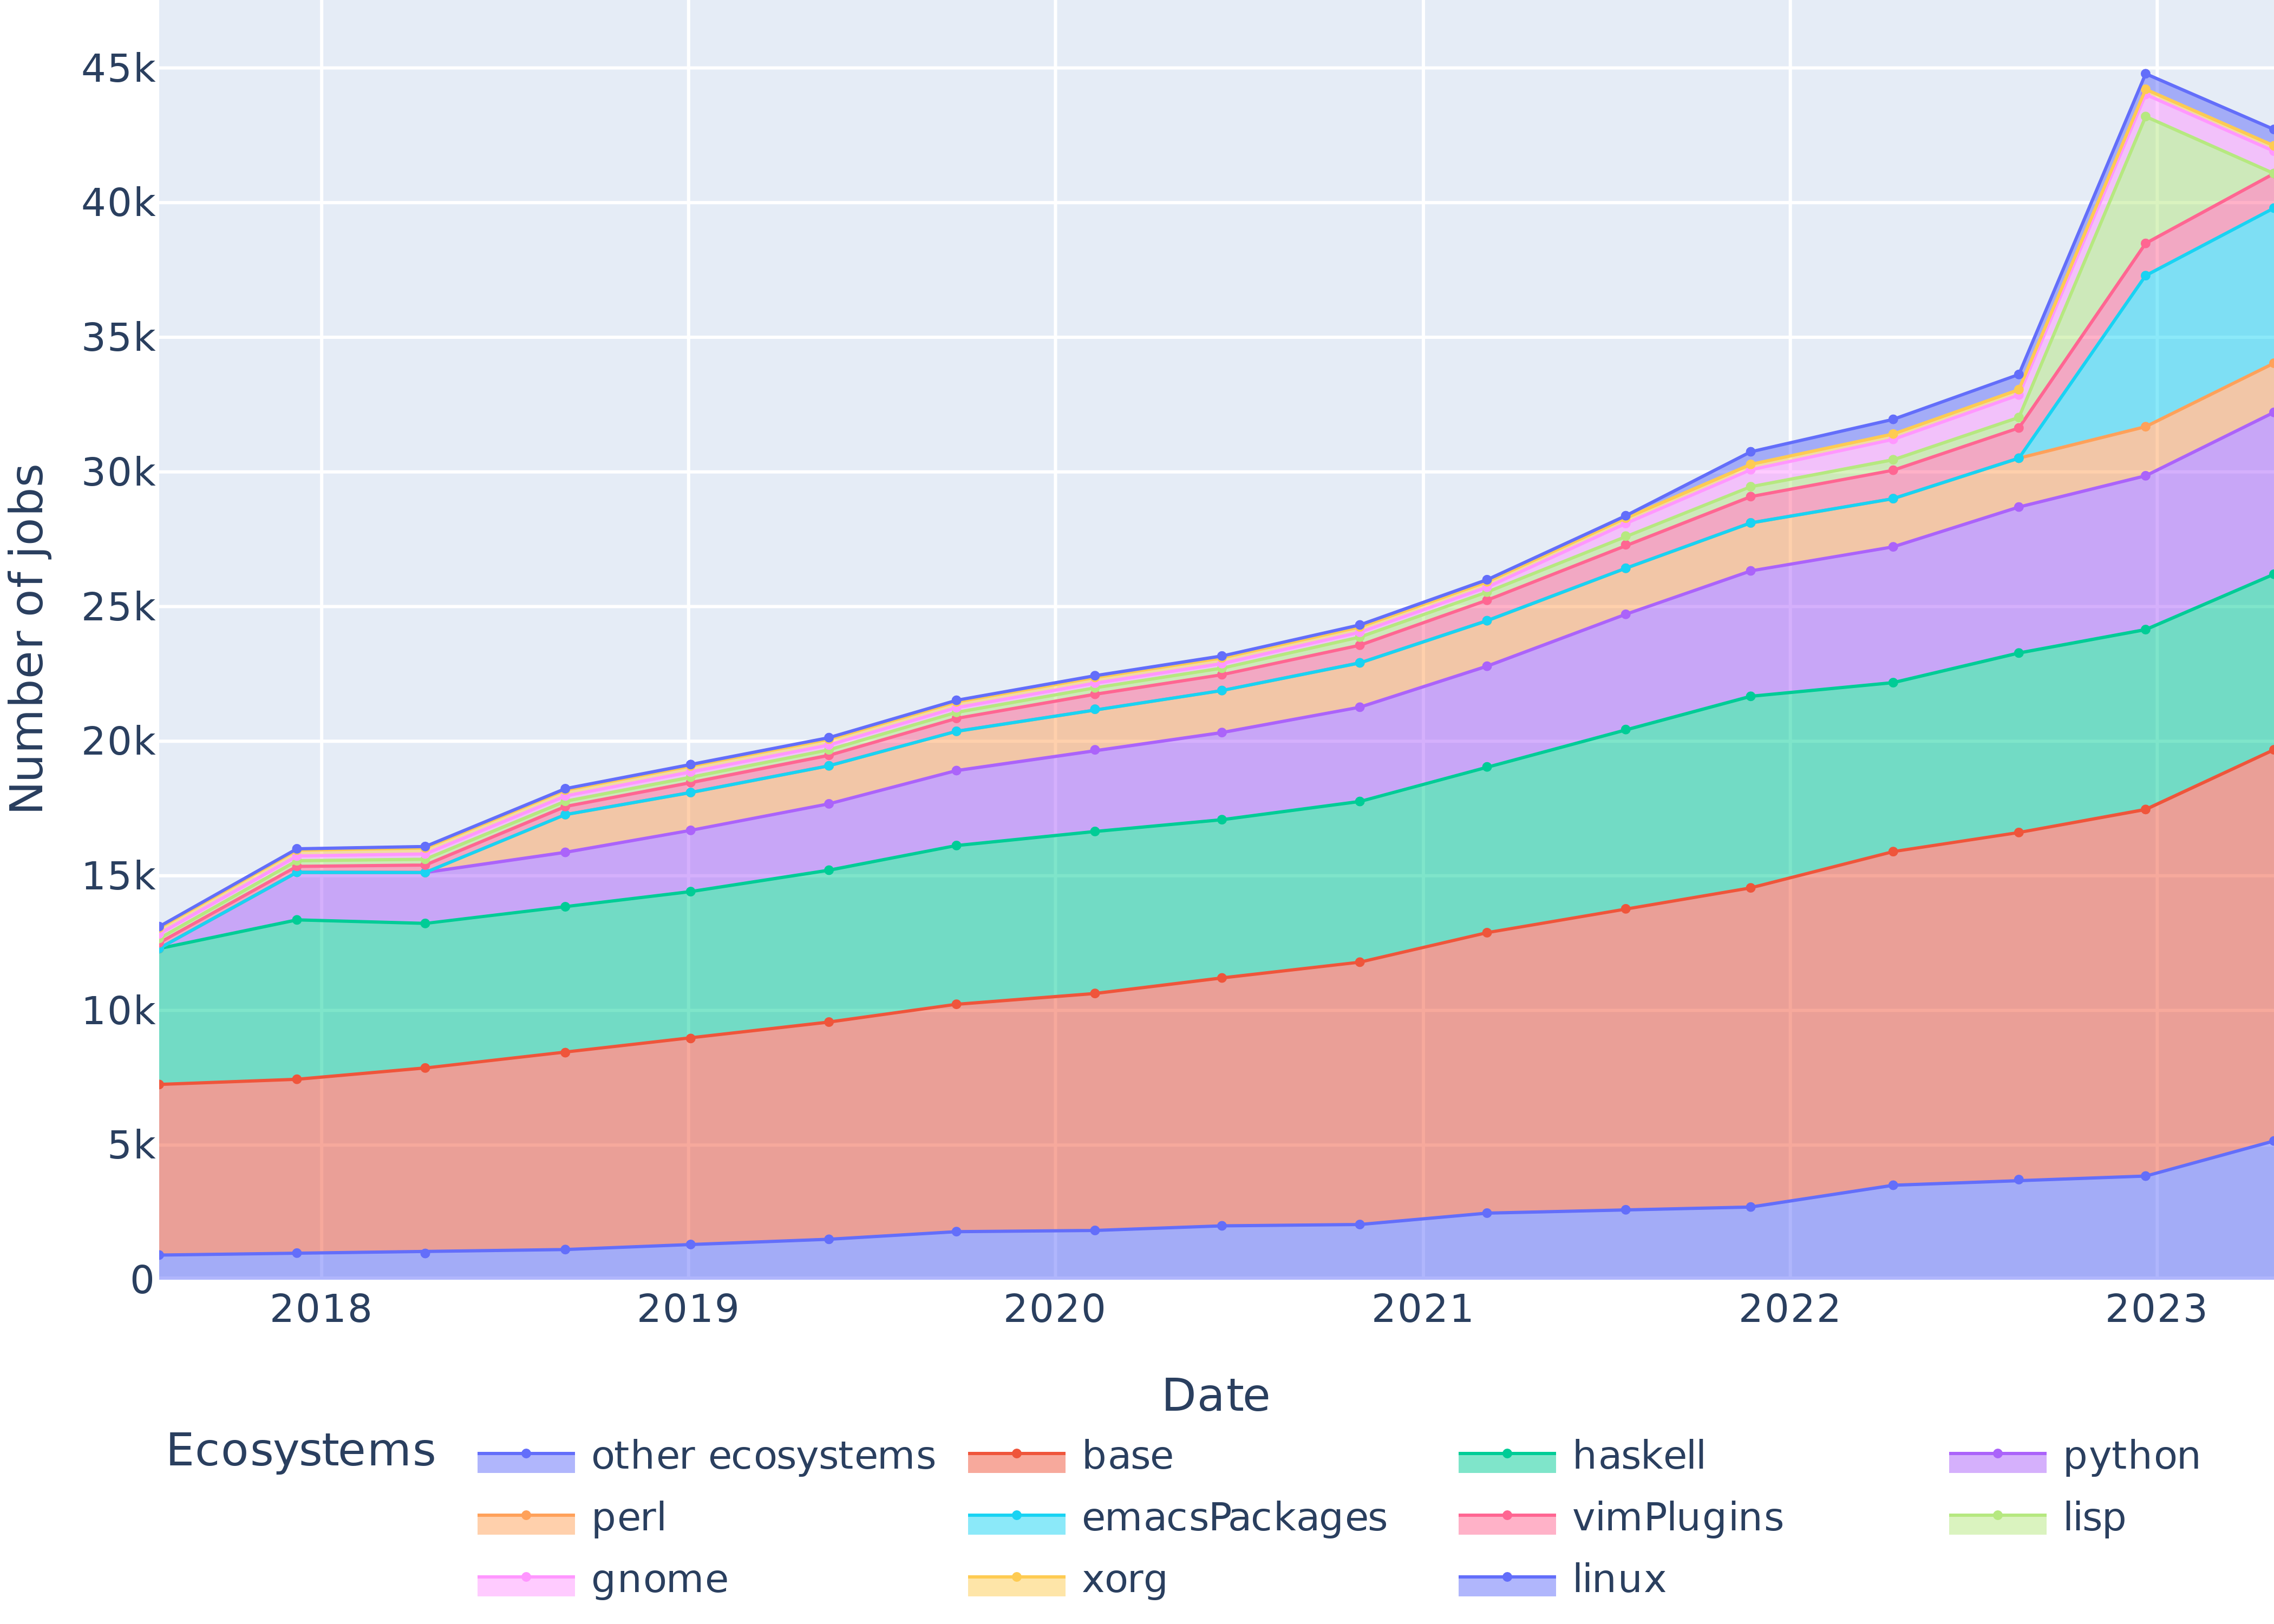
Figure 4: Evolution of the size of the nine most popular software ecosystems in nixpkgs, the packages whose ecosystem is undetermined (base), and the packages from other ecosystems (only packages listed in release.nix).
Figure 4 shows the evolution of the top 9 ecosystem sizes in nixpkgs, plus the base namespace. 61.7% of packages belong to an ecosystem, while the rest live in nixpkgs base namespace. The three largest ecosystems are Haskell, Python and Perl, which together account for 42.4% of the packages.
<details>
<summary>extracted/6418685/paper-images/strates.png Details</summary>
### Visual Description
## Stacked Area Chart: Number of Jobs by Package Introduction Revision (2018-2023)
### Overview
This is a stacked area chart tracking the "Number of jobs" over time, from 2018 to 2023. The chart visualizes how the total volume of jobs is composed of contributions from various software packages, each introduced in a specific revision. The overall trend shows a steady increase in total jobs from 2018 to 2022, followed by a dramatic spike in 2023.
### Components/Axes
* **X-Axis (Horizontal):** Labeled "Date". Major tick marks represent years: 2018, 2019, 2020, 2021, 2022, 2023.
* **Y-Axis (Vertical):** Labeled "Number of jobs". Scale ranges from 0 to 45,000 (45k), with increments of 5,000 (5k).
* **Legend:** Positioned at the bottom of the chart, titled "Packages introduced in revision:". It lists 17 distinct packages, each associated with a unique color and a revision number. The legend is organized into three columns.
* **Column 1:** 1377834 (light blue), 1476353 (light purple), 1544614 (pink), 1622813 (yellow), 1724521 (green), 1787891 (cyan).
* **Column 2:** 1416607 (salmon), 1498441 (light orange), 1569427 (light green), 1653283 (medium blue), 1755200 (medium purple), 1794205 (medium pink).
* **Column 3:** 1448353 (teal), 1520586 (light cyan), 1593430 (light pink), 1687868 (dark orange), 1776404 (peach).
### Detailed Analysis
The chart displays 17 stacked layers, each representing the job count attributable to a package from a specific revision. The layers are stacked from bottom to top. The approximate total job count and the trend for each package are as follows:
**Total Job Count Trend:**
* **2018:** ~16,000
* **2019:** ~19,000
* **2020:** ~22,000
* **2021:** ~26,000
* **2022:** ~31,000
* **2023:** ~45,000 (sharp increase)
**Package-Specific Trends (from bottom layer upward):**
1. **1377834 (Light Blue):** The foundational layer. Shows a steady decline from ~13,000 jobs in 2018 to ~9,000 in 2023.
2. **1476353 (Light Purple):** Sits above the blue layer. Also declines, from ~3,000 to ~2,000 jobs.
3. **1544614 (Pink):** Relatively stable band, contributing approximately 2,000 jobs throughout the period.
4. **1622813 (Yellow):** Shows moderate growth, increasing from ~1,000 to ~2,000 jobs.
5. **1724521 (Green):** Demonstrates clear growth, expanding from ~1,000 to ~3,000 jobs.
6. **1787891 (Cyan):** **The most significant layer.** Shows a dramatic, sharp spike in 2023. It grows from ~1,000 jobs in 2018 to an estimated ~4,000+ jobs in 2023, driving the overall total spike.
7. **1498441 (Light Orange) through 1776404 (Peach):** The remaining 11 layers (1498441, 1569427, 1653283, 1755200, 1794205, 1448353, 1520586, 1593430, 1687868, 1776404) collectively form the upper portion of the stack. Each individually contributes a smaller, growing share, typically increasing from a few hundred jobs in 2018 to approximately 1,000-2,000 jobs each by 2023. Their combined growth adds significantly to the total.
### Key Observations
1. **Dominant Growth Driver:** The package from revision **1787891 (cyan)** is the primary outlier, responsible for the disproportionate surge in total jobs in 2023.
2. **Base Layer Decline:** The two earliest packages (1377834, 1476353) show a consistent downward trend, suggesting they are being phased out or superseded.
3. **Broad-Based Growth:** From 2020 onward, nearly all packages introduced in later revisions (from 1569427 onward) show positive growth trends, indicating a diversifying and expanding ecosystem.
4. **Compositional Shift:** The chart illustrates a clear shift in composition. In 2018, the job count was dominated by the earliest packages (1377834, 1476353). By 2023, the contribution is much more distributed across a larger number of newer packages, with 1787891 becoming a major component.
### Interpretation
This chart likely represents the adoption and usage lifecycle of software packages within a specific ecosystem (e.g., a programming language repository, a cloud platform, or an internal toolchain). The "Number of jobs" could refer to computational tasks, build jobs, or deployment instances that depend on these packages.
The data suggests a healthy, evolving system:
* **Innovation and Adoption:** The consistent introduction of new packages (each tied to a revision number) and their subsequent growth in job count indicates active development and user adoption of new tools and libraries.
* **Technology Migration:** The decline of the earliest packages is a natural part of technology evolution, where older solutions are gradually replaced by newer, more efficient, or more feature-rich alternatives.
* **Potential Major Event in 2023:** The explosive growth of package 1787891 in 2023 is the most notable anomaly. This could correspond to a major version release, a critical security update that forced widespread migration, the package becoming a de facto standard for a new popular framework, or integration into a high-volume automated process. The spike is so pronounced it may warrant investigation into the specific events surrounding revision 1787891.
* **Ecosystem Health:** The overall upward trend in total jobs, coupled with the diversification across many packages, points to an expanding user base or increasing intensity of usage within the ecosystem.
</details>
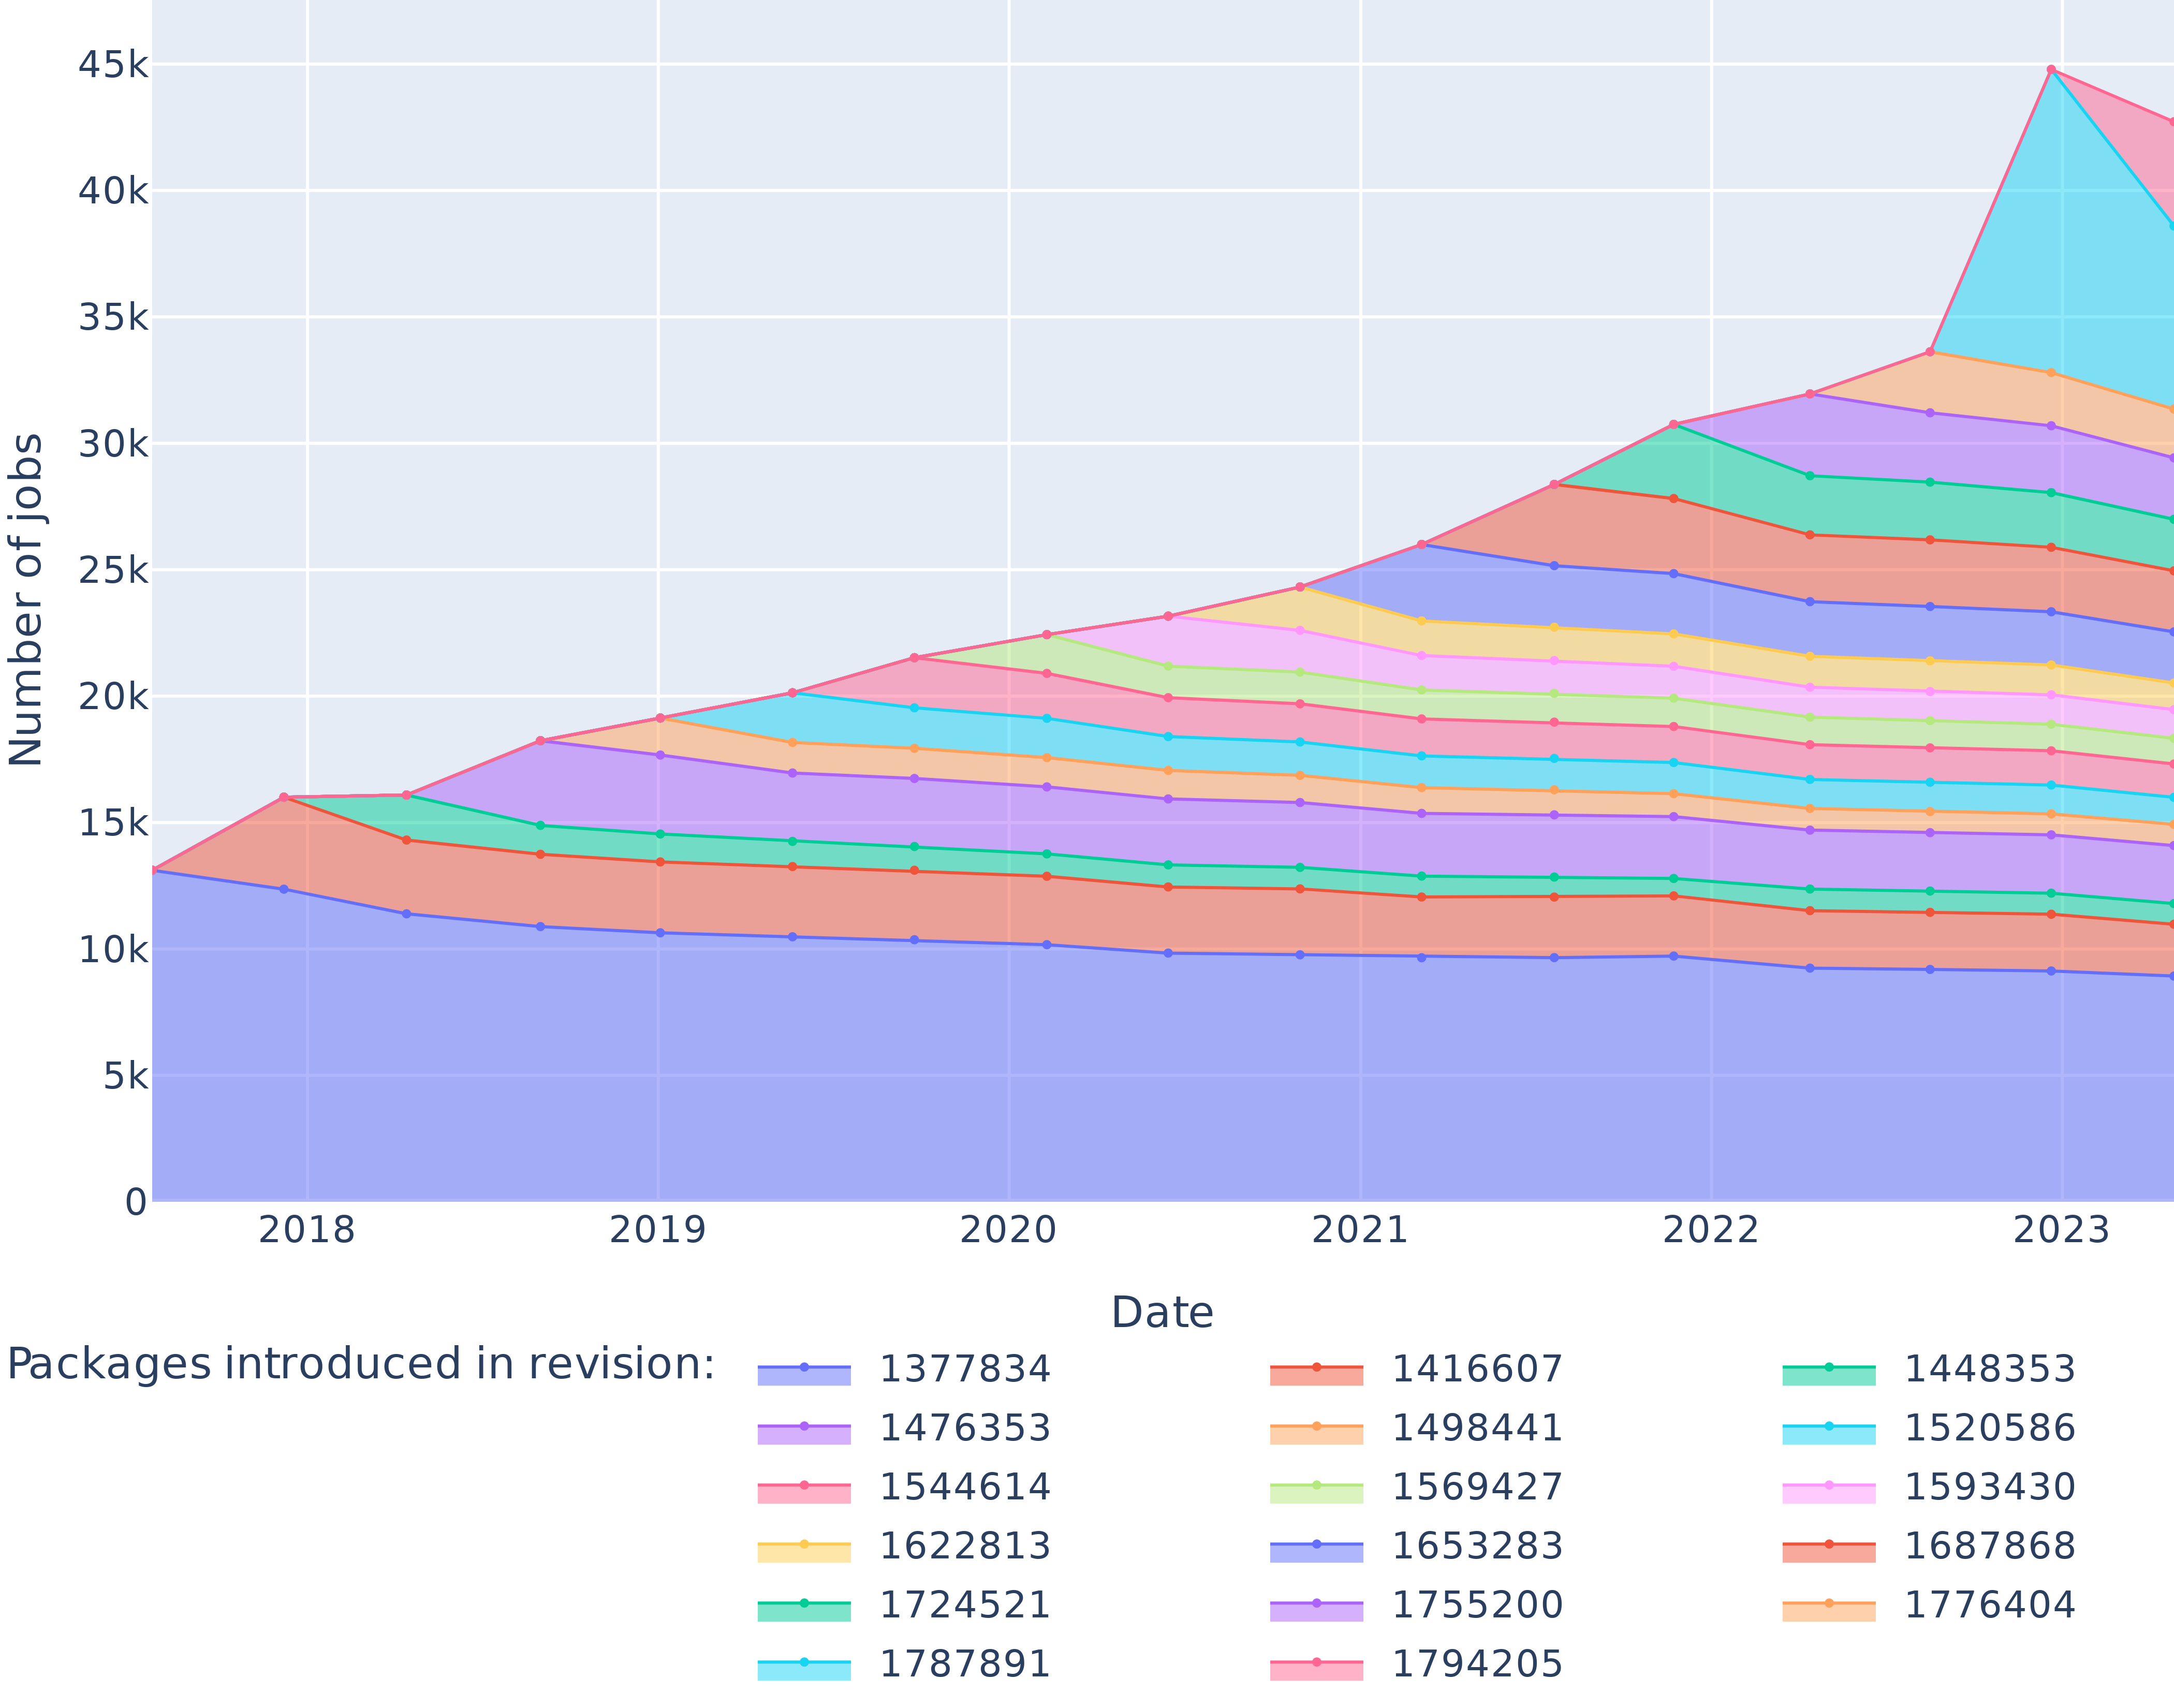
Figure 5: Number of packages introduced by every revision of the dataset and their survival in the package set over time.
Figure 5 outlines the number of packages introduced in the dataset by each revision, and their survival over time. In particular, as of July 2017 the package set contained $13 114$ elements, $8929$ of which were still present in April 2023.
## VI Results
We present our experimental results below, organized by research question. Their discussion is provided later, in Section VII.
### VI-A RQ0: Does Nix allow rebuilding past packages reliably (even if not bitwise reproducibly)?
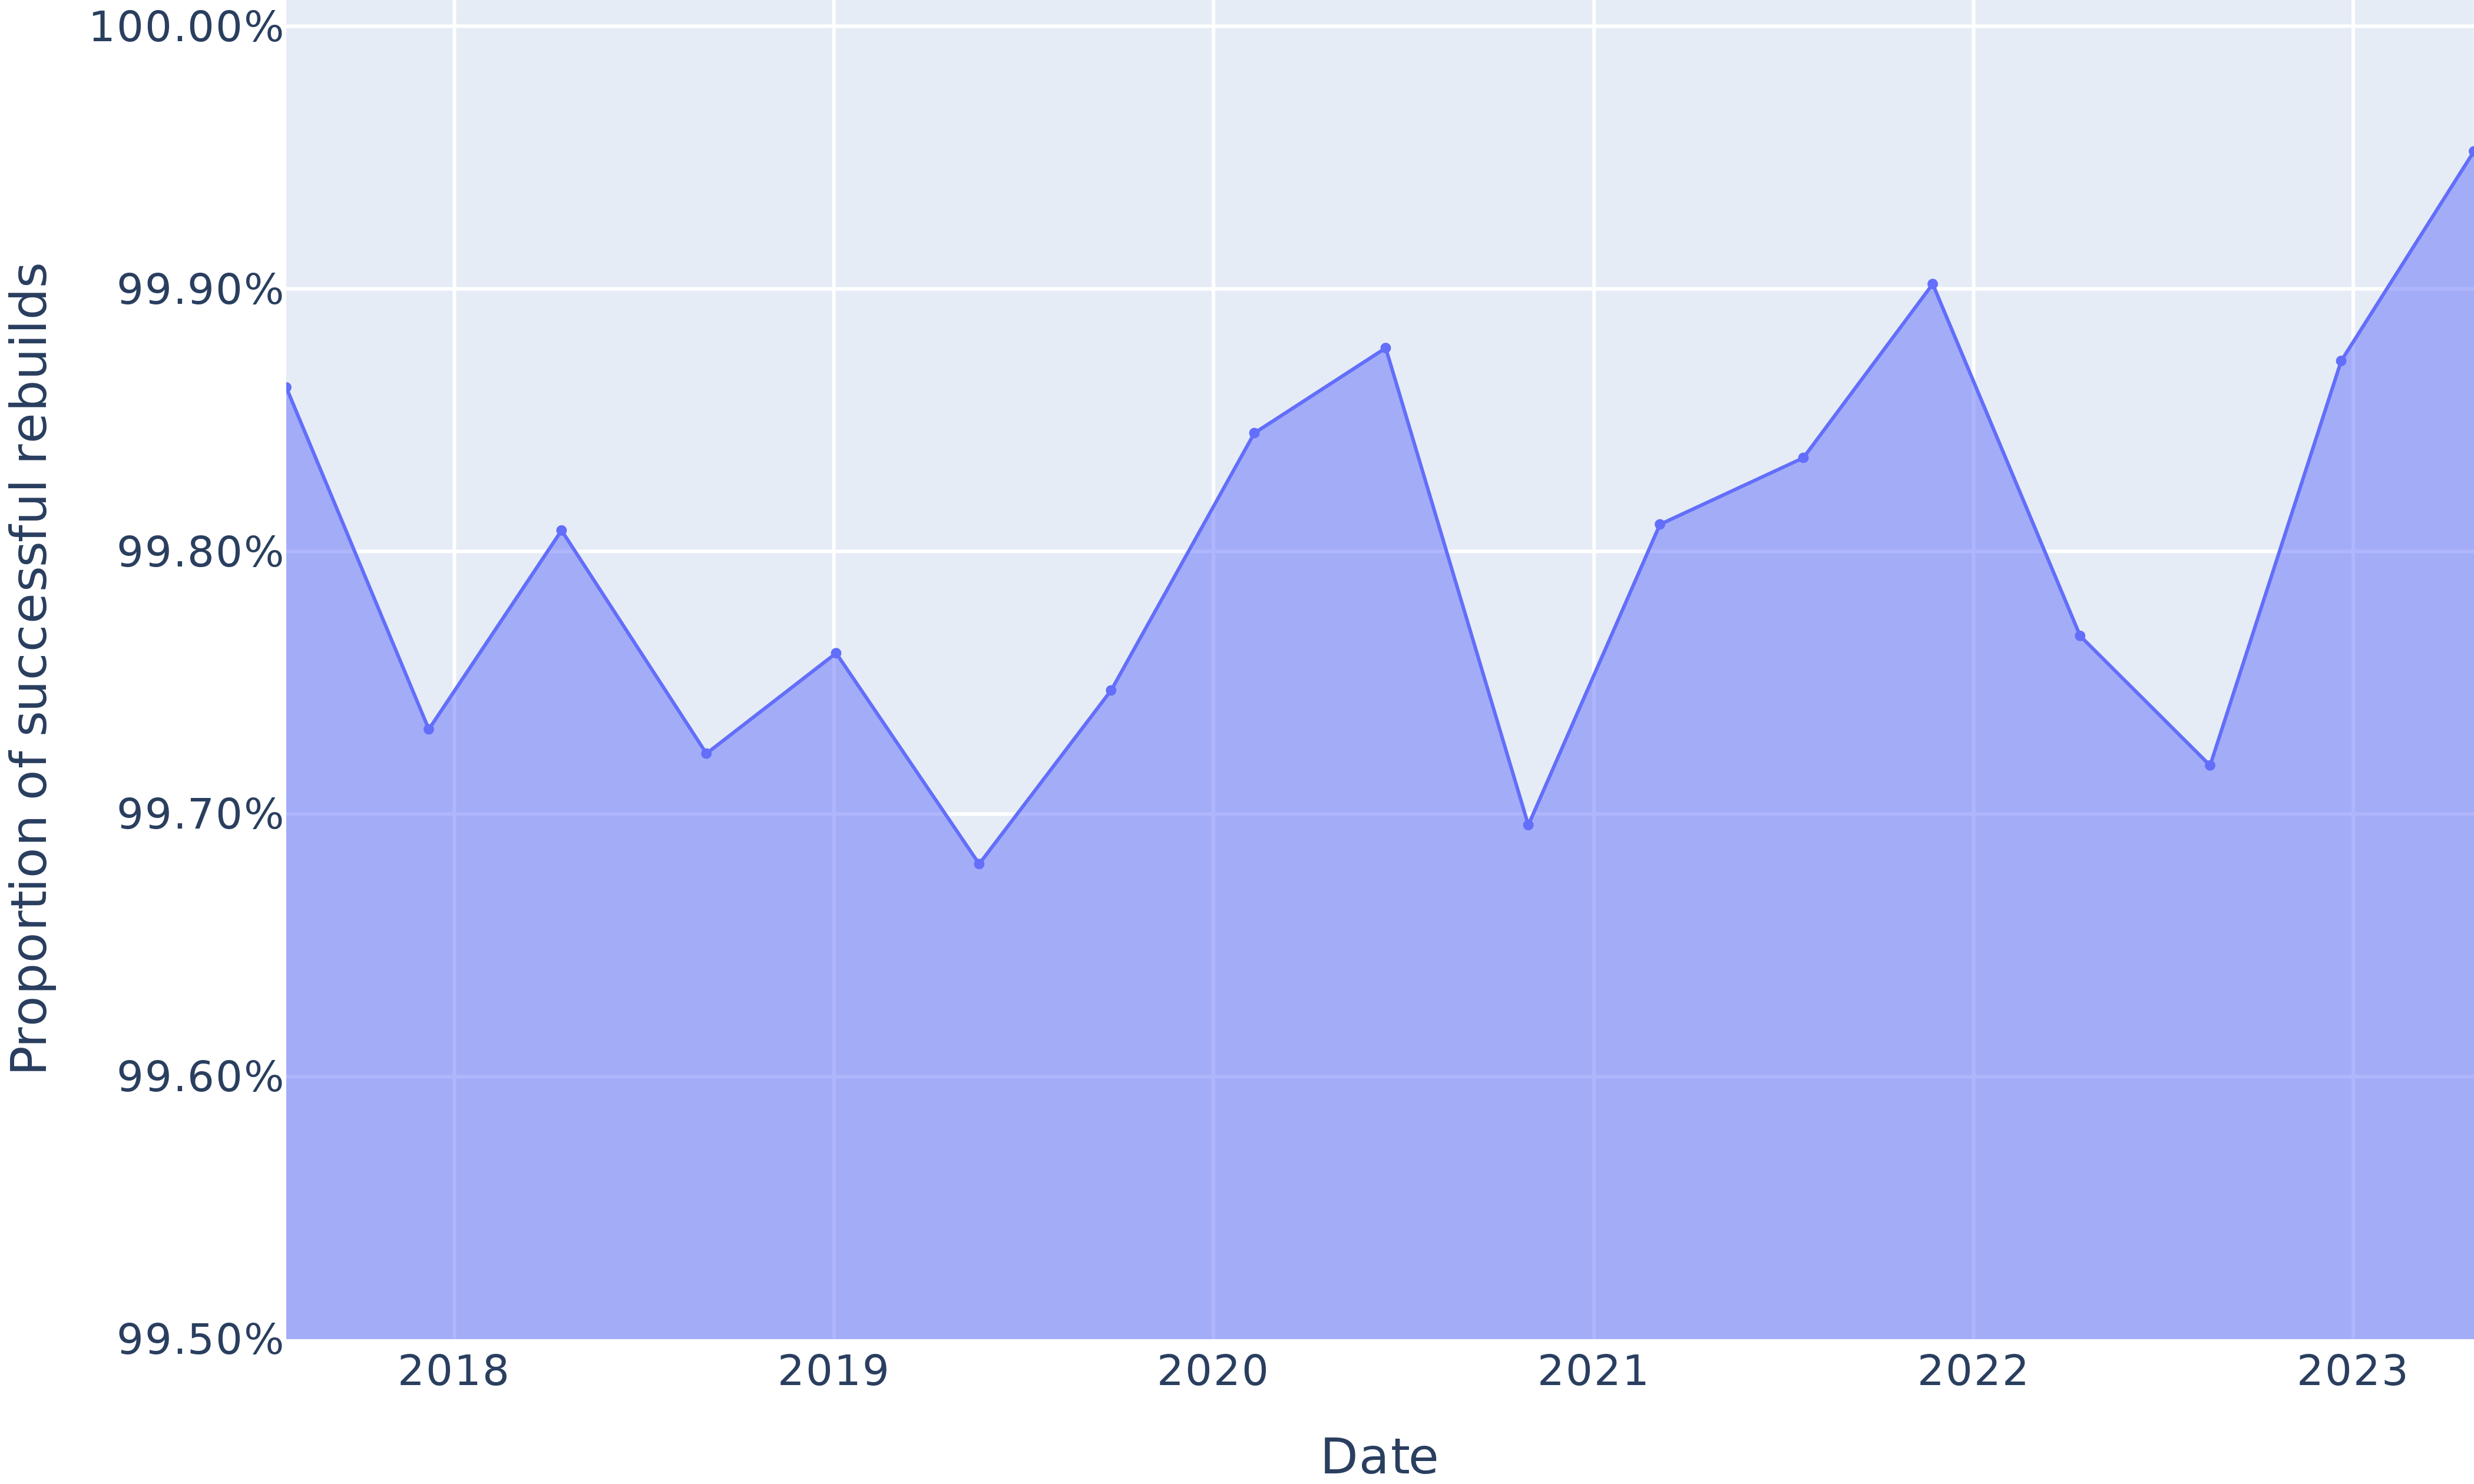
This research question aims to reproduce the results from Malka et al. [malka_reproducibility_2024], as a starting baseline. That earlier work only built one nixpkgs revision, the most ancient in their dataset; in our case, we rebuilt that revision alongside with 16 others, evenly spaced over time to study trends. Figure 6 shows the proportion of packages between 2017 and 2023 that we successfully rebuilt (not necessarily in a bitwise reproducible manner, merely “successfully built” for this RQ).
This proportion varies between 99.68% and 99.95%, confirming previously reported findings: Nix reproducibility of build environments allows for very high rebuildability rate over time. Note that this is not an exact replication of the revision in [malka_reproducibility_2024], because we also included packages not explicitly listed in release.nix, but present in the dependency graph, whereas they did not.
<details>
<summary>extracted/6418685/paper-images/rebuildability.png Details</summary>
### Visual Description
## Area Chart: Proportion of Successful Rebuilds Over Time
### Overview
This is a time-series area chart displaying the proportion of successful rebuilds from early 2018 to late 2023. The chart shows a single data series with a high overall success rate, fluctuating within a narrow band between approximately 99.68% and 99.95%. The area below the line is filled with a light blue color.
### Components/Axes
* **Chart Type:** Area Chart (Line chart with filled area below).
* **X-Axis (Horizontal):**
* **Label:** "Date"
* **Scale:** Time-based, with major tick marks labeled for the years: 2018, 2019, 2020, 2021, 2022, 2023.
* **Range:** Spans from before the "2018" label to after the "2023" label.
* **Y-Axis (Vertical):**
* **Label:** "Proportion of successful rebuilds"
* **Scale:** Percentage, with major grid lines and labels at: 99.50%, 99.60%, 99.70%, 99.80%, 99.90%, 100.00%.
* **Range:** 99.50% to 100.00%.
* **Data Series:**
* **Visual Representation:** A single, continuous blue line connecting data points, with the area beneath it filled in a lighter shade of blue.
* **Legend:** Not present, as there is only one data series.
* **Grid:** A light gray grid is present, with horizontal lines at each labeled Y-axis percentage and vertical lines at each labeled year.
### Detailed Analysis
**Trend Verification:** The line exhibits a volatile, saw-tooth pattern with no single sustained direction. It repeatedly rises and falls within its high-percentage range.
**Data Point Extraction (Approximate Values):**
* **Start of 2018:** ~99.86%
* **Mid-2018:** Dips to ~99.73%
* **Late 2018/Early 2019:** Peaks at ~99.81%
* **Mid-2019:** Dips to ~99.72%
* **Late 2019:** Rises to ~99.76%
* **Early 2020:** Reaches a local low of ~99.68%
* **Mid-2020:** Rises to ~99.75%
* **Late 2020:** Peaks at ~99.88%
* **Early 2021:** Drops sharply to a local low of ~99.70%
* **Mid-2021:** Recovers to ~99.81%
* **Late 2021:** Rises to ~99.84%
* **Early 2022:** Reaches a significant peak at ~99.90%
* **Mid-2022:** Falls to ~99.77%
* **Late 2022:** Dips to ~99.72%
* **Early 2023:** Rises sharply to ~99.88%
* **End of 2023 (Chart Edge):** Reaches the highest visible point, approximately ~99.95%.
### Key Observations
1. **High Baseline Performance:** The proportion of successful rebuilds never falls below ~99.68%, indicating an extremely reliable process.
2. **Cyclical Volatility:** The data shows a repeating pattern of peaks and troughs, suggesting periodic fluctuations in success rates, possibly due to seasonal factors, system updates, or changes in workload.
3. **Notable Peaks:** The highest points occur in late 2020 (~99.88%), early 2022 (~99.90%), and at the end of the series in late 2023 (~99.95%).
4. **Notable Troughs:** The lowest points are in early 2020 (~99.68%) and early 2021 (~99.70%).
5. **Recent Upward Trend:** The final segment from late 2022 to late 2023 shows a strong and sustained upward trajectory, culminating in the highest value on the chart.
### Interpretation
The chart demonstrates a system or process that maintains an exceptionally high level of reliability, with success rates consistently above 99.6%. The "Proportion of successful rebuilds" metric is likely a key performance indicator (KPI) for a technical infrastructure, software deployment pipeline, or manufacturing process.
The observed volatility is the most significant feature. While the baseline is excellent, the regular dips indicate that the process is not perfectly stable. These fluctuations could be investigated to identify root causes—such as specific software releases, infrastructure changes, or increased load periods—that temporarily reduce success rates. The strong recovery and new peak at the end of 2023 suggest that recent improvements or optimizations have been highly effective, pushing the process to its best performance level within the observed timeframe. The narrow Y-axis scale (99.5% to 100%) visually amplifies these small absolute changes, which is appropriate for monitoring a high-reliability system where even a 0.1% change is meaningful.
</details>
Figure 6: Proportion of rebuildable packages over time.
### VI-B RQ1: What is the evolution of bitwise reproducible packages in nixpkgs between 2017 and 2023?
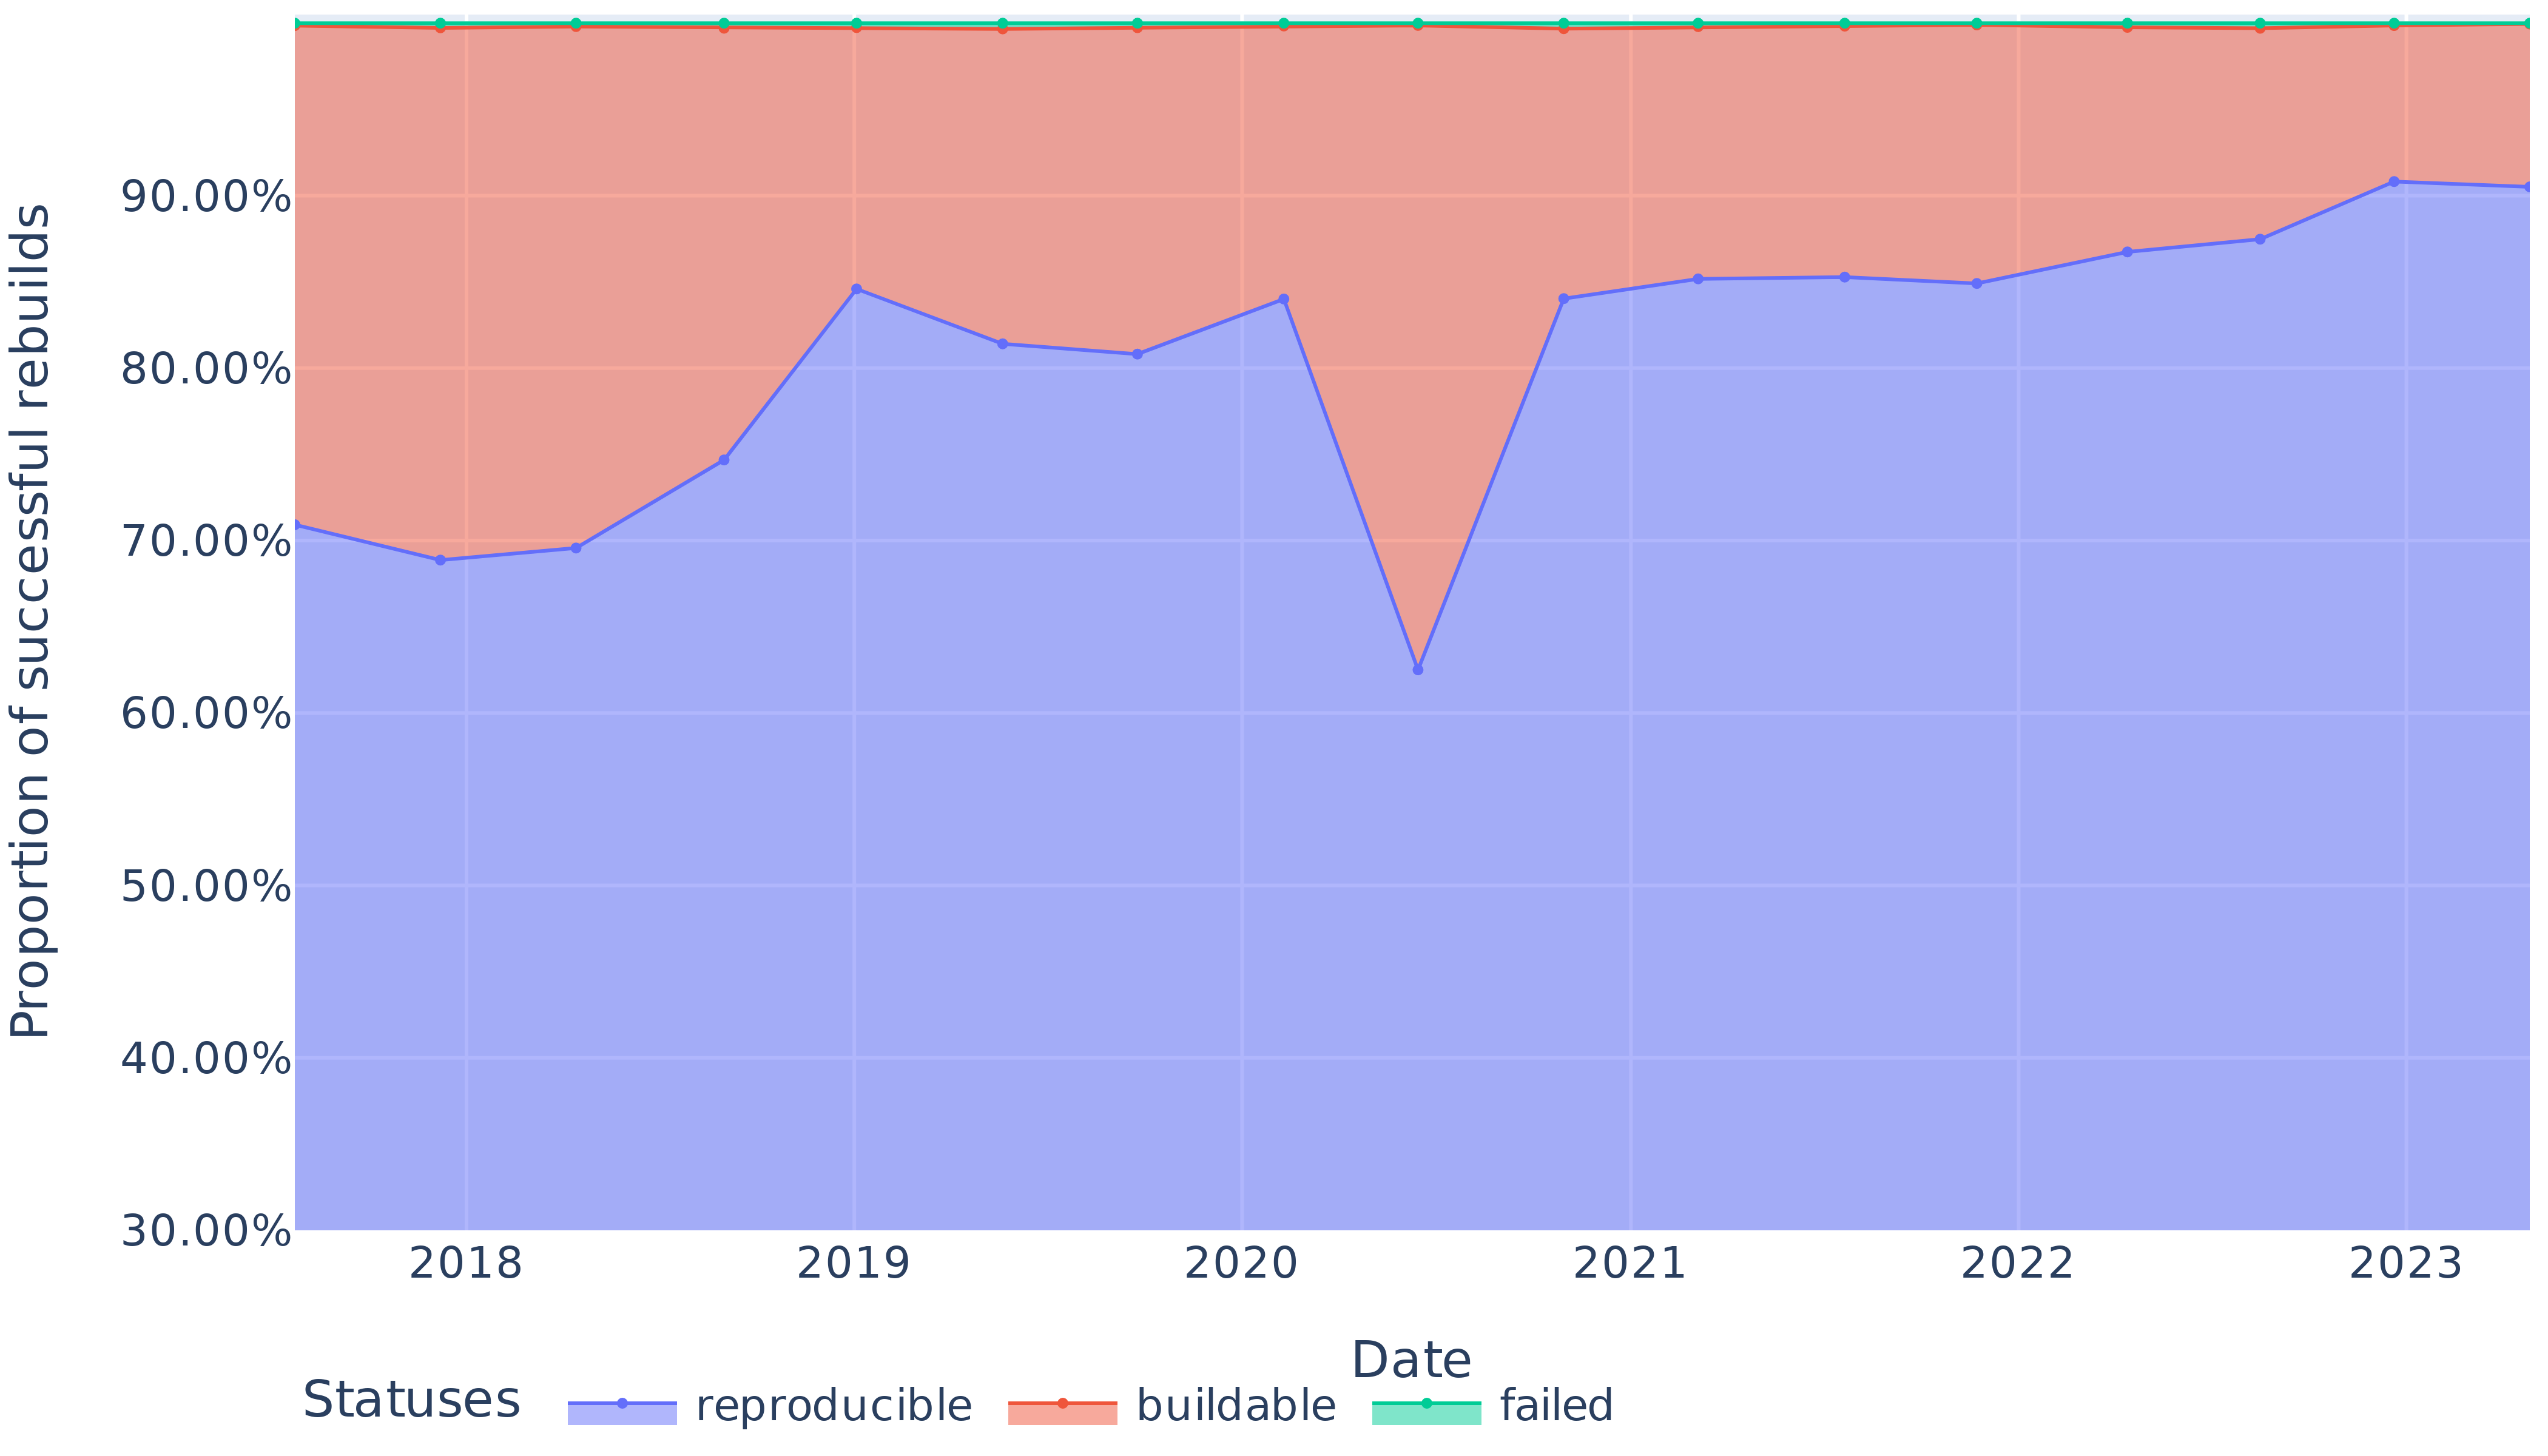
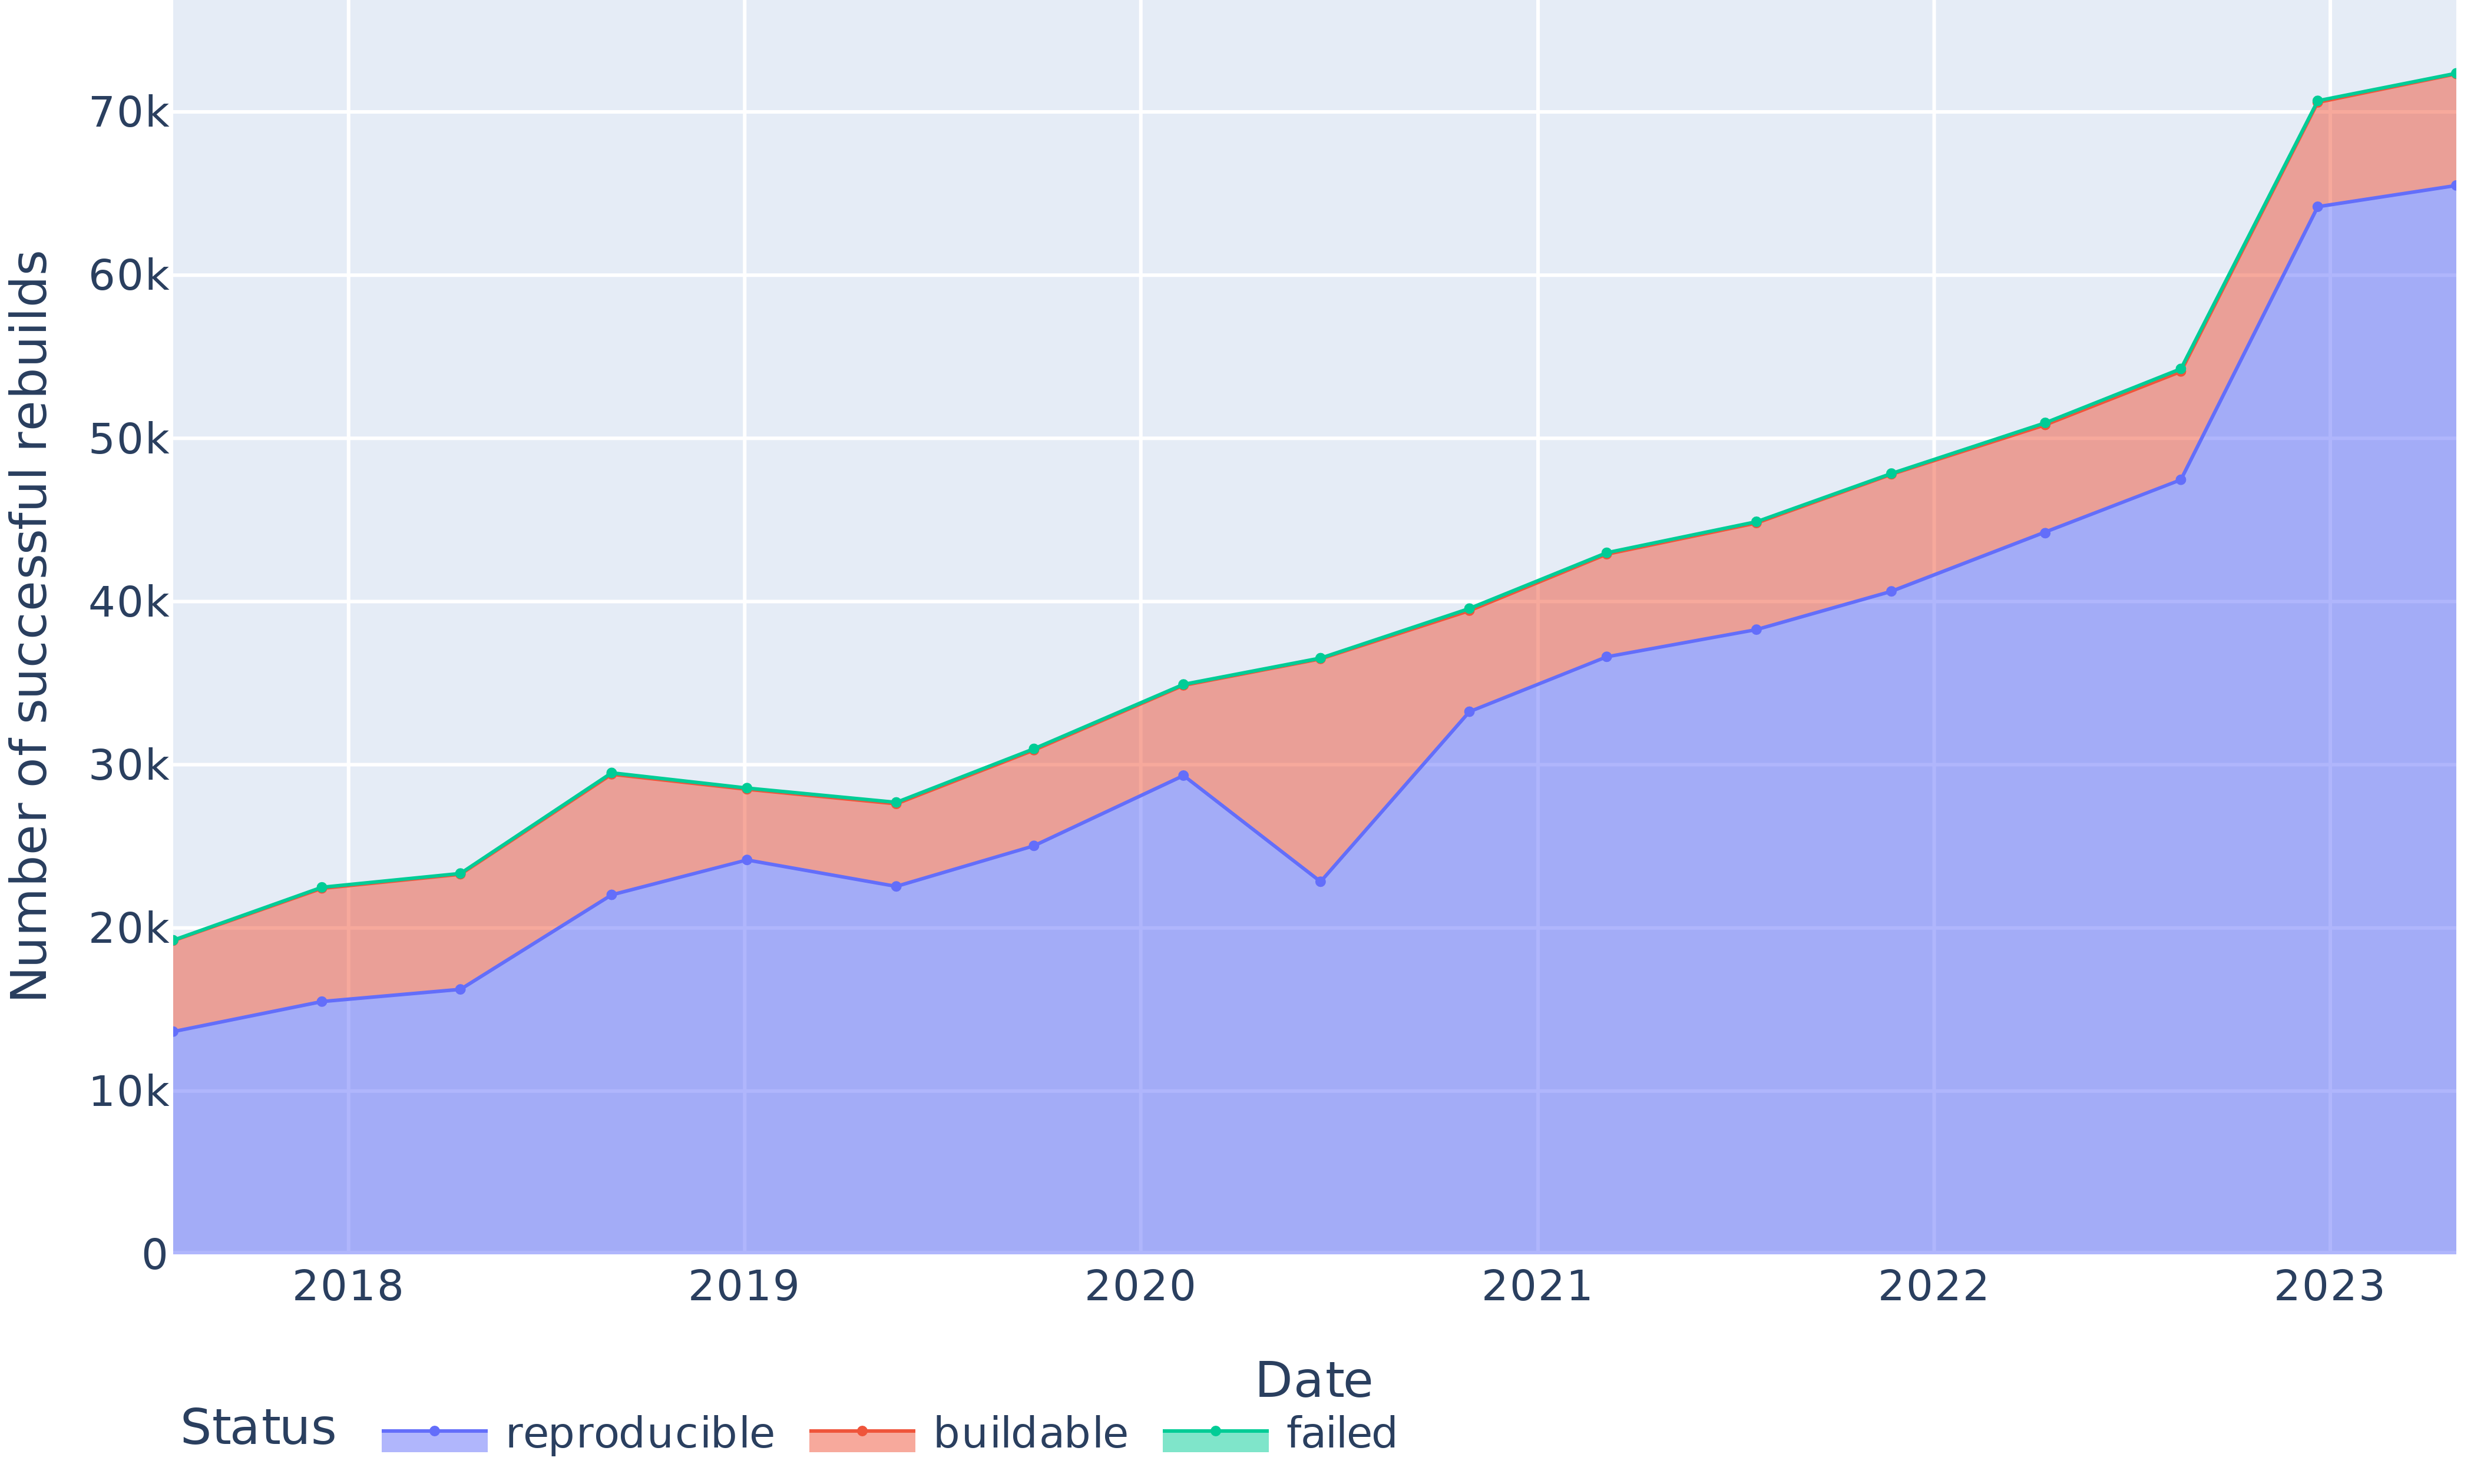
Apart from a significant regression in 2020, we obtain bitwise reproducibility levels between 69% and 91% (see Figure 7). The trends in Figure 8 show that the absolute number of bitwise reproducible packages has consistently gone up and followed the fast growth of the package set. The only exception is the data point for June 2020, where the number of reproducible packages dropped even though the total number of packages grew. We study and explain this reproducibility regression in Section VI-C below.
<details>
<summary>extracted/6418685/paper-images/reproducibility-overall-proportion.png Details</summary>
### Visual Description
## Stacked Area Chart: Proportion of Successful Rebuilds by Status (2018-2023)
### Overview
This is a stacked area chart visualizing the changing proportions of three different statuses for software or system rebuilds over a six-year period, from 2018 to 2023. The chart tracks the "Proportion of successful rebuilds" on the vertical axis against time on the horizontal axis. The three statuses are "reproducible," "buildable," and "failed," which are stacked to show their cumulative contribution to 100% of rebuild attempts.
### Components/Axes
* **Chart Type:** Stacked Area Chart.
* **Y-Axis (Vertical):**
* **Label:** "Proportion of successful rebuilds"
* **Scale:** Percentage, ranging from 30.00% to just above 90.00%. Major gridlines are at 10% intervals (30%, 40%, 50%, 60%, 70%, 80%, 90%).
* **X-Axis (Horizontal):**
* **Label:** "Date"
* **Scale:** Time in years, with markers for 2018, 2019, 2020, 2021, 2022, and 2023. Data points appear to be plotted at quarterly or semi-annual intervals within each year.
* **Legend:**
* **Position:** Bottom center of the chart.
* **Title:** "Statuses"
* **Categories & Colors:**
1. **reproducible:** Represented by a blue line and the blue-filled area at the bottom of the stack.
2. **buildable:** Represented by an orange line and the orange-filled area stacked on top of the blue area.
3. **failed:** Represented by a teal/green line at the very top of the stack. The area for "failed" is not visibly filled, suggesting its proportion is very small.
### Detailed Analysis
**Trend Verification & Data Points (Approximate Values):**
1. **"reproducible" (Blue Line/Area - Bottom Stack):**
* **Trend:** Shows significant volatility with an overall upward trend. It starts around 71%, dips slightly, rises to a peak in 2019, experiences a sharp decline in 2020, then recovers and climbs steadily to its highest point in 2023.
* **Key Points:**
* Start of 2018: ~71%
* Mid-2018: ~69% (local low)
* Early 2019: ~85% (local peak)
* Mid-2020: ~62% (significant trough)
* Early 2021: ~84%
* End of 2022: ~88%
* Mid-2023: ~91% (highest point)
2. **"buildable" (Orange Line/Area - Middle Stack):**
* **Trend:** This represents the proportion of rebuilds that were buildable but not reproducible. Its thickness (the vertical distance between the blue and orange lines) varies inversely with the "reproducible" line. It is thickest when "reproducible" is lowest (e.g., mid-2020) and thinnest when "reproducible" is highest (e.g., 2023).
* **Key Observation:** The orange line itself (the top of the "buildable" area) remains relatively stable near the 100% mark, indicating that the combined total of "reproducible" and "buildable" rebuilds consistently approaches 100%.
3. **"failed" (Teal Line - Top Stack):**
* **Trend:** The teal line is nearly flat and positioned at the very top of the chart, just above the 100% mark (implied). This indicates the proportion of failed rebuilds is consistently very small, likely in the low single-digit percentages or less, throughout the entire period.
* **Key Observation:** There is no visible filled area for "failed," confirming its minimal contribution to the total.
### Key Observations
* **The 2020 Dip:** The most prominent feature is the sharp decline in the "reproducible" proportion during 2020, dropping from over 80% to approximately 62%. This corresponds to a significant expansion of the "buildable" (orange) area.
* **Post-2020 Recovery and Growth:** Following the 2020 low, the "reproducible" proportion not only recovers to pre-dip levels but continues a steady upward trend through 2023, reaching its maximum value.
* **Stability of Total Success:** The sum of "reproducible" and "buildable" (the top of the orange area) remains consistently near 100%, suggesting that outright failures are rare. The primary dynamic is the trade-off between "reproducible" and "buildable" statuses.
* **Legend Placement:** The legend is clearly positioned at the bottom center, with labels directly adjacent to their corresponding colored line samples, ensuring unambiguous mapping.
### Interpretation
This chart likely tracks the health and maturity of a software ecosystem's build system or dependency management over time. The "reproducible" status is the gold standard, meaning a build can be perfectly recreated. "Buildable" suggests it works but may have non-deterministic elements.
* **What the Data Suggests:** The overall upward trend in "reproducible" builds from 2021 onward indicates improving practices, better tooling, or increased emphasis on deterministic builds within the ecosystem. The system is becoming more reliable and predictable.
* **The 2020 Anomaly:** The sharp dip in 2020 is a critical event. It could correlate with a major ecosystem change (e.g., a widespread dependency update, a change in build tool defaults, or the introduction of a new, initially non-reproducible package format). The quick recovery suggests the issue was identified and addressed.
* **Relationship Between Elements:** The inverse relationship between the blue and orange areas highlights a key performance indicator: the conversion of "buildable" projects into "reproducible" ones. The shrinking orange area post-2020 is a positive sign of ecosystem stabilization.
* **The "Failed" Baseline:** The consistently negligible failure rate implies that basic build functionality is well-established. The focus for improvement has rightly shifted to the higher-quality goal of reproducibility.
**In summary, the chart tells a story of an ecosystem that encountered a significant reproducibility challenge around 2020 but has since made strong, sustained progress toward achieving more deterministic and reliable builds.**
</details>
Figure 7: Proportion of reproducible, rebuildable (but unreproducible) and non-rebuildable packages over time.
<details>
<summary>extracted/6418685/paper-images/reproducibility-overall-absolute.png Details</summary>
### Visual Description
## Stacked Area Chart: Successful Rebuilds by Status (2018-2023)
### Overview
This is a stacked area chart tracking the number of successful software or system rebuilds over a period from approximately early 2018 to mid-2023. The chart categorizes rebuilds by their final status: "reproducible," "buildable," and "failed." The data shows a general upward trend in total rebuilds, with a significant acceleration in growth starting in 2022.
### Components/Axes
* **Chart Type:** Stacked Area Chart.
* **X-Axis (Horizontal):** Labeled "Date". It displays years from 2018 to 2023, with major tick marks at the start of each year. The data appears to be plotted at quarterly or semi-annual intervals.
* **Y-Axis (Vertical):** Labeled "Number of successful rebuilds". The scale is linear, ranging from 0 to 70,000 (70k), with major gridlines at intervals of 10,000.
* **Legend:** Located at the bottom center of the chart, titled "Status". It defines three data series:
* **reproducible:** Represented by a blue line and a semi-transparent blue filled area beneath it.
* **buildable:** Represented by a salmon/orange line and a semi-transparent salmon/orange filled area stacked on top of the "reproducible" area.
* **failed:** Represented by a teal/green line and a semi-transparent teal/green filled area stacked on top of the "buildable" area. The top edge of this green area represents the total number of rebuilds (reproducible + buildable + failed).
### Detailed Analysis
**Trend Verification:**
* **reproducible (Blue Line/Area):** Shows a general upward trend with some volatility. It dips notably in mid-2020 before recovering and then rising sharply from 2022 onward.
* **buildable (Orange Line/Area):** The thickness of this band (the difference between the orange and blue lines) remains relatively consistent until 2022, after which it widens slightly, indicating a growing number of builds in this category.
* **failed (Green Line/Area):** The top line (total) follows a similar upward trajectory to the "reproducible" line. The thickness of the green band (failed builds) appears relatively stable as a proportion of the total over time.
**Data Point Extraction (Approximate Values):**
Values are estimated based on the gridlines. The "reproducible" value is read directly from the blue line. The "buildable" value is the difference between the orange and blue lines. The "failed" value is the difference between the green and orange lines. The total is the value of the green line.
| Date (Approx.) | Total (Green Line) | reproducible (Blue) | buildable (Orange - Blue) | failed (Green - Orange) |
| :--- | :--- | :--- | :--- | :--- |
| Early 2018 | ~19,000 | ~14,000 | ~5,000 | ~0 (line starts here) |
| Mid 2018 | ~22,000 | ~15,500 | ~6,500 | ~0 |
| Late 2018 | ~23,000 | ~16,000 | ~7,000 | ~0 |
| Early 2019 | ~29,500 | ~22,000 | ~7,500 | ~0 |
| Mid 2019 | ~28,500 | ~24,000 | ~4,500 | ~0 |
| Late 2019 | ~27,500 | ~22,000 | ~5,500 | ~0 |
| Early 2020 | ~31,000 | ~25,000 | ~6,000 | ~0 |
| Mid 2020 | ~35,000 | ~29,500 | ~5,500 | ~0 |
| Late 2020 | ~36,500 | ~22,500 | ~14,000 | ~0 |
| Early 2021 | ~39,500 | ~33,000 | ~6,500 | ~0 |
| Mid 2021 | ~42,500 | ~36,500 | ~6,000 | ~0 |
| Late 2021 | ~45,000 | ~38,000 | ~7,000 | ~0 |
| Early 2022 | ~48,000 | ~40,500 | ~7,500 | ~0 |
| Mid 2022 | ~51,000 | ~44,000 | ~7,000 | ~0 |
| Late 2022 | ~54,000 | ~47,500 | ~6,500 | ~0 |
| Early 2023 | ~70,500 | ~64,000 | ~6,500 | ~0 |
| Mid 2023 | ~72,000 | ~65,500 | ~6,500 | ~0 |
**Note on "failed" data:** The legend includes "failed," but the green line appears to be the top boundary of the stacked area. The visual representation suggests the green line is the sum of all three categories. The "failed" category, as a distinct band, is not visibly present in the stack, implying its value is zero or negligible throughout the period shown. The green line's label may be misleading; it likely represents the "Total" of all statuses.
### Key Observations
1. **Overall Growth:** The total number of rebuilds (green line) increased from approximately 19,000 in early 2018 to over 72,000 by mid-2023, representing nearly a 280% increase.
2. **Sharp Acceleration:** The most dramatic growth occurs between late 2022 and early 2023, where the total jumps from ~54,000 to ~70,500.
3. **Volatility in "reproducible":** The "reproducible" category shows a significant dip in late 2020 (down to ~22,500 from ~29,500 earlier that year) before beginning a sustained and steep climb.
4. **Stable "buildable" Band:** The number of "buildable" (but not reproducible) rebuilds remains in a relatively narrow band (roughly 4,500 to 7,500) for most of the timeline, with a possible outlier spike in late 2020.
5. **Legend/Data Discrepancy:** The "failed" category listed in the legend does not correspond to a visible, separate data series in the chart. The green line is the cumulative total.
### Interpretation
This chart demonstrates a robust and accelerating adoption or activity in a rebuild process (likely in software engineering, such as package builds or continuous integration) over a five-year period. The consistent growth suggests increasing scale, reliability, or monitoring of these processes.
The relationship between the categories is key: "reproducible" builds form the vast majority of the total, indicating a high standard of build quality and determinism. The "buildable" category represents a smaller, stable subset of builds that succeed but lack full reproducibility. The absence of a visible "failed" band is a strong positive indicator, suggesting either an extremely low failure rate or that the chart's green line is mislabeled and actually represents the sum of "reproducible" and "buildable" only.
The notable dip in "reproducible" builds in late 2020 could indicate a systemic issue, a change in measurement methodology, or a period of transition in the underlying systems. The subsequent sharp recovery and explosive growth from 2022 onward point to a successful resolution of that issue and/or a major scaling-up of operations. The data suggests a system that has matured significantly, achieving both higher volume and a strong emphasis on reproducibility.
</details>
Figure 8: Absolute numbers of reproducible, rebuildable (but unreproducible) and non-rebuildable packages over time.
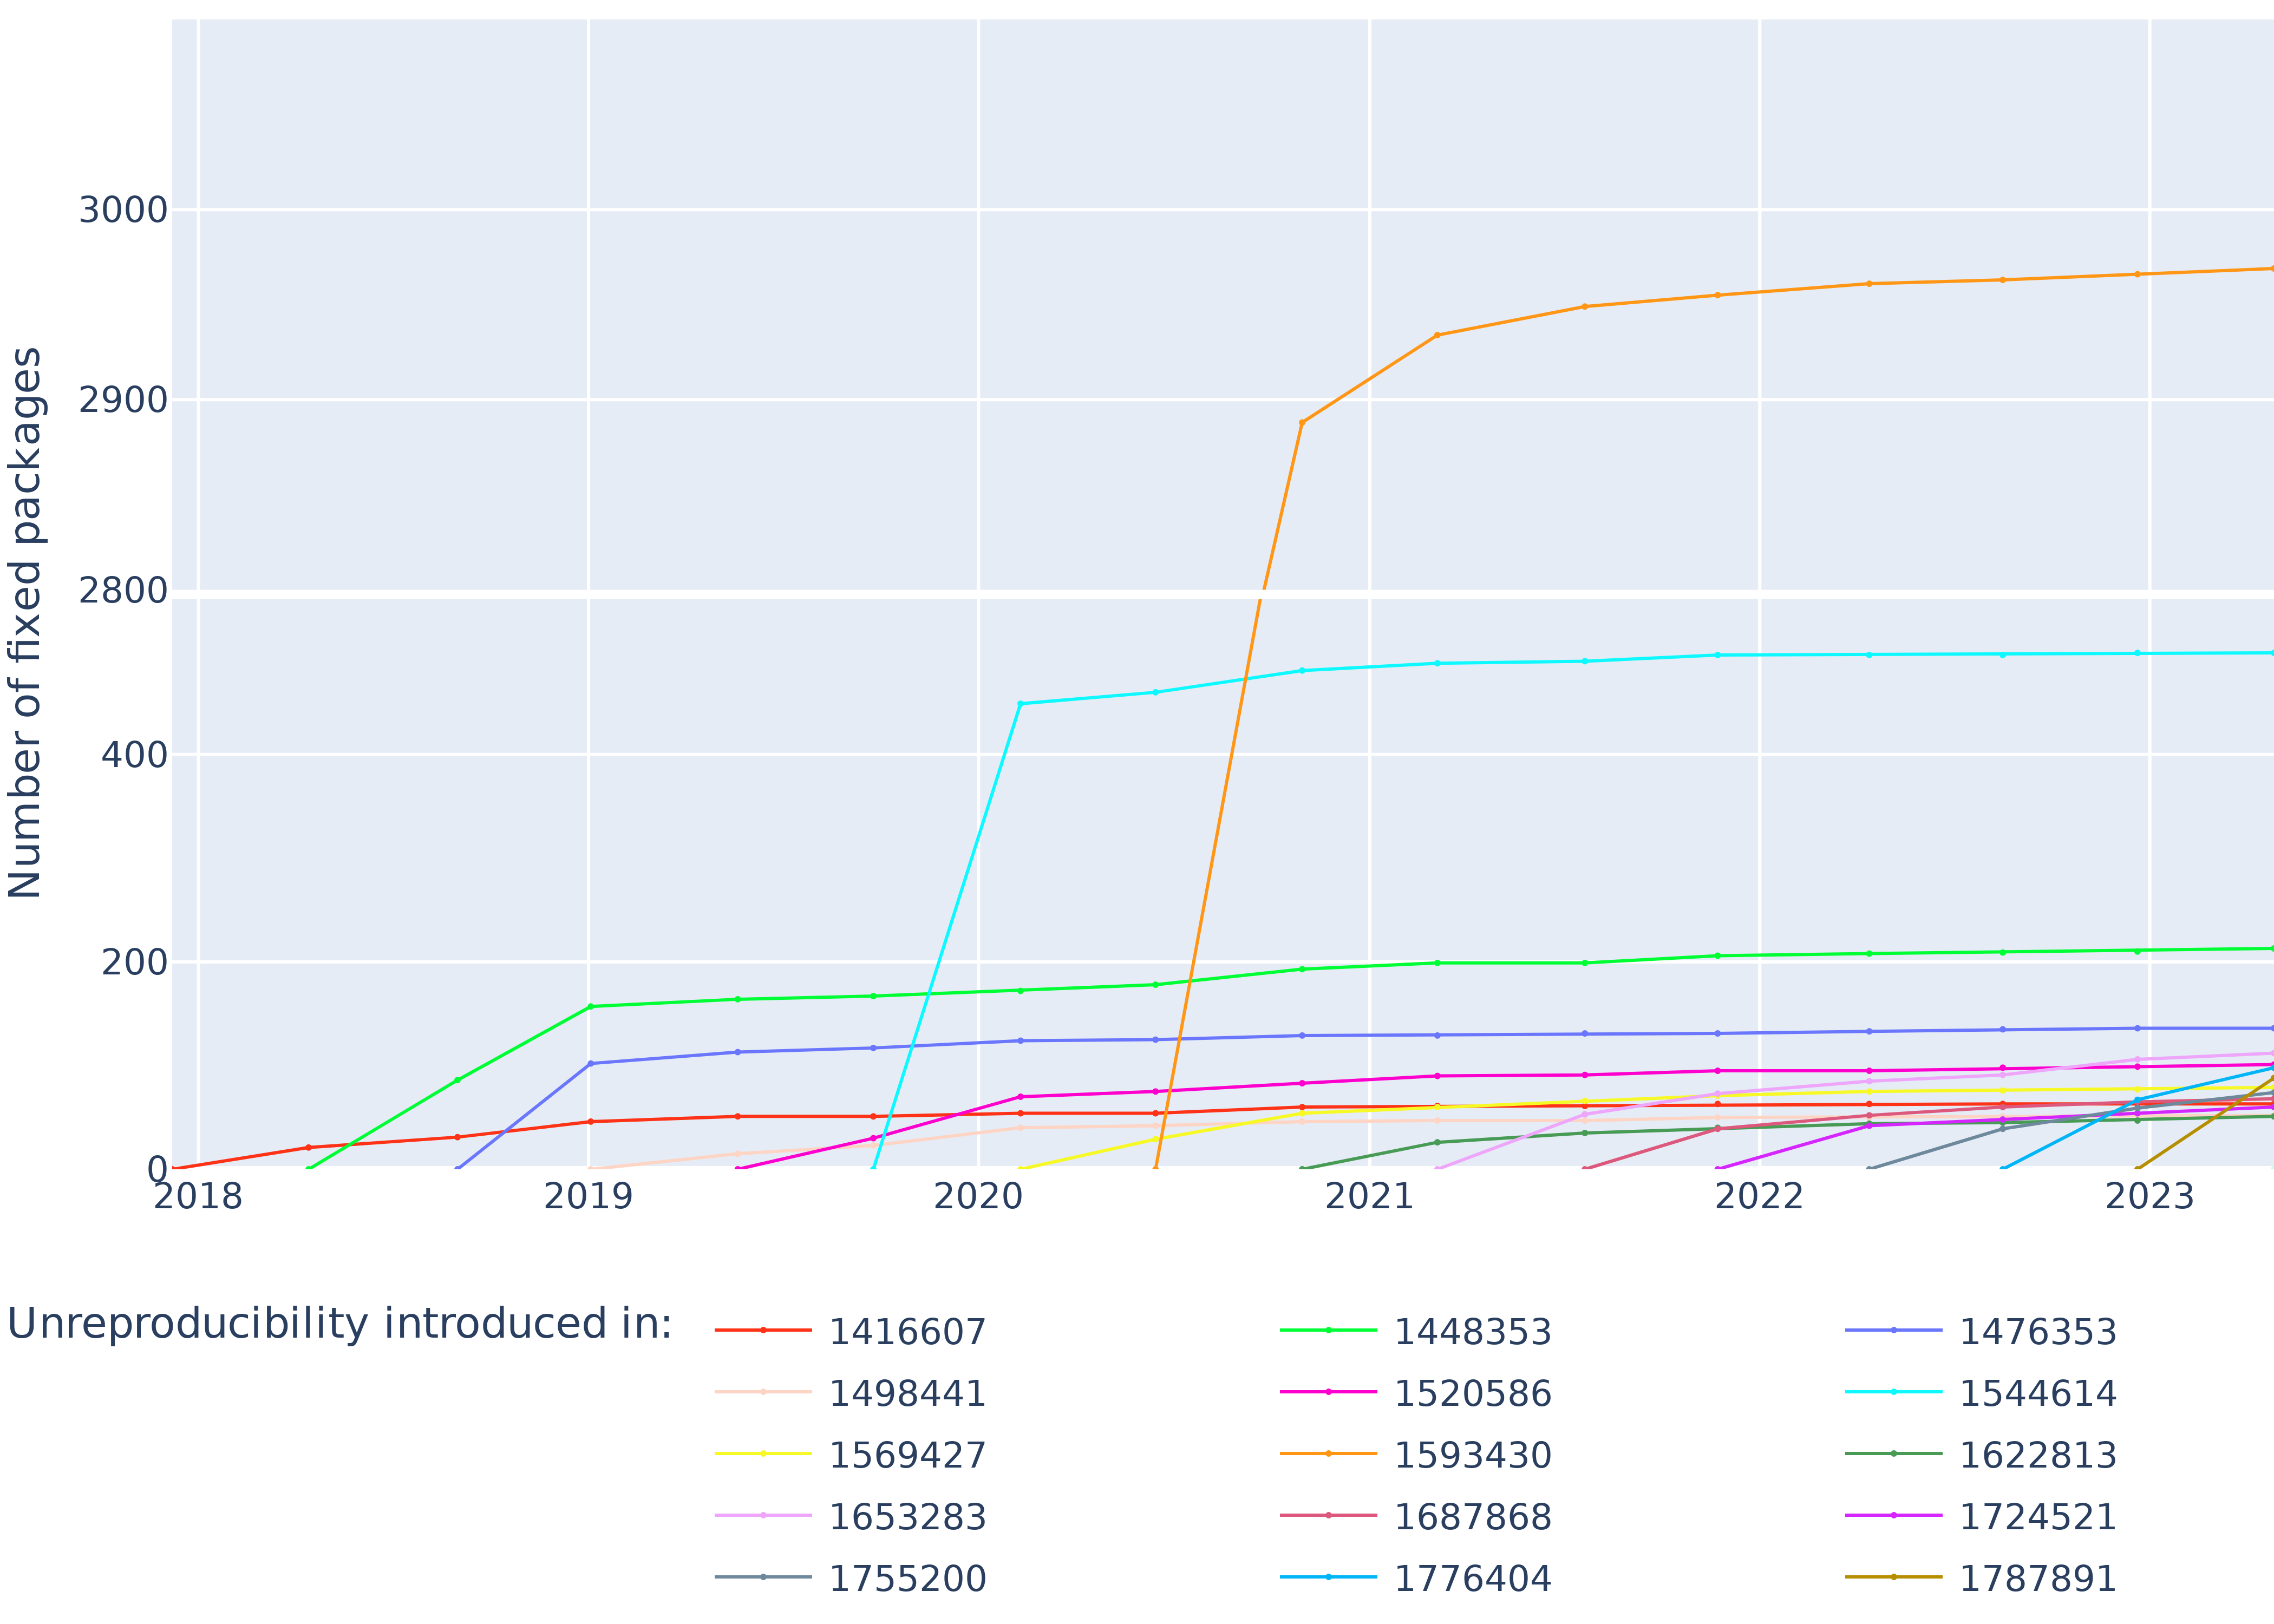
Figure 9 shows for each revision the cumulative amount of unreproducibilities introduced by that revision getting fixed over time. The large slope between the two first points of each plot indicates that most of the unreproducibilities introduced in a revision are fixed in the next revision, on average 62% of them (even raising to 85% if we account for packages fixed after the 2020 reproducibility regression).
<details>
<summary>extracted/6418685/paper-images/fixes-per-revision.png Details</summary>
### Visual Description
## Line Chart: Number of Fixed Packages Over Time by Unreproducibility Introduction Event
### Overview
This is a line chart tracking the cumulative "Number of fixed packages" over time, from early 2018 to late 2023. The chart displays multiple data series, each representing a distinct "Unreproducibility introduced in:" event, identified by a unique numeric code. The data shows how many packages were fixed following the introduction of each specific unreproducibility issue.
### Components/Axes
* **Y-Axis (Vertical):** Labeled "Number of fixed packages". The scale is non-linear, with major gridlines at 0, 200, 400, 2000, 2800, 2900, and 3000. This indicates a significant jump in scale between 400 and 2000.
* **X-Axis (Horizontal):** Represents time, with major year markers for 2018, 2019, 2020, 2021, 2022, and 2023. Data points appear to be plotted at quarterly or semi-annual intervals.
* **Legend:** Located at the bottom center of the chart. It is titled "Unreproducibility introduced in:" and contains 15 entries, each pairing a colored line with a numeric identifier. The legend is organized in three columns.
### Detailed Analysis
**Legend Entries (Color to ID Mapping):**
1. **Red:** 1416607
2. **Light Pink:** 1498441
3. **Yellow:** 1569427
4. **Light Purple:** 1653283
5. **Dark Grey:** 1755200
6. **Bright Green:** 1448353
7. **Magenta:** 1520586
8. **Orange:** 1593430
9. **Dark Red/Brown:** 1687868
10. **Cyan:** 1776404
11. **Blue:** 1476353
12. **Light Blue/Cyan:** 1544614
13. **Dark Green:** 1622813
14. **Purple:** 1724521
15. **Olive/Brown:** 1787891
**Data Series Trends & Approximate Values:**
* **1593430 (Orange):** This is the most prominent series. It shows a dramatic, near-vertical increase starting in late 2020, rising from near 0 to approximately 2880 by early 2021. It then continues a steady, shallow upward trend, reaching approximately 2970 by late 2023.
* **1544614 (Light Blue/Cyan):** Shows a very sharp increase in early 2020, jumping from near 0 to approximately 450. It then plateaus, showing only a very slight increase to around 470 by 2023.
* **1448353 (Bright Green):** Begins rising in mid-2018, reaching about 160 by 2019. It continues a steady, shallow upward trend, ending at approximately 210 in 2023.
* **1476353 (Blue):** Starts rising in late 2018, reaching about 100 by 2019. It follows a very flat, stable trend, ending near 130 in 2023.
* **1520586 (Magenta):** Begins its ascent in late 2019, rising to about 70 by 2020. It shows a slow, steady increase, reaching approximately 100 by 2023.
* **1416607 (Red):** One of the earliest series, starting in early 2018. It rises to about 40 by 2019 and then plateaus, remaining between 40-60 for the rest of the period.
* **1653283 (Light Purple):** Starts rising in late 2020, reaching about 60 by 2021. It shows a slow increase, ending near 80 in 2023.
* **1569427 (Yellow):** Begins in early 2020, rising to about 50 by 2021. It remains relatively flat, ending near 60 in 2023.
* **1687868 (Dark Red/Brown):** Starts in early 2021, rising to about 40 by 2022. It shows a slight increase, ending near 50 in 2023.
* **1724521 (Purple):** Begins in early 2022, rising to about 40 by 2023.
* **1622813 (Dark Green):** Starts in early 2021, rising to about 30 by 2022, and ending near 40 in 2023.
* **1776404 (Cyan):** Begins in late 2022, rising sharply to about 90 by late 2023.
* **1787891 (Olive/Brown):** Begins in mid-2023, rising sharply to about 80 by late 2023.
* **1498441 (Light Pink):** Shows a very shallow rise starting in 2019, remaining below 30 throughout.
* **1755200 (Dark Grey):** Begins in early 2022, showing a very shallow rise, remaining below 20.
### Key Observations
1. **Dominant Series:** The orange line (1593430) is a massive outlier, accounting for the vast majority of fixed packages (nearly 3000) and exhibiting a unique, explosive growth pattern in late 2020/early 2021.
2. **Two Distinct Growth Patterns:** Series generally fall into two categories: a) those with a single, sharp increase followed by a long plateau (e.g., 1544614, 1593430), and b) those with a more gradual, sustained increase over years (e.g., 1448353, 1476353).
3. **Temporal Clustering:** Several series (1593430, 1544614, 1653283, 1569427) show their primary growth phase around 2020-2021, suggesting a period of significant activity in fixing packages related to unreproducibility issues introduced around that time.
4. **Late Emergers:** A few series (1776404, 1787891) begin very late in the timeline (2022-2023) and show steep initial slopes, indicating recent, active fixing efforts for newer issues.
### Interpretation
This chart visualizes the remediation history of software package unreproducibility. Each line represents the cumulative number of packages fixed due to a specific, identified root cause (the "Unreproducibility introduced in:" ID).
The data suggests that unreproducibility issues are not discovered or fixed at a constant rate. Instead, there are periods of intense activity. The monumental spike for issue `1593430` indicates a single, widespread problem that, once addressed, led to a massive wave of package fixes. The sharp plateaus for other series (like `1544614`) suggest that after an initial focused effort to fix packages affected by a particular issue, few additional packages required fixes for that same cause.
The more gradually rising lines (e.g., `1448353`) may represent ongoing, background maintenance or issues that are discovered and fixed incrementally over a long period. The emergence of new, steeply rising lines in 2022-2023 shows that the process of identifying and fixing unreproducibility is ongoing, with new issues being actively addressed. The non-linear Y-axis is crucial, as it allows the visualization of both the massive scale of the `1593430` fix and the more modest, but still important, trends of the other issues on the same chart.
</details>
Figure 9: Evolution of the cumulative number of fixes to non-reproducibilities, separated by the revision in which the non-reproducibilities were introduced.
Excluding the June 2020 revision (corresponding to the observed bitwise reproducibility regression), Figure 10 depicts the average evolution of the package set between two consecutive revisions. In particular, only 0.60% of the packages transition from reproducible to buildable but not reproducible status between two revisions, while 2.07% of the buildable but not reproducible packages become reproducible. The average growth rate of the package set is 1.07 and, on average, 80.02% of the new packages are reproducible.
<details>
<summary>extracted/6418685/paper-images/sankey-average.png Details</summary>
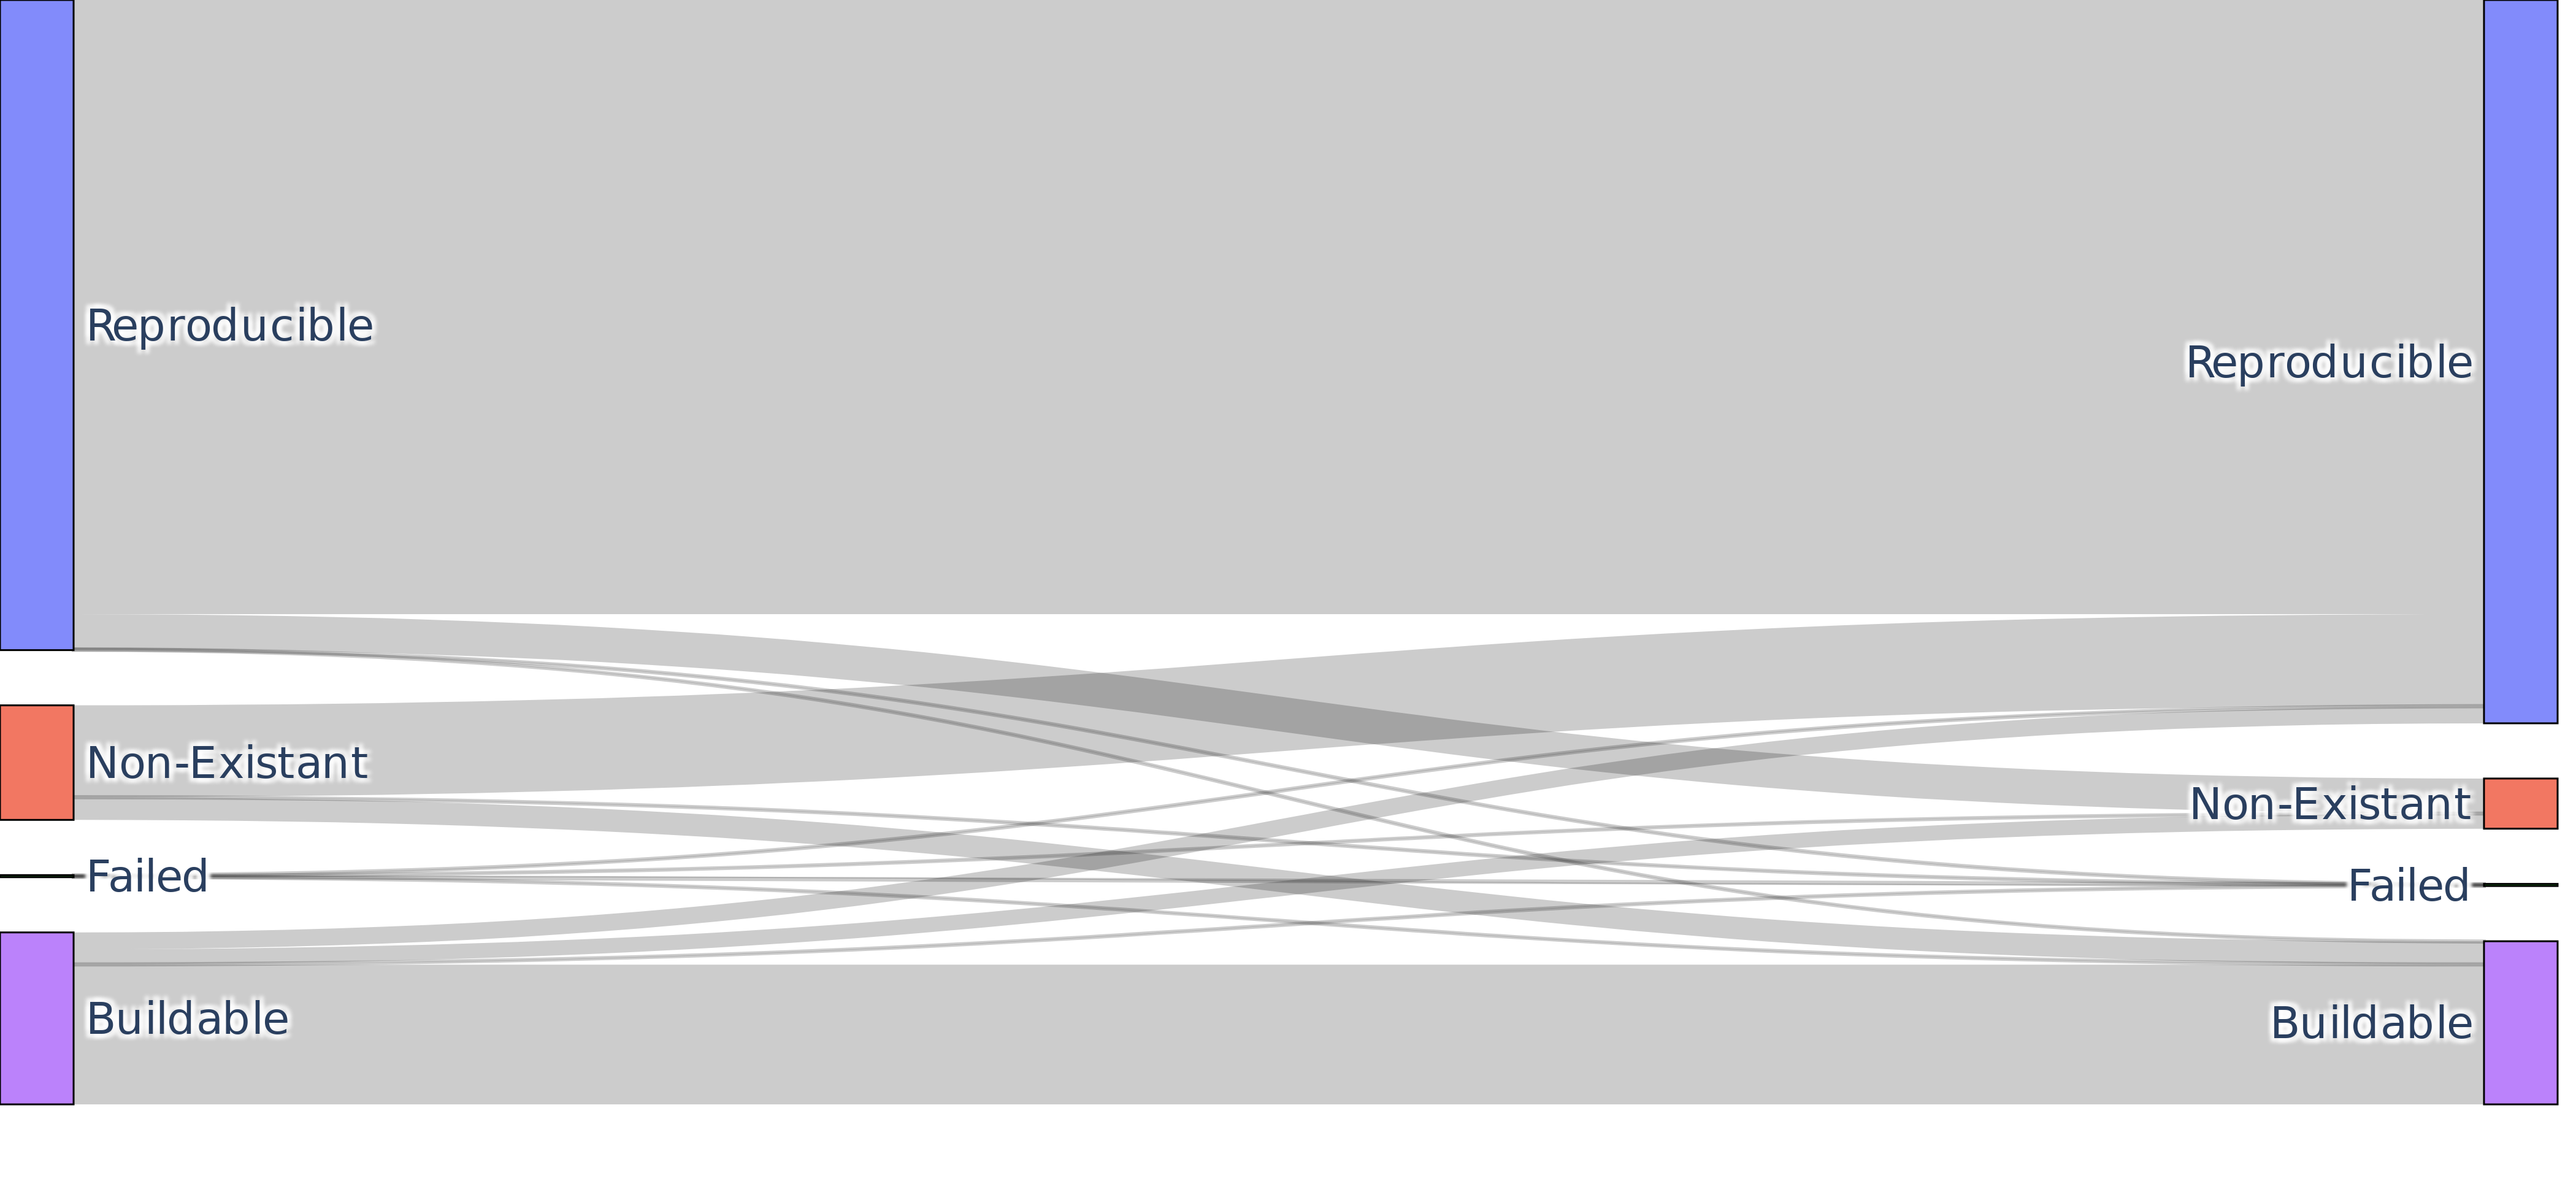
### Visual Description
## Sankey Diagram: State Transition Flow
### Overview
The image displays a Sankey diagram illustrating the flow or transition of items between four distinct states across two points in time or two different conditions. The diagram visualizes the proportional relationships between initial states (left axis) and final states (right axis). The width of each connecting flow is proportional to the quantity of items moving from one state to another. No numerical values or scales are provided; all analysis is based on the relative widths of the flows.
### Components/Axes
* **Left Axis (Initial States):** A vertical column of four categories, each represented by a colored bar.
* **Top:** "Reproducible" (Blue bar)
* **Second:** "Non-Existant" (Orange bar) *[Note: Likely a misspelling of "Non-Existent"]*
* **Third:** "Failed" (Black line/bar)
* **Bottom:** "Buildable" (Purple bar)
* **Right Axis (Final States):** A vertical column mirroring the left axis, with the same four categories in the same order and colors.
* **Top:** "Reproducible" (Blue bar)
* **Second:** "Non-Existant" (Orange bar)
* **Third:** "Failed" (Black line/bar)
* **Bottom:** "Buildable" (Purple bar)
* **Flows:** Gray, semi-transparent bands connecting the left and right categories. The vertical position of a flow's endpoint on the right axis corresponds to its destination category.
### Detailed Analysis
The diagram shows the following transitions, described from the perspective of the initial (left) state:
1. **From "Reproducible" (Left):**
* The vast majority of the flow connects directly to "Reproducible" (Right). This is the single thickest flow in the entire diagram.
* A very thin flow connects to "Non-Existant" (Right).
* An extremely thin, almost negligible flow connects to "Failed" (Right).
* No visible flow connects to "Buildable" (Right).
2. **From "Non-Existant" (Left):**
* The largest portion of this flow connects to "Non-Existant" (Right).
* A significant, but smaller, flow connects to "Failed" (Right).
* A smaller flow connects to "Buildable" (Right).
* No visible flow connects to "Reproducible" (Right).
3. **From "Failed" (Left):**
* This category has the most distributed outflow, connecting to all four right-side categories.
* The thickest flow from "Failed" goes to "Failed" (Right).
* Substantial flows go to "Non-Existant" (Right) and "Buildable" (Right).
* A very thin flow connects to "Reproducible" (Right).
4. **From "Buildable" (Left):**
* The largest portion of this flow connects to "Buildable" (Right).
* A significant flow connects to "Failed" (Right).
* A smaller flow connects to "Non-Existant" (Right).
* No visible flow connects to "Reproducible" (Right).
### Key Observations
* **High Stability for "Reproducible":** The "Reproducible" state shows the highest degree of persistence, with almost all items remaining in that state.
* **"Failed" as a Common Sink:** The "Failed" state on the right receives inflows from all four initial states, suggesting it is a common outcome for items that do not persist in their original state.
* **"Non-Existant" and "Buildable" Dynamics:** Both states show significant persistence but also notable leakage into the "Failed" state. "Non-Existant" items do not transition to "Reproducible," and "Buildable" items do not transition to "Reproducible."
* **Cross-Transitions:** There is a complex web of transitions between "Non-Existant," "Failed," and "Buildable," indicating these states are more interconnected or fluid than "Reproducible."
* **Visual Spelling:** The label "Non-Existant" is consistently misspelled throughout the diagram.
### Interpretation
This Sankey diagram likely models the lifecycle or stability of entities such as software builds, experimental results, or research artifacts. The data suggests a system where:
* **"Reproducible" is a highly stable, desirable state.** Once achieved, it is almost always maintained.
* **"Failed" is a common attractor state.** Entities from any initial condition can end up here, making it a key indicator of system-wide issues or attrition.
* **"Non-Existant" and "Buildable" are intermediate or vulnerable states.** While they have some stability, they are prone to degrading into the "Failed" state. The lack of flow from these states to "Reproducible" implies that achieving reproducibility from a non-reproducible starting point is not observed in this dataset.
* The diagram emphasizes **path dependency**. The initial state strongly determines the range of possible final states. For example, starting as "Reproducible" almost guarantees you stay there, while starting as "Failed" opens up all possible outcomes. This visualization is powerful for identifying which initial conditions are most resilient and which are most at risk of transitioning to failure.
</details>
Figure 10: Sankey graph of the average flow of packages between two revisions, excluding the revision from June 2020, considered as an outlier.
### VI-C RQ2: What are the unreproducible packages?
We observe large disparities both in trends and in reproducibility by package ecosystem (see Figure 11). In the top three most popular ecosystems, Perl has consistently maintained a proportion of reproducible packages above 98%, while Haskell reproducibility rate stagnated around the 60% mark, even decreasing by more than 7 percentage points during the time of our study. A fix to a long-standing reproducibility issue has been introduced in GHC 9.12.1 (new -fobject-determinism flag). As of January 2025, nixpkgs does not make use of this flag to improve Haskell build reproducibility. The Python ecosystem on the contrary sees a positive evolution over time, with reproducibility rates as low as 27.64% in December 2017, reaching 98.28% in April 2023. As can be seen on Figure 11, the Python ecosystem has however known a major dip in reproducibility in June 2020, with a drop to 6.01% (for almost $-90$ percentage points!).
<details>
<summary>extracted/6418685/paper-images/reproducibility-ecosystems.png Details</summary>
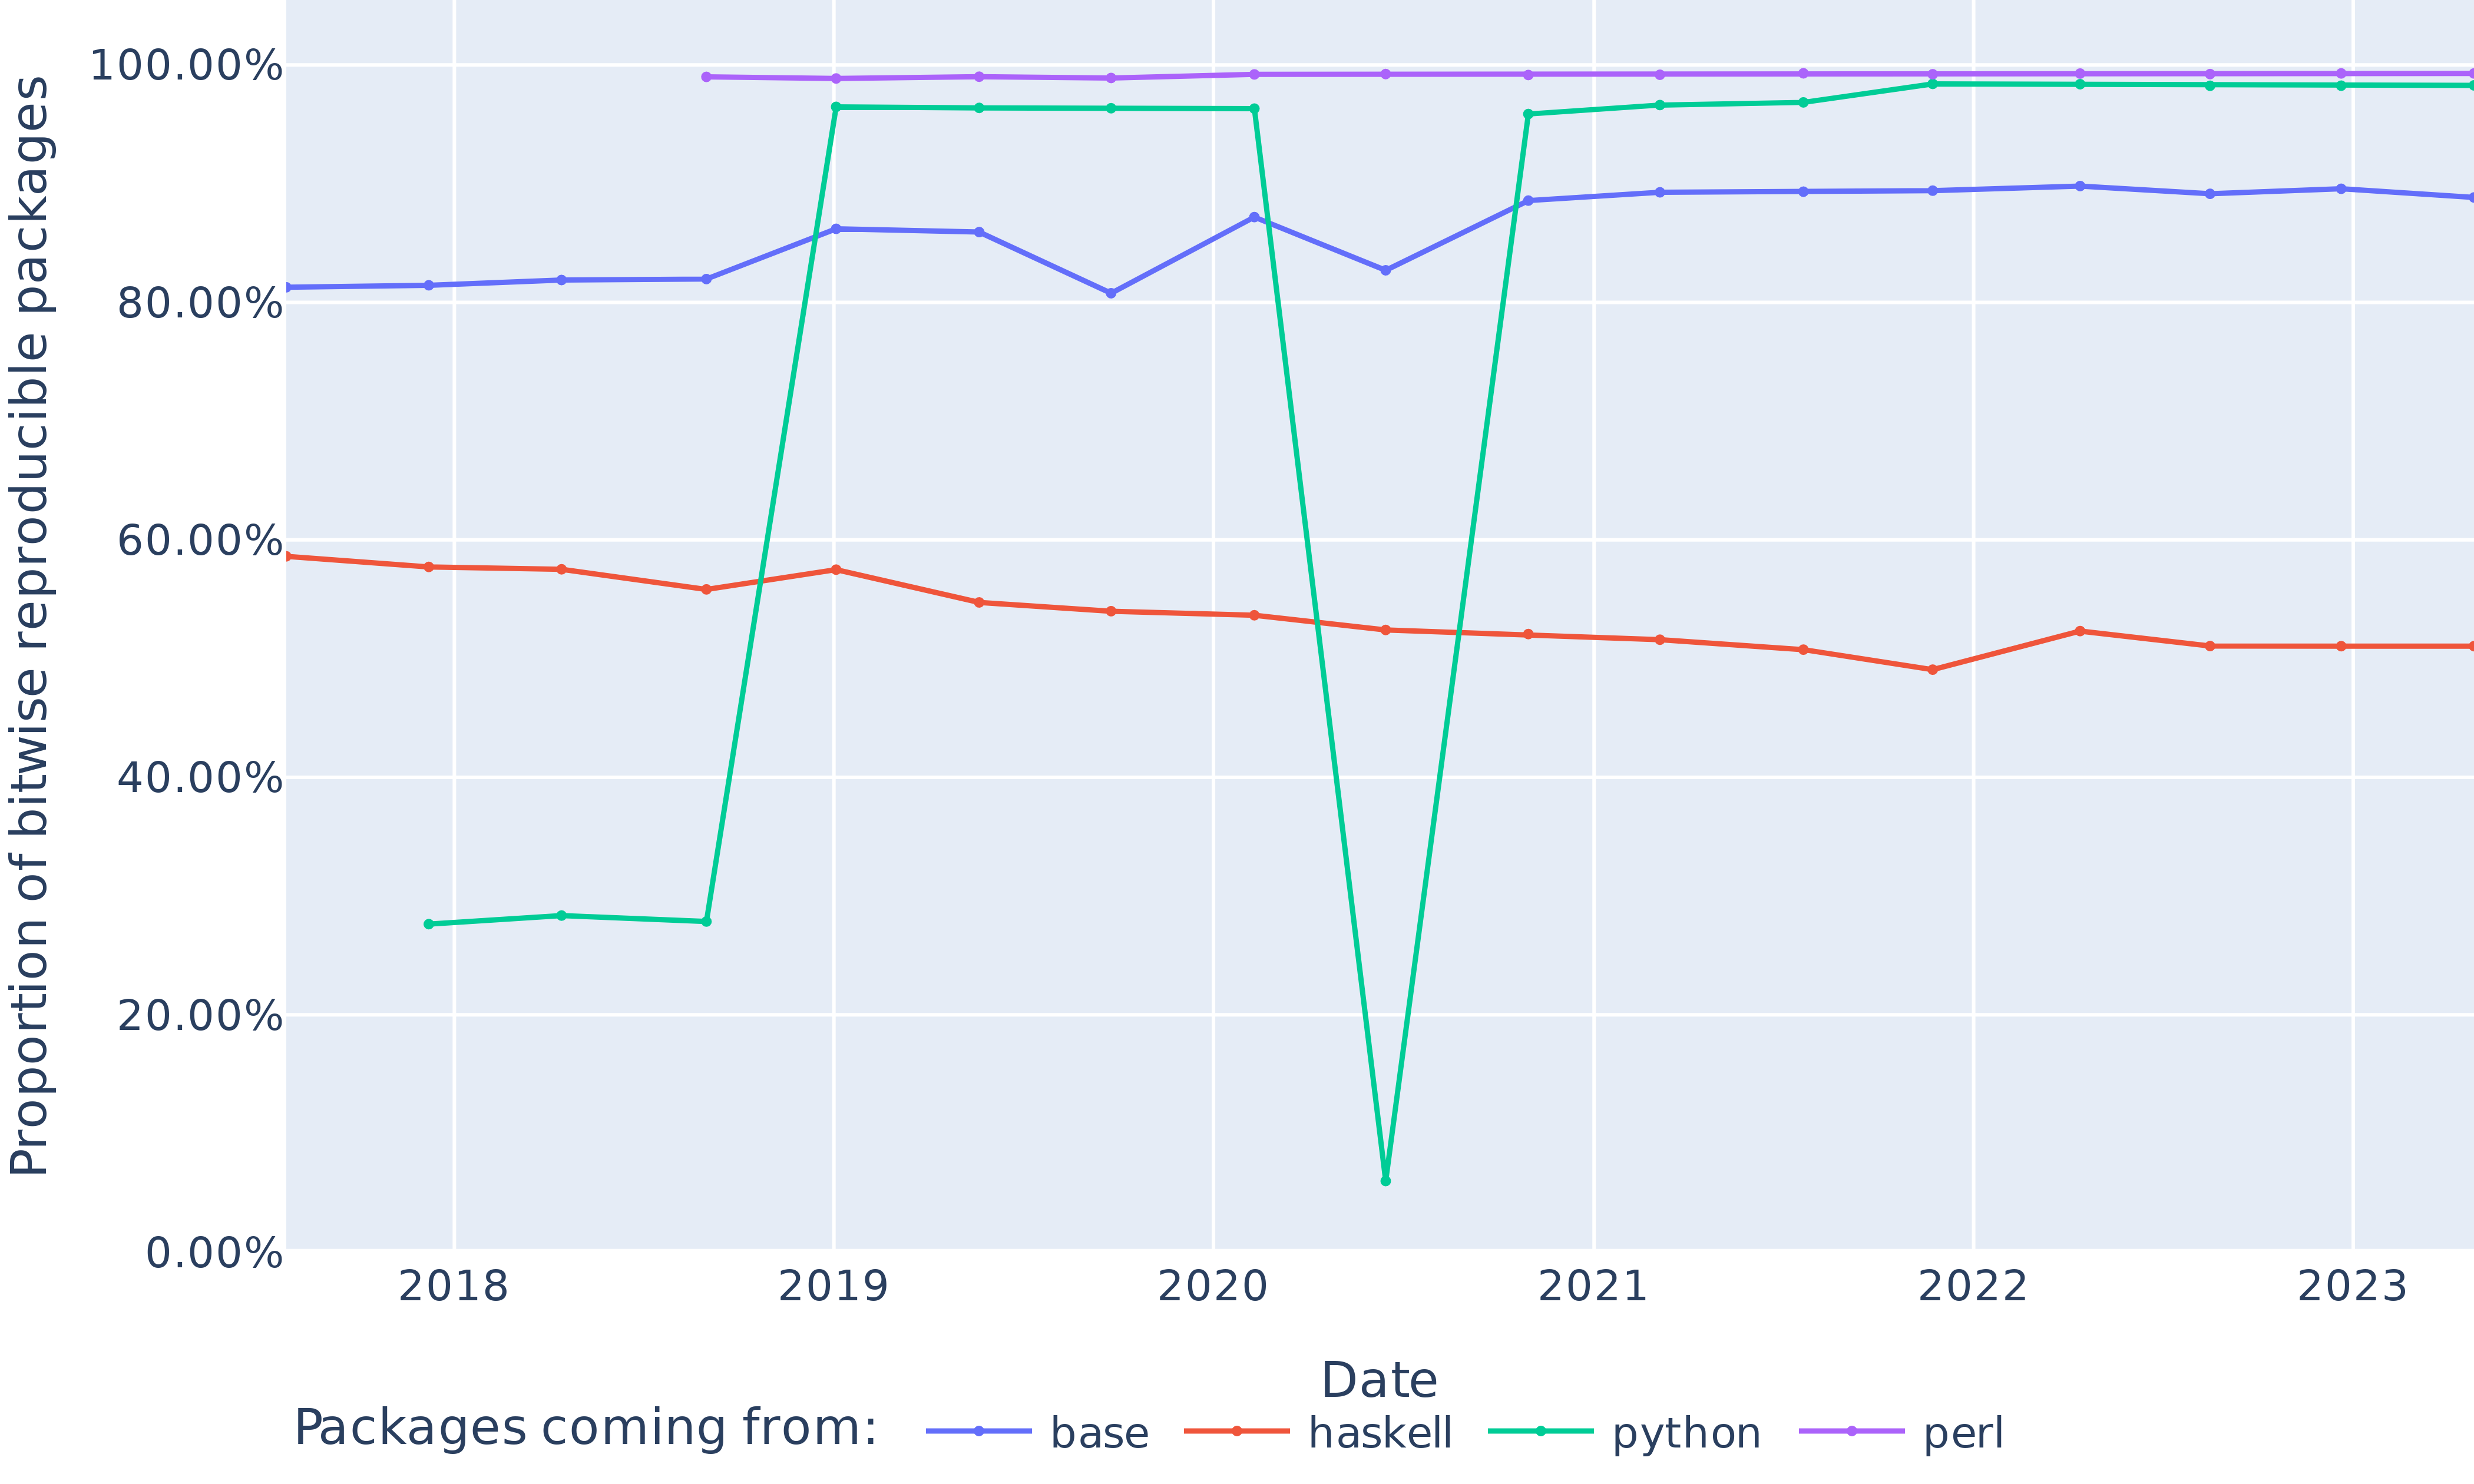
### Visual Description
## Line Chart: Proportion of Bitwise Reproducible Packages Over Time
### Overview
This is a line chart tracking the percentage of packages that are "bitwise reproducible" for four different package sources over a period from early 2018 to late 2023. The chart reveals significant differences in reproducibility rates and stability among the sources, with one source (python) exhibiting a dramatic, temporary collapse.
### Components/Axes
* **Chart Type:** Multi-line chart.
* **Y-Axis (Vertical):**
* **Label:** "Proportion of bitwise reproducible packages"
* **Scale:** Percentage, from 0.00% to 100.00%.
* **Major Tick Marks:** 0.00%, 20.00%, 40.00%, 60.00%, 80.00%, 100.00%.
* **X-Axis (Horizontal):**
* **Label:** "Date"
* **Scale:** Time in years.
* **Major Tick Marks:** 2018, 2019, 2020, 2021, 2022, 2023.
* **Legend:**
* **Position:** Centered at the bottom of the chart.
* **Title:** "Packages coming from:"
* **Categories & Colors:**
* `base` - Blue line with circular markers.
* `haskell` - Red/Orange line with circular markers.
* `python` - Green/Teal line with circular markers.
* `perl` - Purple line with circular markers.
### Detailed Analysis
**Trend Verification & Data Point Extraction (Approximate Values):**
1. **`perl` (Purple Line):**
* **Trend:** Extremely stable and high. The line is nearly flat at the very top of the chart.
* **Data Points:** Consistently at or very near **100.00%** for the entire duration from its first appearance in late 2018 through 2023.
2. **`python` (Green/Teal Line):**
* **Trend:** Highly volatile. Starts low, jumps to a high plateau, suffers a catastrophic drop, then recovers to a new high plateau.
* **Data Points:**
* Early 2018 - Late 2018: Stable at ~**28%**.
* Early 2019: Sharp increase to ~**96%**.
* 2019 - Early 2020: Maintains plateau at ~**96%**.
* Mid-2020: **Dramatic, sharp drop** to a minimum of ~**5%** (the lowest point on the entire chart).
* Late 2020: Sharp recovery back to ~**96%**.
* 2021 - 2023: Gradual increase, stabilizing near **98-99%**.
3. **`base` (Blue Line):**
* **Trend:** Generally stable with a slight upward trend and minor fluctuations.
* **Data Points:**
* 2018: Starts at ~**81%**.
* 2019: Increases to ~**86%**.
* Mid-2020: Dips to ~**80%**.
* Late 2020: Recovers to ~**87%**.
* 2021 - 2023: Hovers between **88% and 90%**, ending near **89%**.
4. **`haskell` (Red/Orange Line):**
* **Trend:** Gradual, consistent decline over the observed period.
* **Data Points:**
* Early 2018: Starts at ~**59%**.
* Shows a slow, steady downward slope with minor bumps.
* 2020: ~**54%**.
* 2021: ~**52%**.
* 2022: Dips to a low of ~**49%**.
* 2023: Slight recovery to ~**51%**.
### Key Observations
1. **Extreme Stability of `perl`:** The `perl` package source maintains near-perfect bitwise reproducibility (~100%) consistently over five years.
2. **Volatility of `python`:** The `python` source shows the most dramatic behavior, with a sudden collapse to near 0% reproducibility in mid-2020, followed by an equally rapid recovery. This suggests a major, temporary systemic issue.
3. **Diverging Long-Term Trends:** While `base` and `python` (post-recovery) show stable or slightly improving reproducibility, `haskell` demonstrates a clear, long-term decreasing trend.
4. **Clustering at High Levels:** By 2023, three of the four sources (`perl`, `python`, `base`) have reproducibility rates at or above ~89%, forming a high-performance cluster, while `haskell` remains an outlier below 55%.
### Interpretation
This chart visualizes the health and reliability of software package ecosystems from a reproducibility standpoint. Bitwise reproducibility is critical for security, verification, and debugging.
* **`perl`'s** perfect score suggests an exceptionally mature and controlled build environment or packaging standard.
* The **`python`** anomaly in 2020 is the most significant finding. It points to a specific event—perhaps a change in build tooling, a compromised dependency, or a shift in packaging policy—that temporarily broke the reproducibility guarantee for the entire ecosystem. The swift recovery indicates effective problem identification and resolution.
* The **`haskell`** decline is concerning. It may indicate increasing complexity in the build process, greater reliance on non-deterministic dependencies, or a shift in community practices away from reproducibility as a priority.
* The **`base`** category (likely core system packages) shows the steady, reliable behavior expected from a foundational layer.
In summary, the data demonstrates that while high reproducibility is achievable and maintained by some ecosystems (`perl`), it is not universal and can be subject to severe, albeit temporary, disruption (`python`). The downward trend in `haskell` warrants investigation to prevent further erosion of reproducibility.
</details>
Figure 11: Proportion of reproducible packages belonging to the three most popular ecosystems and the base namespace of nixpkgs.
As can be seen in Figure 12, this dip in the proportion of reproducible Python packages can be explained by a large number of packages transitioning from the reproducible to the buildable but not reproducible state, indicating a regression in bitwise reproducibility at that time. To identify the root cause of that regression, we used a git bisection on the nixpkgs repository between June and October 2020 in order to identify the commit fixing the unreproducibility issue, and derived that the root cause of the regression was an update in the pip executable changing the behavior of byte-compilation. Details can be found in https://github.com/pypa/pip/issues/7808.
Figure 13 shows the difference in reproducibility rates between the NixOS minimal ISO image—a package set for which there exists community-based reproducibility monitoring, and made of packages that are considered critical—and the whole package set. The minimal ISO image has a very high proportion of reproducible packages in the considered period, with rates consistently higher than 95% starting from May 2019. Its reproducibility rates however do not follow the evolution of the overall package set, such that observing the reproducibility of the minimal ISO image does not give any clue about the reproducibility of the package set as a whole.
<details>
<summary>extracted/6418685/paper-images/reproducibility-absolute-python.png Details</summary>
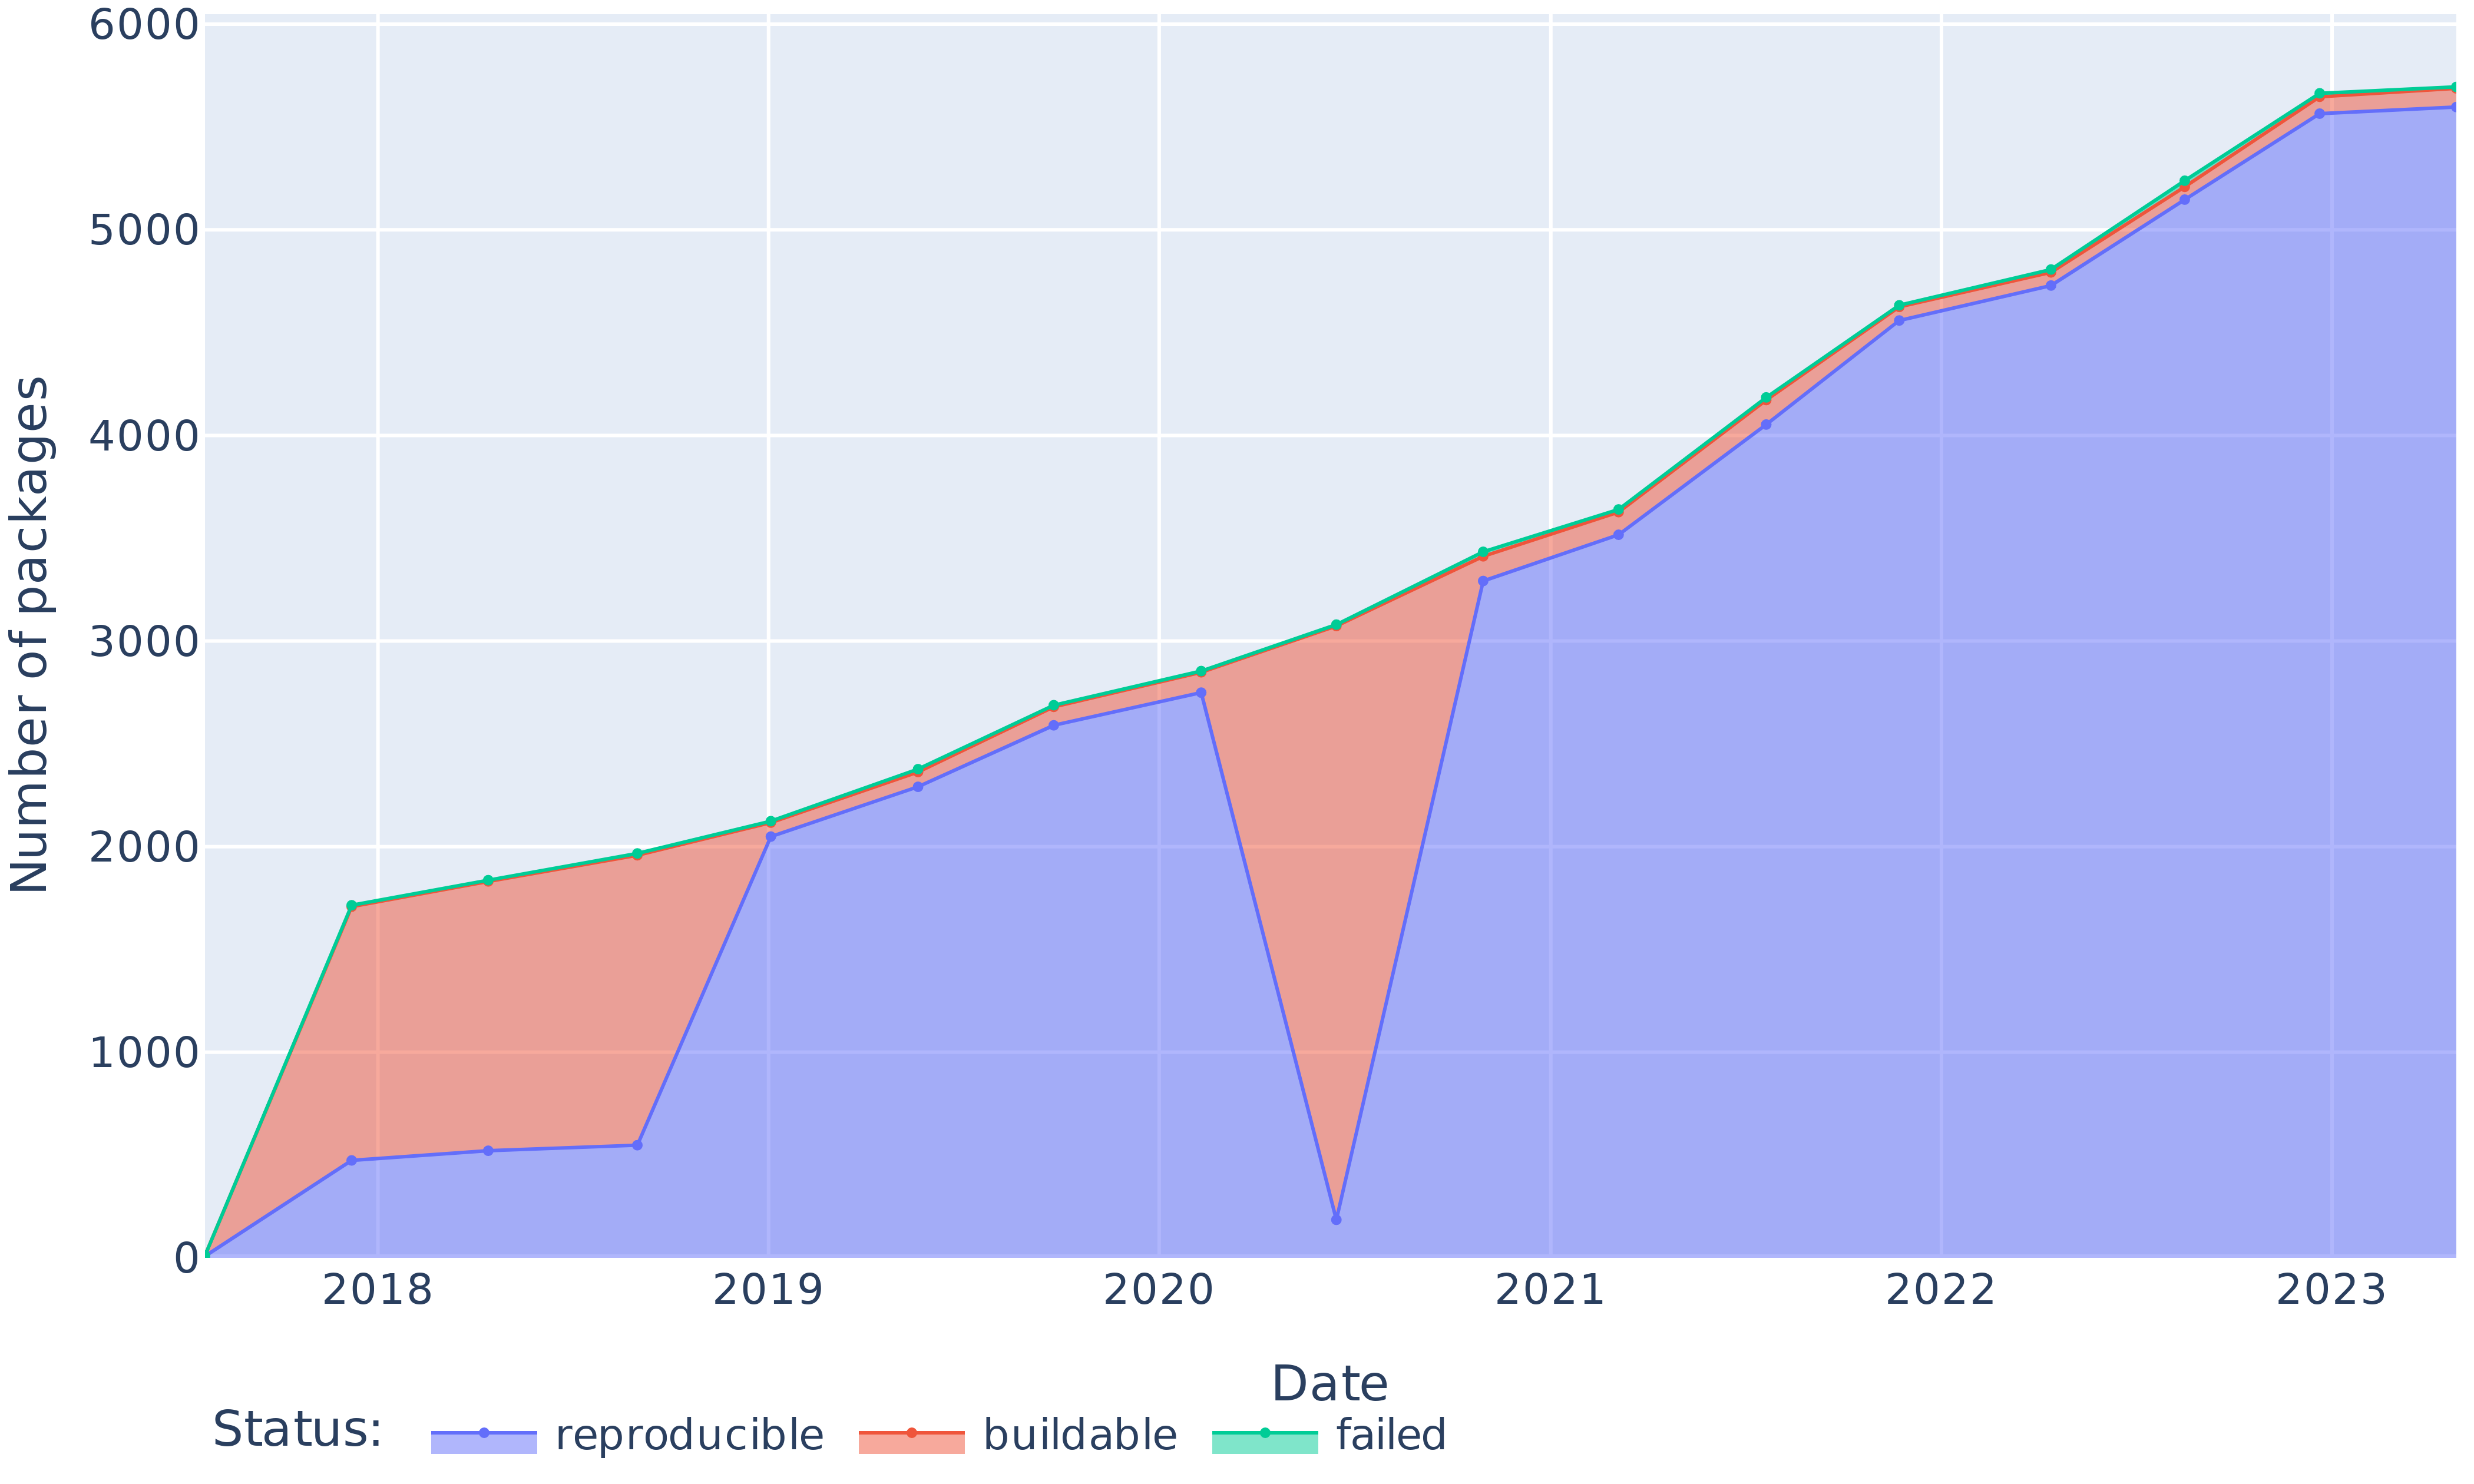
### Visual Description
## Stacked Area Chart: Package Build Status Over Time (2018-2023)
### Overview
This is a stacked area chart tracking the number of software packages in three different build statuses over a period from early 2018 to mid-2023. The chart shows the cumulative total of packages and the proportion within each status category over time. The overall trend is one of significant growth in the total number of packages, with a notable anomaly occurring around mid-2020.
### Components/Axes
* **Chart Type:** Stacked Area Chart.
* **X-Axis (Horizontal):** Labeled **"Date"**. It displays yearly markers: **2018, 2019, 2020, 2021, 2022, 2023**. The axis appears to represent a continuous timeline, with data points plotted at regular intervals (likely quarterly or bi-annually) between the year labels.
* **Y-Axis (Vertical):** Labeled **"Number of packages"**. The scale runs from **0 to 6000**, with major gridlines at intervals of 1000 (0, 1000, 2000, 3000, 4000, 5000, 6000).
* **Legend:** Positioned at the **bottom center** of the chart, below the x-axis label. It defines three categories under the heading **"Status:"**:
* **reproducible:** Represented by a **blue** line and filled area.
* **buildable:** Represented by an **orange/salmon** line and filled area.
* **failed:** Represented by a **green/teal** line and filled area.
* **Data Series:** The chart displays three stacked data series. The "reproducible" (blue) series forms the base layer. The "buildable" (orange) series is stacked on top of the blue layer, and the "failed" (green) series is stacked on top of the orange layer. The top green line therefore represents the total number of packages.
### Detailed Analysis
**Trend Verification & Data Points (Approximate Values):**
The chart shows a general upward trend for all three categories, with the total number of packages growing from near zero in early 2018 to approximately 5700 by mid-2023.
* **"reproducible" (Blue Line/Area):**
* **Trend:** Shows a generally increasing trend with a severe, sharp dip in mid-2020.
* **Key Points:** Starts at ~0 (early 2018). Rises to ~500 by mid-2018, ~600 by early 2019, and ~2100 by early 2020. Experiences a dramatic drop to approximately **200** in mid-2020. Recovers sharply to ~3300 by early 2021. Continues growing to ~4100 (early 2022), ~4800 (early 2023), and ends at ~5600 (mid-2023).
* **"buildable" (Orange Line/Area):**
* **Trend:** Shows a steady, consistent upward trend throughout the entire period. The area between the blue and orange lines represents packages that are buildable but not reproducible.
* **Key Points:** The orange line (top of this segment) starts at ~0. It is at ~1700 in mid-2018, ~2100 in early 2019, ~2700 in early 2020, and ~2900 in mid-2020 (during the blue line's dip). It continues to ~3400 (early 2021), ~4200 (early 2022), ~5200 (early 2023), and ends at ~5700 (mid-2023). The thickness of the orange band (buildable but not reproducible) is relatively narrow and consistent, except for a significant widening during the mid-2020 anomaly.
* **"failed" (Green Line/Area):**
* **Trend:** Also shows a steady, consistent upward trend, very closely following the "buildable" line. The area between the orange and green lines represents packages that failed to build.
* **Key Points:** The green line (top of the stack, representing the total) starts at ~0. It is at ~1700 (mid-2018), ~2100 (early 2019), ~2700 (early 2020), ~3100 (mid-2020), ~3500 (early 2021), ~4200 (early 2022), ~5200 (early 2023), and ends at ~5700 (mid-2023). The green "failed" band is very thin throughout, indicating that a very small proportion of the total packages fail to build compared to those that are buildable or reproducible.
### Key Observations
1. **Major Anomaly in Mid-2020:** The most striking feature is the dramatic, V-shaped collapse and recovery of the "reproducible" (blue) package count around the middle of 2020. During this event, the number of reproducible packages plummeted from ~2700 to ~200, while the total package count (green line) continued its steady rise. This caused the "buildable" (orange) segment to become very thick, indicating a massive increase in packages that were buildable but not reproducible during that specific period.
2. **Consistent Growth:** Outside of the 2020 anomaly, all three metrics show strong, consistent growth from 2018 to 2023. The total number of packages increased more than fivefold over the five-year period.
3. **Proportional Relationships:** For most of the timeline, the "reproducible" category constitutes the vast majority of packages. The "buildable but not reproducible" and "failed" categories represent small, relatively stable fractions of the total.
4. **Legend and Color Consistency:** The legend is clearly placed and the colors (blue, orange, green) are consistently applied to their respective data series and filled areas throughout the chart.
### Interpretation
This chart likely tracks the health and reproducibility of a software package repository (like a Linux distribution's package pool) over time. The data suggests:
* **System Expansion:** The repository has been growing rapidly, indicating active development and inclusion of new software.
* **The 2020 Reproducibility Crisis:** The sharp mid-2020 dip in reproducible packages is a critical event. It does not represent a loss of packages (as the total count kept growing), but rather a **systemic failure in the ability to reproduce builds** for a large portion of the existing package set. This could have been caused by a change in the build environment, a toolchain update, a change in the definition of "reproducible," or a widespread issue with timestamps or other non-deterministic elements in the build process. The rapid recovery suggests the issue was identified and remediated, possibly by updating build scripts or infrastructure.
* **High Build Success Rate:** The consistently thin "failed" band indicates that the build infrastructure is generally reliable, with very few packages failing to compile.
* **Reproducibility as the Norm:** Apart from the crisis period, the dominance of the blue area shows that achieving reproducible builds is the standard and successful state for this package ecosystem. The chart serves as a powerful visualization of both long-term progress and the impact of a specific, significant regression in build system integrity.
</details>
Figure 12: Evolution of the absolute number of reproducible, rebuildable (but unreproducible) and non-rebuildable packages from the Python ecosystem.
<details>
<summary>extracted/6418685/paper-images/minimal-iso-reproducibility.png Details</summary>
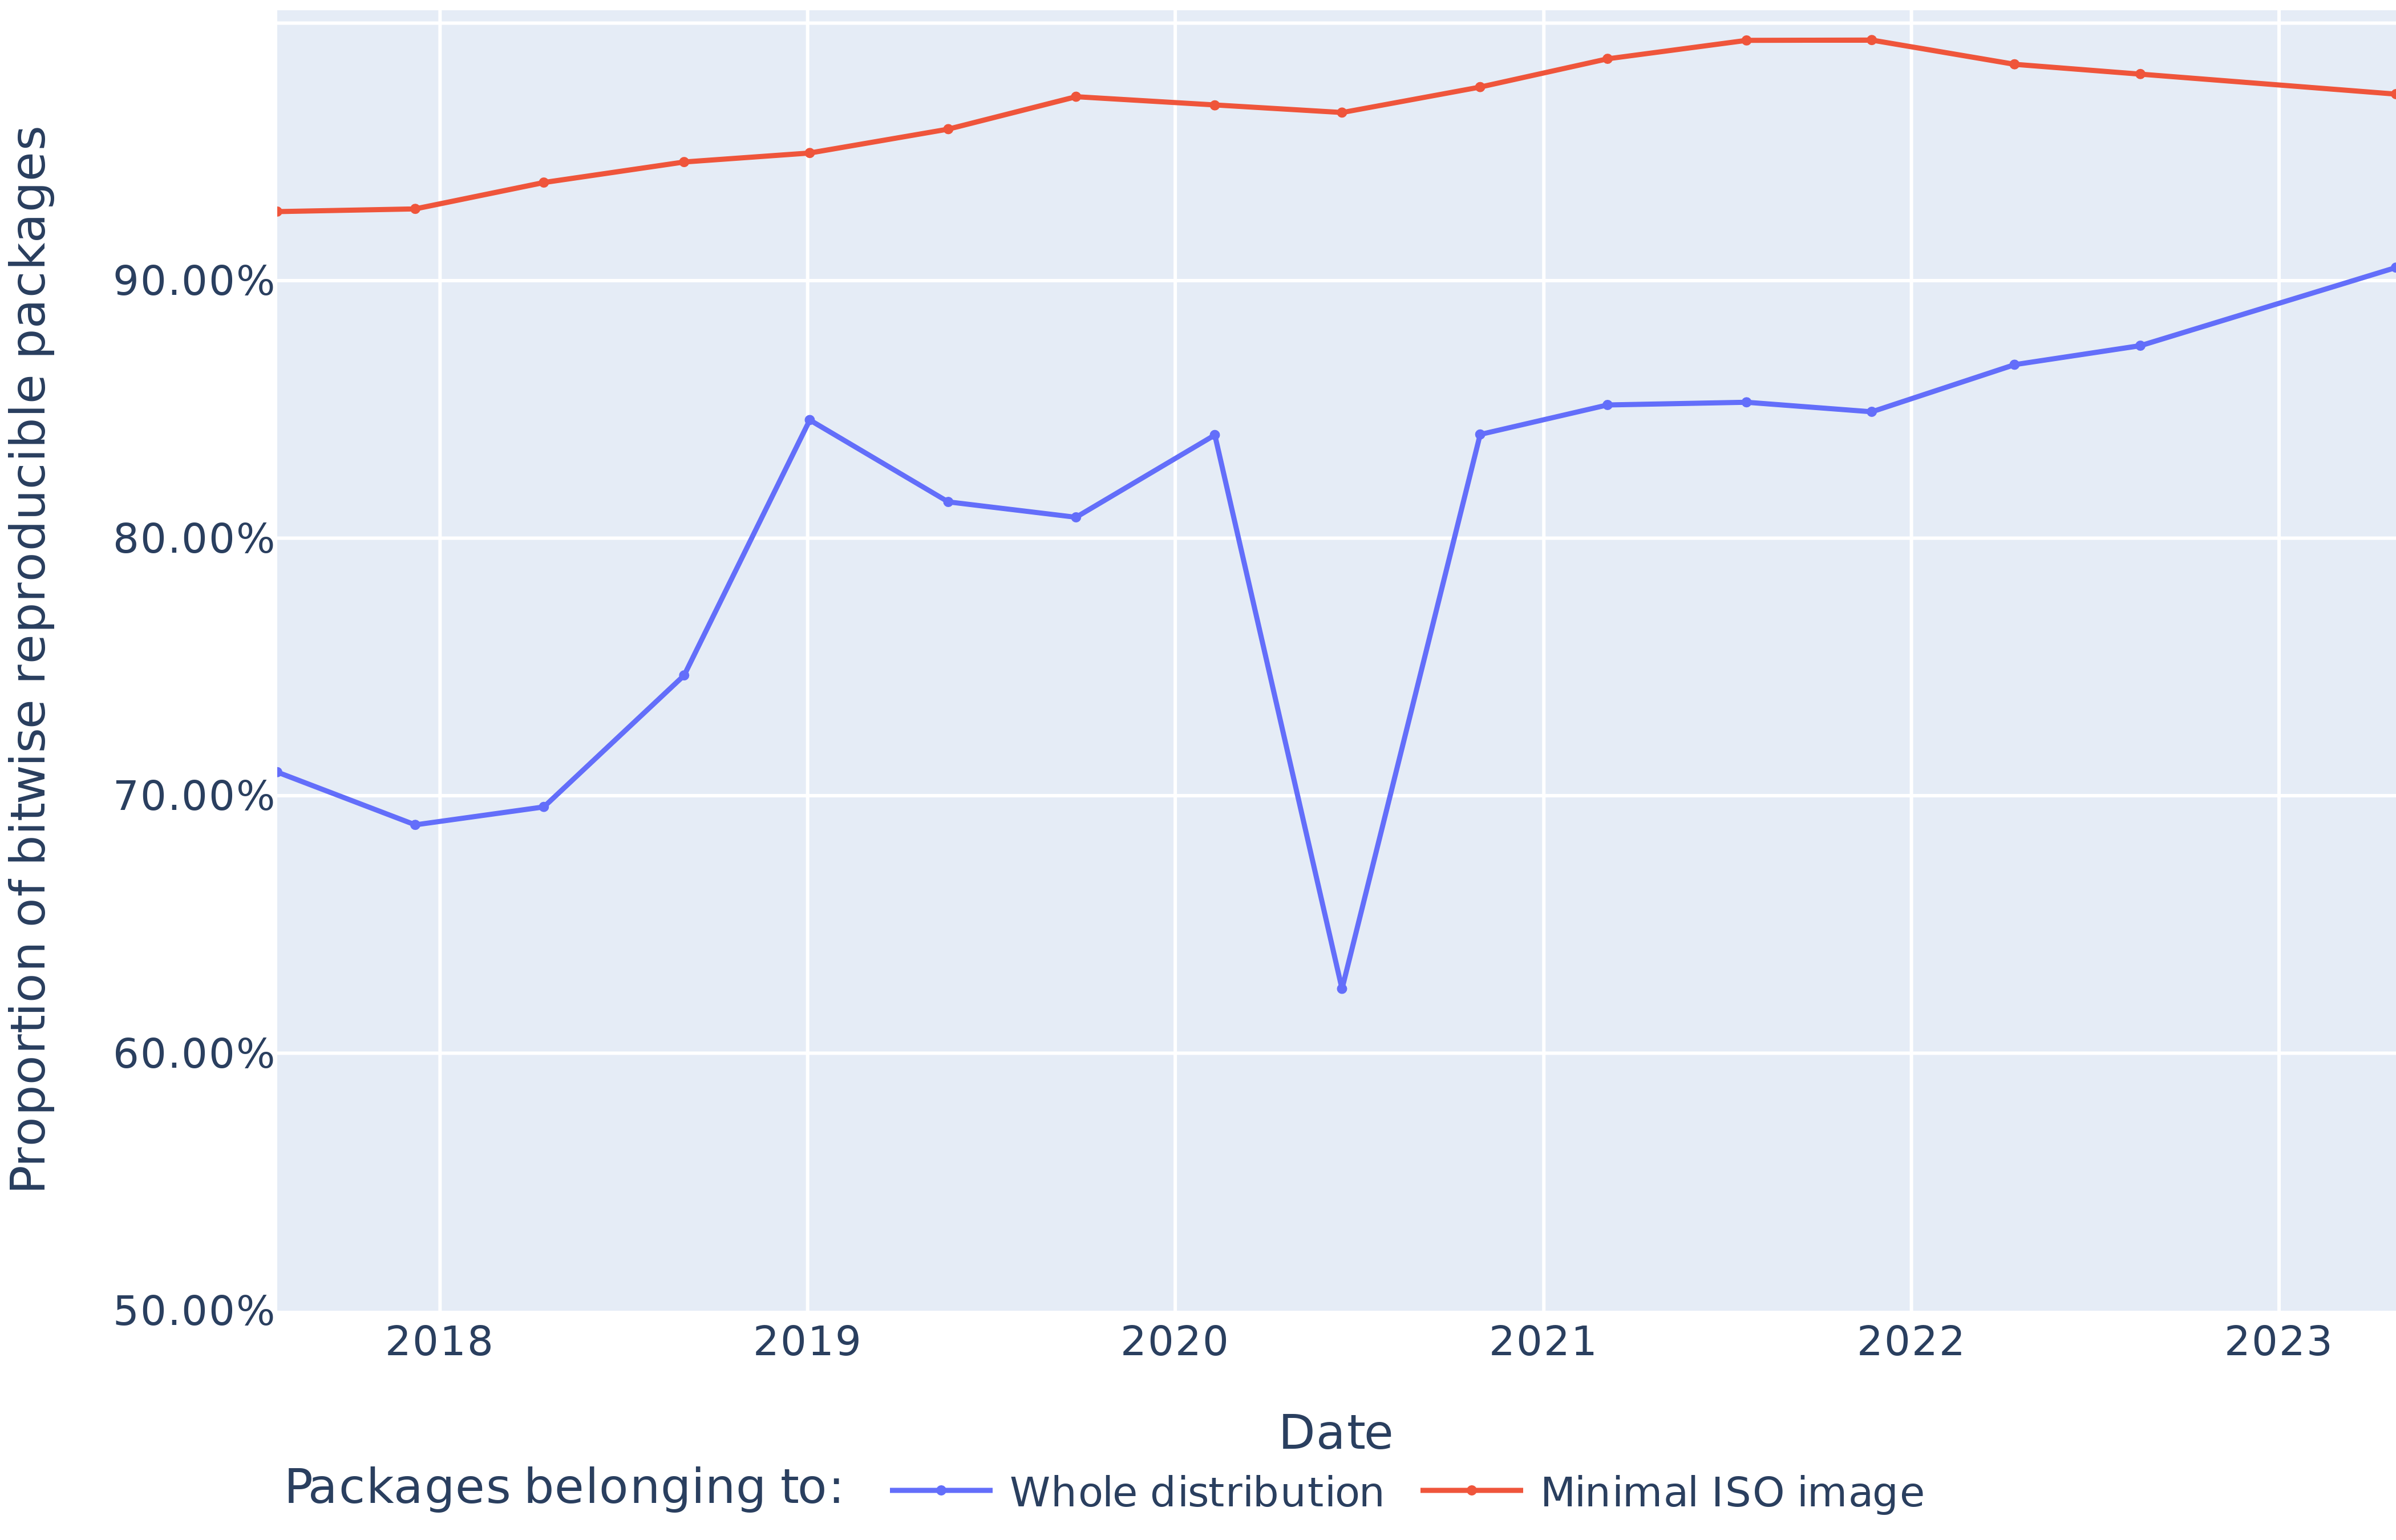
### Visual Description
## Line Chart: Proportion of Bitwise Reproducible Packages Over Time
### Overview
This is a line chart tracking the percentage of software packages that are "bitwise reproducible" over a period from approximately early 2017 to early 2023. It compares two distinct categories of packages within a software distribution. The chart shows a general upward trend for both categories, with one category maintaining a consistently high proportion and the other showing significant volatility before a strong recovery.
### Components/Axes
* **Chart Type:** Line chart with two data series.
* **Y-Axis (Vertical):**
* **Label:** "Proportion of bitwise reproducible packages"
* **Scale:** Percentage, ranging from 50.00% to 95.00% (visible gridlines at 50%, 60%, 70%, 80%, 90%).
* **X-Axis (Horizontal):**
* **Label:** "Date"
* **Scale:** Time, with major year markers for 2018, 2019, 2020, 2021, 2022, and 2023. Data points appear to be plotted at intervals more frequent than yearly (likely quarterly or monthly).
* **Legend:** Located at the bottom center of the chart.
* **Title:** "Packages belonging to:"
* **Series 1:** A blue line with circular markers labeled "Whole distribution".
* **Series 2:** A red/orange line with circular markers labeled "Minimal ISO image".
### Detailed Analysis
**1. "Minimal ISO image" (Red/Orange Line):**
* **Trend:** This line demonstrates a stable, high, and slightly increasing trend over the entire period. It starts just above 92% in early 2017, climbs gradually to a peak of approximately 95% around mid-2022, and then shows a very slight decline into 2023, ending near 94%.
* **Key Data Points (Approximate):**
* Start (2017): ~92.5%
* Peak (Mid-2022): ~95.0%
* End (Early 2023): ~94.0%
* **Spatial Grounding:** This is the top line on the chart, consistently positioned above the blue line.
**2. "Whole distribution" (Blue Line):**
* **Trend:** This line is highly volatile. It begins around 71%, dips slightly in 2018, then rises sharply to a local peak of ~84% in early 2019. It fluctuates between 80-84% through 2019 and early 2020 before experiencing a dramatic, sharp drop to its lowest point of ~62% in mid-2020. Following this trough, it recovers rapidly, climbing back to ~84% by early 2021. From 2021 onward, it shows a steady, consistent upward trend, surpassing its previous peak and ending at approximately 90% in early 2023.
* **Key Data Points (Approximate):**
* Start (2017): ~71.0%
* First Peak (Early 2019): ~84.0%
* Major Trough (Mid-2020): ~62.0%
* Recovery Peak (Early 2021): ~84.0%
* End (Early 2023): ~90.0%
* **Spatial Grounding:** This is the lower, more jagged line. Its most notable feature is the deep "V" shape centered on mid-2020.
### Key Observations
1. **Persistent Gap:** There is a consistent and significant gap between the two categories. The "Minimal ISO image" packages are always more reproducible than the "Whole distribution" packages, though this gap narrows considerably by the end of the period (from ~21 percentage points in 2017 to ~4 percentage points in 2023).
2. **The 2020 Anomaly:** The "Whole distribution" series suffers a severe, isolated drop in reproducibility in mid-2020. This is the most striking feature of the chart and suggests a specific event or change that temporarily broke reproducibility for a large subset of packages.
3. **Strong Post-2020 Recovery:** After the 2020 trough, the "Whole distribution" not only recovers to its previous levels but embarks on its most sustained period of growth, indicating a successful effort to improve reproducibility across the broader package set.
4. **Convergence Trend:** The trajectories of the two lines from 2021 to 2023 suggest a convergence, where the reproducibility of the entire distribution is catching up to the high standard set by the minimal core image.
### Interpretation
This chart visualizes the challenge and progress of achieving software build reproducibility. The "Minimal ISO image" represents a curated, core set of packages where reproducibility is a high priority and is easier to achieve due to fewer dependencies and a controlled environment. Its consistently high rate (>92%) shows this is a solvable problem.
The "Whole distribution" line represents the much harder task of making *all* packages in a large, complex ecosystem reproducible. Its volatility, especially the 2020 crash, highlights how fragile the process can be—susceptible to toolchain updates, dependency changes, or infrastructure shifts. The dramatic recovery and subsequent steady climb, however, are highly positive indicators. They suggest that the distribution's maintainers identified the causes of the 2020 failure, implemented robust fixes, and established sustainable practices that are now yielding continuous improvement. The narrowing gap implies that the principles and tooling developed for the minimal image are being successfully scaled to the entire distribution.
</details>
Figure 13: Evolution of the proportion of reproducible packages belonging to the minimal ISO image and in the entire package set.
### VI-D RQ3: Why are packages unreproducible?
We identified four heuristics that are both effective (they give a large number of matches in our diffoscope dataset) and relevant (they correspond to a software engineering practice that can be changed) to automatically determine why packages are not bitwise reproducible:
- Embedded dates: presence of build dates in various places in the built artifacts (version file, log file, file names, etc.). To detect dates embedded in build outputs, we look specifically for the year 2024 in added lines, given that we ran all our builds during 2024, but none of the historical builds ran during this year.
- uname output: some unreproducible builds embed build information such as the machine that the build was run on. While the real host name is hidden by the Nix sandbox, other pieces of information (such as the Linux kernel version or OS version, reported by uname) are still available.
- Environment variables: some builds embed some or all available environment variables in their build outputs. This typically causes unreproducibility because an environment variable containing the number of cores available to build on the machine is set by Nix.
- Build ID: some ecosystems (Go for example) embed a unique (but not deterministic) build ID into the artifacts.
Despite a well-known recommendation by the Reproducible Builds project to avoid embedding build dates in build artifacts to achieve bitwise reproducibility, we find that $12 831$ of our $86 317$ packages with diffoscopes contain a date, accounting for 14.8% of them. Still in the most recent nixpkgs revision, we find $470$ instances of this non-reproducibility cause, showing that embedding dates is still an existing practice. Additionally, we find that embedded environment variables and build IDs each account for 2.2% of our unreproducible packages. Finally, we find uname outputs in $1097$ of our unreproducible builds (1.3%), $721$ of which also include a date as part of the uname output. Figure 14 shows the evolution of the number of packages matched by each heuristic over time. Altogether, a total of 19.7% of the packages for which we have generated a diffoscope have an unreproducibility that can be explained by at least one of our heuristics.
We evaluate the precision of each heuristic by manually verifying $500$ matched lines for every heuristic and counting false positives. For the uname, build ID, and environment variables heuristics, we report a precision of 100%. For the date heuristic, we obtain a precision of 97.8% (11 false positives).
<details>
<summary>extracted/6418685/paper-images/evolution-heuristics.png Details</summary>
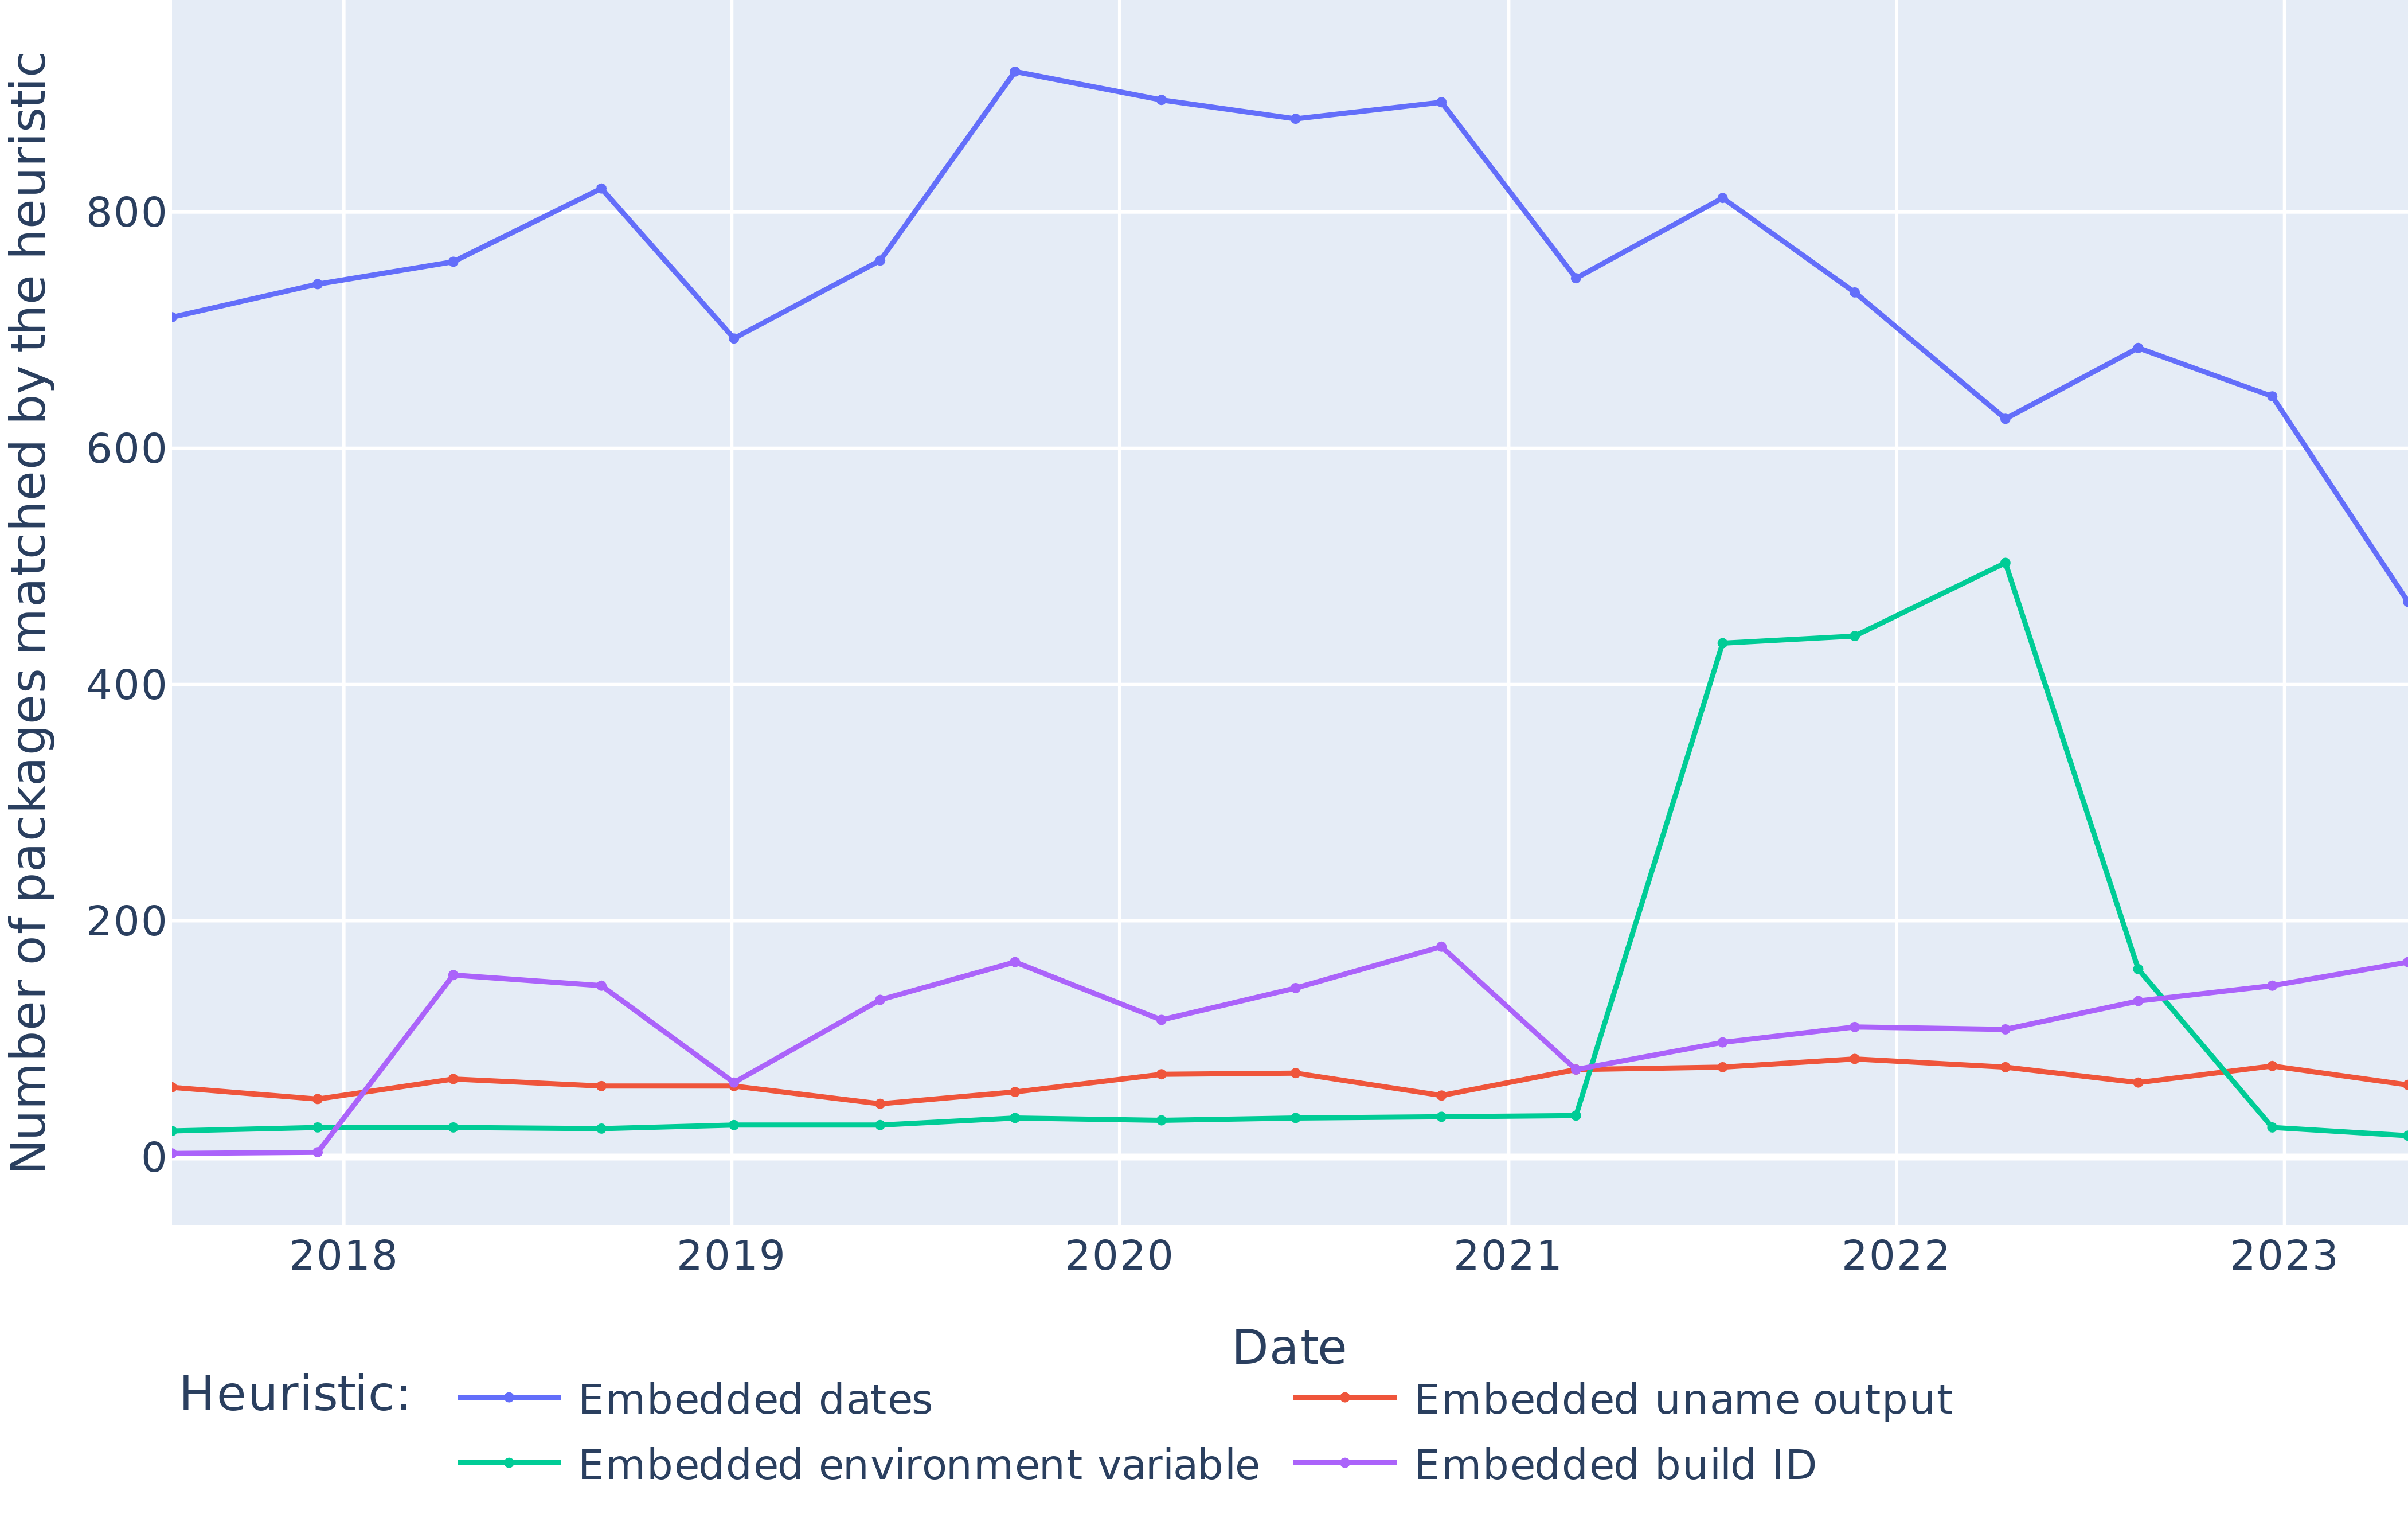
### Visual Description
\n
## Line Chart: Heuristic Matching of Packages Over Time (2018-2023)
### Overview
This is a line chart tracking the number of software packages matched by four different detection heuristics over a period from approximately early 2018 to late 2023. The chart visualizes trends in how frequently certain types of embedded information are found within packages over time.
### Components/Axes
* **Chart Type:** Multi-line chart.
* **X-Axis (Horizontal):** Labeled "Date". It displays yearly time markers: 2018, 2019, 2020, 2021, 2022, 2023. The axis appears to have quarterly or semi-annual data points between the year labels.
* **Y-Axis (Vertical):** Labeled "Number of packages matched by the heuristic". The scale runs from 0 to 800, with major gridlines at intervals of 200 (0, 200, 400, 600, 800).
* **Legend:** Positioned at the bottom center of the chart, below the x-axis label. It is titled "Heuristic:" and defines four data series:
* **Blue Line:** "Embedded dates"
* **Red/Orange Line:** "Embedded uname output"
* **Green Line:** "Embedded environment variable"
* **Purple Line:** "Embedded build ID"
### Detailed Analysis
**1. Embedded dates (Blue Line):**
* **Trend & Position:** This is the dominant series, consistently positioned at the top of the chart. It shows a general upward trend from 2018 to a peak around 2020, followed by a gradual decline through 2023.
* **Approximate Data Points:**
* Early 2018: ~710
* Mid-2018: ~760
* Early 2019: ~820 (local peak)
* Mid-2019: ~690 (dip)
* Early 2020: ~920 (global peak)
* Mid-2020: ~890
* Early 2021: ~890
* Mid-2021: ~740
* Early 2022: ~810
* Mid-2022: ~730
* Early 2023: ~620
* Mid-2023: ~680
* Late 2023: ~470
**2. Embedded environment variable (Green Line):**
* **Trend & Position:** This series is near the bottom (close to 0) for most of the timeline but exhibits a dramatic, isolated spike.
* **Approximate Data Points:**
* 2018 to early 2022: Remains very low, fluctuating between ~20 and ~30.
* Mid-2022: Sharp increase to ~430.
* Late 2022: Peaks at ~500.
* Early 2023: Drops sharply to ~160.
* Mid-2023: Falls back to baseline levels (~20).
**3. Embedded build ID (Purple Line):**
* **Trend & Position:** This series occupies the lower-middle range of the chart, showing moderate fluctuations.
* **Approximate Data Points:**
* Early 2018: ~0
* Mid-2018: ~155
* Early 2019: ~145
* Mid-2019: ~60 (dip)
* Early 2020: ~165
* Mid-2020: ~115
* Early 2021: ~175
* Mid-2021: ~70
* Early 2022: ~95
* Mid-2022: ~110
* Early 2023: ~105
* Mid-2023: ~130
* Late 2023: ~165
**4. Embedded uname output (Red/Orange Line):**
* **Trend & Position:** This is the most stable series, forming a nearly flat line near the bottom of the chart.
* **Approximate Data Points:** Consistently hovers between ~40 and ~80 throughout the entire period, with no significant peaks or valleys.
### Key Observations
1. **Dominance of Dates:** The "Embedded dates" heuristic matches significantly more packages than all others combined for the entire observed period, indicating timestamps are a very common artifact in packages.
2. **Anomalous Spike:** The "Embedded environment variable" heuristic shows a massive, temporary surge in matches during 2022, suggesting a specific event, widespread adoption of a new build practice, or a change in the heuristic's detection capability during that window.
3. **Stability of uname:** The "Embedded uname output" shows remarkable consistency, implying the inclusion of system information (like `uname -a` output) is a stable, low-frequency practice in package creation.
4. **Build ID Volatility:** The "Embedded build ID" shows more volatility than uname but less than the environment variable spike, suggesting its usage is somewhat variable but not tied to a single major event.
### Interpretation
This chart likely analyzes metadata or build artifacts within software packages (e.g., from repositories like npm, PyPI, or container images) to understand common fingerprinting or information leakage patterns.
* **What the data suggests:** The high prevalence of embedded dates points to build timestamps or file modification dates being routinely included. The 2022 spike in environment variables could correlate with a shift in CI/CD practices, a new popular toolchain that embeds such data, or a security research focus that led to better detection. The low, stable rate of `uname` output suggests it's a known but less common practice, possibly avoided due to security or reproducibility concerns.
* **Relationships:** The heuristics are independent detection methods. Their relative frequencies show which types of embedded data are most "noisy" or common. The spike in one heuristic (environment variable) does not correspond to a change in the others, indicating it was driven by a unique factor.
* **Notable Anomalies:** The 2022 environment variable spike is the primary anomaly. Its sharp rise and fall suggest a transient phenomenon rather than a permanent trend change. The consistent gap between "Embedded dates" and all other heuristics is a significant and persistent pattern.
</details>
Figure 14: Evolution of the number of packages for which we generated diffoscopes that are matched by each of our heuristics, over time.
### VI-E RQ4: How are unreproducibilities fixed?
Our analysis of 100 randomly sampled reproducibility fixes showed that, in most cases, authors are not aware that they are fixing a reproducibility issue, or they do not mention it: in 93 instances, we did not find any trace of reproducibility being mentioned. In fact, in 76 cases we found out that the reproducibility fix was just a routine package update, and it is very likely that the package becoming reproducible had more to do with changes in the upstream software than with a conscious action from the package maintainer. Other fixes included internal nixpkgs changes that had reproducibility impact as a side effect of the main reason behind the change.
Our study of the 15 most impactful fixes suggests that those are more often done with the intent of fixing reproducibility: in more than half of them (8 out of 15) the author mentioned and documented the reproducibility issue being fixed and 9 of them were changes internal to nixpkgs. Some large-scale reproducibility fixes were still package updates like toolchain updates.
## VII Discussion
This work brings valuable insights to the ongoing discussions about software supply chain security, reproducible builds, and functional package management.
False myth: reproducible builds (R-B) do not scale
One strongly held belief about R-B is that they work well in limited contexts—either selected “critical” applications (e.g., cryptocurrencies or anonymity technology) or strictly curated distributions—but either do not scale or are not worth the effort in larger settings. Our results can be interpreted as counter proof of this belief: in nixpkgs, the largest general-purpose repository with more than 70k packages (in April 2023), more than 90.5% packages are nowadays bitwise reproducible from source. R-B do scale to general purpose, regularly used software.
Recommendation: invest in infrastructure for binary caches and build attestations
To reap the security benefits of the R-B vision [lamb_reproducible_2022] in practice, users need multiple components: (1) signed attestations by each independent builder, publishing the obtained checksums at the end of a build; (2) caches of built artifacts, so that users can avoid rebuilding from source; (3) verification technology in package managers to verify that built artifacts in (2) match the consensus checksums in (1). With few exceptions, the infrastructure to support all this does not exist yet. Now that the “R-B do not scale” excuse is out of the picture, we call for investments to develop this infrastructure, preferably in a distributed architectural style to make it more secure, robust, and sustainable.
False myth: Nix implies bitwise reproducibility
Contradictory to the previous myth, there is also a belief that Nix (or functional package management more generally) implies bitwise reproducibility. Our results disprove this belief: about 9.4% of nixpkgs packages are not bitwise reproducible. This is not surprising, because R-B violations happen for multiple reasons, only some of which are mitigated by FPM per se.
Recommendation: use FPM for bitwise reproducibility and rebuildability
Still, Nix appears to perform really well at bitwise reproducibility “out of the box”, and even more so at rebuildability (above 99%). Based on this, we recommend to use Nix, or FPM more generally, for all use cases that require either mere rebuildability or full bitwise reproducibility. At worse, they provide a very good starting point.
This work has investigated the causes of the lingering non reproducibility in nixpkgs, but not those of reproducibility; it would be interesting to know why Nix performs so well, possibly for adoption in different contexts. It is possible that bitwise reproducibility is an emerging property of FPM, or that it comes from technical measures during build like sandboxing, or that Nix is simply benefiting (more than other distributions?) from the decade-long efforts of the R-B project in upstream toolchains. Exploring all this is left as future work.
QA monitoring for bitwise reproducibility
The significantly higher (and stably so) bitwise reproducibility performances of the NixOS minimal ISO image (see Figure 13) suggests that quality assurance (QA) monitoring for build reproducibility is an effective way to increase it. The fact that Debian uses a similar approach with good results [lamb_reproducible_2022] is compatible with this interpretation. A deeper analysis of the relationship between QA monitoring and reproducibility rate is out of scope for this work, but it is quite likely that extending reproducibility monitoring to all packages will result in an easy win for nixpkgs (assuming bitwise reproducibility is seen as a project goal).
## VIII Threats to validity
### VIII-A Construct validity
We rebuilt Nix packages from revisions in the period July 2017–April 2023, for about 6 years. That is enough to observe arguably long-term trends, which also appear to be stable in our analysis; except for one temporary regression, which we analyzed and explained. Still, we cannot exclude significant differences in reproducibility trends before/after the studied period.
Due to the high computation cost, build time, and environmental impact of rebuilding general purpose software from source, we sampled nixpkgs revisions to rebuild uniformly (every 4.1 months) within the studied period, totaling $14 296$ hours of build time. We cannot exclude trend anomalies between sampled revisions either, but that seems unlikely due to the stability of the observed long-term trends. More importantly, this means that we are less likely to catch short-spanned reproducibility regressions, which would be introduced and fixed within the same period between two sampled revisions. This can be improved upon by sampling and rebuilding more nixpkgs revisions, complementing this work.
When rebuilding a given package, we relied on the Nix binary cache for all its transitive dependencies. As we have rebuilt all packages from any sampled nixpkgs revisions, our package coverage is complete. But this way we have not measured the impact of unreproducible packages on transitive reverse dependencies, i.e., how many additional packages become unreproducible if systematically built from scratch, including all their dependencies? Our experiment matches real-world use cases and is hence adequate to answer our RQs, but it would still be interesting to know.
Also, during rebuilds we have not attempted to re-download online assets, but relied on the Nix cache. Hence, we have not measured the impact of lacking digital preservation practices on reproducibility and rebuildability. It would be interesting and possible to measure such impact by, e.g., first trying to download assets from their original hosting places and, for source code assets, fallback to archives such as Software Heritage [dicosmo_2017_swh] in case of failure.
### VIII-B External validity
We have rebuilt packages from nixpkgs, the largest cross-ecosystem FOSS distribution, using the Nix functional package manager (FPM). Other FPMs with significant user bases exist, such as Guix [courtes_functional_2013]. Given the similarity in design choices, we do not have reasons to believe that Guix would perform any differently in terms of build reproducibility than Nix, but we have not empirically verified it; doing so would be useful complementary work.
Neither did we verify historical build reproducibility in classic FOSS distributions (e.g., Debian, Fedora, etc.), as out of the FPM scope. Doing so would still be interesting, for comparison purposes. It would be more challenging, though, due to the fact that outside the FPM context, it is significantly harder to recreate exact build environments from years ago.
## IX Conclusion
In this work we conducted the first large-scale experiment of bitwise reproducibility in the context of the Nix functional package manager, by rebuilding $709 816$ packages coming from 17 revisions of the nixpkgs software repository, sampled every 4.1 months from 2017 to 2023. Our findings show that bitwise reproducibility in nixpkgs is very high and has known an upward trend, from 69% in 2017 to 91% in 2023. The mere ability to rebuild packages (whether bitwise reproducibly or not) is even higher, stably around 99.8%.
We have highlighted disparities in reproducibility across ecosystems that coexist in nixpkgs, as well as between packages for which bitwise reproducibility is actively monitored and the others. We have developed heuristics to understand common (un)reproducibility causes, finding that 15% of unreproducible packages were embedding the date during the build process. Finally, we studied reproducibility fixes and found out that only a minority of changes inducing a reproducibility fix were done intentionally; the rest appear to be incidental.
## Data availability statement
The dataset produced as part of this work is archived on and available from Zenodo [replication_metadata, replication_diffoscopes]. A full replication package containing the code used to run the experiment describe in this paper is archived on and available from Software Heritage [replication-code:1.0].
## Acknowledgments
This work would have not been possible without the availability of historical data from the official Nix package cache at https://cache.nixos.org with its long-standing “no expiry” policy. In the context of ongoing discussions to prune the cache, we strongly emphasize its usefulness for performing empirical research on package reproducibility, like this work. We also thank the NixOS Foundation for guaranteeing us that the revisions that we needed for this research would not be garbage-collected.