2502.05714v1
Model: healer-alpha-free
# Proving the Coding Interview: A Benchmark for Formally Verified Code Generation
**Authors**: Quinn Dougherty, Ronak Mehta
> Beneficial AI Foundation
> Independent
conference_101719.bib
## Abstract
We introduce the Formally Verified Automated Programming Progress Standards, or FVAPPS, a benchmark of 4715 samples for writing programs and proving their correctness, the largest formal verification benchmark, including 1083 curated and quality controlled samples. Previously, APPS provided a benchmark and dataset for programming puzzles to be completed in Python and checked against unit tests, of the kind seen in technical assessments in the software engineering industry. Building upon recent approaches for benchmarks in interactive theorem proving, we generalize the unit tests to Lean 4 theorems given without proof (i.e., using Lean’s “sorry” keyword). On the 406 theorems of 100 randomly selected samples, Sonnet correctly proves 30% and Gemini correctly proves 18%. We challenge the machine learning and program synthesis communities to solve both each general purpose programming problem and its associated correctness specifications. The benchmark is available at https://huggingface.co/datasets/quinn-dougherty/fvapps.
Index Terms: theorem proving, machine learning, program synthesis, formal verification
## I Introduction
Large Language Models (LLMs) have developed incredible capabilities, spanning creative writing, tutoring and education, information retrieval and distillation, common sense reasoning, complex mathematical reasoning, and even code generation [chatbotarena, gpt4, llama3, deepseek]. Particular focus and attention has been given towards LLM-assisted software development, given its economic value and position between natural language and formal logic.
We have seen rapid advancements in code generation capabilities [Singh2023CodeFusionAP, jimenez2023swe, Hendrycks2021MeasuringCC]. With this has come strong concerns around the misuse and safety of code generated by these models, and the ability to prove or guarantee that the produced code is sound. An approach commonly employed today includes running LLM-generated code in restricted development environments, and ensuring tight feedback loops with software engineers who understand the unique failure modes of their particular complex software. This paired programming-style approach is common in LLM chatbot interfaces, as well as programming assistants more strongly integrated in the software engineering development cycle such as GitHub Copilot [chen2021evaluating] and Cursor (Anysphere Inc., 2023).
However, recent paradigm shifts in the ability to develop and enhance capabilities through supervised fine-tuning has led to fully autonomous software engineering, which includes code generation and execution in the development loop (e.g., Devin, Cognition AI, Inc. 2023, [wang2024openhandsopenplatformai]). Without a human evaluating code before it is run, strong assumptions or restrictions are necessary to ensure that generated code is safe and correct. Critically, as these tools become ubiquitous across more and more applications that touch the real world, it will be a requirement that we have guarantees of their safety and correctness. Code generated for managing medical devices, for managing patient records, for ensuring the security of private personal information, for controlling autonomous vehicles, for cybersecurity defense systems, and for military use will all require strong guarantees before users, organizations, and governments can make effective use of these tools.
While software quality assurance primarily relies on extensive testing, the emerging field of deductive verification offers a more rigorous alternative by mathematically proving code correctness against formal specifications. However, this approach requires deep system knowledge, explicit property definitions, and often demands rewriting existing code in specialized proof assistant languages—a significant challenge given the current state of tools. As Large Language Models (LLMs) advance in code generation capabilities, they may eventually enable automated creation of deductively verifiable code, allowing us to defer trust to theorem provers rather than testing alone. This could revolutionize mission-critical software development by providing formal guarantees against bugs and hallucinations, though current LLM capabilities fall short of this goal, and it remains unclear whether fine-tuning or prompt engineering can bridge this gap.
Contributions. We deliver a set of 4,715 Lean 4 files consisting of a solution function signature and theorem statements, all of which are passed on for future proving via the “sorry” keyword, allowing the lean executable to compile without actual proofs or implementations. We provide tags for samples that pass additional, rigorous quality assurance, defined by inline unit testing and property tests in Lean.
## II The FVAPPS Benchmark
<details>
<summary>extracted/6182580/figs/FVAPPS_Pipeline.png Details</summary>
### Visual Description
## Diagram: Benchmark Generation Pipeline
### Overview
This image is a flowchart diagram illustrating a multi-stage pipeline for generating a benchmark dataset called "FVAPPS" from an initial source, the "Original APPS Dataset." The process involves sequential data transformation steps, each followed by a validation check. The final output is categorized into three distinct types based on the results of the validation stages.
### Components/Axes
The diagram is structured as a left-to-right flowchart with the following key components:
1. **Title:** "Benchmark Generation Pipeline" (centered at the top).
2. **Input:** A document stack icon labeled "Original APPS Dataset" (top-left).
3. **Process Steps (Yellow Rectangles):**
* Preprocess Dataset
* Generate Python Property Tests
* Generate Lean Theorem Statements
* Generate Solutions and #guard_msgs Unit Tests
4. **Decision Points (Blue Diamonds):**
* python Success?
* pytest Success?
* lean Success? (appears twice)
* Plausible?
5. **Output Section (Right Side):** A large container labeled "FVAPPS" containing three document stack icons representing the final output categories:
* Guarded and Plausible (top)
* Guarded (middle)
* Unguarded (bottom)
6. **Flow Control:** Arrows connect the components, labeled with "Yes" or "No" to indicate the path taken based on the outcome of a decision point. One arrow is labeled "10 Failures?".
### Detailed Analysis
The pipeline proceeds through the following sequential stages:
1. **Input:** The process begins with the "Original APPS Dataset."
2. **Stage 1 - Preprocessing:**
* **Process:** "Preprocess Dataset."
* **Decision:** "python Success?"
* **Flow:** If "No," the process loops back to "Preprocess Dataset." If "Yes," it proceeds to the next stage.
3. **Stage 2 - Python Test Generation:**
* **Process:** "Generate Python Property Tests."
* **Decision:** "pytest Success?"
* **Flow:** If "No," the process loops back to "Generate Python Property Tests." If "Yes," it proceeds.
4. **Stage 3 - Theorem Generation:**
* **Process:** "Generate Lean Theorem Statements."
* **Decision:** "lean Success?"
* **Flow:** If "No," the process loops back to "Generate Lean Theorem Statements." If "Yes," it proceeds.
5. **Stage 4 - Solution & Guard Generation:**
* **Process:** "Generate Solutions and #guard_msgs Unit Tests."
* **Decision:** "lean Success?"
* **Flow:** This decision has two exit paths:
* **Path A (Failure):** An arrow labeled "10 Failures?" leads directly to the "Unguarded" output category.
* **Path B (Success):** An arrow labeled "Yes" leads to the next decision point, "Plausible?".
6. **Final Classification:**
* **Decision:** "Plausible?"
* **Flow:** This decision classifies the successfully generated item into one of two final categories:
* If "Yes," the output is categorized as "Guarded and Plausible."
* If "No," the output is categorized as "Guarded."
### Key Observations
* **Iterative Refinement:** The first three stages (Preprocessing, Python Test Generation, Theorem Generation) feature feedback loops. Failure at the validation step ("No") causes the process to retry the same generation step, suggesting an iterative or corrective approach.
* **Critical Failure Path:** The "Generate Solutions and #guard_msgs Unit Tests" stage has a distinct failure mode. If it results in "10 Failures?" (the exact meaning of this threshold is not defined in the diagram), the item is immediately classified as "Unguarded," bypassing the "Plausible?" check.
* **Two-Tiered Success:** Passing all technical validations (python, pytest, lean) does not guarantee the highest-quality output. A final "Plausible?" check separates "Guarded and Plausible" from merely "Guarded" outputs.
* **Output Hierarchy:** The three output categories in the "FVAPPS" box imply a quality or reliability hierarchy: "Guarded and Plausible" (highest), "Guarded" (middle), and "Unguarded" (lowest).
### Interpretation
This diagram details a technical pipeline for creating a validated benchmark (FVAPPS) from a source dataset (APPS). The process is designed to automatically generate and verify code-related artifacts (property tests, theorem statements, solutions with guard messages).
The pipeline's structure reveals its core purpose: **to filter and classify programming problems or solutions based on their verifiable correctness and plausibility.** The multiple "Success?" checks act as gates ensuring technical soundness (code runs, tests pass, theorems are valid). The final "Plausible?" gate introduces a semantic or logical check beyond mere technical execution.
The existence of the "Unguarded" category for items that fail catastrophically (10 failures) suggests the pipeline is robust enough to handle and categorize failure cases rather than discarding them. This creates a benchmark with graded difficulty or reliability levels, which is valuable for evaluating AI systems—some problems are fully verified ("Guarded and Plausible"), some are partially verified ("Guarded"), and some are known to be problematic ("Unguarded"). The name "FVAPPS" likely stands for "Formally Verified APPS" or a similar concept, emphasizing the formal methods (Lean theorems) used in the generation process.
</details>
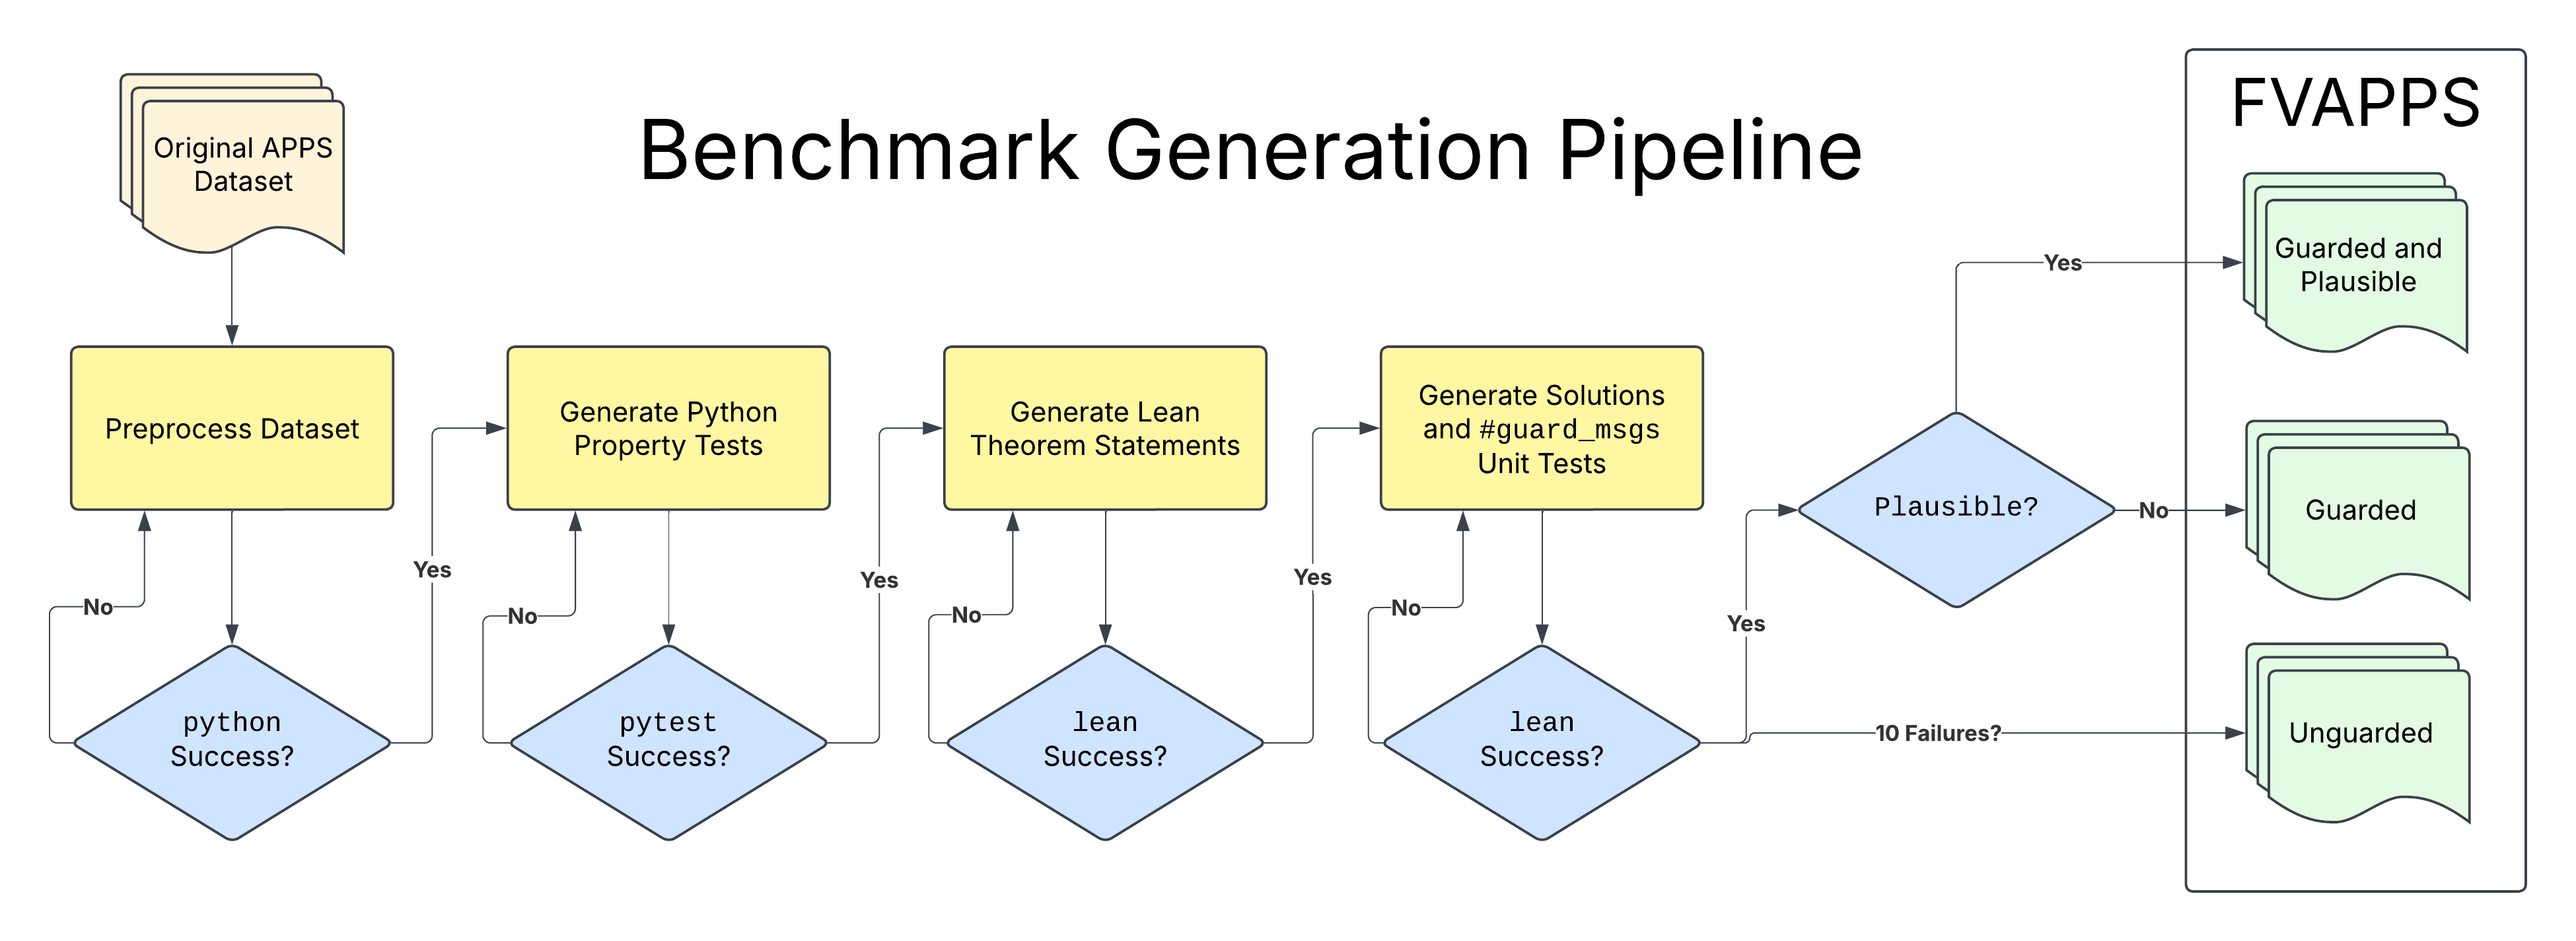
Figure 1: Benchmark generation pipeline for creating coding interview theorem statements in Lean from APPS questions and solutions.
A strong benchmark for evaluating model capabilities for theorem proving should have a number of desirable properties. With a particular focus on software engineering, algorithms and properties of those algorithms should well represent tasks and solutions that are used to evaluate skill in the labor force today. Coding interview questions fit this requirement naturally. With generic coding capabilities well-evaluated, we can build upon existing benchmarks of coding ability to generate our formally-verified one.
We begin with APPS, a benchmark and dataset for programming puzzle solving [Hendrycks2021MeasuringCC]. Developed largely by scraping the interview preparation platforms CodeForces and LeetCode, each sample consists of a natural language question, a ternary flag marking difficulty, a list of correct solutions in Python, and a few input-output test case pairs.
### II-A An Example Task
⬇
def solve_elections (n : Nat) (voters : List (Nat à Nat)) : Nat := sorry
theorem solve_elections_nonnegative (n : Nat) (voters : List (Nat à Nat)) : solve_elections n voters >= 0 := sorry
theorem solve_elections_upper_bound (n : Nat) (voters : List (Nat à Nat)) : solve_elections n voters <= List. foldl (λ acc (pair : Nat à Nat) => acc + pair.2) 0 voters := sorry
theorem solve_elections_zero_votes (n : Nat) (voters : List (Nat à Nat)) : (List. all voters (fun pair => pair.1 = 0)) -> solve_elections n voters = 0 := sorry
theorem solve_elections_single_zero_vote : solve_elections 1 [(0, 5)] = 0 := sorry
Figure 2: FVAPPS sample 23, derived from train sample 23 of APPS source. The def is where the solver implements the function, each theorem is a correctness specification.
As an example, consider the crooked election problem:
There are $n$ voters, and two ways to convince each of them to vote for you. The first way to convince the $i$ -th voter is to pay him $p_i$ coins. The second way is to make $m_i$ other voters vote for you, and the $i$ -th voter will vote for free. Moreover, the process of such voting takes place in several steps. For example, if there are five voters with $m_1=1$ , $m_2=2$ , $m_3=2$ , $m_4=4$ , $m_5=5$ , then you can buy the vote of the fifth voter, and eventually everyone will vote for you. Set of people voting for you will change as follows: ${5}→{1,5}→{1,2,3,5}→{1,2,3,4,5}$ .
Calculate the minimum number of coins you have to spend so that everyone votes for you.
To get everyone to vote for you, you can either purchase votes for each voter’s declared price, or convert each voter through their declared groupthink threshold. This is the setup of sample 0023, derived from APPS problem train/23 https://huggingface.co/datasets/codeparrot/apps/viewer/all/train?row=23. Figure 2 is our pipeline’s output that we ship in our dataset. Crucially, it is one def and multiple theorem s, though many samples include extra definitions that are helper functions either for the solution or some theorem statement. The def is where the problem solution is implemented as a first-order requirement to proving theorems about its correctness.
While a number of theorem provers now exist, we choose Lean because of its explosive growth in mathematics https://leanprover-community.github.io/mathlib_stats.html and its fertile potential for general-purpose programming [christiansen2023fpinlean]. Lean is capable of expressing arbitrary programs, taking advantage of the identity monad and the partial keyword.
### II-B Generation Pipeline
Sonnet 3.5 read run $λ c.c+\texttt{stderr}$ exitcode write $p_0$ $c_k$ 0 1 $p_k+1$
Figure 3: Our generic scaffolding loop used at various stages of our pipeline. The run element is replaced with the python, pytest, lean, or lake build executable respectively.
We use Anthropic’s Claude Sonnet 3.5 Model version claude-3-5-sonnet-20241022, accessed October 25th 2024. to power five core parts of our benchmark creation pipeline. In stages one through three of our pipeline, whenever a non-deductive LLM call is used for processing, we allow for a maximum of 5 attempts before "failing" on that sample. Stage four allows for a maximum of ten, and stage five has no LLM call. These loops include simple instructions that pass relevant error messages back to the model and ask for an updated response. Given that subsets of our pipeline fall withing the scope of what is capable with current LLMs, we construct scaffolding loops for iterating on model-based solutions. Broadly, we use outputs from python, pytest, lean, and lake build to ensure the generated code is correct, and to collect standard error and outputs to send back to the model when incorrect (Figure 3).
We first preprocess the original APPS dataset, aggregating unit tests and solutions into one file with a particular function definition and architecture that better lends itself to automated unit testing. This step also selects a single solution from the set of solutions provided by the original APPS dataset.
Property-based tests are procedurally generated unit tests, up to boundary conditions given on input types [MacIver2019Hypothesis]. We use our scaffolding loop outlined above, specifically feeding pytest ’s standard error and standard out messages back into the next API call. When pytest returns an empty standard error and an exit code of zero, we write the final file of tests to disk and exit the loop.
The lean executable is used as our supervisor for the third step, again with standard error and standard output fed back to the model API until a valid lean file is constructed. The model is prompted to explicitly convert the property tests into unproven theorem statements (cleared via sorry). The lean executable Lean (version 4.12.0, x86_64-unknown-linux-gnu, commit dc2533473114, Release). is used to typecheck the theorem statements, ignoring the sorry s but ensuring statements are well-formed.
Step four of our process aims to add more strict quality assurance to our lean outputs. Using unit tests that have been generated by our preprocessing step as assertions in Python, we deductively parse these assertions to construct inline unit tests in Lean https://github.com/leanprover/lean4/blob/master/src/Lean/Elab/GuardMsgs.lean. In parallel, we translate the Python solutions into Lean 4 as def s, and require that the guard messages "pass". While theorem statements and property tests are broadly our primary goal and focus, these unit tests provide an easy way to filter for solutions that are not correct in some minimal form.
The last phase of our pipeline involves ensuring that the theorems we wish to provide are probably true, using Lean’s property-based testing framework Plausible https://reservoir.lean-lang.org/@leanprover-community/plausible. Any theorems that are not " plausible " at this stage, given our solutions that pass unit tests, are filtered.
All code and prompts used for the generation can be found at our open-source GitHub repository. https://github.com/quinn-dougherty/fvapps
### II-C Results
| 0 | 1963 | 1735 |
| --- | --- | --- |
| 1 | 1915 | 1450 |
| 2 | 584 | 842 |
| 3 | 143 | 394 |
| 4 | 75 | 183 |
| 5 | 35 | 111 |
TABLE I: Iterations needed for Pytest and Lean agents to converge, filtered to those that made it passed Stage 3 of the pipeline.
We provide three subsets of our benchmark according to the assurance level, depending on when the samples were chosen and filtered in our pipeline.
Unguarded
This largest set represents all examples that generated valid theorems, ending at Stage 3 of our full pipeline. Table I shows the number of execution-generation loops needed to pass our generation criterion in Stages 2 and 3. The Pytest agent took on average 0.846 iterations (with the 0th position as initialization prompt), and the Lean agent took on average 1.188 iterations.
<details>
<summary>extracted/6182580/figs/num_theorems_across_samples.png Details</summary>
### Visual Description
## Histogram: Number of defs and theorems across samples (N=4715)
### Overview
The image is a histogram displaying the distribution of the number of theorems per sample within a dataset of 4,715 samples. The chart shows a strongly right-skewed distribution, where the vast majority of samples contain a small number of theorems, and very few samples contain a large number.
### Components/Axes
* **Title:** "Number of defs and theorems across samples (N=4715)" (Located at the top center of the chart).
* **X-Axis:** Labeled "Num theorems". It represents the number of theorems in a sample. The axis has major tick marks at 0, 10, 20, 30, 40, and 50.
* **Y-Axis:** Labeled "Num samples". It represents the count (frequency) of samples. The axis has major tick marks at 0, 200, 400, 600, 800, 1000, and 1200.
* **Data Series:** A single data series represented by blue vertical bars (a histogram). Each bar's width represents a bin (range) of theorem counts, and its height represents the number of samples falling within that bin.
### Detailed Analysis
The histogram bars are concentrated on the far left side of the chart, indicating the data is heavily skewed.
* **Bin 0-1 (approx.):** The first bar, starting at 0, has a height of approximately 280 samples.
* **Bin 1-2 (approx.):** The second bar is significantly taller, with a height of approximately 600 samples.
* **Bin 2-3 (approx.):** The third bar is the tallest in the chart, reaching a peak of approximately 1250 samples.
* **Bin 3-4 (approx.):** The fourth bar is slightly shorter than the peak, with a height of approximately 1120 samples.
* **Bin 4-5 (approx.):** The fifth bar has a height of approximately 850 samples.
* **Bin 5-6 (approx.):** The sixth bar has a height of approximately 390 samples.
* **Bin 6-7 (approx.):** The seventh bar has a height of approximately 120 samples.
* **Bin 7-8 (approx.):** The eighth bar has a height of approximately 80 samples.
* **Bin 8-9 (approx.):** The ninth bar has a height of approximately 20 samples.
* **Bin 9-10 (approx.):** The tenth bar has a height of approximately 10 samples.
* **Beyond 10:** There are one or two very short, barely visible bars between 10 and 15 on the x-axis, representing a negligible number of samples (likely <5 each). No bars are visible beyond approximately x=15, despite the axis extending to 50.
**Trend Verification:** The visual trend is a sharp, steep rise to a peak at 2-3 theorems, followed by a rapid, exponential-like decay. The line formed by the tops of the bars slopes steeply upward from left to the peak, then slopes steeply downward to the right.
### Key Observations
1. **Strong Right Skew:** The distribution is not symmetric. The tail extends far to the right, but the mass of data is concentrated on the left.
2. **Clear Peak Mode:** The modal bin (most frequent) is for samples containing approximately 2-3 theorems.
3. **Low Theorem Count Dominance:** The overwhelming majority of samples (visually estimated >95%) contain 10 or fewer theorems.
4. **Sparse High-Count Samples:** Samples with more than 10 theorems are extremely rare in this dataset. The x-axis scale to 50 appears largely unused, suggesting the maximum number of theorems in any sample is likely less than 20.
5. **Terminology Note:** The title mentions "defs and theorems," but the x-axis is labeled only "Num theorems." This suggests the chart may specifically be counting theorems, or "defs" (definitions) might be included in the count or analyzed separately in a different chart not shown here.
### Interpretation
This histogram provides a quantitative profile of the complexity of the samples in the dataset (N=4715), where complexity is measured by the number of theorems.
* **What the data suggests:** The dataset is composed primarily of samples that are mathematically or logically simple, containing only a handful of theorems. This could indicate the dataset consists of many short proofs, lemmas, or exercises. The rarity of samples with many theorems suggests that long, complex proofs or comprehensive mathematical developments are uncommon within this collection.
* **Relationship between elements:** The title sets the context (counting theorems across many samples). The axes define the measurement (theorem count vs. frequency). The shape of the histogram directly visualizes the central tendency (low theorem count) and the variance (limited spread) of the dataset's complexity.
* **Notable Anomalies/Considerations:** The primary anomaly is the extreme skew. The disconnect between the title ("defs and theorems") and the axis label ("Num theorems") is a point of ambiguity. It is unclear if definitions are being counted alongside theorems, if the title is slightly inaccurate, or if this is one of a pair of charts. For a technical document, this ambiguity should be clarified. The choice of x-axis range (0-50) is also noteworthy, as it visually emphasizes the emptiness of the higher range, reinforcing the conclusion about the scarcity of complex samples.
</details>
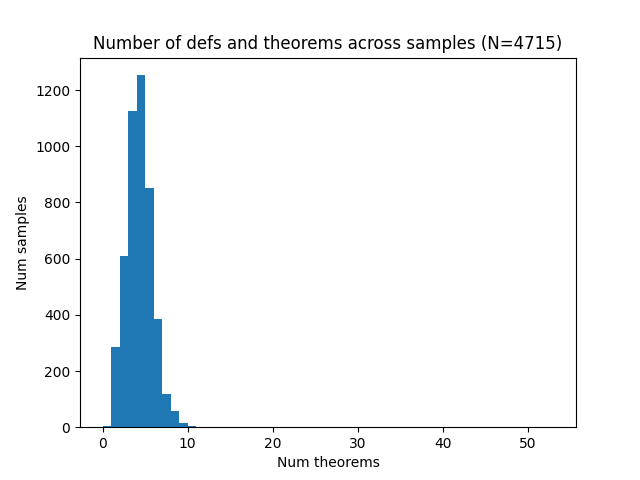
Figure 4: Total number of defs and theorems across FVAPPS samples.
Of the 4715 successful samples, the median number of theorems is four (Figure 4).
Guarded
Samples that passed Stage 4 of our pipeline include those samples where solutions were able to be identified that pass simple unit tests. While we don’t include these solutions in our set here, the definitions have been verified to admit a solution such that these basic unit tests pass. Importantly this means that claude-3-5-sonnet-20241022 was able to solve the problem with our scaffold. 2089 samples passed this level of assurance.
Guarded and Plausible
1083 samples passed through all five parts of our pipeline These problems are solvable and well-stated to the highest possible probability short of a full proof (which we leave to the LLMs and other program synthesis methods). Note that the definitions in each of the sets Guarded and Guarded and Plausible are somehow "easy" in the sense that current language models can provide definitions.
All 4715 samples are provided as a dataset on HuggingFace with appropriate tagging. https://huggingface.co/datasets/quinn-dougherty/fvapps
## III Baseline Experiments
Our baseline task is to implement and prove each invocation of the word "sorry" in the benchmark’s source specification. We provide preliminary evaluations here, using a loop similar to the generation pipeline. We attempt to solve 101 randomly sampled FVAPPS problems with both Claude 3.5 Sonnet (new) and Gemini 1.5 Pro Retrieved in early November 2024.. For a direct human comparison, we allocated ten hours for a baseliner to attempt one sample.
### III-A Model Baseline Details
We use Lean 4.12.0 throughout our benchmark generation and baseline, pinned with Mathlib available in the environment. Mathlib commit: 809c3fb3b5c8f5d7dace56e200b426187516535a We attempt to produce a partial baseline for a subset of FVAPPS using claude-3-5-sonnet-20241022 (the same model that generated the task).
A note on open source models. We spent some time attempting to solve benchmark samples with small and medium-sized open source models. Particularly, we attempted simple, single-shot autocompletion of theorem statements using DeepSeek’s DeepSeek-Prover-V1.5-RL https://huggingface.co/deepseek-ai/DeepSeek-Prover-V1.5-RL [xin2024deepseekproverv15harnessingproofassistant], but were unable to find a one-shot or loop-based scaffolding solution that made any sufficient progress. An important part of this task seems to be the ability to iterate, and while models fine-tuned to reduce loss on next token prediction in Lean may eventually prove to be useful, currently their limited capability in broader, less narrow goals is insufficient.
#### III-A 1 Prompt Details
Because Lean 4 is in active development and interfaces and functions change with reasonable frequency, we found it was critical to give the LLM sufficient context to avoid common pitfalls associated with biases it may have due to outdated training data. We found significantly higher success rates by following a number of key insights by Victor Taelin https://github.com/VictorTaelin/AI-scripts/, including 1) direct, explicit description of the problem formulation and goal, 2) details of the Lean 4 environment that may be significantly different from its pretrain dataset, and 3) multiple examples of theorem statements and solutions to theorem statements.
#### III-A 2 Scaffolding Loop (Agent)
We initially provide the model with a system prompt consisting of the details in the previous section, and prompt the model first with the original English-language description of the problem and the sorry ’d benchmark .lean file (Figure 2), with instructions to implement the sorry s. After the model responds, any code block provided is extracted, written to a Basic.lean file, and run in a custom managed environment with specifically pinned libraries using lake build. The full standard input and output alongside returncode are sent back to the model with the instruction to address the issues.
Initial attempts were unsuccessful in solving all of the theorem statements at once; to give the model a better chance at solving the problem we show and allow the model to solve one statement at a time, starting with the definitions and then appending each theorem independently, to be proven separately from the rest.
### III-B Human Baseline
A human attempted the function and one of the theorems from sample 0023. It took them 10 hours to accomplish the function shown in Figure 5, since they needed termination proofs for two recursors. In the time allotted, they did not make it through any of the proofs. A problem they ran into with the proofs was stack overflow trying to unfold the recursors. Given this, we don’t think a full human baseline is a feasible option.
⬇
def go (voters holdouts : List (Nat à Nat)) (expense conversions : Nat) : Nat :=
if conversions ⥠voters. length then
expense
else
let filtered := filter_cascade holdouts conversions
if filtered. isEmpty then
expense
else
let bestValue := filtered. argmax? utility |>. get!
let holdouts ’ := filtered. eraseP (. == bestValue)
go voters
holdouts ’
(expense + bestValue. snd)
(conversions + 1)
termination_by (voters. length - conversions)
decreasing_by omega
def solve_elections (n : Nat) (voters : List (Nat à Nat)) : Nat :=
go voters voters 0 0
Figure 5: Human baseline’s solution to the definition for sample 23 of FVAPPS (helper recursor omitted for brevity, available on GitHub)
### III-C Comparing Model Baseline and Human Baseline on One Sample
On sample 23 regarding the crooked election, both successfully implemented the definition of the function (Appendix -C) and succeeded on no nontrivial proofs. We let Sonnet attempt the second theorem for 100 loops, and while it made a valiant effort, it diverged. The human and Sonnet clearly took two very different approaches, but it remains to be seen which approach has better proof ergonomics.
### III-D Model performance on more samples
<details>
<summary>extracted/6182580/figs/qualitative_assessment_of_model_baseline_results.png Details</summary>
### Visual Description
## Bar Chart: Qualitative Assessments of Model Baseline Results
### Overview
This is a grouped bar chart comparing the performance of two models, "Sonnet" and "Gemini," across seven qualitative assessment categories. The chart is titled "Qualitative assessments of model baseline results." The y-axis represents a numerical score or count, while the x-axis lists the assessment categories. The chart includes visual annotations (dashed boxes) highlighting specific data points.
### Components/Axes
* **Title:** "Qualitative assessments of model baseline results" (centered at the top).
* **Y-Axis:** Vertical axis on the left. It is labeled with numerical values from 0 to 12, with major tick marks at intervals of 2 (0, 2, 4, 6, 8, 10, 12). The axis line is solid black.
* **X-Axis:** Horizontal axis at the bottom. It lists seven categorical labels, rotated approximately 45 degrees for readability. The categories are:
1. Easy Branch of If
2. Effectively Unit Test
3. Non-negativity of Nat
4. Too Trivial
5. Actually Nontrivial
6. Bug
7. Model Declares Untrue
* **Legend:** Located in the top-right corner of the chart area. It contains two entries:
* A blue square labeled "Sonnet"
* An orange square labeled "Gemini"
* **Data Series:** Two series of vertical bars, grouped by category.
* **Sonnet (Blue Bars):** Represented by solid blue bars.
* **Gemini (Orange Bars):** Represented by solid orange bars.
* **Annotations:** Three dashed red rectangular boxes and one dashed green rectangular box are drawn around specific bars, likely for emphasis or to indicate a point of interest.
* A red dashed box surrounds the Gemini (orange) bar in the "Effectively Unit Test" category.
* A red dashed box surrounds the Gemini (orange) bar in the "Non-negativity of Nat" category.
* A green dashed box surrounds the Sonnet (blue) bar in the "Actually Nontrivial" category.
* A red dashed box surrounds the Gemini (orange) bar in the "Bug" category.
### Detailed Analysis
**Data Point Extraction (Approximate Values):**
| Category | Sonnet (Blue) Value | Gemini (Orange) Value | Annotation |
| :--- | :--- | :--- | :--- |
| Easy Branch of If | 12 | 7 | None |
| Effectively Unit Test | 6 | 1 | Red dashed box around Gemini bar |
| Non-negativity of Nat | 10 | 1 | Red dashed box around Gemini bar |
| Too Trivial | 9 | 10 | None |
| Actually Nontrivial | 9 | 5 | Green dashed box around Sonnet bar |
| Bug | 6 | 2 | Red dashed box around Gemini bar |
| Model Declares Untrue | 0 | 1 | None |
**Trend Verification:**
* **Sonnet (Blue):** The trend is variable. It starts very high (12), drops significantly (6), rises again (10), dips slightly (9), holds steady (9), drops again (6), and finally falls to zero (0). The highest score is in "Easy Branch of If," and the lowest is in "Model Declares Untrue."
* **Gemini (Orange):** The trend is also variable but generally lower than Sonnet. It starts moderately high (7), drops very low (1, 1), spikes to its highest point (10), falls to a mid-level (5), drops again (2), and ends very low (1). Its peak is in "Too Trivial."
### Key Observations
1. **Performance Disparity:** Sonnet outperforms Gemini in 5 out of 7 categories ("Easy Branch of If," "Effectively Unit Test," "Non-negativity of Nat," "Actually Nontrivial," "Bug").
2. **Gemini's Strength:** Gemini's only category where it scores higher than Sonnet is "Too Trivial" (10 vs. 9).
3. **Low Scores:** Both models have very low scores (1 or 0) in several categories. Gemini scores 1 in "Effectively Unit Test," "Non-negativity of Nat," and "Model Declares Untrue." Sonnet scores 0 in "Model Declares Untrue."
4. **Annotations:** The dashed boxes highlight specific low scores for Gemini (in "Effectively Unit Test," "Non-negativity of Nat," and "Bug") and a relatively high score for Sonnet (in "Actually Nontrivial"). This suggests these data points are considered particularly noteworthy, possibly indicating failures or successes worth investigating.
5. **Category "Model Declares Untrue":** This is the only category where one model (Sonnet) has a score of zero, while the other (Gemini) has a minimal score of 1.
### Interpretation
This chart provides a comparative snapshot of how two AI models (Sonnet and Gemini) perform on a set of qualitative benchmarks, likely related to code generation, reasoning, or logical tasks given the category names (e.g., "Unit Test," "Bug," "Branch of If").
* **What the data suggests:** Sonnet appears to be the stronger or more reliable model across a broader range of these specific qualitative assessments. Its high score in "Easy Branch of If" suggests strength in basic logical control flow, while its high score in "Non-negativity of Nat" might indicate robustness in handling mathematical or logical constraints. Gemini's singular peak in "Too Trivial" could imply it is adept at solving problems deemed simple, but it struggles significantly with others, as indicated by the very low scores highlighted by the red boxes.
* **Relationship between elements:** The side-by-side bars allow for direct, category-by-category comparison. The annotations draw the viewer's eye to extreme values—either very low performance (Gemini's 1s) or a point of relative strength (Sonnet's 9 in a category where Gemini scored 5). This framing suggests the chart's purpose is not just to show overall performance but to pinpoint specific areas of concern or advantage.
* **Notable anomalies:** The "Model Declares Untrue" category is an outlier. A score of zero for Sonnet is striking and could mean the model never produced this specific type of error in the assessment, or the test was not applicable. The near-zero scores for Gemini in multiple categories are also anomalous and indicate potential critical weaknesses in those areas.
* **Underlying message:** The chart likely aims to argue that model evaluation must be granular. While one model may be better overall, the other can have specific strengths. The annotations emphasize that failures in certain categories (like producing bugs or failing unit tests) are particularly important to note, even if the model performs well elsewhere. The data underscores the importance of diverse testing suites to capture the full performance profile of an AI model.
</details>
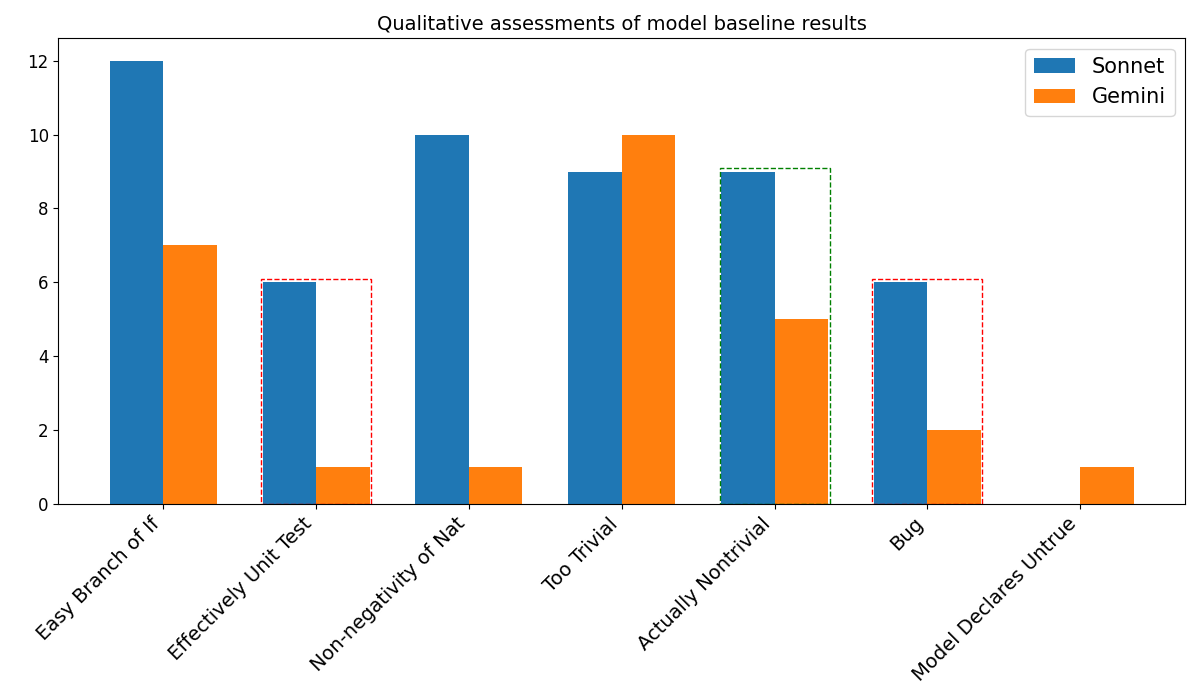
Figure 6: Qualitative categories of theorem solutions in the 100 samples, first two theorems each sample. The red box shows completely spurious results, either bugs or a substitution of a quantified variable with a single value. The green box shows the most nontrivial results. The other categories are neither spurious nor impressive, though they require some syntactic fluency that many language models would fail at.
Both Sonnet and Gemini ran for a maximum of 25 loops for the def s and a max of 50 loops for each theorem. Sonnet completed all but seven of the definitions and 43 samples had at least one theorem completed. Gemini completed only 71 of the definitions, and 23 samples had at least one theorem completed. Figure 6 shows the breakdown across our different buckets, assessed qualitatively. The green box surrounds the best solutions, nontrivial proofs that involve both intricate reasoning and correct syntax. The red box shows completely spurious results, either bugs or a substitution of a quantified variable with a single value. The other categories are neither spurious nor impressive, though they require some syntactic fluency that many language models would fail at. Importantly, Gemini declared the second theorem of sample 3078 incorrect/unsolvable in a comment, while Sonnet nontrivially solved it.
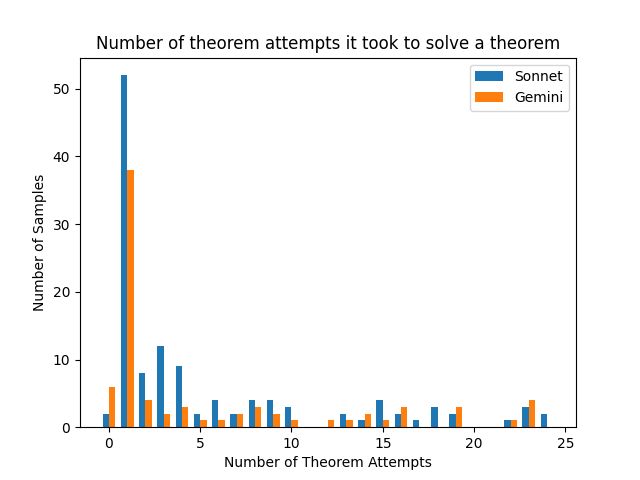
Figures 7 and 8 show how many samples took how many attempts. Of the theorems that got eventually completed, roughly 20% of each model’s were done in zero or one iteration of the loop.
<details>
<summary>extracted/6182580/figs/number_of_theorem_attempts_it_took_to_solve_a_theorem.png Details</summary>
### Visual Description
## Bar Chart: Number of Theorem Attempts It Took to Solve a Theorem
### Overview
This is a grouped bar chart comparing the performance of two models, "Sonnet" and "Gemini," on a theorem-solving task. The chart displays the frequency distribution of the number of attempts required by each model to successfully solve a theorem. The data suggests a right-skewed distribution for both models, with the vast majority of theorems being solved in a very low number of attempts.
### Components/Axes
* **Chart Title:** "Number of theorem attempts it took to solve a theorem"
* **X-Axis:** Labeled "Number of Theorem Attempts". It is a linear scale with major tick marks at 0, 5, 10, 15, 20, and 25. The axis represents discrete counts of attempts.
* **Y-Axis:** Labeled "Number of Samples". It is a linear scale with major tick marks at 0, 10, 20, 30, 40, and 50. The axis represents the frequency or count of theorems solved within a specific number of attempts.
* **Legend:** Located in the top-right corner of the plot area.
* A blue square corresponds to the label "Sonnet".
* An orange square corresponds to the label "Gemini".
* **Data Series:** Two sets of vertical bars, grouped by the x-axis value (number of attempts). For each x-value, the blue bar (Sonnet) is on the left, and the orange bar (Gemini) is on the right.
### Detailed Analysis
The following table reconstructs the approximate data points from the chart. Values are estimated based on bar height relative to the y-axis.
| Number of Attempts (X) | Sonnet (Blue) - Approx. Sample Count | Gemini (Orange) - Approx. Sample Count |
| :--- | :--- | :--- |
| 0 | ~2 | ~6 |
| 1 | **~52** | **~38** |
| 2 | ~8 | ~4 |
| 3 | ~12 | ~2 |
| 4 | ~9 | ~3 |
| 5 | ~2 | ~1 |
| 6 | ~4 | ~1 |
| 7 | ~2 | ~2 |
| 8 | ~3 | ~4 |
| 9 | ~4 | ~2 |
| 10 | ~3 | ~1 |
| 11 | ~0 | ~1 |
| 12 | ~0 | ~1 |
| 13 | ~2 | ~1 |
| 14 | ~1 | ~2 |
| 15 | ~4 | ~1 |
| 16 | ~1 | ~3 |
| 17 | ~0 | ~1 |
| 18 | ~3 | ~1 |
| 19 | ~1 | ~3 |
| 20 | ~0 | ~0 |
| 21 | ~0 | ~0 |
| 22 | ~1 | ~1 |
| 23 | ~1 | ~4 |
| 24 | ~2 | ~0 |
| 25 | ~0 | ~0 |
**Trend Verification:**
* **Sonnet (Blue):** The distribution has a very sharp peak at 1 attempt, followed by a rapid decline. There is a secondary, much smaller cluster of activity between 2-4 attempts. The tail extends thinly and sporadically out to 24 attempts.
* **Gemini (Orange):** Also peaks at 1 attempt, but the peak is lower than Sonnet's. Its decline after the peak is more gradual, with a more noticeable presence in the 2-9 attempt range compared to Sonnet. Its tail is similarly sparse but includes a small, notable uptick at 23 attempts.
### Key Observations
1. **Dominant Peak at 1 Attempt:** For both models, the single most common outcome is solving the theorem on the first attempt. Sonnet has a significantly higher count (~52) at this point compared to Gemini (~38).
2. **Rapid Drop-off:** The number of samples drops dramatically for both models after 1 attempt. By 5 attempts, the counts are in the low single digits.
3. **Long Tail:** Both distributions have a long, sparse tail extending to over 20 attempts, indicating that a small subset of theorems are significantly more difficult and require many attempts.
4. **Comparative Performance:** Sonnet appears to have a higher concentration of successes at the very lowest attempt counts (0-4), while Gemini shows a slightly more distributed performance across the 2-9 attempt range.
5. **Notable Outlier:** Gemini shows a small but distinct increase in samples at 23 attempts (~4), which is higher than its counts for the preceding ~10 attempt values.
### Interpretation
This chart visualizes the efficiency and difficulty distribution of a theorem-solving task for two AI models. The data suggests that the task is not uniformly difficult; most theorems are "easy" and solvable in one or a few attempts, while a minority are "hard," requiring an order of magnitude more effort.
The pronounced peak at 1 attempt for both models indicates a high baseline proficiency on a significant portion of the test set. The difference in peak height (Sonnet > Gemini) could suggest Sonnet is more effective on the easiest problems or that the test set contained more problems aligned with Sonnet's strengths.
The long tail is critical from a research perspective. It highlights the models' limitations and the existence of challenging edge cases. The small cluster of Gemini results at 23 attempts might indicate a specific class of problem where Gemini's strategy leads to prolonged, but eventually successful, exploration, whereas Sonnet either solves it quicker or fails (if failures are not plotted). The chart does not show failed attempts, only successful ones, so we cannot determine the total failure rate.
In summary, the chart demonstrates that while both models are highly effective on the majority of theorems, their performance diverges on moderately difficult problems, and both encounter a subset of problems that are exceptionally challenging, requiring over 20 attempts to solve.
</details>
Figure 7: Number of theorem attempts it took to solve a theorem, conditional on that theorem succeeding.
Of the 406 theorems attempted, Sonnet accomplished 121 ( $30\$ ) and Gemini accomplished 74 ( $18.5\$ ).
### III-E Discussion
We noticed that Sonnet solved many problems via imperative programming with the identity monad (Id.run do). However, this kind of solution fails to capture inductive structure that lends itself to proofs. This means future solutions to FVAPPS will take one of two directions: an unwieldy and uninterpretable proof involving the identity monad, or ensuring that solutions are factored in a way that can exploit inductive structure.
Table II shows the split over our quality assurance steps over the entire baseline set and those that were solved. While this sample is small, we roughly find that our higher-quality samples that are both guarded and plausible are somewhat more likely to be solvable by current models.
| Unguarded Guarded Guarded and Plausible | 69 18 14 | 41 12 7 | 28 11 4 |
| --- | --- | --- | --- |
| Total | 101 | 60 | 43 |
TABLE II: Baseline results split across quality assurance stages of our generation pipeline.
## IV Related Work
Research and development into stronger programming guarantees spans a number of large and growing communities in the software landscape. While interest in generally stronger-typed programming paradigms is growing (e.g., growing interest in converting the Linux kernel codebase to Rust, https://github.com/Rust-for-Linux/linux increasing availability of static typing in Python https://realpython.com/python312-typing/) there remains a smaller group of people and programming languages focused directly on formal verification. Coq [coq], Dafny [dafnybook], Isabelle [isabellebook], and Lean [demoura2015lean] all target theorem proving and formal verification as first class goals, albeit with varying visions and core foundations.
Automating programming with machine learning or program synthesis is a rich area [ellis2020dreamcodergrowinggeneralizableinterpretable, austin2021programsynthesislargelanguage]
### IV-A Datasets and Benchmarks
Informal Mathematical theorem proving datasets are the most extensive, with benchmarks ranging from 15,000 to over 100,000 proofs [coqgym, leandojo, jiang2021lisa, naturalproofs], plus the Archive of Formal Proofs containing around 1 million lines of code [afp]. Unverified program synthesis benchmarks are typically an order of magnitude smaller, containing thousands of programs, with APPS being the largest at 10,000 programs [Hendrycks2021MeasuringCC] (though LiveCodeBench continues to grow [livecodebench]). In stark contrast, formal software verification benchmarks have historically been much more limited in size, with both available datasets (Clover and dafny-synthesis) containing order of 100 programs each [clover, dafny-synthesis], with DafnyBench [loughridge2024dafnybench] up at 782.
### IV-B Models
Models like DeepSeek [xin2024deepseekproveradvancingtheoremproving, xin2024deepseekproverv15harnessingproofassistant] and AlphaProof [deepmind2024imo] have advanced the ability of AI to do math, both formally and informally. DeepSeek Prover has demonstrated significant capabilities in formal mathematics, achieving state-of-the-art performance on the Lean theorem proving benchmark. The model combines large-scale pretraining on mathematical texts with specialized fine-tuning on formal proof corpora, enabling it to generate valid formal proofs for complex mathematical statements.
AlphaProof [deepmind2024imo] represents another milestone in automated theorem proving, showing particular strength in creative mathematical problem-solving. Its success on IMO-level problems demonstrates the potential for AI systems to engage in sophisticated mathematical reasoning, though the gap between informal mathematical proofs and formal verification remains significant.
In the domain of program synthesis and verification, models have evolved along several tracks. Traditional program synthesis approaches using symbolic techniques and SMT solvers have been augmented by neural methods [wang2023legoprover]. Large language models fine-tuned on code, such as CodeLlama [Rozire2023CodeLO] and GPT-4 [gpt4], have shown promising results in generating functionally correct programs, but their capabilities in formal verification remain limited.
Recent work has begun to bridge this gap [Baif2024DafnyCopilot, yang2024autoverusautomatedproofgeneration] demonstrating the potential for AI assistance in formal program verification. However, these systems typically require significant human guidance and cannot yet autonomously generate both correct programs and their formal proofs. The challenge of simultaneously reasoning about program semantics and verification conditions remains an open problem in the field.
## V Discussion
Our current presentation has a few limitations, and clear directions for future work. While the samples in our final guarded and plausible set are quite high quality, it is nontheless possible that the theorem statements do not correspond to desirable properties nor that they, in union, cover the full range of properties one would ideally prefer. While manual spot-checking did not reveal any systematic failures post complete five-stage processing, it is nontheless possible that particular theorems are not applicable or vacuous in some form.
The FVAPPS benchmark evaluates AI systems on both program synthesis and formal verification by extending APPS with Lean 4 theorem specifications. While current language models can implement programming solutions https://www.anthropic.com/news/3-5-models-and-computer-use https://openai.com/index/introducing-swe-bench-verified/, they struggle with formal verification proofs, highlighting the challenge between imperative programming and proof-amenable structures. The benchmark’s difficulty is demonstrated by limited progress from both human baselines and models. FVAPPS opens research directions in simultaneous implementation and verification reasoning, automated proof-amenable solution structuring, and scaling formal verification, providing a framework to measure progress toward verified automated programming.
## Acknowledgment
We thank Buck Shlegeris, Jason Gross, and Rajashree Agarwal for valuable feedback and discussion during early versions of this work. We are also grateful to the Anthropic External Researcher program for providing API credits for benchmark generation, and to FAR.ai for providing operations and administrative support during the course of the project.
### -A Details of buckets in 6
Table III declares which samples in particular fall into Figure 6 ’s buckets. Of note is that 3078 is declared untrue in a code comment by Gemini, but solved completely by Sonnet. Otherwise, many samples fall into the same buckets across models.
TABLE III: Comparison of theorem classifications between Sonnet and Gemini
### -B Number of definition attempts it took to solve a function, conditional on it succeeding
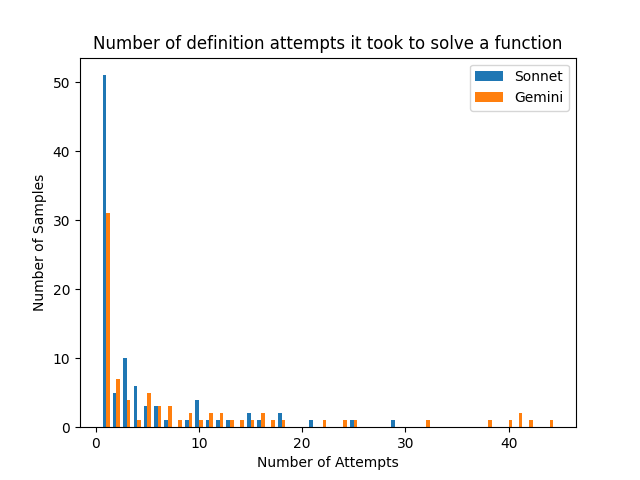
Figure 8 is a companion to Figure 7 but refers to definitions instead of theorems. Of the def s that succeeded at all, 50% of Sonnet’s and 31% of Gemini’s succeeded in one shot.
<details>
<summary>extracted/6182580/figs/number_of_definition_attempts_it_took_to_solve_a_function.png Details</summary>
### Visual Description
## Bar Chart: Number of Definition Attempts to Solve a Function
### Overview
This is a grouped bar chart comparing the performance of two models, "Sonnet" and "Gemini," on a task involving solving a function. The chart displays the distribution of how many definition attempts were required for each model to successfully solve the function across a set of samples. The data is heavily right-skewed, with the vast majority of samples being solved in very few attempts.
### Components/Axes
* **Chart Title:** "Number of definition attempts it took to solve a function"
* **X-Axis:** Labeled "Number of Attempts". It is a linear scale with major tick marks at 0, 10, 20, 30, and 40. The axis represents discrete counts of attempts.
* **Y-Axis:** Labeled "Number of Samples". It is a linear scale with major tick marks at 0, 10, 20, 30, 40, and 50. The axis represents the frequency or count of function samples.
* **Legend:** Located in the top-right corner of the plot area.
* A blue square is labeled "Sonnet".
* An orange square is labeled "Gemini".
* **Data Series:** Two series of vertical bars, grouped by the "Number of Attempts" value on the x-axis. For each attempt count, the blue bar (Sonnet) is on the left, and the orange bar (Gemini) is on the right.
### Detailed Analysis
The following table reconstructs the approximate data from the chart. Values are estimated based on bar height relative to the y-axis grid. "N/A" indicates no visible bar for that model at that attempt count.
| Number of Attempts | Sonnet (Blue) - Approx. Number of Samples | Gemini (Orange) - Approx. Number of Samples |
| :--- | :--- | :--- |
| 1 | ~51 | ~31 |
| 2 | ~7 | ~5 |
| 3 | ~10 | ~3 |
| 4 | ~6 | ~4 |
| 5 | ~4 | ~5 |
| 6 | ~2 | ~3 |
| 7 | ~2 | ~2 |
| 8 | ~1 | ~2 |
| 9 | ~1 | ~1 |
| 10 | ~4 | ~1 |
| 11 | ~1 | ~2 |
| 12 | ~1 | ~1 |
| 13 | ~1 | ~1 |
| 14 | ~2 | ~1 |
| 15 | ~2 | ~1 |
| 16 | ~1 | N/A |
| 17 | ~2 | N/A |
| 18 | ~2 | N/A |
| 19 | N/A | N/A |
| 20 | ~1 | N/A |
| 21 | N/A | ~1 |
| 22 | N/A | N/A |
| 23 | N/A | N/A |
| 24 | N/A | ~1 |
| 25 | ~1 | ~1 |
| 26-28 | N/A | N/A |
| 29 | ~1 | N/A |
| 30-31 | N/A | N/A |
| 32 | N/A | ~1 |
| 33-37 | N/A | N/A |
| 38 | N/A | ~1 |
| 39 | N/A | N/A |
| 40 | N/A | ~1 |
| 41 | N/A | ~2 |
| 42 | N/A | N/A |
| 43 | N/A | ~1 |
| 44 | N/A | N/A |
**Trend Verification:**
* **Overall Trend:** Both distributions are extremely right-skewed. The highest frequency for both models is at 1 attempt, with a sharp, exponential-like decay as the number of attempts increases. A very long, sparse tail extends to over 40 attempts.
* **Sonnet (Blue) Trend:** Peaks dramatically at 1 attempt (~51 samples). The count drops sharply at 2 attempts, has a minor secondary peak at 3 attempts (~10), then generally declines with small fluctuations. The last visible data point is at 29 attempts.
* **Gemini (Orange) Trend:** Also peaks at 1 attempt (~31 samples), but this peak is lower than Sonnet's. It shows a more gradual initial decline than Sonnet. Notably, Gemini has several isolated data points in the high-attempt tail (21, 24, 32, 38, 40, 41, 43) where Sonnet has none, suggesting a subset of problems where Gemini required significantly more attempts.
### Key Observations
1. **Dominant First-Attempt Success:** For both models, the most common outcome by a large margin is solving the function in a single definition attempt. This accounts for the majority of all samples.
2. **Model Comparison at Low Attempts:** Sonnet has a higher absolute count of samples solved in 1 attempt (~51 vs. ~31). However, in the range of 2-9 attempts, the counts are more comparable, with Sonnet often slightly higher.
3. **Long Tail Discrepancy:** The most striking difference is in the tail. Gemini's distribution extends much further, with sparse but present data points beyond 30 attempts, including a small cluster around 40-41 attempts. Sonnet's data effectively ends before 30 attempts.
4. **Sparsity:** Beyond approximately 15 attempts, the data becomes very sparse for both models, with most attempt counts having zero or one sample.
### Interpretation
This chart visualizes the efficiency and reliability of two AI models (Sonnet and Gemini) on a specific function-solving task defined by "definition attempts."
* **Performance Implication:** The high concentration at 1 attempt suggests that for most function samples, both models can identify the correct solution path immediately. The task is likely straightforward for a majority of cases.
* **Model Differentiation:** The key differentiator is not typical performance but **failure mode or difficulty handling**. Sonnet appears more consistent; when it doesn't solve a problem immediately, it typically does so within a bounded number of attempts (<30). Gemini, while also efficient on most samples, exhibits a "long tail" behavior. This indicates that for a small subset of particularly challenging or anomalous function samples, Gemini can enter a prolonged, inefficient loop of definition attempts, far exceeding the range seen with Sonnet.
* **Practical Takeaway:** If the cost or time per attempt is significant, Sonnet might be preferable for its bounded worst-case behavior. Gemini's performance is excellent on average but carries a higher risk of extreme inefficiency on edge cases. The data suggests investigating the specific function samples that caused Gemini's long tail to understand the nature of the difficulty.
* **Uncertainty:** The exact numerical values are approximate due to the resolution of the chart. The interpretation of trends, however, is robust given the clear visual patterns.
</details>
Figure 8: Definition attempts needed to solve a function, conditional on success.
### -C Baseline solutions to problem 23
Gemini accomplished 10 in 11 attempts and sonnet failed 9 after 50 attempts.
⬇
def solve_elections (n : Nat) (voters : List (Nat à Nat)) : Nat := Id. run do
let range := List. range (n + 1)
let mut best := none
for k in range do
match try_subset ⨠n, voters, 0, k, []⩠with
| some cost =>
match best with
| none => best := some cost
| some b => if cost < b then best := some cost
| none => continue
best. getD 0
Figure 9: claude-3-5-sonnet-20241022’s attempt at the definition for sample 23 of FVAPPS (try_subset omitted for brevity, available on GitHub)
⬇
def solve_elections (n : Nat) (voters : List (Nat à Nat)) : Nat :=
let voters := voters. toArray. qsort (fun v â v â => (v â. fst < v â. fst) || (v â. fst == v â. fst && v â. snd > v â. snd)) |>. toList – Use boolean comparisons for sorting
let rec go (cost : Nat) (numVoters : Nat) (remainingVoters : List (Nat à Nat)) : Nat :=
if numVoters == n then cost
else
match remainingVoters with
| [] => cost
| (m, p):: rest =>
let buyCost := go (cost + p) (numVoters) rest
let freeCost := if m <= numVoters then go cost (min n (numVoters + 1)) rest else buyCost
min buyCost freeCost
go 0 0 voters
Figure 10: gemini-1.5-pro’s solution to the definition for sample 23 of FVAPPS