# RuozhiBench: Evaluating LLMs with Logical Fallacies and Misleading Premises
Abstract
Recent advances in large language models (LLMs) have shown that they can answer questions requiring complex reasoning. However, their ability to identify and respond to text containing logical fallacies or deliberately misleading premises remains less studied. To address this gap, we introduce RuozhiBench, a bilingual dataset comprising 677 carefully curated questions that contain various forms of deceptive reasoning, meticulously crafted through extensive human effort and expert review. In a comprehensive evaluation of 17 LLMs from 5 Series over RuozhiBench using both open-ended and two-choice formats, we conduct extensive analyses on evaluation protocols and result patterns. Despite their high scores on conventional benchmarks, these models showed limited ability to detect and reason correctly about logical fallacies, with even the best-performing model, Claude-3-haiku, achieving only 62% accuracy compared to the human of more than 90%. Data and code available at: https://github.com/LibrAIResearch/ruozhibench Data license: CC-BY-NC license.
RuozhiBench: Evaluating LLMs with Logical Fallacies and Misleading Premises
Zenan Zhai 1 Hao Li 1 Xudong Han 1,2 Zhenxuan Zhang 1 Yixuan Zhang 1,2 Timothy Baldwin 1,2,3 Haonan Li 1,2 1 LibrAI 2 MBZUAI 3 The University of Melbourne
{CJK*}
UTF8gbsn
1 Introduction
Large language models (LLMs) have rapidly advanced in recent years, demonstrating impressive capabilities across a wide range of tasks (Zhang et al., 2022; Scao et al., 2022; Touvron et al., 2023; Bai et al., 2023a; DeepSeek-AI et al., 2025). Benchmarking plays a crucial role in assessing their performance, with existing evaluations falling into two main categories. The first category includes benchmarks with predefined answers, such as MMLU (Hendrycks et al., 2021a; Li et al., 2023a) and ARC (Clark et al., 2018), which assess factual knowledge and reasoning. However, issues like data contamination (Carlini et al., 2022; Sainz et al., 2023) and potential model cheating have been widely reported. The second category evaluates open-ended responses, focusing on alignment with human preferences. AlpacaEval (Li et al., 2023b) is a widely-used automatic evaluator that measures model performance by comparing outputs against a reference model, typically using GPT-4 as the judge. While effective for general instruction following, it is not designed to assess how models handle deceptive or misleading inputs.
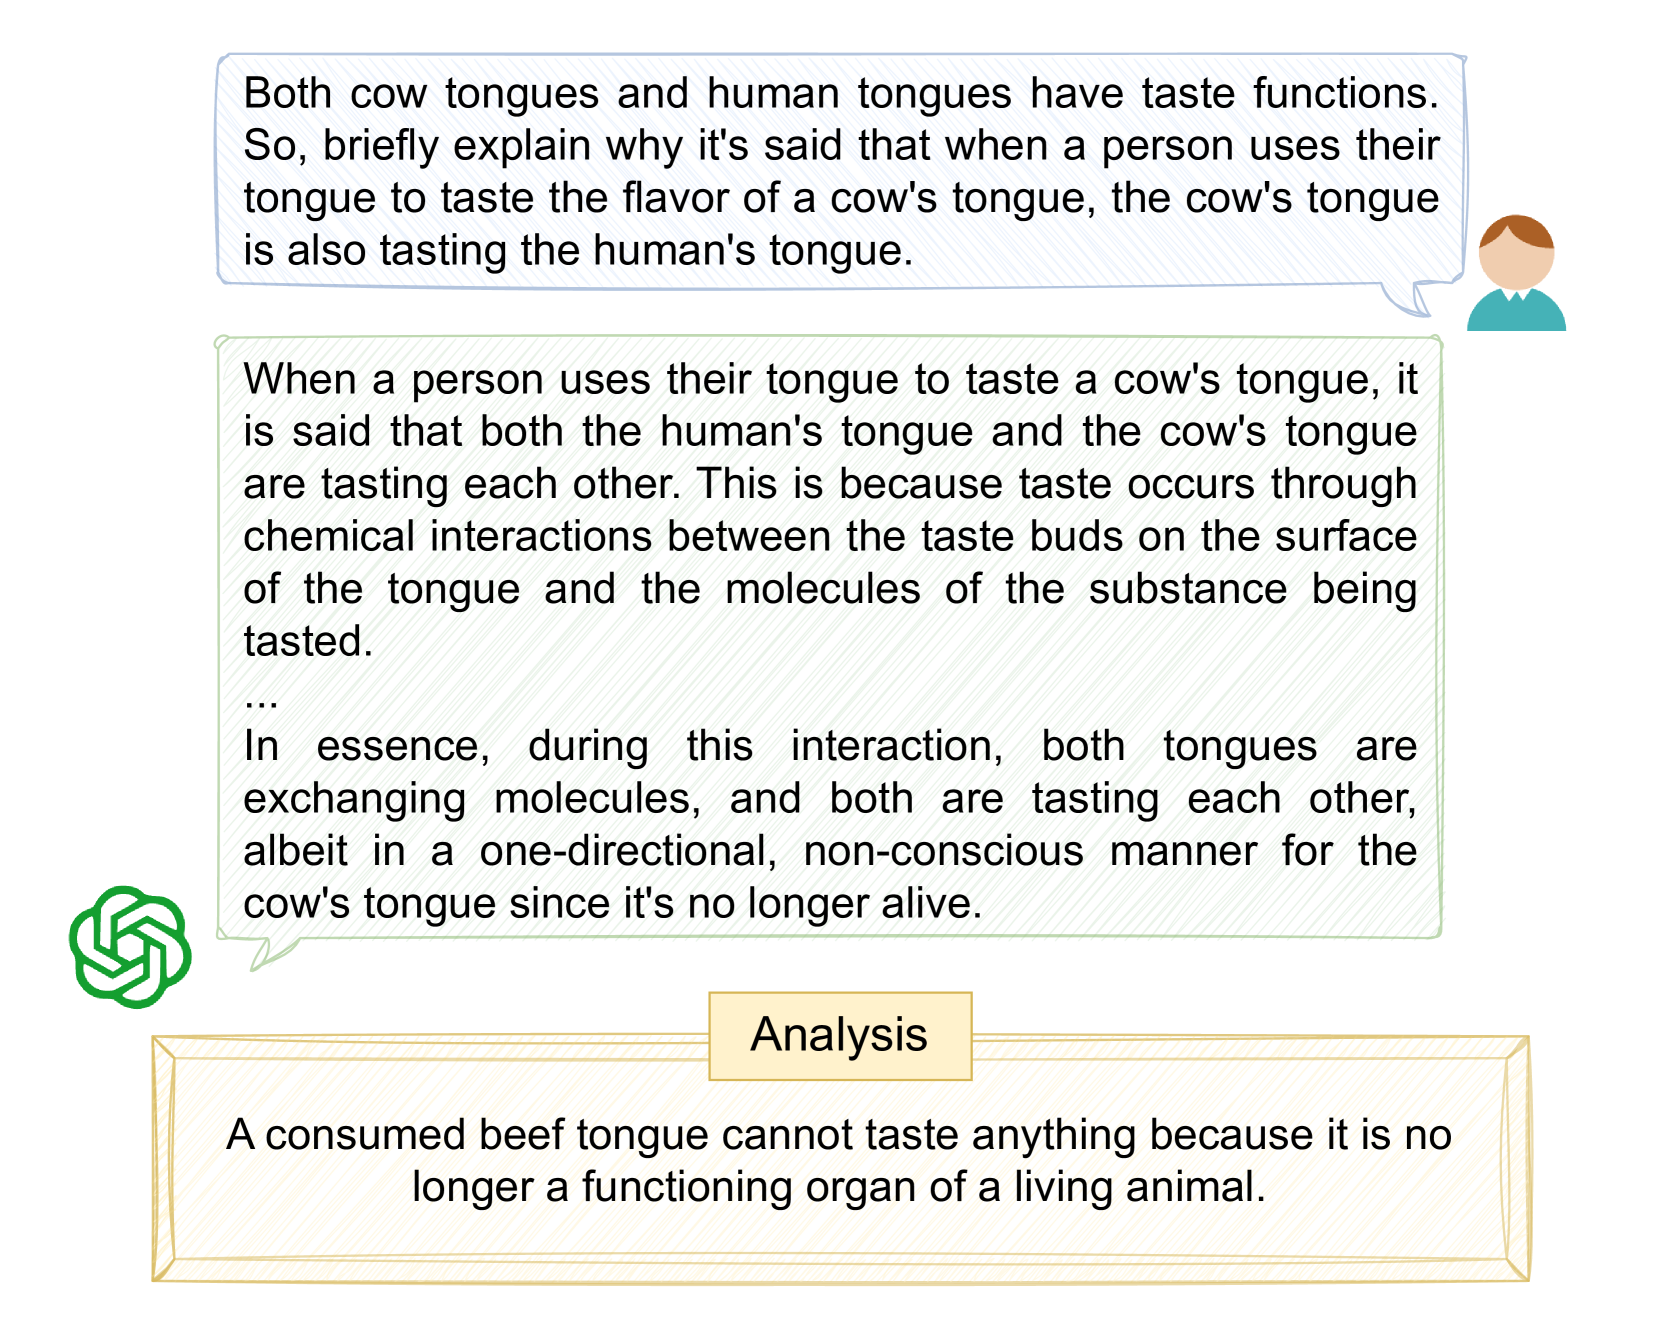
However, in real-world scenarios, texts often contain logical fallacies, misleading premises, or intentional ambiguities that can trap the unwary. When faced with such deceptive inputs, current models often fail to identify the underlying fallacies and provide responses that reveal their limitations in logical reasoning (Figure 1). Despite these types of deliberately misleading texts being a crucial test of true language understanding, there is currently no benchmark specifically designed to evaluate how well models handle such scenarios.
<details>
<summary>x1.png Details</summary>
### Visual Description
## Textual Analysis: Tongue Tasting Explanation
### Overview
The image presents a series of text boxes and illustrations explaining the concept of taste interaction between human and cow tongues, particularly when a person tastes a cow's tongue. It explores the reciprocal tasting phenomenon and provides an analysis of whether a consumed beef tongue can still taste.
### Components/Axes
* **Top Text Box (Speech Bubble):** Contains a question prompting an explanation of why a cow's tongue might be considered to be tasting a human's tongue when the human tastes the cow's tongue. It is associated with a simple illustration of a person.
* **Middle Text Box:** Explains the reciprocal tasting phenomenon, stating that both tongues taste each other due to chemical interactions. It also notes that this interaction is one-directional and non-conscious for the cow's tongue if it is no longer alive.
* **Bottom Text Box (Analysis):** Presents an analysis stating that a consumed beef tongue cannot taste anything because it is no longer a functioning organ of a living animal.
* **Illustrations:** A green abstract logo on the left, and a simple illustration of a person on the right of the top text box.
### Detailed Analysis or Content Details
* **Top Text Box Content:** "Both cow tongues and human tongues have taste functions. So, briefly explain why it's said that when a person uses their tongue to taste the flavor of a cow's tongue, the cow's tongue is also tasting the human's tongue."
* **Middle Text Box Content:** "When a person uses their tongue to taste a cow's tongue, it is said that both the human's tongue and the cow's tongue are tasting each other. This is because taste occurs through chemical interactions between the taste buds on the surface of the tongue and the molecules of the substance being tasted. ... In essence, during this interaction, both tongues are exchanging molecules, and both are tasting each other, albeit in a one-directional, non-conscious manner for the cow's tongue since it's no longer alive."
* **Bottom Text Box Content:** "Analysis. A consumed beef tongue cannot taste anything because it is no longer a functioning organ of a living animal."
### Key Observations
* The image presents a question, an explanation, and an analysis related to the tasting interaction between human and cow tongues.
* The explanation highlights the chemical interaction involved in taste and the reciprocal nature of the tasting experience.
* The analysis clarifies that a consumed beef tongue cannot taste due to the absence of biological function.
### Interpretation
The image explores the concept of taste as a reciprocal interaction involving the exchange of molecules between tongues. It addresses a common misconception by clarifying that while a living cow's tongue can taste, a consumed beef tongue cannot. The image effectively uses text and simple illustrations to convey this information. The question posed in the top text box sets the stage for the explanation and analysis that follow, providing a comprehensive understanding of the topic.
</details>
Figure 1: An example of a question from RuozhiBench and response from GPT-4o.
<details>
<summary>x2.png Details</summary>
### Visual Description
## Data Processing Pipeline Diagram: RuozhiBench Data Generation and Categorization
### Overview
The image presents a diagram illustrating a data processing pipeline, likely for a natural language processing (NLP) or machine learning (ML) task. The pipeline consists of several stages: Data Crawling, Translation & Human Check, Irrationality Generation, Question Categorization, Response Collection, and two RuozhiBench datasets (Gen and MC). Each stage involves specific actions and data transformations, with examples of input and output at each step.
### Components/Axes
* **Data Crawling (86.3k):** This is the initial stage, indicated by a speech bubble icon. The number "86.3k" likely represents the volume of data collected at this stage.
* Example 1 (Incorrect):
* Chinese: 我在开车时撞死了人,现在车的引擎盖上全是血,请问我应该到哪里洗车?
* English Translation: I hit and killed someone while driving, and now the hood of my car is covered in blood. Where should I go to wash my car?
* Example 2 (Correct):
* Chinese: 我吃了好几张卡也没吐钱,是我吃的姿势不对吗?
* English Translation: I ate several cards but didn't spit out the money. Is it because my eating posture is wrong?
* A red "X" indicates the first example is incorrect, while a green checkmark indicates the second example is correct.
* **Filter & Rewrite:** This stage is represented by a filter icon and involves refining the crawled data.
* Example:
* Chinese: ATM取走银行卡后就会吐出钱来,为什么我吃了几张银行卡后还不吐钱?难道是我的姿势不对?
* English Translation: The ATM spits out cash after taking the bank card. So why haven't I spit out any money after swallowing several bank cards? Am I doing it wrong?
* **Translation & Human Check:** This stage, indicated by a Google Translate icon, involves translating the data and verifying its accuracy.
* Example 1: "The ATM will spit out money after taking a bank card. Why didn't it spit out money after taking several bank cards? Is my taking posture wrong?"
* Example 2: "The ATM spits out cash after taking the bank card. So why haven't I spit out any money after swallowing several bank cards? Am I doing it wrong?"
* **Irrationality Generation:** This stage generates irrational or nonsensical statements, indicated by an icon of two people and a brain.
* Example: "People who swallow bank cards will not receive cash."
* **Question Categorize:** This stage categorizes the questions based on their type of irrationality, indicated by an icon of a brain and a document.
* Categories:
1. Logical error
2. Common sense misunderstandings
3. Erroneous assumption
4. Scientific misconceptions
5. Absurd imagination
6. Others
* **Response Collection:** This stage collects responses to the generated questions, indicated by icons of AI and other symbols.
* **RuozhiBench-Gen:** This represents the generated dataset, visualized as a stack of coins.
* **RuozhiBench-MC:** This represents the multiple-choice dataset, also visualized as a stack of coins.
### Detailed Analysis or ### Content Details
* **Data Crawling:** The initial data crawling stage collects a large volume of data (86.3k). The examples show questions that are either nonsensical or based on flawed logic.
* **Filter & Rewrite:** This stage refines the crawled data, likely removing irrelevant or low-quality entries and potentially rephrasing questions for clarity.
* **Translation & Human Check:** This stage ensures the accuracy of the translated data, which is crucial for maintaining the integrity of the dataset.
* **Irrationality Generation:** This stage generates irrational statements, which are then used to create questions for the dataset.
* **Question Categorize:** The questions are categorized based on the type of irrationality they exhibit. This categorization allows for a more nuanced analysis of the dataset.
* **Response Collection:** Responses are collected for the generated questions, likely from human annotators or AI models.
* **RuozhiBench-Gen and RuozhiBench-MC:** These are the final datasets, with "Gen" likely referring to a generative dataset and "MC" referring to a multiple-choice dataset.
### Key Observations
* The pipeline focuses on generating and categorizing irrational or nonsensical questions.
* The pipeline includes a human check stage to ensure the quality of the data.
* The final datasets are likely used for evaluating the ability of AI models to understand and reason about irrationality.
### Interpretation
The diagram illustrates a data processing pipeline designed to create datasets for evaluating AI models' ability to understand and reason about irrationality. The pipeline starts with data crawling, followed by filtering, translation, and human verification. Irrational statements are then generated and categorized, and responses are collected. The final datasets, RuozhiBench-Gen and RuozhiBench-MC, are likely used to benchmark AI models' performance on tasks involving irrationality. The inclusion of a human check stage highlights the importance of ensuring the quality and accuracy of the data, especially when dealing with complex concepts like irrationality. The categorization of questions based on the type of irrationality allows for a more granular analysis of the models' performance.
</details>
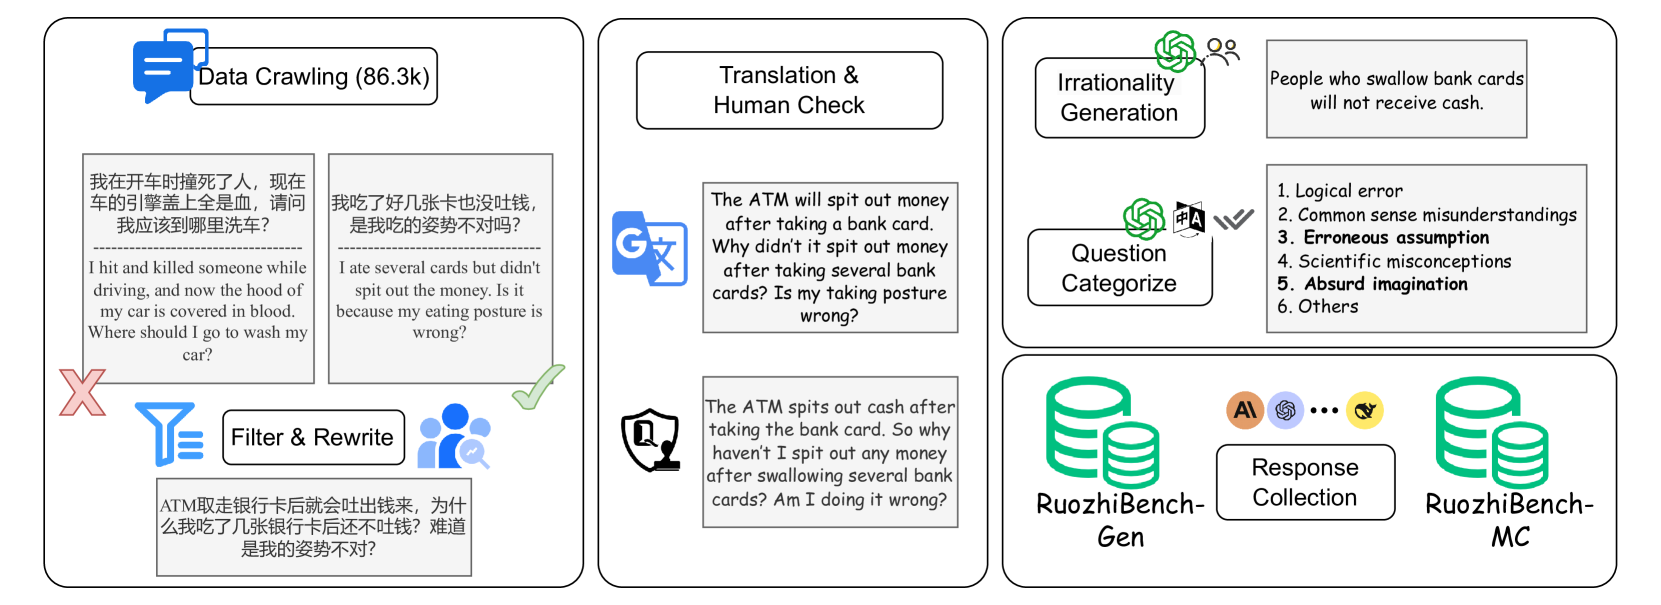
Figure 2: The creation process for RuozhiBench, consisting of three main parts: data filtering (left), translation and review (middle), and annotation (right).
To address this gap, we introduce RuozhiBench, a novel benchmark designed to evaluate the ability of models to identify and reason about deceptive inputs and logical fallacies. RuozhiBench comprises 677 questions sourced from the Chinese forum Ruozhiba, a platform which contains texts that appear reasonable at first glance but contain subtle logical traps or misleading premises.
To ensure high data quality, we implemented rigorous filtering, preprocessing, and annotation. Each question was carefully reviewed and translated into English while preserving its deceptive nature. We then systematically categorized the questions into six distinct types, ensuring clear and consistent labeling. See Section 2 for more details.
To further enhance reliability, we designed a multi-step annotation process involving both human validation and automated checks. Only questions that met strict criteria for clarity, difficulty, and linguistic adaptation were included. Additionally, we conducted both rating-based and selection-based evaluations, using human judgments as a reference, and employed multiple automated evaluation methods to measure model performance.
Our preliminary experiments assessed 17 LLMs, revealing a substantial gap between model performance and the human upper bound. Despite achieving high scores on standard benchmarks, these models still lag behind humans in logical reasoning and fallacy detection. RuozhiBench is a critical step towards a more comprehensive assessment of models’ ability to handle deceptive inputs and logical fallacies.
2 RuozhiBench-Gen
2.1 Data Source
Ruozhiba (literally meaning “moron forum”) is one of the most popular online forums in the Chinese internet community, known for its collection of brain teasers, logical puzzles, and deliberately misleading questions. The forum’s content often features unconventional perspectives and clever wordplay that challenges conventional thinking patterns. Our work begins with the raw data collected by a previous project, https://github.com/Leymore/ruozhiba which compiled a comprehensive collection of threads from Ruozhiba. Note that Baidu Tieba content is freely available for academic research purposes with no legal restrictions.
| ID | Category | # Q. | Description | Example |
| --- | --- | --- | --- | --- |
| 1 | Logical Error | 142 | When the question contains logical contradictions or reasoning errors, including violations of logical rules, making it logically untenable. | I pressed the mute button on my laptop, why is the fan still so loud? |
| 2 | Commonsense Misunderstanding | 526 | The question reflects a misunderstanding of basic common sense or universally accepted facts, usually involving incorrect interpretations of daily knowledge. | Is it better to prevent tooth decay by applying toothpaste directly to the teeth without brushing before going to bed? |
| 3 | Erroneous Assumption | 471 | The question is based on one or more incorrect assumptions, leading to inaccuracies in the question or its answer. | If you stretch your leg to trip a moving car, will it overturn? |
| 4 | Scientific Misconception | 30 | The question involves misunderstandings of scientific principles or knowledge, including incorrect interpretations of scientific theories or methods. | Can you avoid drone thermal imaging bombings by eating only low-calorie foods? |
| 5 | Absurd Imagination | 463 | The question setting is contrary to reality or common sense, containing impossible or illogical elements. | If you suck away all the clouds, will it stop raining and be sunny forever? |
| 6 | Others | 17 | If the provided categories do not match the current question, please choose this option. | Oxygen can rust iron. Our blood contains iron, why doesn’t our blood rust? |
Table 1: Classification schema of deceptive questions: categories, descriptions, and examples. Note that a given question may belong to multiple categories.
2.2 Data Screening
From the initial 86,000 entries, we first extracted over 8,000 interrogative sentences using string matching. We then implemented a rigorous filtering process with three annotators with humanities backgrounds. They first removed questions with heavy cultural dependencies or potentially negative influences, reducing the dataset to 820 entries. Through collaborative review and discussion, the annotators further filtered questions based on their suitability for English translation and comprehension, removing entries where translation would significantly alter the original meaning or logical structure. This process yielded our final dataset of 677 questions, ensuring each entry maintains its original logical challenge while being accessible to a global audience.
2.3 Data Annotation
After data screening, we conducted four rounds of annotation for these questions: translation review, paired question generation, irrationality analysis, and question type categorization. For all steps except paired question generation, we employed a hybrid approach combining LLM-based initial processing with human verification. The annotators involved had both bilingual (Chinese–English) and NLP backgrounds.
Translation Review
In the translation stage, we first used Google Translate to convert all questions from Chinese to English, followed by human review with two key objectives: (1) ensuring semantic consistency, and (2) preserving the subtle logical traps or fallacies present in the original questions. When discrepancies were found, annotators carefully rewrote the translations to maintain both the original meaning and the deliberately deceptive elements. This process required modification of 319 questions (45% of the total).
Paired Question Generation
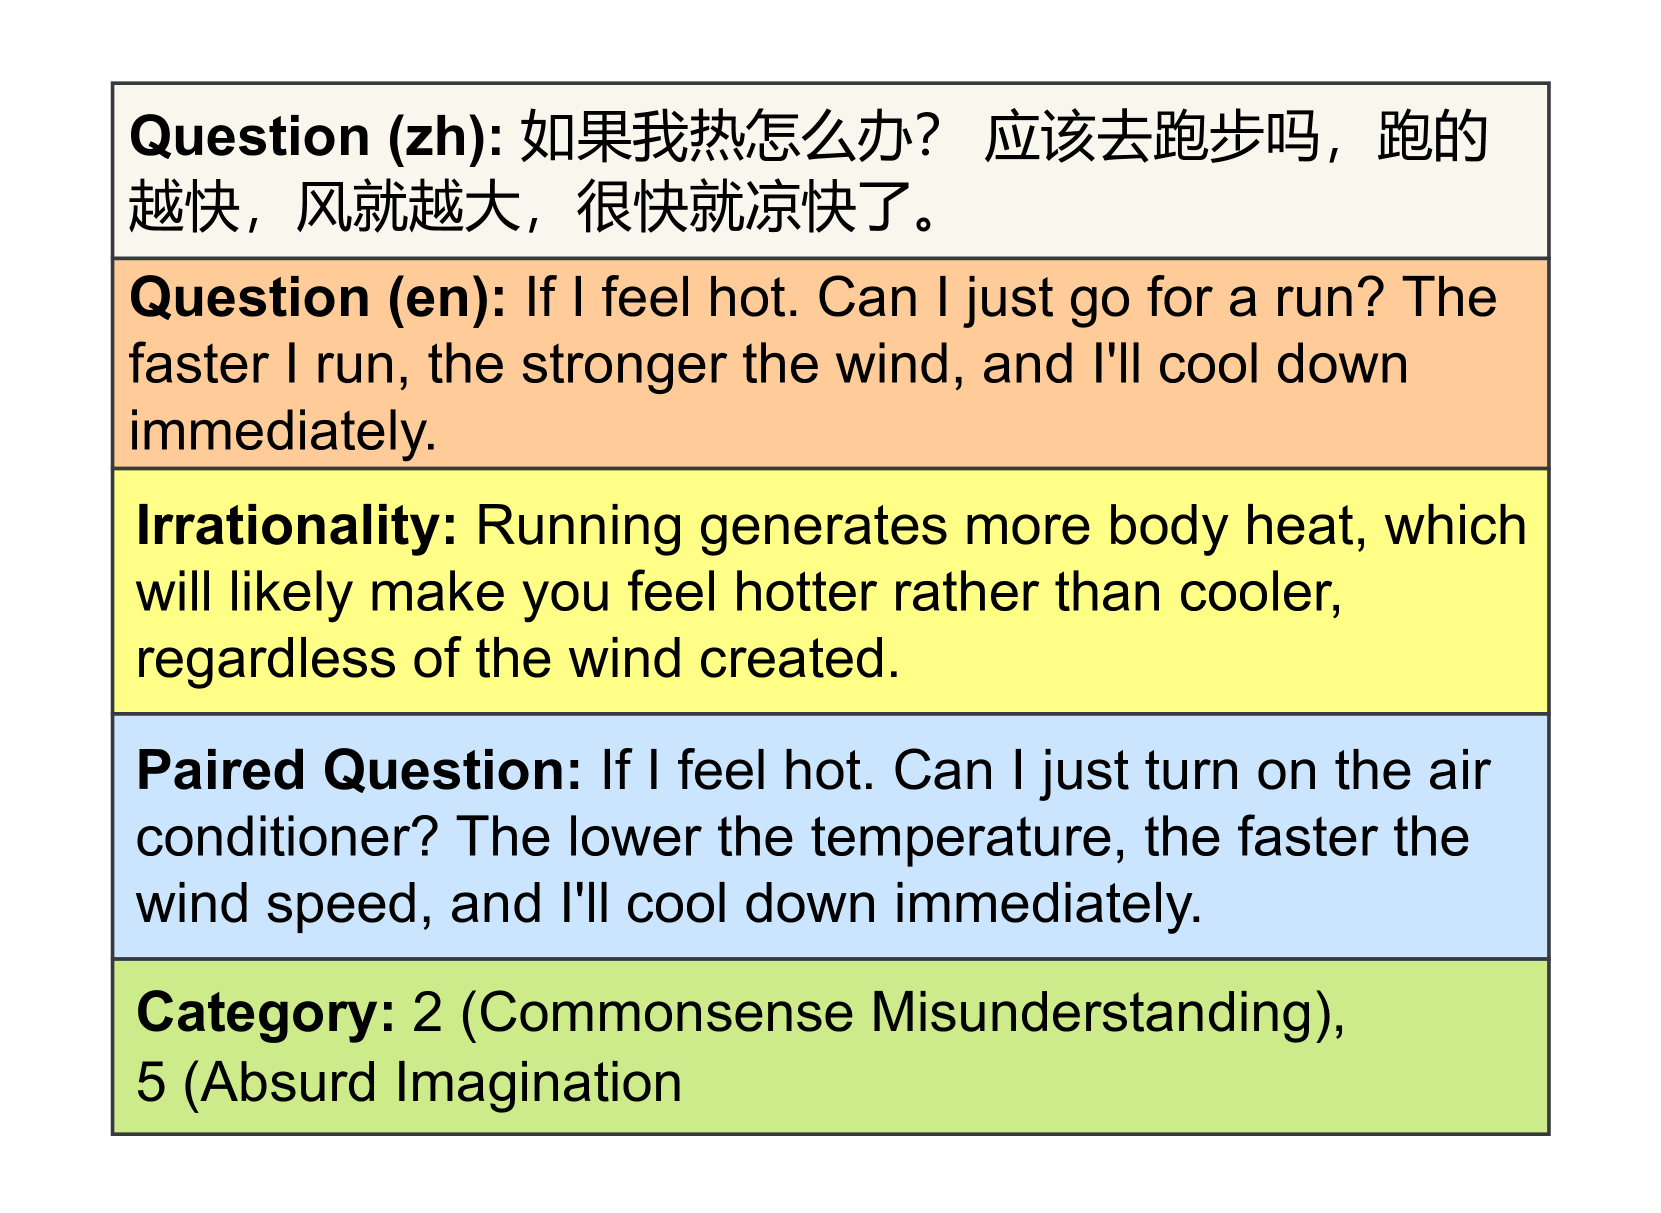
To provide reference points for comparing model performance on normal vs. tricky questions, our annotators identified suitable questions from the dataset that could be naturally transformed into normal versions. For these selected questions, we created normal counterparts by removing the trap or fallacy with minimal edits, to maintaining the same format. This selective pairing process resulted in 342 normal questions, which enable us to analyze how models handle similar content with and without logical traps. An example is provided in Figure 3.
<details>
<summary>x3.png Details</summary>
### Visual Description
## Text Blocks: Question and Categories
### Overview
The image presents a series of text blocks, each with a different background color, containing questions, explanations, and categorizations related to the feeling of being hot. The text includes a question in both Chinese and English, an explanation of irrationality, a paired question, and categories.
### Components/Axes
* **Background Colors:** The text blocks are distinguished by different background colors: light beige, light orange, light yellow, light blue, and light green.
* **Text Labels:** Each block starts with a label indicating its type: "Question (zh)", "Question (en)", "Irrationality", "Paired Question", and "Category".
### Detailed Analysis or ### Content Details
* **Question (zh):** (Light beige background)
* Text: "如果我热怎么办? 应该去跑步吗,跑的越快,风就越大,很快就凉快了。"
* Translation: "If I feel hot, what should I do? Should I go for a run? The faster I run, the stronger the wind, and I'll cool down quickly."
* **Question (en):** (Light orange background)
* Text: "If I feel hot. Can I just go for a run? The faster I run, the stronger the wind, and I'll cool down immediately."
* **Irrationality:** (Light yellow background)
* Text: "Running generates more body heat, which will likely make you feel hotter rather than cooler, regardless of the wind created."
* **Paired Question:** (Light blue background)
* Text: "If I feel hot. Can I just turn on the air conditioner? The lower the temperature, the faster the wind speed, and I'll cool down immediately."
* **Category:** (Light green background)
* Text: "2 (Commonsense Misunderstanding), 5 (Absurd Imagination)"
### Key Observations
* The image presents a question in two languages, Chinese and English, followed by an explanation of why the initial premise is irrational.
* A "Paired Question" offers a more logical alternative.
* The categories classify the initial question as a "Commonsense Misunderstanding" and an "Absurd Imagination".
### Interpretation
The image appears to be part of an educational or explanatory material, possibly related to critical thinking or understanding common misconceptions. It contrasts an intuitive but flawed solution (running to cool down) with a more rational one (using air conditioning). The categorization adds a layer of analysis, highlighting the nature of the initial misunderstanding.
</details>
Figure 3: Sample data entry format in RuozhiBench.
| Attribute | # Q. | # Q w/ Pair | Avg. len | Max len | Min len |
| --- | --- | --- | --- | --- | --- |
| Value | 677 | 342 | 18.64 | 100 | 5 |
Table 2: Statistical overview of RuozhiBench-Gen: total questions, paired questions, and question length distribution (# words).
Irrationality Analysis
To facilitate automatic evaluation, we generated an analysis of the logical fallacy or trick in each question. We used GPT-4o-2024-08-06 with carefully designed prompts (see Figure 10) to generate initial analyses, followed by human verification and correction to ensure accuracy.
<details>
<summary>x4.png Details</summary>
### Visual Description
## Heatmap: LLM Performance Across Error Categories
### Overview
The image is a heatmap displaying the performance of various Large Language Models (LLMs) across different error categories. The rows represent the LLMs, and the columns represent the error categories and the average performance. The cells are color-coded, with darker shades indicating higher values.
### Components/Axes
* **Rows (LLMs):**
* claude-3-haiku-20240307
* Mixtral-8x22B-v0.1
* Llama-3.1-70B
* Qwen2.5-32B
* Qwen2.5-72B
* gpt-4o-2024-05-13
* Mixtral-8x7B-v0.1
* Qwen2.5-7B
* gpt-4o-mini-2024-07-18
* Qwen2.5-3B
* claude-3-sonnet-20240229
* Llama-3.1-8B
* Llama-3.2-3B
* Mistral-7B-v0.1
* Llama-3.2-1B
* Qwen2.5-0.5B
* Average
* **Columns (Categories):**
* Absurd Imagination
* Commonsense Misunderstanding
* Erroneous Assumption
* Logical Error
* Others
* Scientific Misconception
* Average
### Detailed Analysis or Content Details
The heatmap presents numerical values for each LLM's performance in each category. The values range from approximately 7.35 to 66.96. The "Average" row and column provide the average performance across LLMs and categories, respectively.
Here's a breakdown of the data, including trends and specific values:
* **Absurd Imagination:**
* Values range from 12.37 (Qwen2.5-0.5B) to 61.99 (claude-3-haiku-20240307).
* The average is 44.93.
* **Commonsense Misunderstanding:**
* Values range from 12.49 (Qwen2.5-0.5B) to 61.95 (claude-3-haiku-20240307).
* The average is 44.51.
* **Erroneous Assumption:**
* Values range from 12.96 (Qwen2.5-0.5B) to 62.52 (claude-3-haiku-20240307).
* The average is 44.24.
* **Logical Error:**
* Values range from 13.87 (Qwen2.5-0.5B) to 58.25 (claude-3-haiku-20240307).
* The average is 43.92.
* **Others:**
* Values range from 7.35 (Qwen2.5-0.5B) to 63.24 (claude-3-haiku-20240307).
* The average is 41.37.
* **Scientific Misconception:**
* Values range from 13.69 (Qwen2.5-0.5B) to 66.96 (claude-3-haiku-20240307).
* The average is 49.20.
* **Average (across categories):**
* Values range from 12.70 (Qwen2.5-0.5B) to 62.00 (claude-3-haiku-20240307).
* The average of the averages is not explicitly provided (marked as "nan").
### Key Observations
* **Top Performers:** The "claude-3-haiku-20240307" model consistently shows high values across all error categories and in the average, indicating better performance.
* **Bottom Performers:** The "Qwen2.5-0.5B" model consistently shows low values across all error categories and in the average, indicating worse performance.
* **Category Variation:** The "Scientific Misconception" category has the highest average value (49.20), suggesting that LLMs generally struggle more with this type of error. The "Others" category has the lowest average value (41.37).
### Interpretation
The heatmap provides a comparative analysis of LLM performance across different error types. The data suggests that certain models are more prone to specific types of errors than others. For example, while "claude-3-haiku-20240307" performs well overall, "Qwen2.5-0.5B" struggles across all categories. The higher average for "Scientific Misconception" indicates a general weakness in LLMs' understanding or handling of scientific concepts. This information can be valuable for developers in identifying areas for improvement in LLM training and design. The absence of an overall average ("nan") is an oversight, as it would provide a single metric for comparing the models' aggregate performance.
</details>
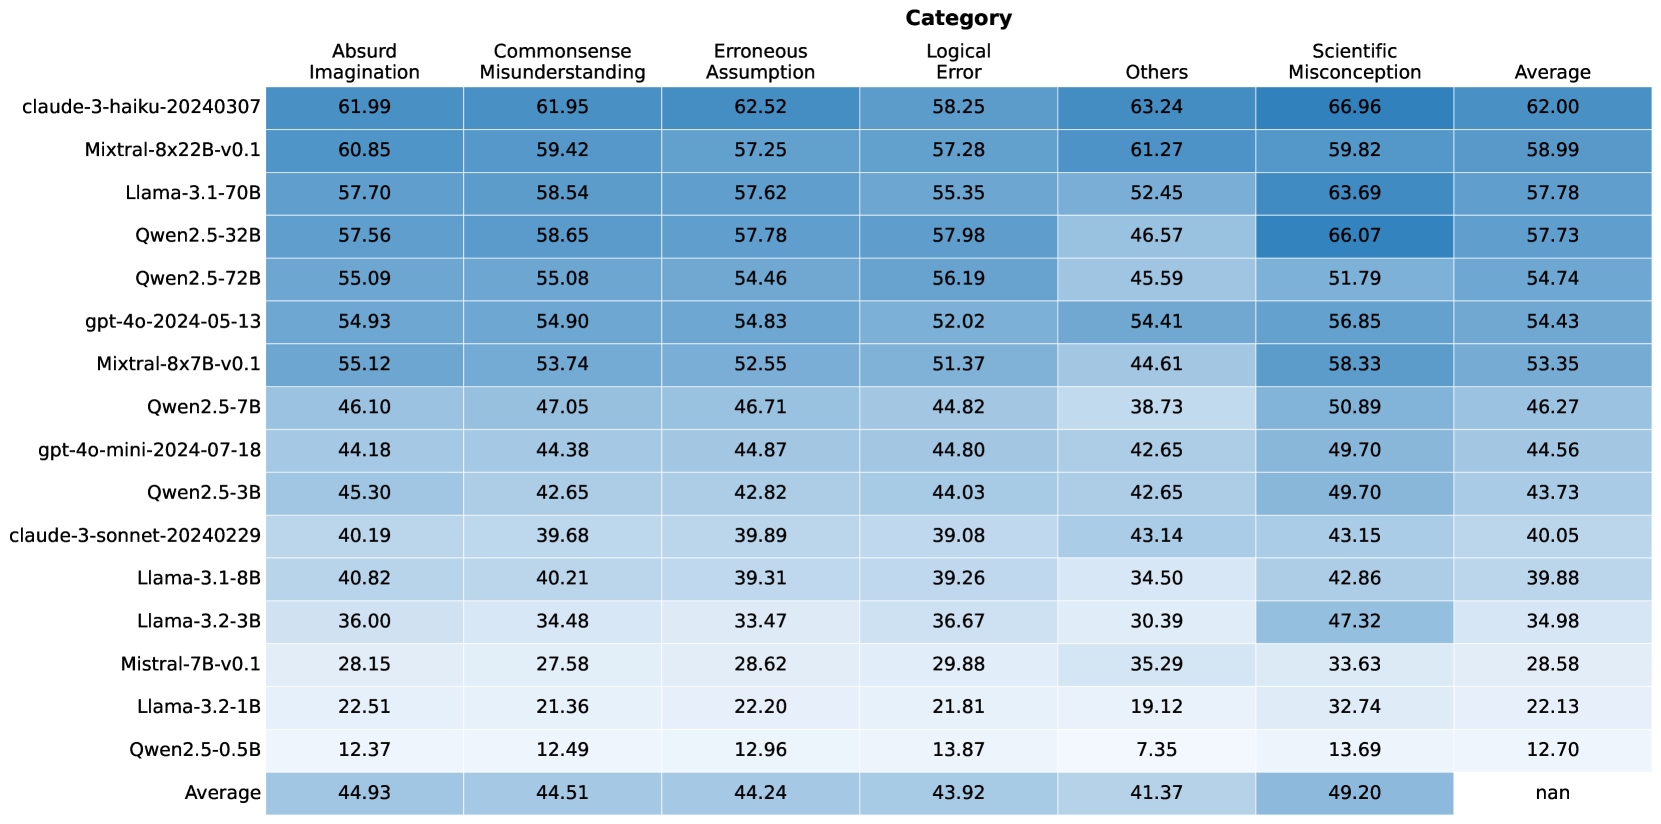
Figure 4: Overall model performance across different error categories.
Question Type Annotation
Finally, we categorized questions into 6 types (shown in Table 1). We first used GPT-4o-2024-08-06 with bilingual prompts (see Figure 11) to generate initial classifications based on both the questions and their irrationality analyses. Human annotators then reviewed and adjusted these classifications. For cases where annotators disagreed or were uncertain, a meta annotator (one of the authors) made the final decision to ensure consistency and quality across both the English and Chinese versions, resulting in the final RuozhiBench-Gen.
2.4 RuozhiBench-Gen Statistics
Figure 3 illustrates the structure of a data entry in RuozhiBench. Each entry consists of a question in both Chinese and English, its irrationality analysis, question categories, and where applicable, the paired normal question. Table 2 shows the basic statistics of the dataset.
3 Experiments on RuozhiBench-Gen
3.1 Setup
Models
We evaluated 17 advanced models from 5 series. Including: GPT-4o-2024-05-13, GPT-4o-mini-2024-07-18 from OpenAI (OpenAI, 2023); Claude-3-haiku-20240307, and Claude-3-sonnet-20240229 from Anthropic Claude (2023); Mistral-Instruct-v0.1 (7B, 8x7B, and 8x22B) from Mixtral Jiang et al. (2024); Qwen2.5-Instruct (0.5B, 3B, 7B, 32B, 72B) from Qwen team Bai et al. (2023b); and Llama-3.1-Instruct (8B, 70B), Llama-3.2-Instruct (1B, 3B) from Meta Meta AI (2024).
Automated Evaluation
We employ an LLM-as-Judge framework using three independent models: GPT-4o-2024-08-06, Claude-3.5-Sonnet-20241022, and Llama-3.3-70B-Instruct. By design, we ensure the judge models are distinct from those being evaluated and represent more advanced versions of their respective architectures. Each judge independently evaluates responses on a scale of 0 to 4. Additionally, we incorporate irrationality analysis into the judging process to enhance evaluation quality and consistency. The detailed scoring criteria and evaluation prompts are available in Figure 13.
3.2 Main results
The results highlight significant performance differences across models and error categories. Claude-3-haiku leads with an average score of 62.00, particularly excelling in “Scientific Misconception” (66.96). Mixtral-8x22B-v0.1 (58.99) and Llama-3.1-70B (57.78) follow closely, showing balanced performance across categories.
A clear trend is observed across all model series: larger models consistently outperform their smaller counterparts, as seen in the Qwen, Llama, Mixtral, and GPT families. This suggests that model size plays a crucial role in performance, though architectural design and training strategies, such as those in Mixtral models, also contribute significantly.
Across categories, “Scientific Misconception” has the highest average score (49.20), suggesting models handle domain-specific knowledge better than abstract concepts like “Absurd Imagination” and “Others”. Smaller models, such as Qwen2.5-0.5B, consistently struggle, reinforcing the importance of both scale and training strategies in reducing errors.
Notably, the best-performing model only achieved a score of 62.00, indicating that this task remains inherently challenging for current models.
3.3 Comparison on Paired Normal Questions
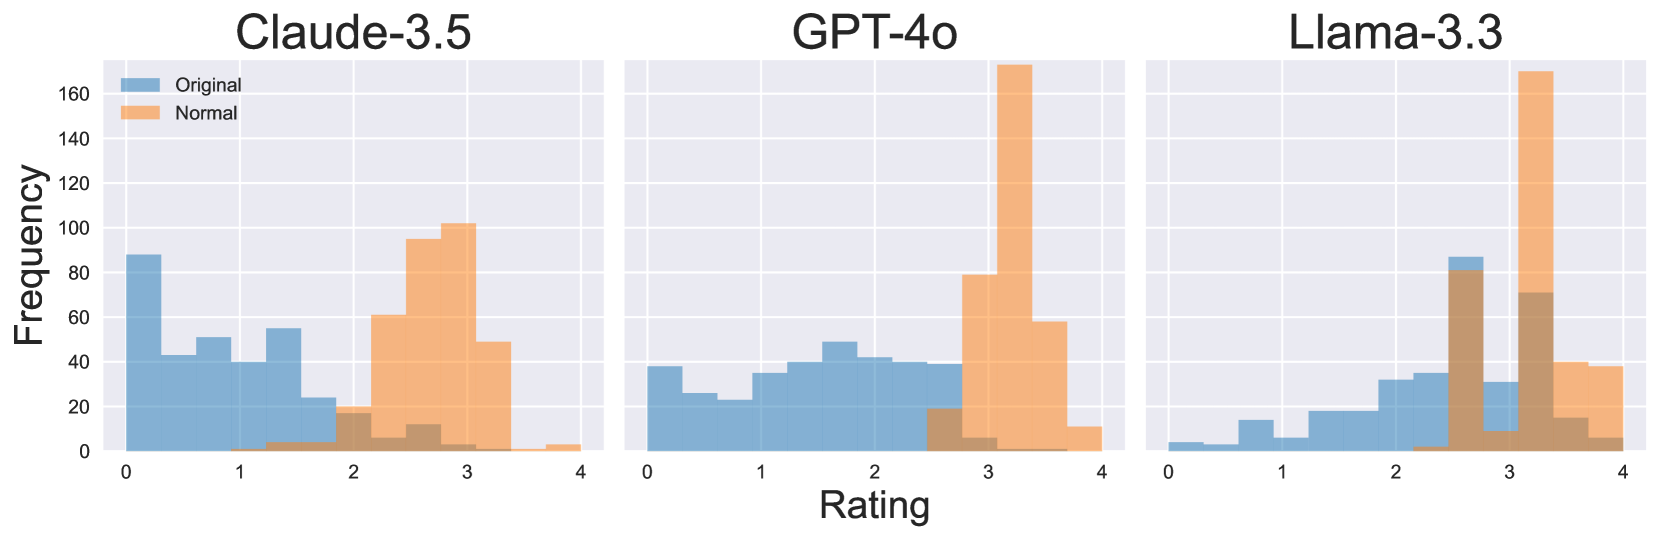
To compare model performance on normal and tricky questions, we input paired normal questions and apply the same LLM-based judging with a 0-4 scoring system (see Figure 13 for prompt). Figure 5 shows the rating distributions from three evaluators for three models. The results reveal a clear shift toward higher scores, indicating better performance on normal questions while logical traps remain consistently challenging.
<details>
<summary>x5.png Details</summary>
### Visual Description
## Histogram: Model Rating Distributions
### Overview
The image presents three histograms comparing the rating distributions of three language models: Claude-3.5, GPT-4o, and Llama-3.3. Each histogram displays the frequency of ratings for "Original" and "Normal" categories. The x-axis represents the rating, ranging from 0 to 4, and the y-axis represents the frequency, ranging from 0 to 160.
### Components/Axes
* **Titles (Top):** Claude-3.5, GPT-4o, Llama-3.3
* **X-Axis Title:** Rating
* **X-Axis Scale:** 0, 1, 2, 3, 4
* **Y-Axis Title:** Frequency
* **Y-Axis Scale:** 0, 20, 40, 60, 80, 100, 120, 140, 160
* **Legend (Top-Left):**
* Blue: Original
* Orange: Normal
### Detailed Analysis
**Claude-3.5:**
* **Original (Blue):** The distribution is relatively uniform between 0 and 2, with a peak around 0. The frequency is approximately:
* 0: 90
* 1: 50
* 2: 20
* 3: 0
* 4: 0
* **Normal (Orange):** The distribution is skewed towards higher ratings, with a peak around 3. The frequency is approximately:
* 0: 0
* 1: 0
* 2: 20
* 3: 100
* 4: 10
**GPT-4o:**
* **Original (Blue):** The distribution is relatively uniform between 0 and 3, with a peak around 2. The frequency is approximately:
* 0: 30
* 1: 40
* 2: 40
* 3: 40
* 4: 0
* **Normal (Orange):** The distribution is heavily skewed towards a rating of 3. The frequency is approximately:
* 0: 0
* 1: 0
* 2: 0
* 3: 170
* 4: 10
**Llama-3.3:**
* **Original (Blue):** The distribution is skewed towards higher ratings, with a peak around 3. The frequency is approximately:
* 0: 0
* 1: 0
* 2: 10
* 3: 90
* 4: 10
* **Normal (Orange):** The distribution is heavily skewed towards a rating of 4. The frequency is approximately:
* 0: 0
* 1: 0
* 2: 0
* 3: 70
* 4: 170
### Key Observations
* For Claude-3.5, the "Original" ratings are more evenly distributed, while "Normal" ratings are concentrated around 3.
* For GPT-4o, "Original" ratings are relatively uniform, while "Normal" ratings are overwhelmingly concentrated at 3.
* For Llama-3.3, "Original" ratings peak at 3, while "Normal" ratings are heavily concentrated at 4.
### Interpretation
The histograms suggest that the "Normal" ratings tend to be higher than the "Original" ratings across all three models. GPT-4o and Llama-3.3 show a particularly strong bias towards higher ratings in the "Normal" category, with most ratings clustered around 3 and 4, respectively. Claude-3.5 shows a more moderate shift towards higher ratings in the "Normal" category. This could indicate that the "Normal" condition leads to more favorable ratings compared to the "Original" condition for these language models.
</details>
Figure 5: Rating distribution comparison between normal and tricky questions for three models..
<details>
<summary>x6.png Details</summary>
### Visual Description
## Pairwise Scatter Plot Matrix of Language Model Outputs
### Overview
The image is a pairwise scatter plot matrix comparing the outputs of three language models: Claude-3.5, GPT-4o, and Llama-3.3. The diagonal shows histograms of each model's output distribution. The off-diagonal plots show scatter plots of the outputs of each pair of models, along with a red line indicating the linear regression fit. The correlation coefficient 'r' is displayed on each scatter plot.
### Components/Axes
* **Axes Labels:**
* X-axis and Y-axis labels are the names of the language models: Claude-3.5, GPT-4o, and Llama-3.3.
* The axes range from approximately 0 to 4.
* The histogram axes range from 0 to approximately 120 for Claude-3.5, and 0 to 4 for GPT-4o and Llama-3.3.
* **Histograms (Diagonal):**
* Claude-3.5: Histogram shows a right-skewed distribution, with most values concentrated between 0 and 2.
* GPT-4o: Histogram shows a more uniform distribution between 0 and 4.
* Llama-3.3: Histogram shows a right-skewed distribution, with most values concentrated between 2 and 4.
* **Scatter Plots (Off-Diagonal):**
* Each scatter plot shows the relationship between two language models' outputs.
* A red line indicates the linear regression fit.
* The correlation coefficient 'r' is displayed on each plot.
### Detailed Analysis
* **Claude-3.5 vs. GPT-4o (Top-Middle):**
* Scatter plot shows a positive correlation.
* The red regression line slopes upward.
* r = 0.73
* **Claude-3.5 vs. Llama-3.3 (Top-Right):**
* Scatter plot shows a positive correlation.
* The red regression line slopes upward.
* r = 0.43
* **GPT-4o vs. Claude-3.5 (Middle-Left):**
* Scatter plot shows a positive correlation.
* The red regression line slopes upward.
* r = 0.73
* **GPT-4o vs. Llama-3.3 (Middle-Right):**
* Scatter plot shows a positive correlation.
* The red regression line slopes upward.
* r = 0.75
* **Llama-3.3 vs. Claude-3.5 (Bottom-Left):**
* Scatter plot shows a positive correlation.
* The red regression line slopes upward.
* r = 0.43
* **Llama-3.3 vs. GPT-4o (Bottom-Middle):**
* Scatter plot shows a positive correlation.
* The red regression line slopes upward.
* r = 0.75
### Key Observations
* GPT-4o and Llama-3.3 have the highest correlation (r = 0.75).
* Claude-3.5 and Llama-3.3 have the lowest correlation (r = 0.43).
* Claude-3.5's output distribution is skewed towards lower values compared to GPT-4o and Llama-3.3.
* GPT-4o's output distribution is more uniform.
* Llama-3.3's output distribution is skewed towards higher values.
### Interpretation
The scatter plot matrix provides insights into the relationships between the outputs of the three language models. The correlation coefficients indicate the strength and direction of the linear relationship between each pair of models. The histograms reveal the distribution of outputs for each model.
The high correlation between GPT-4o and Llama-3.3 suggests that these models tend to produce similar outputs. The lower correlation between Claude-3.5 and Llama-3.3 indicates that these models' outputs are less aligned. The differences in output distributions suggest that each model has a different response profile.
The data suggests that GPT-4o and Llama-3.3 may be more similar in their behavior, while Claude-3.5 exhibits distinct characteristics. This information could be valuable for selecting the appropriate model for a specific task or for combining the outputs of multiple models to improve performance.
</details>
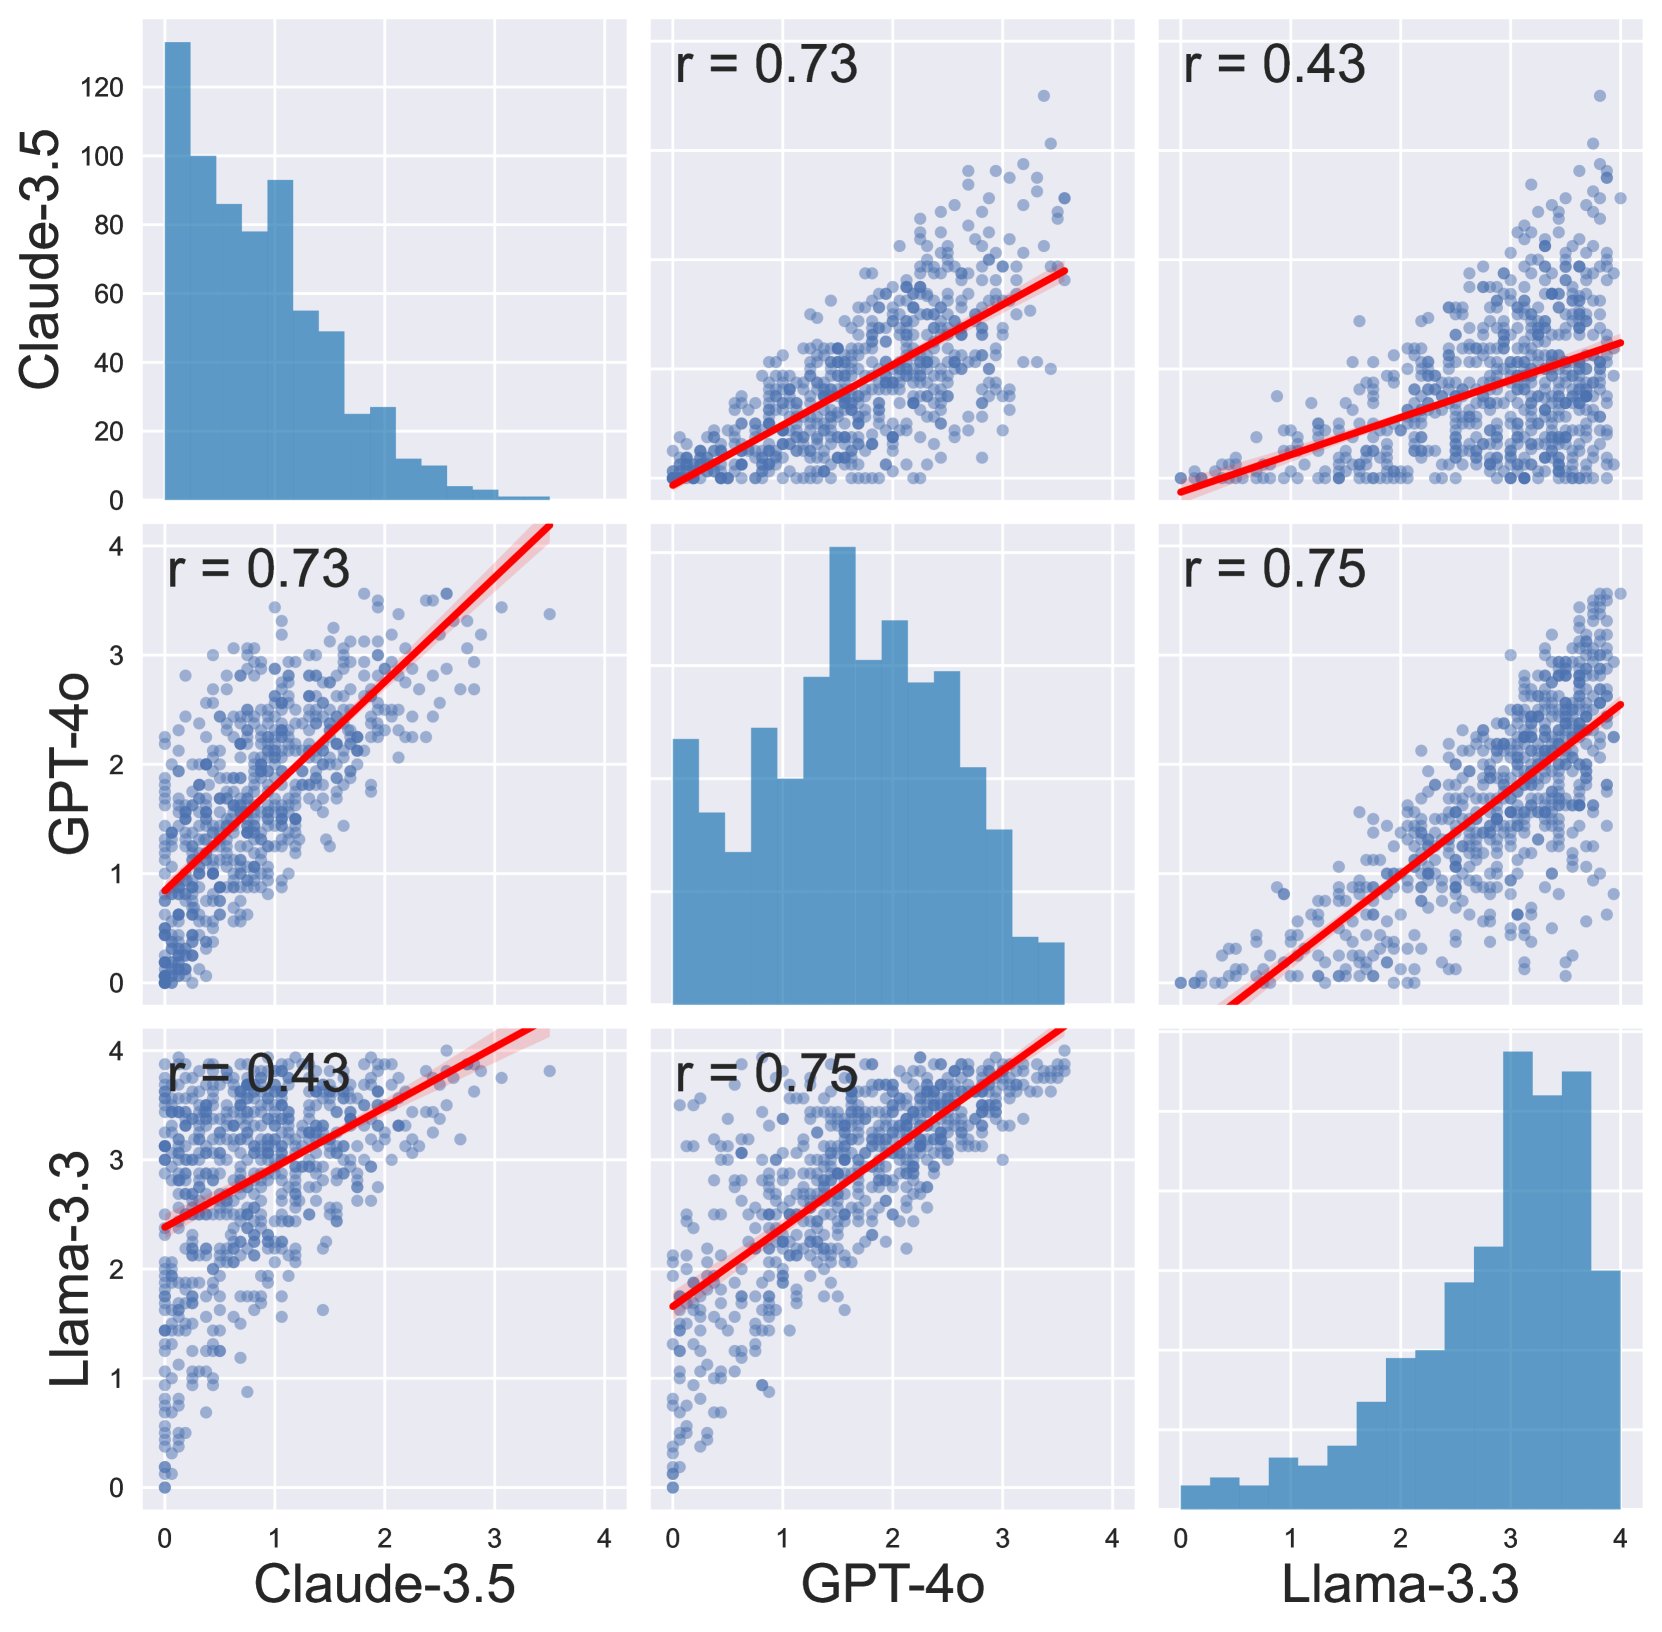
Figure 6: Pairwise scatter plots with Pearson correlation coefficients, and rating distributions of difference evaluators. The diagonal histograms show Claude-3.5’s tendency toward lower ratings compared to GPT-4 in middle and Llama-3.3 with a higher ratings.
3.4 High Variance between Evaluators
| Model Pair | Pearson Correlation | Mean Difference | Large Disagreement (%) | | | |
| --- | --- | --- | --- | --- | --- | --- |
| Individual | Mean | Individual | Mean | Individual | Mean | |
| Claude vs GPT | 0.568 | 0.726 | -0.560 | -0.806 | 0.281 | 3.99 |
| Claude vs Llama | 0.359 | 0.433 | -2.107 | -2.002 | 1.007 | 50.37 |
| GPT vs Llama | 0.687 | 0.748 | -1.196 | -1.196 | 19.80 | 10.19 |
Table 3: Comparison of rating agreement metrics between model pairs. Individual analysis treats each rating independently, while Mean analysis averages multiple ratings per item. Pearson correlation measures linear relationship strength (-1 to 1); Mean difference indicates systematic rating bias between models; Large disagreement shows percentage of ratings differing by $≥$ 2 points.
Table 3 presents key metrics comparing rating agreements between model pairs, and Figure 6 visualizes the mean-based pairwise relationships and rating distributions. Full results and evaluations using all three evaluators are presented in Appendix D.
The comparison reveals distinct rating patterns among the three models. GPT-4o and Llama-3.3 demonstrate the strongest agreement, with the highest correlation and relatively moderate large disagreements. In contrast, Claude-3.5 shows notably weaker correlation with others, indicating fundamentally different evaluation standard given the same criteria.
Mean-based analysis consistently shows stronger correlations and fewer large disagreements compared to individual analysis across all model pairs. This pattern is particularly evident in the Claude-3.5 vs GPT-4o comparison, where large disagreements decrease from 28.1% to 3.99% when using mean-based analysis. The scatter plots in Figure 6 visualize these relationships, with the GPT-4o vs Llama-3.3 comparison showing the tightest clustering around the regression line, while the Claude-3.5 vs Llama-3.3 comparison exhibits more dispersed points, reflecting their lower correlation and higher disagreement rate. These observations motivate us the creation of the multiple-choice evaluation format.
<details>
<summary>x7.png Details</summary>
### Visual Description
## Heatmap: Model Performance Across Error Categories
### Overview
The image is a heatmap displaying the performance of various language models across different error categories. The rows represent the models, and the columns represent the error categories. The cells contain numerical values indicating the performance (likely error rate or a similar metric), with darker shades of blue indicating higher values. The last column shows the micro-average performance for each model.
### Components/Axes
* **Rows (Models):**
* Llama-3.1-70B
* gpt-4o-2024-05-13
* Qwen2.5-72B
* Qwen2.5-32B
* Mixtral-8x22B-v0.1
* Mixtral-8x7B-v0.1
* Qwen2.5-7B
* Llama-3.1-8B
* claude-3-haiku-20240307
* gpt-4o-mini-2024-07-18
* claude-3-sonnet-20240229
* Qwen2.5-3B
* Llama-3.2-3B
* Mistral-7B-v0.1
* Qwen2.5-0.5B
* Llama-3.2-1B
* Average
* **Columns (Error Categories):**
* Logical Error
* Commonsense Misunderstanding
* Erroneous Assumption
* Scientific Misconception
* Absurd Imagination
* Others
* Micro Average
### Detailed Analysis
Here's a breakdown of the data, row by row:
* **Llama-3.1-70B:**
* Logical Error: 60.42
* Commonsense Misunderstanding: 58.21
* Erroneous Assumption: 57.31
* Scientific Misconception: 46.43
* Absurd Imagination: 56.74
* Others: 57.35
* Micro Average: 56.90
* **gpt-4o-2024-05-13:**
* Logical Error: 52.00
* Commonsense Misunderstanding: 56.58
* Erroneous Assumption: 52.77
* Scientific Misconception: 46.43
* Absurd Imagination: 52.13
* Others: 47.06
* Micro Average: 53.12
* **Qwen2.5-72B:**
* Logical Error: 49.29
* Commonsense Misunderstanding: 50.85
* Erroneous Assumption: 50.39
* Scientific Misconception: 53.57
* Absurd Imagination: 49.89
* Others: 35.29
* Micro Average: 49.82
* **Qwen2.5-32B:**
* Logical Error: 53.75
* Commonsense Misunderstanding: 50.56
* Erroneous Assumption: 50.83
* Scientific Misconception: 39.29
* Absurd Imagination: 47.26
* Others: 41.18
* Micro Average: 49.37
* **Mixtral-8x22B-v0.1:**
* Logical Error: 46.38
* Commonsense Misunderstanding: 47.61
* Erroneous Assumption: 46.12
* Scientific Misconception: 44.44
* Absurd Imagination: 46.45
* Others: 47.06
* Micro Average: 46.48
* **Mixtral-8x7B-v0.1:**
* Logical Error: 44.72
* Commonsense Misunderstanding: 46.30
* Erroneous Assumption: 45.10
* Scientific Misconception: 45.63
* Absurd Imagination: 46.01
* Others: 47.06
* Micro Average: 45.99
* **Qwen2.5-7B:**
* Logical Error: 36.69
* Commonsense Misunderstanding: 39.61
* Erroneous Assumption: 40.21
* Scientific Misconception: 58.57
* Absurd Imagination: 43.19
* Others: 32.73
* Micro Average: 41.57
* **Llama-3.1-8B:**
* Logical Error: 43.19
* Commonsense Misunderstanding: 41.26
* Erroneous Assumption: 40.83
* Scientific Misconception: 51.67
* Absurd Imagination: 41.81
* Others: 26.27
* Micro Average: 41.24
* **claude-3-haiku-20240307:**
* Logical Error: 42.14
* Commonsense Misunderstanding: 40.80
* Erroneous Assumption: 42.51
* Scientific Misconception: 39.29
* Absurd Imagination: 43.21
* Others: 29.41
* Micro Average: 40.77
* **gpt-4o-mini-2024-07-18:**
* Logical Error: 41.43
* Commonsense Misunderstanding: 38.80
* Erroneous Assumption: 38.99
* Scientific Misconception: 50.00
* Absurd Imagination: 37.78
* Others: 47.06
* Micro Average: 39.29
* **claude-3-sonnet-20240229:**
* Logical Error: 37.14
* Commonsense Misunderstanding: 35.80
* Erroneous Assumption: 34.80
* Scientific Misconception: 39.29
* Absurd Imagination: 31.90
* Others: 29.41
* Micro Average: 34.56
* **Qwen2.5-3B:**
* Logical Error: 39.06
* Commonsense Misunderstanding: 32.10
* Erroneous Assumption: 32.54
* Scientific Misconception: 48.15
* Absurd Imagination: 33.25
* Others: 26.79
* Micro Average: 33.26
* **Llama-3.2-3B:**
* Logical Error: 34.53
* Commonsense Misunderstanding: 34.84
* Erroneous Assumption: 35.95
* Scientific Misconception: 21.32
* Absurd Imagination: 27.98
* Others: 22.22
* Micro Average: 32.10
* **Mistral-7B-v0.1:**
* Logical Error: 4.70
* Commonsense Misunderstanding: 0.40
* Erroneous Assumption: 5.85
* Scientific Misconception: 3.57
* Absurd Imagination: 0.45
* Others: 0.00
* Micro Average: 2.81
* **Qwen2.5-0.5B:**
* Logical Error: 0.00
* Commonsense Misunderstanding: 0.00
* Erroneous Assumption: 0.00
* Scientific Misconception: 0.00
* Absurd Imagination: 0.00
* Others: 0.00
* Micro Average: 0.00
* **Llama-3.2-1B:**
* Logical Error: -3.39
* Commonsense Misunderstanding: -2.77
* Erroneous Assumption: -0.69
* Scientific Misconception: 1.52
* Absurd Imagination: -6.17
* Others: 23.78
* Micro Average: -2.46
* **Average:**
* Logical Error: 36.38
* Commonsense Misunderstanding: 35.68
* Erroneous Assumption: 35.84
* Scientific Misconception: 36.82
* Absurd Imagination: 34.49
* Others: 32.04
### Key Observations
* **Llama-3.1-70B** has the highest Logical Error rate (60.42) and the highest Commonsense Misunderstanding rate (58.21).
* **Mistral-7B-v0.1, Qwen2.5-0.5B, and Llama-3.2-1B** generally have the lowest error rates across most categories. Llama-3.2-1B even has negative error rates in some categories, which is unusual and may indicate a different interpretation of the metric.
* **Qwen2.5-7B** has a significantly higher Scientific Misconception rate (58.57) compared to its other error rates.
* The "Others" category has the lowest average value (32.04) compared to other error categories.
* The average values across error categories are relatively similar, ranging from 32.04 to 36.82.
### Interpretation
The heatmap provides a comparative analysis of language model performance across various error types. It highlights the strengths and weaknesses of each model in specific areas. For example, Llama-3.1-70B seems to struggle more with logical errors and commonsense misunderstandings compared to other models. The negative values for Llama-3.2-1B suggest that the metric used might be a difference or improvement score relative to a baseline, rather than a raw error rate. The relatively low error rates for Mistral-7B-v0.1 and Qwen2.5-0.5B suggest that these models are more robust in avoiding these types of errors, or that they are smaller models that are less likely to generate complex errors. The high Scientific Misconception rate for Qwen2.5-7B could indicate a need for improved training data or model architecture to address this specific weakness. Overall, the heatmap is a useful tool for identifying areas where language models can be improved and for selecting the most appropriate model for a given task based on its error profile.
</details>
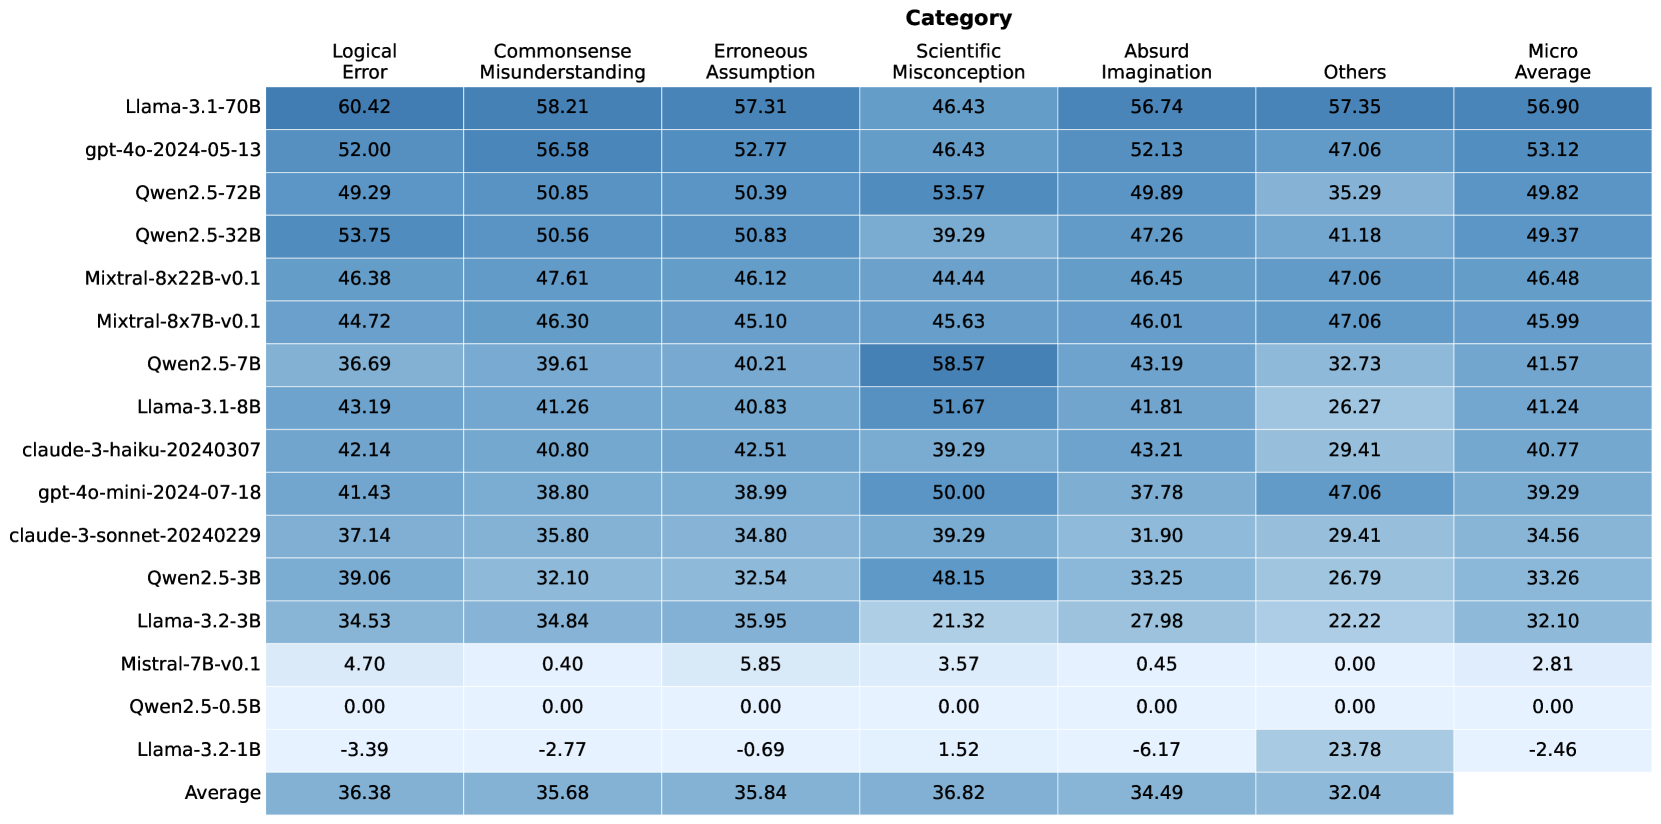
Figure 7: RuozhiBench-MC evaluation results in percentage by question categories. Scores ( $x$ ) are normalized according to the baseline score ( $50\%$ ) by $2×(x-0.5)$ .
4 RuozhiBench-MC: A Multiple-Choice Evaluation Framework
While generative evaluation provides a natural way to assess language model responses to tricky questions, our experiments on RuozhiBench-Gen revealed several limitations in the evaluation process. First, evaluator models themselves may sometimes fail to recognize subtle logical traps, even when provided with analysis of the trick, leading to inaccurate assessments. Second, the significant variations in scoring standards across different evaluator models as seen in Section 3.4. Finally, the two-step process of generating responses and then evaluating them with high-performance models introduces both substantial computational overhead and significant costs, particularly when using commercial models as evaluators.
4.1 Multiple-Choice Format
To address evaluation challenges, we created RuozhiBench-MC, a multiple-choice version of our benchmark. For each question, we present two responses, one “good” and one “bad”, and ask an LLM to choose between them. This binary format transforms evaluation from open-ended generation to a simple decision: can the model identify better logical reasoning? There are several key advantages: (1) Standardized Evaluation through consistent binary choices, (2) Computational Efficiency by eliminating separate generation and evaluation, and (3) Clear Success Criteria via unambiguous metrics.
4.2 Option Construction
To construct high-quality response options for RuozhiBench-MC, we leveraged the extensive response data collected during our evaluation of the 17 models in RuozhiBench-Gen. For each question, we implemented the following selection process.
We used the automatic evaluations from three different models to calculate an average score for each response in our existing dataset. We randomly sample two responses for each question, ensuring that the selected responses have a score difference greater than 2. If no response pairs meet this criterion, we select the responses with the highest and lowest scores. In all cases, the response with the higher score is designated as the “good” answer, while the other is designated as the “bad” answer. The detailed distribution of selected responses across models is shown in Figure 15.
5 Experiments on RuozhiBench-MC
We evaluate the same models as in Section 3. In our evaluation, we test models by presenting each question with its two corresponding options in alternating orders. This approach helps eliminate potential position bias in model responses while maintaining the fundamental binary choice structure. Models are prompted to select their preferred answer, and their performance is assessed based on their ability to consistently identify the better response.
| Model | Good First | Bad First | Avg | Positional Bias | Format |
| --- | --- | --- | --- | --- | --- |
| Llama-3.2-1B-Instruct | $58.19$ | $39.35$ | $48.77$ | $18.84$ | $59.68$ |
| Llama-3.2-3B-Instruct | $65.43$ | $66.67$ | $66.05$ | $-1.24$ | $53.99$ |
| Llama-3.1-8B-Instruct | $76.97$ | $64.26$ | $70.62$ | $12.71$ | $89.96$ |
| Llama-3.1-70B-Instruct | $81.86$ | $75.04$ | $78.45$ | $6.82$ | $98.67$ |
| Mistral-7B-Instruct-v0.1 | $55.85$ | $46.96$ | $51.41$ | $8.89$ | $99.70$ |
| Mixtral-8x7B-Instruct-v0.1 | $69.22$ | $76.77$ | $72.99$ | $-7.55$ | $96.23$ |
| Mixtral-8x22B-Instruct-v0.1 | $74.77$ | $71.71$ | $73.24$ | $3.07$ | $97.93$ |
| Qwen2.5-0.5B-Instruct | $100.00$ | $0.00$ | $50.00$ | $100.00$ | $89.66$ |
| Qwen2.5-3B-Instruct | $74.28$ | $58.98$ | $66.63$ | $15.30$ | $87.22$ |
| Qwen2.5-7B-Instruct | $68.59$ | $72.97$ | $70.78$ | $-4.38$ | $53.99$ |
| Qwen2.5-32B-Instruct | $77.00$ | $72.36$ | $74.68$ | $4.64$ | $99.48$ |
| Qwen2.5-72B-Instruct | $75.11$ | $74.70$ | $74.91$ | $0.41$ | $99.78$ |
| claude-3-haiku-20240307 | $73.41$ | $67.36$ | $70.38$ | $6.06$ | $100.00$ |
| claude-3-sonnet-20240229 | $67.21$ | $67.36$ | $67.28$ | $-0.15$ | $100.00$ |
| gpt-4o-mini-2024-07-18 | $72.23$ | $67.06$ | $69.65$ | $5.17$ | $100.00$ |
| gpt-4o-2024-05-13 | $81.22$ | $71.89$ | $76.56$ | $9.33$ | $99.48$ |
Table 4: RuozhiBench-MC evaluation results. Good First and Bad First are the accuracy in the percentage of selecting the correct answer where the correct answers are the first one and second one, respectively. Avg is the average of Good First and Bad First, with the random baseline of $50\%$ . Positional Bias indicates the models’ position bias to the first answer, and the closer it is to 0, the better. Format is the percentage of answers generated by the model in the correct format specified in the prompt.
5.1 Main Results
Figure 7 shows the overall model performance on RuozhiBench-MC. In the multiple-choice evaluation setting, the general finding that larger models perform better still holds. We can observe models with large models in the Llama, Qwen, Mixtral family and GPT-4o achieved at least 40 scores in micro average across all categories of questions, which shows that they are significantly better than the random baseline. On the other hand, the ranking of the top-performing models has changed significantly. The best-performing model (Claude-3-haiku) in open generation evaluation ranks only in the middle tier of all models, while Llama-3.1-70B and GPT-4o now take the lead with micro average scores of 56.90 and 53.12, respectively.
There are three small models Mistral-7B, Qwen2.5-0.5B, and Llama-3.2-1B struggle on the multiple-choice evaluation with almost zero performance difference compared to random baseline across all question categories. This observation suggests that these models cannot understand the concept and definition of trick questions and hence unable to accurately assess the answers to these questions, reaffirming that RuozhiBench-MC had the advantages of standardized evaluation and clear success criteria.
<details>
<summary>x8.png Details</summary>
### Visual Description
## Scatter Plot: Correlation between Generation and Multiple Choice Scores
### Overview
The image is a scatter plot showing the correlation between a "Generation Score" (x-axis) and a "Multiple Choice Score" (y-axis) for various language models. The plot includes individual data points for each model, a dashed red line indicating a linear trend, and a shaded red region representing the confidence interval around the trend line. The correlation coefficient is stated as 0.909.
### Components/Axes
* **Title:** Correlation between Generation and Multiple Choice Scores
* **Correlation Coefficient:** 0.909
* **X-axis:** Generation Score, ranging from approximately 10 to 60, with tick marks at intervals of 10.
* **Y-axis:** Multiple Choice Score, ranging from 45 to 80, with tick marks at intervals of 5.
* **Data Points:** Each data point represents a specific language model, labeled with its name (e.g., "Llama-3.1-70B", "Qwen2.5-0.5B").
* **Trend Line:** A dashed red line indicates the general trend of the data.
* **Confidence Interval:** A shaded red region around the trend line represents the confidence interval.
### Detailed Analysis or Content Details
**Data Points and their approximate coordinates:**
* **Qwen2.5-0.5B:** (15, 50)
* **Llama-3.2-1B:** (25, 48)
* **Mistral-7B-v0.1:** (30, 51)
* **Llama-3.2-3B:** (40, 65)
* **Llama-3.1-8B:** (38, 71)
* **Qwen2.5-3B:** (48, 66)
* **claude-3-sonnet:** (47, 68)
* **Qwen2.5-7B:** (48, 70)
* **gpt-4o-mini-2024-07-18:** (52, 69)
* **Mixtral-8x7B-v0.1:** (53, 73)
* **gpt-4o-2024-05-13:** (42, 75)
* **Mixtral-8x22B-v0.1:** (43, 74)
* **Qwen2.5-32B:** (58, 76)
* **Llama-3.1-70B:** (58, 79)
* **Qwen2.5-72B:** (58, 78)
* **Trend Line:** The dashed red line starts at approximately (10, 45) and extends to approximately (60, 62).
* **Confidence Interval:** The shaded red region widens as the Generation Score increases, indicating greater uncertainty in the prediction for higher generation scores.
### Key Observations
* There is a strong positive correlation (0.909) between Generation Score and Multiple Choice Score.
* The data points generally follow the trend line, but there is some scatter, indicating that Generation Score is not the only factor influencing Multiple Choice Score.
* The confidence interval widens at higher Generation Scores, suggesting that predictions become less precise as Generation Score increases.
* Some models, like "Mistral-7B-v0.1", deviate noticeably from the trend line, suggesting they may have different characteristics compared to other models.
### Interpretation
The scatter plot demonstrates a strong positive correlation between a model's "Generation Score" and its performance on multiple-choice questions. This suggests that, in general, models with higher generation scores tend to perform better on multiple-choice tasks. However, the scatter of the data points and the widening confidence interval indicate that other factors also play a role in determining a model's multiple-choice performance. The specific model architectures, training data, and fine-tuning strategies likely contribute to the observed variations. The outlier models, such as "Mistral-7B-v0.1", warrant further investigation to understand why their performance deviates from the general trend.
</details>
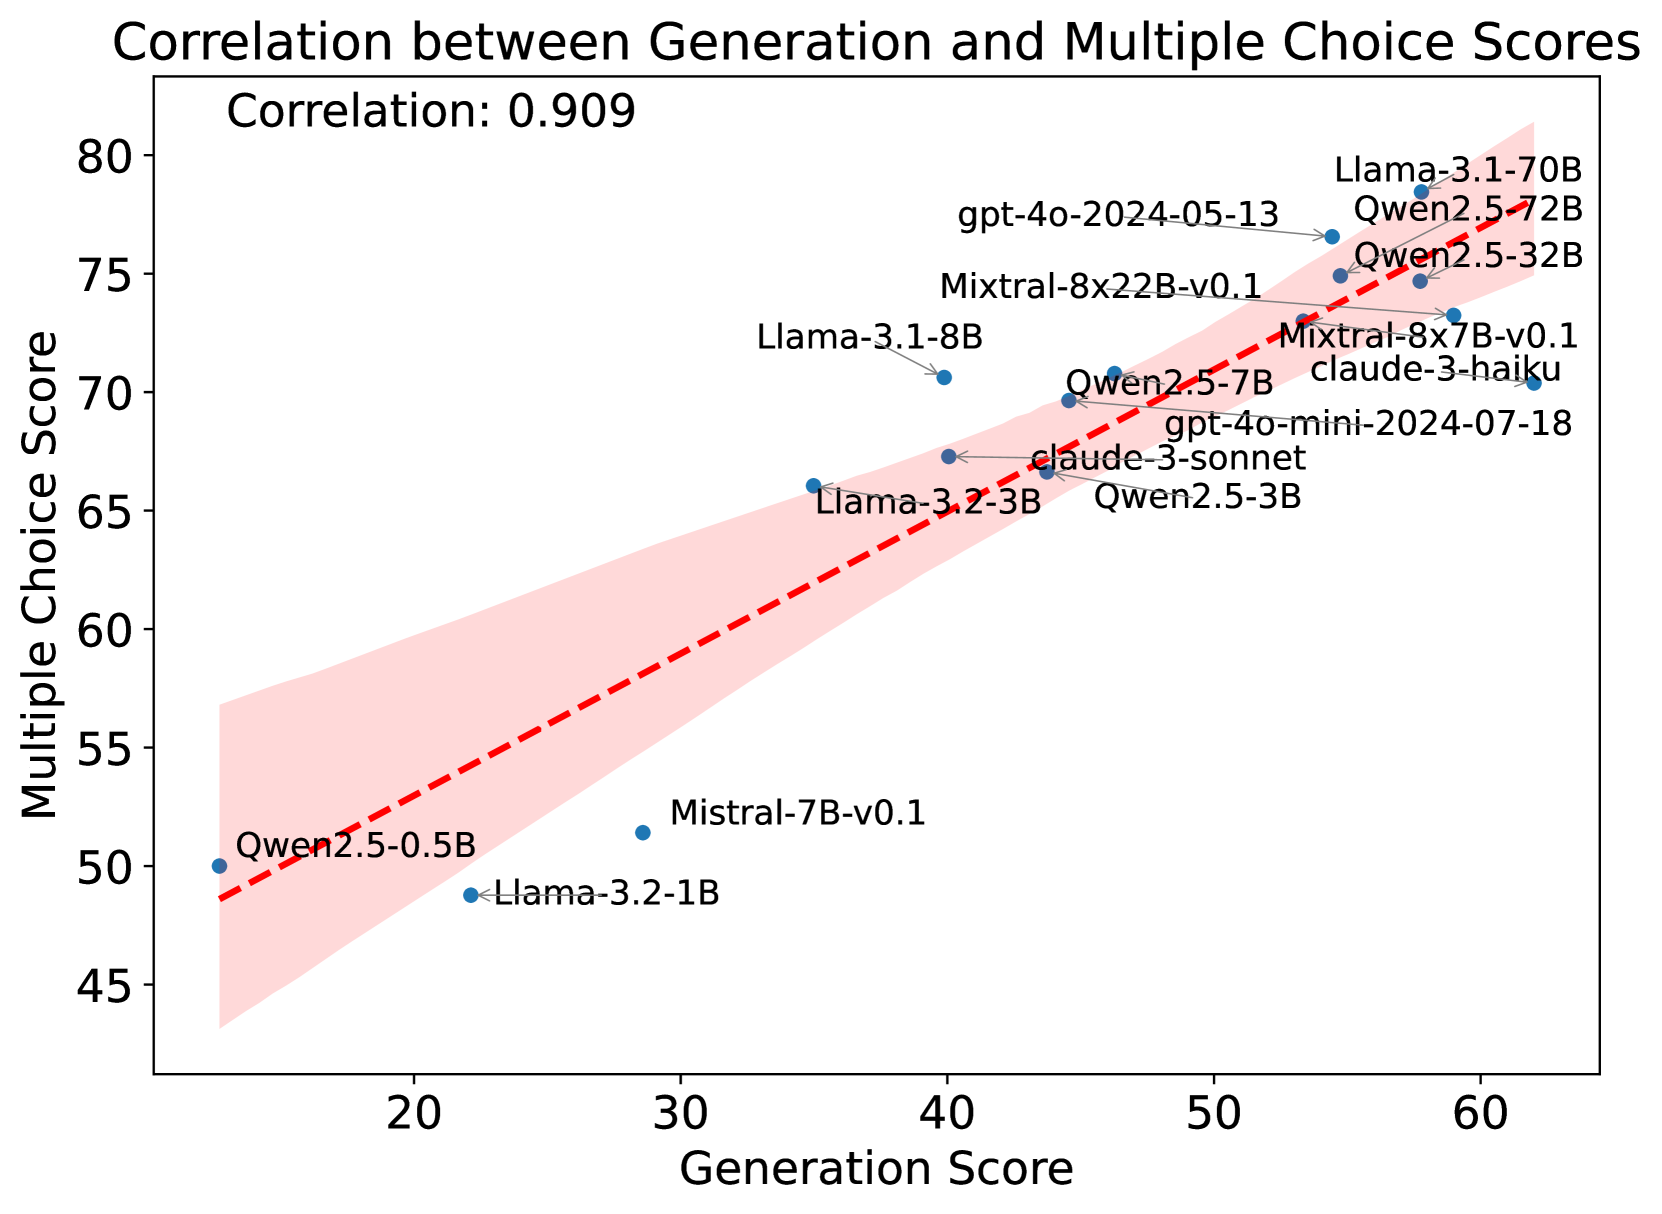
Figure 8: Pairwise scatter plots with Pearson correlation coefficients of generation and multiple choice scores.
<details>
<summary>x9.png Details</summary>
### Visual Description
## Scatter Plot: Model Size vs RuozhiBench Scores
### Overview
The image contains two scatter plots comparing the model size (in billions of parameters) of various language models against their scores on two different RuozhiBench benchmarks: Generation (Gen) and Multiple Choice (MC). The x-axis (Model Size) is logarithmic. The left plot shows the relationship between model size and the Generation score, while the right plot shows the relationship between model size and the Multiple Choice score.
### Components/Axes
**Left Plot (Model Size vs RuozhiBench-Gen Scores):**
* **Title:** Model Size vs RuozhiBench-Gen Scores
* **X-axis:** Model Size (B parameters) - Logarithmic scale. Approximate values shown are 10^0 (1) and 10^1 (10).
* **Y-axis:** Generation Score - Linear scale, ranging from 20 to 60.
* **Data Points:** Blue dots, each labeled with the model name.
* **Trend Line:** Dashed blue line showing the general trend.
**Right Plot (Model Size vs RuozhiBench-MC Scores):**
* **Title:** Model Size vs RuozhiBench-MC Scores
* **X-axis:** Model Size (B parameters) - Logarithmic scale. Approximate values shown are 10^0 (1) and 10^1 (10).
* **Y-axis:** Multiple Choice Score - Linear scale, ranging from 50 to 80.
* **Data Points:** Orange dots, each labeled with the model name.
* **Trend Line:** Dashed orange line showing the general trend.
### Detailed Analysis
**Left Plot (Model Size vs RuozhiBench-Gen Scores):**
* **Qwen2.5-0.5B:** Model Size ~0.5B, Generation Score ~25
* **Llama-3.2-1B:** Model Size ~1B, Generation Score ~22
* **Mistral-7B-v0.1:** Model Size ~7B, Generation Score ~34
* **Llama-3.2-3B:** Model Size ~3B, Generation Score ~35
* **Qwen2.5-3B:** Model Size ~3B, Generation Score ~42
* **Llama-3.1-8B:** Model Size ~8B, Generation Score ~40
* **Qwen2.5-7B:** Model Size ~7B, Generation Score ~45
* **Qwen2.5-32B:** Model Size ~32B, Generation Score ~55
* **Qwen2.5-72B:** Model Size ~72B, Generation Score ~54
* **Llama-3.1-70B:** Model Size ~70B, Generation Score ~57
The Generation Score trend is generally increasing with model size, with a steeper increase for models larger than 7B parameters.
**Right Plot (Model Size vs RuozhiBench-MC Scores):**
* **Qwen2.5-0.5B:** Model Size ~0.5B, Multiple Choice Score ~50
* **Llama-3.2-1B:** Model Size ~1B, Multiple Choice Score ~48
* **Mistral-7B-v0.1:** Model Size ~7B, Multiple Choice Score ~52
* **Llama-3.2-3B:** Model Size ~3B, Multiple Choice Score ~64
* **Qwen2.5-3B:** Model Size ~3B, Multiple Choice Score ~69
* **Llama-3.1-8B:** Model Size ~8B, Multiple Choice Score ~70
* **Qwen2.5-7B:** Model Size ~7B, Multiple Choice Score ~71
* **Qwen2.5-32B:** Model Size ~32B, Multiple Choice Score ~74
* **Qwen2.5-72B:** Model Size ~72B, Multiple Choice Score ~75
* **Llama-3.1-70B:** Model Size ~70B, Multiple Choice Score ~78
The Multiple Choice Score trend is also generally increasing with model size, with a steeper increase for models larger than 7B parameters.
### Key Observations
* Both Generation and Multiple Choice scores tend to increase with model size.
* The increase in scores appears to be more pronounced for models with more than 7B parameters.
* There are some variations in performance among models of similar sizes.
### Interpretation
The plots suggest a positive correlation between model size and performance on both RuozhiBench-Gen and RuozhiBench-MC benchmarks. This indicates that larger models generally perform better on these tasks. However, the relationship is not strictly linear, as the rate of improvement seems to increase for larger models. The variations in performance among models of similar sizes suggest that other factors, such as model architecture and training data, also play a significant role in determining performance. The data highlights the trend that increasing model size is a viable strategy for improving performance, but it is not the only factor to consider.
</details>
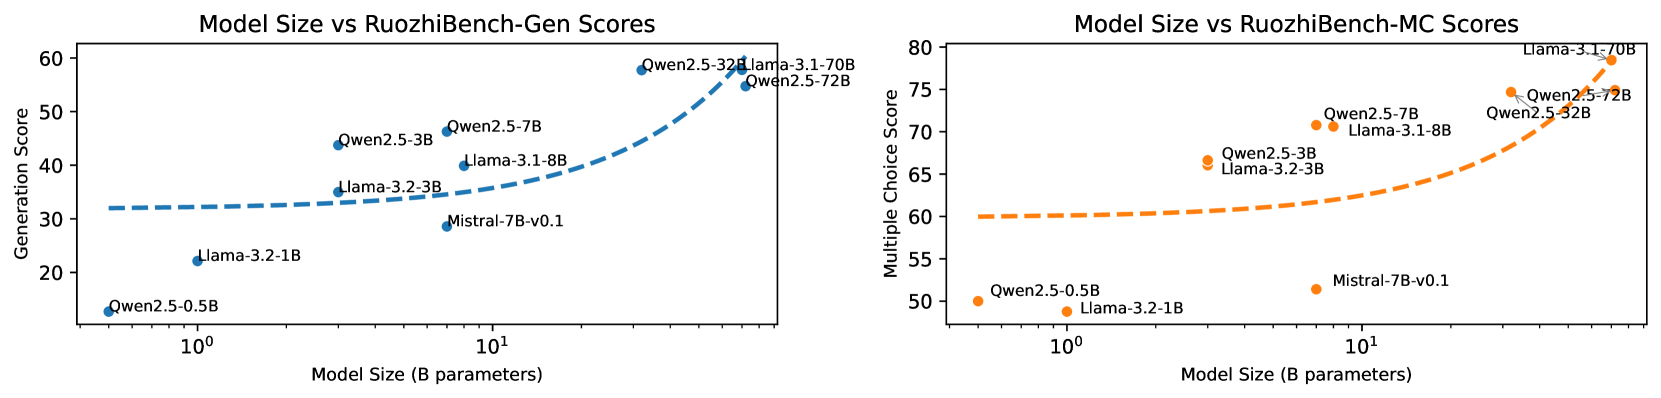
Figure 9: Relationship between model size and performance on generation and multiple-choice tasks. The plots show the correlation between model size (in billions of parameters) and performance scores for both generation (top) and multiple-choice (bottom) tasks. Both plots use a logarithmic scale for model size. The dashed lines represent the regression fit, demonstrating a positive correlation between model size and performance for both task types.
5.2 Analysis
Correlation with RuozhiBench-Gen
Figure 8 shows the correlation between generation and multiple choice scores for all models. We can observe a strong positive correlation between the generation and multiple choice scores for all models, with a Pearson correlation coefficient of 0.909. In general, most models have achieved slightly higher scores in the multiple choice than generation evaluation.
Model Size Analysis
Figure 9 shows the relationship between model size and performance on generation and multiple-choice tasks.
Issues in MC
Despite the advantages discussed above, we found two caveats of RuozhiBench-MC based on the detailed results in Table 4. (1) We found different degrees of performance gaps between when we provide the better response as the first option and the reverse, even for some of the best-performing models like GPT-4o and Claude-3-haiku. Most models perform slightly better when the better answer is provided as the first option. This positional bias suggests these models may be influenced by the ordering of options and indicates some uncertainty in their decision-making process. (2) Not all models can strictly follow the formatting instructions we provided in the prompts of RuozhiBench-MC. Except for Claude-3 models and GPT-4o, all other models produce different numbers of responses with formatting errors. Smaller models in Llama-3.2 family and Qwen2.5-7B suffer more from this issue as their formatting success rates are less than 60%.
6 Related Work
General Reasoning Evaluation of LLMs
Evaluating the reasoning capabilities of LLMs has gained significant attention, with diverse benchmarks developed for different reasoning domains, such as commonsense reasoning Talmor et al. (2019); Zellers et al. (2019); Clark et al. (2018); Bisk et al. (2020), math Cobbe et al. (2021); Hendrycks et al. (2021b), code Chen et al. (2021); Austin et al. (2021), and logic Liu et al. (2020, 2023a, 2023b). Recent advances, with models like GPT-4 surpassing human performance on many of these benchmarks, have driven further exploration into more challenging testbeds. Models such as GPT-o1 OpenAI et al. (2024) and Deepseek-R1 DeepSeek-AI et al. (2025) have demonstrated improved performance on advanced benchmarks like AIME MMA. (2024) and HLE Phan et al. (2025), which assess reasoning across domains such as mathematics, physics, and scientific knowledge. In contrast, RuozhiBench presents seemingly simple questions—ones even a five-year-old could find fallacy—that expose fundamental gaps in LLMs’ commonsense reasoning abilities, highlighting the limitations of current models beyond factual knowledge and formulaic problem-solving.
Understanding Deceptive and Fallacious Texts
While there is a substantial body of work on LLMs’ reasoning capabilities, research specifically focused on evaluating how models handle deliberately deceptive or fallacious inputs remains limited. Recent work has begun exploring the use of Chinese Ruozhiba forum data for improving LLMs’ capabilities; for instance, Lin et al. (2024) and Bai et al. (2024) incorporated Ruozhiba data in their training data to enhance logic reasoning in Chinese.
There are several works exploring LLMs’ understanding of logical fallacies Lei and Huang (2024); Payandeh et al. (2023); Li et al. (2024a). While most relevant work is Li et al. (2024b), which created a benchmark using data from Ruozhiba. However, our work differs in that: (1) we provide the first English benchmark, while theirs is Chinese-only; (2) their evaluation relies on artificially-constructed input formats, whereas our evaluation setting is more natural, directly using questions as prompts; and (3) we include detailed annotations of fallacy types, enabling more systematic analysis of model capabilities. Through these innovations, we aim to enable more rigorous assessment of how LLMs handle the types of deliberately tricky or misleading inputs they may encounter in real-world applications.
7 Conclusion
This paper presents RuozhiBench, a comprehensive benchmark designed to evaluate the logical reasoning capabilities of LLMs through both generative and multiple-choice formats. Our analysis across diverse models reveals that while state-of-the-art models like Claude demonstrate strong performance on logical reasoning tasks, significant challenges remain, particularly in handling edge cases and complex logical structures. The dual format of our benchmark provides complementary insights into models’ reasoning abilities, suggesting several promising directions for future research, including the enhancement of model training and the development of more targeted approaches to improving logical reasoning capabilities.
Limitations
Despite our efforts to create a comprehensive benchmark for logical reasoning, RuozhiBench has several limitations. First, while our multiple-choice format offers standardized evaluation, it may not fully capture the nuanced reasoning processes that models employ in real-world scenarios. Second, our evaluation method relies heavily on model-generated responses for constructing the trapped options, which might not encompass all possible fallacies or reasoning errors that LLMs could make. Additionally, although the dataset is bilingual, our experiments focus primarily on English. Finally, the binary choice format in RuozhiBench -MC, while effective for evaluation, may inadvertently simplify complex reasoning problems that in practice require consideration of multiple valid perspectives or solutions.
References
- Austin et al. (2021) Jacob Austin, Augustus Odena, Maxwell I. Nye, Maarten Bosma, Henryk Michalewski, David Dohan, Ellen Jiang, Carrie J. Cai, Michael Terry, Quoc V. Le, and Charles Sutton. 2021. Program synthesis with large language models. CoRR, abs/2108.07732.
- Bai et al. (2023a) Jinze Bai, Shuai Bai, Yunfei Chu, Zeyu Cui, Kai Dang, Xiaodong Deng, Yang Fan, Wenbin Ge, Yu Han, Fei Huang, Binyuan Hui, Luo Ji, Mei Li, Junyang Lin, Runji Lin, Dayiheng Liu, Gao Liu, Chengqiang Lu, Keming Lu, Jianxin Ma, Rui Men, Xingzhang Ren, Xuancheng Ren, Chuanqi Tan, Sinan Tan, Jianhong Tu, Peng Wang, Shijie Wang, Wei Wang, Shengguang Wu, Benfeng Xu, Jin Xu, An Yang, Hao Yang, Jian Yang, Shusheng Yang, Yang Yao, Bowen Yu, Hongyi Yuan, Zheng Yuan, Jianwei Zhang, Xingxuan Zhang, Yichang Zhang, Zhenru Zhang, Chang Zhou, Jingren Zhou, Xiaohuan Zhou, and Tianhang Zhu. 2023a. Qwen technical report. Preprint, arXiv:2309.16609.
- Bai et al. (2023b) Jinze Bai, Shuai Bai, Yunfei Chu, Zeyu Cui, Kai Dang, Xiaodong Deng, Yang Fan, Wenbin Ge, Yu Han, Fei Huang, et al. 2023b. Qwen technical report. arXiv preprint arXiv:2309.16609.
- Bai et al. (2024) Yuelin Bai, Xinrun Du, Yiming Liang, Yonggang Jin, Ziqiang Liu, Junting Zhou, Tianyu Zheng, Xincheng Zhang, Nuo Ma, Zekun Wang, Ruibin Yuan, Haihong Wu, Hongquan Lin, Wenhao Huang, Jiajun Zhang, Wenhu Chen, Chenghua Lin, Jie Fu, Min Yang, Shiwen Ni, and Ge Zhang. 2024. Coig-cqia: Quality is all you need for chinese instruction fine-tuning. Preprint, arXiv:2403.18058.
- Bisk et al. (2020) Yonatan Bisk, Rowan Zellers, Ronan Le Bras, Jianfeng Gao, and Yejin Choi. 2020. Piqa: Reasoning about physical commonsense in natural language. In Thirty-Fourth AAAI Conference on Artificial Intelligence.
- Carlini et al. (2022) Nicholas Carlini, Daphne Ippolito, Matthew Jagielski, Katherine Lee, Florian Tramer, and Chiyuan Zhang. 2022. Quantifying memorization across neural language models. arXiv preprint arXiv:2202.07646.
- Chen et al. (2021) Mark Chen, Jerry Tworek, Heewoo Jun, Qiming Yuan, Henrique Pondé de Oliveira Pinto, Jared Kaplan, Harrison Edwards, Yuri Burda, Nicholas Joseph, Greg Brockman, Alex Ray, Raul Puri, Gretchen Krueger, Michael Petrov, Heidy Khlaaf, Girish Sastry, Pamela Mishkin, Brooke Chan, Scott Gray, Nick Ryder, Mikhail Pavlov, Alethea Power, Lukasz Kaiser, Mohammad Bavarian, Clemens Winter, Philippe Tillet, Felipe Petroski Such, Dave Cummings, Matthias Plappert, Fotios Chantzis, Elizabeth Barnes, Ariel Herbert-Voss, William Hebgen Guss, Alex Nichol, Alex Paino, Nikolas Tezak, Jie Tang, Igor Babuschkin, Suchir Balaji, Shantanu Jain, William Saunders, Christopher Hesse, Andrew N. Carr, Jan Leike, Joshua Achiam, Vedant Misra, Evan Morikawa, Alec Radford, Matthew Knight, Miles Brundage, Mira Murati, Katie Mayer, Peter Welinder, Bob McGrew, Dario Amodei, Sam McCandlish, Ilya Sutskever, and Wojciech Zaremba. 2021. Evaluating large language models trained on code. CoRR, abs/2107.03374.
- Clark et al. (2018) Peter Clark, Isaac Cowhey, Oren Etzioni, Tushar Khot, Ashish Sabharwal, Carissa Schoenick, and Oyvind Tafjord. 2018. Think you have solved question answering? try arc, the AI2 reasoning challenge. CoRR, abs/1803.05457.
- Claude (2023) Claude. 2023. Our latest model, claude 2.1, is now available over api in our console and is powering our claude.ai chat experience.
- Cobbe et al. (2021) Karl Cobbe, Vineet Kosaraju, Mohammad Bavarian, Jacob Hilton, Reiichiro Nakano, Christopher Hesse, and John Schulman. 2021. Training verifiers to solve math word problems. CoRR, abs/2110.14168.
- DeepSeek-AI et al. (2025) DeepSeek-AI, Daya Guo, Dejian Yang, Haowei Zhang, Junxiao Song, Ruoyu Zhang, Runxin Xu, Qihao Zhu, Shirong Ma, Peiyi Wang, Xiao Bi, Xiaokang Zhang, Xingkai Yu, Yu Wu, Z. F. Wu, Zhibin Gou, Zhihong Shao, Zhuoshu Li, Ziyi Gao, Aixin Liu, Bing Xue, Bingxuan Wang, Bochao Wu, Bei Feng, Chengda Lu, Chenggang Zhao, Chengqi Deng, Chenyu Zhang, Chong Ruan, Damai Dai, Deli Chen, Dongjie Ji, Erhang Li, Fangyun Lin, Fucong Dai, Fuli Luo, Guangbo Hao, Guanting Chen, Guowei Li, H. Zhang, Han Bao, Hanwei Xu, Haocheng Wang, Honghui Ding, Huajian Xin, Huazuo Gao, Hui Qu, Hui Li, Jianzhong Guo, Jiashi Li, Jiawei Wang, Jingchang Chen, Jingyang Yuan, Junjie Qiu, Junlong Li, J. L. Cai, Jiaqi Ni, Jian Liang, Jin Chen, Kai Dong, Kai Hu, Kaige Gao, Kang Guan, Kexin Huang, Kuai Yu, Lean Wang, Lecong Zhang, Liang Zhao, Litong Wang, Liyue Zhang, Lei Xu, Leyi Xia, Mingchuan Zhang, Minghua Zhang, Minghui Tang, Meng Li, Miaojun Wang, Mingming Li, Ning Tian, Panpan Huang, Peng Zhang, Qiancheng Wang, Qinyu Chen, Qiushi Du, Ruiqi Ge, Ruisong Zhang, Ruizhe Pan, Runji Wang, R. J. Chen, R. L. Jin, Ruyi Chen, Shanghao Lu, Shangyan Zhou, Shanhuang Chen, Shengfeng Ye, Shiyu Wang, Shuiping Yu, Shunfeng Zhou, Shuting Pan, S. S. Li, Shuang Zhou, Shaoqing Wu, Shengfeng Ye, Tao Yun, Tian Pei, Tianyu Sun, T. Wang, Wangding Zeng, Wanjia Zhao, Wen Liu, Wenfeng Liang, Wenjun Gao, Wenqin Yu, Wentao Zhang, W. L. Xiao, Wei An, Xiaodong Liu, Xiaohan Wang, Xiaokang Chen, Xiaotao Nie, Xin Cheng, Xin Liu, Xin Xie, Xingchao Liu, Xinyu Yang, Xinyuan Li, Xuecheng Su, Xuheng Lin, X. Q. Li, Xiangyue Jin, Xiaojin Shen, Xiaosha Chen, Xiaowen Sun, Xiaoxiang Wang, Xinnan Song, Xinyi Zhou, Xianzu Wang, Xinxia Shan, Y. K. Li, Y. Q. Wang, Y. X. Wei, Yang Zhang, Yanhong Xu, Yao Li, Yao Zhao, Yaofeng Sun, Yaohui Wang, Yi Yu, Yichao Zhang, Yifan Shi, Yiliang Xiong, Ying He, Yishi Piao, Yisong Wang, Yixuan Tan, Yiyang Ma, Yiyuan Liu, Yongqiang Guo, Yuan Ou, Yuduan Wang, Yue Gong, Yuheng Zou, Yujia He, Yunfan Xiong, Yuxiang Luo, Yuxiang You, Yuxuan Liu, Yuyang Zhou, Y. X. Zhu, Yanhong Xu, Yanping Huang, Yaohui Li, Yi Zheng, Yuchen Zhu, Yunxian Ma, Ying Tang, Yukun Zha, Yuting Yan, Z. Z. Ren, Zehui Ren, Zhangli Sha, Zhe Fu, Zhean Xu, Zhenda Xie, Zhengyan Zhang, Zhewen Hao, Zhicheng Ma, Zhigang Yan, Zhiyu Wu, Zihui Gu, Zijia Zhu, Zijun Liu, Zilin Li, Ziwei Xie, Ziyang Song, Zizheng Pan, Zhen Huang, Zhipeng Xu, Zhongyu Zhang, and Zhen Zhang. 2025. Deepseek-r1: Incentivizing reasoning capability in llms via reinforcement learning. Preprint, arXiv:2501.12948.
- Hendrycks et al. (2021a) Dan Hendrycks, Collin Burns, Steven Basart, Andy Zou, Mantas Mazeika, Dawn Song, and Jacob Steinhardt. 2021a. Measuring massive multitask language understanding. In 9th International Conference on Learning Representations, ICLR 2021, Virtual Event, Austria, May 3-7, 2021. OpenReview.net.
- Hendrycks et al. (2021b) Dan Hendrycks, Collin Burns, Saurav Kadavath, Akul Arora, Steven Basart, Eric Tang, Dawn Song, and Jacob Steinhardt. 2021b. Measuring mathematical problem solving with the MATH dataset. In Proceedings of the Neural Information Processing Systems Track on Datasets and Benchmarks 1, NeurIPS Datasets and Benchmarks 2021, December 2021, virtual.
- Jiang et al. (2024) Albert Q Jiang, Alexandre Sablayrolles, Antoine Roux, Arthur Mensch, Blanche Savary, Chris Bamford, Devendra Singh Chaplot, Diego de las Casas, Emma Bou Hanna, Florian Bressand, et al. 2024. Mixtral of experts. arXiv preprint arXiv:2401.04088.
- Lei and Huang (2024) Yuanyuan Lei and Ruihong Huang. 2024. Boosting logical fallacy reasoning in LLMs via logical structure tree. In Proceedings of the 2024 Conference on Empirical Methods in Natural Language Processing, pages 13157–13173, Miami, Florida, USA. Association for Computational Linguistics.
- Li et al. (2023a) Haonan Li, Yixuan Zhang, Fajri Koto, Yifei Yang, Hai Zhao, Yeyun Gong, Nan Duan, and Timothy Baldwin. 2023a. Cmmlu: Measuring massive multitask language understanding in chinese. CoRR.
- Li et al. (2023b) Xuechen Li, Tianyi Zhang, Yann Dubois, Rohan Taori, Ishaan Gulrajani, Carlos Guestrin, Percy Liang, and Tatsunori B. Hashimoto. 2023b. Alpacaeval: An automatic evaluator of instruction-following models. https://github.com/tatsu-lab/alpaca_eval.
- Li et al. (2024a) Yanda Li, Dixuan Wang, Jiaqing Liang, Guochao Jiang, Qianyu He, Yanghua Xiao, and Deqing Yang. 2024a. Reason from fallacy: Enhancing large language models’ logical reasoning through logical fallacy understanding. Preprint, arXiv:2404.04293.
- Li et al. (2024b) Yinghui Li, Qingyu Zhou, Yuanzhen Luo, Shirong Ma, Yangning Li, Hai-Tao Zheng, Xuming Hu, and Philip S. Yu. 2024b. When LLMs meet cunning texts: A fallacy understanding benchmark for large language models. In The Thirty-eight Conference on Neural Information Processing Systems Datasets and Benchmarks Track.
- Lin et al. (2024) Mingan Lin, Fan Yang, Yanjun Shen, Haoze Sun, Tianpeng Li, Tao Zhang, Chenzheng Zhu, Tao Zhang, Miao Zheng, Xu Li, Yijie Zhou, Mingyang Chen, Yanzhao Qin, Youquan Li, Hao Liang, Fei Li, Yadong Li, Mang Wang, Guosheng Dong, Kun Fang, Jianhua Xu, Bin Cui, Wentao Zhang, Zenan Zhou, and Weipeng Chen. 2024. Baichuan alignment technical report. Preprint, arXiv:2410.14940.
- Liu et al. (2023a) Hanmeng Liu, Jian Liu, Leyang Cui, Zhiyang Teng, Nan Duan, Ming Zhou, and Yue Zhang. 2023a. Logiqa 2.0—an improved dataset for logical reasoning in natural language understanding. IEEE/ACM Transactions on Audio, Speech, and Language Processing, 31:2947–2962.
- Liu et al. (2023b) Hanmeng Liu, Ruoxi Ning, Zhiyang Teng, Jian Liu, Qiji Zhou, and Yue Zhang. 2023b. Evaluating the logical reasoning ability of chatgpt and gpt-4. Preprint, arXiv:2304.03439.
- Liu et al. (2020) Jian Liu, Leyang Cui, Hanmeng Liu, Dandan Huang, Yile Wang, and Yue Zhang. 2020. Logiqa: A challenge dataset for machine reading comprehension with logical reasoning. Preprint, arXiv:2007.08124.
- Meta AI (2024) Meta AI. 2024. Introducing meta llama 3: The most capable openly available llm to date.
- MMA. (2024) MMA. 2024. American invitational mathematics examination - aime.
- OpenAI et al. (2024) OpenAI, :, Aaron Jaech, Adam Kalai, Adam Lerer, Adam Richardson, Ahmed El-Kishky, Aiden Low, Alec Helyar, Aleksander Madry, Alex Beutel, Alex Carney, Alex Iftimie, Alex Karpenko, Alex Tachard Passos, Alexander Neitz, Alexander Prokofiev, Alexander Wei, Allison Tam, Ally Bennett, Ananya Kumar, Andre Saraiva, Andrea Vallone, Andrew Duberstein, Andrew Kondrich, Andrey Mishchenko, Andy Applebaum, Angela Jiang, Ashvin Nair, Barret Zoph, Behrooz Ghorbani, Ben Rossen, Benjamin Sokolowsky, Boaz Barak, Bob McGrew, Borys Minaiev, Botao Hao, et al. 2024. Openai o1 system card. Preprint, arXiv:2412.16720.
- OpenAI (2023) OpenAI. 2023. Gpt-4 technical report. Preprint, arXiv:2303.08774.
- Payandeh et al. (2023) Amirreza Payandeh, Dan Pluth, Jordan Hosier, Xuesu Xiao, and Vijay K. Gurbani. 2023. How susceptible are llms to logical fallacies? Preprint, arXiv:2308.09853.
- Phan et al. (2025) Long Phan, Alice Gatti, Ziwen Han, Nathaniel Li, Josephina Hu, Hugh Zhang, Chen Bo Calvin Zhang, Mohamed Shaaban, John Ling, Sean Shi, Michael Choi, Anish Agrawal, Arnav Chopra, Adam Khoja, Ryan Kim, Richard Ren, Jason Hausenloy, Oliver Zhang, Mantas Mazeika, Tung Nguyen, Daron Anderson, Imad Ali Shah, Mikhail Doroshenko, Alun Cennyth Stokes, Mobeen Mahmood, et al. 2025. Humanity’s last exam. Preprint, arXiv:2501.14249.
- Sainz et al. (2023) Oscar Sainz, Jon Campos, Iker García-Ferrero, Julen Etxaniz, Oier Lopez de Lacalle, and Eneko Agirre. 2023. NLP evaluation in trouble: On the need to measure LLM data contamination for each benchmark. In Findings of the Association for Computational Linguistics: EMNLP 2023, pages 10776–10787, Singapore. Association for Computational Linguistics.
- Scao et al. (2022) Teven Le Scao, Angela Fan, Christopher Akiki, Ellie Pavlick, Suzana Ilic, Daniel Hesslow, Roman Castagné, Alexandra Sasha Luccioni, François Yvon, Matthias Gallé, Jonathan Tow, Alexander M. Rush, Stella Biderman, Albert Webson, Pawan Sasanka Ammanamanchi, Thomas Wang, Benoît Sagot, Niklas Muennighoff, Albert Villanova del Moral, Olatunji Ruwase, Rachel Bawden, Stas Bekman, Angelina McMillan-Major, Iz Beltagy, Huu Nguyen, Lucile Saulnier, Samson Tan, Pedro Ortiz Suarez, Victor Sanh, Hugo Laurençon, Yacine Jernite, Julien Launay, Margaret Mitchell, Colin Raffel, Aaron Gokaslan, Adi Simhi, Aitor Soroa, Alham Fikri Aji, Amit Alfassy, Anna Rogers, Ariel Kreisberg Nitzav, Canwen Xu, Chenghao Mou, Chris Emezue, Christopher Klamm, Colin Leong, Daniel van Strien, David Ifeoluwa Adelani, and et al. 2022. BLOOM: A 176b-parameter open-access multilingual language model. CoRR, abs/2211.05100.
- Talmor et al. (2019) Alon Talmor, Jonathan Herzig, Nicholas Lourie, and Jonathan Berant. 2019. CommonsenseQA: A question answering challenge targeting commonsense knowledge. In Proceedings of the 2019 Conference of the North American Chapter of the Association for Computational Linguistics: Human Language Technologies, Volume 1 (Long and Short Papers), pages 4149–4158, Minneapolis, Minnesota. Association for Computational Linguistics.
- Touvron et al. (2023) Hugo Touvron, Thibaut Lavril, Gautier Izacard, Xavier Martinet, Marie-Anne Lachaux, Timothée Lacroix, Baptiste Rozière, Naman Goyal, Eric Hambro, Faisal Azhar, et al. 2023. Llama: Open and efficient foundation language models. arXiv preprint arXiv:2302.13971.
- Zellers et al. (2019) Rowan Zellers, Ari Holtzman, Yonatan Bisk, Ali Farhadi, and Yejin Choi. 2019. Hellaswag: Can a machine really finish your sentence? In Proceedings of the 57th Conference of the Association for Computational Linguistics, ACL 2019, Florence, Italy, July 28- August 2, 2019, Volume 1: Long Papers, pages 4791–4800. Association for Computational Linguistics.
- Zhang et al. (2022) Susan Zhang, Stephen Roller, Naman Goyal, Mikel Artetxe, Moya Chen, Shuohui Chen, Christopher Dewan, Mona Diab, Xian Li, Xi Victoria Lin, et al. 2022. Opt: Open pre-trained transformer language models. arXiv preprint arXiv:2205.01068.
Appendix A Prompts Used in This Study
Please read the following question and point out the irrationality in the question based on correct knowledge and common sense. The answer should be concise. (Note: Do not answer this question, do not use words like "the irrationality of this question is", your output only needs to include the irrationality of the question, try to use one sentence to complete the answer, and the answer should not exceed 100 words.) Example: Question: If the sun rises at night, what impact will it have on the temperature of the Earth? Irrationality Analysis: The sun does not rise at night because day and night are caused by the rotation of the Earth, and the phenomenon of the sun rising and falling is the result of the Earth’s rotation. Assuming that the sun rises at night is contrary to basic astronomical knowledge. Inputs: Question: {question}
Figure 10: Irrationality analysis generation prompt.
Based on the following tricky question and the irrationality analysis of this question, analyze and label them with three closest question categories. You will see all question categories in the question classification criteria, and you need to output the number sequence of question categories according to priority. Question Classification Criteria: 1. Logical error: When the question is raised, there may be logical contradictions or reasoning errors, which may include violations of logical rules, such as informal or formal logical errors, making the question logically untenable. 2. Common sense misunderstandings: The question reflects a misunderstanding of some basic common sense or universally accepted facts, usually involving incorrect understanding of common knowledge or information in daily life. 3. Erroneous assumption: The question is based on one or more erroneous assumptions. This means that the foundation or starting point of the question is incorrect, leading to inaccuracies in the entire question or its answer. 4. Scientific misconceptions: The content of the question involves misunderstandings of scientific principles or knowledge, including incorrect interpretations or applications of scientific theories, experimental results, or scientific methods. 5. Absurd imagination: The situation or setting in the question is clearly contrary to reality or common sense, has absurdity, and usually contains impossible or illogical elements, making the entire question appear unrealistic. 6. Others: If you believe that the provided question categories do not match the current question, please choose this option. Definitions: - Tricky Question: A question that is illogical or lacks a clear answer, often based on unrealistic assumptions or contradictions to common sense. - Irrationality Analysis: A detailed explanation highlighting the logical flaws or unrealistic assumptions present in the tricky question. Output format: The output format must be *Number Space Number Space Number*, and the output string length must be 5. Example: 2 6 3 Inputs: Question: {question} Irrationality Analysis: {irrationality}
Figure 11: Question type classification prompt.
You are an evaluation system designed to assess responses to *deceptive* or *logically flawed* questions. ## Task Definition: For each input, you will be provided with: - A **deceptive question** that contains misleading premises, logical fallacies, or contradictions. - An **irrationality analysis**, explaining why the question is deceptive and identifying its logical flaws. - An **answer** provided by a model or a human. Your task is to **evaluate the answer’s ability to correctly identify and address the deception** rather than simply providing a direct response. ## Rating Criteria (0-4 Scale): - **0**: The answer completely fails to recognize the deception and directly attempts to answer the question as if it were valid. - **1**: The answer acknowledges a flaw but does not engage with it meaningfully. - **2**: The answer recognizes and partially explains the deception but has logical gaps. - **3**: The answer correctly identifies and mostly explains the fallacy but lacks depth or clarity. - **4**: The answer fully explains the deceptive nature, providing a comprehensive and logically sound explanation. <question> \n {question} \n </question> <irrationality_analysis> \n {irrationality_analysis} \n </irrationality_analysis> <answer> \n {answer} \n </answer> ## Output Format: You must return a JSON object with keys: "rating" (int) and "explanation" (str), for example: {{\n "rating": [2], "explanation": "[Your justification for the rating]" \n}} Ensure that your response is **valid JSON** with the exact keys shown above without any additional text or formatting.
Figure 12: RuozhiBench-Gen evaluation prompt.
You are an expert evaluator tasked with assessing the quality of an answer to a given question. ## Question: \n {question} ## Answer: \n {answer} ## Evaluation Criteria: Rate the answer based on the following criteria: - 4: Excellent – The answer is complete, accurate, and well-explained. - 3: Good – The answer is mostly correct with minor inaccuracies or missing details. - 2: Fair – The answer has some correct elements but contains notable errors or omissions. - 1: Poor – The answer is mostly incorrect or incomplete. - 0: Very Poor – The answer is irrelevant or completely incorrect. ## Output Format: You must return a JSON object with keys: "rating" (int) and "explanation" (str), for example: {\n "rating": [0, 1, 2, 3, or 4], "explanation": "[Your justification for the rating]" \n} Ensure that your response is **valid JSON** with the exact keys shown above without any additional text or formatting.
Figure 13: RuozhiBench-MC evaluation prompt.
Appendix B Option Distribution of RuozhiBench-MC
Figure 15 shows the option data source statistics of RuozhiBench-MC, and Figure 15 shows the gap distribution between “Good” and “Bad” options.
<details>
<summary>x10.png Details</summary>
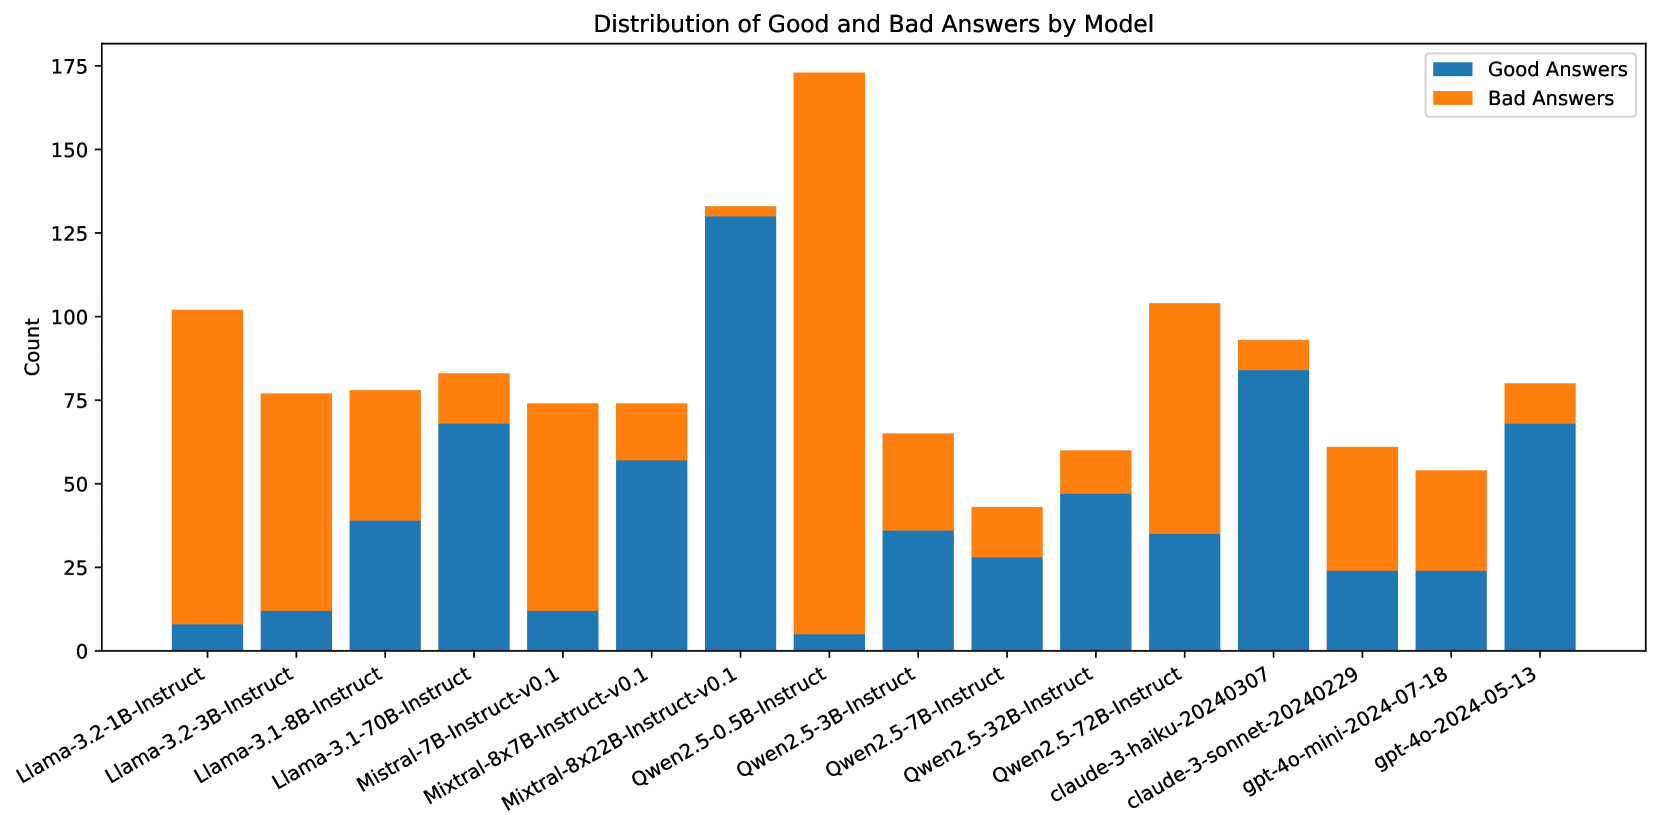
### Visual Description
## Bar Chart: Distribution of Good and Bad Answers by Model
### Overview
The image is a stacked bar chart comparing the number of "Good Answers" and "Bad Answers" generated by different language models. The x-axis represents the model names, and the y-axis represents the count of answers. Each bar is divided into two sections: a blue section representing "Good Answers" and an orange section representing "Bad Answers."
### Components/Axes
* **Title:** Distribution of Good and Bad Answers by Model
* **X-axis:** Model Names (listed below)
* **Y-axis:** Count, with scale markers at 0, 25, 50, 75, 100, 125, 150, and 175.
* **Legend:** Located in the top-right corner, indicating:
* Blue: Good Answers
* Orange: Bad Answers
### Detailed Analysis
Here's a breakdown of the data for each model, including the approximate counts of "Good Answers" and "Bad Answers":
1. **Llama-3.2-1B-Instruct:**
* Good Answers: Approximately 8
* Bad Answers: Approximately 95
2. **Llama-3.2-3B-Instruct:**
* Good Answers: Approximately 12
* Bad Answers: Approximately 65
3. **Llama-3.1-8B-Instruct:**
* Good Answers: Approximately 40
* Bad Answers: Approximately 38
4. **Llama-3.1-70B-Instruct:**
* Good Answers: Approximately 70
* Bad Answers: Approximately 15
5. **Mistral-7B-Instruct-v0.1:**
* Good Answers: Approximately 12
* Bad Answers: Approximately 62
6. **Mixtral-8x7B-Instruct-v0.1:**
* Good Answers: Approximately 60
* Bad Answers: Approximately 15
7. **Mixtral-8x22B-Instruct-v0.1:**
* Good Answers: Approximately 130
* Bad Answers: Approximately 45
8. **Qwen2.5-0.5B-Instruct:**
* Good Answers: Approximately 5
* Bad Answers: Approximately 170
9. **Qwen2.5-3B-Instruct:**
* Good Answers: Approximately 35
* Bad Answers: Approximately 30
10. **Qwen2.5-7B-Instruct:**
* Good Answers: Approximately 30
* Bad Answers: Approximately 15
11. **Qwen2.5-32B-Instruct:**
* Good Answers: Approximately 45
* Bad Answers: Approximately 15
12. **Qwen2.5-72B-Instruct:**
* Good Answers: Approximately 35
* Bad Answers: Approximately 70
13. **claude-3-haiku-20240307:**
* Good Answers: Approximately 85
* Bad Answers: Approximately 10
14. **claude-3-sonnet-20240229:**
* Good Answers: Approximately 25
* Bad Answers: Approximately 35
15. **gpt-4o-mini-2024-07-18:**
* Good Answers: Approximately 25
* Bad Answers: Approximately 30
16. **gpt-4o-2024-05-13:**
* Good Answers: Approximately 70
* Bad Answers: Approximately 10
### Key Observations
* **Qwen2.5-0.5B-Instruct** has the highest number of "Bad Answers" and the lowest number of "Good Answers."
* **Mixtral-8x22B-Instruct-v0.1** has the highest number of "Good Answers."
* Some models, like **Llama-3.2-1B-Instruct** and **Qwen2.5-0.5B-Instruct**, have a significantly higher number of "Bad Answers" compared to "Good Answers."
* Other models, like **Llama-3.1-70B-Instruct** and **claude-3-haiku-20240307**, have a higher number of "Good Answers" compared to "Bad Answers."
### Interpretation
The chart provides a comparative analysis of the performance of different language models in terms of generating "Good" versus "Bad" answers. The data suggests that the models vary significantly in their ability to produce desirable outputs.
* Models like **Qwen2.5-0.5B-Instruct** may require further refinement or optimization to improve their performance, as they exhibit a strong tendency to generate "Bad Answers."
* Conversely, models like **Mixtral-8x22B-Instruct-v0.1** and **claude-3-haiku-20240307** appear to be more reliable in generating "Good Answers."
* The differences in performance could be attributed to various factors, including model architecture, training data, and hyperparameter tuning.
* The chart highlights the importance of evaluating and comparing different models to identify those that are best suited for specific tasks or applications.
* The "gpt-4o" models show a relatively balanced performance, with a decent number of "Good Answers" and a manageable number of "Bad Answers."
* The older "Llama-3.2-1B-Instruct" model seems to perform the worst, indicating potential improvements in newer model versions.
</details>
Figure 14: Distribution of Good and Bad Answers by Model. The figure shows the total number of responses across various models, divided into good and bad answers. Most models exhibit a relatively balanced distribution, while models like Claude 3 Sonnet, Mixtral 8x22B, and GPT-4o produce a higher proportion of good answers. In contrast, models like Qwen 2.5 0.5B have a substantial number of responses but with a higher proportion of bad answers.
<details>
<summary>x11.png Details</summary>
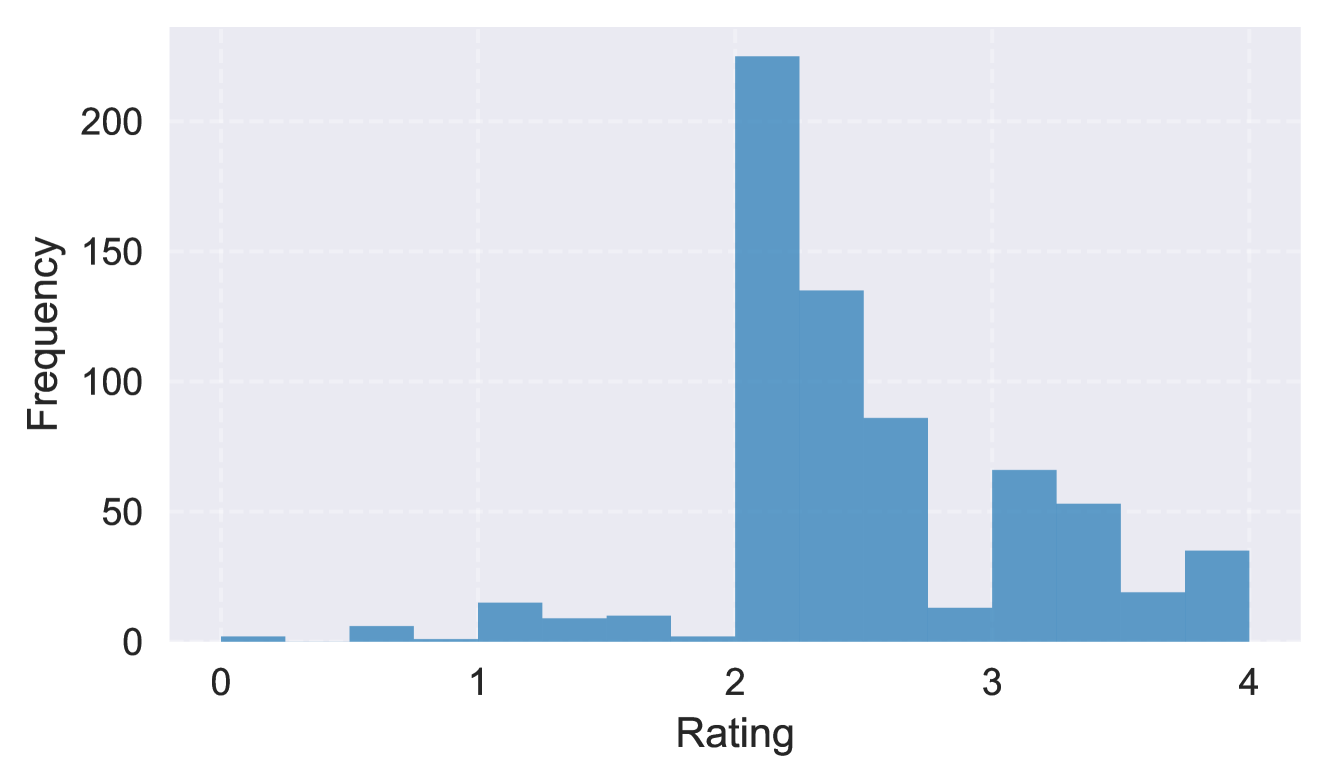
### Visual Description
## Histogram: Rating Frequency
### Overview
The image is a histogram displaying the frequency of ratings. The x-axis represents the rating values, ranging from 0 to 4, and the y-axis represents the frequency of each rating. The histogram shows the distribution of ratings, with a clear peak around the rating of 2.
### Components/Axes
* **X-axis:** Rating (values from 0 to 4, incrementing by 1)
* **Y-axis:** Frequency (values from 0 to 200+, incrementing by 50)
* **Bars:** Represent the frequency of each rating value. The bars are all the same shade of blue.
### Detailed Analysis
Here's a breakdown of the approximate frequency for each rating value:
* **Rating 0:** Frequency is approximately 2.
* **Rating 1:** Frequency is approximately 15.
* **Rating 1.5:** Frequency is approximately 10.
* **Rating 2:** Frequency is approximately 220.
* **Rating 2.5:** Frequency is approximately 140.
* **Rating 3:** Frequency is approximately 65.
* **Rating 3.5:** Frequency is approximately 50.
* **Rating 4:** Frequency is approximately 35.
### Key Observations
* The most frequent rating is 2, with a frequency of approximately 220.
* The frequency decreases as the rating moves away from 2 in either direction.
* The distribution is skewed to the right, indicating that lower ratings are less common than higher ratings.
### Interpretation
The histogram suggests that the majority of ratings are centered around the value of 2. This could indicate a general tendency towards moderate ratings, or it could reflect a specific characteristic of the data being analyzed. The skewness to the right suggests that there are fewer instances of very low ratings compared to higher ratings. This could be due to various factors, such as a selection bias in the data or an inherent tendency for people to rate things positively.
</details>
Figure 15: “Good” and “Bad” answer scores distribution. The majority of the data falls into categories with score differences greater than 2, indicating a clear gap between the options.
Appendix C Recruitment and Payment
We hired 2 annotators with bachelor’s degrees or higher from China with an hourly rate of 50 Chinese Yuan. The annotators are native Chinese speakers and have studied English for more than 10 years. This rate is higher than the average hourly wage in China.
Appendix D Full Evaluation Results on RuozhiBench-Gen
<details>
<summary>x12.png Details</summary>
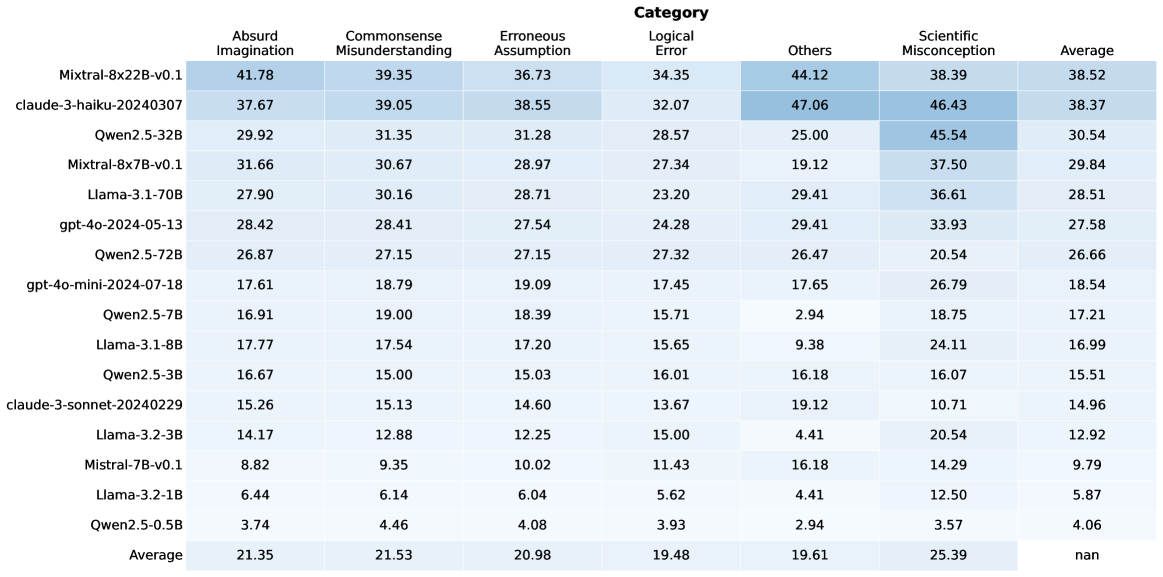
### Visual Description
## Heatmap: Model Performance Across Categories
### Overview
The image is a heatmap displaying the performance of various language models across different categories of errors or misconceptions. The rows represent the models, and the columns represent the categories. The cells contain numerical values, presumably representing error rates or some other performance metric, with a color gradient indicating the magnitude of the value.
### Components/Axes
* **Rows (Models):**
* Mixtral-8x22B-v0.1
* claude-3-haiku-20240307
* Qwen2.5-32B
* Mixtral-8x7B-v0.1
* Llama-3.1-70B
* gpt-4o-2024-05-13
* Qwen2.5-72B
* gpt-4o-mini-2024-07-18
* Qwen2.5-7B
* Llama-3.1-8B
* Qwen2.5-3B
* claude-3-sonnet-20240229
* Llama-3.2-3B
* Mistral-7B-v0.1
* Llama-3.2-1B
* Qwen2.5-0.5B
* Average
* **Columns (Categories):**
* Absurd Imagination
* Commonsense Misunderstanding
* Erroneous Assumption
* Logical Error
* Others
* Scientific Misconception
* Average
### Detailed Analysis or ### Content Details
Here's a breakdown of the data for each model and category:
* **Mixtral-8x22B-v0.1:**
* Absurd Imagination: 41.78
* Commonsense Misunderstanding: 39.35
* Erroneous Assumption: 36.73
* Logical Error: 34.35
* Others: 44.12
* Scientific Misconception: 38.39
* Average: 38.52
* **claude-3-haiku-20240307:**
* Absurd Imagination: 37.67
* Commonsense Misunderstanding: 39.05
* Erroneous Assumption: 38.55
* Logical Error: 32.07
* Others: 47.06
* Scientific Misconception: 46.43
* Average: 38.37
* **Qwen2.5-32B:**
* Absurd Imagination: 29.92
* Commonsense Misunderstanding: 31.35
* Erroneous Assumption: 31.28
* Logical Error: 28.57
* Others: 25.00
* Scientific Misconception: 45.54
* Average: 30.54
* **Mixtral-8x7B-v0.1:**
* Absurd Imagination: 31.66
* Commonsense Misunderstanding: 30.67
* Erroneous Assumption: 28.97
* Logical Error: 27.34
* Others: 19.12
* Scientific Misconception: 37.50
* Average: 29.84
* **Llama-3.1-70B:**
* Absurd Imagination: 27.90
* Commonsense Misunderstanding: 30.16
* Erroneous Assumption: 28.71
* Logical Error: 23.20
* Others: 29.41
* Scientific Misconception: 36.61
* Average: 28.51
* **gpt-4o-2024-05-13:**
* Absurd Imagination: 28.42
* Commonsense Misunderstanding: 28.41
* Erroneous Assumption: 27.54
* Logical Error: 24.28
* Others: 29.41
* Scientific Misconception: 33.93
* Average: 27.58
* **Qwen2.5-72B:**
* Absurd Imagination: 26.87
* Commonsense Misunderstanding: 27.15
* Erroneous Assumption: 27.15
* Logical Error: 27.32
* Others: 26.47
* Scientific Misconception: 20.54
* Average: 26.66
* **gpt-4o-mini-2024-07-18:**
* Absurd Imagination: 17.61
* Commonsense Misunderstanding: 18.79
* Erroneous Assumption: 19.09
* Logical Error: 17.45
* Others: 17.65
* Scientific Misconception: 26.79
* Average: 18.54
* **Qwen2.5-7B:**
* Absurd Imagination: 16.91
* Commonsense Misunderstanding: 19.00
* Erroneous Assumption: 18.39
* Logical Error: 15.71
* Others: 2.94
* Scientific Misconception: 18.75
* Average: 17.21
* **Llama-3.1-8B:**
* Absurd Imagination: 17.77
* Commonsense Misunderstanding: 17.54
* Erroneous Assumption: 17.20
* Logical Error: 15.65
* Others: 9.38
* Scientific Misconception: 24.11
* Average: 16.99
* **Qwen2.5-3B:**
* Absurd Imagination: 16.67
* Commonsense Misunderstanding: 15.00
* Erroneous Assumption: 15.03
* Logical Error: 16.01
* Others: 16.18
* Scientific Misconception: 16.07
* Average: 15.51
* **claude-3-sonnet-20240229:**
* Absurd Imagination: 15.26
* Commonsense Misunderstanding: 15.13
* Erroneous Assumption: 14.60
* Logical Error: 13.67
* Others: 19.12
* Scientific Misconception: 10.71
* Average: 14.96
* **Llama-3.2-3B:**
* Absurd Imagination: 14.17
* Commonsense Misunderstanding: 12.88
* Erroneous Assumption: 12.25
* Logical Error: 15.00
* Others: 4.41
* Scientific Misconception: 20.54
* Average: 12.92
* **Mistral-7B-v0.1:**
* Absurd Imagination: 8.82
* Commonsense Misunderstanding: 9.35
* Erroneous Assumption: 10.02
* Logical Error: 11.43
* Others: 16.18
* Scientific Misconception: 14.29
* Average: 9.79
* **Llama-3.2-1B:**
* Absurd Imagination: 6.44
* Commonsense Misunderstanding: 6.14
* Erroneous Assumption: 6.04
* Logical Error: 5.62
* Others: 4.41
* Scientific Misconception: 12.50
* Average: 5.87
* **Qwen2.5-0.5B:**
* Absurd Imagination: 3.74
* Commonsense Misunderstanding: 4.46
* Erroneous Assumption: 4.08
* Logical Error: 3.93
* Others: 2.94
* Scientific Misconception: 3.57
* Average: 4.06
* **Average:**
* Absurd Imagination: 21.35
* Commonsense Misunderstanding: 21.53
* Erroneous Assumption: 20.98
* Logical Error: 19.48
* Others: 19.61
* Scientific Misconception: 25.39
* Average: nan
### Key Observations
* The "Average" row shows the average performance across all models for each category.
* The "Average" column shows the average performance of each model across all categories.
* The "Average" in the bottom right is "nan", which suggests that the average of the averages is not a meaningful metric in this context.
* The models at the top (Mixtral, Claude) generally have higher error rates across most categories compared to the models at the bottom (Llama, Qwen).
* "Scientific Misconception" tends to have higher values compared to other categories, especially for the top-performing models.
* The "Others" category has a wide range of values, suggesting it encompasses diverse error types.
### Interpretation
The heatmap provides a comparative analysis of language model performance across different error categories. The data suggests that:
* **Model Size/Complexity Matters:** Larger and more complex models (e.g., Mixtral, Claude) tend to exhibit higher error rates in certain categories, possibly due to overfitting or a broader range of potential outputs.
* **Scientific Reasoning is Challenging:** The relatively high error rates in the "Scientific Misconception" category indicate that language models struggle with scientific accuracy and reasoning.
* **Error Distribution Varies:** Different models exhibit different error profiles, with some being more prone to "Absurd Imagination" while others struggle more with "Commonsense Misunderstanding."
* **Smaller Models Can Be More Reliable:** The smaller models (e.g., Qwen2.5-0.5B, Llama-3.2-1B) generally have lower error rates, suggesting they might be more reliable for tasks requiring factual accuracy and logical consistency.
The heatmap is a valuable tool for understanding the strengths and weaknesses of different language models and for identifying areas where further improvement is needed. It also highlights the importance of evaluating models across a diverse range of tasks and error categories to gain a comprehensive understanding of their capabilities.
</details>
Figure 16: Overall score on RuozhiBench-Gen using Claude-3-5-sonnet as an evaluator.
<details>
<summary>x13.png Details</summary>
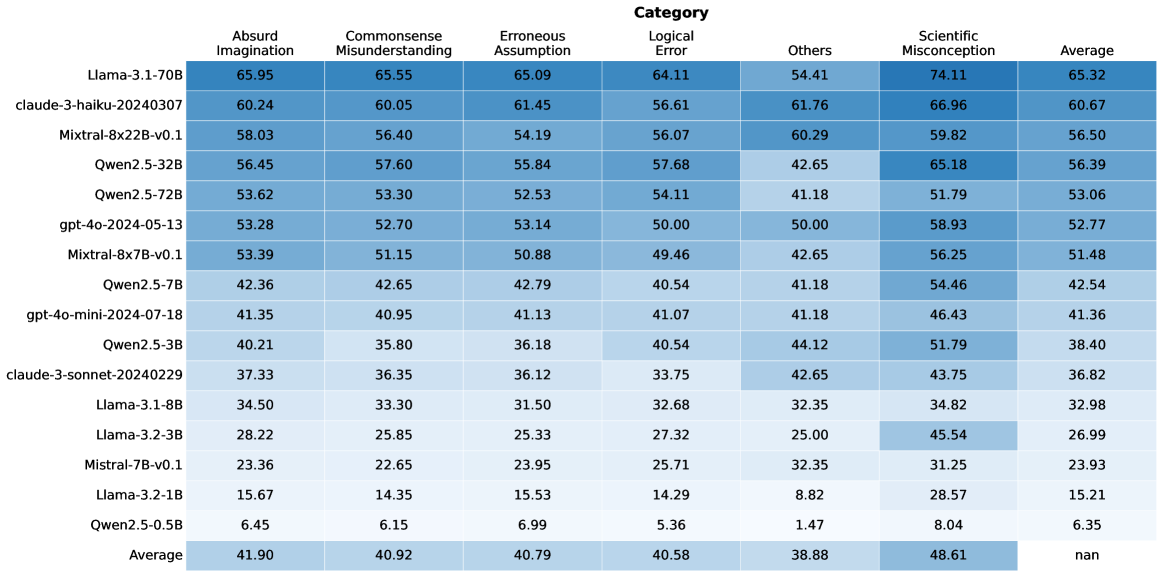
### Visual Description
## Heatmap: Model Performance Across Error Categories
### Overview
The image is a heatmap displaying the performance of various language models across different categories of errors. The rows represent the models, and the columns represent the error categories and the average performance. The cells are color-coded, with darker shades of blue indicating higher values.
### Components/Axes
* **Rows (Models):**
* Llama-3.1-70B
* claude-3-haiku-20240307
* Mixtral-8x22B-v0.1
* Qwen2.5-32B
* Qwen2.5-72B
* gpt-4o-2024-05-13
* Mixtral-8x7B-v0.1
* Qwen2.5-7B
* gpt-4o-mini-2024-07-18
* Qwen2.5-3B
* claude-3-sonnet-20240229
* Llama-3.1-8B
* Llama-3.2-3B
* Mistral-7B-v0.1
* Llama-3.2-1B
* Qwen2.5-0.5B
* Average
* **Columns (Error Categories):**
* Absurd Imagination
* Commonsense Misunderstanding
* Erroneous Assumption
* Logical Error
* Others
* Scientific Misconception
* Average
### Detailed Analysis or ### Content Details
Here's a breakdown of the data, row by row:
* **Llama-3.1-70B:** 65.95 (Absurd Imagination), 65.55 (Commonsense Misunderstanding), 65.09 (Erroneous Assumption), 64.11 (Logical Error), 54.41 (Others), 74.11 (Scientific Misconception), 65.32 (Average)
* **claude-3-haiku-20240307:** 60.24, 60.05, 61.45, 56.61, 61.76, 66.96, 60.67
* **Mixtral-8x22B-v0.1:** 58.03, 56.40, 54.19, 56.07, 60.29, 59.82, 56.50
* **Qwen2.5-32B:** 56.45, 57.60, 55.84, 57.68, 42.65, 65.18, 56.39
* **Qwen2.5-72B:** 53.62, 53.30, 52.53, 54.11, 41.18, 51.79, 53.06
* **gpt-4o-2024-05-13:** 53.28, 52.70, 53.14, 50.00, 50.00, 58.93, 52.77
* **Mixtral-8x7B-v0.1:** 53.39, 51.15, 50.88, 49.46, 42.65, 56.25, 51.48
* **Qwen2.5-7B:** 42.36, 42.65, 42.79, 40.54, 41.18, 54.46, 42.54
* **gpt-4o-mini-2024-07-18:** 41.35, 40.95, 41.13, 41.07, 41.18, 46.43, 41.36
* **Qwen2.5-3B:** 40.21, 35.80, 36.18, 40.54, 44.12, 51.79, 38.40
* **claude-3-sonnet-20240229:** 37.33, 36.35, 36.12, 33.75, 42.65, 43.75, 36.82
* **Llama-3.1-8B:** 34.50, 33.30, 31.50, 32.68, 32.35, 34.82, 32.98
* **Llama-3.2-3B:** 28.22, 25.85, 25.33, 27.32, 25.00, 45.54, 26.99
* **Mistral-7B-v0.1:** 23.36, 22.65, 23.95, 25.71, 32.35, 31.25, 23.93
* **Llama-3.2-1B:** 15.67, 14.35, 15.53, 14.29, 8.82, 28.57, 15.21
* **Qwen2.5-0.5B:** 6.45, 6.15, 6.99, 5.36, 1.47, 8.04, 6.35
* **Average:** 41.90, 40.92, 40.79, 40.58, 38.88, 48.61, nan
### Key Observations
* **Top Performers:** Llama-3.1-70B and claude-3-haiku-20240307 generally show higher values across most error categories.
* **Scientific Misconception:** Models tend to have higher values in the "Scientific Misconception" category compared to others.
* **Qwen2.5-0.5B:** This model consistently has the lowest values across all error categories.
* **Average Row:** The average performance across models is highest for "Scientific Misconception" (48.61) and lowest for "Others" (38.88). The overall average is marked as "nan".
### Interpretation
The heatmap provides a comparative analysis of language model performance based on error types. The darker shades indicate areas where models struggle more. The "Scientific Misconception" category appears to be a common challenge for these models. The Llama-3.1-70B and claude-3-haiku-20240307 models seem to perform better overall, while Qwen2.5-0.5B lags behind. The average row highlights the general trends in error categories across all models. The "nan" value for the average of averages suggests that this metric might not be meaningful or was not calculated correctly.
</details>
Figure 17: Overall score on RuozhiBench-Gen using GPT-4o-2024-08-06 as an evaluator.
<details>
<summary>x14.png Details</summary>
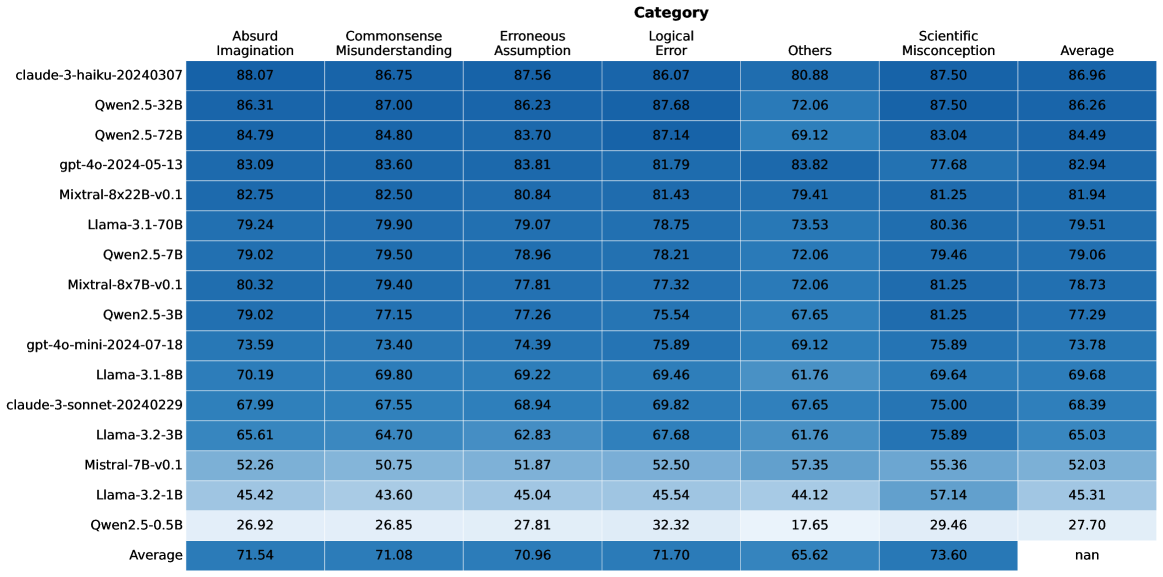
### Visual Description
## Heatmap: Model Performance Across Error Categories
### Overview
The image is a heatmap displaying the performance of various language models across different error categories. The rows represent the models, and the columns represent the error categories and the average performance. The cells are color-coded, presumably based on the performance score, though the color scale is not explicitly provided.
### Components/Axes
* **Rows (Models):**
* claude-3-haiku-20240307
* Qwen2.5-32B
* Qwen2.5-72B
* gpt-4o-2024-05-13
* Mixtral-8x22B-v0.1
* Llama-3.1-70B
* Qwen2.5-7B
* Mixtral-8x7B-v0.1
* Qwen2.5-3B
* gpt-4o-mini-2024-07-18
* Llama-3.1-8B
* claude-3-sonnet-20240229
* Llama-3.2-3B
* Mistral-7B-v0.1
* Llama-3.2-1B
* Qwen2.5-0.5B
* Average
* **Columns (Categories):**
* Absurd Imagination
* Commonsense Misunderstanding
* Erroneous Assumption
* Logical Error
* Others
* Scientific Misconception
* Average
### Detailed Analysis or ### Content Details
Here's a breakdown of the data for each model and category:
* **claude-3-haiku-20240307:**
* Absurd Imagination: 88.07
* Commonsense Misunderstanding: 86.75
* Erroneous Assumption: 87.56
* Logical Error: 86.07
* Others: 80.88
* Scientific Misconception: 87.50
* Average: 86.96
* **Qwen2.5-32B:**
* Absurd Imagination: 86.31
* Commonsense Misunderstanding: 87.00
* Erroneous Assumption: 86.23
* Logical Error: 87.68
* Others: 72.06
* Scientific Misconception: 87.50
* Average: 86.26
* **Qwen2.5-72B:**
* Absurd Imagination: 84.79
* Commonsense Misunderstanding: 84.80
* Erroneous Assumption: 83.70
* Logical Error: 87.14
* Others: 69.12
* Scientific Misconception: 83.04
* Average: 84.49
* **gpt-4o-2024-05-13:**
* Absurd Imagination: 83.09
* Commonsense Misunderstanding: 83.60
* Erroneous Assumption: 83.81
* Logical Error: 81.79
* Others: 83.82
* Scientific Misconception: 77.68
* Average: 82.94
* **Mixtral-8x22B-v0.1:**
* Absurd Imagination: 82.75
* Commonsense Misunderstanding: 82.50
* Erroneous Assumption: 80.84
* Logical Error: 81.43
* Others: 79.41
* Scientific Misconception: 81.25
* Average: 81.94
* **Llama-3.1-70B:**
* Absurd Imagination: 79.24
* Commonsense Misunderstanding: 79.90
* Erroneous Assumption: 79.07
* Logical Error: 78.75
* Others: 73.53
* Scientific Misconception: 80.36
* Average: 79.51
* **Qwen2.5-7B:**
* Absurd Imagination: 79.02
* Commonsense Misunderstanding: 79.50
* Erroneous Assumption: 78.96
* Logical Error: 78.21
* Others: 72.06
* Scientific Misconception: 79.46
* Average: 79.06
* **Mixtral-8x7B-v0.1:**
* Absurd Imagination: 80.32
* Commonsense Misunderstanding: 79.40
* Erroneous Assumption: 77.81
* Logical Error: 77.32
* Others: 72.06
* Scientific Misconception: 81.25
* Average: 78.73
* **Qwen2.5-3B:**
* Absurd Imagination: 79.02
* Commonsense Misunderstanding: 77.15
* Erroneous Assumption: 77.26
* Logical Error: 75.54
* Others: 67.65
* Scientific Misconception: 81.25
* Average: 77.29
* **gpt-4o-mini-2024-07-18:**
* Absurd Imagination: 73.59
* Commonsense Misunderstanding: 73.40
* Erroneous Assumption: 74.39
* Logical Error: 75.89
* Others: 69.12
* Scientific Misconception: 75.89
* Average: 73.78
* **Llama-3.1-8B:**
* Absurd Imagination: 70.19
* Commonsense Misunderstanding: 69.80
* Erroneous Assumption: 69.22
* Logical Error: 69.46
* Others: 61.76
* Scientific Misconception: 69.64
* Average: 69.68
* **claude-3-sonnet-20240229:**
* Absurd Imagination: 67.99
* Commonsense Misunderstanding: 67.55
* Erroneous Assumption: 68.94
* Logical Error: 69.82
* Others: 67.65
* Scientific Misconception: 75.00
* Average: 68.39
* **Llama-3.2-3B:**
* Absurd Imagination: 65.61
* Commonsense Misunderstanding: 64.70
* Erroneous Assumption: 62.83
* Logical Error: 67.68
* Others: 61.76
* Scientific Misconception: 75.89
* Average: 65.03
* **Mistral-7B-v0.1:**
* Absurd Imagination: 52.26
* Commonsense Misunderstanding: 50.75
* Erroneous Assumption: 51.87
* Logical Error: 52.50
* Others: 57.35
* Scientific Misconception: 55.36
* Average: 52.03
* **Llama-3.2-1B:**
* Absurd Imagination: 45.42
* Commonsense Misunderstanding: 43.60
* Erroneous Assumption: 45.04
* Logical Error: 45.54
* Others: 44.12
* Scientific Misconception: 57.14
* Average: 45.31
* **Qwen2.5-0.5B:**
* Absurd Imagination: 26.92
* Commonsense Misunderstanding: 26.85
* Erroneous Assumption: 27.81
* Logical Error: 32.32
* Others: 17.65
* Scientific Misconception: 29.46
* Average: 27.70
* **Average:**
* Absurd Imagination: 71.54
* Commonsense Misunderstanding: 71.08
* Erroneous Assumption: 70.96
* Logical Error: 71.70
* Others: 65.62
* Scientific Misconception: 73.60
* Average: nan
### Key Observations
* The "Average" row shows the average performance across all models for each error category.
* The "Average" column shows the average performance of each model across all error categories.
* The value in the bottom right cell is "nan", indicating that the average of the averages is not calculated or is not a meaningful metric.
* The models generally perform better in "Absurd Imagination", "Commonsense Misunderstanding", "Erroneous Assumption", "Logical Error", and "Scientific Misconception" categories compared to the "Others" category.
* There is a significant performance difference between the top-performing models (e.g., claude-3-haiku-20240307, Qwen2.5-32B) and the bottom-performing models (e.g., Llama-3.2-1B, Qwen2.5-0.5B).
### Interpretation
The heatmap provides a comparative analysis of different language models based on their ability to avoid specific types of errors. The error categories likely represent different aspects of reasoning, knowledge, or common sense. The data suggests that some models are more robust to certain types of errors than others. For example, the higher scores in "Scientific Misconception" might indicate a better grasp of scientific concepts. The lower scores in "Others" suggest that this category might encompass more diverse or less well-defined errors. The "Average" row provides a benchmark for each error category, while the "Average" column gives an overall performance score for each model. The "nan" value in the bottom right suggests that a simple average of averages is not a useful metric in this context, possibly because the error categories are not equally weighted or because the models have different strengths and weaknesses.
</details>
Figure 18: Overall score on RuozhiBench-Gen using Llama-3.3-70B-Instruction as an evaluator.
Appendix E Rating Distribution of Evaluators on RuozhiBench-Gen
<details>
<summary>x15.png Details</summary>
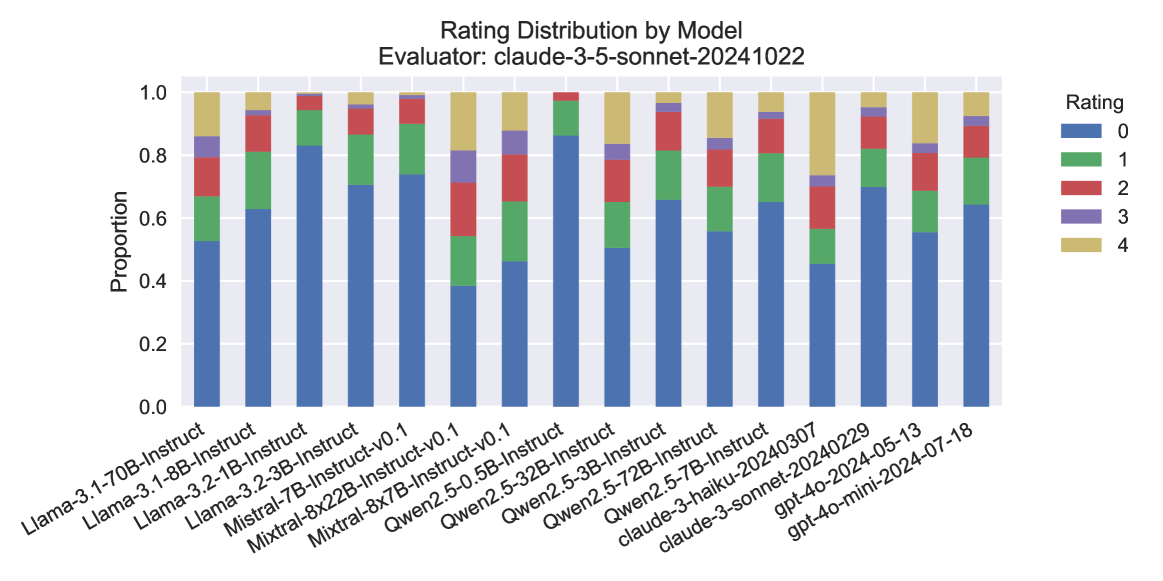
### Visual Description
## Stacked Bar Chart: Rating Distribution by Model
### Overview
The image is a stacked bar chart illustrating the distribution of ratings for various language models. The x-axis represents different models, and the y-axis represents the proportion of each rating (0-4). The chart also specifies the evaluator used: "claude-3-5-sonnet-20241022".
### Components/Axes
* **Title:** Rating Distribution by Model
* **Subtitle:** Evaluator: claude-3-5-sonnet-20241022
* **X-axis:** Language Models (categorical):
* Llama-3.1-70B-Instruct
* Llama-3.1-8B-Instruct
* Llama-3.2-1B-Instruct
* Llama-3.2-3B-Instruct
* Mistral-7B-Instruct-v0.1
* Mixtral-8x22B-Instruct-v0.1
* Mixtral-8x7B-Instruct-v0.1
* Qwen2.5-0.5B-Instruct
* Qwen2.5-32B-Instruct
* Qwen2.5-3B-Instruct
* Qwen2.5-72B-Instruct
* Qwen2.5-7B-Instruct
* claude-3-haiku-20240307
* claude-3-sonnet-20240229
* gpt-4o-2024-05-13
* gpt-4o-mini-2024-07-18
* **Y-axis:** Proportion (numerical), ranging from 0.0 to 1.0 in increments of 0.2.
* **Legend:** Located on the top-right of the chart.
* Blue: 0
* Green: 1
* Red: 2
* Purple: 3
* Tan/Beige: 4
### Detailed Analysis
The chart displays the proportion of each rating (0 to 4) for each language model. Each bar represents a model, and the height of each colored segment within the bar indicates the proportion of that rating for the model.
* **Llama-3.1-70B-Instruct:**
* Rating 0 (Blue): ~0.6
* Rating 1 (Green): ~0.2
* Rating 2 (Red): ~0.1
* Rating 3 (Purple): ~0.05
* Rating 4 (Tan): ~0.05
* **Llama-3.1-8B-Instruct:**
* Rating 0 (Blue): ~0.6
* Rating 1 (Green): ~0.2
* Rating 2 (Red): ~0.1
* Rating 3 (Purple): ~0.05
* Rating 4 (Tan): ~0.05
* **Llama-3.2-1B-Instruct:**
* Rating 0 (Blue): ~0.6
* Rating 1 (Green): ~0.2
* Rating 2 (Red): ~0.1
* Rating 3 (Purple): ~0.05
* Rating 4 (Tan): ~0.05
* **Llama-3.2-3B-Instruct:**
* Rating 0 (Blue): ~0.6
* Rating 1 (Green): ~0.2
* Rating 2 (Red): ~0.1
* Rating 3 (Purple): ~0.05
* Rating 4 (Tan): ~0.05
* **Mistral-7B-Instruct-v0.1:**
* Rating 0 (Blue): ~0.5
* Rating 1 (Green): ~0.2
* Rating 2 (Red): ~0.15
* Rating 3 (Purple): ~0.1
* Rating 4 (Tan): ~0.05
* **Mixtral-8x22B-Instruct-v0.1:**
* Rating 0 (Blue): ~0.45
* Rating 1 (Green): ~0.25
* Rating 2 (Red): ~0.15
* Rating 3 (Purple): ~0.1
* Rating 4 (Tan): ~0.05
* **Mixtral-8x7B-Instruct-v0.1:**
* Rating 0 (Blue): ~0.4
* Rating 1 (Green): ~0.3
* Rating 2 (Red): ~0.15
* Rating 3 (Purple): ~0.1
* Rating 4 (Tan): ~0.05
* **Qwen2.5-0.5B-Instruct:**
* Rating 0 (Blue): ~0.7
* Rating 1 (Green): ~0.15
* Rating 2 (Red): ~0.05
* Rating 3 (Purple): ~0.05
* Rating 4 (Tan): ~0.05
* **Qwen2.5-32B-Instruct:**
* Rating 0 (Blue): ~0.8
* Rating 1 (Green): ~0.1
* Rating 2 (Red): ~0.05
* Rating 3 (Purple): ~0.02
* Rating 4 (Tan): ~0.03
* **Qwen2.5-3B-Instruct:**
* Rating 0 (Blue): ~0.6
* Rating 1 (Green): ~0.2
* Rating 2 (Red): ~0.1
* Rating 3 (Purple): ~0.05
* Rating 4 (Tan): ~0.05
* **Qwen2.5-72B-Instruct:**
* Rating 0 (Blue): ~0.7
* Rating 1 (Green): ~0.15
* Rating 2 (Red): ~0.05
* Rating 3 (Purple): ~0.05
* Rating 4 (Tan): ~0.05
* **Qwen2.5-7B-Instruct:**
* Rating 0 (Blue): ~0.6
* Rating 1 (Green): ~0.2
* Rating 2 (Red): ~0.1
* Rating 3 (Purple): ~0.05
* Rating 4 (Tan): ~0.05
* **claude-3-haiku-20240307:**
* Rating 0 (Blue): ~0.5
* Rating 1 (Green): ~0.2
* Rating 2 (Red): ~0.15
* Rating 3 (Purple): ~0.1
* Rating 4 (Tan): ~0.05
* **claude-3-sonnet-20240229:**
* Rating 0 (Blue): ~0.8
* Rating 1 (Green): ~0.1
* Rating 2 (Red): ~0.05
* Rating 3 (Purple): ~0.02
* Rating 4 (Tan): ~0.03
* **gpt-4o-2024-05-13:**
* Rating 0 (Blue): ~0.6
* Rating 1 (Green): ~0.2
* Rating 2 (Red): ~0.1
* Rating 3 (Purple): ~0.05
* Rating 4 (Tan): ~0.05
* **gpt-4o-mini-2024-07-18:**
* Rating 0 (Blue): ~0.6
* Rating 1 (Green): ~0.2
* Rating 2 (Red): ~0.1
* Rating 3 (Purple): ~0.05
* Rating 4 (Tan): ~0.05
### Key Observations
* Most models have a high proportion of rating 0.
* Ratings 3 and 4 have the lowest proportions across all models.
* The Qwen models tend to have a higher proportion of rating 0 compared to the other models.
* The Mixtral models have a relatively higher proportion of ratings 1, 2, and 3 compared to the other models.
### Interpretation
The chart provides a comparative overview of how different language models are rated by the "claude-3-5-sonnet-20241022" evaluator. The dominance of rating 0 suggests that, according to this evaluator, many of the models are frequently assigned the lowest rating. The variations in rating distributions among the models indicate differences in their performance or characteristics as perceived by the evaluator. The Mixtral models seem to receive more diverse ratings, while the Qwen models are more heavily skewed towards the lowest rating. This information can be valuable for understanding the relative strengths and weaknesses of these models and for guiding further development and refinement efforts.
</details>
Figure 19: Rating distribution on RuozhiBench-Gen using Claude-3-5-sonnet as an evaluator.
<details>
<summary>x16.png Details</summary>
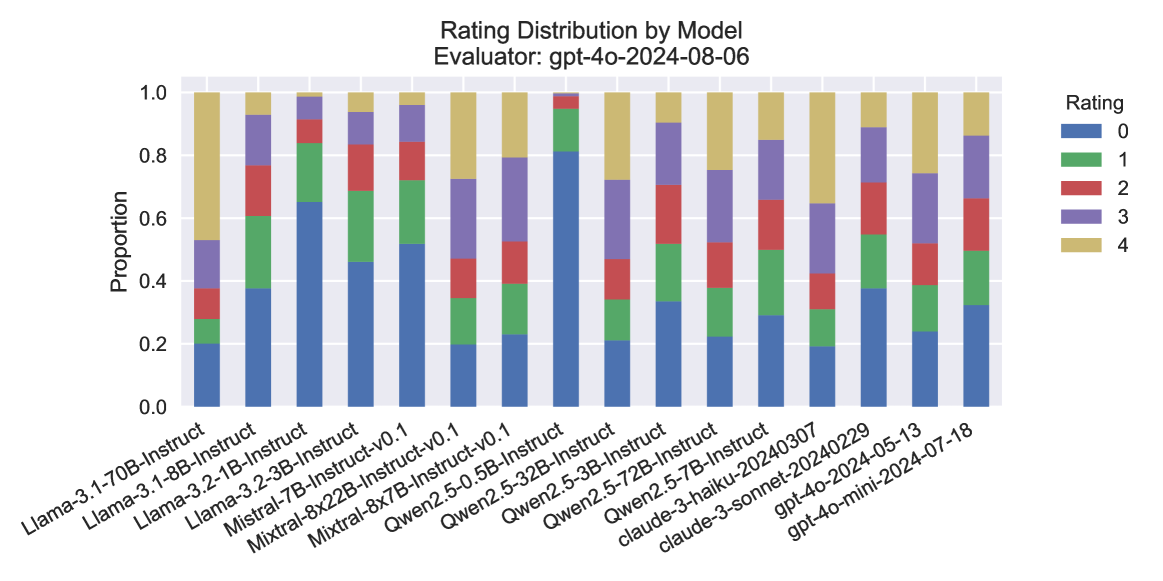
### Visual Description
## Stacked Bar Chart: Rating Distribution by Model
### Overview
The image is a stacked bar chart showing the distribution of ratings for various language models. The x-axis represents different models, and the y-axis represents the proportion of each rating (0-4) assigned to each model. The chart is titled "Rating Distribution by Model" and specifies the evaluator as "gpt-4o-2024-08-06".
### Components/Axes
* **Title:** Rating Distribution by Model
* **Subtitle:** Evaluator: gpt-4o-2024-08-06
* **X-axis:** Language Models (categorical)
* Llama-3.1-70B-Instruct
* Llama-3.1-8B-Instruct
* Llama-3.2-1B-Instruct
* Llama-3.2-3B-Instruct
* Mistral-7B-Instruct-v0.1
* Mixtral-8x22B-Instruct-v0.1
* Mixtral-8x7B-Instruct-v0.1
* Qwen2.5-0.5B-Instruct
* Qwen2.5-3B-Instruct
* Qwen2.5-32B-Instruct
* Qwen2.5-72B-Instruct
* Qwen2.5-7B-Instruct
* claude-3-haiku-20240307
* claude-3-sonnet-20240229
* gpt-4o-2024-05-13
* gpt-4o-mini-2024-07-18
* **Y-axis:** Proportion (numerical), ranging from 0.0 to 1.0 in increments of 0.2.
* **Legend:** Located on the top-right of the chart.
* Blue: Rating 0
* Green: Rating 1
* Red: Rating 2
* Purple: Rating 3
* Tan/Beige: Rating 4
### Detailed Analysis
The chart presents a stacked bar for each language model, where the height of each colored segment represents the proportion of ratings for that category.
* **Llama-3.1-70B-Instruct:**
* Rating 0: ~0.25
* Rating 1: ~0.20
* Rating 2: ~0.15
* Rating 3: ~0.20
* Rating 4: ~0.20
* **Llama-3.1-8B-Instruct:**
* Rating 0: ~0.35
* Rating 1: ~0.25
* Rating 2: ~0.15
* Rating 3: ~0.15
* Rating 4: ~0.10
* **Llama-3.2-1B-Instruct:**
* Rating 0: ~0.30
* Rating 1: ~0.25
* Rating 2: ~0.15
* Rating 3: ~0.15
* Rating 4: ~0.15
* **Llama-3.2-3B-Instruct:**
* Rating 0: ~0.35
* Rating 1: ~0.25
* Rating 2: ~0.15
* Rating 3: ~0.15
* Rating 4: ~0.10
* **Mistral-7B-Instruct-v0.1:**
* Rating 0: ~0.20
* Rating 1: ~0.20
* Rating 2: ~0.15
* Rating 3: ~0.25
* Rating 4: ~0.20
* **Mixtral-8x22B-Instruct-v0.1:**
* Rating 0: ~0.20
* Rating 1: ~0.20
* Rating 2: ~0.10
* Rating 3: ~0.30
* Rating 4: ~0.20
* **Mixtral-8x7B-Instruct-v0.1:**
* Rating 0: ~0.20
* Rating 1: ~0.20
* Rating 2: ~0.15
* Rating 3: ~0.25
* Rating 4: ~0.20
* **Qwen2.5-0.5B-Instruct:**
* Rating 0: ~0.40
* Rating 1: ~0.25
* Rating 2: ~0.15
* Rating 3: ~0.10
* Rating 4: ~0.10
* **Qwen2.5-3B-Instruct:**
* Rating 0: ~0.40
* Rating 1: ~0.25
* Rating 2: ~0.15
* Rating 3: ~0.10
* Rating 4: ~0.10
* **Qwen2.5-32B-Instruct:**
* Rating 0: ~0.40
* Rating 1: ~0.25
* Rating 2: ~0.15
* Rating 3: ~0.10
* Rating 4: ~0.10
* **Qwen2.5-72B-Instruct:**
* Rating 0: ~0.40
* Rating 1: ~0.25
* Rating 2: ~0.15
* Rating 3: ~0.10
* Rating 4: ~0.10
* **Qwen2.5-7B-Instruct:**
* Rating 0: ~0.40
* Rating 1: ~0.25
* Rating 2: ~0.15
* Rating 3: ~0.10
* Rating 4: ~0.10
* **claude-3-haiku-20240307:**
* Rating 0: ~0.30
* Rating 1: ~0.25
* Rating 2: ~0.20
* Rating 3: ~0.15
* Rating 4: ~0.10
* **claude-3-sonnet-20240229:**
* Rating 0: ~0.35
* Rating 1: ~0.25
* Rating 2: ~0.20
* Rating 3: ~0.10
* Rating 4: ~0.10
* **gpt-4o-2024-05-13:**
* Rating 0: ~0.20
* Rating 1: ~0.30
* Rating 2: ~0.25
* Rating 3: ~0.15
* Rating 4: ~0.10
* **gpt-4o-mini-2024-07-18:**
* Rating 0: ~0.30
* Rating 1: ~0.30
* Rating 2: ~0.20
* Rating 3: ~0.10
* Rating 4: ~0.10
### Key Observations
* Models like Qwen2.5 variants tend to have a higher proportion of rating 0 compared to other models.
* Models like Mistral and Mixtral have a more even distribution of ratings, with a higher proportion of ratings 3 and 4 compared to Qwen2.5.
* The gpt-4o models show a relatively high proportion of rating 1.
### Interpretation
The chart provides a comparative view of how different language models are rated by the "gpt-4o-2024-08-06" evaluator. The distribution of ratings suggests that some models are consistently rated lower (e.g., Qwen2.5 variants), while others receive a more balanced distribution of ratings. This could indicate differences in the models' performance, capabilities, or suitability for the tasks evaluated. The gpt-4o models show a different rating pattern, possibly reflecting a different evaluation focus or inherent characteristics of these models. The data highlights the subjective nature of model evaluation and the importance of considering the evaluation context.
</details>
Figure 20: Rating distribution on RuozhiBench-Gen using GPT-4o-2024-08-06 as an evaluator.
<details>
<summary>x17.png Details</summary>
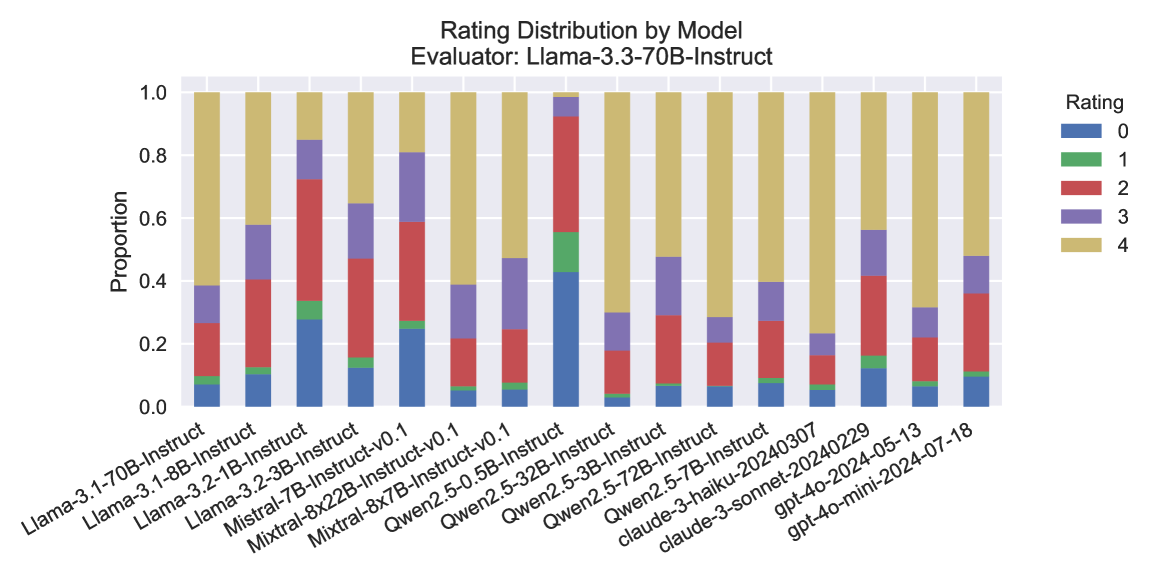
### Visual Description
## Stacked Bar Chart: Rating Distribution by Model
### Overview
The image is a stacked bar chart showing the distribution of ratings for different language models, as evaluated by Llama-3.3-70B-Instruct. Each bar represents a model, and the bar is segmented into colored sections representing the proportion of each rating (0 to 4).
### Components/Axes
* **Title:** Rating Distribution by Model
* **Subtitle:** Evaluator: Llama-3.3-70B-Instruct
* **Y-axis:** Proportion, ranging from 0.0 to 1.0 in increments of 0.2.
* **X-axis:** Language models, including:
* Llama-3.1-70B-Instruct
* Llama-3.1-8B-Instruct
* Llama-3.2-1B-Instruct
* Llama-3.2-3B-Instruct
* Mistral-7B-Instruct-v0.1
* Mixtral-8x22B-Instruct-v0.1
* Mixtral-8x7B-Instruct-v0.1
* Qwen2.5-0.5B-Instruct
* Qwen2.5-32B-Instruct
* Qwen2.5-3B-Instruct
* Qwen2.5-72B-Instruct
* Qwen2.5-7B-Instruct
* claude-3-haiku-20240307
* claude-3-sonnet-20240229
* gpt-4o-2024-05-13
* gpt-4o-mini-2024-07-18
* **Legend (Top-Right):**
* Blue: 0
* Green: 1
* Red: 2
* Purple: 3
* Tan/Beige: 4
### Detailed Analysis
The chart displays the proportion of each rating (0-4) assigned to different language models by the Llama-3.3-70B-Instruct evaluator. Each model has a stacked bar representing its rating distribution.
* **Llama-3.1-70B-Instruct:** Approximately 10% rating 0, 5% rating 1, 25% rating 2, 20% rating 3, and 40% rating 4.
* **Llama-3.1-8B-Instruct:** Approximately 12% rating 0, 3% rating 1, 25% rating 2, 15% rating 3, and 45% rating 4.
* **Llama-3.2-1B-Instruct:** Approximately 10% rating 0, 5% rating 1, 20% rating 2, 25% rating 3, and 40% rating 4.
* **Llama-3.2-3B-Instruct:** Approximately 10% rating 0, 25% rating 2, 20% rating 3, and 45% rating 4.
* **Mistral-7B-Instruct-v0.1:** Approximately 25% rating 0, 10% rating 1, 35% rating 2, 20% rating 3, and 10% rating 4.
* **Mixtral-8x22B-Instruct-v0.1:** Approximately 10% rating 0, 5% rating 1, 25% rating 2, 30% rating 3, and 30% rating 4.
* **Mixtral-8x7B-Instruct-v0.1:** Approximately 10% rating 0, 5% rating 1, 25% rating 2, 20% rating 3, and 40% rating 4.
* **Qwen2.5-0.5B-Instruct:** Approximately 40% rating 0, 10% rating 1, 30% rating 2, 15% rating 3, and 5% rating 4.
* **Qwen2.5-32B-Instruct:** Approximately 10% rating 0, 5% rating 1, 20% rating 2, 30% rating 3, and 35% rating 4.
* **Qwen2.5-3B-Instruct:** Approximately 50% rating 0, 5% rating 1, 20% rating 2, 20% rating 3, and 5% rating 4.
* **Qwen2.5-72B-Instruct:** Approximately 10% rating 0, 5% rating 1, 10% rating 2, 20% rating 3, and 55% rating 4.
* **Qwen2.5-7B-Instruct:** Approximately 10% rating 0, 5% rating 1, 35% rating 2, 30% rating 3, and 20% rating 4.
* **claude-3-haiku-20240307:** Approximately 5% rating 0, 5% rating 1, 10% rating 2, 20% rating 3, and 60% rating 4.
* **claude-3-sonnet-20240229:** Approximately 5% rating 0, 5% rating 1, 20% rating 2, 20% rating 3, and 50% rating 4.
* **gpt-4o-2024-05-13:** Approximately 10% rating 0, 5% rating 1, 35% rating 2, 20% rating 3, and 30% rating 4.
* **gpt-4o-mini-2024-07-18:** Approximately 10% rating 0, 5% rating 1, 30% rating 2, 5% rating 3, and 50% rating 4.
### Key Observations
* The Qwen2.5-3B-Instruct model has the highest proportion of rating 0.
* The claude-3-haiku-20240307 model has the highest proportion of rating 4.
* The distribution of ratings varies significantly across different models.
### Interpretation
The stacked bar chart provides a visual comparison of how different language models are rated by the Llama-3.3-70B-Instruct evaluator. The distribution of ratings for each model gives insight into the evaluator's perception of the model's performance. Models like Qwen2.5-3B-Instruct receive a higher proportion of lower ratings (0), suggesting they may not perform as well as models like claude-3-haiku-20240307, which receives a higher proportion of higher ratings (4). The chart highlights the variability in performance across different models and can be used to identify models that may require further improvement or investigation.
</details>
Figure 21: Rating distribution on RuozhiBench-Gen using Llama-3.3-70B-Instruction as an evaluator.