# Grounding LLM Reasoning with Knowledge Graphs
**Authors**: Alfonso Amayuelas, UC Santa Barbara
> Work completed during an internship at JP Morgan AI Research
\workshoptitle
Foundations of Reasoning in Language Models
Abstract
Large Language Models (LLMs) excel at generating natural language answers, yet their outputs often remain unverifiable and difficult to trace. Knowledge Graphs (KGs) offer a complementary strength by representing entities and their relationships in structured form, providing a foundation for more reliable reasoning. We propose a novel framework that integrates LLM reasoning with KGs by linking each step of the reasoning process to graph-structured data. This grounding turns intermediate “thoughts” into interpretable traces that remain consistent with external knowledge. Our approach incorporates multiple reasoning strategies, Chain-of-Thought (CoT), Tree-of-Thought (ToT), and Graph-of-Thought (GoT), and is evaluated on GRBench, a benchmark for domain-specific graph reasoning. Our experiments show state-of-the-art (SOTA) performance, with at least 26.5% improvement over CoT baselines. Beyond accuracy, we analyze how step depth, branching structure, and model size influence reasoning quality, offering insights into the conditions that support effective reasoning. Together, these contributions highlight how grounding LLMs in structured knowledge enables both higher accuracy and greater interpretability in complex reasoning tasks.
1 Introduction
LLMs have shown remarkable versatility in answering questions posed in natural language. This is mainly due to their ability to generate text, their broad internal knowledge, and their capacity to access external information (toolqa; rag). However, a significant area for improvement is their tendency to produce information that, while plausible-sounding, is often unverifiable and lacks traceable origins and sources (hallucination_survey). This limitation highlights a deeper issue in how LLMs organize and apply reasoning, especially when reliable and accountable outputs are required.
The LLM generation process heavily relies on their internal parameters, making it difficult to link their outputs to external sources (llm_internal_knowledge; llm_kb). This limitation challenges their reliability in industrial applications (llm_explainability_survey). In applied settings, where LLMs handle critical operations, integrating them with domain-specific knowledge is essential. Fine-tuning LLMs for new domains is labor-intensive, especially for companies with proprietary data facing privacy and legal issues. As a result, there is a need for interventions that guide reasoning processes so that outputs remain accurate and transparent without requiring exhaustive re-training.
Methods such as Retrieval-Augmented Generation (RAG) (rag) and SQL-based querying (llm_eval_sql) address this gap partially. However, they often fail to capture the dynamic relationships between concepts that are necessary for comprehensive understanding. These approaches typically assume that knowledge is well-represented in discrete units, such as documents or tables, which can lead to incomplete insights when dealing with interconnected knowledge that spans multiple sources. This limits the ability to support reasoning over complex queries.
<details>
<summary>figures/general.png Details</summary>
### Visual Description
## Diagram: Comparative Analysis of Agent and Automatic Exploration Methods for Knowledge Graph Query Resolution
### Overview
The diagram illustrates two approaches to answering the question "What is the most frequently cited artwork by Mark Brunswick?" through a knowledge graph. The left side shows the Agent method (blue), while the right side demonstrates the Automatic Exploration method (red). Both methods interact with a central knowledge graph containing entities and triples.
### Components/Axes
1. **Left Panel (Agent Method)**:
- **Steps**: 3 sequential steps (Step 1, Step 2, Step n)
- **Elements**:
- **Actions**: RetrieveNode, NeighborCheck, Finish
- **Observations**: Node ID 8309, Neighbor entities (Nocturne, Rondo, Symphony in B♭)
- **Thoughts**: Sequential reasoning about Mark Brunswick's works
- **Knowledge Graph**: Central graph showing node connections
2. **Right Panel (Automatic Exploration)**:
- **Steps**: 3 sequential steps (Step 1, Step 2, Step n)
- **Elements**:
- **Entities**: Mark Brunswick, The Master Builder, Symphony in B♭
- **Triples**: Author relationships, citation data
- **Thoughts**: Logical deduction about most cited work
- **Knowledge Graph**: Same central graph with entity/triple annotations
3. **Central Knowledge Graph**:
- **Nodes**: Represent entities (green circles)
- **Edges**: Represent relationships (blue lines)
- **Annotations**: Specific triples (e.g., "Mark Brunswick authored Symphony in B♭")
### Detailed Analysis
**Agent Method (Left)**:
- **Step 1**: Retrieves node 8309 (Mark Brunswick) and observes its ID
- **Step 2**: Checks neighbors of node 8309 (works) and observes related artworks
- **Step n**: Concludes "The Master Builder" is the most cited work
**Automatic Exploration (Right)**:
- **Step 1**: Identifies entities (Mark Brunswick) and triples (author relationships)
- **Step 2**: Discovers Mark Brunswick authored "The Master Builder" and "Symphony in B♭"
- **Step n**: Concludes "The Master Builder" is most frequently cited
**Knowledge Graph**:
- Contains interconnected nodes for artists, artworks, and relationships
- Shows explicit author relationships and citation data
- Serves as the knowledge base for both methods
### Key Observations
1. **Methodological Differences**:
- Agent method uses explicit node traversal (ID-based)
- Automatic Exploration uses semantic entity/triple analysis
2. **Knowledge Graph Structure**:
- Nodes represent both entities (artists, artworks) and relationships
- Triples encode provenance (authored by, cited by)
3. **Convergent Conclusion**:
- Both methods arrive at the same answer ("The Master Builder")
- Different paths to the same conclusion demonstrate complementary approaches
### Interpretation
The diagram demonstrates two distinct knowledge graph query resolution strategies:
1. **Agent Method** follows a procedural, step-by-step approach with explicit node manipulation
2. **Automatic Exploration** leverages semantic relationships and triple patterns for logical deduction
The convergence on "The Master Builder" as the most cited work suggests:
- The knowledge graph contains sufficient provenance data
- Both methods can handle complex author-artwork relationships
- Semantic relationships (triples) are critical for answering provenance questions
The blue/red color coding effectively distinguishes the two approaches while maintaining visual connection through the shared knowledge graph. This diagram effectively illustrates how different AI reasoning strategies can complement each other in knowledge graph navigation tasks.
</details>
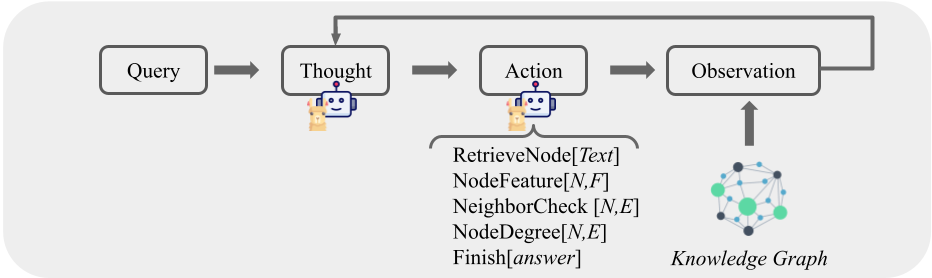
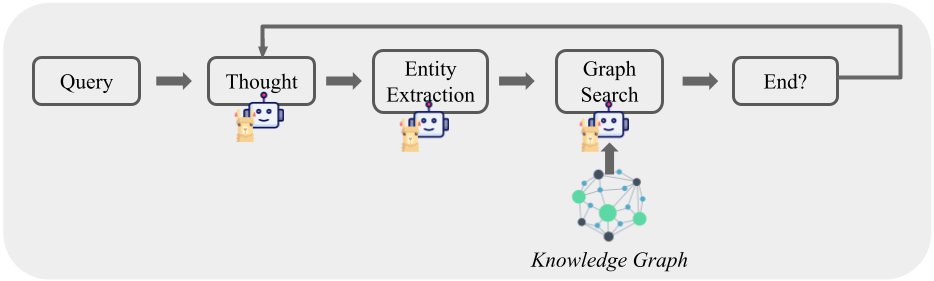
Figure 1: Methods for Question-Answering in KGs (Section 4). Left: Agent. LLM decides to take one of the predefined actions to connect with the graph. Right: Automatic Graph Exploration. Entities are extracted in each reasoning step, triggering a search for each identified entity.
KGs capture such relationships by organizing entities and their connections in a structured representation. Recent work has begun to explore how KGs can guide reasoning in LLMs (rog). Building on this direction, we propose a framework that integrates reasoning strategies with domain-specific KGs from the GRBench dataset. Each reasoning step is explicitly connected to the graph, producing answers that are both accurate and traceable. We evaluate three strategies, CoT, ToT, and GoT, which provide different ways of organizing reasoning traces (Figure 2). Our framework achieves SOTA performance on GRBench, improving by at least 26.5% over CoT baselines. Beyond accuracy, we analyze how reasoning behaviors vary with step depth, branching, and model size (Section 7), offering insights into how reasoning evolves during inference and how it can be shaped by structured knowledge. Our contributions can be summarized as follows:
- We present a versatile framework that links reasoning steps with graph search, providing an intervention that can be applied across domains and knowledge settings.
- We show substantial gains over existing reasoning strategies, with state-of-the-art performance on GRBench and an improvement of at least 26.5% compared to CoT baselines.
- We conduct a detailed study of how reasoning quality is influenced by step depth, branching structure, and model size, offering insights into the conditions under which different interventions succeed (Section 7).
- By systematically grounding each step in a knowledge graph, we improve both the accuracy and the traceability of outputs, creating reasoning traces that are interpretable and verifiable.
2 Related Work
LLMs require substantial data and resources for training villalobos2024will. Retrieval-Augmented Generation (RAG) enable the models to incorporate external evidence at inference time (rag; demonstrate-search-predict). Recent work further combines RAG with structured knowledge, such as ontologies and KGs, to improve factuality and reasoning li2024structrag, underscoring the growing importance of structured data for robust and domain-adaptable LLMs.
Structured Knowledge
Structured knowledge, such as databases or KGs, provides organizations with reliable sources of information that can be systematically maintained and automatically updated. KGs in particular offer an adaptable knowledge model that captures complex relationships between interconnected concepts. Research has explored models that can interact with multiple types of structured knowledge, such as StructLM (structLM), and approaches that incorporate structured knowledge during pretraining to improve model performance (skill_llm_structured_knowledge_infusion).
Integrating KGs with LLMs
The integration of KGs with LLMs has emerged as a promising direction to strengthen reasoning capabilities and reliability (peng2024graph). In general, four primary methods can be distinguished: (1) learning graph representations (let_graph_do_thinking; graphllm), though latent representations often underperform compared to text-based methods on Knowledge Graph Question Answering (KGQA) tasks; (2) using Graph Neural Network (GNN) retrievers to extract relevant entities and feeding them as text-based input to the model (g-retriever; gnn-rag); (3) generating code, such as SPARQL queries, to directly retrieve information from graphs (kb-binder); and (4) step-by-step interaction methods that allow iterative reasoning over graphs (rog; decaf; chatkbqa), which currently achieve the strongest results on KGQA benchmarks.
LLM Reasoning with Graphs
Beyond retrieval, KGs have also been studied as a means to structure and analyze the reasoning processes of LLMs themselves wang2024understanding. This integration enables more coherent and contextually relevant outputs while also supporting the tracing and verification of reasoning steps. The most effective methods typically rely on interactive, step-by-step engagement between LLMs and graphs, as discussed above. Examples of this approach include systems such as think-on-graph; mindmap; rog; kg-gpt; li2025cot, which demonstrate improved reasoning performance through graph-based scaffolding. More recent work has further investigated the integration of traditional reasoning strategies, such as CoT and tree-structured reasoning, into KG-based interaction (graphCoT; tree-of-traversals).
Building on these advances, our framework integrates established reasoning strategies directly with domain-specific KGs. Unlike previous methods that treat KGs as retrieval tools or rely on latent representations, our approach systematically links each reasoning step to graph entities and relations.
3 Background
In this section, we formalize the prerequisite knowledge relevant to this paper. We use $p_{\theta}$ to denote a pre-trained language model with parameters $\theta$ , and letters $x,y,z$ to refer to a language sequence. $x=(x_{1},x_{2},...,x_{n})$ , where each generated token is $x_{i}$ is a such that $p_{\theta}(x)=\prod_{i=1}^{n}p_{\theta}(x_{i}|x_{1...i-1})$ .
Knowledge Graphs (KGs)
A KG is a heterogeneous directed graph that contains factual knowledge to model structured information. Nodes represent entities, events, or concepts, while edges represent the connection and types of relations between them. Formally, a KG is represented as $\mathcal{G}$ , defined by a set of triples $\mathcal{G}=\{(h,r,t)\mid h,t∈\mathcal{E},r∈\mathcal{R}\}$ , where $\mathcal{E}$ , $\mathcal{R}$ denote the set of entities and relations, respectively. KGs provide a structured framework that can guide reasoning processes by explicitly representing the relationships between concepts.
Knowledge Graph Question-Answering (KGQA)
It is a reasoning task that leverages KGs. Given a natural language question, $q$ , and an associated KG, $\mathcal{G}$ , the goal is to develop a method that retrieves the correct answer, $a$ , based on the knowledge extracted from the KG: $a=f(q,\mathcal{G})$ . Beyond retrieving facts, KGQA often requires integrating multiple reasoning steps that traverse the graph to connect related concepts.
Step-by-step Reasoning with LLMs
To improve the reasoning capabilities of LLMs at inference time, a common approach is to generate intermediate reasoning steps. The key idea is the introduction of intermediate steps, $Z_{p_{\theta}}=z_{1},...,z_{n}$ , to add inference sources to bridge the $q$ and $a$ . This decomposition allows models to tackle complex, multi-step problems incrementally, focusing computational effort on parts of reasoning chain that require deeper analysis. Stepwise reasoning over KGs offers a natural mechanism to track, guide, and interpret the reasoning process.
4 Method
This work demonstrates how progressively conditioning LLM reasoning at each step can enhance performance on domain-specific question answering over knowledge graphs. By structuring reasoning into incremental steps that interact with graph data, the model can manage complex dependencies and dynamically refine its conclusions. Our method combines reasoning strategies for LLMs: CoT, ToT, GoT with 2 graph interaction methods: (1) Agent, an agent to navigate the graph; and (2) Automatic Graph Exploration, an automatic graph traversal mechanism based on the generated text.
<details>
<summary>figures/cot.jpg Details</summary>
### Visual Description
## Flowchart: Cognitive Processing Pipeline
### Overview
The diagram illustrates a sequential cognitive processing workflow starting with an "Input" and progressing through three iterative "Thought" stages, culminating in an "Answer". Each "Thought" stage is accompanied by a network diagram representing interconnected nodes, suggesting complex information processing.
### Components/Axes
1. **Input**: Oval-shaped starting point (top of diagram)
2. **Thought Stages**: Three rectangular blocks labeled "Thought" (center-left)
3. **Network Diagrams**: Three interconnected node systems (dark blue, light blue, green nodes) connected to each "Thought" block via yellow plus signs
4. **Answer**: Final rectangular output (bottom of diagram)
5. **Arrows**: Gray directional indicators showing process flow
6. **Node Colors**:
- Dark blue (largest nodes)
- Light blue (medium nodes)
- Green (smallest nodes)
- No explicit legend provided
### Detailed Analysis
- **Input → First Thought**: Initial information enters the system and triggers the first cognitive processing stage, represented by a network with dominant dark blue nodes
- **Thought Iteration**: Each subsequent "Thought" block shows progressively lighter node colors (dark blue → light blue → green), suggesting refinement or abstraction of information
- **Network Connections**: The yellow plus signs between "Thought" blocks and networks imply additive or combinatorial processing
- **Final Output**: The "Answer" block receives processed information from the third Thought stage's network
### Key Observations
1. The three Thought stages show decreasing node size and increasing lightness in color, potentially indicating:
- Information distillation
- Abstraction layers
- Confidence scoring
2. Network density remains consistent across stages, suggesting maintained contextual relationships
3. No explicit feedback loops or error correction mechanisms are depicted
4. The absence of a legend for node colors limits quantitative interpretation
### Interpretation
This diagram represents a simplified model of cognitive processing where:
1. **Input** triggers sequential reasoning stages ("Thought")
2. Each "Thought" stage processes information through interconnected nodes, with color progression suggesting:
- Dark blue: Core concepts/primary data
- Light blue: Secondary associations
- Green: Tertiary refinements
3. The yellow plus signs may represent:
- Information merging
- Cognitive weighting
- Confidence aggregation
4. The final "Answer" emerges from synthesized processing across all three stages
The model emphasizes linear progression rather than parallel processing, and the node color gradient implies a qualitative rather than quantitative transformation of information. The lack of error handling suggests this represents idealized cognitive processing rather than real-world implementation.
</details>
(a) Chain of Thought (CoT)
<details>
<summary>figures/tot.jpg Details</summary>
### Visual Description
## Flowchart: Decision Tree with Binary Outcomes
### Overview
The image depicts a hierarchical decision tree with multiple layers of decision nodes ("T") and binary outcomes (correct/incorrect paths). The structure begins with an "Input" node at the top, branches into intermediate decision points, and culminates in a final "Answer" node at the bottom. Green checkmarks (✓) and red Xs (✗) indicate successful and failed paths, respectively.
### Components/Axes
- **Input**: Oval-shaped node at the top, serving as the starting point.
- **Decision Nodes ("T")**: Rectangular boxes labeled "T" arranged in three layers:
- **Layer 1**: 3 nodes (left, center, right).
- **Layer 2**: 5 nodes (left, center-left, center, center-right, right).
- **Layer 3**: 5 nodes (left, center-left, center, center-right, right).
- **Outcome Indicators**:
- Green checkmarks (✓) on arrows denote correct paths.
- Red Xs (✗) on arrows denote incorrect paths.
- **Answer**: Final rectangular node at the bottom, labeled "Answer."
### Detailed Analysis
1. **Layer 1 (Top)**:
- All three "T" nodes have green checkmarks (✓) on their outgoing arrows, indicating all paths are initially valid.
2. **Layer 2 (Middle)**:
- **Left "T"**: One green checkmark (✓) and one red X (✗).
- **Center "T"**: One green checkmark (✓) and one red X (✗).
- **Right "T"**: One green checkmark (✓) and one red X (✗).
3. **Layer 3 (Bottom)**:
- **Left "T"**: One green checkmark (✓) and one red X (✗).
- **Center "T"**: One green checkmark (✓) and one red X (✗).
- **Center-right "T"**: One green checkmark (✓) and one red X (✗).
- **Right "T"**: One green checkmark (✓) and one red X (✗).
4. **Final "Answer" Node**:
- Reached via two green checkmarked paths from Layer 3 nodes.
### Key Observations
- **Path Validity**:
- Only 2 out of 8 total paths (25%) lead to the "Answer" node.
- Incorrect paths (red Xs) terminate prematurely, preventing progression to the final answer.
- **Symmetry**:
- The tree is balanced, with equal numbers of checkmarks and Xs at each layer.
- **Flow Direction**:
- All arrows point downward, enforcing a top-down decision-making process.
### Interpretation
This flowchart represents a **binary decision tree** where each "T" node acts as a critical juncture. The green checkmarks (✓) and red Xs (✗) likely symbolize success/failure states in a process (e.g., validation steps, error handling). The low success rate (25%) suggests that multiple correct decisions are required to reach the final "Answer," emphasizing the importance of sequential accuracy. The symmetry implies a standardized evaluation framework, while the red Xs highlight potential failure points that must be addressed to improve outcomes.
</details>
(b) Tree of Thought (ToT)
<details>
<summary>figures/got.jpg Details</summary>
### Visual Description
## Flowchart Diagram: Input Validation Process
### Overview
The diagram illustrates a multi-stage validation process starting with an "Input" and progressing through multiple layers of decision points labeled "T". Each stage contains nodes with green checkmarks (✓) or red Xs (✗), culminating in a final "Answer" output. The flow suggests a hierarchical decision tree with conditional branching.
### Components/Axes
1. **Input**: Oval-shaped starting point at the top center
2. **T-Boxes**: Rectangular nodes labeled "T" arranged in three horizontal layers
- Layer 1: 3 T-boxes
- Layer 2: 5 T-boxes
- Layer 3: 4 T-boxes
3. **Arrows**:
- Green arrows indicate valid paths
- Gray arrows indicate rejected paths
4. **Status Indicators**:
- Green checkmarks (✓) in bottom-right corners of valid T-boxes
- Red Xs (✗) in bottom-left corners of rejected T-boxes
5. **Answer**: Final output box at the bottom center
### Detailed Analysis
1. **Layer 1**:
- Three T-boxes receive input
- Two valid paths (✓) to Layer 2
- One rejected path (✗) to Layer 2
2. **Layer 2**:
- Five T-boxes process intermediate results
- Three valid paths (✓) to Layer 3
- Two rejected paths (✗) to Layer 3
3. **Layer 3**:
- Four T-boxes evaluate final conditions
- All four paths valid (✓) to Answer
- One rejected path (✗) from Layer 2 bypasses this layer
4. **Answer**:
- Receives input from all valid Layer 3 paths
- Contains no status indicators
### Key Observations
1. **Validation Threshold**:
- 66% of initial inputs survive first validation (2/3)
- 60% of Layer 2 inputs survive (3/5)
- 100% of Layer 3 inputs survive (4/4)
2. **Path Efficiency**:
- Only 2 of 3 initial paths reach final answer
- 50% of Layer 2 paths are rejected
- No final-stage rejections
3. **Visual Hierarchy**:
- Checkmarks cluster in bottom-right quadrant
- Xs appear in top-left quadrant
- Answer box centrally positioned at bottom
### Interpretation
This diagram represents a multi-criteria validation system with progressive filtering. The "T" boxes likely represent test cases or validation criteria, with checkmarks indicating successful validation and Xs indicating failures. The process shows diminishing returns in validation efficiency through each layer, with the final answer only considering fully validated paths. The absence of Xs in the final layer suggests a design where only fully validated inputs reach the conclusion. The system appears to implement a "fail-fast" strategy, rejecting invalid paths early while maintaining 100% success rate in final evaluation.
</details>
(c) Graph of Thought (GoT)
Figure 2: Reasoning Strategies: This figure illustrates different LLM reasoning strategies to navigate the potential answer space: CoT, ToT, GoT. Each strategy consists of "thoughts" connected to the KG through search methods (Section 4.2) illustrating stepwise reasoning over structured knowledge.
4.1 Reasoning Strategies
Chain-of-Thought (CoT)
CoT is a well-known reasoning method that involves generating a sequence of logical steps, where each step builds upon previous ones, ultimately leading to a conclusion. Formally, it generates a sequence of reasoning steps $Z_{p_{\theta}}(q)=\{z_{1},z_{2},...,z_{n}\}$ , where each step $z_{i}$ is sampled sequentially given the input query $q$ , all previous steps and graph information from all steps , $\mathcal{G}^{\prime}$ , as $z_{i}\sim p_{\theta}^{\text{CoT}}(z_{i}|q,\mathcal{G}^{\prime},z_{1... i-1})$ . The final answer $a$ is derived from this reasoning process given all the generated thoughts $a\sim p_{\theta}^{\text{CoT}}(a|q,\mathcal{G}^{\prime},z_{1... n})$ . In practice, it is sampled as a continuous language sequence. Figure 2(a) represents this method, where each step is linked to the KG.
Tree-of-Thought (ToT)
ToT generalizes CoT by modeling the reasoning process as a tree, enabling simultaneous exploration of multiple reasoning paths. Starting from an initial state $s_{0}=[q]$ , where $q$ is the input, ToT incrementally expands each state by generating multiple candidate thoughts:
$$
z_{i+1}^{(j)}\sim p_{\theta}(z_{i+1}\mid s_{i}),\quad j=1,\dots,k \tag{1}
$$
Each candidate thought represents a node in the tree, forming new states. These states are evaluated by a heuristic scoring function $V(p_{\theta},s)$ , guiding the selection and pruning of branches. Search strategies, such as breadth-first search (BFS), systematically explore this tree:
$$
S_{t}=\text{argmax}_{S^{\prime}\subseteq\hat{S}_{t},|S^{\prime}|=b}\sum_{s\in S^{\prime}}V(p_{\theta},s) \tag{2}
$$
where $\hat{S}_{t}$ denotes candidate states at step $t$ , and $b$ limits the breadth. We implement two versions of heuristic functions $V$ to select the top $t$ states:
1. Selection: The LLM directly chooses the top $t$ states to proceed, discarding the others.
1. Score: The states are ranked by a heuristic voting mechanism: $V(p_{\theta},S)(s)=\mathbb{P}[s=s^{*}]$ where the LLM is prompted to estimate probability of the current state solving the given input question.
This structured search and pruning strategy allows the model to evaluate multiple candidate reasoning paths, enabling more deliberate and interpretable reasoning.
Graph-of-Thought (GoT)
GoT extends ToT by organizing reasoning into a directed graph structure $G=(V,E)$ , where each node represents a thought and edges reflect dependencies. Starting from initial thought, new thoughts are generated similarly to ToT and added to the graph. Each new thought is connected to its parent, and additional reasoning chains can be formed through merging operations:
$$
z_{i+1}=A(z_{i}^{(a)},z_{i}^{(b)}) \tag{3}
$$
where $A$ denotes a merge operation that integrates two thought chains into a single coherent reasoning step. The merged thought is added as a new node with edges from both parents. In our implementation, thoughts are evaluated using either Selection- or Score-based strategy as in ToT. Merged thoughts inherit information from both parents and can enhance robustness. At each depth, a fixed number of thoughts are retained using breadth-first traversal and evaluated for progression. The graph-based organization captures dependencies and merges information from multiple reasoning chains, supporting dynamic refinement and structured exploration of the reasoning space.
4.2 LLM + KG Interaction Methods
We implement methods to connect reasoning strategies with KGs. The LLM interacts with the KG at every step. This retrieves new information and conditions the model for subsequent steps. We present 2 methods to achieve this interaction, both illustrated in Appendix B.
4.2.1 Agent
This approach creates an agent that interacts with the graph, following the methodology initially described in ReACT (react). After generating a thought, the LLM selects from a set of actions based on the given thought. Each step in the reasoning chain consists of an interleaved sequence: thought $→$ action $→$ retrieved data. This method implements four actions as described in GraphCoT (graphCoT): (a) RetrieveNode (Text): Identifies the related node in the graph using semantic search, (b) NodeFeature (NodeID, FeatureName): Retrieves textual information for a specific node from the graph, (c) NeighborCheck (NodeID, EdgeType): Retrieves neighbors’ information for a specific node, (d) NodeDegree (NodeID, EdgeType): Returns the degree (#neighbors) for a given node and edge type. These actions collectively enable the agent to navigate and extract meaningful information from the graph, enhancing the reasoning capabilities of the LLM by grounding its thoughts in structured, retrievable data.
4.2.2 Automatic Graph Exploration
This method incrementally searches the graph by interleaving language generation with structured retrieval. At each step, the LLM generates a new "thought" based on previous thoughts and retrieved triples. Entities mentioned in the generated text are automatically extracted using LLM prompts and serve as anchors for further graph exploration.
<details>
<summary>figures/graph_search.png Details</summary>
### Visual Description
## Flowchart: Knowledge Graph Triple Generation Process
### Overview
The diagram illustrates a multi-stage pipeline for constructing knowledge graph triples from raw text. It shows entity extraction, relation validation, neighbor selection, and final triple formation with quality control markers.
### Components/Axes
1. **Entity Extraction**
- Input: Document icon (📄) + Robot icon (🤖)
- Output: Three entities (Entity1, Entity2, Entity3)
- Spatial: Entities arranged vertically, Entity2 highlighted in blue
2. **Relation Selection**
- Input: Entity2
- Process: Network diagram with 3 nodes (Entity2, EntityA, EntityB)
- Output: Two relations (Rel1, Rel2)
- Color coding: Orange (Rel1) with green checkmark, Red (Rel2) with red X
3. **Neighbor Selection**
- Input: EntityA
- Process: Three self-referential connections
- Output: Three neighbor instances
- Color coding: Two green (✓) with green checkmarks, one red (✗) with red X
4. **Triples**
- Input: Entity2 → EntityA connections
- Output: Three triplets
- Color coding: Two valid (blue→green with ✓), one invalid (blue→red with ✗)
### Detailed Analysis
- **Entity Extraction**:
- Document icon (top-left) → Robot icon (center-left) → Three entity boxes
- Entity2 (blue box) is the selected candidate for relation analysis
- **Relation Selection**:
- Network diagram shows Entity2 connected to EntityA (green) and EntityB (red)
- Rel1 (orange arrow) to EntityA marked correct (✓)
- Rel2 (red arrow) to EntityB marked incorrect (✗)
- **Neighbor Selection**:
- EntityA connects to three instances:
- Two valid neighbors (green boxes with ✓)
- One invalid neighbor (red box with ✗)
- **Triples**:
- Final output shows:
- Two valid triples (blue→green with ✓)
- One invalid triple (blue→red with ✗)
### Key Observations
1. **Quality Control**:
- Green checkmarks (✓) and red crosses (✗) consistently indicate valid/invalid elements across all stages
- Color coding follows strict pattern: Blue (entities), Green (valid), Red (invalid)
2. **Flow Direction**:
- Left-to-right progression: Extraction → Relation → Neighbor → Triples
- Vertical stacking in Entity Extraction and Triples sections
3. **Entity Relationships**:
- Entity2 serves as source for relations
- EntityA acts as intermediate node for neighbor selection
- Triples maintain source→relation→target structure
### Interpretation
This diagram demonstrates a knowledge graph construction pipeline with explicit quality control at each stage. The process shows:
1. **Entity Filtering**: Only Entity2 (highlighted) proceeds to relation analysis
2. **Relation Validation**: Only Rel1 (orange) survives relation selection
3. **Neighbor Pruning**: Two out of three neighbors are rejected
4. **Triple Integrity**: Final output maintains 2:1 valid:invalid ratio
The use of consistent color coding and symbolic validation markers suggests an automated quality assurance system. The pipeline's structure implies that:
- Entity extraction is the most permissive stage (3 entities selected)
- Relation selection is moderately selective (1/2 relations kept)
- Neighbor selection is most restrictive (2/3 neighbors rejected)
- Final triple formation maintains moderate quality standards
The robot icon suggests AI/ML involvement in the extraction process, while the network diagram indicates complex relationship analysis between entities. The systematic filtering at each stage ensures only high-confidence triples reach the final output, demonstrating a robust knowledge graph construction methodology.
</details>
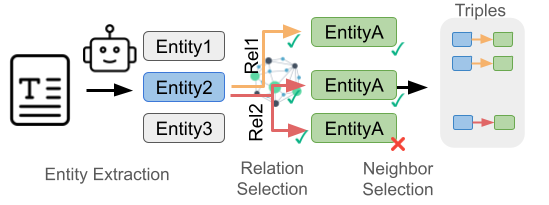
Figure 3: Automatic Graph Exploration. It extracts entities from text (query/thought), then select relevant relations and neighbors with the LLM. The resulting entity-relation-entity combinations form triples to expand the reasoning chain.
Graph exploration proceeds through a multi-step Search + Prune pipeline, inspired by the process described in think-on-graph. For each unvisited entity, the system first retrieves and prunes relation types using LLM guidance. Then, for each selected relation, neighboring entities are discovered and filtered using a second round of pruning. The model selects only the most relevant neighbors based on their contextual fit with the question and previous reasoning steps. This hierarchical pruning – first on relations, then on entities – ensures the method remains computationally tractable while preserving interpretability. The overall traversal follows a breadth-first search (BFS) pattern, with pruning decisions at each level directed by LLM. This process is shown in Figure 3. This iterative reasoning and retrieval process allows the model to condition future steps on progressively relevant subgraphs, shaping the reasoning trajectory. Unlike agentic methods that rely on predefined actions, the automatic approach operates in the graph space guided by the natural language, providing more freedom in the generation. The mechanism is designed to maximize information gain at each step while avoiding graph overgrowth. More details are provided in Algorithm 1.
5 Experiments
Benchmark
We use the GRBench dataset to evaluate our methods. This dataset is specifically designed to evaluate how effectively LLMs can perform stepwise reasoning over domain-specific graphs. It includes several graphs spanning various general domains. For our evaluation, we selected 7 graphs across multiple domains, excluding those with excessively high RAM requirements that exceed our available resources. Comprehensive graph statistics are provided in Appendix A.
Baselines
The proposed methods, Agent and Automatic Graph Exploration, applied to CoT, ToT, and GoT, are compared against the following baseline methods: (1) Zero-Shot: Directly querying the model to answer the question without additional context. (2) Text RAG rag_sruvey: Text-retrieval method that uses text representation of nodes as input for query, with retrieved data serving as context for the model. (3) Graph RAG: Includes node neighbors (1-hop) for additional context beyond Text RAG. (4) Graph CoT (Agent): Implements Graph CoT as an agent for CoT reasoning, utilizing the actions described in Section 4.2. These baselines allow us to measure impact of stepwise, knowledge-grounded reasoning versus simple retrieval-augmented or zero-shot approaches.
Experimental methods
We implement the methods described in Section 4, extending (1) Agent and (2) Automatic Graph Exploration with various reasoning strategies during inference: (1) CoT, (2) ToT, and (3) GoT. For ToT and GoT, we evaluate the impact of stepwise decision-making using State Evaluation methods: (1) Selection and (2) Score. In the results presented in Table 1, we set $n=10$ steps for all methods. ToT and GoT use a branching factor and Selection of $k=t=3$ . Our experiments focus on the effect of structured reasoning interventions on performance and stepwise refinement of answers. We use only open-access Llama 3.1 (Instruct) llama3models as the backend models, which enhances reproducibility and allows for unlimited free calls. Specifically, we employ the 8B, 70B, and 405B versions, using the FP8 variant for the 405B model.
Evaluation
We use rule-based and model-based metrics to evaluate the models, following GRBench paper graphCoT. For the rule-based metric, we use Rouge-L (R-L) (rouge_metric), which measures the longest sequence of words appearing in same order in both generated text and ground truth answer. For model-based metric, we prompt GPT-4o to assess if the model’s output matches ground truth answer. GPT4Score is percentage of answers that GPT-4o identifies as correct. These evaluation methods capture not only final answer accuracy but also the fidelity of reasoning steps, reflecting the effectiveness of our interventions in guiding LLM reasoning over structured knowledge.
Implementation Details
The experiments are run on NVIDIA TITAN RTX or NVIDIA A100 using Python 3.8. The models are deployed with vLLM vllm, a memory-efficient library for LLM inference and serving. For the baseline, Mpnet-v2 is used as the retriever, and FAISS faiss is employed for indexing.
6 Results
The main results from both the baselines and experimental methods, evaluated using R-L, are presented in Table 1. For brevity, additional results using GPT4Score can be found in Appendix D. Together, these findings allow us to compare different forms of reasoning interventions, agentic action selection, automatic graph exploration, and structured multi-path search, on their ability to guide LLMs toward accurate answers. We highlight three key insights from the findings: (1) The agentic method generally outperformed automatic graph exploration, indicating that targeted interventions on knowledge graph traversal enhance answer accuracy. (2) The ToT strategy demonstrated superior performance by effectively exploring multiple reasoning paths, showcasing the benefits of inference-time interventions that diversify reasoning trajectories. (3) Although GoT strategy showed potential, it did not significantly outperform ToT, suggesting that merging divergent reasoning paths remains a challenging intervention design problem. These results show the importance of reasoning strategies in enabling LLMs to navigate multiple paths in the graph, while also illustrating the limits of current intervention techniques.
| | Method | | Model | Healthcare | Goodreads | Biology | Chemistry | Materials Science | Medicine | Physics |
| --- | --- | --- | --- | --- | --- | --- | --- | --- | --- | --- |
| Baselines | | Llama 3.1 8B-Ins | 7.32 | 6.18 | 10.68 | 11.69 | 8.95 | 8.77 | 11.52 | |
| Base | Llama 3.1 70B-Ins | 9.74 | 9.79 | 11.49 | 12.58 | 10.40 | 12.21 | 12.61 | | |
| Llama 3.1 405B-Ins | 8.66 | 12.49 | 10.52 | 13.51 | 11.73 | 11.82 | 11.63 | | | |
| Llama 3.1 8B-Ins | 8.24 | 14.69 | 12.43 | 11.42 | 9.46 | 10.75 | 11.29 | | | |
| Text-RAG | Llama 3.1 70B-Ins | 10.32 | 18.81 | 11.87 | 16.35 | 12.25 | 12.77 | 12.54 | | |
| Llama 3.1 405B-Ins | 11.61 | 16.23 | 16.11 | 13.82 | 14.23 | 15.16 | 16.32 | | | |
| Llama 3.1 8B-Ins | 12.94 | 22.30 | 30.72 | 34.46 | 30.20 | 25.81 | 33.49 | | | |
| Graph-RAG | Llama 3.1 70B-Ins | 17.95 | 25.36 | 38.88 | 40.90 | 41.09 | 31.43 | 39.75 | | |
| Llama 3.1 405B-Ins | 16.12 | 23.13 | 37.57 | 42.58 | 37.74 | 33.34 | 40.98 | | | |
| Graph CoT | | Llama 3.1 8B-Ins | 16.83 | 30.91 | 20.15 | 18.43 | 26.29 | 14.95 | 21.41 | |
| Agent | Llama 3.1 70B-Ins | 33.48 | 40.98 | 50.00 | 51.53 | 49.6 | 48.27 | 44.35 | | |
| Llama 3.1 405B-Ins | 28.41 | 36.56 | 41.35 | 48.36 | 47.81 | 42.54 | 35.24 | | | |
| Graph Explore | Llama 3.1 8B-Ins | 25.58 | 32.34 | 36.65 | 35.33 | 31.06 | 31.05 | 35.96 | | |
| Llama 3.1 70B-Ins | 29.41 | 29.60 | 44.63 | 49.49 | 39.23 | 38.87 | 45.52 | | | |
| Llama 3.1 405B-Ins | 28.45 | 43.06 | 36.93 | 38.71 | 47.49 | 55.66 | 32.73 | | | |
| Graph ToT | Agent | Score | Llama 3.1 8B-Ins | 28.91 | 52.25 | 43.81 | 44.18 | 43.49 | 36.07 | 39.56 |
| Llama 3.1 70B-Ins | 38.51 | 51.58 | 64.44 | 61.13 | 55.19 | 63.00 | 55.33 | | | |
| Llama 3.1 405B-Ins | 47.51 | 50.73 | 70.34 | 64.9 | 49.02 | 65.40 | 44.63 | | | |
| Select | Llama 3.1 8B-Ins | 28.67 | 50.59 | 42.33 | 37.07 | 40.81 | 33.17 | 36.50 | | |
| Llama 3.1 70B-Ins | 40.26 | 52.59 | 64.53 | 66.84 | 61.42 | 61.21 | 55.89 | | | |
| Llama 3.1 405B-Ins | 46.90 | 51.68 | 70.27 | 67.95 | 63.74 | 64.23 | 59.56 | | | |
| Graph Explore | Score | Llama 3.1 8B-Ins | 24.49 | 36.80 | 35.81 | 36.41 | 34.28 | 34.49 | 37.69 | |
| Llama 3.1 70B-Ins | 32.79 | 38.19 | 53.83 | 58.25 | 48.55 | 52.18 | 48.07 | | | |
| Llama 3.1 405B-Ins | 33.90 | 42.68 | 46.87 | 57.43 | 50.46 | 55.56 | 48.73 | | | |
| Select | Llama 3.1 8B-Ins | 25.04 | 37.8 | 36.34 | 38.5 | 32.44 | 33.31 | 34.85 | | |
| Llama 3.1 70B-Ins | 33.40 | 39.13 | 54.78 | 58.53 | 47.19 | 51.13 | 47.51 | | | |
| Llama 3.1 405B-Ins | 33.82 | 43.63 | 44.47 | 59.06 | 48.52 | 55.62 | 46.07 | | | |
Table 1: Rouge-L (R-L) performance results on GRBench, comparing standard LLMs, Text-RAG, Graph-RAG, Graph-CoT, and Graph-ToT. Experiments are described in Section 5, using LLama 3.1 - Instruct backbone models with sizes 8B, 70B, and 405B-FP8.
Agent vs Graph Search
In our experimental results, the agentic method outperformed graph exploration approach across most datasets and reasoning strategies. The agent-based method, which involves LLM selecting specific actions to interact with KG, consistently improves performance as the number of reasoning steps increases, as shown in Section 7. This highlights that explicit, model-driven interventions are more effective than passive expansion strategies, as they promote iterative refinement and selective focus. While graph exploration can quickly provide broad coverage, the agentic method’s targeted, stepwise interactions yield more accurate and comprehensive answers over longer sequences of reasoning.
Tree of Thought (ToT)
The ToT reasoning strategy showed superior performance across its various interaction methods and state evaluators, as summarized in Table 1. ToT achieved performance improvements of 54.74% in agent performance and 11.74% in exploration mode compared to the CoT baseline. However, this improvement comes with the trade-off of increased inference time, highlighting the cost of inference-time reasoning interventions. The success of ToT illustrates how branching interventions that explore multiple candidate paths can substantially enhance reasoning accuracy, especially when coupled with evaluators that prune unpromising trajectories. We also compared the two State Evaluation methods (Selection and Score), finding complementary benefits depending on dataset and scale.
| Method | Model | Healthcare | Biology | |
| --- | --- | --- | --- | --- |
| Agent | Score | Llama 3.1 8B-Ins | 29.11 | 33.25 |
| Llama 3.1 70B-Ins | 30.88 | 56.64 | | |
| Llama 3.1 405B-Ins | 43.53 | 48.1 | | |
| Select | Llama 3.1 8B-Ins | 29.05 | 40.37 | |
| Llama 3.1 70B-Ins | 40.74 | 65.59 | | |
| Llama 3.1 405B-Ins | 47.63 | 71.49 | | |
| Graph Explore | Score | Llama 3.1 8B-Ins | 24.96 | 21.72 |
| Llama 3.1 70B-Ins | 31.24 | 50.70 | | |
| Llama 3.1 405B-Ins | 35.00 | 39.10 | | |
| Select | Llama 3.1 8B-Ins | 25.06 | 21.84 | |
| Llama 3.1 70B-Ins | 36.95 | 52.32 | | |
| Llama 3.1 405B-Ins | 33.74 | 54.64 | | |
Table 2: Graph-GoT results on GRBench using Rouge-L
Graph of Thought (GoT)
The results for GoT strategy are summarized in Table 2. Due to the additional computational cost, we report results for two datasets only. GoT did not outperform ToT. Our initial hypothesis was that LLMs could integrate divergent results from multiple branches, but in practice the models struggled to merge these effectively. Specifically, in the graph exploration setting, models often failed to combine different triples found in separate branches. This reveals a current limitation of reasoning interventions based on aggregation: while branching helps discover diverse facts, robust mechanisms for synthesis and reconciliation are still underdeveloped. This finding opens a direction for future research into more advanced intervention strategies for merging partial reasoning outcomes.
7 Analysis & Ablation studies
In this section, we want to better understand the nuances of our methods for LLM and KG grounding. We conduct an analysis on the Academic datasets from the benchmark, as they all contain the same number of samples and feature questions generated from similar templates to ensure a controlled comparison.
<details>
<summary>figures/analysis_steps_academic_rl.png Details</summary>
### Visual Description
## Line Graph: Rouge-L Performance Comparison
### Overview
The image displays a line graph comparing the performance of two entities ("Agent" and "Explore") across 10 steps, measured by the metric "Rouge-L". The graph includes shaded confidence intervals around each line, indicating variability in measurements.
### Components/Axes
- **X-axis (Steps)**: Labeled "Steps", with integer markers from 1 to 10.
- **Y-axis (Rouge-L)**: Labeled "Rouge-L", with a scale from 0 to 60 in increments of 10.
- **Legend**: Located in the bottom-right corner, with:
- **Blue line with circles**: Labeled "Agent"
- **Orange line with squares**: Labeled "Explore"
- **Shaded Regions**: Light blue (Agent) and light orange (Explore) bands around the lines, representing confidence intervals.
### Detailed Analysis
#### Agent (Blue Line)
- **Step 1**: ~0
- **Step 3**: ~15
- **Step 5**: ~45
- **Step 10**: ~55
- **Trend**: Sharp upward trajectory after Step 3, with a plateau near 55 by Step 10. Confidence interval widens significantly after Step 5.
#### Explore (Orange Line)
- **Step 1**: ~40
- **Step 3**: ~48
- **Step 5**: ~50
- **Step 10**: ~50
- **Trend**: Gradual increase until Step 5, followed by a plateau. Confidence interval remains relatively narrow throughout.
### Key Observations
1. **Agent's Acceleration**: The Agent's performance surges after Step 5, surpassing Explore by Step 10.
2. **Explore's Stability**: Explore's performance plateaus at ~50 after Step 5, showing minimal improvement.
3. **Confidence Intervals**: Agent's uncertainty (shaded blue) increases markedly after Step 5, while Explore's remains consistent.
### Interpretation
The data suggests that the Agent's strategy becomes more effective over time, particularly after Step 5, where its performance overtakes Explore. The initial lower performance of the Agent (Step 1–3) may reflect an exploration or adaptation phase. In contrast, Explore's plateau indicates diminishing returns or a lack of adaptability in later steps. The widening confidence interval for the Agent implies increasing variability in its performance as steps progress, potentially due to complex decision-making or environmental changes. This graph highlights the importance of dynamic optimization in achieving superior long-term outcomes compared to static strategies.
</details>
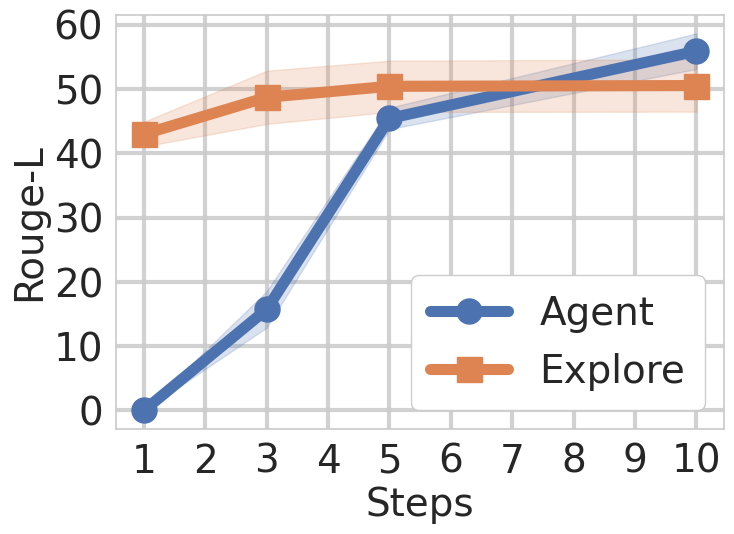
Figure 4: Effect of the number of steps in the LLM-KG Interaction Methods. The Agent requires more steps to obtain the performance of the Graph Exploration, while the Graph Exploration only needs the anchor entities to perform the search within the graph.
<details>
<summary>figures/search_depth_academic_rl.png Details</summary>
### Visual Description
## Line Graph: Explore Performance vs. Search Depth
### Overview
The image depicts a line graph illustrating the relationship between "Search Depth" (x-axis) and "Rouge-L" scores (y-axis). A blue line labeled "Explore" represents the central trend, while a light blue shaded area labeled "SD (σ)" indicates variability (standard deviation). The graph spans Search Depth values 1–5 and Rouge-L scores from 30–70.
### Components/Axes
- **X-axis (Search Depth)**: Integer values 1–5, labeled "Search Depth."
- **Y-axis (Rouge-L)**: Continuous scale from 30–70, labeled "Rouge-L."
- **Legend**:
- "Explore": Blue line with circular markers.
- "SD (σ)": Light blue shaded area representing standard deviation.
- **Placement**: Legend is positioned in the top-left corner of the graph.
### Detailed Analysis
- **Data Points (Explore)**:
- Search Depth 1: ~36
- Search Depth 2: ~41
- Search Depth 3: ~43
- Search Depth 4: ~43
- Search Depth 5: ~43
- **Trend**: The "Explore" line shows a gradual upward slope from Search Depth 1 to 2, followed by a plateau from 3–5. The shaded area (SD) remains consistent in width (~2–3 units) across all Search Depths, indicating stable variability.
### Key Observations
1. **Initial Growth**: Rouge-L scores increase by ~5 units between Search Depth 1 and 2.
2. **Plateau Effect**: Scores stabilize at ~43 from Search Depth 3 onward.
3. **Consistent Variability**: The standard deviation (shaded area) does not widen significantly, suggesting minimal fluctuation in performance across depths.
### Interpretation
The data suggests that the "Explore" method achieves its highest performance gain when increasing Search Depth from 1 to 2, after which further depth yields diminishing returns. The stable standard deviation implies that the method’s results are relatively consistent, with no significant outliers or anomalies. This could indicate that the Explore algorithm’s effectiveness plateaus at moderate search depths, making deeper searches computationally inefficient unless additional gains are prioritized.
</details>
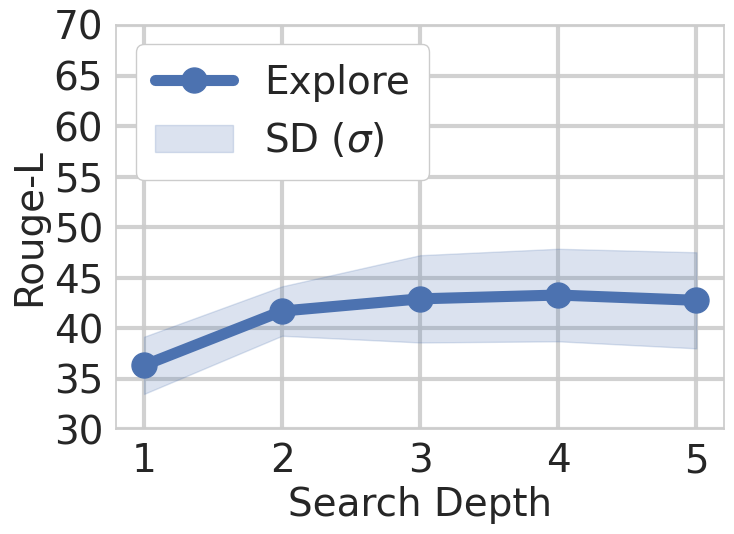
Figure 5: Effect of the Search depth in Graph Exploration interaction method for a fixed steps number. The method can achieve relatively good performance with the anchor entities extracted from the question.
How does the number of steps affect the results?
We observe in Figure 5 the effect of varying the number of steps in the KG interaction methods (Agent, Explore) across all academic datasets. The plots indicate that graph exploration performs better with fewer steps, as it automatically traverses the graph for the identified anchor entities. Conversely, the agentic methods improve as the number of steps increases, eventually achieving better performance. This validates our framework’s design choice to support both exploration and agentic strategies, each excels in complementary regimes.
<details>
<summary>figures/tree_width_academic_rl.png Details</summary>
### Visual Description
## Line Graph: Rouge-L vs Tree Width
### Overview
The image is a line graph comparing the performance metric "Rouge-L" across different "Tree Width" values (1–5). It includes three data series: a primary line labeled "ToT-Explore," a shaded region labeled "SD (σ)," and discrete points labeled "CoT." The graph emphasizes trends in Rouge-L scores as Tree Width increases.
### Components/Axes
- **X-axis (Tree Width)**: Discrete values from 1 to 5, labeled "Tree Width."
- **Y-axis (Rouge-L)**: Continuous scale from 30 to 70, labeled "Rouge-L."
- **Legend**: Located in the bottom-right corner, with three entries:
- **ToT-Explore**: Orange line with circular markers.
- **SD (σ)**: Light orange shaded area.
- **CoT**: Orange crosses (×).
- **Gridlines**: Gray horizontal and vertical lines for reference.
### Detailed Analysis
1. **ToT-Explore (Orange Line)**:
- Starts at **~45** when Tree Width = 1.
- Increases steadily to **~60** by Tree Width = 5.
- Slope: Gradual upward trend with minor fluctuations (e.g., slight dip at Tree Width = 4).
- Key data points:
- Tree Width 1: ~45
- Tree Width 2: ~58
- Tree Width 3: ~60
- Tree Width 4: ~61
- Tree Width 5: ~60
2. **SD (σ) (Light Orange Shaded Area)**:
- Represents variability around the ToT-Explore line.
- Width decreases as Tree Width increases:
- Widest at Tree Width = 1 (~±5 units).
- Narrowest at Tree Width = 5 (~±3 units).
3. **CoT (Orange Crosses)**:
- Two points:
- Tree Width 1: ~45 (matches ToT-Explore's starting value).
- Tree Width 5: ~60 (matches ToT-Explore's ending value).
- No intermediate values plotted.
### Key Observations
- **ToT-Explore** shows a consistent upward trend, with a plateau at Tree Width = 5.
- **SD (σ)** indicates decreasing variability in performance as Tree Width increases.
- **CoT** aligns with ToT-Explore's endpoints but lacks intermediate data, suggesting limited comparison points.
### Interpretation
The graph demonstrates that **ToT-Explore** improves in Rouge-L scores as Tree Width increases, with diminishing returns after Tree Width = 3. The narrowing SD region implies greater consistency in performance at higher Tree Widths. The CoT points at Tree Widths 1 and 5 suggest that CoT's performance matches ToT-Explore's at these extremes but does not provide insight into intermediate values. This could indicate that CoT is either equivalent to ToT-Explore at these points or that intermediate Tree Widths are not tested for CoT. The overall trend supports the hypothesis that wider trees enhance performance, but the benefits stabilize beyond a certain width.
</details>
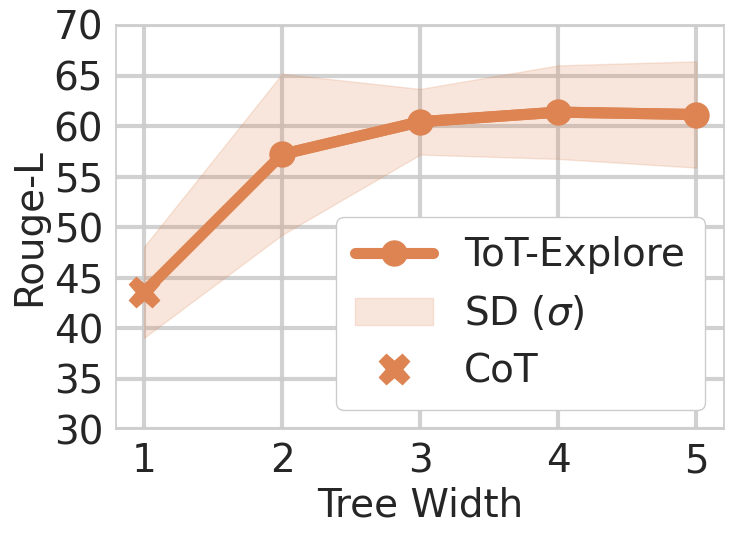
Figure 6: Impact of tree width on Agentic ToT performance. It shows a general trend of performance improvement with increasing tree width.
<details>
<summary>figures/state_evaluators.png Details</summary>
### Visual Description
## Bar Chart: Agent and Explore Performance by Model Size
### Overview
The image is a grouped bar chart comparing the performance of three model sizes (8B, 70B, 405B) across two tasks ("Agent" and "Explore") using two metrics: "Score" (solid bars) and "Select" (striped bars). The y-axis measures "Rouge-L" (a text generation evaluation metric), and the x-axis categorizes data by model size and task.
### Components/Axes
- **X-axis**: Model sizes (8B, 70B, 405B) grouped under "Agent" and "Explore" tasks.
- **Y-axis**: Rouge-L scores (range: 30–70).
- **Legend**:
- Solid blue bars: "Score"
- Striped orange bars: "Select"
- **Error Bars**: Vertical lines with caps on top of each bar, indicating variability.
### Detailed Analysis
#### Agent Task
- **8B**:
- Score (blue): ~40 (error ±3)
- Select (orange): ~38 (error ±2)
- **70B**:
- Score (blue): ~60 (error ±4)
- Select (orange): ~62 (error ±3)
- **405B**:
- Score (blue): ~58 (error ±3)
- Select (orange): ~65 (error ±4)
#### Explore Task
- **8B**:
- Score (blue): ~35 (error ±2)
- Select (orange): ~33 (error ±1)
- **70B**:
- Score (blue): ~52 (error ±3)
- Select (orange): ~51 (error ±2)
- **405B**:
- Score (blue): ~51 (error ±2)
- Select (orange): ~50 (error ±3)
### Key Observations
1. **Model Size Impact**: Larger models (70B, 405B) consistently outperform smaller models (8B) in both tasks.
2. **Metric Comparison**:
- "Select" (orange) generally scores higher than "Score" (blue) across all model sizes and tasks.
- Exception: In the "Agent" task, the 8B model's "Score" (40) slightly exceeds its "Select" (38).
3. **Error Variability**: Larger models (405B) exhibit greater variability in "Select" scores (error ±4) compared to smaller models.
### Interpretation
The data suggests that model size is a critical factor in performance, with larger models achieving higher Rouge-L scores. The "Select" metric consistently outperforms "Score," except in the smallest model (8B) for the "Agent" task. The error bars indicate that while variability increases with model size, the trends remain robust. This implies that scaling model size improves performance, but the choice between "Score" and "Select" may depend on task-specific requirements or evaluation criteria.
</details>
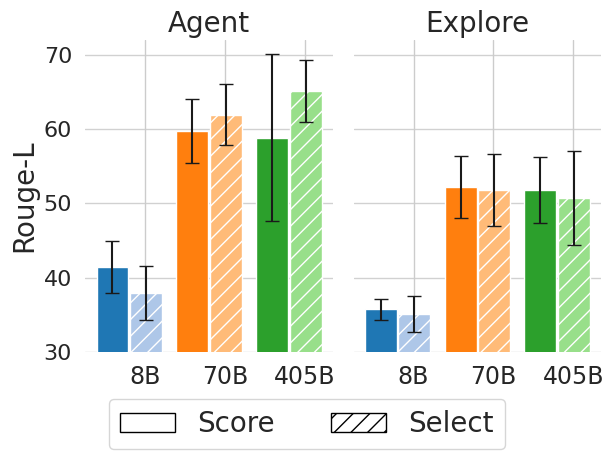
Figure 7: Influence of the State Evaluators in ToT. The Select method obtains better results over Score method.
What is the effect of Search Depth in Automatic Graph Exploration?
We observe the effect of search depth in Figure 5, which presents performance results across various depths, with fixed step size of one. The results demonstrate that the performance of depth-first search plateaus at depth of 3, highlighting the relevance of search exploration with respect to the given query. Beyond this point, deeper traversal yields no significant gains, likely due to diminishing relevance of distant nodes. This shows why shallow, targeted exploration is sufficient in our framework, keeping search efficient without sacrificing accuracy.
What is the effect of tree width in the reasoning strategy (ToT)?
Based on experimental results across all academic datasets, we observe performance variations among different methods. To gain further insight, we observe in Figure 7 the effect of tree width on results. We notice a slight upward trend in performance as the tree width increases, although the difference is more pronounced between CoT and ToT itself, going from one branch to two. The added computational time and resources likely contribute to this performance enhancement.
What is the influence of the state evaluator?
We observe in Figure 7 the impact of state evaluators, specifically Score and Select, within the ToT framework. The analysis indicates that, while there is no significant difference between the two methods, the Select evaluator generally yields slightly better results. This trend is especially evident in the context of the Agent’s performance, though the advantage is less pronounced in automatic graph exploration.
How are errors different for each strategy?
<details>
<summary>figures/pie_cot.png Details</summary>
### Visual Description
## Pie Chart: Distribution of Categories
### Overview
The image displays a pie chart with three distinct segments, each labeled with a percentage. The chart visually represents the distribution of three categories, with the largest segment occupying the majority of the chart, a medium-sized segment, and a very small segment. The colors of the segments are teal, blue, and orange, respectively.
### Components/Axes
- **Legend**: Located at the top of the chart, with percentages written in black text. The legend does not include explicit category labels but directly associates percentages with their corresponding segments.
- **Segments**:
- **Teal Segment**: Largest portion, labeled **60.4%**.
- **Blue Segment**: Medium portion, labeled **34.1%**.
- **Orange Segment**: Smallest portion, labeled **5.5%**.
- **Color Coding**:
- Teal (60.4%) is the dominant color.
- Blue (34.1%) is the second-largest.
- Orange (5.5%) is the smallest.
### Detailed Analysis
- **Teal Segment (60.4%)**: Occupies the left side of the chart, covering approximately 60% of the total area. Its size and position emphasize its dominance.
- **Blue Segment (34.1%)**: Positioned on the right side, it accounts for roughly one-third of the chart. Its placement and size suggest it is a significant but secondary category.
- **Orange Segment (5.5%)**: A small slice at the top of the chart, visually distinct due to its size and color. It represents the smallest portion of the distribution.
### Key Observations
1. **Dominance of Teal**: The teal segment (60.4%) is the largest, indicating it constitutes the majority of the data.
2. **Significant Blue Portion**: The blue segment (34.1%) is the second-largest, representing a substantial but smaller share.
3. **Minor Orange Slice**: The orange segment (5.5%) is negligible in size, highlighting its minimal contribution.
4. **Sum of Percentages**: The total of all segments (60.4% + 34.1% + 5.5%) equals 100%, confirming the chart's accuracy.
### Interpretation
The chart illustrates a clear hierarchical distribution:
- **Teal (60.4%)** is the primary category, suggesting it dominates the dataset (e.g., market share, survey responses, or resource allocation).
- **Blue (34.1%)** represents a secondary but notable portion, indicating a secondary but significant factor.
- **Orange (5.5%)** is a minor outlier, possibly representing an edge case or a small subset of the data.
The spatial arrangement (teal on the left, blue on the right, orange at the top) reinforces the visual hierarchy, with the largest segment positioned to draw immediate attention. The absence of explicit category labels in the legend implies that the percentages themselves serve as the primary identifiers, which may require additional context for interpretation (e.g., what the categories represent). The data suggests a scenario where one category is overwhelmingly dominant, while the others are comparatively smaller, with the smallest segment being particularly marginal.
</details>
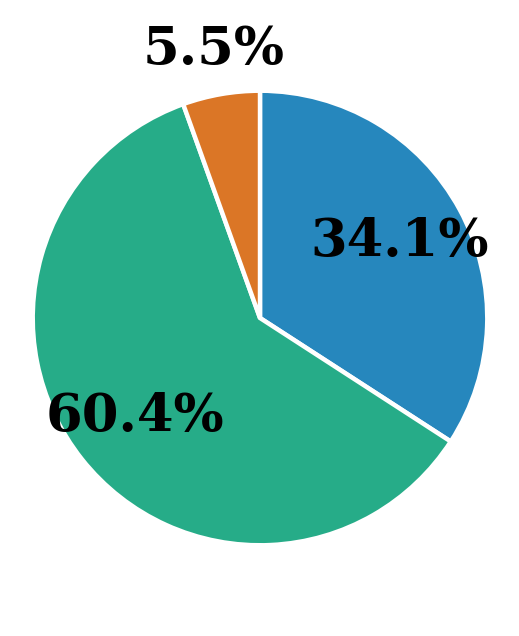
(a) CoT
<details>
<summary>figures/pie_tot.png Details</summary>
### Visual Description
## Pie Chart: Distribution of Categories
### Overview
The image displays a pie chart divided into three distinct segments, each labeled with a percentage. The chart visually represents the proportional distribution of three categories, with the largest segment occupying the majority of the circle.
### Components/Axes
- **Segments**: Three colored sections (teal, orange, blue) representing different categories.
- **Percentages**: Labeled directly on each segment in black text.
- **Colors**:
- Teal (#008080) for the largest segment.
- Orange (#FFA500) for the second segment.
- Blue (#0000FF) for the smallest segment.
- **No explicit legend** is present, but colors are directly associated with their respective percentages.
### Detailed Analysis
1. **Teal Segment (67.8%)**:
- Occupies the largest portion of the pie chart, positioned at the bottom-right quadrant.
- Labeled with "67.8%" in black text.
2. **Orange Segment (21.3%)**:
- Located in the top-left quadrant, adjacent to the teal segment.
- Labeled with "21.3%" in black text.
3. **Blue Segment (10.9%)**:
- Smallest segment, positioned in the top-right quadrant.
- Labeled with "10.9%" in black text.
### Key Observations
- The teal segment dominates the chart, accounting for **67.8%** of the total, significantly larger than the other two categories.
- The orange segment (21.3%) is the second-largest, while the blue segment (10.9%) is the smallest.
- Percentages sum to **100%**, confirming a complete distribution.
### Interpretation
The chart suggests a hierarchical distribution where the teal category is the dominant group, potentially representing a majority in a dataset (e.g., market share, survey responses, or resource allocation). The orange and blue segments represent smaller, secondary categories. The stark contrast in sizes emphasizes the disparity between the largest and smaller groups. The absence of a legend implies that the colors are self-explanatory within the context of the chart, but additional context (e.g., labels for categories) would enhance clarity.
</details>
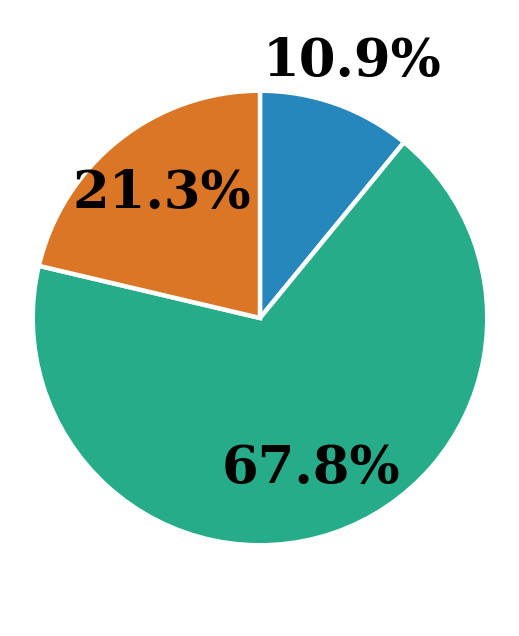
(b) ToT
<details>
<summary>figures/pie_got.png Details</summary>
### Visual Description
## Pie Chart: Distribution of Categories
### Overview
The image displays a pie chart divided into three distinct sections, each labeled with a percentage. The largest section is teal (67.8%), followed by a medium-sized blue section (20.0%), and the smallest orange section (12.2%). The legend is positioned at the top of the chart, with each color explicitly labeled with its corresponding percentage.
### Components/Axes
- **Legend**: Located at the top-center of the chart, the legend uses three colors:
- **Teal**: 67.8%
- **Blue**: 20.0%
- **Orange**: 12.2%
- **Chart Sections**: Each section is separated by thin white borders, with the percentages labeled in black text inside their respective segments.
### Detailed Analysis
1. **Teal Section (67.8%)**:
- Occupies the majority of the pie chart, spanning approximately two-thirds of the circle.
- Positioned as the dominant category, it is visually the largest segment.
2. **Blue Section (20.0%)**:
- Occupies roughly one-fifth of the chart, placed adjacent to the teal section.
- Smaller than the teal section but larger than the orange section.
3. **Orange Section (12.2%)**:
- The smallest segment, occupying the remaining portion of the chart.
- Positioned opposite the teal section, creating a balanced visual distribution.
### Key Observations
- The teal section (67.8%) is significantly larger than the other two categories combined (32.2%).
- The blue and orange sections are roughly in a 1.6:1 ratio (20.0% vs. 12.2%).
- All percentages sum to 100%, confirming the chart represents a complete distribution.
### Interpretation
The data suggests a highly skewed distribution, with one category (teal) dominating the dataset. This could indicate a scenario where a single factor or group accounts for the majority of the total, while the remaining categories represent smaller but notable contributions. The blue section (20.0%) acts as a secondary contributor, while the orange section (12.2%) represents the least significant portion. Such a distribution might highlight imbalances or concentrations in the underlying data, warranting further investigation into the causes of the disparity.
</details>
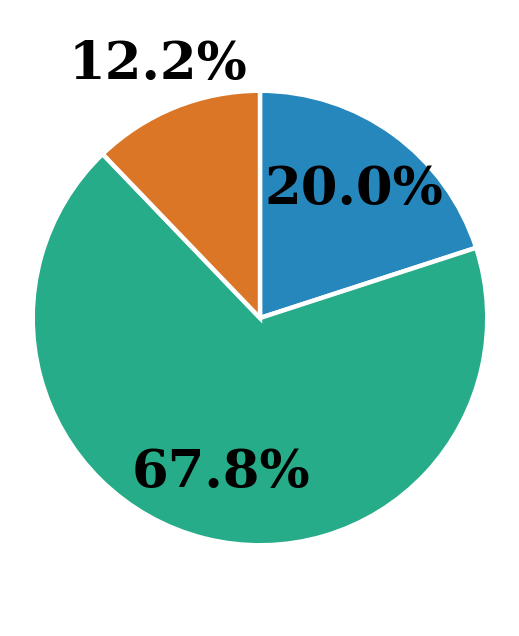
(c) GoT
<details>
<summary>figures/pie_legend.png Details</summary>

### Visual Description
## Diagram: Categorization of System States or Decision Outcomes
### Overview
The image depicts a horizontal bar diagram with three distinct colored rectangles, each labeled with a specific state or outcome. The diagram uses color-coded labels to represent different conditions or errors, likely in a technical or decision-making context.
### Components/Axes
- **Legend/Color Labels**:
- **Blue**: "Reached limit"
- **Green**: "Found answer but not returned"
- **Orange**: "Wrong reasoning"
- **Structure**:
- Three horizontal bars aligned sequentially from left to right.
- No numerical axes or scales present; the diagram focuses on categorical labels.
### Detailed Analysis
- **Blue Bar ("Reached limit")**: Positioned on the far left, this label suggests a state where a predefined threshold or boundary has been exceeded.
- **Green Bar ("Found answer but not returned")**: Located in the center, this indicates a scenario where a solution or result exists but has not been communicated or finalized.
- **Orange Bar ("Wrong reasoning")**: Positioned on the far right, this denotes an error state where the logic or process leading to a conclusion is flawed.
### Key Observations
1. The labels are mutually exclusive, representing distinct stages or error types.
2. The order of the bars (left to right) may imply a progression or hierarchy of states (e.g., escalation from normal operation to error).
3. No numerical data or quantitative metrics are provided, limiting direct statistical interpretation.
### Interpretation
This diagram likely represents a decision tree, error-handling flowchart, or state machine in a technical system. The labels suggest:
- **Blue ("Reached limit")**: A critical condition requiring intervention (e.g., resource exhaustion, timeout).
- **Green ("Found answer but not returned")**: A transitional state where a solution exists but is pending execution or acknowledgment.
- **Orange ("Wrong reasoning")**: A failure state where the system’s logic is invalid, necessitating debugging or recalibration.
The absence of numerical data implies the diagram is conceptual, emphasizing qualitative states over quantitative metrics. The color coding aids in rapid identification of states, which is critical in high-stakes technical environments.
</details>
Figure 8: Error distribution across strategies. ToT and GoT reduce unanswered cases but increase logical errors due to more complex reasoning.
To understand failure patterns, we define three error types: (1) Reached limit — the reasoning hit the step limit; (2) Answer found but not returned — the correct answer appeared but was not output; (3) Wrong reasoning step — the model followed an illogical step. Using GPT-4o, we labeled a larger set of answers and traces. We observe in Figure 8 that ToT and GoT show more “answer found but not returned” cases than CoT, suggesting better retrieval but occasional failures in synthesis. This comes with a slight rise in logical errors, likely due to the complexity of multiple reasoning paths.
8 Limitations
In this work, we demonstrate how LLMs can be used to explore a graph while conditioning the next steps based on the graph’s results. We show that the two approaches presented achieve superior results in graph exploration. Integrating KGs with LLMs can provide complex relational knowledge for LLMs to leverage. However, the overall effectiveness depends heavily on both the coverage and quality of the underlying graph, as well as the capabilities of the language model.
Extending inference-time reasoning methods for LLMs is significantly constrained by computational resources and the time available to the user. We analyze the computational complexity of the methods in Appendix E, where we show the exponential growth of ToT and GoT due to its branching structure. GoT further compounds this by allowing merges between reasoning paths, which increases the total number of evaluations. Additionally, loading large graphs into memory introduces substantial RAM overhead, limiting applicability to resource-rich environments.
While LLMs conditioned on external knowledge can generate outputs based on accessed content, their generated output is not strictly limited to that information. Thus, they may still hallucinate. Our framework helps mitigate this risk by grounding reasoning in explicit graph structure, but does not eliminate it.
9 Conclusion
We present a framework for grounding LLM reasoning in KGs by integrating each step with structured graph retrieval. By combining strategies like CoT, ToT, and GoT with adaptive graph search, our method achieves state-of-the-art performance on GRBench. Beyond performance, we find that explicitly linking reasoning steps to graph structure offers a more interpretable view of how LLMs navigate knowledge. The approach enables inference-time reasoning, offering flexibility across domains, and suggests a path toward reasoning interventions that are both systematic and transparent. Future work includes extending this framework to larger and more heterogeneous graphs, and exploring how structured retrieval can guide reasoning in domains where accuracy and verifiability are critical.
Disclaimers
This [paper/presentation] was prepared for informational purposes [“in part” if the work is collaborative with external partners] by the Artificial Intelligence Research group of JPMorganChase and its affiliates ("JP Morgan”) and is not a product of the Research Department of JP Morgan. JP Morgan makes no representation and warranty whatsoever and disclaims all liability, for the completeness, accuracy or reliability of the information contained herein. This document is not intended as investment research or investment advice, or a recommendation, offer or solicitation for the purchase or sale of any security, financial instrument, financial product or service, or to be used in any way for evaluating the merits of participating in any transaction, and shall not constitute a solicitation under any jurisdiction or to any person, if such solicitation under such jurisdiction or to such person would be unlawful.
©2025 JPMorganChase. All rights reserved
Appendix A GRBench Statistics
Detailed statistics of the graphs in GRBench graphCoT are shown in Table 3. Academic Graphs contain 3 types of nodes: paper, author, venue. Literature Graphs contain 4 types of nodes: book, author, publisher and series. Healthcare Graph contains 11 types of nodes: anatomy, biological process, cellular component, compound, disease, gene, molecular function, pathway, pharmacologic class, side effect, and symptom. Questions are created according to multiple templates labeled as easy, medium, and hard, depending on the number of nodes required to give the answer.
| Domain | Topic | Graph Statistics | Data | | |
| --- | --- | --- | --- | --- | --- |
| # Nodes | # Edges | # Templates | # Questions | | |
| Academic | Biology | $\sim$ 4M | $\sim$ 39M | 14 | 140 |
| Chemistry | $\sim$ 4M | $\sim$ 30M | 14 | 140 | |
| Material Science | $\sim$ 3M | $\sim$ 22M | 14 | 140 | |
| Medicine | $\sim$ 6M | $\sim$ 30M | 14 | 140 | |
| Physics | $\sim$ 2M | $\sim$ 33M | 14 | 140 | |
| Literature | Goodreads | $\sim$ 3M | $\sim$ 22M | 24 | 240 |
| Healthcare | Disease | $\sim$ 47K | $\sim$ 4M | 27 | 270 |
| SUM | - | - | - | 121 | 1210 |
Table 3: Detailed statistics of the GRBench graphCoT.
Appendix B LLM <–> KG Interaction Pipelines
Description of the two LLM + KG Interaction Pipelines in their CoT form:
1. Agent – Figure 9 A pipeline where the LLM alternates between generating a reasoning step, selecting an explicit action (e.g., retrieving a node, checking neighbors), and observing results from the KG until termination.
1. Automatic Graph Exploration – Figure 10. A pipeline where entities are automatically extracted from the LLM’s generated text and used to guide iterative graph traversal with pruning, progressively expanding the reasoning chain.
<details>
<summary>figures/agent_pipeline.png Details</summary>
### Visual Description
## Flowchart: Knowledge Graph Query Processing Workflow
### Overview
The image depicts a cyclical workflow for processing queries using a knowledge graph. It consists of four interconnected stages: **Query**, **Thought**, **Action**, and **Observation**, with feedback loops between stages. Key elements include robotic icons, a knowledge graph visualization, and action-specific operations.
### Components/Axes
1. **Stages**:
- **Query**: Text box labeled "Query" (top-left).
- **Thought**: Text box labeled "Thought" with a robot icon (🤖) and a dog icon (🐶) (center-left).
- **Action**: Text box labeled "Action" with a robot icon (🤖) and a dropdown list of operations (center-right).
- **Observation**: Text box labeled "Observation" with a robot icon (🤖) and a knowledge graph visualization (bottom-right).
2. **Knowledge Graph**:
- Nodes: Colored in green (primary), blue (secondary), and gray (tertiary).
- Edges: Connect nodes with varying line weights.
- Positioned in the "Observation" box.
3. **Action Operations**:
- Dropdown list includes:
- `RetrieveNode[Text]`
- `NodeFeature[N,F]`
- `NeighborCheck[N,E]`
- `NodeDegree[N,E]`
- `Finish[answer]`
### Detailed Analysis
- **Flow Direction**:
- Arrows connect stages sequentially: `Query → Thought → Action → Observation → Thought` (loop).
- Feedback loop from "Observation" back to "Thought" suggests iterative refinement.
- **Textual Elements**:
- All labels are in English. No non-English text detected.
- Action operations use bracketed parameters (e.g., `[N,F]` for node features).
- **Visual Elements**:
- Robot icons (🤖) appear in "Thought" and "Action" stages, symbolizing AI processing.
- Dog icon (🐶) in "Thought" may represent user/system interaction.
- Knowledge graph nodes/edges use distinct colors for categorization.
### Key Observations
1. **Iterative Process**: The loop from "Observation" to "Thought" implies continuous refinement of queries based on retrieved data.
2. **Action Specificity**: The dropdown operations suggest granular control over knowledge graph interactions (e.g., retrieving node features, checking neighbors).
3. **Knowledge Graph Structure**: Colored nodes and edges indicate hierarchical or categorical relationships within the graph.
### Interpretation
This workflow illustrates a closed-loop system for query resolution using a knowledge graph. The "Thought" stage likely involves AI-driven analysis (robot icon), while the "Action" stage executes specific graph operations. The knowledge graph visualization in "Observation" provides structured data for feedback, enabling the system to refine its approach iteratively. The inclusion of a dog icon in "Thought" may symbolize user/system collaboration or contextual awareness.
**Critical Note**: The absence of numerical data or explicit trends suggests this is a conceptual workflow rather than a data-driven analysis. The focus is on process design and component interactions.
</details>
Figure 9: Agent Pipeline: (1) Input Query, (2) Thought Generation (3) Action Selection, (4) Environment Observation from the Knowledge Graph. The process is repeated until termination action is generated or limit reached.
<details>
<summary>figures/graph_explore_pipeline.png Details</summary>
### Visual Description
## Flowchart: Automated Query Processing Workflow
### Overview
The image depicts a linear workflow diagram with five sequential steps, each represented by a labeled box connected by arrows. A "Knowledge Graph" visual element is positioned below the flowchart, connected to the "Graph Search" step. Robot emojis (🤖) are embedded in each step box, suggesting automation or AI involvement.
### Components/Axes
1. **Steps/Nodes**:
- Query (top-left)
- Thought (center-left)
- Entity Extraction (center)
- Graph Search (center-right)
- End? (top-right)
2. **Arrows**:
- Directed flow from left to right, top to bottom
- Feedback loop from "End?" back to "Thought"
3. **Visual Elements**:
- Robot emojis (🤖) in each step box
- Knowledge Graph (bottom-center): A network diagram with green/blue nodes and gray edges
### Detailed Analysis
1. **Query → Thought**:
- Input query triggers initial processing ("Thought" step)
2. **Thought → Entity Extraction**:
- Processed query leads to entity identification
3. **Entity Extraction → Graph Search**:
- Extracted entities inform knowledge graph queries
4. **Graph Search → End?**:
- Search results determine process termination
5. **Feedback Loop**:
- "End?" connects back to "Thought" for potential iteration
### Key Observations
- **Automation Theme**: Consistent robot emojis suggest AI/ML integration throughout the process
- **Knowledge Graph Dependency**: The network diagram implies structured data relationships are critical for the Graph Search step
- **Iterative Potential**: Feedback loop indicates possible cyclical processing until termination conditions are met
- **Ambiguous Terminology**: "Thought" and "End?" steps lack specific definitions in the diagram
### Interpretation
This flowchart represents an automated information retrieval system where:
1. Queries are processed through successive stages of analysis
2. Entity recognition feeds into knowledge graph queries
3. The system may iterate between "Thought" and "End?" based on search results
4. The Knowledge Graph serves as the authoritative data source for the Graph Search step
The diagram emphasizes machine-driven decision-making, with human intervention implied only at the initial Query stage. The lack of explicit termination criteria in the "End?" box suggests either:
- A binary yes/no decision point
- A confidence threshold for result acceptance
- A placeholder for additional conditional logic
The Knowledge Graph's central position highlights its importance as the system's knowledge base, while the robot emojis reinforce the theme of automated cognitive processing.
</details>
Figure 10: Automatic Graph Exploration Pipeline: (1) Input Query, (2) Thought Generation, (3) Entity Extraction (from query or thought with LLM), (4) Automatic Graph Search as described in Algorithm 1 (5) Query LLM for answer or continue
Algorithm 1 presents the pseudocode for the Automatic Graph Exploration described in Section 4.2.2.
Algorithm 1 Graph Exploration Algorithm
1: procedure GraphExplore ( $LLM,seen\_entities,search\_depth$ )
2: $relevant\_attributes$ , $found\_triples← 0$
3: for $depth$ in $search\_depth$ do
4: for $entity$ in $seen\_entities$ do
5: if $seen\_entities[entity\_id].visited$ == True then
6: Continue
7: else
8: $seen\_entities[entity]←$ Visited
9: end if
10: $head\_entity\_name$ , $entity\_attributes$ , $neighbors←$ Graph[ $entity$ ]
11: $pruned\_neighbors←$ prune_relations( $LLM,neighbors$ )
12: $pruned\_neighbors←$ prune_entities( $LLM,pruned\_neighbors$ )
13: $found\_triples←$ generate_triples( $entity,pruned\_neighbros$ )
14: end for
15: $seen\_entities←$ Update( $seen\_entities$ , neighbors)
16: if End?( $LLM,found\_triples,relevant\_attributes$ ) == True then
17: break
18: end if
19: end for
20: return $found\_triples,relevant\_attributes,seen\_entities$
21: end procedure
Appendix C Performance results in plots
Figures 11 and 12 illustrate the performance results using the Rouge-L and GPT4score metrics, respectively, for the healthcare graph for all methods. The results were run on the LLama 3.1 Instruct models (8B, 70B, and 405B-FP8) and demonstrate the improved performance achieved through more complex reasoning and search strategies during inference.
<details>
<summary>figures/healthcare_rl_all.png Details</summary>
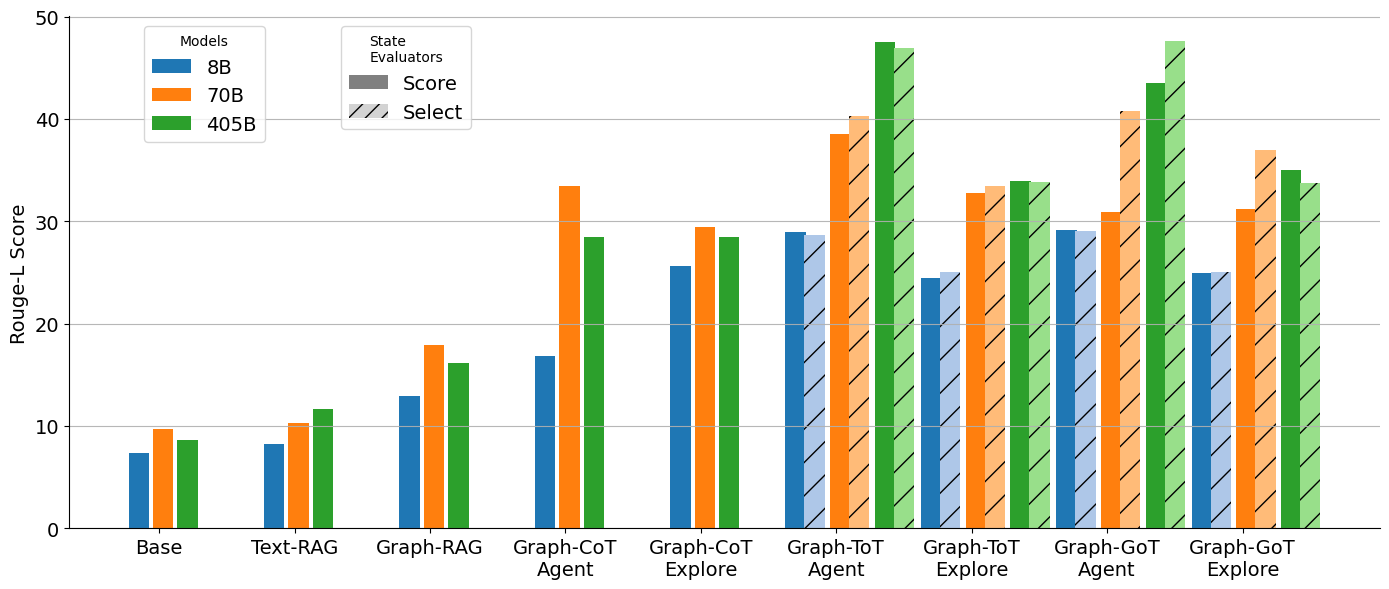
### Visual Description
## Bar Chart: Rouge-L Score Comparison Across Models and Tasks
### Overview
The chart compares Rouge-L scores for three models (8B, 70B, 405B) across 10 evaluation tasks. Tasks include Base, Text-RAG, Graph-RAG, Graph-CoT Agent/Explore, Graph-ToT Agent/Explore, and Graph-GoT Agent/Explore. The y-axis ranges from 0 to 50, with higher scores indicating better performance.
### Components/Axes
- **X-axis (Tasks)**: Base, Text-RAG, Graph-RAG, Graph-CoT Agent, Graph-CoT Explore, Graph-ToT Agent, Graph-ToT Explore, Graph-GoT Agent, Graph-GoT Explore.
- **Y-axis (Rouge-L Score)**: 0–50 scale.
- **Legend**:
- Blue = 8B model
- Orange = 70B model
- Green = 405B model
- **State Evaluators**: Score (solid bars) and Select (striped bars, not visible in data).
### Detailed Analysis
| Task | 8B | 70B | 405B |
|-----------------------|------|------|------|
| Base | ~7 | ~10 | ~9 |
| Text-RAG | ~8 | ~10 | ~12 |
| Graph-RAG | ~13 | ~18 | ~16 |
| Graph-CoT Agent | ~17 | ~33 | ~28 |
| Graph-CoT Explore | ~25 | ~29 | ~28 |
| Graph-ToT Agent | ~29 | ~39 | ~48 |
| Graph-ToT Explore | ~29 | ~33 | ~34 |
| Graph-GoT Agent | ~29 | ~41 | ~43 |
| Graph-GoT Explore | ~25 | ~31 | ~35 |
### Key Observations
- **Model Size Correlation**: Larger models (405B) generally outperform smaller ones, especially in complex tasks (e.g., Graph-ToT Agent: 405B = 48 vs. 8B = 29).
- **Anomalies**:
- In Graph-RAG, 70B (18) slightly outperforms 405B (16).
- 405B underperforms 70B in Graph-CoT Agent (28 vs. 33).
- **Task-Specific Trends**:
- Graph-ToT tasks show the largest performance gaps between models.
- Graph-GoT tasks maintain consistent 405B dominance.
### Interpretation
The data suggests that model size strongly correlates with performance in complex reasoning tasks (e.g., Graph-ToT), where 405B achieves ~48 vs. 8B’s 29. However, exceptions like Graph-RAG (70B > 405B) imply that architectural design or training data may sometimes outweigh raw model size. The 70B model’s mid-range performance highlights its potential as a cost-effective alternative to 405B in most scenarios. The 8B model’s consistent underperformance underscores limitations in handling advanced tasks, likely due to insufficient capacity for nuanced reasoning.
</details>
Figure 11: Performance results using the Rouge-L metric on the healthcare graph of GRBench graphCoT, comparing all methods with LLama 3.1 Instruct models of various sizes (8B, 70B, 405B-FP8). Experimental details are included in Section 5.
<details>
<summary>figures/healthcare_gpt4score_all.png Details</summary>
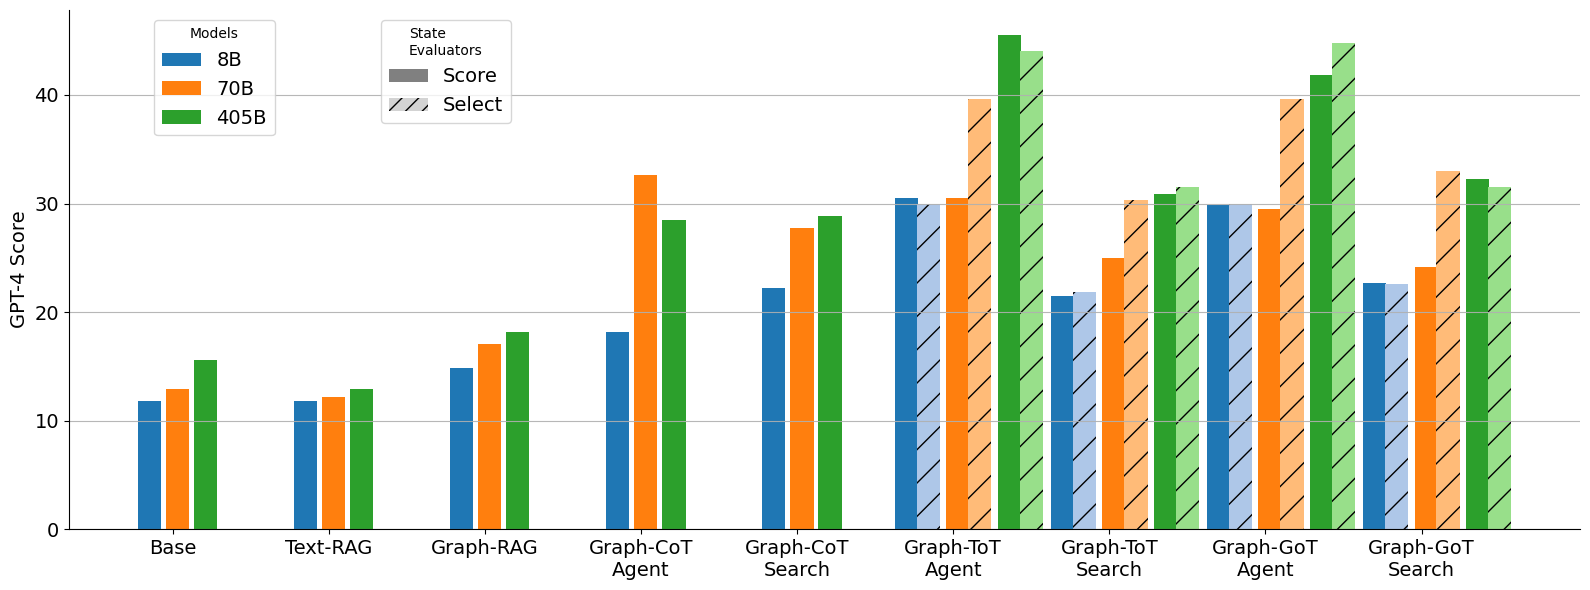
### Visual Description
## Bar Chart: GPT-4 Scores Across Models and Evaluation Methods
### Overview
The chart compares GPT-4 scores (0–40) for three models (8B, 70B, 405B) across nine evaluation methods: Base, Text-RAG, Graph-RAG, Graph-CoT Agent, Graph-CoT Search, Graph-ToT Agent, Graph-ToT Search, Graph-GoT Agent, and Graph-GoT Search. The 405B model consistently outperforms the others, with the Graph-ToT and Graph-GoT methods showing the highest scores.
### Components/Axes
- **X-axis**: Evaluation methods (Base, Text-RAG, Graph-RAG, Graph-CoT Agent, Graph-CoT Search, Graph-ToT Agent, Graph-ToT Search, Graph-GoT Agent, Graph-GoT Search).
- **Y-axis**: GPT-4 Score (0–40).
- **Legend**:
- Blue: 8B model
- Orange: 70B model
- Green: 405B model
- **Spatial Grounding**:
- Legend: Top-left corner.
- X-axis labels: Bottom, centered under each evaluation method.
- Y-axis: Left, with ticks at 0, 10, 20, 30, 40.
### Detailed Analysis
- **Base**:
- 8B: ~12
- 70B: ~13
- 405B: ~15
- **Text-RAG**:
- 8B: ~12
- 70B: ~13
- 405B: ~14
- **Graph-RAG**:
- 8B: ~15
- 70B: ~17
- 405B: ~18
- **Graph-CoT Agent**:
- 8B: ~18
- 70B: ~22
- 405B: ~28
- **Graph-CoT Search**:
- 8B: ~22
- 70B: ~28
- 405B: ~29
- **Graph-ToT Agent**:
- 8B: ~30
- 70B: ~31
- 405B: ~45
- **Graph-ToT Search**:
- 8B: ~31
- 70B: ~30
- 405B: ~43
- **Graph-GoT Agent**:
- 8B: ~30
- 70B: ~31
- 405B: ~42
- **Graph-GoT Search**:
- 8B: ~23
- 70B: ~25
- 405B: ~32
### Key Observations
1. **Model Size Correlation**: The 405B model consistently scores highest across all methods, followed by 70B and 8B.
2. **Evaluation Method Impact**:
- Graph-ToT Agent/Search methods yield the highest scores (405B: ~43–45).
- Base and Text-RAG methods have the lowest scores (~12–15).
3. **Anomalies**:
- In Graph-GoT Search, the 405B model scores ~32, lower than its performance in other methods.
- The 70B model occasionally outperforms the 8B model but rarely surpasses the 405B.
### Interpretation
- **Model Size Matters**: Larger models (405B) demonstrate superior performance, suggesting that increased capacity enhances reasoning and task-solving.
- **Graph-ToT Methods Excel**: The Graph-ToT Agent/Search methods achieve the highest scores, indicating that combining graph-based reasoning with Tree of Thoughts (ToT) frameworks significantly improves outcomes.
- **Graph-GoT Search Exception**: The 405B model’s lower score in Graph-GoT Search (~32) may reflect method-specific limitations or data variability.
- **Practical Implications**: For high-stakes tasks, the 405B model with Graph-ToT methods is optimal. Smaller models (8B) are less effective, highlighting trade-offs between cost and performance.
</details>
Figure 12: Performance results using the GPT4Score metric on the healthcare graph of GRBench graphCoT, comparing all methods with LLama 3.1 Instruct models of various sizes (8B, 70B, 405B-FP8). Experimental details are included in Section 5.
Appendix D Results on GPT4Score
In this section, we present the results of the experiments described in Section 5 for all methods, using the GPT4Score metric. This metric calculates the percentage of "correct" answers as judged by GPT-4 when presented with both the correct and the generated answer. The tables in this section present the same data as in Tables 1 and 2, but evaluated using GPT4Score.
| | Method | | Model | Healthcare | Goodreads | Biology | Chemistry | Materials Science | Medicine | Physics |
| --- | --- | --- | --- | --- | --- | --- | --- | --- | --- | --- |
| Baselines | | Llama 3.1 8B-Ins | 11.85 | 13.33 | 10.71 | 11.43 | 7.86 | 7.87 | 9.29 | |
| Base | Llama 3.1 70B-Ins | 12.96 | 19.17 | 10.00 | 12.14 | 11.43 | 11.43 | 12.86 | | |
| Llama 3.1 405B-Ins | 15.55 | 26.67 | 12.86 | 12.14 | 12.14 | 13.57 | 12.14 | | | |
| Llama 3.1 8B-Ins | 11.85 | 21.67 | 12.86 | 10.00 | 10.00 | 8.57 | 7.86 | | | |
| Text-RAG | Llama 3.1 70B-Ins | 12.22 | 27.5 | 12.14 | 13.57 | 13.57 | 13.57 | 12.86 | | |
| Llama 3.1 405B-Ins | 12.96 | 26.67 | 15.00 | 13.57 | 12.86 | 14.29 | 13.57 | | | |
| Llama 3.1 8B-Ins | 14.81 | 32.50 | 29.29 | 29.28 | 27.86 | 25.71 | 29.29 | | | |
| Graph-RAG | Llama 3.1 70B-Ins | 17.04 | 32.92 | 39.29 | 40.71 | 43.57 | 34.29 | 40.00 | | |
| Llama 3.1 405B-Ins | 18.15 | 31.67 | 37.14 | 42.86 | 40.00 | 36.43 | 41.43 | | | |
| Graph CoT | | Llama 3.1 8B-Ins | 18.15 | 32.5 | 20.71 | 19.28 | 25.00 | 14.29 | 21.43 | |
| Agent | Llama 3.1 70B-Ins | 32.59 | 43.75 | 50.00 | 51.43 | 50.00 | 48.57 | 46.43 | | |
| Llama 3.1 405B-Ins | 28.89 | 48.33 | 38.57 | 38.57 | 47.86 | 56.43 | 34.29 | | | |
| Graph Explore | Llama 3.1 8B-Ins | 22.22 | 36.67 | 35.00 | 30.71 | 29.29 | 29.29 | 32.86 | | |
| Llama 3.1 70B-Ins | 27.78 | 32.92 | 45.71 | 49.29 | 40.00 | 40.00 | 44.29 | | | |
| Llama 3.1 405B-Ins | 28.89 | 48.33 | 38.57 | 38.57 | 47.86 | 56.43 | 34.29 | | | |
| Graph ToT | Agent | Score | Llama 3.1 8B-Ins | 30.49 | 55.14 | 43.33 | 41.67 | 44.05 | 36.43 | 39.52 |
| Llama 3.1 70B-Ins | 30.49 | 54.48 | 65.48 | 62.14 | 55.95 | 63.57 | 56.19 | | | |
| Llama 3.1 405B-Ins | 45.55 | 56.53 | 71.67 | 65.71 | 52.62 | 68.81 | 44.76 | | | |
| Select | Llama 3.1 8B-Ins | 30.00 | 54.17 | 40.71 | 37.14 | 40.00 | 32.86 | 36.43 | | |
| Llama 3.1 70B-Ins | 39.63 | 56.67 | 65.00 | 67.14 | 62.86 | 60.71 | 55.55 | | | |
| Llama 3.1 405B-Ins | 44.07 | 58.75 | 71.43 | 69.29 | 65.00 | 68.81 | 60.00 | | | |
| Graph Explore | Score | Llama 3.1 8B-Ins | 21.48 | 41.10 | 32.86 | 31.67 | 31.43 | 32.14 | 35.24 | |
| Llama 3.1 70B-Ins | 24.94 | 40.97 | 52.38 | 57.86 | 49.29 | 54.29 | 47.86 | | | |
| Llama 3.1 405B-Ins | 30.86 | 48.33 | 47.86 | 57.14 | 50.71 | 56.67 | 47.14 | | | |
| Select | Llama 3.1 8B-Ins | 21.85 | 41.67 | 32.86 | 31.67 | 31.43 | 32.14 | 35.24 | | |
| Llama 3.1 70B-Ins | 30.37 | 42.08 | 54.29 | 57.14 | 47.86 | 52.14 | 46.43 | | | |
| Llama 3.1 405B-Ins | 31.48 | 48.75 | 45.00 | 57.86 | 48.86 | 57.14 | 45.71 | | | |
Table 4: GPT4Score performance results on GRBench graphCoT, comparing standard LLMs, Text-RAG, Graph-RAG, Graph-CoT, and Graph-ToT. Experiments are described in Section 5, using LLama 3.1 - Instruct backbone models with sizes 8B, 70B, and 405B.
| Method | Model | Healthcare | Biology | |
| --- | --- | --- | --- | --- |
| Agent | Score | Llama 3.1 8B-Ins | 29.88 | 32.86 |
| Llama 3.1 70B-Ins | 29.51 | 61.69 | | |
| Llama 3.1 405B-Ins | 41.81 | 48.33 | | |
| Select | Llama 3.1 8B-Ins | 30.00 | 40.71 | |
| Llama 3.1 70B-Ins | 39.63 | 69.83 | | |
| Llama 3.1 405B-Ins | 44.81 | 72.86 | | |
| Graph Explore | Score | Llama 3.1 8B-Ins | 22.72 | 21.19 |
| Llama 3.1 70B-Ins | 24.20 | 48.57 | | |
| Llama 3.1 405B-Ins | 32.22 | 41.67 | | |
| Select | Llama 3.1 8B-Ins | 22.59 | 19.28 | |
| Llama 3.1 70B-Ins | 32.96 | 52.86 | | |
| Llama 3.1 405B-Ins | 31.48 | 57.86 | | |
Figure 13: Graph-GoT results (GPT4Score) on GRBench with Llama 3.1 Instruct sizes 8B, 70B, and 405B.
<details>
<summary>figures/radar_levels.png Details</summary>
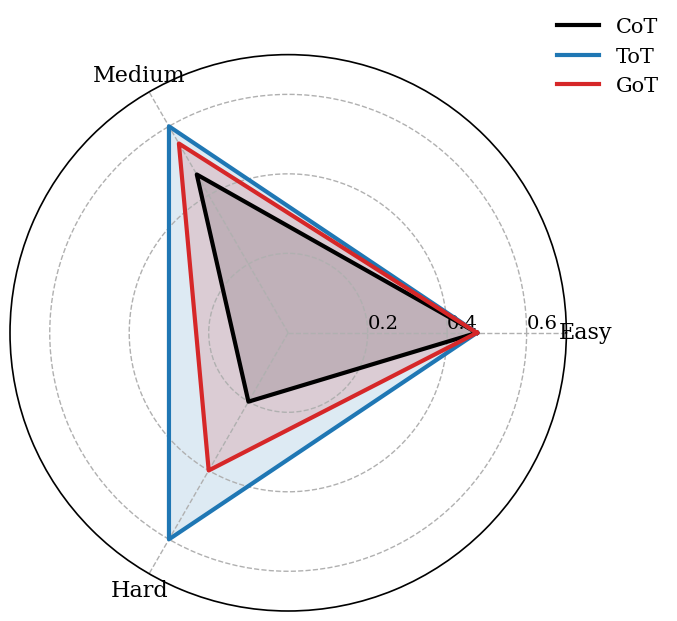
### Visual Description
## Radar Chart: Performance Metrics Across Difficulty Levels
### Overview
The image is a radar chart comparing three data series (CoT, ToT, GoT) across three difficulty levels (Easy, Medium, Hard). The chart uses a circular layout with radial axes representing performance scores (0.0–1.0) and angular axes representing difficulty levels. Shaded regions indicate data distributions or confidence intervals.
### Components/Axes
- **Axes**:
- **Angular (Categories)**:
- **Easy** (right side, 0°)
- **Medium** (top, 90°)
- **Hard** (left, 180°)
- **Radial (Scale)**:
- Linear scale from 0.0 to 1.0, with tick marks at 0.2, 0.4, 0.6, 0.8.
- **Legend**:
- **CoT**: Black line (solid)
- **ToT**: Blue line (dashed)
- **GoT**: Red line (dotted)
- **Shading**:
- Gray (CoT), Light Blue (ToT), Light Red (GoT) for filled areas.
### Detailed Analysis
- **CoT (Black)**:
- **Easy**: ~0.3
- **Medium**: ~0.4
- **Hard**: ~0.5
- **Trend**: Gradual increase from Easy to Hard.
- **ToT (Blue)**:
- **Easy**: ~0.4
- **Medium**: ~0.5
- **Hard**: ~0.6
- **Trend**: Steeper increase than CoT.
- **GoT (Red)**:
- **Easy**: ~0.5
- **Medium**: ~0.6
- **Hard**: ~0.7
- **Trend**: Highest values across all levels, consistent upward slope.
### Key Observations
1. **GoT** consistently outperforms ToT and CoT across all difficulty levels.
2. **ToT** shows a steeper improvement from Easy to Hard compared to CoT.
3. **CoT** has the lowest values but follows a similar upward trend.
4. Shaded regions suggest variability or confidence intervals, though exact metrics are unspecified.
### Interpretation
The data suggests that **GoT** is the most effective metric across all difficulty levels, with performance increasing as difficulty rises. **ToT** demonstrates stronger growth in harder tasks compared to CoT, which shows more modest improvements. The shaded areas imply uncertainty or distribution, but without explicit labels, their interpretation remains speculative. The chart highlights a clear hierarchy in performance, with GoT as the dominant series.
</details>
Figure 14: Results decomposed into easy/medium/hard questions according to GPT4Score.
Appendix E Computational Analysis
<details>
<summary>figures/computational_analysis.png Details</summary>
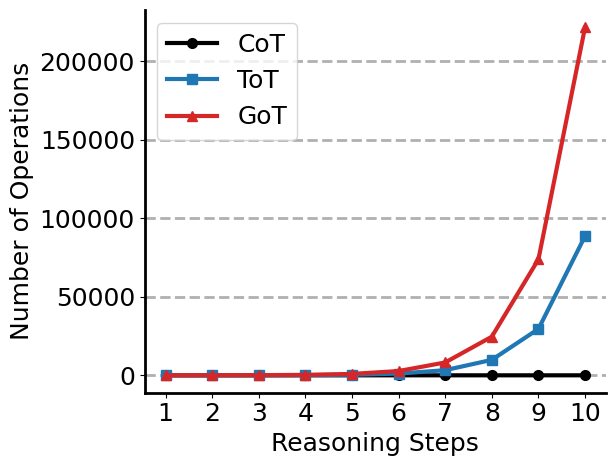
### Visual Description
## Line Chart: Number of Operations vs Reasoning Steps
### Overview
The chart displays three data series (CoT, ToT, GoT) across 10 reasoning steps, showing the number of operations required at each step. The y-axis scales logarithmically up to 200,000 operations, while the x-axis represents discrete reasoning steps 1-10.
### Components/Axes
- **X-axis**: Reasoning Steps (1-10, integer increments)
- **Y-axis**: Number of Operations (0-200,000, increments of 50,000)
- **Legend**:
- CoT: Black line with circular markers (constant at 0)
- ToT: Blue line with square markers (gradual increase)
- GoT: Red line with triangular markers (sharp late-stage increase)
- **Positioning**: Legend in top-left corner; data series anchored to bottom-left origin
### Detailed Analysis
1. **CoT (Black)**:
- Flat line at 0 operations across all steps
- No variation observed (0 ± 0 operations)
2. **ToT (Blue)**:
- Flat at 0 until step 7
- Step 8: ~10,000 operations
- Step 9: ~30,000 operations
- Step 10: ~90,000 operations
3. **GoT (Red)**:
- Flat at 0 until step 7
- Step 8: ~10,000 operations
- Step 9: ~70,000 operations
- Step 10: ~220,000 operations (steep upward spike)
### Key Observations
- CoT maintains perfect operational stability (0 operations)
- ToT and GoT show identical behavior until step 7
- Both ToT and GoT exhibit exponential growth between steps 8-10
- GoT's operations at step 10 are 2.44× higher than ToT's
- All data series share identical initial conditions (0 operations)
### Interpretation
The chart reveals a critical divergence in computational demands between ToT and GoT during final reasoning steps. While CoT demonstrates perfect operational efficiency (0 cost), ToT and GoT both require minimal resources until the final step, where GoT's operations surge dramatically. This suggests:
1. **Algorithmic Bottlenecks**: GoT's late-stage operations may involve complex computations or recursive processes
2. **Resource Allocation**: The 2.44× difference between ToT and GoT at step 10 indicates potential inefficiencies in GoT's implementation
3. **Threshold Effects**: The step-7 plateau suggests a computational threshold being crossed at later stages
4. **Scalability Concerns**: GoT's exponential growth pattern raises questions about its practicality for extended reasoning tasks
The data implies that while CoT offers optimal efficiency, ToT and GoT trade increased operational costs for potentially enhanced reasoning capabilities in later stages. The stark contrast at step 10 warrants further investigation into GoT's computational architecture.
</details>
Figure 15: Comparison of computational costs across different reasoning strategies — CoT, ToT, GoT — as a function of reasoning steps. GoT exhibits the highest cost due to merge operations and graph traversal.
| | Method | Key Parameters | Approx. # LLM Calls | Approx. # KG Operations | Primary Growth Driver(s) |
| --- | --- | --- | --- | --- | --- |
| CoT | Agent | $n$ | $\mathcal{O}(n)$ | $\mathcal{O}(n)$ | $n$ (linear) |
| Graph Explore | $n$ , $d$ | $\mathcal{O}(n)$ | $\mathcal{O}(n·\text{Cost}_{\text{Explore}}(d))$ | $n$ , $d$ | |
| ToT | Agent | $D_{\text{max}}$ , $k$ , $t$ | $\mathcal{O}\left(k·\frac{t^{D_{\text{max}}}-1}{t-1}\right)$ | Same as LLM Calls | $D_{\text{max}}$ , $k$ , $t$ (exponential in $D_{\text{max}}$ ) |
| Graph Explore | $D_{\text{max}}$ , $k$ , $t$ , $d$ | $\mathcal{O}\left(k·\frac{t^{D_{\text{max}}}-1}{t-1}\right)$ | $\mathcal{O}\left(k·\frac{t^{D_{\text{max}}}-1}{t-1}·\text{Cost}_{\text{Explore}}(d)\right)$ | $D_{\text{max}}$ , $k$ , $t$ , $d$ | |
| GoT | Agent | $D_{\text{max}}$ , $k$ , $t$ | . $\mathcal{O}\left(k·\frac{t^{D_{\text{max}}}-1}{t-1}+\sum_{i=1}^{D_{\text{max}}}\left\lfloor\frac{k· t^{i}}{2}\right\rfloor\right)$ | Same as LLM Calls | $D_{\text{max}}$ , $k$ , $t$ (aggregation adds extra cost) |
| Graph Explore | $D_{\text{max}}$ , $k$ , $t$ , $d$ | Same as Agent | $\mathcal{O}\left(\text{LLM Calls}·\text{Cost}_{\text{Explore}}(d)\right)$ | $D_{\text{max}}$ , $k$ , $t$ , $d$ | |
Table 5: Theoretical computational complexity comparison of reasoning methods. Parameters: $n$ (reasoning steps), $D_{\text{max}}$ (tree depth), $k$ (branching factor), $t$ (paths retained), $d$ (KG search depth), and $\text{Cost}_{\text{Explore}}(d)$ (cost per KG search). GoT includes pairwise aggregation of thoughts at each depth.
The computational analysis summarized in Table 5 highlights the trade-offs between reasoning power and computational cost when grounding LLMs with Knowledge Graphs (KGs). The Agent -based methods scale linearly with the number of reasoning steps or tree nodes, with CoT representing the lowest cost baseline. In contrast, Automatic Graph Exploration methods introduce additional overhead via entity extraction, multi-hop traversal up to a fixed max_depth, and LLM-based pruning at each step.
Among reasoning strategies, ToT introduces exponential growth in cost with respect to depth due to its exploration of $k$ branches and selection of $t$ continuations per level. GoT further amplifies this by incorporating aggregation transformations that attempt to merge every pair of thoughts at each depth, leading to an additional cost proportional to $\sum_{i=1}^{D_{\text{max}}}\left\lfloor\frac{k· t^{i}}{2}\right\rfloor$ .
Importantly, our experiments reveal that the higher complexity of GoT does not consistently translate to improved accuracy compared to ToT, suggesting diminishing returns. While the model size (e.g., 8B, 70B, 405B) influences the latency and memory footprint of each LLM call, it does not affect the algorithmic complexity classes shown. Hence, selecting a strategy requires balancing reasoning depth with feasible compute budgets.
Appendix F Prompts Archive
In this section, we gather the necessary prompts essential for implementing the proposed methodologies.
Agent
Agent Step: Solve a question answering task with interleaving Thought, Interaction with Graph, Feedback from Graph steps. In Thought step, you can think about what further information is needed, and In Interaction step, you can get feedback from graphs with four functions: (1) RetrieveNode[keyword], which retrieves the related node from the graph according to the corresponding query. (2) NodeFeature[Node, feature], which returns the detailed attribute information of Node regarding the given "feature" key. (3) NodeDegree[Node, neighbor_type], which calculates the number of "neighbor_type" neighbors of the node Node in the graph. (4) NeighbourCheck[Node, neighbor_type], which lists the "neighbor_type" neighbours of the node Node in the graph and returns them. You may take as many steps as necessary. Here are some examples: {examples} Please answer by providing node main feature (e.g., names) rather than node IDs. Generate the next step. Definition of the graph: {graph_definition} Question: {question} {scratchpad}
Automatic Graph Exploration
Search Thought: Given the previous thoughts, generate the next thought to answer the provided question. Your end goal is to answer the question step by step. For context, you are also provided with some knowledge triples from a knowledge base. Follow the format of the examples to generate the next thought. {examples} Graph Definition: {graph_definition} Question: {question} Knowledge Triples: {triples} Previous thoughts: {thoughts} Related Entity Attributes: {attributes} Next Thought: Search End?: Your are provided with the an original question, the associated subquestion thoughts and their corresponding knowledge graph triples (head_entity -> relation -> tail_entity). Your task is to answer whether it’s sufficient for you to answer the original question (Yes or No). You are provided with examples. You should follow the same format as in the examples, writing ’Yes’ or ’No’ within brackets at the beginning of the answer. (Examples) Task: Question: {question} Thoughts: {thoughts} Knowledge Triples: {triples} Entity Attributes: {attributes} Answer: Entity Extraction: Given the provided text, extract the relevant entities that may appear in a knowledge base. Return the answer at the end with brackets relevant entities as shown in the following examples. If there are several entities, separate them with commas. (Examples) Task: Text: {text} Relevant Entities: Prune Relations: From the given entity and relations, select only the relevant relations to answer the question. Provide the answer at the end with bracketsanswer , as shown in the following example. (Examples) Question: {question} Head Entity: {entity} Relations: {relations} Answer: Prune entities: You are provided with a question, a head entity, a relation and tail entity or entities from a knowledge base. Select the tail entity or entities to answer the question. Return the tail entity or entities at the end with brackets relevant entity or entities, as shown in the following examples. (Examples) Question: {question} Head Entity: {head_entity} Relation: {relation} Tail Entities: {tail_entities} Relevant Entities: Search Attributes: Is any of the attributes relevant to answer the question? Return the answer at the end with brackets answer , as shown in the following examples. (Examples) Question: {question} Entity: {entity} Attributes: {attributes} Relevant Attributes:
State Evaluators
Selection Vote: Given a question, you need to select the possible chain of thought that may lead to the correct answer with higher probablity. You are provided with several choices with thouhgts and related triples from a knowledge base. Decide which choice is most promising to complete the task. Analyze each choice in detail, then conclude in the last line: "The best choice is s" , where s the integer id of the choice. (Examples) Question: {question} Choices: {choices} (+ attributes/triples) Answer: Score Vote: Generate a score for the given reasoning chain. The score represents the probability that the chain will lead to the correct answer. The chains contain interleaved thoughts and related triples from a knowledge base. Some chains may not be complete, but you need to judge the steps that are provided. The score can be any floating number between 0 and 1. (Examples) Question: {question} Thought Chain: {thoughts} (+ attributes/triples) Score:
Graph of Thoughts
Graph of Thought Merge: Generate the next thought for the merged chain of thoughts. You are provided with the question, two chains of thoughts, and the corresponding merged chain of thought. Identify inconsistencies or errors from the previous chains and provide the next thought for the merged chain. You should follow the same format as in the examples. (Examples) Question: {question} Chain 1: {chain_1} (+triples/attributes) Chain 2: {chain_2} (+triples/attributes) Merged Chain: {merged_chain} Next Thought:
Appendix G Examples
| Example 1: Multi-step Reasoning over Graph | Example 2: Direct Triple Lookup |
| --- | --- |
| Question: What anatomy can be expressed by gene KRT39? Ground Truth Answer: head, skin of body Model Answer: head, skin of body
Thought 1: The question is related to a gene node (KRT39). We need to find this node in the graph. Action 1: RetrieveNode[KRT39] Observation 1: The ID of the node is 390792. Thought 2: We need to check the ’Anatomy-expresses-Gene’ neighbors of this gene node. Action 2: NeighbourCheck[390792, Anatomy-expresses-Gene] Observation 2: The neighbors are [’UBERON:0000033’, ’UBERON:0002097’]. Thought 3: Retrieve names of the anatomy nodes. Action 3: NodeFeature[UBERON:0000033, name], NodeFeature[UBERON:0002097, name] Observation 3: UBERON:0000033 $→$ head, UBERON:0002097 $→$ skin of body. Thought 4: These are the anatomy terms expressed by the gene. Action 4: Finish[head, skin of body] | Question: What anatomy can be expressed by gene KRT39? Ground Truth Answer: head, skin of body Model Answer: head, skin of body
Thought 1: KRT39 is a gene that is known to be expressed in two anatomical regions. Found Triples: •
"KRT39" --> Anatomy-expresses-Gene --> head •
"KRT39" --> Anatomy-expresses-Gene --> skin of body Action: Finish[head, skin of body] |
Table 6: Comparison of two LLM-generated reasoning traces for the same question using different strategies: multi-step graph traversal (Example 1) vs. direct triple lookup (Example 2).