# 1.4 Million Open-Source Distilled Reasoning Dataset to Empower Large Language Model Training
**Authors**: Han Zhao, Haotian Wang, Yiping Peng, Sitong Zhao, Xiaoyu Tian, Shuaiting Chen, Yunjie Ji, Xiangang Li
> a-m-team
## Abstract
The AM-DeepSeek-R1-Distilled is a large-scale dataset with thinking traces for general reasoning tasks, composed of high-quality and challenging reasoning problems. These problems are collected from a multitude of open-source datasets, subjected to semantic deduplication and meticulous cleaning to eliminate test set contamination. All responses within the dataset are distilled from reasoning models (predominantly DeepSeek-R1) and have undergone rigorous verification procedures. Mathematical problems are validated by checking against reference answers, code problems are verified using test cases, and other tasks are evaluated with the aid of a reward model. The AM-Distill-Qwen-32B model, which was trained through only simple Supervised Fine-Tuning (SFT) using this batch of data, outperformed the DeepSeek-R1-Distill-Qwen-32B model on four benchmarks: AIME2024, MATH-500, GPQA-Diamond, and LiveCodeBench. Additionally, the AM-Distill-Qwen-72B model surpassed the DeepSeek-R1-Distill-Llama-70B model on all benchmarks as well. We are releasing these 1.4 million problems and their corresponding responses to the research community with the objective of fostering the development of powerful reasoning-oriented Large Language Models (LLMs). The dataset was published in https://huggingface.co/datasets/a-m-team/AM-DeepSeek-R1-Distilled-1.4M
<details>
<summary>extracted/6308700/20250325-163012.png Details</summary>
### Visual Description
## Bar Chart: Model Accuracy Comparison Across Datasets
### Overview
The chart compares the accuracy (Pass@1) of four AI models across four datasets: AIME 2024, MATH-500, GPQA Diamond, and LiveCodeBench. Models include AM-Distill-Qwen-32B, DeepSeek-R1-Distill-Qwen-32B, AM-Distill-Qwen-72B, and DeepSeek-R1-Distill-Llama-70B. Accuracy is measured in percentage (%) on a y-axis from 30% to 100%.
### Components/Axes
- **X-axis**: Datasets (AIME 2024, MATH-500, GPQA Diamond, LiveCodeBench).
- **Y-axis**: Accuracy (Pass@1) in percentage (%) from 30% to 100%.
- **Legend**: Located in the top-right corner, mapping colors to models:
- Blue (striped): AM-Distill-Qwen-32B
- Red (solid): DeepSeek-R1-Distill-Qwen-32B
- Green (striped): AM-Distill-Qwen-72B
- Orange (solid): DeepSeek-R1-Distill-Llama-70B
### Detailed Analysis
1. **AIME 2024**:
- AM-Distill-Qwen-32B: 72.7%
- DeepSeek-R1-Distill-Qwen-32B: 72.6%
- AM-Distill-Qwen-72B: 76.5%
- DeepSeek-R1-Distill-Llama-70B: 70.0%
2. **MATH-500**:
- AM-Distill-Qwen-32B: 96.2%
- DeepSeek-R1-Distill-Qwen-32B: 94.3%
- AM-Distill-Qwen-72B: 97.0%
- DeepSeek-R1-Distill-Llama-70B: 94.5%
3. **GPQA Diamond**:
- AM-Distill-Qwen-32B: 64.3%
- DeepSeek-R1-Distill-Qwen-32B: 62.1%
- AM-Distill-Qwen-72B: 65.9%
- DeepSeek-R1-Distill-Llama-70B: 65.2%
4. **LiveCodeBench**:
- AM-Distill-Qwen-32B: 59.1%
- DeepSeek-R1-Distill-Qwen-32B: 57.2%
- AM-Distill-Qwen-72B: 59.7%
- DeepSeek-R1-Distill-Llama-70B: 57.5%
### Key Observations
- **Highest Performance**: MATH-500 dataset shows the highest accuracies, with AM-Distill-Qwen-72B achieving 97.0%.
- **Lowest Performance**: LiveCodeBench dataset has the lowest accuracies, with DeepSeek-R1-Distill-Llama-70B at 57.5%.
- **Model Trends**:
- AM-Distill-Qwen-72B consistently outperforms other models across all datasets.
- DeepSeek-R1-Distill-Qwen-32B and DeepSeek-R1-Distill-Llama-70B show lower accuracy than their Qwen-based counterparts.
- The 72B model (AM-Distill-Qwen-72B) demonstrates superior performance compared to the 32B and 70B models.
### Interpretation
The data suggests that larger model sizes (e.g., 72B parameters) and specific architectures (e.g., AM-Distill-Qwen) yield higher accuracy. The DeepSeek-R1-Distill models, while based on Qwen, underperform compared to their non-distilled counterparts, indicating potential trade-offs in distillation processes. MATH-500’s high accuracy across models implies it is the "easiest" dataset, while LiveCodeBench’s lower scores suggest greater complexity. The AM-Distill-Qwen-72B model emerges as the most robust performer, highlighting the importance of model scale and architecture in task-specific performance.
</details>
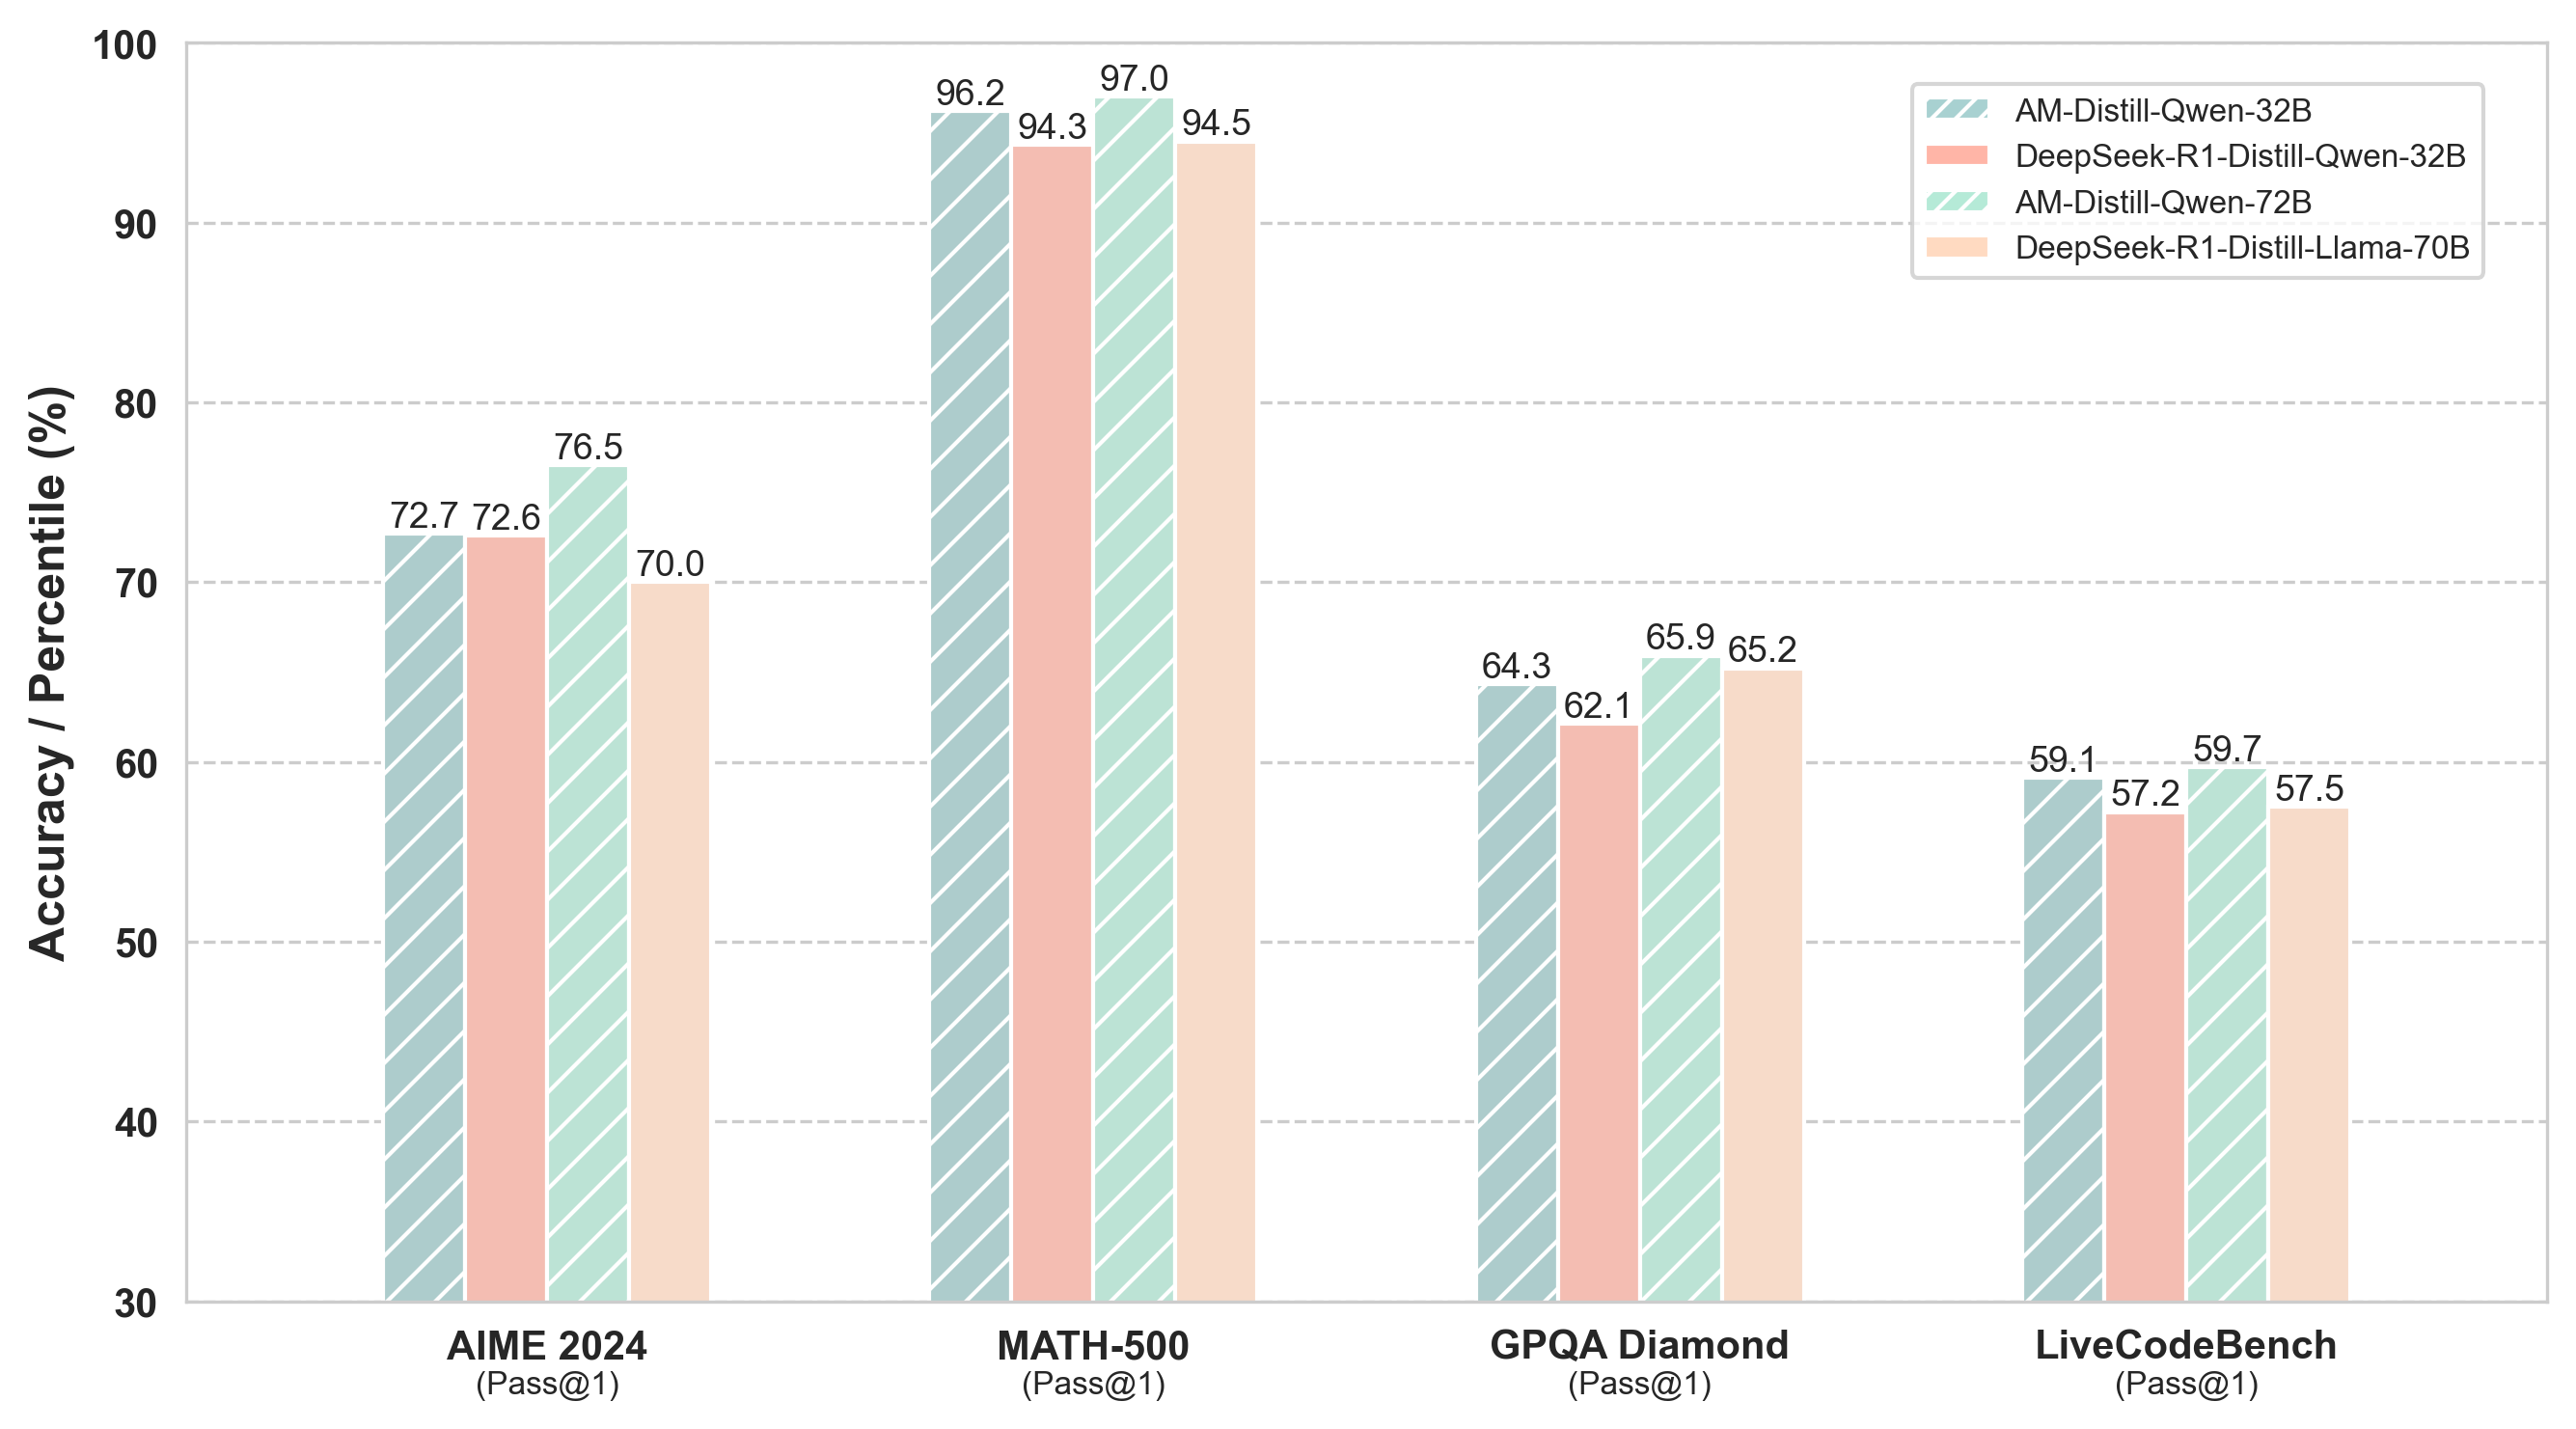
Figure 1: Overall performance of AM model
## 1 Introduction
OpenAI’s o1 series models (OpenAI, 2024) were the pioneers in introducing inference-time scaling by extending the length of the Chain-of-thought reasoning process (Wei et al., 2023; Snell et al., 2024; Wu et al., 2025). This approach has yielded remarkable improvements across various reasoning tasks, including mathematics, coding, and scientific reasoning (Lightman et al., 2023; Hwang et al., 2024).
Subsequently, the introduction of DeepSeek-R1 (DeepSeek-AI et al., 2025) significantly propelled the open-source community forward, enabling deeper insights into inference-time scaling. DeepSeek also introduced the DeepSeek-R1-distilled series of models. These models solely utilized distilled data with reasoning chains for Supervised Fine-Tuning (SFT), yet they achieved outstanding results on diverse benchmarks. In the training pipeline of DeepSeek-R1, compared with DeepSeek-R1-Zero, 800,000 selected entries of data were used for SFT. This is a crucial factor contributing to DeepSeek-R1’s superiority over DeepSeek-R1-Zero, thus demonstrating the necessity of high-quality SFT. SFT process, with carefully selected data, can effectively improve the performance of the model, as evidenced by the significant improvement of DeepSeek-R1 over its counterpart. This not only highlights the importance of data selection in SFT but also further validates the positive impact of well-executed SFT on enhancing a model’s reasoning ability.
Building upon prior work, the open-source community has recently introduced numerous datasets that distilled reasoning models from DeepSeek-R1 (OpenThoughts, 2025; Xu et al., 2025). However, the scale of these datasets is generally smaller than the 800,000 samples employed by DeepSeek in its distilled series of models. To date, few open-source initiatives have matched the performance achieved by the DeepSeek-R1-distilled series models based on the corresponding base models. Therefore, we have constructed the AM-DeepSeek-R1-Distilled dataset, which encompasses 1.4 million high-quality data entries with reasoning chains. Among these, 0.5 million data entries are entirely sourced from open-source datasets, and 0.9 million data entries are distilled by AM from DeepSeek-R1, as denoted by the “am-0309” in the response sources. The AM-DeepSeek-R1-Distilled dataset we developed exhibits significant advantages in terms of data scale, quality, and diversity. Through our meticulous data processing and stringent verification procedures, this dataset can offer robust support for the long COT training of large language models.
In terms of data collection, we comprehensively gathered diverse types of reasoning problems from numerous open-source datasets and implemented semantic deduplication and cleaning to guarantee the high quality and purity of the data (Li et al., 2023; Tirumala et al., 2023). Simultaneously, we conducted strict verification of all responses, including validating mathematical problems through answer checking, verifying code problems via test cases, and evaluating other tasks using a reward model, thereby ensuring the accuracy and reliability of the data.
Regarding data scale, the AM dataset, with its 1.4 million data entries, has significantly outperformed other recent open-source datasets. Among these entries, 500,000 are fully derived from open-source datasets. They span a wide range of knowledge domains and problem types. For the remaining 900,000, the instruction part is sourced from open-source datasets, and the response part is distilled by the AM team from DeepSeek-R1. These data have undergone processing in our data pipeline and possess high quality.
In terms of diversity, our dataset not only encompasses problems from common domains such as math, code, and science but also includes some cross-domain and comprehensive reasoning tasks. This can comprehensively exercise the reasoning ability and generalization ability of the models (Song et al., 2024). Moreover, we meticulously processed the instruction part. We utilized a large language model to score all instructions in terms of difficulty and category and performed strict semantic deduplication according to these labels to ensure the high quality and diversity of the instructions (Xu et al., 2024).
In addition, our dataset adopts a unified format, and each data entry is annotated in detail, including user-assistant interaction information, reasoning processes, final answers, reference answers, test cases, and other metadata. This standardized format renders the dataset easy to use and understand, facilitating researchers in conducting data processing and model training.
We believe that the release of the AM-DeepSeek-R1-Distilled dataset will offer crucial resource support for the research of reasoning-oriented large language models and is anticipated to drive further development and innovation in this field. We look forward to the research community leveraging this dataset to achieve more research breakthroughs and jointly promote the progress of AGI.
## 2 Approach
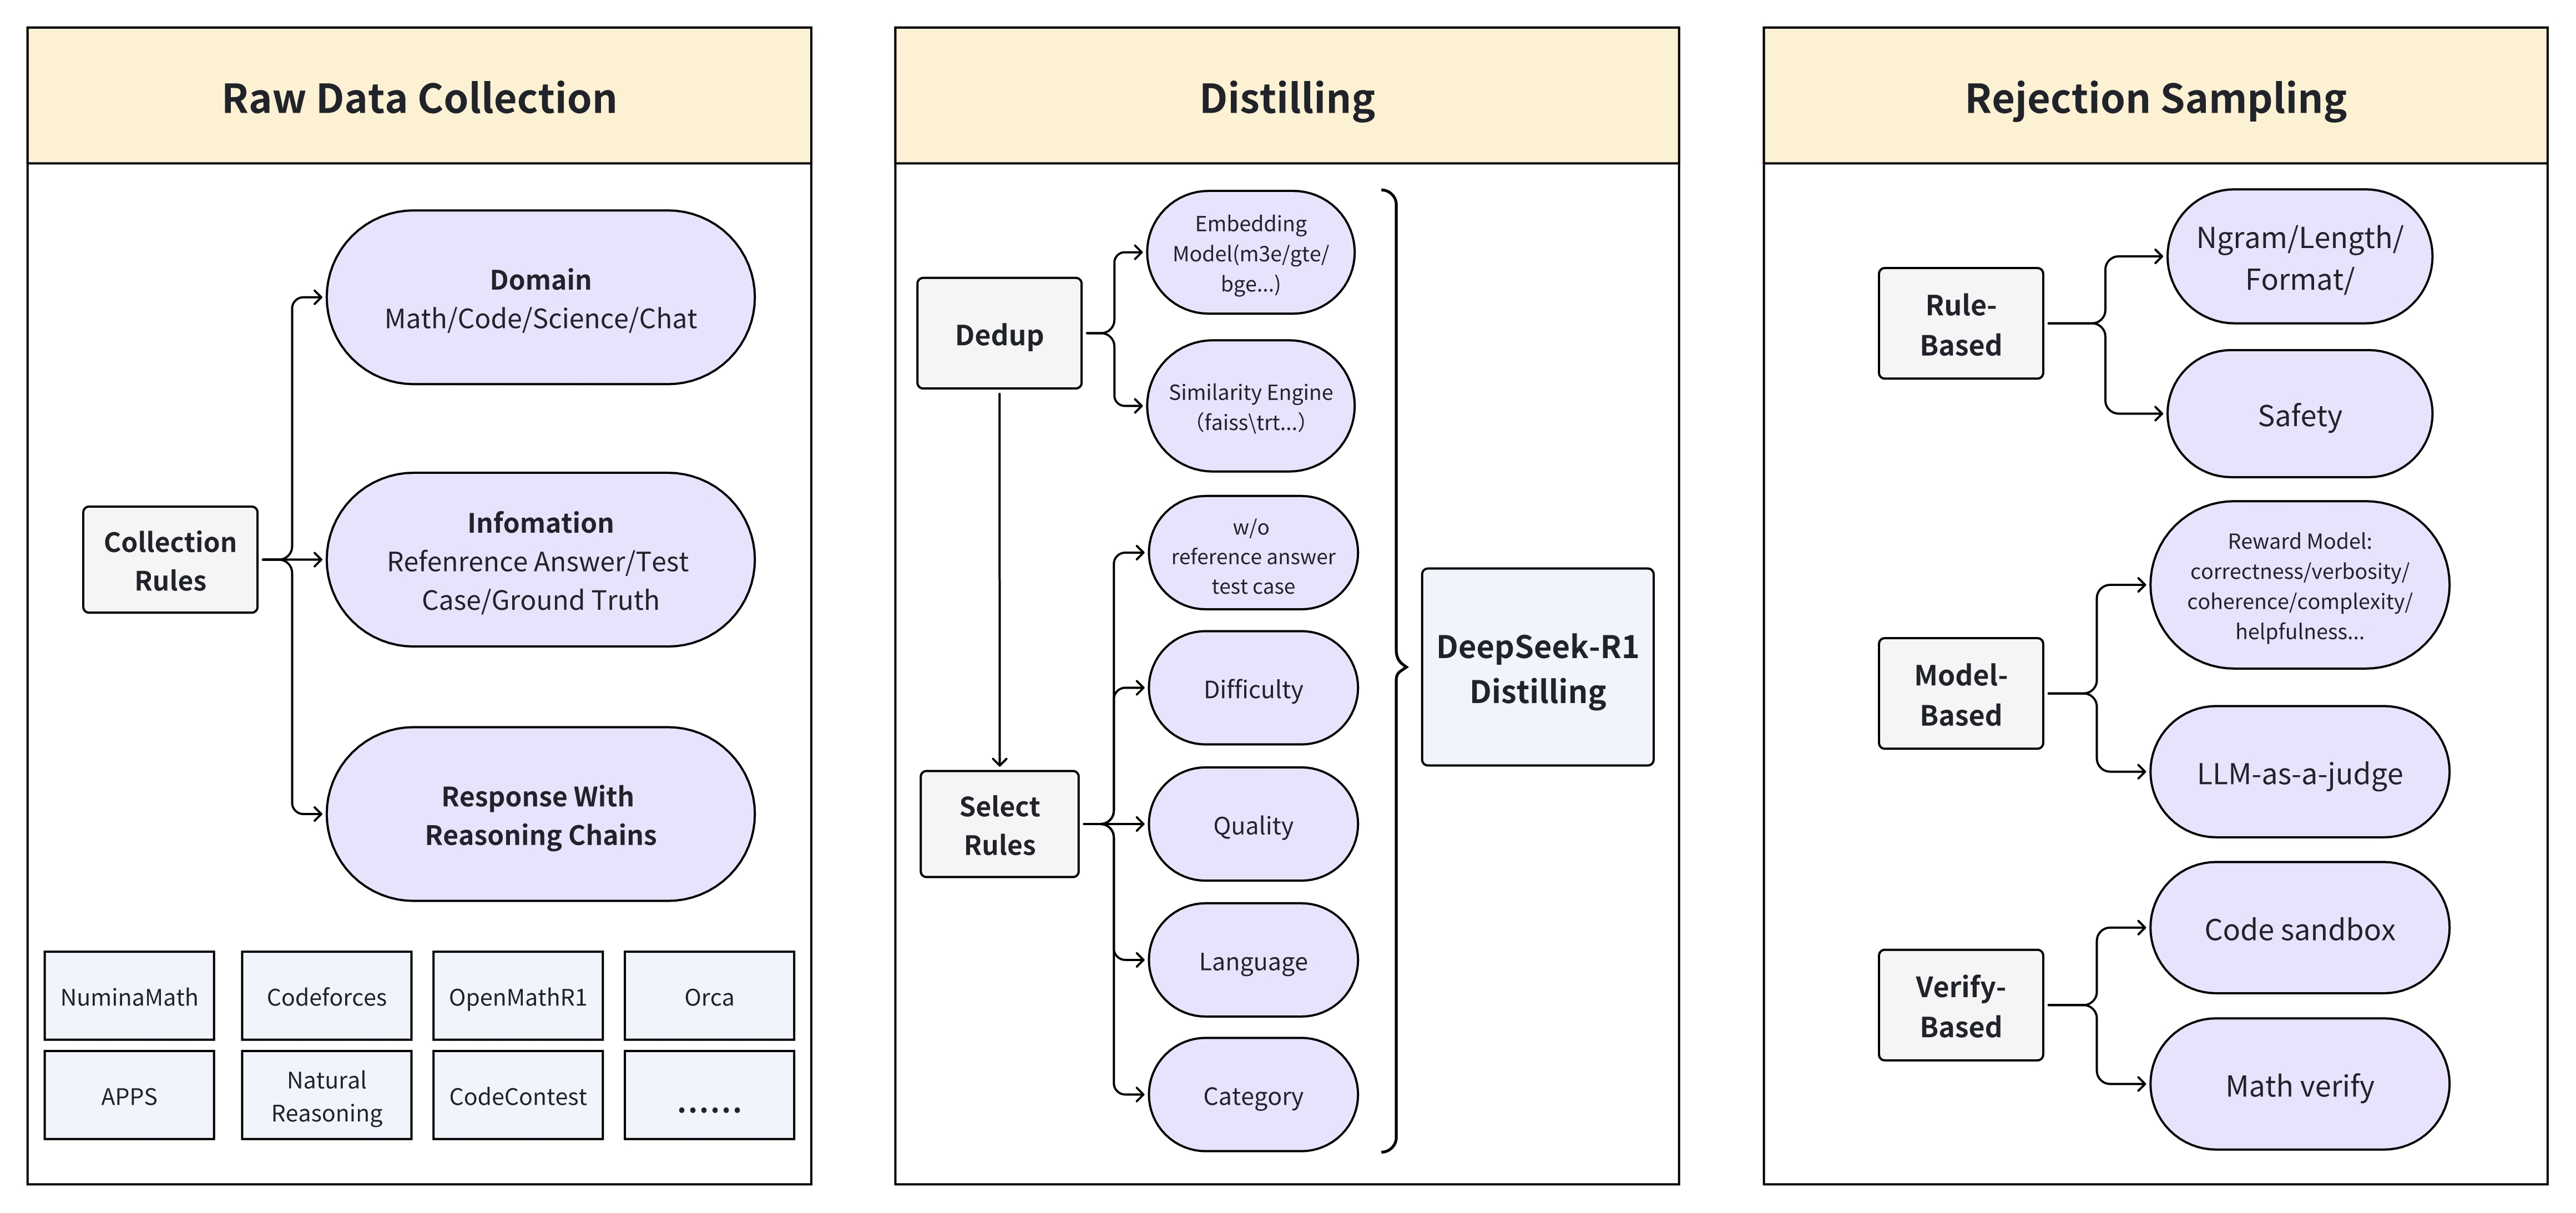
The core criteria for our data selection mainly include three aspects: diversity, complexity, and accuracy. We constructed our data pipeline around how to improve these three core indicators. As demonstrated in Figure 2, the entire pipeline can be divided into (1) Raw Data Collection, (2) Distilling, and (3) Rejection Sampling. The subsequent sections will elaborate on these components in detail.
<details>
<summary>extracted/6308700/20250322-135500.jpeg Details</summary>
### Visual Description
## Flowchart: Data Processing Pipeline for LLM-Based Systems
### Overview
The flowchart illustrates a three-stage pipeline for processing data in LLM-based systems: **Raw Data Collection**, **Distilling**, and **Rejection Sampling**. Each stage includes specific components and rules for data handling, quality control, and filtering.
---
### Components/Axes
#### 1. Raw Data Collection
- **Domain**: Math, Code, Science, Chat
- **Collection Rules**:
- **Information**: Reference Answer, Test Case, Ground Truth
- **Response With Reasoning Chains**:
- Sources: NuminaMath, Codeforces, OpenMathR1, Orca, APPS, Natural Reasoning, CodeContest
#### 2. Distilling
- **Dedup**:
- Embedding Model (m3e/gte/bge...)
- Similarity Engine (faiss/tr...)
- w/o reference answer test case
- **DeepSeek-R1 Distilling**:
- Select Rules: Difficulty, Quality, Language, Category
#### 3. Rejection Sampling
- **Rule-Based**:
- Ngram/Length/Format
- Safety
- LLM-as-a-judge
- **Model-Based**:
- Reward Model: correctness/verbosity/coherence/complexity/helpfulness
- Verify-Based: Code sandbox, Math verify
---
### Detailed Analysis
#### Raw Data Collection
- **Domain**: Broad categorization of data sources (Math, Code, Science, Chat).
- **Information**: Focuses on structured data (Reference Answer, Test Case, Ground Truth).
- **Response With Reasoning Chains**: Aggregates outputs from diverse LLM benchmarks (e.g., NuminaMath for math, Codeforces for coding).
#### Distilling
- **Dedup**:
- Uses embeddings (e.g., m3e/gte/bge) and similarity engines (faiss/tr) to remove duplicates.
- Excludes test cases without reference answers.
- **DeepSeek-R1 Distilling**:
- Applies **Select Rules** to refine data based on difficulty, quality, language, and category.
#### Rejection Sampling
- **Rule-Based**:
- Filters data using syntactic rules (Ngram/Length/Format) and safety checks.
- Employs LLM-as-a-judge for qualitative assessment.
- **Model-Based**:
- Uses a **Reward Model** to evaluate data on correctness, verbosity, coherence, complexity, and helpfulness.
- Verifies code and math solutions via sandboxing and automated checks.
---
### Key Observations
1. **Data Flow**: Raw data is collected, distilled to remove redundancy and improve quality, then filtered using hybrid rule/model-based methods.
2. **Hybrid Approach**: Combines rule-based (e.g., safety checks) and model-based (e.g., reward model) rejection criteria.
3. **Domain-Specific Tools**: Tools like Codeforces and OpenMathR1 suggest domain-specific data collection.
4. **DeepSeek-R1 Integration**: Indicates a focus on iterative refinement using specialized distillation techniques.
---
### Interpretation
This pipeline emphasizes **quality assurance** at every stage:
- **Raw Data Collection** ensures diverse, domain-specific inputs.
- **Distilling** refines data by removing duplicates and applying domain-specific rules.
- **Rejection Sampling** acts as a final gatekeeper, using both rigid rules (e.g., format constraints) and nuanced model evaluations (e.g., helpfulness).
The use of **DeepSeek-R1** in the Distilling stage suggests an emphasis on iterative improvement, while the **Reward Model** in Rejection Sampling highlights a focus on multi-dimensional data quality metrics. The pipeline likely aims to balance efficiency (via rule-based filtering) and accuracy (via model-based evaluation) in LLM training or inference workflows.
</details>
Figure 2: Construction process of data pipeline.
### 2.1 Raw Data
#### 2.1.1 Data Sources
We divided the data selection into four major categories: math, code, scienceQA, and general chat. We classified high-quality open-source datasets into these four categories. For Math, Code, and ScienceQA, we prioritized to select datasets with reference answers or test cases, such as NuminaMath (LI et al., 2024), MetaMathQA (Yu et al., 2023), natural_reasoning (Yuan et al., 2025), OpenCoder (Huang et al., 2024), Omni-MATH (Gao et al., 2024), PRIME (Yuan et al., 2024), CodeIO (Li et al., 2025), MATH-lighteval (Hendrycks et al., 2021). Additionally, we also selected some datasets with reasoning chains generated by DeepSeek-R1 from the open-source community, such as Openthoughts (OpenThoughts, 2025), OpenR1Math (Open-R1, 2025), KodCode (Xu et al., 2025), Bespoke-Stratos-17k (Bespoke, 2025), GeneralThought (Reasoning, 2025), Dolphin-R1 (cognitivecomputations, 2025), data_ablation_full59K (Muennighoff et al., 2025), s1K (Muennighoff et al., 2025), LIMO (Ye et al., 2025). Additionally, to enhance the model’s chatting ability, we obtained chat data from general-data SFT datasets, such as InfinityInstruct (BAAI, 2024), Orca (Lian et al., 2023). The distribution of reference answers and test cases can be found in Appendix A.2
#### 2.1.2 Categories
The initial four categories alone were insufficient, especially for general chat data. Thus, we designed some more detailed categories, such as creative writing and instruction following. To facilitate data matching and enhance the diversity of the AM dataset, we used the Qwen2.5-7B-Instruct model (Qwen, 2024) to label the data. The details of the categories can be found in the Appendix A.3 and Appendix B.2.
#### 2.1.3 Difficulty
For the training of long-cot models, more challenging data can effectively extend the length of the reasoning chains generated by the model and improve its reasoning ability. Thus, we used a large language model to score the difficulty of all instructions, subsequently screening the data and downsampling easy and medium difficulty examples. This ensures that the AM dataset emphasizes more challenging data while maintaining its diversity. The difficulty distribution of the data can be found in Appendix A.4 and Appendix B.1.
#### 2.1.4 Deduplication
We performed strict semantic deduplication on the collected data. We calculated the embedding for each data entry and computed text similarity based on their embeddings to obtain the semantic similarity of different data entries. For data with high semantic similarity, we designed some priority strategies and ultimately retained only one representative entry. This process ensures dataset uniqueness and diversity of the dataset and prevents the negative impact of similar data during model training.
### 2.2 Distilled Data
We obtained responses to prompts via two ways: filtering existing responses and creating new responses. For prompts with existing responses, we retained the original response if it can pass reference-answer or test-case verification. For data without reasoning chains, we generated new responses using DeepSeek-R1.
#### 2.2.1 Ground Truth Verification
For problems with available reference answers, we conducted verification through a combination of rule-based methods and a large language model. Initially, we applied math-verify (Kydlíček and Gandenberger, 2025) to assess whether the response matched reference answers in terms of format and calculation results. Subsequently, we used Qwen2.5-7B-Instruct to further evaluate the correctness and consistency of these responses, the prompt could be found in Appendix B.3. For code-related problems with test cases, we verified responses within a sandbox environment. We ultimately removed the data that did not pass the verification to ensure the accuracy and reliability of the dataset.
#### 2.2.2 Reward
We used two methods, Decision-Tree-Reward-Llama-3.1-8B (Rlhflow, 2025) as reward model and Qwen2.5-7B-Instruct for large language model scoring, to evaluate the answer_content part of the model output. We set a certain score threshold based on the score distribution and removed the data with lower scores. The reward model evaluates responses across five dimensions: correctness, helpfulness, coherence, complexity, and verbosity to ensure the selected responses contribute to improving the overall quality of the dataset.
#### 2.2.3 Rule Verification
We established verification rules, such as format template conformity and n-gram repetition checks. For format verification, we ensured that each response adhered strictly to the specified format, such as clearly indicating <think>reasoning process here</think><answer>final answer here</answer>in the prompt. For n-gram repetition verification, we checked responses for excessive consecutive word repetition. Responses failing these rule-based verifications were excluded to guarantee dataset quality and consistency.
#### 2.2.4 Labels
We additionally annotated the data with supplementary information, such as length and language. For length annotation, we calculated the number of words or tokens per data entry, providing insights into the complexity and scale of the dataset. The length distribution of the data can be found in Appendix A.1. For language annotation, we primarily annotated entries as Chinese, English, or other languages. These labels facilitate effective data screening and analysis.
## 3 Experiment
### 3.1 Evaluation
#### 3.1.1 Benchmark
We evaluated the reasoning ability of the model using LiveCodeBench (Jain et al., 2024) (2024-08–2025-01), GPQA-Diamond (Rein et al., 2023), AIME 2024 (MAA, 2024), and MATH-500 (Lightman et al., 2023). These benchmarks span multiple fields and difficulty levels, enabling a thorough assessment of the model’s reasoning performance across diverse scenarios.
#### 3.1.2 Evaluation Methodology
We set the maximum generation length to 32,768 tokens. For benchmarks requiring sampling, the temperature was uniformly set to 0.6, and the top-p value to 0.95. For AIME 2024 (MAA, 2024), we generated 16 samples per query to estimate pass@1. For LiveCodeBench (Jain et al., 2024), MATH-500 (Lightman et al., 2023) and GPQA Diamond (Rein et al., 2023), we generated 4 responses per query, also to estimate pass@1. The evaluation metric across these benchmarks was the globally averaged accuracy.
### 3.2 Main Result
We performed SFT on Qwen2.5-32B producing a model named AM-Distill-Qwen-32B, the system prompt used is shown in Table 1. Compared with DeepSeek-R1-Distill-Qwen-32B, our models achieved significant improvements. Evaluation results are shown in Table 2. Specifically, on AIME2024, the accuracy increased from 72.6% to 72.7%; on MATH-500, from 94.3% to 96.2%; on GPQA-Diamond, from 62.1% to 64.3%; and on LiveCodeBench, from 57.2% to 59.1%. Overall, the average accuracy improved from 71.6% to 73.1%.
| You are a helpful assistant. To answer the user’s question, you first think about the reasoning process and then provide the user with the answer. The reasoning process and answer are enclosed within <think> and <answer> tags, respectively, i.e., <think> reasoning process here </think> <answer> answer here </answer>. |
| --- |
Table 1: System prompt in training process.
We further performed training based on the Qwen2.5-72B model to obtain AM-Distill-Qwen-72B. Compared with DeepSeek-R1-Distill-Llama-70B, our 72B model achieved notable improvements across all evaluation benchmarks. Specifically, accuracy on AIME2024 significantly increased from 70.0% to 76.5%; MATH-500 improved from 94.5% to 97.0%; GPQA-Diamond rose from 65.2% to 65.9%; and LiveCodeBench increased from 57.5% to 59.7%.
Experimental results demonstrate that models trained on our constructed AM-DeepSeek-R1-Distilled-1.4M dataset exhibit substantial enhancements in reasoning ability.
| DeepSeek-R1-Distill-Qwen-32B AM-Distill-Qwen-32B DeepSeek-R1-Distill-Llama-70B | 72.6 72.7 70.0 | 94.3 96.2 94.5 | 62.1 64.3 65.2 | 57.2 59.1 57.5 | 71.6 73.1 71.8 |
| --- | --- | --- | --- | --- | --- |
| AM-Distill-Qwen-72B | 76.5 | 97.0 | 65.9 | 59.7 | 74.8 |
Table 2: Model performance.
## 4 Limitation
Since the responses in this dataset are generated by large language models and have not been rigorously verified, there are still deficiencies in terms of factual accuracy and other aspects. When using this dataset, it is necessary to conduct a careful examination. This dataset is mainly used to enhance the reasoning capabilities of large language models (LLMs). We have not carried out a thorough filtering of the harmful instructions or responses within it. We require developers to use only the open-sourced code, data, model, and any other artifacts generated through this project for research purposes. Commercial use and other potential harmful use cases are not permitted. In addition, due to the nested relationships among some data sources, there may be issues with the inaccuracy of the data sources.
## 5 Conclusion
In this study, we have constructed and released an AM-DeepSeek-R1-Distilled dataset, a large-scale general reasoning task dataset with 1.4 million data entries and rich thinking traces. It was created through meticulous selection, semantic deduplication, and strict cleaning of a large number of open-source datasets.
Furthermore, the AM-Distill-Qwen-32B model, developed by performing SFT on Qwen2.5-32B with the utilization of our constructed dataset, has exhibited remarkable performance enhancements. This compellingly demonstrates that our dataset serves as a significant asset in training the reasoning capabilities of the model. We are optimistic that our endeavors will play a substantial and catalytic role in the research related to reasoning-oriented Large Language Models, propelling forward the development in this field.
## References
- BAAI (2024) BAAI. Infinity instruct. 2024. URL https://huggingface.co/datasets/BAAI/Infinity-Instruct.
- Bespoke (2025) Bespoke. Bespoke-stratos: The unreasonable effectiveness of reasoning distillation. https://www.bespokelabs.ai/blog/bespoke-stratos-the-unreasonable-effectiveness-of-reasoning-distillation, 2025. Accessed: 2025-01-22.
- cognitivecomputations (2025) cognitivecomputations. dolphin-r1. https://huggingface.co/datasets/cognitivecomputations/dolphin-r1, 2025.
- DeepSeek-AI et al. (2025) DeepSeek-AI, Daya Guo, Dejian Yang, Haowei Zhang, Junxiao Song, Ruoyu Zhang, Runxin Xu, Qihao Zhu, Shirong Ma, Peiyi Wang, Xiao Bi, Xiaokang Zhang, Xingkai Yu, Yu Wu, Z. F. Wu, Zhibin Gou, Zhihong Shao, Zhuoshu Li, Ziyi Gao, Aixin Liu, Bing Xue, Bingxuan Wang, Bochao Wu, Bei Feng, Chengda Lu, Chenggang Zhao, Chengqi Deng, Chenyu Zhang, Chong Ruan, Damai Dai, Deli Chen, Dongjie Ji, Erhang Li, Fangyun Lin, Fucong Dai, Fuli Luo, Guangbo Hao, Guanting Chen, Guowei Li, H. Zhang, Han Bao, Hanwei Xu, Haocheng Wang, Honghui Ding, Huajian Xin, Huazuo Gao, Hui Qu, Hui Li, Jianzhong Guo, Jiashi Li, Jiawei Wang, Jingchang Chen, Jingyang Yuan, Junjie Qiu, Junlong Li, J. L. Cai, Jiaqi Ni, Jian Liang, Jin Chen, Kai Dong, Kai Hu, Kaige Gao, Kang Guan, Kexin Huang, Kuai Yu, Lean Wang, Lecong Zhang, Liang Zhao, Litong Wang, Liyue Zhang, Lei Xu, Leyi Xia, Mingchuan Zhang, Minghua Zhang, Minghui Tang, Meng Li, Miaojun Wang, Mingming Li, Ning Tian, Panpan Huang, Peng Zhang, Qiancheng Wang, Qinyu Chen, Qiushi Du, Ruiqi Ge, Ruisong Zhang, Ruizhe Pan, Runji Wang, R. J. Chen, R. L. Jin, Ruyi Chen, Shanghao Lu, Shangyan Zhou, Shanhuang Chen, Shengfeng Ye, Shiyu Wang, Shuiping Yu, Shunfeng Zhou, Shuting Pan, S. S. Li, Shuang Zhou, Shaoqing Wu, Shengfeng Ye, Tao Yun, Tian Pei, Tianyu Sun, T. Wang, Wangding Zeng, Wanjia Zhao, Wen Liu, Wenfeng Liang, Wenjun Gao, Wenqin Yu, Wentao Zhang, W. L. Xiao, Wei An, Xiaodong Liu, Xiaohan Wang, Xiaokang Chen, Xiaotao Nie, Xin Cheng, Xin Liu, Xin Xie, Xingchao Liu, Xinyu Yang, Xinyuan Li, Xuecheng Su, Xuheng Lin, X. Q. Li, Xiangyue Jin, Xiaojin Shen, Xiaosha Chen, Xiaowen Sun, Xiaoxiang Wang, Xinnan Song, Xinyi Zhou, Xianzu Wang, Xinxia Shan, Y. K. Li, Y. Q. Wang, Y. X. Wei, Yang Zhang, Yanhong Xu, Yao Li, Yao Zhao, Yaofeng Sun, Yaohui Wang, Yi Yu, Yichao Zhang, Yifan Shi, Yiliang Xiong, Ying He, Yishi Piao, Yisong Wang, Yixuan Tan, Yiyang Ma, Yiyuan Liu, Yongqiang Guo, Yuan Ou, Yuduan Wang, Yue Gong, Yuheng Zou, Yujia He, Yunfan Xiong, Yuxiang Luo, Yuxiang You, Yuxuan Liu, Yuyang Zhou, Y. X. Zhu, Yanhong Xu, Yanping Huang, Yaohui Li, Yi Zheng, Yuchen Zhu, Yunxian Ma, Ying Tang, Yukun Zha, Yuting Yan, Z. Z. Ren, Zehui Ren, Zhangli Sha, Zhe Fu, Zhean Xu, Zhenda Xie, Zhengyan Zhang, Zhewen Hao, Zhicheng Ma, Zhigang Yan, Zhiyu Wu, Zihui Gu, Zijia Zhu, Zijun Liu, Zilin Li, Ziwei Xie, Ziyang Song, Zizheng Pan, Zhen Huang, Zhipeng Xu, Zhongyu Zhang, and Zhen Zhang. Deepseek-r1: Incentivizing reasoning capability in llms via reinforcement learning, 2025. URL https://arxiv.org/abs/2501.12948.
- Gao et al. (2024) Bofei Gao, Feifan Song, Zhe Yang, Zefan Cai, Yibo Miao, Qingxiu Dong, Lei Li, Chenghao Ma, Liang Chen, Runxin Xu, Zhengyang Tang, Benyou Wang, Daoguang Zan, Shanghaoran Quan, Ge Zhang, Lei Sha, Yichang Zhang, Xuancheng Ren, Tianyu Liu, and Baobao Chang. Omni-math: A universal olympiad level mathematic benchmark for large language models, 2024. URL https://arxiv.org/abs/2410.07985.
- Hendrycks et al. (2021) Dan Hendrycks, Collin Burns, Saurav Kadavath, Akul Arora, Steven Basart, Eric Tang, Dawn Song, and Jacob Steinhardt. Measuring mathematical problem solving with the math dataset. arXiv preprint arXiv:2103.03874, 2021.
- Huang et al. (2024) Siming Huang, Tianhao Cheng, Jason Klein Liu, Jiaran Hao, Liuyihan Song, Yang Xu, J. Yang, J. H. Liu, Chenchen Zhang, Linzheng Chai, Ruifeng Yuan, Zhaoxiang Zhang, Jie Fu, Qian Liu, Ge Zhang, Zili Wang, Yuan Qi, Yinghui Xu, and Wei Chu. Opencoder: The open cookbook for top-tier code large language models. 2024. URL https://arxiv.org/pdf/2411.04905.
- Hwang et al. (2024) Hyeonbin Hwang, Doyoung Kim, Seungone Kim, Seonghyeon Ye, and Minjoon Seo. Self-explore: Enhancing mathematical reasoning in language models with fine-grained rewards, 2024. URL https://arxiv.org/abs/2404.10346.
- Jain et al. (2024) Naman Jain, King Han, Alex Gu, Wen-Ding Li, Fanjia Yan, Tianjun Zhang, Sida Wang, Armando Solar-Lezama, Koushik Sen, and Ion Stoica. Livecodebench: Holistic and contamination free evaluation of large language models for code. arXiv preprint arXiv:2403.07974, 2024.
- Kydlíček and Gandenberger (2025) Hynek Kydlíček and Greg Gandenberger. Math-verify, 2025. URL https://github.com/huggingface/math-verify.
- LI et al. (2024) Jia LI, Edward Beeching, Lewis Tunstall, Ben Lipkin, Roman Soletskyi, Shengyi Costa Huang, Kashif Rasul, Longhui Yu, Albert Jiang, Ziju Shen, Zihan Qin, Bin Dong, Li Zhou, Yann Fleureau, Guillaume Lample, and Stanislas Polu. Numinamath. https://huggingface.co/AI-MO/NuminaMath-CoT, 2024.
- Li et al. (2025) Junlong Li, Daya Guo, Dejian Yang, Runxin Xu, Yu Wu, and Junxian He. Codei/o: Condensing reasoning patterns via code input-output prediction. arXiv preprint arXiv:2502.07316, 2025.
- Li et al. (2023) Zhuoyan Li, Hangxiao Zhu, Zhuoran Lu, and Ming Yin. Synthetic data generation with large language models for text classification: Potential and limitations, 2023. URL https://arxiv.org/abs/2310.07849.
- Lian et al. (2023) Wing Lian, Bleys Goodson, Eugene Pentland, Austin Cook, Chanvichet Vong, and ”Teknium”. Openorca: An open dataset of gpt augmented flan reasoning traces. https://https://huggingface.co/datasets/Open-Orca/OpenOrca, 2023.
- Lightman et al. (2023) Hunter Lightman, Vineet Kosaraju, Yura Burda, Harri Edwards, Bowen Baker, Teddy Lee, Jan Leike, John Schulman, Ilya Sutskever, and Karl Cobbe. Let’s verify step by step, 2023. URL https://arxiv.org/abs/2305.20050.
- MAA (2024) MAA. American invitational mathematics examination - aime. https://maa.org/math-competitions/american-invitational-mathematics-examination-aime, feb 2024. Accessed in February 2024, from American Invitational Mathematics Examination - AIME 2024.
- Muennighoff et al. (2025) Niklas Muennighoff, Zitong Yang, Weijia Shi, Xiang Lisa Li, Li Fei-Fei, Hannaneh Hajishirzi, Luke Zettlemoyer, Percy Liang, Emmanuel Candès, and Tatsunori Hashimoto. s1: Simple test-time scaling, 2025. URL https://arxiv.org/abs/2501.19393.
- Open-R1 (2025) Open-R1. Openr1-math-220k. https://huggingface.co/datasets/open-r1/OpenR1-Math-220k, 2025.
- OpenAI (2024) OpenAI. Learning to reason with llms, 2024. URL https://openai.com/index/learning-to-reason-with-llms/.
- OpenThoughts (2025) Team OpenThoughts. Open Thoughts. https://open-thoughts.ai, January 2025.
- Qwen (2024) Qwen. Team qwen2.5: A party of foundation models, September 2024. URL https://qwenlm.github.io/blog/qwen2.5/.
- Reasoning (2025) General Reasoning. Generalthought-feb25. https://huggingface.co/datasets/GeneralReasoning/GeneralThought-Feb25, 02 2025.
- Rein et al. (2023) David Rein, Betty Li Hou, Asa Cooper Stickland, Jackson Petty, Richard Yuanzhe Pang, Julien Dirani, Julian Michael, and Samuel R. Bowman. Gpqa: A graduate-level google-proof q&a benchmark, 2023. URL https://arxiv.org/abs/2311.12022.
- Rlhflow (2025) Rlhflow. Decision tree reward model. https://rlhflow.github.io/posts/2025-01-22-decision-tree-reward-model/, 2025. Accessed: 2025-03-11.
- Snell et al. (2024) Charlie Snell, Jaehoon Lee, Kelvin Xu, and Aviral Kumar. Scaling llm test-time compute optimally can be more effective than scaling model parameters, 2024. URL https://arxiv.org/abs/2408.03314.
- Song et al. (2024) Feifan Song, Bowen Yu, Hao Lang, Haiyang Yu, Fei Huang, Houfeng Wang, and Yongbin Li. Scaling data diversity for fine-tuning language models in human alignment, 2024. URL https://arxiv.org/abs/2403.11124.
- Tirumala et al. (2023) Kushal Tirumala, Daniel Simig, Armen Aghajanyan, and Ari S. Morcos. D4: Improving llm pretraining via document de-duplication and diversification, 2023. URL https://arxiv.org/abs/2308.12284.
- Wei et al. (2023) Jason Wei, Xuezhi Wang, Dale Schuurmans, Maarten Bosma, Brian Ichter, Fei Xia, Ed Chi, Quoc Le, and Denny Zhou. Chain-of-thought prompting elicits reasoning in large language models, 2023. URL https://arxiv.org/abs/2201.11903.
- Wu et al. (2025) Yangzhen Wu, Zhiqing Sun, Shanda Li, Sean Welleck, and Yiming Yang. Inference scaling laws: An empirical analysis of compute-optimal inference for problem-solving with language models, 2025. URL https://arxiv.org/abs/2408.00724.
- Xu et al. (2024) Zhangchen Xu, Fengqing Jiang, Luyao Niu, Yuntian Deng, Radha Poovendran, Yejin Choi, and Bill Yuchen Lin. Magpie: Alignment data synthesis from scratch by prompting aligned llms with nothing, 2024. URL https://arxiv.org/abs/2406.08464.
- Xu et al. (2025) Zhangchen Xu, Yang Liu, Yueqin Yin, Mingyuan Zhou, and Radha Poovendran. Kodcode: A diverse, challenging, and verifiable synthetic dataset for coding. 2025. URL https://arxiv.org/abs/2503.02951.
- Ye et al. (2025) Yixin Ye, Zhen Huang, Yang Xiao, Ethan Chern, Shijie Xia, and Pengfei Liu. Limo: Less is more for reasoning, 2025. URL https://arxiv.org/abs/2502.03387.
- Yu et al. (2023) Longhui Yu, Weisen Jiang, Han Shi, Jincheng Yu, Zhengying Liu, Yu Zhang, James T Kwok, Zhenguo Li, Adrian Weller, and Weiyang Liu. Metamath: Bootstrap your own mathematical questions for large language models. arXiv preprint arXiv:2309.12284, 2023.
- Yuan et al. (2024) Lifan Yuan, Wendi Li, Huayu Chen, Ganqu Cui, Ning Ding, Kaiyan Zhang, Bowen Zhou, Zhiyuan Liu, and Hao Peng. Free process rewards without process labels. arXiv preprint arXiv:2412.01981, 2024.
- Yuan et al. (2025) Weizhe Yuan, Jane Yu, Song Jiang, Karthik Padthe, Yang Li, Dong Wang, Ilia Kulikov, Kyunghyun Cho, Yuandong Tian, Jason E Weston, and Xian Li. Naturalreasoning: Reasoning in the wild with 2.8m challenging questions, 2025. URL https://arxiv.org/abs/2502.13124.
## Appendix A Data Analysis
### A.1 Length Distribution
<details>
<summary>extracted/6308700/length_dist_1.png Details</summary>
### Visual Description
## Bar Chart: Frequency of Token Counts in Dataset
### Overview
The chart displays a distribution of dataset sizes measured in "Number of tokens," with corresponding frequencies on the y-axis. The data shows a steep decline in frequency as token counts increase, indicating a concentration of smaller datasets.
### Components/Axes
- **X-axis (Number of tokens in dataset)**: Labeled with values 2048, 4096, 8192, 16384, and intermediate markers (e.g., 6144, 12288). The scale is logarithmic, with intervals doubling (e.g., 2048 → 4096 → 8192 → 16384).
- **Y-axis (Frequency)**: Labeled "Frequency" with a linear scale from 0 to 600,000 in increments of 100,000.
- **Bars**: Blue-colored vertical bars represent frequency counts. No explicit legend is visible, but the color is consistent across all bars.
### Detailed Analysis
- **2048 tokens**: Tallest bar, approximately **600,000** frequency.
- **4096 tokens**: Second tallest, approximately **450,000** frequency.
- **8192 tokens**: Third tallest, approximately **250,000** frequency.
- **16384 tokens**: Shortest visible bar, approximately **10,000** frequency.
- Intermediate values (e.g., 6144, 12288, 14336) show gradual declines, with frequencies dropping below 50,000 for token counts above 8192.
### Key Observations
1. **Skewed Distribution**: Over 90% of datasets have ≤8192 tokens, with the majority clustered at 2048 tokens.
2. **Long Tail**: Fewer datasets exist with higher token counts (e.g., 16384 tokens), forming a long tail.
3. **Rapid Decline**: Frequency drops by ~50% when token counts double (e.g., 2048 → 4096: 600k → 450k; 4096 → 8192: 450k → 250k).
### Interpretation
The data suggests a strong preference or constraint for smaller datasets in the analyzed collection. This could reflect:
- **Resource Limitations**: Smaller datasets may be easier to collect, store, or process.
- **Use Case Requirements**: Applications like lightweight NLP models or edge computing might prioritize compact data.
- **Data Collection Bias**: Larger datasets may be underrepresented due to sampling methods or domain-specific scarcity.
The logarithmic x-axis emphasizes the exponential growth in token counts, highlighting the disparity between small and large datasets. The absence of datasets beyond 16384 tokens (if any exist) could indicate a cutoff in the study or a natural upper limit in the data source.
</details>
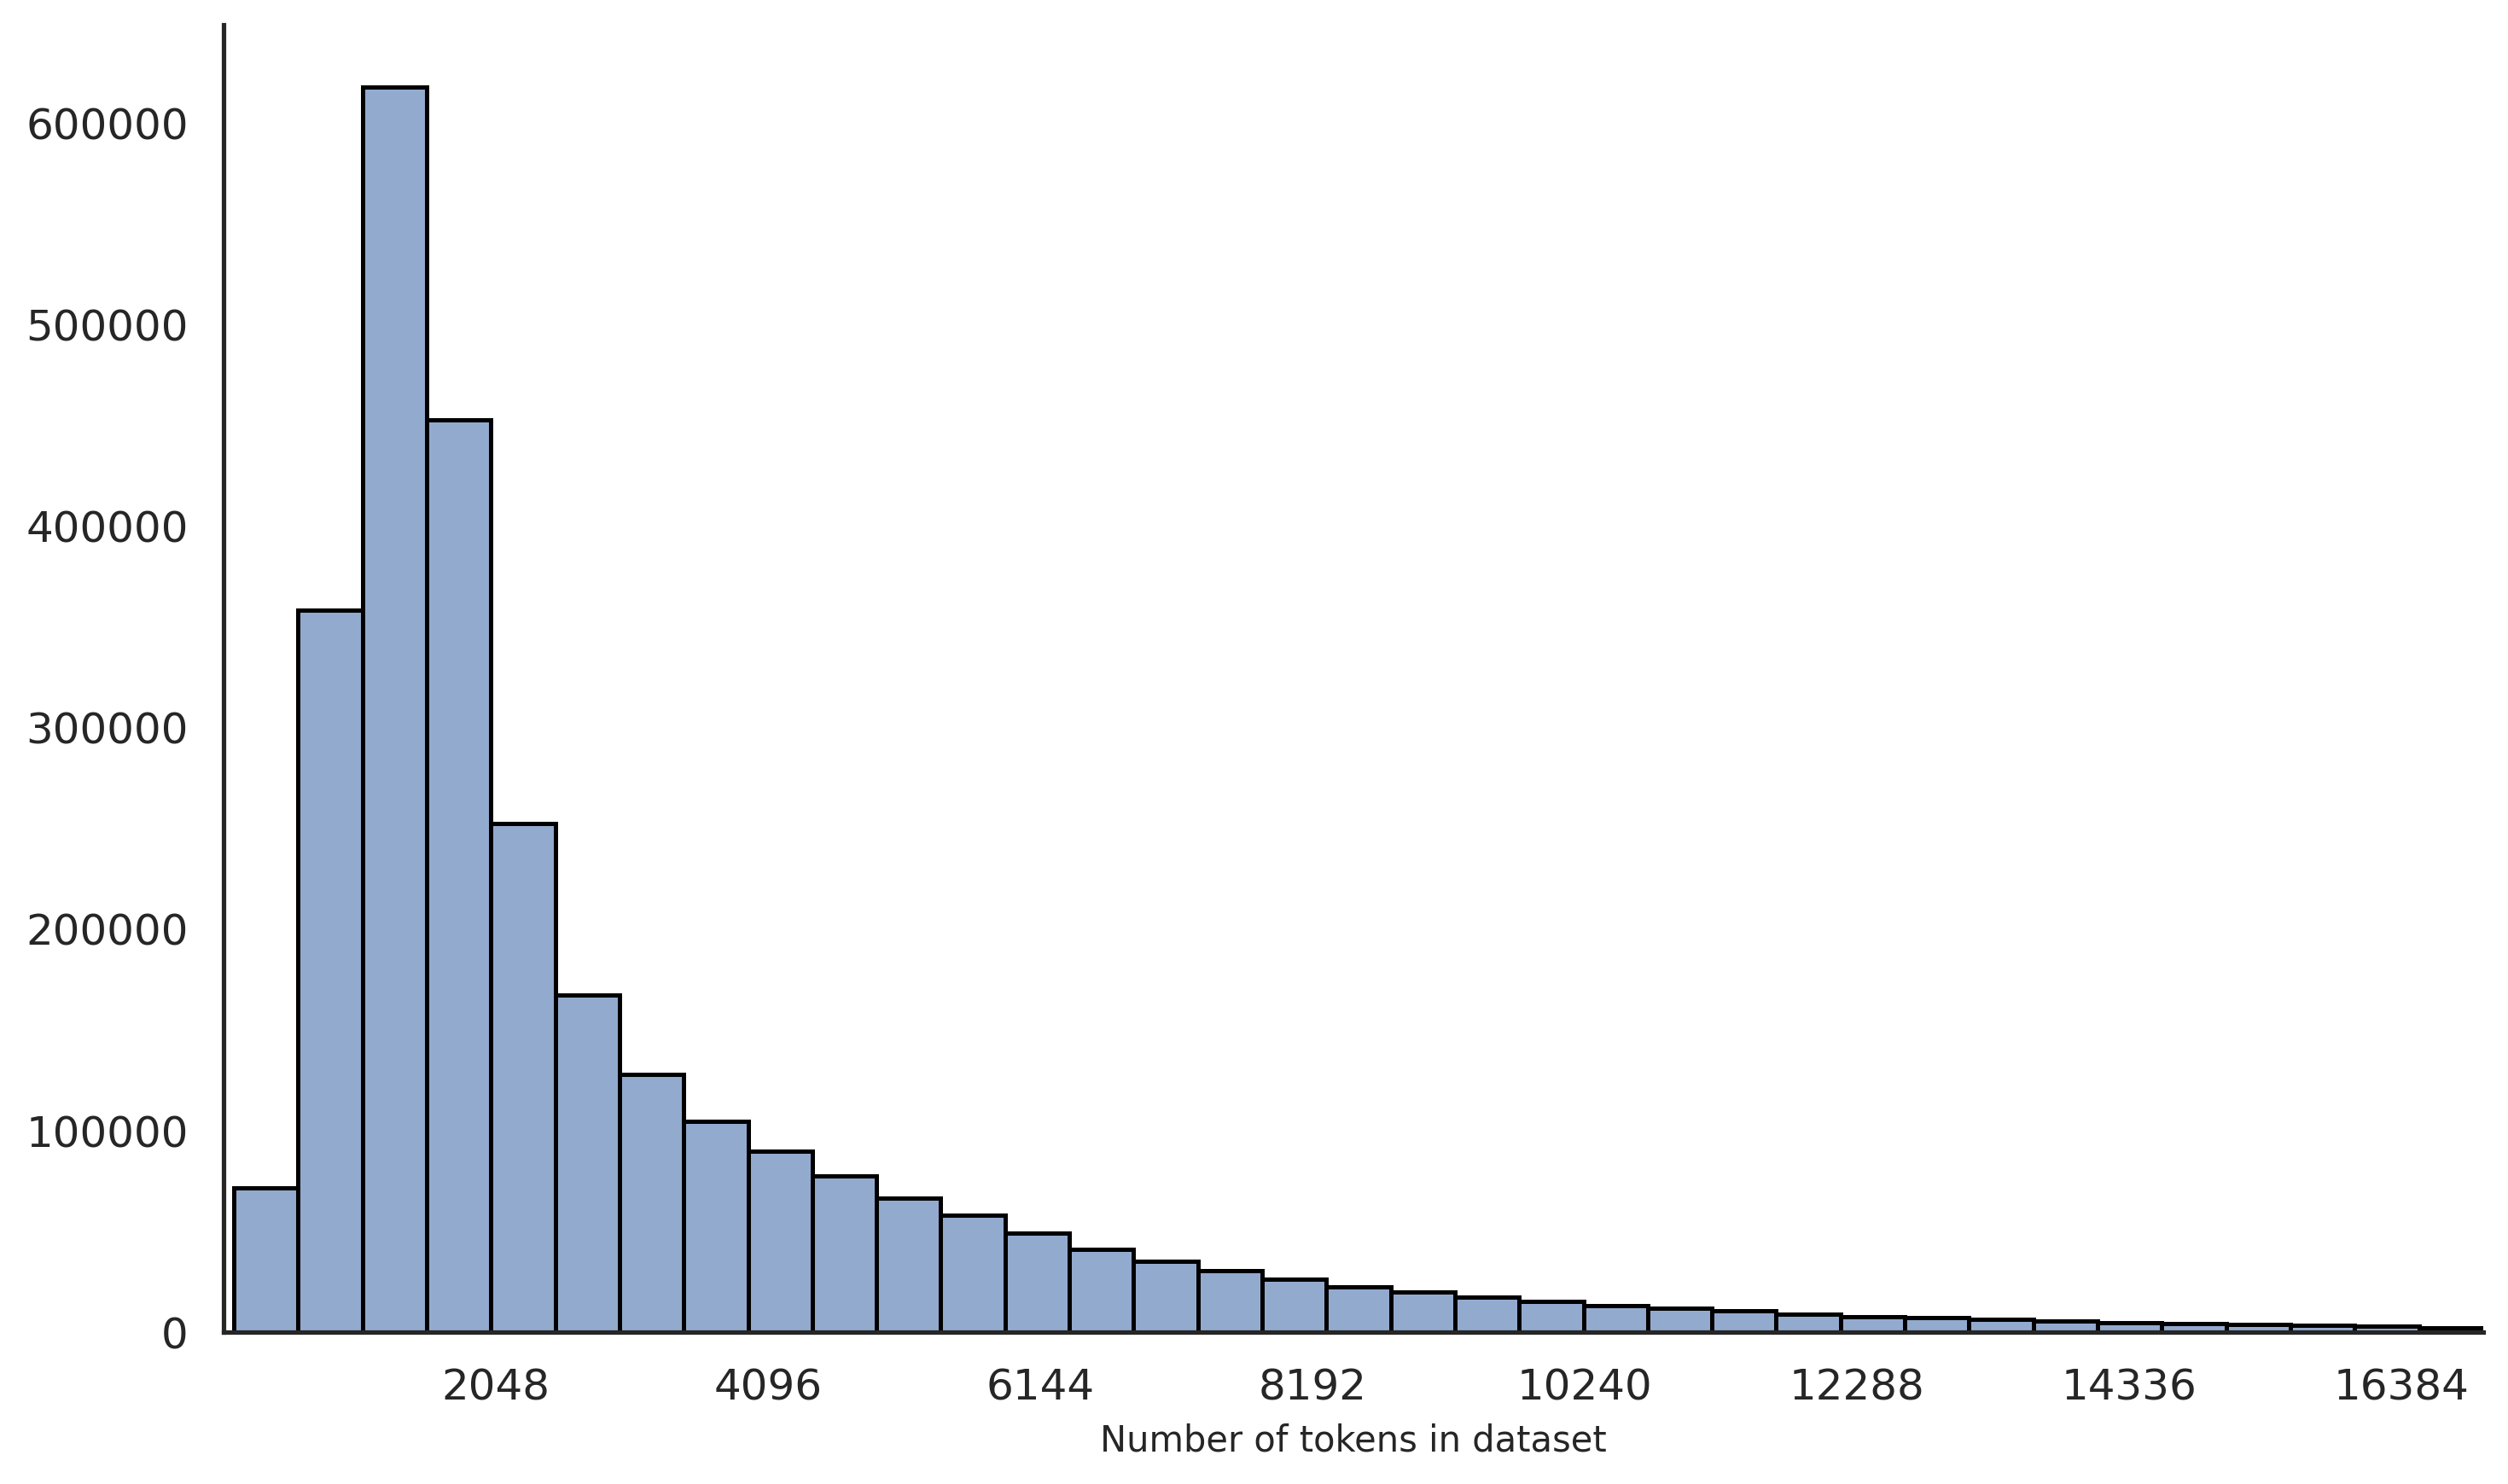
Figure 3: Token length distribution of data entries in the dataset. Most data entries contain fewer than 4096 tokens, with the highest concentration around approximately 2048 tokens. The distribution gradually decreases as the token count increases, indicating fewer samples with longer contexts.
### A.2 Reference Distribution
<details>
<summary>extracted/6308700/test_case_distribution.png Details</summary>
### Visual Description
## Pie Chart: Distribution of Reference Answer and Test Case
### Overview
The chart illustrates the distribution of three categories: "Null," "Have reference answer," and "Have test case." It uses a pie chart format with three distinct color-coded segments. The title is positioned at the top, and the legend is located on the left side of the chart.
### Components/Axes
- **Legend**:
- **Null**: Red (#FF6B6B)
- **Have reference answer**: Blue (#64B5F6)
- **Have test case**: Green (#76FF00)
- **Title**: "Distribution of Reference Answer and Test Case" (top-center)
- **Data Representation**:
- Percentages and absolute counts are annotated within each segment.
- No traditional axes (x/y) are present; the chart is purely categorical.
### Detailed Analysis
1. **Null (Red)**:
- Percentage: 39.2% (exact value: 39.2%)
- Count: 549,238
- Position: Largest segment, occupying the left portion of the pie chart.
2. **Have reference answer (Blue)**:
- Percentage: 38.9% (exact value: 38.9%)
- Count: 543,935
- Position: Second-largest segment, adjacent to the Null segment on the right.
3. **Have test case (Green)**:
- Percentage: 21.9% (exact value: 21.9%)
- Count: 306,818
- Position: Smallest segment, located at the bottom-right of the chart.
### Key Observations
- The "Null" category dominates the dataset, accounting for nearly 40% of the total.
- "Have reference answer" and "Null" are nearly equal in proportion, differing by only 0.3%.
- "Have test case" is significantly smaller, representing less than a quarter of the total.
### Interpretation
The data suggests a near-balance between "Null" and "Have reference answer" categories, with "Null" slightly outpacing the other. The "Have test case" category is a clear outlier, indicating it is less frequently represented in the dataset. This distribution could reflect a scenario where most entries lack test cases or reference answers, with "Null" being the most common state. The proximity of "Null" and "Have reference answer" might imply overlapping criteria or a design choice where reference answers are almost as prevalent as missing data. The stark contrast with "Have test case" highlights its rarity, potentially signaling a need for further investigation into why test cases are underrepresented.
</details>
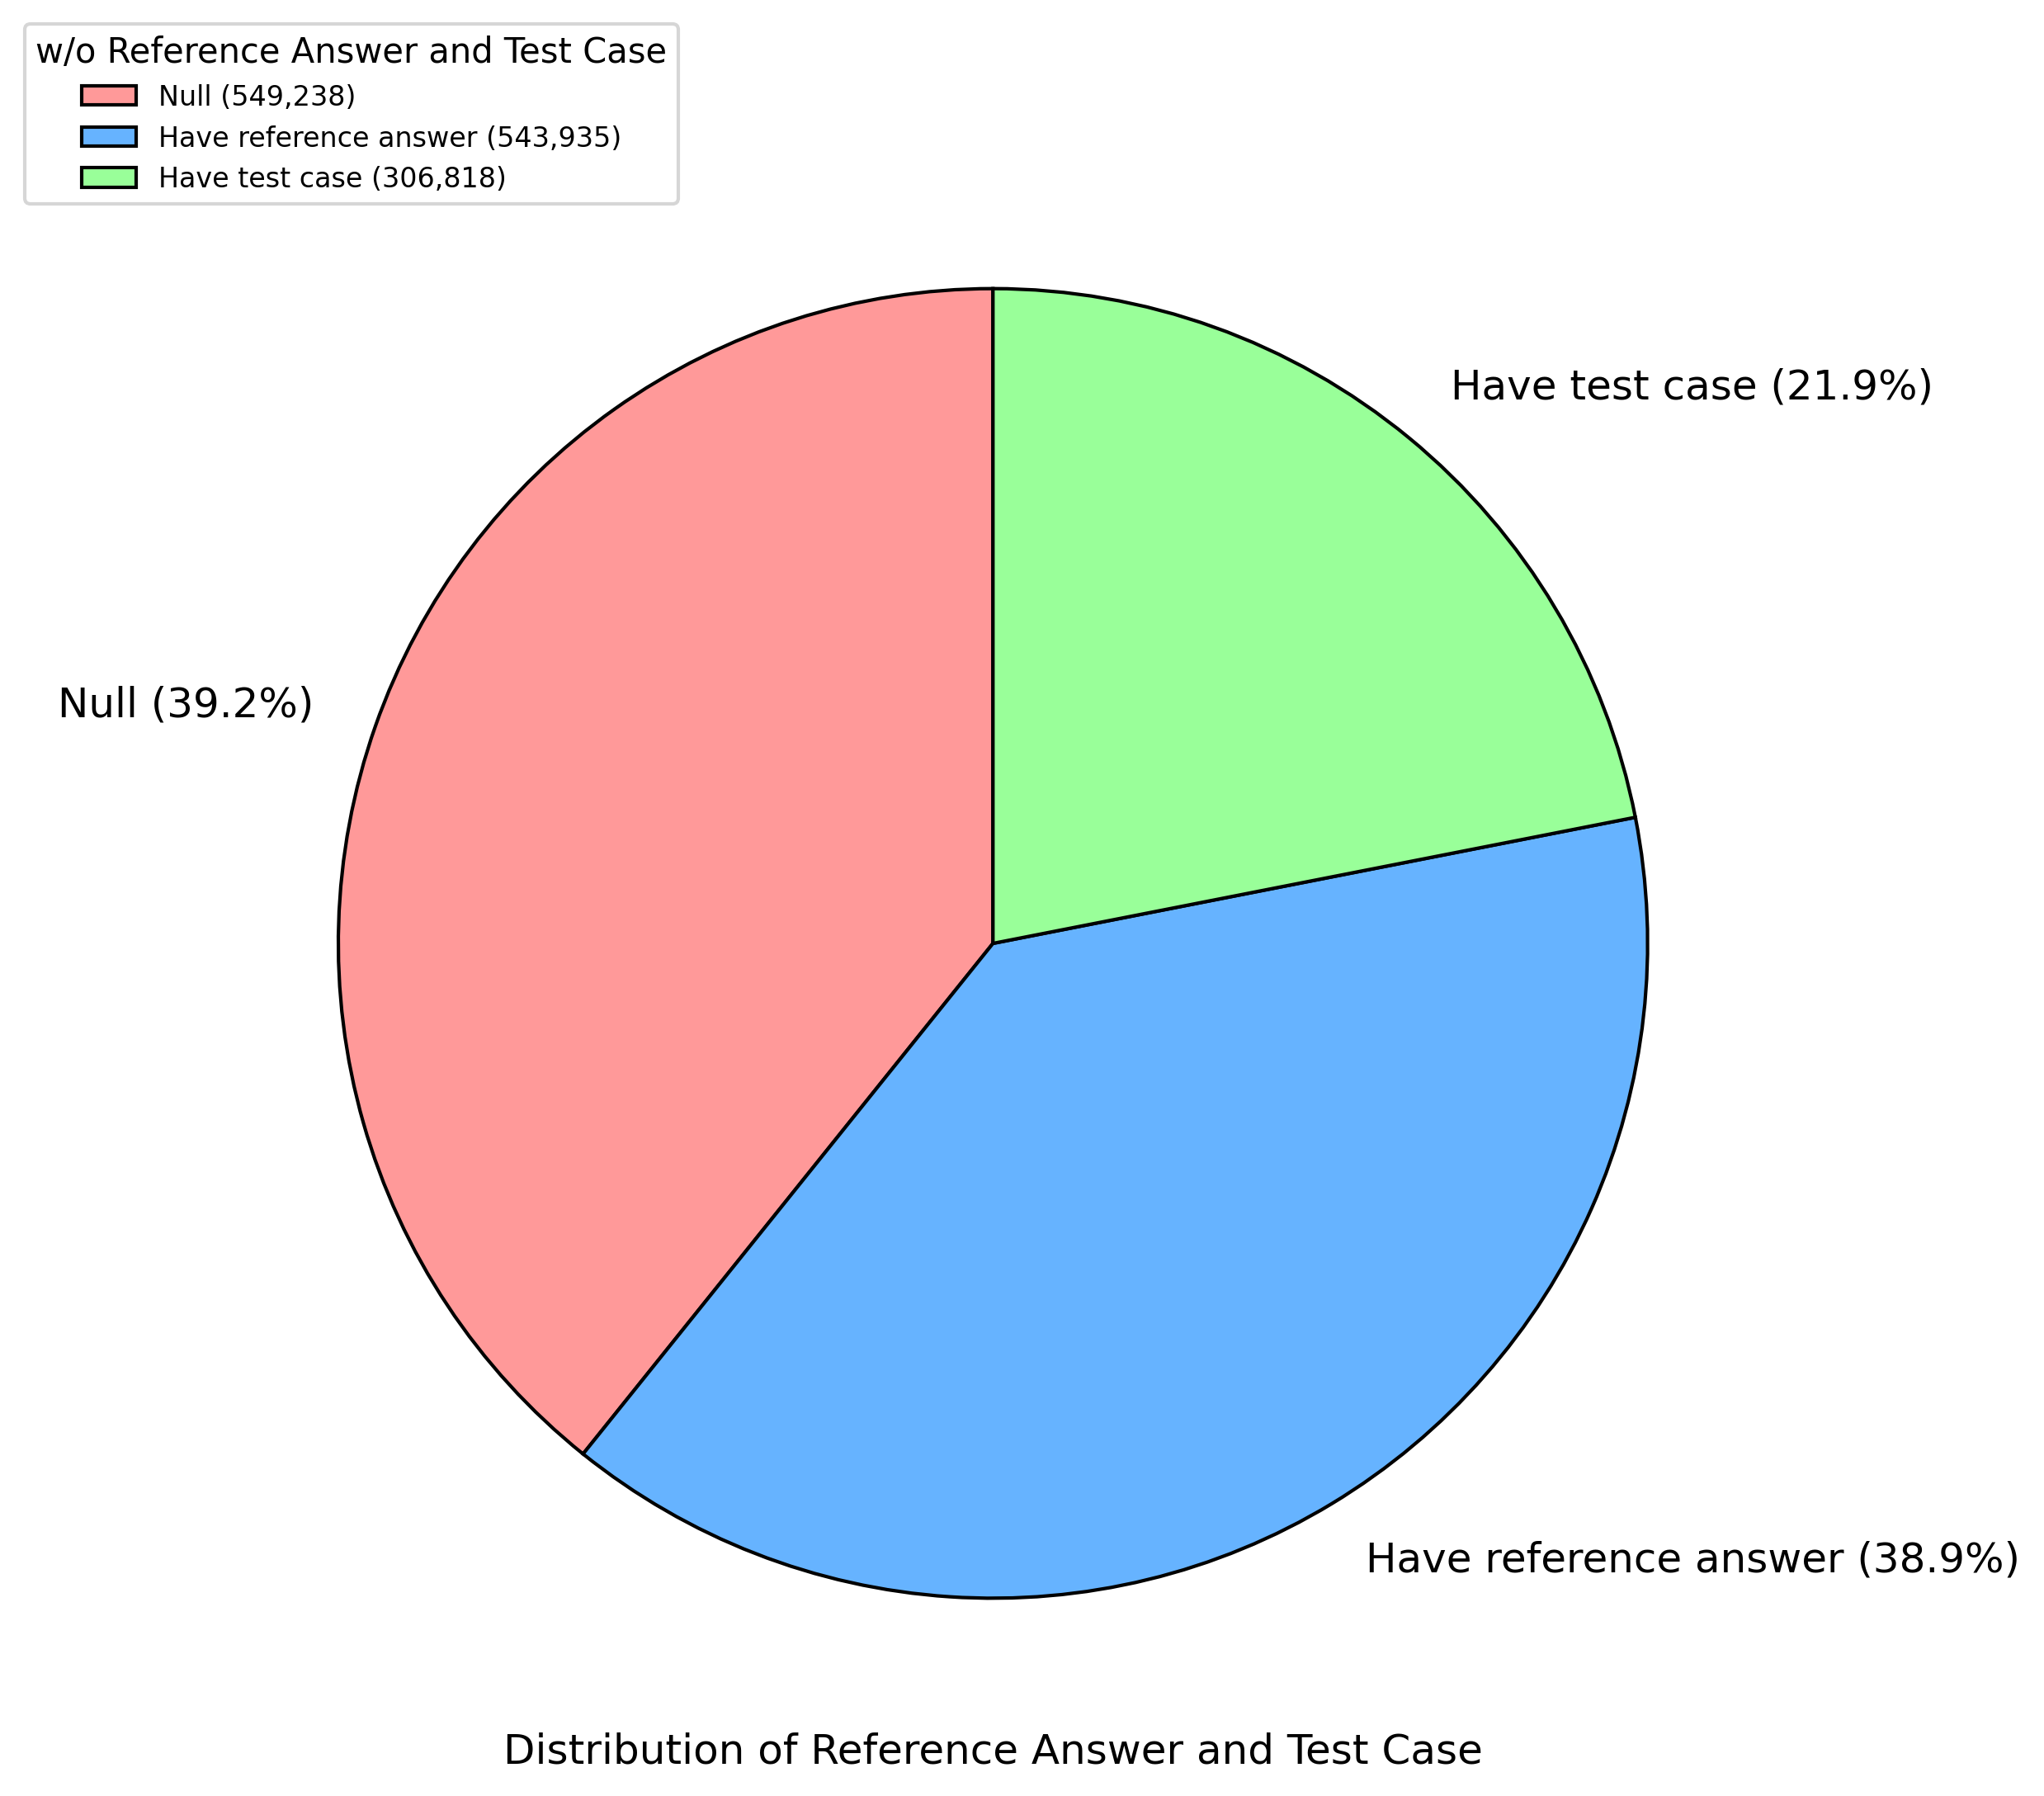
Figure 4: Distribution of reference answers and test cases in the dataset. Among the entries, 38.9% have reference answers, 21.9% include test cases, and 39.2% have neither reference answers nor test cases.
### A.3 Category Distribution
<details>
<summary>extracted/6308700/category_distribution.png Details</summary>
### Visual Description
## Pie Chart: Distribution of Different Categories
### Overview
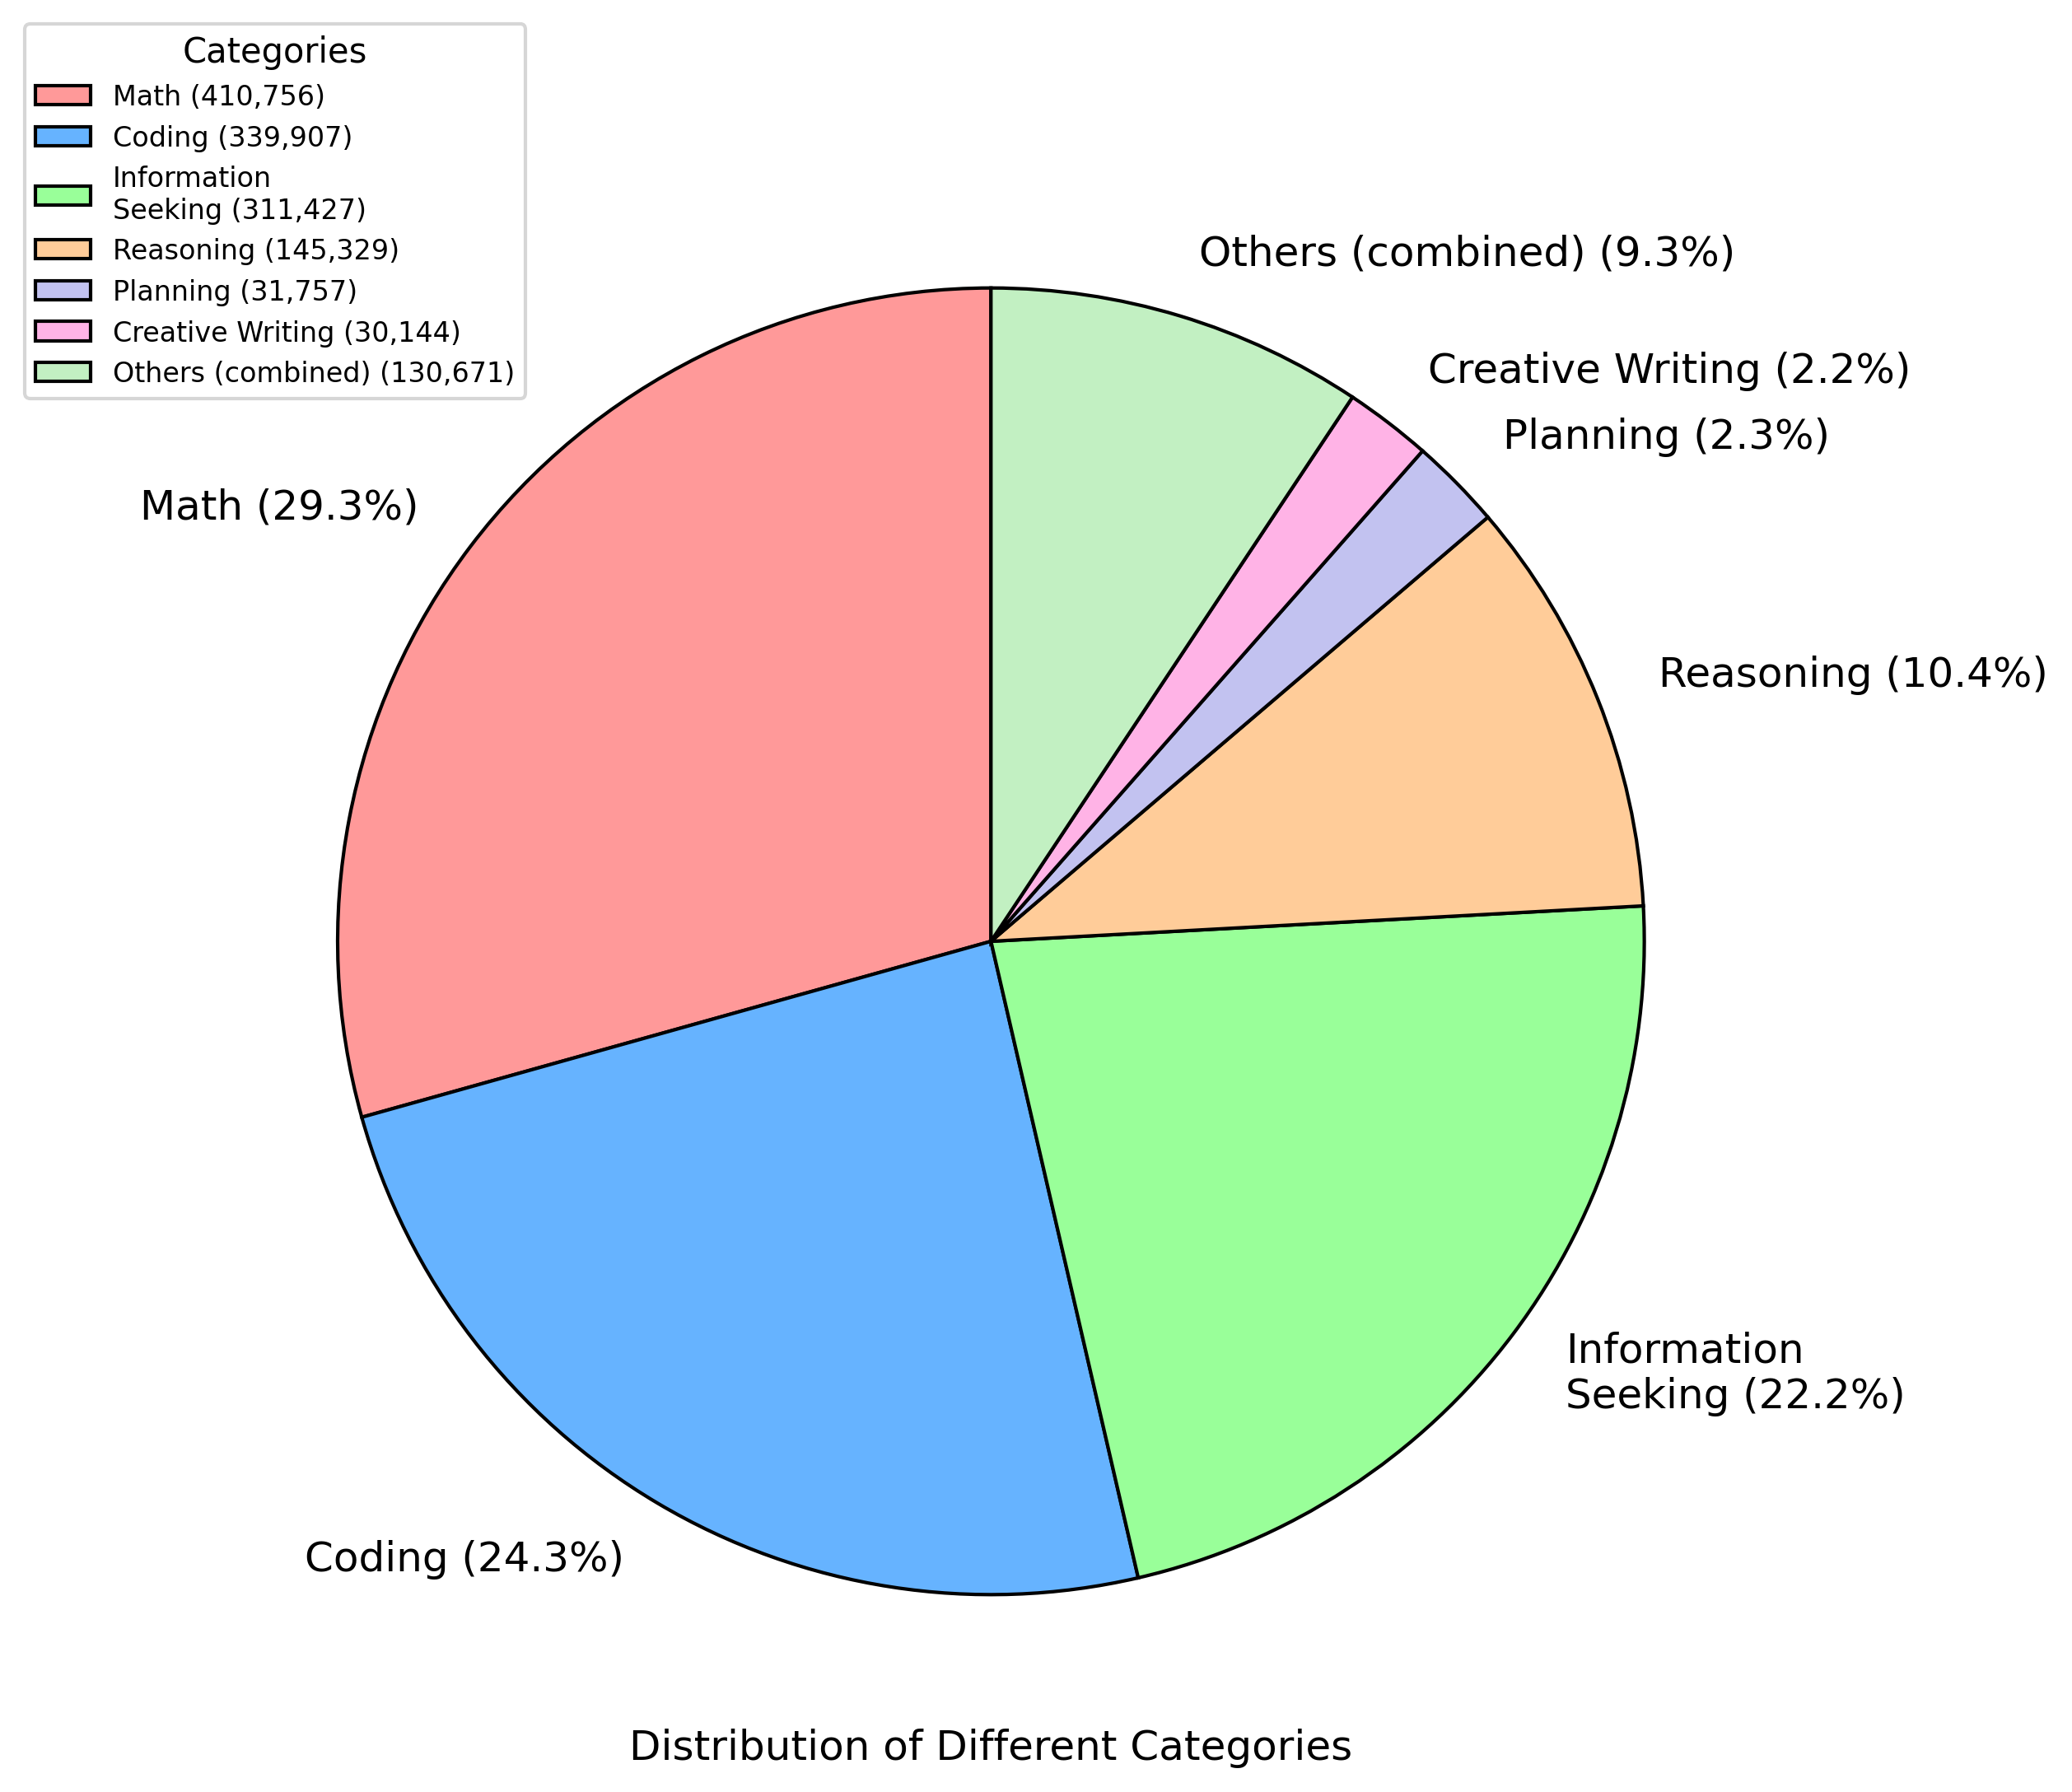
The image displays a pie chart titled "Distribution of Different Categories," visually representing the proportional allocation of seven distinct categories. A legend on the left side maps colors to categories, with numerical values and percentages provided for each. The chart emphasizes the dominance of certain categories while highlighting smaller, less significant segments.
### Components/Axes
- **Legend**: Positioned on the left, the legend includes seven categories with corresponding colors:
- **Math** (Red): 410,756 (29.3%)
- **Coding** (Blue): 339,907 (24.3%)
- **Information Seeking** (Green): 311,427 (22.2%)
- **Reasoning** (Orange): 145,329 (10.4%)
- **Planning** (Purple): 31,757 (2.3%)
- **Creative Writing** (Pink): 30,144 (2.2%)
- **Others (combined)** (Light Green): 130,671 (9.3%)
- **Pie Slices**: Each slice is labeled with the category name and percentage, positioned clockwise starting from the top-left (Math).
### Detailed Analysis
1. **Math (Red)**: Largest slice at 29.3%, occupying nearly 30% of the chart.
2. **Coding (Blue)**: Second-largest at 24.3%, adjacent to Math.
3. **Information Seeking (Green)**: Third-largest at 22.2%, forming a significant portion.
4. **Reasoning (Orange)**: 10.4%, smaller than the top three but still notable.
5. **Planning (Purple)**: 2.3%, a minor segment near the bottom.
6. **Creative Writing (Pink)**: 2.2%, the smallest labeled slice.
7. **Others (combined) (Light Green)**: 9.3%, a moderate-sized slice representing aggregated smaller categories.
### Key Observations
- **Dominance of Core Categories**: Math, Coding, and Information Seeking collectively account for **75.8%** of the total, indicating their critical importance.
- **Smaller Segments**: Planning, Creative Writing, and Others combined make up **13.8%**, with Creative Writing being the smallest individual category.
- **Color Consistency**: All legend colors match their corresponding slices without discrepancies.
### Interpretation
The data suggests a strong emphasis on technical and analytical skills (Math, Coding, Information Seeking), which dominate the distribution. Reasoning represents a mid-tier category, while Planning and Creative Writing are underrepresented. The "Others" category, though aggregated, still constitutes a non-negligible 9.3%, potentially indicating a diverse range of less common categories. The chart highlights a clear hierarchy in priorities, with the top three categories driving the majority of the distribution. This could reflect resource allocation, user behavior, or focus areas in a specific domain (e.g., education, software development, or content creation). The minimal representation of Creative Writing and Planning might signal areas for growth or underinvestment.
</details>
Figure 5: Distribution of data entries across different task categories. The dataset primarily consists of Math (29.3%), Coding (24.3%), and Information Seeking (22.2%) tasks, followed by Reasoning (10.4%), Planning (2.3%), Creative Writing (2.2%), and other combined categories (9.3%).
### A.4 Difficulty Distribution
<details>
<summary>extracted/6308700/difficulty_distribution.png Details</summary>
### Visual Description
## Pie Chart: Distribution of Difficulty
### Overview
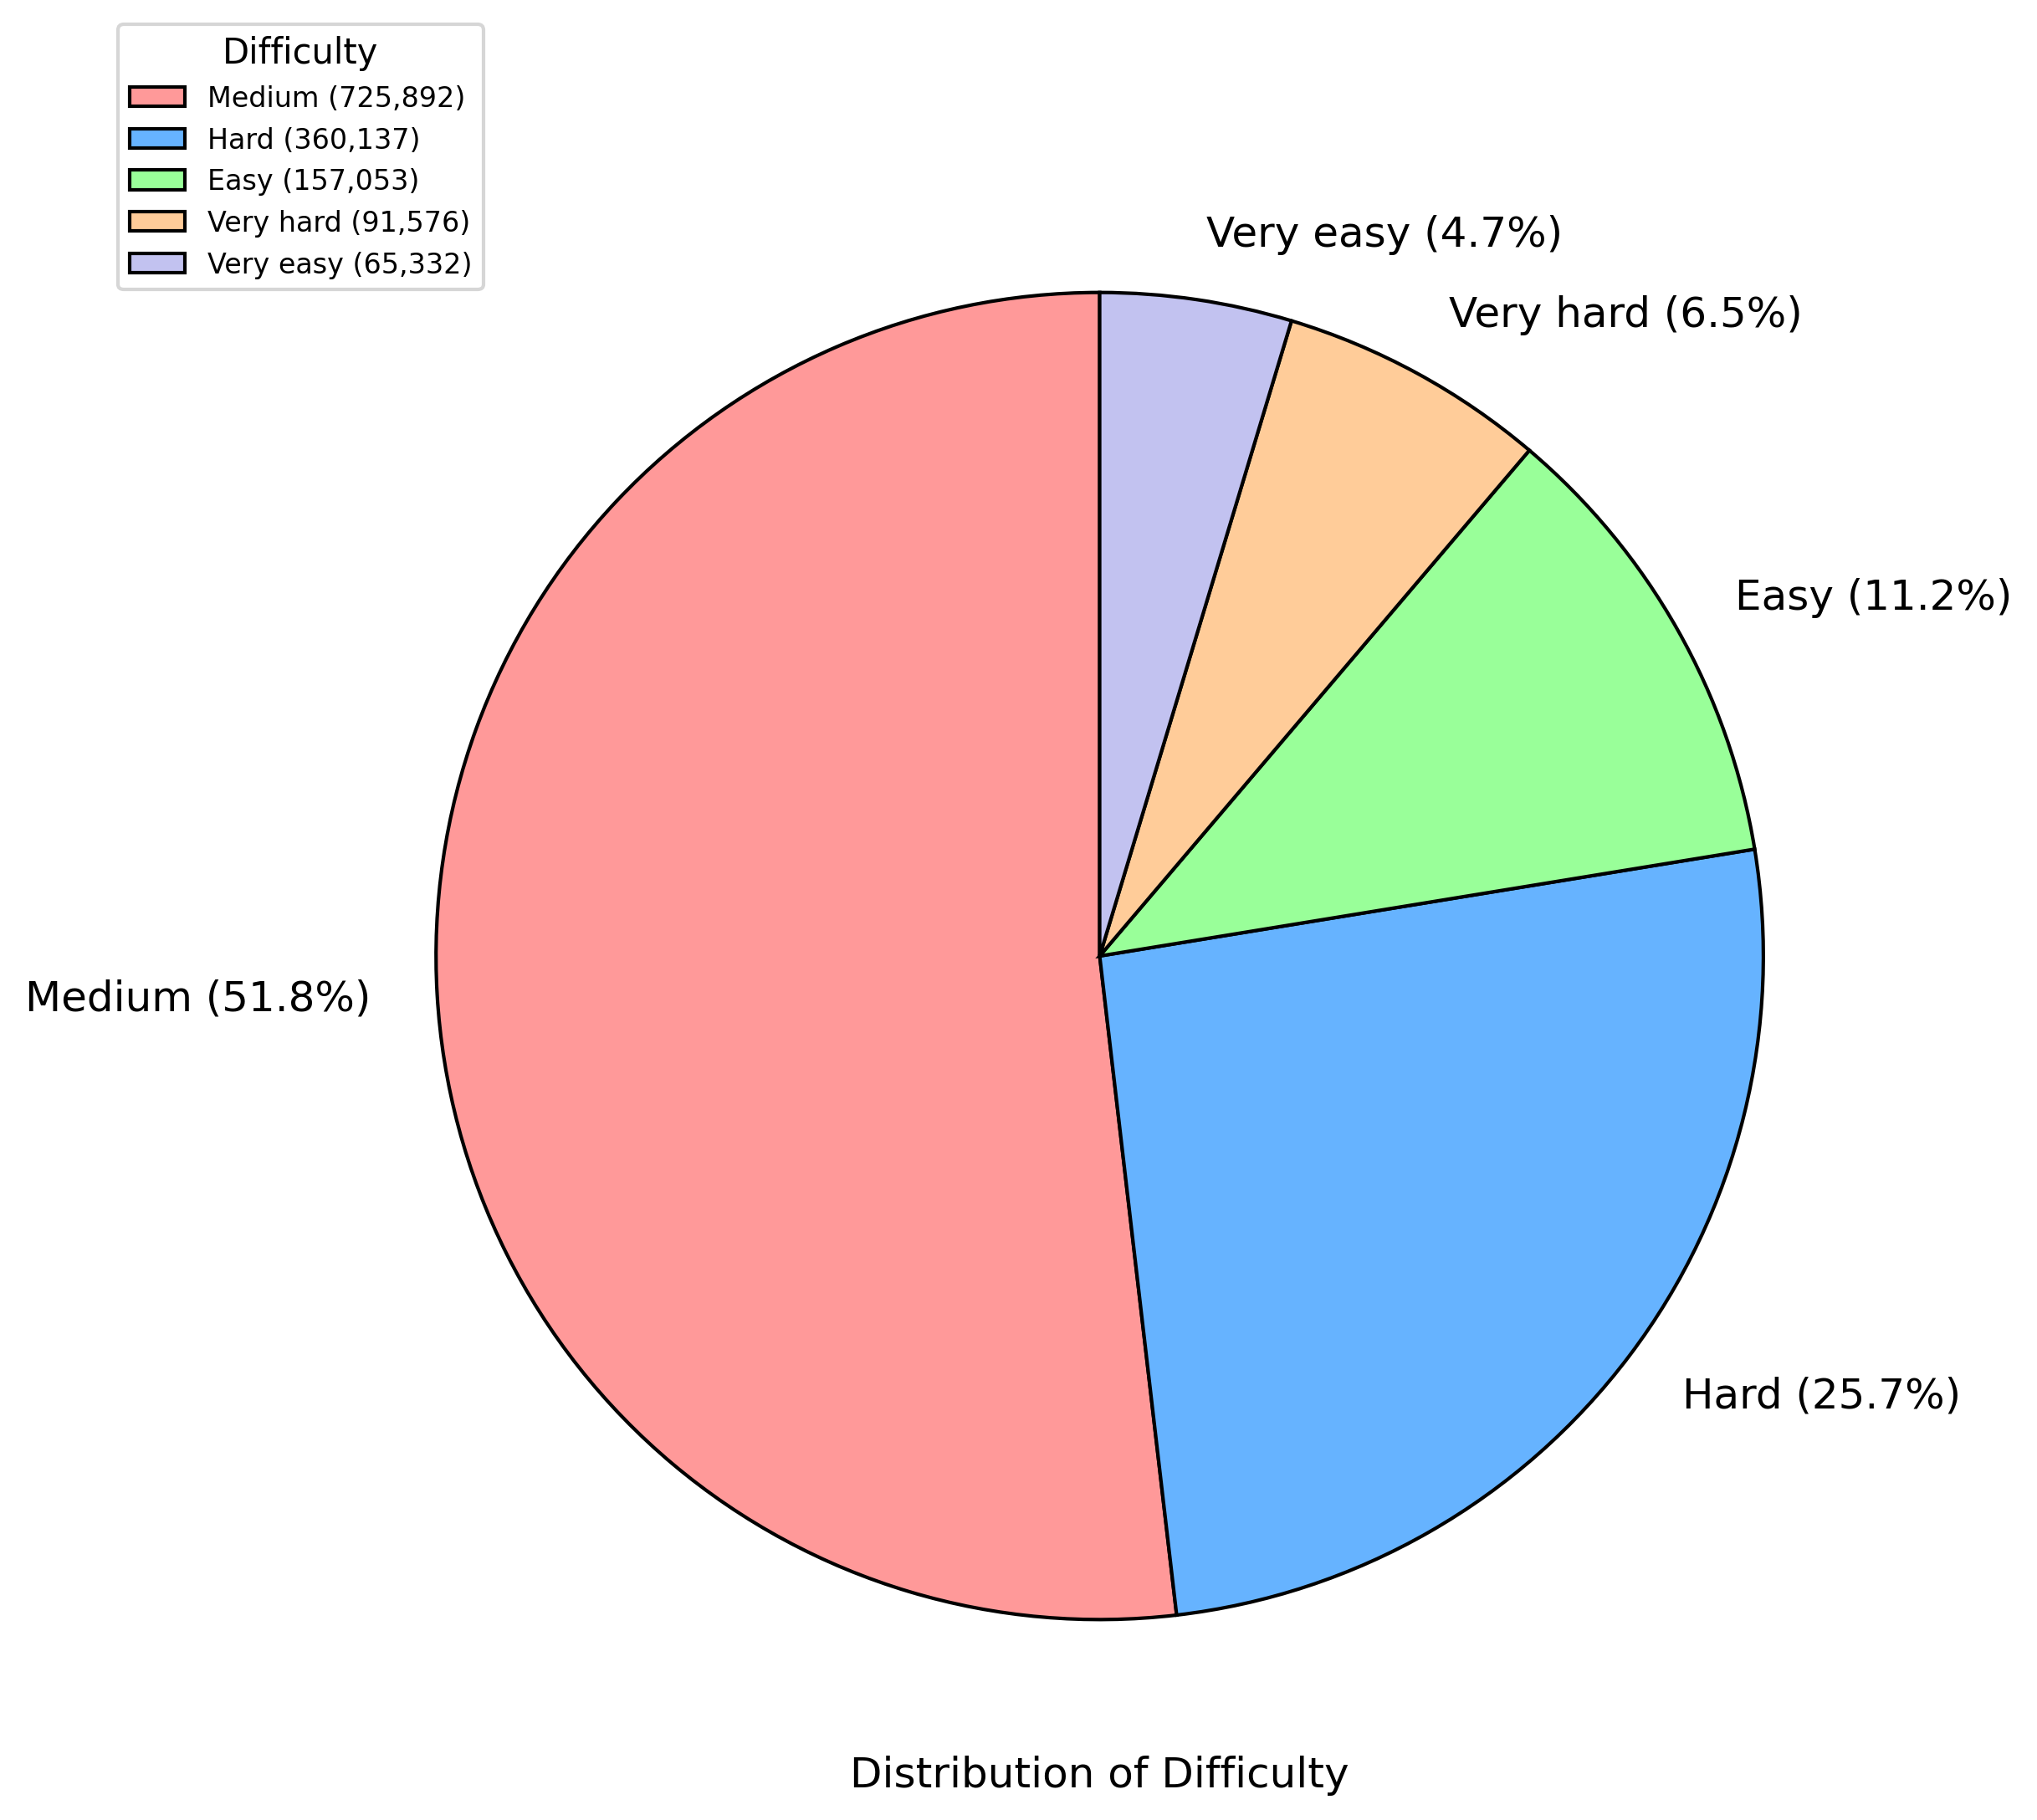
The image depicts a pie chart illustrating the distribution of difficulty levels across five categories: Medium, Hard, Easy, Very Hard, and Very Easy. The chart uses distinct colors for each category, with numerical values and percentages provided for both the total counts and proportional distribution.
### Components/Axes
- **Legend**: Positioned on the left side of the chart, the legend maps colors to difficulty categories:
- **Medium**: Red (725,892, 51.8%)
- **Hard**: Blue (360,137, 25.7%)
- **Easy**: Green (157,053, 11.2%)
- **Very Hard**: Orange (91,576, 6.5%)
- **Very Easy**: Purple (65,332, 4.7%)
- **Chart Title**: "Distribution of Difficulty" (centered above the pie chart).
- **Slices**: Each difficulty category is represented as a wedge in the pie chart, with labels and percentages placed adjacent to their respective sections.
### Detailed Analysis
1. **Medium (Red)**: Dominates the chart at 51.8% (725,892 instances), occupying slightly more than half the pie.
2. **Hard (Blue)**: Second-largest segment at 25.7% (360,137 instances), positioned to the right of the Medium slice.
3. **Easy (Green)**: Occupies 11.2% (157,053 instances), located below the Hard segment.
4. **Very Hard (Orange)**: Smallest non-trivial segment at 6.5% (91,576 instances), situated below the Easy slice.
5. **Very Easy (Purple)**: Smallest segment at 4.7% (65,332 instances), placed at the bottom-right of the chart.
### Key Observations
- **Dominance of Medium Difficulty**: The Medium category accounts for over half of the total, indicating it is the most prevalent difficulty level.
- **Significant Hard Difficulty**: The Hard category represents a quarter of the data, suggesting a notable but secondary prevalence.
- **Minor Extremes**: Easy, Very Hard, and Very Easy categories collectively account for only 22.4% of the data, with Very Easy being the smallest.
### Interpretation
The data suggests a bimodal distribution skewed toward Medium and Hard difficulties, with the extremes (Very Easy and Very Hard) being relatively rare. This could imply:
- A balanced dataset designed to test intermediate and challenging scenarios.
- Potential outliers in the Very Easy and Very Hard categories, which may require further investigation for data quality or contextual relevance.
- The distribution might reflect user performance trends, where most tasks fall into moderate difficulty, while a subset is either overly simplistic or excessively complex.
The percentages sum to 99.9% (due to rounding), confirming the data's internal consistency. The spatial arrangement of slices and legend ensures clarity, with colors and labels directly correlating to their respective segments.
</details>
Figure 6: Difficulty distribution of the data entries. Most of the dataset entries are classified as Medium (51.8%) or Hard (25.7%). A smaller proportion falls into the Easy (11.2%), Very Hard (6.5%), and Very Easy (4.7%) categories.
## Appendix B Prompt
### B.1 Difficulty Rating
To grading difficulty rating, wo use prompt as Table 3.
| ⬇ # Instruction You first need to analyze the given user intent and then label the difficulty level of the user query based on the content of the user query. ## User Query ‘‘‘ {input} ‘‘‘ ## Evaluation Criteria Given the user query, you first need to analyze the user intent and the knowledge needed to solve the task in the user query. Then, rate the difficulty level of the user query as ‘ very easy ‘, ‘ easy ‘, ‘ medium ‘, ‘ hard ‘, or ‘ very hard ‘. Classify the difficulty of the query into one of five levels: - very easy: Basic, straightforward questions requiring minimal reasoning. - easy: Simple factual queries with slightly more depth. - medium: Requires moderate reasoning, explanation, or multi - step processing. - hard: Involves advanced concepts, deeper analysis, or multiple interrelated steps. - very hard: Expert - level queries demanding significant domain expertise, synthesis, or novel problem - solving. ## Output Format Just output the json format answer, don ’ t provide additional explanation Now, please output the difficulty level below in a json format by filling in the placeholders in []: ‘‘‘ json { " difficulty ": "[very easy / easy / medium / hard / very hard]" } ‘‘‘ |
| --- |
Table 3: Difficulty rating prompt.
### B.2 Category Classification
To label category, wo use prompt as Table 4.
| ⬇ # Instruction Please label the task tags for the user query. ## User Query ‘‘‘ {input} ‘‘‘ ## Tagging the user input Please label the task tags for the user query. You will need to analyze the user query and select the most relevant task tag from the list below. all_task_tags = [ " Logic ", # Queries involving logical puzzles, riddles, or formal deductive reasoning. " Information ", # Users ask for specific information or facts about various topics. " Editing ", # Involves editing, rephrasing, proofreading, or other tasks related to the composition of general written content. " Coding ", # Users seek help with writing, reviewing, or fixing code in programming. " Math ", # Queries related to mathematical concepts, problems, and calculations. " Brainstorming ", # Involves generating ideas, creative thinking, exploring possibilities, or assisting with decision - making processes. " Others " # Any queries that do not fit into the above categories or are of a miscellaneous nature. ] ## Output Format: Note that you can only select a single primary tag. Other applicable tags can be added to the list of other tags. Now, please output your tags below in a json format by filling in the placeholders in <...>: ‘‘‘ {{ " primary_tag ": "< primary tag >", " other_tags ": ["< tag 1>", "< tag 2>", ... ] }} ‘‘‘ |
| --- |
Table 4: Category classification prompt.
### B.3 Correctness Rating
To rate correctness, wo use prompt as Table 5.
| ⬇ # Instruction You are an evaluation expert tasked with assessing the correctness of answers provided by a relatively small - sized Language Model (such as a 7 B model) based on three inputs. Assign a score from 1 to 5 according to the following criteria: - Score 5: Completely correct, fully matches the reference answer or accurately addresses the query when the reference answer is not provided. - Score 4: Mostly correct, minor deviations or insignificant errors that do not affect overall meaning. - Score 3: Partially correct, includes key information but contains noticeable errors or omissions. - Score 2: Minimally correct, significant errors or major omissions, answer barely meets requirements. - Score 1: Completely incorrect, fails to address the question or content severely mismatches the query. ### Please score based on the following inputs: - ** Query **: {input_query} - ** Reference Answer:** (May be empty) {reference_answer} - ** LLM Answer **: {llm_answer} ### Provide your score strictly following the output format below: ‘‘‘ {{ " correctness ": "< correctness score >", }} ‘‘‘ ** Justification ** (briefly explain your scoring decision): |
| --- |
Table 5: Correctness Rating prompt.