# Challenging the Boundaries of Reasoning: An Olympiad-Level Math Benchmark for Large Language Models
**Authors**: DataCanvas Alaya NeW. BAAI.
Technical Report on Slow Thinking with LLMs: Evaluation Benchmark
## Abstract
In recent years, the rapid development of large reasoning models has resulted in the saturation of existing benchmarks for evaluating mathematical reasoning, highlighting the urgent need for more challenging and rigorous evaluation frameworks. To address this gap, we introduce OlymMATH, a novel Olympiad-level mathematical benchmark, designed to rigorously test the complex reasoning capabilities of LLMs. OlymMATH features 200 meticulously curated problems, each manually verified and available in parallel English and Chinese versions. The problems are systematically organized into two distinct difficulty tiers: (1) AIME-level problems (easy) that establish a baseline for mathematical reasoning assessment, and (2) significantly more challenging problems (hard) designed to push the boundaries of current state-of-the-art models. In our benchmark, these problems span four core mathematical fields, each including a verifiable numerical solution to enable objective, rule-based evaluation. Empirical results underscore the significant challenge presented by OlymMATH, with state-of-the-art models including DeepSeek-R1, OpenAI’s o3-mini and Gemini 2.5 Pro Exp demonstrating notably limited accuracy on the hard subset. Furthermore, the benchmark facilitates comprehensive bilingual assessment of mathematical reasoning abilities—a critical dimension that remains largely unaddressed in mainstream mathematical reasoning benchmarks. We release the benchmark, evaluation code, detailed results and a data visualization tool at https://github.com/RUCAIBox/OlymMATH.
## 1 Introduction
The advent of large language models (LLMs) [1] has marked a significant leap forward in the capabilities of artificial intelligence, showcasing exceptional performance across a broad spectrum of tasks, and in some cases, even rivaling or exceeding human-level proficiency [2, 3]. Among the myriad of capabilities demonstrated by LLMs, mathematical reasoning has surfaced as a particularly pivotal and demanding area of research [4, 5, 6]. In recent years, the evaluation and enhancement of mathematical reasoning abilities have become a central focus in the development of LLMs [7].
Effective assessment of LLM reasoning necessitates reliable and verifiable evaluation benchmarks. Reliability ensures accurately designed problems and solutions, free from ambiguities or errors. Verifiability demands that the evaluation process be easily constructed, replicated, and validated, often relying on easily parsable answer formats. Many benchmarks adopt a single-answer format, like “ The answer is $3 3 3$ ”, to simplify parsing and enhance reproducibility.
<details>
<summary>x1.png Details</summary>
### Visual Description
## Grouped Bar Chart: AI Model Accuracy on Mathematical Problem Sets
### Overview
The image is a grouped bar chart comparing the accuracy percentages of seven different AI models across four distinct mathematical problem sets. The chart is designed to benchmark model performance on increasingly difficult math competitions and problem collections.
### Components/Axes
* **Y-Axis:** Labeled "Accuracy (%)". The scale runs from 0 to 100 in increments of 10.
* **X-Axis:** Represents four different problem sets, grouped as follows:
1. **AIME 24** (30 Problems)
2. **HMMT 202502** (30 Problems)
3. **OlymMATH-EN-EASY** (100 Problems)
4. **OlymMATH-EN-HARD** (100 Problems)
* **Legend:** Located in the top-right corner. It maps colors to seven AI models:
* Pinkish-Red: **Gemini 2.5 Pro Exp**
* Teal Green: **OpenAI o3-mini (high)**
* Yellow: **Qwen3-235B-A22B**
* Light Blue: **Qwen3-30B-A3B**
* Grey: **DeepSeek-R1**
* Beige: **QwQ-32B**
* Salmon/Orange: **GLM-Z1-AIR**
### Detailed Analysis
**1. AIME 24 (30 Problems)**
* **Trend:** All models perform relatively well, with scores clustered between ~80% and 92%.
* **Data Points (from left to right bar in the group):**
* Gemini 2.5 Pro Exp: **92.0%**
* OpenAI o3-mini (high): **87.3%**
* Qwen3-235B-A22B: **85.7%**
* Qwen3-30B-A3B: **80.4%**
* DeepSeek-R1: **79.8%**
* QwQ-32B: **79.5%**
* GLM-Z1-AIR: **80.8%**
**2. HMMT 202502 (30 Problems)**
* **Trend:** A significant performance drop for all models compared to AIME 24. The spread between models widens considerably.
* **Data Points:**
* Gemini 2.5 Pro Exp: **82.5%**
* OpenAI o3-mini (high): **67.5%**
* Qwen3-235B-A22B: **62.5%**
* Qwen3-30B-A3B: **50.8%**
* DeepSeek-R1: **41.7%**
* QwQ-32B: **47.5%**
* GLM-Z1-AIR: **47.5%** (Note: The bar for GLM-Z1-AIR appears to be the same height as QwQ-32B, but the label is missing. Based on visual alignment, it is approximately 47.5%.)
**3. OlymMATH-EN-EASY (100 Problems)**
* **Trend:** Performance rebounds for most models, with scores again clustered in a high range (76%-92%), similar to the AIME 24 benchmark.
* **Data Points:**
* Gemini 2.5 Pro Exp: **92.2%**
* OpenAI o3-mini (high): **91.4%**
* Qwen3-235B-A22B: **90.5%**
* Qwen3-30B-A3B: **87.2%**
* DeepSeek-R1: **79.6%**
* QwQ-32B: **84.0%**
* GLM-Z1-AIR: **76.8%**
**4. OlymMATH-EN-HARD (100 Problems)**
* **Trend:** A dramatic and universal performance collapse. All models score below 60%, with most below 40%. This indicates a substantial increase in problem difficulty.
* **Data Points:**
* Gemini 2.5 Pro Exp: **58.4%**
* OpenAI o3-mini (high): **31.2%**
* Qwen3-235B-A22B: **36.5%**
* Qwen3-30B-A3B: **26.3%**
* DeepSeek-R1: **19.5%**
* QwQ-32B: **23.1%**
* GLM-Z1-AIR: **20.1%**
### Key Observations
1. **Consistent Leader:** Gemini 2.5 Pro Exp (pinkish-red bar) is the top-performing model on every single benchmark.
2. **Difficulty Cliff:** There is a stark performance cliff between the "EASY" and "HARD" OlymMATH sets. The highest score drops from 92.2% to 58.4%, and the lowest from 76.8% to 19.5%.
3. **Model Hierarchy Shift:** While the general order of model performance is somewhat preserved across benchmarks, there are notable shifts. For example, Qwen3-235B-A22B (yellow) is often the second or third best, but on the hardest set (OlymMATH-EN-HARD), it outperforms OpenAI o3-mini (high).
4. **Performance Clustering:** On the easier tasks (AIME 24, OlymMATH-EN-EASY), models form a tight cluster. On harder tasks (HMMT 202502, OlymMATH-EN-HARD), the performance gap between the top model and the rest widens significantly.
### Interpretation
This chart provides a comparative snapshot of AI reasoning capabilities in mathematics. The data suggests several key insights:
* **Benchmark Sensitivity:** Model performance is highly sensitive to the specific benchmark. Success on one type of math competition (AIME) does not guarantee similar success on another (HMMT), even when problem counts are equal.
* **The "Hard Problem" Barrier:** The catastrophic drop in scores on OlymMATH-EN-HARD reveals a current frontier in AI mathematical reasoning. The problems in this set likely require deeper abstraction, multi-step logical chains, or creative problem-solving approaches that current models struggle with, despite excelling at more standardized competition problems.
* **Model Robustness:** Gemini 2.5 Pro Exp demonstrates the most robust performance, maintaining a significant lead even as difficulty spikes. This could indicate superior generalization or a more advanced underlying reasoning architecture.
* **Practical Implications:** For users or developers selecting a model for mathematical tasks, the choice depends heavily on the expected problem difficulty. For "easier" competition-level math, several models are highly capable. For research-level or exceptionally hard problems, the field has a significant gap to close, with one model currently leading the pack.
**Language Note:** All text in the image is in English.
</details>
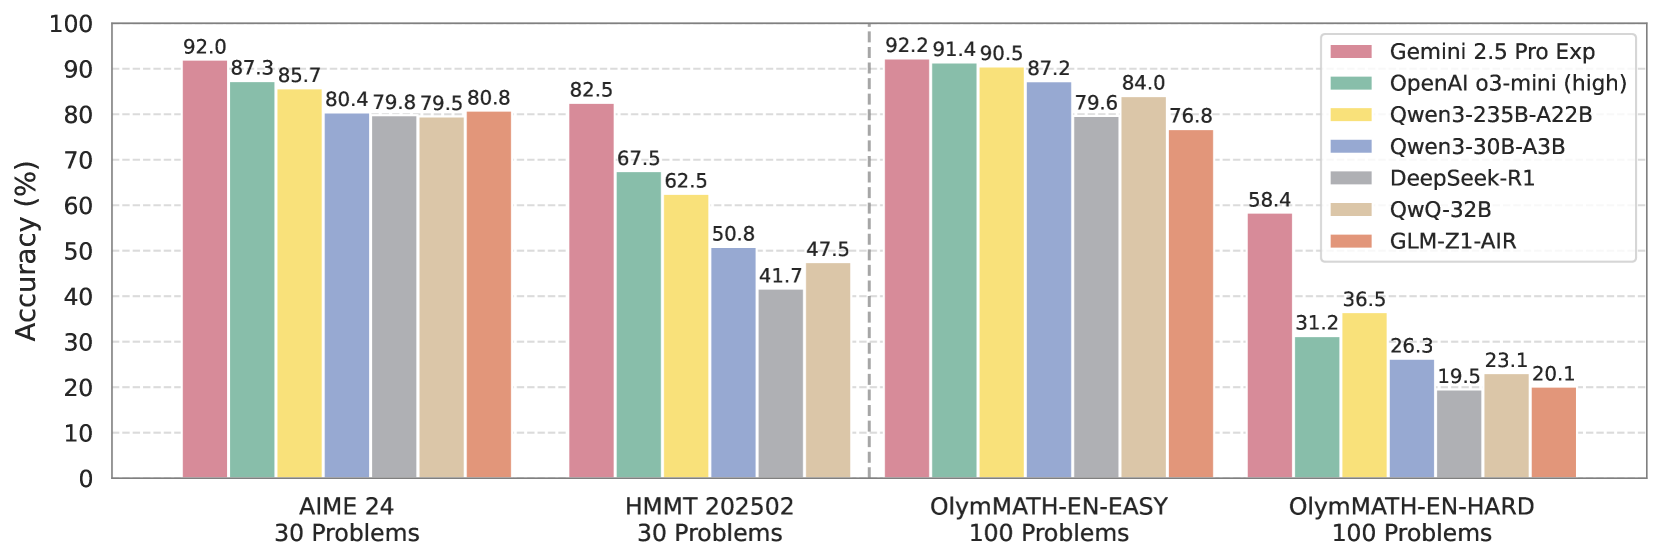
Figure 1: Performance comparisons of mainstream reasoning models between our OlymMATH (English version) and other Olympiad-level mathematical benchmarks. Our OlymMATH dataset provides test results that align with those on existing benchmarks and features a significantly larger number of problems.
Evaluation benchmarks are primarily established to identify LLM limitations, and guiding future improvements. Over recent years, numerous high-quality mathematical benchmarks, such as GSM8K [8] and MATH [9], have been pivotal in advancing LLM reasoning capabilities [10, 11]. However, a significant trend is the saturation of many benchmarks, including those currently in use, due to rapid LLM advancements. For example, GSM8K [8], once a standard for earlier models like Llama 1 and 2, is now largely mastered by state-of-the-art models. Similarly, MATH [9], initially challenging for GPT-4-level models, has also become saturated by today’s leading models. This saturation is further compounded by slow-thinking models like DeepSeek-R1 [4], OpenAI’s o3-mini [12], and Gemini 2.5 Pro Experimental [13]. These models, which promote deliberate step-by-step reasoning, show that enhancing the reasoning process yields substantial performance gains, thereby diminishing the effectiveness of existing benchmarks in differentiating cutting-edge capabilities.
To better evaluate the performance of advanced reasoning models, more rigorous and challenging benchmarks are needed to assess their mathematical reasoning capabilities. The AIME dataset has emerged as a more demanding benchmark by incorporating problems from the American Invitational Mathematics Examination (AIME), which presents a higher level of difficulty. Due to their complexity and rigor, AIME problems continue to challenge state-of-the-art models under standard prompting. Nevertheless, the AIME dataset has three major limitations. First, the limited scale of the current dataset (containing merely 30 problems from AIME 2024) may compromise the statistical reliability and robustness of the evaluation results. Second, as reasoning models rapidly improve—through methods like fine-tuning with long chain-of-thought data [14] or reinforcement learning scaling [4] —the benchmark’s original performance ceiling is being surpassed. For example, models such as Gemini 2.5 Pro Exp now achieve 92% accuracy with single attempt, demonstrating that current top-performing models are approaching the limits of what AIME can effectively measure. Third, the dataset exclusively features English problems, leaving multilingual reasoning capabilities unassessed despite their importance for a comprehensive evaluation.
To overcome these limitations, we present OlymMATH: a rigorously curated, bilingual (English and Chinese) benchmark for Olympiad-level reasoning, comprising 200 problems split into easy (OlymMATH-EASY) and hard (OlymMATH-HARD) levels with parallel bilingual sets (EN & ZH). To prevent data leakage, problems were manually sourced from printed publications and expert-verified. OlymMATH requires precise numerical answers for reliable verification, covers four major mathematical fields, and adheres to the MATH dataset [9] format for compatibility (see Figure 2).
MATH Dataset
Problem: Compute:
$$
1-2+3-4+5-\dots+99-100.
$$
Answer: $-50$ .
Problem: Let $n$ be a positive integer. Simplify the expression
$$
\frac{(2^4+\frac{1}{4})(4^4+\frac{1}{4})\dotsm[(2n)^4+\frac{1}{4}]}{(1^
4+\frac{1}{4})(3^4+\frac{1}{4})\dotsm[(2n-1)^4+\frac{1}{4}]}.
$$
Answer: $8n^2+4n+1$ .
v
OlymMATH-HARD (Ours) Problem-EN: UTF8gbsn Find the remainder of $∑_k=0^1234\binom{2016× 1234}{2016k}$ modulo $2017^2$ (provide the value in the range $[0,2017^2)$ ). Answer: $1581330$ . Subject: Number Theory. OlymMATH-EASY (Ours) Problem-ZH: UTF8gbsn 设 $O$ 为 $\triangle ABC$ 的内心, $AB=3$ , $AC=4$ , $BC=5$ , $\overrightarrow{OP}=x\overrightarrow{OA}+y\overrightarrow{OB}+z\overrightarrow {OC}$ , $0≤slant x,y,z≤slant 1$ . 求动点 $P$ 的轨迹所覆盖的平面区域的面积. Answer: $12$ . Subject: UTF8gbsn几何.
Figure 2: Examples from the MATH dataset and our OlymMATH dataset.
By leveraging the OlymMATH benchmark, we conduct extensive experiments to evaluate the performance of several state-of-the-art models (see Figure 1). The results underscore our benchmark’s difficulty, with advanced models like DeepSeek-R1 [4], o3-mini [12], and Gemini 2.5 Pro Exp [13] achieving only 19.5%, 31.2%, and 58.4% accuracy, respectively, on OlymMATH-EN-HARD, indicating Olympiad-level math remains a significant challenge necessitating further research. Our multilingual comparison showed a consistent performance gap, with higher accuracy on English problems versus Chinese, highlighting the need for multilingual evaluation. Furthermore, case studies revealed models sometimes use heuristic “guessing” to reach answers without rigorous proofs. This underscores the importance of process-level inspection for accurate LLM capability assessment.
In summary, our contribution are as follows:
$\bullet$ We introduce OlymMATH, a manually curated, Olympiad-level mathematical benchmark. It features parallel English and Chinese versions for objective, bilingual evaluation of LLM mathematical reasoning, with answers efficiently verifiable using sympy -based tools.
$\bullet$ Experiments demonstrate OlymMATH’s reliability (aligned with AIME) and strong discriminative power; even state-of-the-art models achieve only moderate scores, highlighting OlymMATH’s potential to drive LLM reasoning advancements.
$\bullet$ Detailed analyses and case studies reveal key model limitations in complex problem-solving, including performance disparities between English and Chinese problems and instances of heuristic “guessing” rather than rigorous deduction.
$\bullet$ We open-source evaluation results and resources, including sampled long chain-of-thought reasoning trajectories (582,400 entries from 28 models on 400 problems), a data visualization tool, and standard solutions for problems where all LLMs struggled, to facilitate community research and analysis on diverse reasoning patterns and common reasoning issues.
## 2 Benchmark Construction
In this section, we describe the OlymMATH dataset in detail, including its construction methodology, problem composition, categorical distribution, and evaluation approach. Our dataset is specifically designed to provide a rigorous yet objectively verifiable benchmark for assessing the mathematical reasoning capabilities of LLMs. Additionally, we offer two parallel evaluation sets containing 200 problems each in English and Chinese as supplementary data to facilitate a comparative analysis of performance gaps between the two languages. Table 1 presents a basic comparison of our proposed OlymMATH benchmark and other mathematical reasoning benchmarks.
Table 1: Comparison of existing benchmarks. EN and ZH denote English and Chinese, respectively.
columneven = c, column3 = c, column5 = c, hline1,12 = -0.08em, hline2,10 = -0.05em, Name & # Problems # Field Language Evaluation Difficulty GSM8K [8] 1319 - EN Rule Grade School MATH [9] 5000 6 EN Rule Competition AIME 2024 [15] 30 - EN Rule Olympiad AIME 2025 [16] 30 - EN Rule Olympiad HMMT 202502 [17] 30 - EN Rule Olympiad USAMO 2025 [18] 6 - EN LLM Olympiad Olympiad Bench [19] 8476 3 ZH & EN Rule CEE & Olympiad Omni-MATH [20] 4428 33+ EN LLM Olympiad OlymMATH-EN 200 4 EN Rule Olympiad OlymMATH-ZH 200 4 ZH Rule Olympiad
### 2.1 Reliability: Contamination and Verification
#### Contamination
OlymMATH comprises 200 high-quality mathematical problems at the Olympiad level, meticulously curated from printed resources to ensure both quality and originality. These problems were manually gathered from a range of authoritative sources, including specialized magazines, textbooks, and official competition materials. To minimize the risk of data contamination, online repositories and forums were intentionally excluded from the sourcing process. This methodology ensures that the problems are intellectually challenging and representative of advanced mathematical reasoning, while also minimizing prior exposure on publicly accessible digital platforms. Consequently, OlymMATH serves as a reliable benchmark for evaluating the real capabilities of LLMs in solving complex mathematical tasks.
#### Verification
To enhance dataset reliability, we invited a China Mathematical Olympiad silver medalist and two provincial first-prize winners to verify and revise the problems and solutions. Since the answers to the problems were already provided, the verification difficulty was reduced, making the expertise of reviewers sufficient for this task. Each problem was reviewed by at least two reviewers. Additionally, official solutions for challenging problems are published for community oversight.
### 2.2 Problem Categories and Distribution
OlymMATH problems span four key high-school Olympiad mathematical fields—algebra, geometry, number theory, and combinatorics—classified by experts (not LLMs) for reliability. Problems are selected for their challenge, suitability for simple-answer verification, and topic diversity (e.g., inequalities, sequences, and more in algebra). Figure-based problems within this set are text-reformulated for LLM compatibility, with non-convertible ones excluded (e.g., Figure 6 in Appendix).
For refined evaluation, problems are categorized by difficulty: easy, designed to challenge standard prompting in mainstream models, and hard, tailored to test advanced reasoning (e.g., slow-thinking modes) in state-of-the-art models. The distribution details are described in Table 2.
Table 2: The distribution of contest problems by category.
cells = c, cell61 = c=2, hline1,7 = -0.08em, hline2,6 = -0.05em, Category & Topic # HARD # EASY # Total Algebra (Alg.) Inequality, Sequence, Trigonometry, etc. 25 25 50 Geometry (Geo.) Solid Geometry, Analytic Geometry, etc. 25 33 58 Number Theory (Num.) Divisibility, Diophantine Equation, etc. 25 13 38 Combinatorics (Com.) Graph Theory, Permutation, etc. 25 29 54 Total 100 100 200
### 2.3 Format and Verification Methodology
OlymMATH adopts the MATH dataset format (see Figure 2) for seamless integration with existing pipelines and enhancing clarity and processing efficiency. All problems are text-based, including geometry reformulated from diagrams to align with LLM evaluation, as mentioned previously. For consistent, objective assessment, answers are restricted to real numbers and intervals (see Table 3), avoiding ambiguous formats and enabling reliable sympy -based and numerical verification.
Table 3: The included and excluded formats of the final answer.
width = colspec = Q[c,m,wd=0.16] X[l,m] X[l,m], cell12 = halign=c, cell13 = halign=c, cell31 = r=2c, hline1,Z = 0.08em, solid, hline2 = 0.05em, solid, hline3 = 0.05em, solid & Type & Example Type & Example Included Real number: $16^∘$ , $2^2017+\arctan 2$ Interval: $[√{33},+∞)$ , $(4,5π]$ Excluded Set Operations: $\{4,5\}∪\{1,8\}$ Variable: $√[3]{5}a^2$ , $p^2-pq$ , $n!+2$ Complex number: $9+4i$ , $√{-4}$ Text: East, Alice
To make the evaluation more challenging, OlymMATH includes problems with multiple numerical answers. These problems are modified to require a summary of all potential outcomes (e.g., sums, sums of squares; see Figure 7 in Appendix). This method effectively assesses whether models can consider all possible answers, thereby providing a robust evaluation of their reasoning capabilities.
### 2.4 Bilingual Extension
Originating from Chinese-language problems, the OlymMATH benchmark includes both original Chinese and translated English versions for comprehensive bilingual evaluation. Our LLM-based translation pipeline first uses Claude Sonnet 3.7 for initial English translations, which are then iteratively refined with GPT-4o. Finally, a crucial human verification stage by two expert annotators ensures mathematical accuracy, rigor, and linguistic fluency. These resulting parallel sets, OlymMATH-EN (English) and OlymMATH-ZH (Chinese) (see Figure 2), facilitate systematic comparison of cross-lingual reasoning, with their union denoted as OlymMATH (full set).
## 3 Experiments
In this section, we assess the performance of leading reasoning models using the OlymMATH benchmark and then provide a detailed analysis of their capabilities.
### 3.1 Experimental Setup
#### Models.
To conduct a thorough evaluation, we assess a range of representative LLMs. For open-source models, we investigated recent work on reasoning models, and evaluated DeepSeek-R1 series [4], STILL-3-Preview [21], DeepScaleR-Preview [22], QwQ [23], Light-R1 series [24], OpenThinker2 series [25], Skywork-OR1 series [26], GLM-Z1-Air [27], AceMath-RL [28], OpenMath-Nemotron series [29], and Qwen3 series [30]. For closed-source models, we include o3-mini (high) [12], Gemini 2.5 Pro Experimental 0325 [13] in our evaluation.
Table 4: Model performance on OlymMATH-EN. Models within each model size group are sorted by release time. The abbreviations “Alg.”, “Geo.”, “Num.”, and “Com.” represent the four categories in OlymMATH. Highest accuracy per model size is bolded. The second highest accuracy per model size is underlined. Models sampled only 8 times are marked in gray to indicate potential instability.
| Model | OlymMATH-EN-HARD | OlymMATH-EN-EASY | | | | | | | | | | | | | | | | | | |
| --- | --- | --- | --- | --- | --- | --- | --- | --- | --- | --- | --- | --- | --- | --- | --- | --- | --- | --- | --- | --- |
| Alg. | Geo. | Num. | Com. | Avg. | Alg. | Geo. | Num. | Com. | Avg. | | | | | | | | | | | |
| P@1 | C@k | P@1 | C@k | P@1 | C@k | P@1 | C@k | P@1 | C@k | P@1 | C@k | P@1 | C@k | P@1 | C@k | P@1 | C@k | P@1 | C@k | |
| Qwen3 (0.6B, Think) | 2.5 | 0.0 | 2.1 | 4.0 | 6.6 | 8.0 | 0.2 | 0.0 | 2.8 | 3.0 | 15.5 | 20.0 | 5.6 | 15.2 | 24.5 | 38.5 | 5.2 | 6.9 | 10.4 | 17.0 |
| DS-R1-Distill (1.5B) | 1.9 | 0.0 | 1.8 | 0.0 | 1.8 | 0.0 | 0.4 | 0.0 | 1.5 | 0.0 | 20.8 | 40.0 | 12.6 | 21.2 | 32.6 | 61.5 | 8.2 | 24.1 | 16.0 | 32.0 |
| STILL-3-Pre. (1.5B) | 3.7 | 0.0 | 4.9 | 4.0 | 5.8 | 8.0 | 0.8 | 0.0 | 3.8 | 3.0 | 22.7 | 36.0 | 14.8 | 30.3 | 37.6 | 69.2 | 10.3 | 17.2 | 18.4 | 33.0 |
| DeepScaleR-Pre. (1.5B) | 3.4 | 4.0 | 4.2 | 8.0 | 8.2 | 4.0 | 0.4 | 0.0 | 4.1 | 4.0 | 19.9 | 16.0 | 18.5 | 21.2 | 44.6 | 46.2 | 18.9 | 31.0 | 22.3 | 26.0 |
| OpenMath-Nemo. (1.5B) | 14.5 | 24.0 | 13.6 | 16.0 | 10.9 | 16.0 | 2.6 | 4.0 | 10.4 | 15.0 | 70.9 | 100.0 | 59.3 | 90.9 | 81.6 | 100.0 | 40.6 | 58.6 | 59.7 | 85.0 |
| Qwen3 (4B, Think) | 18.1 | 20.0 | 14.8 | 12.0 | 19.8 | 28.0 | 3.1 | 4.0 | 13.9 | 16.0 | 76.4 | 92.0 | 79.1 | 97.0 | 85.1 | 84.6 | 57.1 | 72.4 | 72.8 | 87.0 |
| DS-R1-Distill (7B) | 15.6 | 36.0 | 12.6 | 24.0 | 13.1 | 24.0 | 3.1 | 4.0 | 11.1 | 22.0 | 52.8 | 84.0 | 49.6 | 84.8 | 62.5 | 84.6 | 33.9 | 58.6 | 47.5 | 77.0 |
| Light-R1-DS (7B) | 17.1 | 28.0 | 15.2 | 16.0 | 12.8 | 24.0 | 3.6 | 4.0 | 12.2 | 18.0 | 57.1 | 84.0 | 53.6 | 93.9 | 73.7 | 84.6 | 39.5 | 51.7 | 53.0 | 78.0 |
| OpenThinker2 (7B) | 16.0 | 20.0 | 16.8 | 28.0 | 14.0 | 20.0 | 2.8 | 4.0 | 12.4 | 18.0 | 65.3 | 96.0 | 60.5 | 97.0 | 79.1 | 84.6 | 42.3 | 58.6 | 58.9 | 84.0 |
| Skywork-OR1-Pre. (7B) | 14.4 | 20.0 | 12.5 | 12.0 | 11.7 | 24.0 | 1.6 | 0.0 | 10.0 | 14.0 | 61.6 | 88.0 | 55.9 | 78.8 | 74.3 | 92.3 | 36.9 | 48.3 | 54.2 | 74.0 |
| Skywork-OR1-Math (7B) | 17.4 | 20.0 | 17.1 | 20.0 | 13.6 | 28.0 | 0.9 | 0.0 | 12.2 | 17.0 | 67.9 | 92.0 | 67.4 | 93.9 | 76.6 | 92.3 | 47.6 | 62.1 | 63.0 | 84.0 |
| AceMath-RL (7B) | 19.4 | 32.0 | 19.3 | 32.0 | 14.4 | 24.0 | 3.5 | 4.0 | 14.2 | 23.0 | 69.7 | 96.0 | 63.7 | 93.9 | 79.0 | 84.6 | 44.2 | 69.0 | 61.5 | 86.0 |
| OpenMath-Nemo. (7B) | 26.9 | 36.0 | 18.6 | 28.0 | 19.8 | 28.0 | 4.4 | 4.0 | 17.4 | 24.0 | 86.4 | 100.0 | 76.4 | 97.0 | 91.5 | 100.0 | 55.3 | 72.4 | 74.7 | 91.0 |
| DS-R1-Distill (14B) | 16.1 | 16.0 | 17.0 | 16.0 | 18.1 | 32.0 | 2.1 | 4.0 | 13.3 | 17.0 | 69.0 | 96.0 | 65.1 | 97.0 | 79.4 | 92.3 | 44.0 | 65.5 | 61.8 | 87.0 |
| Light-R1-DS (14B) | 21.8 | 24.0 | 22.2 | 28.0 | 17.8 | 36.0 | 2.6 | 4.0 | 16.1 | 23.0 | 72.3 | 88.0 | 73.0 | 100.0 | 84.3 | 92.3 | 47.6 | 65.5 | 66.9 | 86.0 |
| OpenMath-Nemo. (14B) | 28.7 | 40.0 | 22.1 | 32.0 | 21.0 | 32.0 | 3.4 | 4.0 | 18.8 | 27.0 | 87.9 | 100.0 | 78.5 | 93.9 | 95.8 | 100.0 | 59.9 | 86.2 | 77.7 | 94.0 |
| Qwen3 (30B-A3B, Think) | 38.8 | 44.0 | 33.8 | 44.0 | 26.7 | 36.0 | 5.9 | 4.0 | 26.3 | 32.0 | 91.4 | 100.0 | 92.9 | 100.0 | 90.9 | 92.3 | 75.6 | 93.1 | 87.2 | 97.0 |
| DS-R1-Distill (32B) | 22.4 | 32.0 | 21.4 | 24.0 | 20.3 | 40.0 | 3.4 | 4.0 | 16.9 | 25.0 | 73.6 | 100.0 | 71.8 | 97.0 | 84.5 | 92.3 | 49.0 | 69.0 | 67.3 | 89.0 |
| QwQ (32B) | 32.9 | 28.0 | 26.6 | 36.0 | 26.7 | 44.0 | 6.2 | 4.0 | 23.1 | 28.0 | 91.8 | 100.0 | 87.0 | 100.0 | 95.0 | 100.0 | 69.0 | 89.7 | 84.0 | 97.0 |
| Light-R1-DS (32B) | 28.9 | 44.0 | 31.1 | 52.0 | 24.1 | 36.0 | 5.2 | 8.0 | 22.3 | 35.0 | 84.2 | 100.0 | 83.3 | 100.0 | 92.5 | 100.0 | 62.1 | 82.8 | 78.6 | 95.0 |
| OpenThinker2 (32B) | 24.1 | 32.0 | 22.9 | 32.0 | 18.0 | 20.0 | 2.6 | 4.0 | 16.9 | 22.0 | 79.4 | 96.0 | 74.0 | 100.0 | 90.4 | 92.3 | 56.5 | 79.3 | 72.4 | 92.0 |
| Skywork-OR1-Pre. (32B) | 37.2 | 52.0 | 32.3 | 48.0 | 27.0 | 40.0 | 4.2 | 4.0 | 25.2 | 36.0 | 89.3 | 100.0 | 87.3 | 100.0 | 92.4 | 100.0 | 63.9 | 82.8 | 81.7 | 95.0 |
| GLM-Z1-Air (32B) | 35.0 | 44.0 | 21.5 | 32.0 | 19.5 | 24.0 | 4.5 | 4.0 | 20.1 | 26.0 | 86.5 | 100.0 | 79.5 | 90.9 | 90.4 | 100.0 | 59.1 | 75.9 | 76.8 | 90.0 |
| OpenMath-Nemo. (32B) | 22.0 | 36.0 | 21.0 | 28.0 | 20.0 | 24.0 | 3.5 | 4.0 | 16.6 | 23.0 | 75.5 | 100.0 | 60.6 | 90.9 | 89.4 | 100.0 | 42.2 | 69.0 | 62.7 | 88.0 |
| Qwen3 (235B-A22B, Think) | 48.0 | 52.0 | 49.5 | 60.0 | 38.0 | 36.0 | 10.5 | 16.0 | 36.5 | 41.0 | 93.5 | 100.0 | 92.4 | 100.0 | 99.0 | 100.0 | 81.9 | 93.1 | 90.5 | 98.0 |
| DeepSeek R1 | 30.0 | 40.0 | 25.5 | 32.0 | 18.5 | 24.0 | 4.0 | 4.0 | 19.5 | 25.0 | 90.5 | 100.0 | 82.2 | 97.0 | 94.2 | 100.0 | 60.8 | 72.4 | 79.6 | 91.0 |
| OpenAI o3-mini (high) | 29.5 | 32.0 | 29.0 | 44.0 | 49.5 | 60.0 | 17.0 | 20.0 | 31.2 | 39.0 | 93.0 | 92.0 | 89.8 | 100.0 | 97.1 | 100.0 | 89.2 | 96.6 | 91.4 | 97.0 |
| Gemini 2.5 Pro Exp 0325 | 71.5 | 76.0 | 75.5 | 84.0 | 59.0 | 72.0 | 27.5 | 36.0 | 58.4 | 67.0 | 92.0 | 100.0 | 97.0 | 100.0 | 98.1 | 100.0 | 84.5 | 89.7 | 92.2 | 97.0 |
#### Evaluation Details.
Our evaluation pipeline follows a systematic approach: for each problem, we generate 64 distinct responses from each comparison model, with the exception of certain models (i.e., OpenMath-Nemotron-32B, Qwen3-235B-A22B, GLM-Z1-Air, DeepSeek-R1, o3-mini (high) and Gemini 2.5 Pro Exp), for which, due to resource limitations and the relatively large scale of our dataset, we only conducted 8 samples. For the Pass@1 metric, we compute the mean accuracy across all sampled responses to derive the final accuracy score. For the Cons@64 and Cons@8 metric, we implement majority voting to determine a consensus answer for each problem, subsequently calculating the average accuracy across the entire dataset. For generation hyperparameters, we adhere to established practices from previous research [4, 23], configuring locally-evaluated models with temperature, top_p, min_p, and max_token set to $0.6$ , $0.95$ , $0 0$ , and $32768$ , respectively. For api-evaluated models (i.e., GLM-Z1-Air, DeepSeek-R1, o3-mini (high) and Gemini 2.5 Pro Exp), we expand their max_token limit to the maximum extent possible to unleash their reasoning capabilities better. We have open-sourced all the samples (a dataset of 582,400 math reasoning samples with long chain-of-thought, generated from the 400 problems in OlymMATH across 28 models), an online data visualization tool and standard solutions for problems where all LLMs struggled in our repository, aiming to help the community analyze the problem-solving patterns and characteristics of LLMs (see Section 4 for further information).
### 3.2 Evaluation Results
In this part, we assess the performance of reasoning models on our benchmark. We present the evaluation results of OlymMATH-EN and OlymMATH-ZH in Table 4 and Table 5, respectively.
Table 5: Model performance on OlymMATH-ZH. Models within each model size group are sorted by release time. The abbreviations “Alg.”, “Geo.”, “Num.”, and “Com.” represent the four categories in OlymMATH. Highest accuracy per model size is bolded. The second highest accuracy per model size is underlined. Models sampled only 8 times are marked in gray to indicate potential instability.
| Model | OlymMATH-ZH-HARD | OlymMATH-ZH-EASY | | | | | | | | | | | | | | | | | | |
| --- | --- | --- | --- | --- | --- | --- | --- | --- | --- | --- | --- | --- | --- | --- | --- | --- | --- | --- | --- | --- |
| Alg. | Geo. | Num. | Com. | Avg. | Alg. | Geo. | Num. | Com. | Avg. | | | | | | | | | | | |
| P@1 | C@k | P@1 | C@k | P@1 | C@k | P@1 | C@k | P@1 | C@k | P@1 | C@k | P@1 | C@k | P@1 | C@k | P@1 | C@k | P@1 | C@k | |
| Qwen3 (0.6B, Think) | 2.6 | 4.0 | 0.8 | 0.0 | 4.4 | 4.0 | 0.0 | 0.0 | 1.9 | 2.0 | 9.9 | 8.0 | 2.8 | 3.0 | 12.0 | 15.4 | 1.3 | 3.4 | 5.4 | 6.0 |
| DS-R1-Distill (1.5B) | 1.8 | 0.0 | 1.3 | 0.0 | 1.1 | 0.0 | 0.0 | 0.0 | 1.0 | 0.0 | 13.7 | 20.0 | 6.3 | 9.1 | 20.9 | 30.8 | 2.6 | 0.0 | 9.0 | 12.0 |
| STILL-3-Pre. (1.5B) | 2.9 | 0.0 | 2.2 | 0.0 | 4.5 | 4.0 | 0.2 | 0.0 | 2.5 | 1.0 | 15.9 | 32.0 | 7.4 | 18.2 | 27.6 | 46.2 | 4.3 | 6.9 | 11.3 | 22.0 |
| DeepScaleR-Pre. (1.5B) | 4.4 | 8.0 | 2.6 | 4.0 | 6.4 | 8.0 | 0.1 | 0.0 | 3.4 | 5.0 | 15.9 | 20.0 | 7.2 | 9.1 | 32.6 | 46.2 | 8.9 | 20.7 | 13.2 | 20.0 |
| OpenMath-Nemo. (1.5B) | 13.9 | 16.0 | 9.8 | 4.0 | 13.3 | 16.0 | 0.8 | 0.0 | 9.5 | 9.0 | 67.9 | 96.0 | 37.6 | 57.6 | 65.3 | 76.9 | 27.6 | 41.4 | 45.9 | 65.0 |
| Qwen3 (4B, Think) | 12.5 | 20.0 | 7.0 | 8.0 | 12.6 | 24.0 | 0.9 | 0.0 | 8.3 | 13.0 | 70.8 | 88.0 | 61.0 | 75.8 | 74.8 | 92.3 | 41.8 | 51.7 | 59.7 | 74.0 |
| DS-R1-Distill (7B) | 6.1 | 8.0 | 7.9 | 12.0 | 6.6 | 8.0 | 0.6 | 0.0 | 5.3 | 7.0 | 38.0 | 64.0 | 30.8 | 51.5 | 49.2 | 61.5 | 18.7 | 27.6 | 31.5 | 49.0 |
| Light-R1-DS (7B) | 7.1 | 4.0 | 9.4 | 12.0 | 7.8 | 12.0 | 1.1 | 0.0 | 6.3 | 7.0 | 42.9 | 76.0 | 42.7 | 72.7 | 56.9 | 61.5 | 22.7 | 31.0 | 38.8 | 60.0 |
| OpenThinker2 (7B) | 7.0 | 0.0 | 7.3 | 8.0 | 7.4 | 8.0 | 1.0 | 0.0 | 5.7 | 4.0 | 48.2 | 80.0 | 44.7 | 72.7 | 57.8 | 76.9 | 22.4 | 37.9 | 40.8 | 65.0 |
| Skywork-OR1-Pre. (7B) | 4.7 | 4.0 | 7.8 | 8.0 | 7.4 | 8.0 | 0.4 | 0.0 | 5.1 | 5.0 | 41.1 | 60.0 | 36.6 | 54.5 | 58.1 | 69.2 | 23.6 | 34.5 | 36.8 | 52.0 |
| Skywork-OR1-Math (7B) | 6.4 | 8.0 | 8.3 | 8.0 | 9.8 | 12.0 | 0.8 | 0.0 | 6.3 | 7.0 | 45.2 | 72.0 | 40.0 | 63.6 | 62.3 | 69.2 | 30.2 | 37.9 | 41.3 | 59.0 |
| AceMath-RL (7B) | 6.4 | 8.0 | 10.7 | 12.0 | 7.8 | 8.0 | 1.4 | 0.0 | 6.6 | 7.0 | 55.1 | 88.0 | 46.6 | 75.8 | 66.9 | 76.9 | 31.0 | 44.8 | 46.9 | 70.0 |
| OpenMath-Nemo. (7B) | 25.0 | 32.0 | 20.8 | 28.0 | 22.3 | 36.0 | 4.8 | 4.0 | 18.2 | 25.0 | 86.8 | 100.0 | 72.7 | 90.9 | 91.8 | 100.0 | 57.9 | 79.3 | 74.4 | 91.0 |
| DS-R1-Distill (14B) | 5.2 | 0.0 | 5.3 | 4.0 | 8.7 | 16.0 | 0.2 | 0.0 | 4.9 | 5.0 | 43.1 | 56.0 | 38.9 | 66.7 | 58.2 | 69.2 | 24.8 | 31.0 | 38.4 | 54.0 |
| Light-R1-DS (14B) | 6.2 | 4.0 | 7.5 | 8.0 | 10.9 | 12.0 | 0.2 | 0.0 | 6.2 | 6.0 | 56.6 | 84.0 | 45.5 | 75.8 | 66.5 | 76.9 | 28.7 | 37.9 | 46.1 | 67.0 |
| OpenMath-Nemo. (14B) | 28.7 | 32.0 | 26.1 | 40.0 | 26.8 | 40.0 | 4.2 | 4.0 | 21.4 | 29.0 | 88.3 | 100.0 | 75.2 | 100.0 | 94.5 | 100.0 | 60.2 | 86.2 | 76.6 | 96.0 |
| Qwen3 (30B-A3B, Think) | 35.6 | 40.0 | 24.1 | 28.0 | 18.1 | 24.0 | 2.7 | 4.0 | 20.1 | 24.0 | 87.8 | 92.0 | 84.7 | 97.0 | 91.3 | 100.0 | 61.9 | 65.5 | 79.7 | 87.0 |
| DS-R1-Distill (32B) | 6.5 | 0.0 | 5.4 | 4.0 | 10.6 | 12.0 | 0.7 | 0.0 | 5.8 | 4.0 | 45.2 | 52.0 | 41.8 | 63.6 | 60.2 | 69.2 | 26.0 | 37.9 | 40.4 | 54.0 |
| QwQ (32B) | 20.9 | 24.0 | 15.9 | 16.0 | 17.6 | 24.0 | 2.0 | 0.0 | 14.1 | 16.0 | 85.4 | 96.0 | 76.6 | 97.0 | 92.9 | 100.0 | 53.8 | 69.0 | 74.3 | 89.0 |
| Light-R1-DS (32B) | 16.8 | 28.0 | 12.0 | 12.0 | 13.4 | 16.0 | 4.4 | 16.0 | 11.6 | 18.0 | 70.1 | 96.0 | 64.1 | 93.9 | 80.4 | 92.3 | 39.8 | 51.7 | 60.7 | 82.0 |
| OpenThinker2 (32B) | 13.6 | 16.0 | 11.1 | 16.0 | 12.7 | 20.0 | 0.9 | 0.0 | 9.6 | 13.0 | 68.0 | 92.0 | 64.3 | 93.9 | 84.6 | 92.3 | 44.8 | 65.5 | 62.2 | 85.0 |
| Skywork-OR1-Pre. (32B) | 19.6 | 20.0 | 16.8 | 20.0 | 18.9 | 24.0 | 3.5 | 4.0 | 14.7 | 17.0 | 79.5 | 96.0 | 72.1 | 93.9 | 88.0 | 100.0 | 45.4 | 58.6 | 68.3 | 85.0 |
| GLM-Z1-Air (32B) | 18.0 | 16.0 | 12.0 | 8.0 | 16.0 | 16.0 | 2.5 | 4.0 | 12.1 | 11.0 | 76.0 | 96.0 | 69.3 | 78.8 | 89.4 | 92.3 | 41.8 | 48.3 | 65.6 | 76.0 |
| OpenMath-Nemo. (32B) | 22.5 | 36.0 | 22.5 | 32.0 | 22.5 | 28.0 | 3.5 | 4.0 | 17.8 | 25.0 | 68.0 | 96.0 | 62.5 | 90.9 | 90.4 | 100.0 | 48.7 | 72.4 | 63.5 | 88.0 |
| Qwen3 (235B-A22B, Think) | 36.5 | 48.0 | 43.5 | 48.0 | 28.5 | 32.0 | 4.0 | 8.0 | 28.1 | 34.0 | 91.0 | 100.0 | 90.2 | 97.0 | 94.2 | 100.0 | 78.4 | 89.7 | 87.5 | 96.0 |
| DeepSeek R1 | 20.0 | 24.0 | 25.0 | 28.0 | 17.0 | 16.0 | 1.5 | 0.0 | 15.9 | 17.0 | 79.5 | 96.0 | 74.6 | 84.8 | 88.5 | 92.3 | 49.6 | 55.2 | 70.4 | 80.0 |
| OpenAI o3-mini (high) | 31.5 | 40.0 | 32.5 | 44.0 | 48.5 | 56.0 | 19.0 | 28.0 | 32.9 | 42.0 | 93.0 | 96.0 | 89.4 | 100.0 | 99.0 | 100.0 | 85.8 | 93.1 | 90.5 | 97.0 |
| Gemini 2.5 Pro Exp 0325 | 65.0 | 76.0 | 78.0 | 80.0 | 53.5 | 56.0 | 25.0 | 40.0 | 55.4 | 63.0 | 90.5 | 96.0 | 93.2 | 93.9 | 100.0 | 100.0 | 84.1 | 86.2 | 90.8 | 93.0 |
First, we observe that all tested models exhibit relatively poor performance, with even OpenAI o3-mini (high) and Gemini 2.5 Pro Exp achieving only 31.2% and 58.4% on OlymMATH-EN-HARD. This underscores the high overall difficulty of our benchmark, which demands stronger reasoning abilities and a deeper understanding of mathematical knowledge to solve the problems effectively. In contrast, the performance of these advanced reasoning models on OlymMATH-EN-EASY is more modest and comparable to that on AIME 2024 and AIME 2025, suggesting that OlymMATH-EN-EASY is well-suited for evaluating the capabilities of less advanced reasoning models.
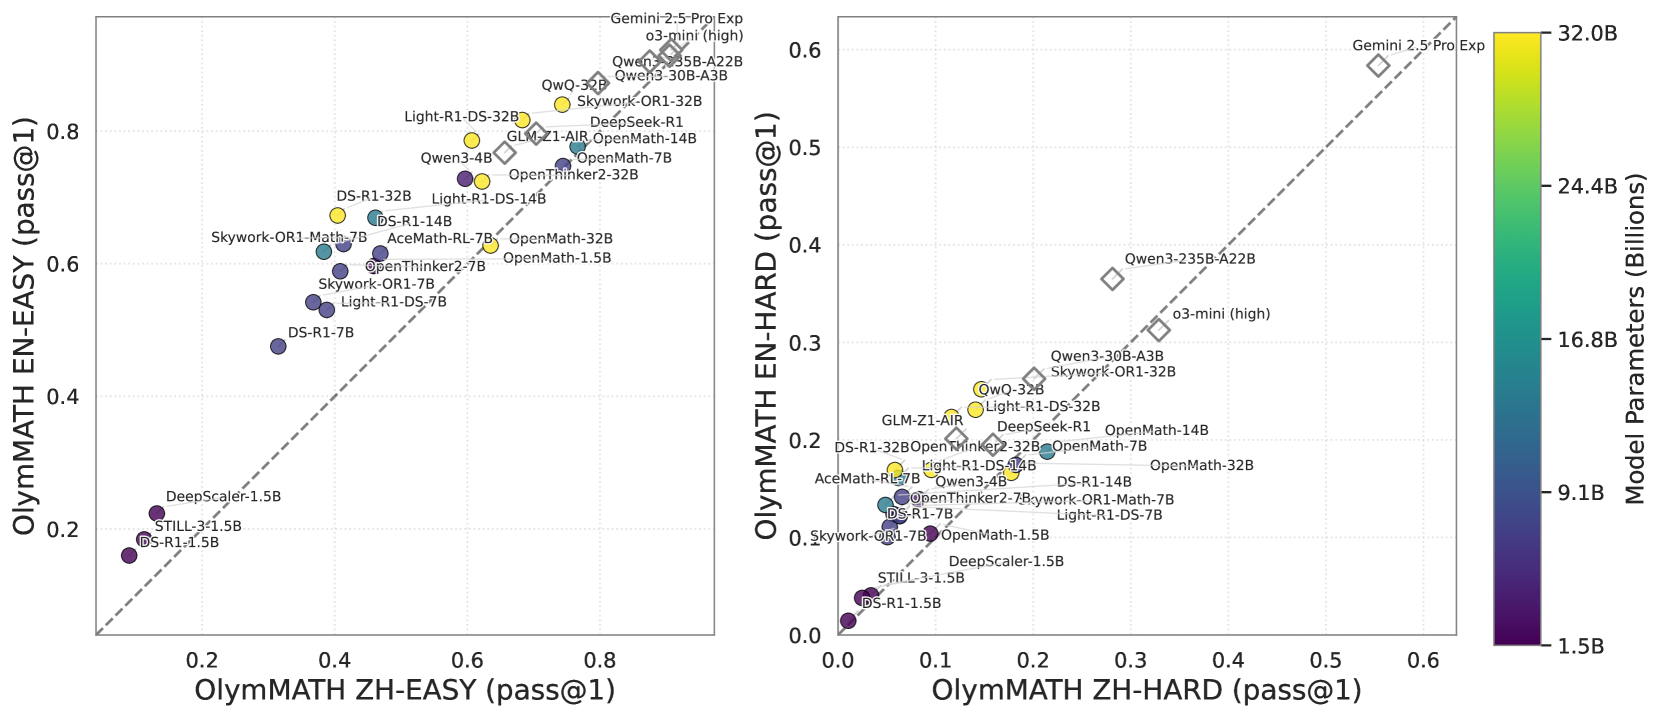
Second, by comparing the performance of LLMs on OlymMATH-EN and OlymMATH-ZH, we find that language can influence the reasoning performance of LLMs to some extent (see Figure 3). Overall, all models tend to achieve higher performance on the English benchmarks. A potential reason for this is that English corpora still dominate existing pre-training datasets, making the English-based task-solving capabilities of LLMs generally more superior compared to other languages. This finding highlights the importance of considering performance across different languages when conducting a comprehensive evaluation of LLMs.
<details>
<summary>x2.png Details</summary>
### Visual Description
## Scatter Plot Comparison: OlymMATH Benchmark Performance (EN vs. ZH)
### Overview
The image displays two side-by-side scatter plots comparing the performance of various large language models (LLMs) on the "OlymMATH" benchmark. The left plot compares performance on "EASY" problems, while the right plot compares performance on "HARD" problems. Each data point represents a specific model, plotted according to its score on the Chinese (ZH) version versus the English (EN) version of the benchmark. The color of each point indicates the model's approximate parameter count in billions.
### Components/Axes
**Common Elements:**
* **Color Bar (Far Right):** A vertical color scale labeled "Model Parameters (Billions)". It ranges from dark purple (1.5B) at the bottom to bright yellow (32.0B) at the top, with intermediate markers at 9.1B, 16.8B, and 24.4B.
* **Diagonal Dashed Line:** A gray dashed line (y = x) runs through both plots, representing equal performance on the Chinese and English versions.
**Left Plot: OlymMATH EASY**
* **X-Axis:** "OlymMATH ZH-EASY (pass@1)". Scale ranges from 0.0 to 0.8.
* **Y-Axis:** "OlymMATH EN-EASY (pass@1)". Scale ranges from 0.0 to 0.8.
* **Data Points:** Approximately 25-30 labeled circles, colored according to the parameter scale.
**Right Plot: OlymMATH HARD**
* **X-Axis:** "OlymMATH ZH-HARD (pass@1)". Scale ranges from 0.0 to 0.6.
* **Y-Axis:** "OlymMATH EN-HARD (pass@1)". Scale ranges from 0.0 to 0.6.
* **Data Points:** Approximately 25-30 labeled circles, colored according to the parameter scale.
### Detailed Analysis
**Left Plot (EASY Problems) - Data Points & Trends:**
* **Trend:** There is a strong positive correlation between performance on ZH-EASY and EN-EASY. Most models lie close to or slightly above the diagonal line, suggesting comparable or slightly better performance in English on easy problems.
* **Top Performers (High EN & ZH scores):**
* `Gemini-2.5-Pro Exp` (Yellow, ~32B): ~0.85 ZH, ~0.88 EN.
* `o3-mini (high)` (Yellow, ~32B): ~0.82 ZH, ~0.86 EN.
* `Qwen3-235B-A22B` (Yellow, ~32B): ~0.80 ZH, ~0.85 EN.
* `Qwen3-30B-A3B` (Yellow, ~32B): ~0.78 ZH, ~0.83 EN.
* `Skywork-OR1-32B` (Yellow, ~32B): ~0.75 ZH, ~0.82 EN.
* **Mid-Range Cluster:** A dense cluster of models with scores between 0.4 and 0.7 on both axes. Includes models like `Light-R1-DS-32B`, `DeepSeek-R1`, `GLM-Z1-AIR`, `OpenMath-14B`, `Qwen3-4B`, `OpenThinker2-32B`, `OpenMath-7B`, `DS-R1-32B`, `Light-R1-DS-14B`, `DS-R1-14B`, `Skywork-OR1-Math-7B`, `AceMath-RL-7B`, `OpenMath-32B`, `OpenMath-1.5B`, `OpenThinker2-7B`, `Skywork-OR1-7B`, `Light-R1-DS-7B`.
* **Lower Performers (Low EN & ZH scores):**
* `DS-R1-7B` (Purple, ~9.1B): ~0.35 ZH, ~0.48 EN.
* `DeepScaler-1.5B` (Dark Purple, ~1.5B): ~0.15 ZH, ~0.22 EN.
* `STILL-3-1.5B` (Dark Purple, ~1.5B): ~0.10 ZH, ~0.18 EN.
* `DS-R1-1.5B` (Dark Purple, ~1.5B): ~0.08 ZH, ~0.16 EN.
**Right Plot (HARD Problems) - Data Points & Trends:**
* **Trend:** A positive correlation exists, but with more scatter. Many models fall below the diagonal line, indicating a tendency for higher scores on ZH-HARD compared to EN-HARD for the same model.
* **Top Performer:**
* `Gemini-2.5-Pro Exp` (Yellow, ~32B): ~0.55 ZH, ~0.58 EN. It is a clear outlier, far above the rest.
* **High-End Cluster:**
* `Qwen3-235B-A22B` (Yellow, ~32B): ~0.28 ZH, ~0.37 EN.
* `o3-mini (high)` (Yellow, ~32B): ~0.33 ZH, ~0.32 EN.
* `Qwen3-30B-A3B` (Yellow, ~32B): ~0.25 ZH, ~0.27 EN.
* `Skywork-OR1-32B` (Yellow, ~32B): ~0.22 ZH, ~0.25 EN.
* **Mid-Range Cluster:** A dense group with scores between 0.05 and 0.20 on both axes. Includes `QwQ-32B`, `Light-R1-DS-32B`, `GLM-Z1-AIR`, `DeepSeek-R1`, `OpenMath-14B`, `OpenThinker2-32B`, `OpenMath-7B`, `OpenMath-32B`, `DS-R1-32B`, `Light-R1-DS-14B`, `DS-R1-14B`, `AceMath-RL-7B`, `Skywork-OR1-Math-7B`, `Light-R1-DS-7B`, `OpenMath-1.5B`, `Skywork-OR1-7B`.
* **Lower Performers:**
* `DeepScaler-1.5B` (Dark Purple, ~1.5B): ~0.08 ZH, ~0.05 EN.
* `STILL-3-1.5B` (Dark Purple, ~1.5B): ~0.04 ZH, ~0.03 EN.
* `DS-R1-1.5B` (Dark Purple, ~1.5B): ~0.02 ZH, ~0.01 EN.
### Key Observations
1. **Parameter Size Correlation:** Larger models (yellow, ~32B) consistently occupy the top-right (high performance) regions of both plots. Smaller models (dark purple, ~1.5B) are clustered in the bottom-left. This demonstrates a clear positive correlation between model size and benchmark performance.
2. **Language Performance Gap:** On EASY problems, models perform similarly or slightly better in English. On HARD problems, there is a noticeable shift where many models achieve higher scores in Chinese (points below the diagonal), suggesting the HARD Chinese benchmark may be relatively easier for these models than the HARD English version.
3. **Outlier:** `Gemini-2.5-Pro Exp` is the dominant model on both benchmarks, especially on the HARD set where it is in a league of its own.
4. **Model Families:** Models from the same family (e.g., `Qwen3-*`, `OpenMath-*`, `DS-R1-*`, `Skywork-OR1-*`) tend to cluster together, with performance scaling with their parameter count variant.
### Interpretation
This visualization provides a comparative snapshot of LLM capabilities on mathematical reasoning across languages and difficulty levels. The data suggests that:
* **Scale is a primary driver of performance:** Increasing parameter count is strongly associated with higher pass@1 rates on this benchmark.
* **Language parity is not uniform:** The relative ease of a problem set is language-dependent. The "HARD" Chinese problems appear more solvable for these models than their English counterparts, which could indicate differences in problem style, cultural context, or the training data composition of the models.
* **Benchmarking Utility:** The OlymMATH benchmark effectively stratifies models by capability. The clear separation between model tiers (e.g., 1.5B vs. 32B) and the identification of a standout performer (`Gemini-2.5-Pro Exp`) make it a useful tool for evaluating progress in mathematical reasoning.
* **Investigative Insight:** The shift in the performance gap between languages from EASY to HARD problems warrants further investigation. It could reveal biases in model training, differences in the linguistic complexity of mathematical problems, or variations in the quality of the translated benchmark sets.
</details>
Figure 3: Pass@1 accuracy on OlymMATH EN (y) vs. ZH (x), the dashed line shows parity. Points above favor English, below favor Chinese. Solid circles (local dense models, colored by size) indicate larger models trend towards higher accuracy. Hollow diamonds are MoE or API evaluated models.
### 3.3 Benchmark Comparison
<details>
<summary>x3.png Details</summary>
### Visual Description
## Scatter Plot: Model Performance Comparison on AIME24 vs. OlymMATH EN Datasets
### Overview
This image is a scatter plot comparing the performance of various AI models on two different mathematics benchmarks: AIME24 Accuracy (x-axis) and OlymMATH EN Accuracy (pass@1) (y-axis). Data points are colored according to their release date, with a color gradient bar on the right indicating the timeline from January 2025 (dark purple) to April 2025 (bright yellow). Two distinct datasets are plotted: "EN-EASY" (represented by circles) and "EN-HARD" (represented by triangles), each with a corresponding linear trend line.
### Components/Axes
* **X-Axis:** "AIME24 Accuracy". Scale ranges from 0.1 to 1.0, with major tick marks at 0.1 intervals.
* **Y-Axis:** "OlymMATH EN Accuracy (pass@1)". Scale ranges from 0.0 to 1.0, with major tick marks at 0.2 intervals.
* **Legend (Top-Left Corner):**
* **Dataset / Trend**
* `EN-EASY`: Represented by a teal circle.
* `EN-EASY Trend`: Represented by a blue dashed line.
* `EN-HARD`: Represented by a light green triangle.
* `EN-HARD Trend`: Represented by a red dashed line.
* **Color Bar (Right Side):** Labeled "Release Date (Later → Brighter)". The gradient runs from dark purple (Jan 2025) through teal and green to bright yellow (Apr 2025).
* **Data Points:** Each point is labeled with a model name. Points are either circles (EN-EASY) or triangles (EN-HARD) and are filled with a color corresponding to their release date.
### Detailed Analysis
**Data Series & Trends:**
1. **EN-EASY Trend (Blue Dashed Line):** Shows a strong positive linear correlation. The line slopes steeply upward from the bottom-left to the top-right of the chart.
2. **EN-HARD Trend (Red Dashed Line):** Also shows a positive linear correlation, but with a shallower slope compared to the EN-EASY trend. It starts near the origin and rises more gradually.
**Data Points (Approximate Coordinates & Release Date Inference):**
*Coordinates are (AIME24 Accuracy, OlymMATH EN Accuracy). Release date is inferred from point color.*
* **Top-Right Cluster (High Performance on Both Benchmarks):**
* `Gemini 2.5 Pro Exp` (Star, ~0.92, ~0.92) - Bright green (Late Mar/Early Apr 2025).
* `o3-mini (high)` (Circle, ~0.88, ~0.85) - Yellow (Apr 2025).
* `Qwen3-235B-A22B` (Circle, ~0.85, ~0.88) - Yellow (Apr 2025).
* `Qwen3-30B-A3B` (Circle, ~0.82, ~0.82) - Yellow-green (Late Mar 2025).
* `QwQ-32B` (Circle, ~0.80, ~0.80) - Green (Mar 2025).
* `OpenMath-14B` (Circle, ~0.78, ~0.72) - Green (Mar 2025).
* `OpenMath-7B` (Circle, ~0.76, ~0.78) - Green (Mar 2025).
* `Qwen3-4B` (Circle, ~0.74, ~0.75) - Green (Mar 2025).
* **Mid-Range Cluster:**
* `OpenMATH-1.5B` (Circle, ~0.62, ~0.60) - Light green (Early Mar 2025).
* `OpenMATH-1.5B` (Circle, ~0.58, ~0.54) - Teal (Late Feb 2025).
* `OpenMATH-1.5B` (Circle, ~0.50, ~0.59) - Teal (Late Feb 2025).
* `Qwen3-4B` (Circle, ~0.69, ~0.62) - Purple (Feb 2025).
* `OpenMath-7B` (Circle, ~0.70, ~0.68) - Purple (Feb 2025).
* **Lower-Left Points (Lower Performance):**
* Several unlabeled circles and triangles with AIME24 Accuracy between 0.25-0.45 and OlymMATH Accuracy between 0.0-0.25. Colors are dark purple/blue, indicating release in Jan/Feb 2025.
* **EN-HARD Dataset Points (Triangles):**
* `Gemini 2.5 Pro Exp` (Star, ~0.92, ~0.58) - Bright green (Late Mar/Early Apr 2025).
* `o3-mini (high)` (Triangle, ~0.87, ~0.30) - Yellow (Apr 2025).
* `Qwen3-235B-A22B` (Triangle, ~0.85, ~0.36) - Yellow (Apr 2025).
* `Skywork-OR1-32B` (Triangle, ~0.80, ~0.24) - Yellow-green (Late Mar 2025).
* `OpenMath-14B` (Triangle, ~0.79, ~0.22) - Green (Mar 2025).
* `Qwen3-30B-A3B` (Triangle, ~0.81, ~0.20) - Green (Mar 2025).
* `OpenMath-7B` (Triangle, ~0.77, ~0.16) - Green (Mar 2025).
* `Qwen3-4B` (Triangle, ~0.70, ~0.14) - Purple (Feb 2025).
* `OpenMATH-1.5B` (Triangle, ~0.63, ~0.10) - Teal (Late Feb 2025).
* `OpenMATH-1.5B` (Triangle, ~0.59, ~0.12) - Teal (Late Feb 2025).
* `OpenMATH-1.5B` (Triangle, ~0.50, ~0.12) - Teal (Late Feb 2025).
* Several unlabeled triangles with AIME24 Accuracy between 0.28-0.43 and OlymMATH Accuracy near 0.0-0.05. Colors are dark purple (Jan 2025).
### Key Observations
1. **Positive Correlation:** There is a clear positive correlation between performance on AIME24 and OlymMATH EN for both the EASY and HARD datasets. Models that score higher on one tend to score higher on the other.
2. **Performance Gap:** The EN-EASY dataset yields significantly higher OlymMATH scores than the EN-HARD dataset for the same models. The vertical gap between the two trend lines is substantial.
3. **Temporal Trend:** Brighter-colored points (more recent releases, Mar-Apr 2025) are generally clustered in the upper-right quadrant, indicating that newer models tend to achieve higher accuracy on both benchmarks.
4. **Outlier:** `Gemini 2.5 Pro Exp` is a notable outlier, achieving the highest or near-highest scores on both datasets within its release timeframe.
5. **Model Clustering:** Models from the same family (e.g., OpenMath, Qwen3) often appear in clusters, with larger or newer variants generally performing better.
### Interpretation
This chart demonstrates a strong relationship between a model's capability on the AIME24 competition-style problems and its performance on the OlymMATH EN benchmark. The positive correlation suggests these benchmarks may be measuring overlapping aspects of mathematical reasoning ability.
The significant performance drop from the EN-EASY to EN-HARD datasets indicates that the "HARD" subset presents a substantially greater challenge, likely involving more complex problem types or requiring deeper reasoning. The fact that the trend lines are parallel (both linear) but offset suggests the difficulty increase is consistent across the model performance spectrum.
The temporal trend is a key insight: the field is progressing rapidly, with models released in early 2025 (purple) generally underperforming those released in spring 2025 (yellow/green). This visualizes the pace of advancement in AI mathematical reasoning over a short period.
The clustering of models by family suggests that architectural choices and training methodologies have a consistent impact on performance across different benchmarks. The outlier performance of `Gemini 2.5 Pro Exp` may indicate a significant architectural or training breakthrough relative to its contemporaries.
**Language Declaration:** All text in the image is in English.
</details>
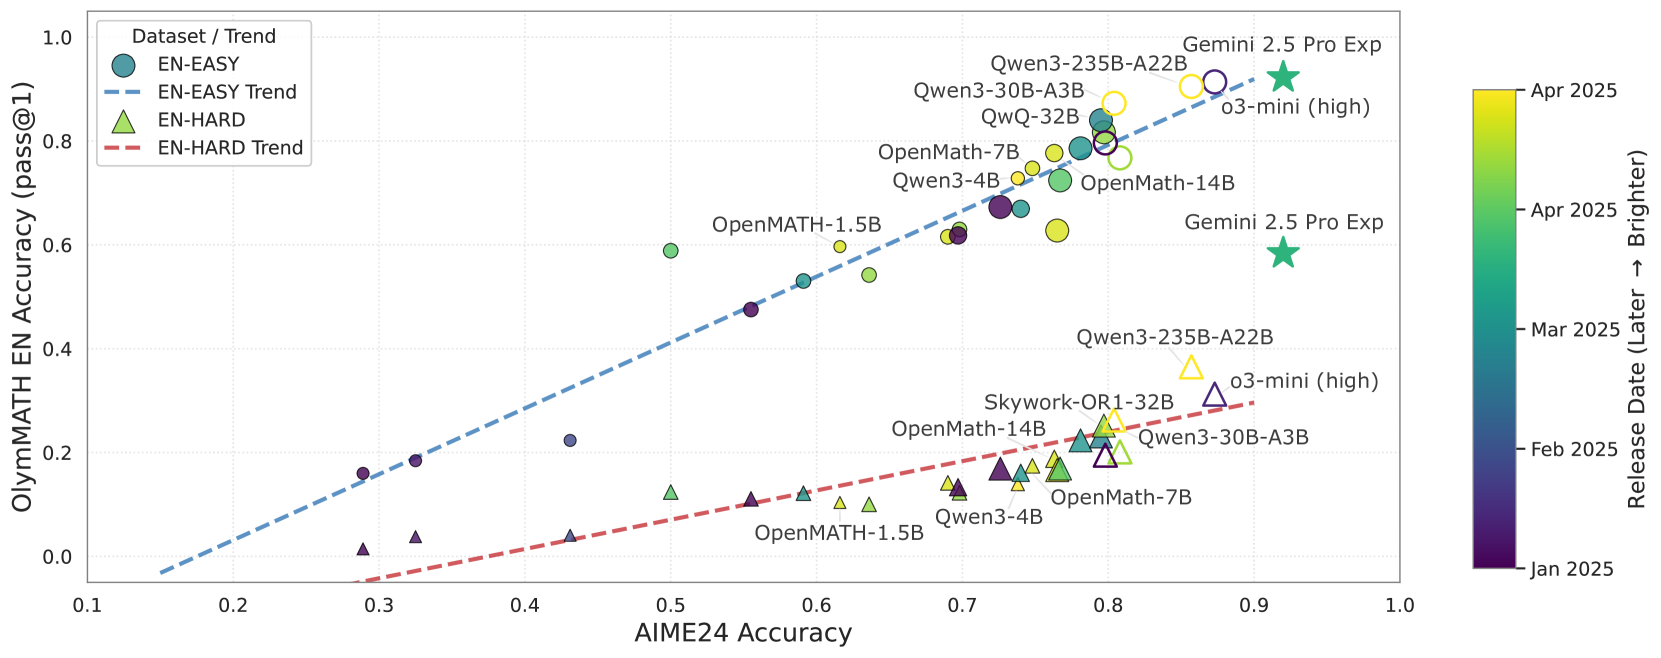
Figure 4: Correlation of Pass@1 performance: OlymMATH-EN vs. AIME24. Dashed lines indicate linear trends per dataset. Solid shapes are local dense models (size = model size, color = release date). Hollow shapes denote MoE or API evaluated models. Stars mark the best overall model.
To comprehensively evaluate OlymMATH against existing benchmarks, we compare state-of-the-art model performance across widely used mathematical benchmarks (see Figure 1). Results are sourced from research reports or the MathArena platform https://matharena.ai/ .
Figure 1 illustrates that OlymMATH is more challenging, yielding lower accuracy compared to saturated benchmarks like MATH-500 (where even DeepSeek-R1-Distill-Qwen-7B exceeds 92% accuracy [4]) or AIME24 (where top LLMs reach 92% with single attempt). Unlike these benchmarks whose high performance limits discriminative power, OlymMATH elicits more varied scores, offering superior differentiation of reasoning capabilities. For example, while Gemini 2.5 Pro Exp and o3-mini (high) achieve similar AIME24 accuracy (92.0% vs. 87.3%), their OlymMATH-EN-HARD performance diverges significantly (58.4% vs. 31.2%).
Figure 4 further demonstrates OlymMATH’s reliability by comparing OlymMATH-EN performance against AIME24. The close clustering of data points around linear trend lines indicates consistent relative model performance across both benchmarks. This strong correlation suggests OlymMATH measures similar underlying mathematical reasoning abilities as the respected AIME24 dataset, validating its use for LLM evaluation (see Figure 8 in Appendix for more information). Despite this alignment, OlymMATH, particularly the HARD subset, remains significantly more challenging than AIME24 for most models, reinforcing its superior ability to differentiate state-of-the-art capabilities.
### 3.4 Case Study
During our data collection and preliminary experiments, we empirically observed that LLMs sometimes resort to empirical guesses —such as heuristics, symmetry assumptions, or even fabrication—rather than rigorous reasoning. For instance, o3-mini-high merely “guessed” $b=c$ due to symmetry in a geometric optimization problem (see Figure 9 in Appendix). While such intuitive approaches might yield correct answers, they lack logical rigor and this case becomes problematic when employing rule-based or LLM-as-judge methods, as neither can effectively assess the quality of rigorous reasoning, thus potentially leading to an illusory improvement in accuracy via “shortcuts”.
Similar issues were observed in the AIME 2025 and Omni-MATH benchmarks (see Figure 10 and 11 in Appendix), indicating that despite performance gains, LLMs still exhibit deficiencies in deliberative thinking. This underscores the importance of process-level supervision, though its scalability remains a challenge. Currently, we do not accurately measure the proportion of “guesses” in these benchmarks, leaving this as an important direction for future work.
Notably, these guessing strategies often fail on our OlymMATH dataset. For example, a model incorrectly assumed symmetry for a complex optimization problem in OlymMATH, yielding $3081$ instead of the correct $2625$ (see Figure 12 in Appendix). OlymMATH problems, particularly in the HARD subset, are selected and designed so that their reasoning steps are difficult to “hack” through empirical guessing, thus providing a more robust evaluation of genuine reasoning capabilities.
## 4 Usability and Accessibility
To support research into LLM reasoning, we have open-sourced the OlymMATH-eval dataset at https://hf.co/datasets/RUC-AIBOX/OlymMATH-eval, with 582,400 entries from 28 models, to help compare reasoning capabilities across different models and mathematical domains.
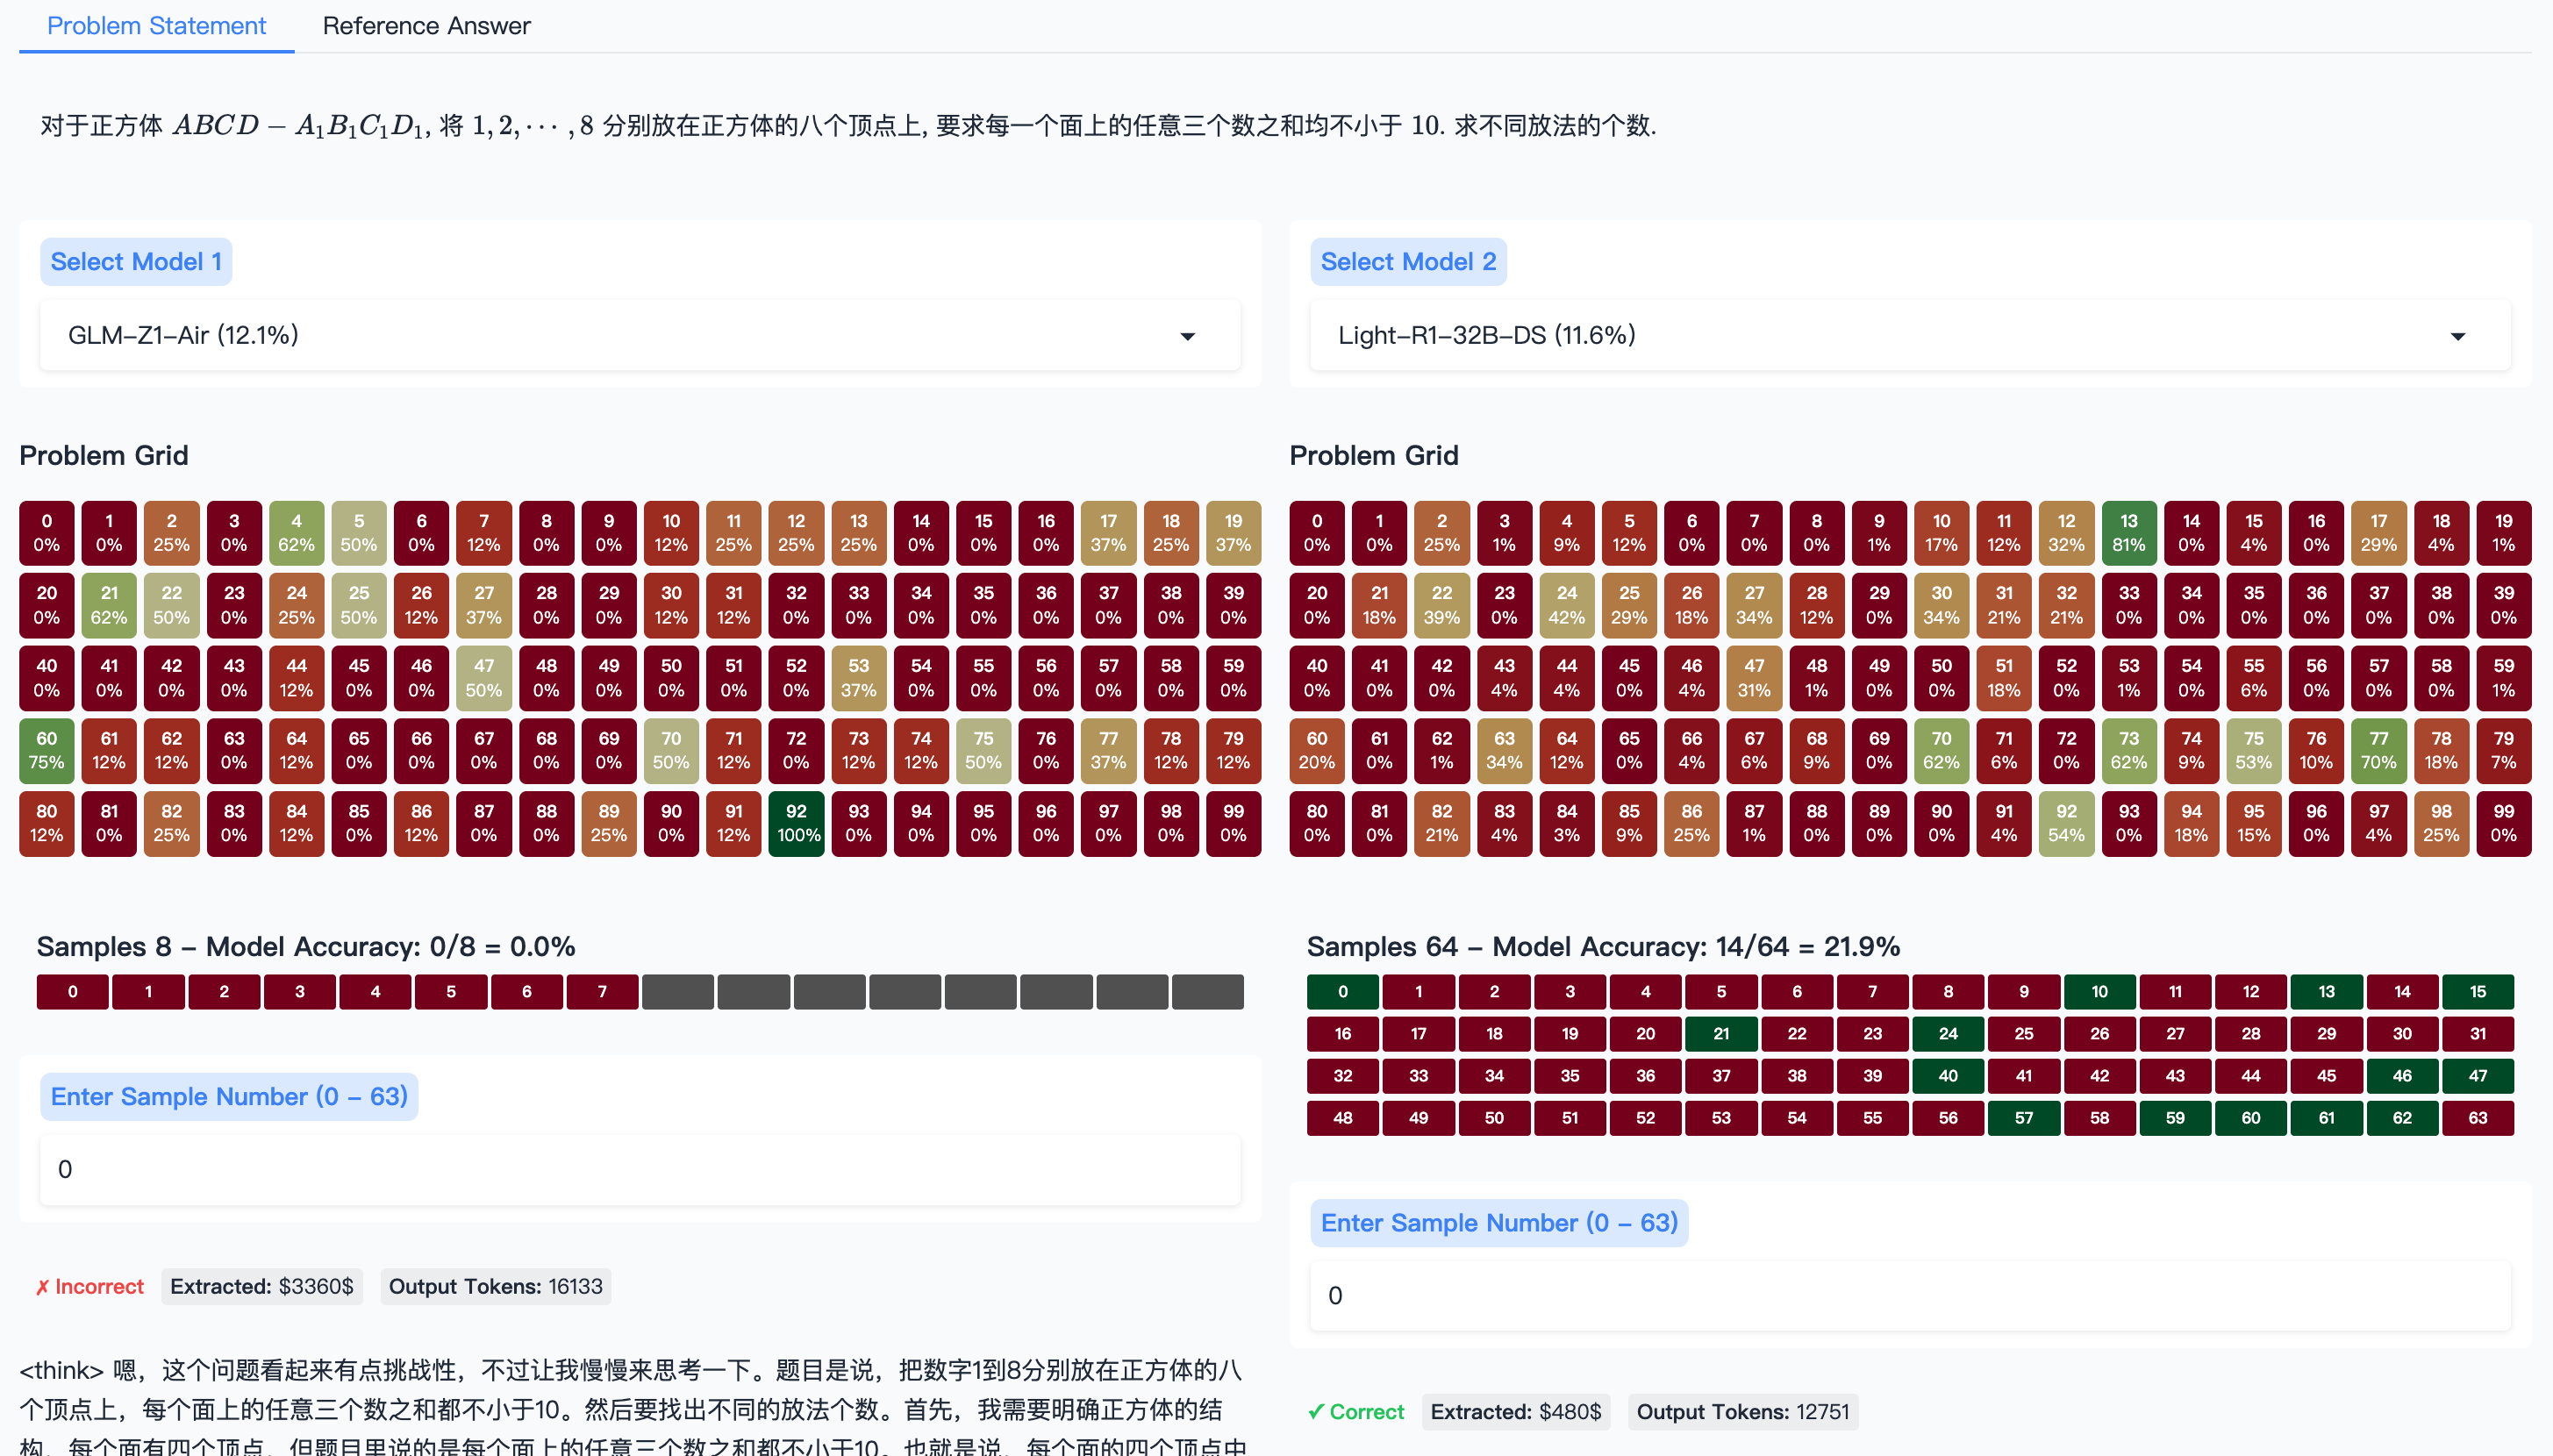
Furthermore, we provide the OlymMATH-demo visualization tool (https://hf.co/spaces/RUC-AIBOX/OlymMATH-demo; see Figure 5) to facilitate in-depth analysis of LLM reasoning. This interactive interface enables: (1) Side-by-side comparison of two selected LLMs on the same L a T e X -rendered problem, with access to reference answers. (2) Color-coded “Problem Grids” for each model, displaying per-problem accuracy for quick identification of challenging areas. (3) Examination of individual model-generated reasoning samples, including correctness, extracted answers, and token counts, crucial for understanding solution processes and identifying flaws. The tool also includes standard solutions for difficult problems and supports local deployment. OlymMATH-demo is thus a valuable asset for dissecting reasoning patterns, diagnosing errors, and guiding LLM development.
<details>
<summary>extracted/6453487/figs/demo.png Details</summary>
### Visual Description
## Technical Document Extraction: AI Model Evaluation Interface
### Overview
The image displays a web-based interface for evaluating and comparing the performance of two AI models on a specific mathematical problem. The interface includes the problem statement, model selection dropdowns, visual performance grids ("Problem Grids"), sample accuracy summaries, and model output snippets. The primary language is Chinese, with some English UI elements.
### Components/Axes
**1. Header Section:**
* **Tabs:** "Problem Statement" (selected, blue underline) and "Reference Answer".
* **Problem Statement (Chinese):** "对于正方体 $ABCD - A_1B_1C_1D_1$, 将 $1, 2, \cdots, 8$ 分别放在正方体的八个顶点上, 要求每一个面上的任意三个数之和均不小于 $10$. 求不同放法的个数."
* **English Translation:** "For a cube $ABCD - A_1B_1C_1D_1$, place the numbers $1, 2, \cdots, 8$ on the eight vertices of the cube, with the requirement that the sum of any three numbers on each face is not less than $10$. Find the number of different placement methods."
**2. Model Selection:**
* **Left Panel:** "Select Model 1" dropdown showing "GLM-Z1-Air (12.1%)".
* **Right Panel:** "Select Model 2" dropdown showing "Light-R1-32B-DS (11.6%)".
* The percentages in parentheses likely represent an overall accuracy or performance metric for each model on a broader benchmark.
**3. Problem Grids (Two Identical Structures):**
* **Title:** "Problem Grid" (appears above both left and right grids).
* **Structure:** A 10x10 grid of cells, numbered 0 to 99 (reading left-to-right, top-to-bottom).
* **Cell Content:** Each cell contains a number (the index, 0-99) and a percentage value below it.
* **Color Coding:** Cells are colored based on the percentage value, creating a heatmap.
* **Dark Red / Maroon:** Very low percentages (e.g., 0%, 1%, 4%).
* **Brown / Tan:** Low to mid-range percentages (e.g., 12%, 18%, 25%, 37%).
* **Olive / Yellow-Green:** Mid to high percentages (e.g., 50%, 62%, 70%).
* **Dark Green:** Very high percentages (e.g., 81%, 100%).
* **Spatial Layout:** The grids are placed side-by-side for direct visual comparison. The left grid corresponds to Model 1, and the right grid to Model 2.
**4. Sample Accuracy & Output Sections:**
* **Left (Model 1):**
* **Title:** "Samples 8 – Model Accuracy: 0/8 = 0.0%"
* **Sample Bar:** A horizontal bar with 8 segments, all colored dark red, labeled 0 through 7.
* **Input Field:** "Enter Sample Number (0 – 63)" with a text box containing "0".
* **Output Status:** "✗ Incorrect" (in red).
* **Output Details:** "Extracted: $3360$", "Output Tokens: 16133".
* **Model Output Snippet (Chinese):** "<think> 嗯,这个问题看起来有点挑战性,不过让我慢慢来思考一下。题目是说,把数字1到8分别放在正方体的八个顶点上,每个面上的任意三个数之和都不小于10。然后要找出不同的放法个数。首先,我需要明确正方体的结构。每个面有四个顶点,但题目里说的是每个面上的任意三个数之和都不小于10。也就是说,每个面的四个顶点中..."
* **Partial English Translation:** "<think> Hmm, this problem looks a bit challenging, but let me think about it slowly. The problem states that we place the numbers 1 to 8 on the eight vertices of a cube, and the sum of any three numbers on each face is not less than 10. Then we need to find the number of different placement methods. First, I need to clarify the structure of a cube. Each face has four vertices, but the problem says the sum of any three numbers on each face is not less than 10. That is to say, among the four vertices of each face..."
* **Right (Model 2):**
* **Title:** "Samples 64 – Model Accuracy: 14/64 = 21.9%"
* **Sample Bar:** A horizontal bar with 64 segments. Segments are colored either dark red (incorrect) or dark green (correct). The green segments are at indices: 0, 10, 13, 15, 21, 24, 40, 46, 47, 57, 59, 60, 61, 62.
* **Input Field:** "Enter Sample Number (0 – 63)" with a text box containing "0".
* **Output Status:** "✓ Correct" (in green).
* **Output Details:** "Extracted: $480$", "Output Tokens: 12751".
### Detailed Analysis
**Problem Grid Data (Key Points):**
* **Left Grid (GLM-Z1-Air):** Shows a scattered pattern of performance. Notable high-performing cells (green/olive) include:
* Cell 4: 62%
* Cell 5: 50%
* Cell 21: 62%
* Cell 22: 50%
* Cell 60: 75%
* Cell 92: 100% (the only perfect score).
* The majority of cells are dark red (0%) or brown (12-37%).
* **Right Grid (Light-R1-32B-DS):** Shows a different performance distribution. Notable high-performing cells include:
* Cell 13: 81%
* Cell 24: 42%
* Cell 30: 34%
* Cell 70: 62%
* Cell 73: 62%
* Cell 77: 70%
* Cell 92: 54%
* This grid has fewer 0% cells but also fewer extremely high (75%+) cells compared to the left grid.
**Model Accuracy Comparison:**
* **Model 1 (GLM-Z1-Air):** Evaluated on 8 samples. Achieved 0 correct answers (0.0% accuracy). The extracted answer for sample 0 was "$3360$", which was marked incorrect.
* **Model 2 (Light-R1-32B-DS):** Evaluated on 64 samples. Achieved 14 correct answers (21.9% accuracy). The extracted answer for sample 0 was "$480$", which was marked correct.
### Key Observations
1. **Performance Discrepancy:** There is a stark contrast in accuracy between the two models on this specific problem (0% vs. 21.9%), despite their similar overall benchmark scores shown in the dropdowns (12.1% vs. 11.6%).
2. **Answer Divergence:** For the same sample input (Sample 0), the models produced vastly different numerical answers ($3360$ vs. $480$), with only the latter being correct.
3. **Grid Pattern Differences:** The heatmap grids reveal that the models have different strengths and weaknesses across the 100 problem variants or test cases. Model 1 has a few very high peaks (including a 100% score) but many valleys (0%). Model 2's performance is more distributed, with fewer perfect scores but a higher baseline of non-zero results.
4. **Sample Size Inequality:** The models were evaluated on different sample sizes (8 vs. 64), which makes a direct comparison of the "Model Accuracy" percentage somewhat misleading without considering the confidence interval.
### Interpretation
This interface is a diagnostic tool for analyzing AI model reasoning on a complex combinatorial geometry problem. The data suggests:
* **Problem Difficulty:** The mathematical problem is non-trivial, as evidenced by the low accuracy rates (0% and 21.9%) even for specialized models. The correct answer appears to be 480.
* **Model Capability:** Model 2 (Light-R1-32B-DS) demonstrates a significantly better grasp of this specific problem type than Model 1 (GLM-Z1-Air). Its higher accuracy and the correctness of its answer for the displayed sample indicate more robust reasoning for this constraint-satisfaction task.
* **Diagnostic Value of the Grid:** The "Problem Grid" is not showing accuracy on 100 different problems, but likely the model's confidence or success rate on 100 different *sub-problems, reasoning steps, or perturbed versions* of the main problem. The color-coded heatmap allows researchers to quickly identify which specific aspects of the problem (represented by cell indices) are challenging for each model. For instance, both models scored 0% on cell 0, but Model 2 scored 81% on cell 13 where Model 1 scored 0%.
* **Token Efficiency:** Model 2 achieved a correct answer using fewer output tokens (12751 vs. 16133) for the same sample, suggesting potentially more efficient reasoning.
In summary, the image captures a moment of comparative analysis where one model clearly outperforms another on a challenging mathematical reasoning task, with visual tools provided to drill down into the granular performance differences.
</details>
Figure 5: The OlymMATH-demo interface. It is currently being maintained on HuggingFace Spaces.
## 5 Conclusion
We introduced OlymMATH, a challenging math benchmark for LLMs, uniquely curated from printed materials. It includes 200 problems across four fields, with easy (AIME-level) and hard (more challenging) subsets, in parallel English and Chinese versions. Our experiments with state-of-the-art LLMs, especially in slow-thinking modes, show significant struggles. Analysis highlights language-specific strengths and universal limitations like empirical guessing, identifying weaknesses in LLMs’ multi-step reasoning and logical consistency. Meanwhile, to facilitate community research, we have open-sourced over 580k reasoning data, a visualization tool, and solutions for challenging problems.
As part of our STILL project, OlymMATH affirms our belief in benchmarks’ pivotal role in advancing LLMs’ reasoning capabilities. We advocate for benchmarks to evolve faster than methodologies, guiding the field’s progress. Our planned expansion of OlymMATH embodies this commitment, aiming to further cultivate the development of more robust reasoning models and continue pushing the boundaries of language intelligence.
## References
- [1] Wayne Xin Zhao, Kun Zhou, Junyi Li, Tianyi Tang, Xiaolei Wang, Yupeng Hou, Yingqian Min, Beichen Zhang, Junjie Zhang, Zican Dong, Yifan Du, Chen Yang, Yushuo Chen, Zhipeng Chen, Jinhao Jiang, Ruiyang Ren, Yifan Li, Xinyu Tang, Zikang Liu, Peiyu Liu, Jian-Yun Nie, and Ji-Rong Wen. A survey of large language models, 2025.
- [2] An Yang, Baosong Yang, Beichen Zhang, Binyuan Hui, Bo Zheng, Bowen Yu, Chengyuan Li, Dayiheng Liu, Fei Huang, Haoran Wei, Huan Lin, Jian Yang, Jianhong Tu, Jianwei Zhang, Jianxin Yang, Jiaxi Yang, Jingren Zhou, Junyang Lin, Kai Dang, Keming Lu, Keqin Bao, Kexin Yang, Le Yu, Mei Li, Mingfeng Xue, Pei Zhang, Qin Zhu, Rui Men, Runji Lin, Tianhao Li, Tingyu Xia, Xingzhang Ren, Xuancheng Ren, Yang Fan, Yang Su, Yichang Zhang, Yu Wan, Yuqiong Liu, Zeyu Cui, Zhenru Zhang, and Zihan Qiu. Qwen2.5 technical report. arXiv preprint arXiv:2412.15115, 2024.
- [3] Abhimanyu Dubey, Abhinav Jauhri, Abhinav Pandey, Abhishek Kadian, Ahmad Al-Dahle, Aiesha Letman, Akhil Mathur, Alan Schelten, Amy Yang, Angela Fan, Anirudh Goyal, Anthony Hartshorn, Aobo Yang, Archi Mitra, Archie Sravankumar, Artem Korenev, Arthur Hinsvark, Arun Rao, Aston Zhang, Aurélien Rodriguez, Austen Gregerson, Ava Spataru, Baptiste Rozière, Bethany Biron, Binh Tang, Bobbie Chern, Charlotte Caucheteux, Chaya Nayak, Chloe Bi, Chris Marra, Chris McConnell, Christian Keller, Christophe Touret, Chunyang Wu, Corinne Wong, Cristian Canton Ferrer, Cyrus Nikolaidis, Damien Allonsius, Daniel Song, Danielle Pintz, Danny Livshits, David Esiobu, Dhruv Choudhary, Dhruv Mahajan, Diego Garcia-Olano, Diego Perino, Dieuwke Hupkes, Egor Lakomkin, Ehab AlBadawy, Elina Lobanova, Emily Dinan, Eric Michael Smith, Filip Radenovic, Frank Zhang, Gabriel Synnaeve, Gabrielle Lee, Georgia Lewis Anderson, Graeme Nail, Grégoire Mialon, Guan Pang, Guillem Cucurell, Hailey Nguyen, Hannah Korevaar, Hu Xu, Hugo Touvron, Iliyan Zarov, Imanol Arrieta Ibarra, Isabel M. Kloumann, Ishan Misra, Ivan Evtimov, Jade Copet, Jaewon Lee, Jan Geffert, Jana Vranes, Jason Park, Jay Mahadeokar, Jeet Shah, Jelmer van der Linde, Jennifer Billock, Jenny Hong, Jenya Lee, Jeremy Fu, Jianfeng Chi, Jianyu Huang, Jiawen Liu, Jie Wang, Jiecao Yu, Joanna Bitton, Joe Spisak, Jongsoo Park, Joseph Rocca, Joshua Johnstun, Joshua Saxe, Junteng Jia, Kalyan Vasuden Alwala, Kartikeya Upasani, Kate Plawiak, Ke Li, Kenneth Heafield, Kevin Stone, and et al. The llama 3 herd of models. CoRR, abs/2407.21783, 2024.
- [4] DeepSeek-AI, Daya Guo, Dejian Yang, Haowei Zhang, Junxiao Song, Ruoyu Zhang, Runxin Xu, Qihao Zhu, Shirong Ma, Peiyi Wang, Xiao Bi, Xiaokang Zhang, Xingkai Yu, Yu Wu, Z. F. Wu, Zhibin Gou, Zhihong Shao, Zhuoshu Li, Ziyi Gao, Aixin Liu, Bing Xue, Bingxuan Wang, Bochao Wu, Bei Feng, Chengda Lu, Chenggang Zhao, Chengqi Deng, Chenyu Zhang, Chong Ruan, Damai Dai, Deli Chen, Dongjie Ji, Erhang Li, Fangyun Lin, Fucong Dai, Fuli Luo, Guangbo Hao, Guanting Chen, Guowei Li, H. Zhang, Han Bao, Hanwei Xu, Haocheng Wang, Honghui Ding, Huajian Xin, Huazuo Gao, Hui Qu, Hui Li, Jianzhong Guo, Jiashi Li, Jiawei Wang, Jingchang Chen, Jingyang Yuan, Junjie Qiu, Junlong Li, J. L. Cai, Jiaqi Ni, Jian Liang, Jin Chen, Kai Dong, Kai Hu, Kaige Gao, Kang Guan, Kexin Huang, Kuai Yu, Lean Wang, Lecong Zhang, Liang Zhao, Litong Wang, Liyue Zhang, Lei Xu, Leyi Xia, Mingchuan Zhang, Minghua Zhang, Minghui Tang, Meng Li, Miaojun Wang, Mingming Li, Ning Tian, Panpan Huang, Peng Zhang, Qiancheng Wang, Qinyu Chen, Qiushi Du, Ruiqi Ge, Ruisong Zhang, Ruizhe Pan, Runji Wang, R. J. Chen, R. L. Jin, Ruyi Chen, Shanghao Lu, Shangyan Zhou, Shanhuang Chen, Shengfeng Ye, Shiyu Wang, Shuiping Yu, Shunfeng Zhou, Shuting Pan, and S. S. Li. Deepseek-r1: Incentivizing reasoning capability in llms via reinforcement learning. CoRR, abs/2501.12948, 2025.
- [5] OpenAI. Openai o1 system card, 2024.
- [6] Zhipeng Chen, Yingqian Min, Beichen Zhang, Jie Chen, Jinhao Jiang, Daixuan Cheng, Wayne Xin Zhao, Zheng Liu, Xu Miao, Yang Lu, Lei Fang, Zhongyuan Wang, and Ji-Rong Wen. An empirical study on eliciting and improving r1-like reasoning models, 2025.
- [7] An Yang, Beichen Zhang, Binyuan Hui, Bofei Gao, Bowen Yu, Chengpeng Li, Dayiheng Liu, Jianhong Tu, Jingren Zhou, Junyang Lin, Keming Lu, Mingfeng Xue, Runji Lin, Tianyu Liu, Xingzhang Ren, and Zhenru Zhang. Qwen2.5-math technical report: Toward mathematical expert model via self-improvement, 2024.
- [8] Karl Cobbe, Vineet Kosaraju, Mohammad Bavarian, Mark Chen, Heewoo Jun, Lukasz Kaiser, Matthias Plappert, Jerry Tworek, Jacob Hilton, Reiichiro Nakano, et al. Training verifiers to solve math word problems. arXiv preprint arXiv:2110.14168, 2021.
- [9] Dan Hendrycks, Collin Burns, Saurav Kadavath, Akul Arora, Steven Basart, Eric Tang, Dawn Song, and Jacob Steinhardt. Measuring mathematical problem solving with the MATH dataset. In Proceedings of the Neural Information Processing Systems Track on Datasets and Benchmarks 1, NeurIPS Datasets and Benchmarks 2021, December 2021, virtual, 2021.
- [10] Meng Fang, Xiangpeng Wan, Fei Lu, Fei Xing, and Kai Zou. Mathodyssey: Benchmarking mathematical problem-solving skills in large language models using odyssey math data, 2024.
- [11] Daman Arora, Himanshu Gaurav Singh, and Mausam. Have llms advanced enough? a challenging problem solving benchmark for large language models, 2023.
- [12] OpenAI. Openai o3-mini: Pushing the frontier of cost-effective reasoning, 1 2025.
- [13] Google Deepmind. Gemini 2.5: Our most intelligent ai model, 3 2025.
- [14] Yingqian Min, Zhipeng Chen, Jinhao Jiang, Jie Chen, Jia Deng, Yiwen Hu, Yiru Tang, Jiapeng Wang, Xiaoxue Cheng, Huatong Song, Wayne Xin Zhao, Zheng Liu, Zhongyuan Wang, and Ji-Rong Wen. Imitate, explore, and self-improve: A reproduction report on slow-thinking reasoning systems, 2024.
- [15] Mathematical Association of America. Aime 2024, 2024.
- [16] Mathematical Association of America. Aime 2025, 2025.
- [17] HMMT. Hmmt 202502, 2025.
- [18] Mathematical Association of America. Usamo 2025, 2025.
- [19] Chaoqun He, Renjie Luo, Yuzhuo Bai, Shengding Hu, Zhen Leng Thai, Junhao Shen, Jinyi Hu, Xu Han, Yujie Huang, Yuxiang Zhang, Jie Liu, Lei Qi, Zhiyuan Liu, and Maosong Sun. Olympiadbench: A challenging benchmark for promoting AGI with olympiad-level bilingual multimodal scientific problems. In Proceedings of the 62nd Annual Meeting of the Association for Computational Linguistics (Volume 1: Long Papers), ACL 2024, Bangkok, Thailand, August 11-16, 2024, pages 3828–3850, 2024.
- [20] Bofei Gao, Feifan Song, Zhe Yang, Zefan Cai, Yibo Miao, Qingxiu Dong, Lei Li, Chenghao Ma, Liang Chen, Runxin Xu, et al. Omni-math: A universal olympiad level mathematic benchmark for large language models. arXiv preprint arXiv:2410.07985, 2024.
- [21] RUCAIBox STILL Team. Still-3-1.5b-preview: Enhancing slow thinking abilities of small models through reinforcement learning. 2025.
- [22] Michael Luo, Sijun Tan, Justin Wong, Xiaoxiang Shi, William Y. Tang, Manan Roongta, Colin Cai, Jeffrey Luo, Li Erran Li, Raluca Ada Popa, and Ion Stoica. Deepscaler: Surpassing o1-preview with a 1.5b model by scaling rl, 2025. Notion Blog.
- [23] Qwen Team. Qwq-32b: Embracing the power of reinforcement learning, March 2025.
- [24] Liang Wen, Yunke Cai, Fenrui Xiao, Xin He, Qi An, Zhenyu Duan, Yimin Du, Junchen Liu, Lifu Tang, Xiaowei Lv, Haosheng Zou, Yongchao Deng, Shousheng Jia, and Xiangzheng Zhang. Light-r1: Curriculum sft, dpo and rl for long cot from scratch and beyond, 2025.
- [25] OpenThoughts Team. Open Thoughts. https://open-thoughts.ai, January 2025.
- [26] Jujie He, Jiacai Liu, Chris Yuhao Liu, Rui Yan, Chaojie Wang, Peng Cheng, Xiaoyu Zhang, Fuxiang Zhang, Jiacheng Xu, Wei Shen, Siyuan Li, Liang Zeng, Tianwen Wei, Cheng Cheng, Yang Liu, and Yahui Zhou. Skywork open reasoner series, 2025. Notion Blog.
- [27] Team GLM, Aohan Zeng, Bin Xu, Bowen Wang, Chenhui Zhang, Da Yin, Diego Rojas, Guanyu Feng, Hanlin Zhao, Hanyu Lai, Hao Yu, Hongning Wang, Jiadai Sun, Jiajie Zhang, Jiale Cheng, Jiayi Gui, Jie Tang, Jing Zhang, Juanzi Li, Lei Zhao, Lindong Wu, Lucen Zhong, Mingdao Liu, Minlie Huang, Peng Zhang, Qinkai Zheng, Rui Lu, Shuaiqi Duan, Shudan Zhang, Shulin Cao, Shuxun Yang, Weng Lam Tam, Wenyi Zhao, Xiao Liu, Xiao Xia, Xiaohan Zhang, Xiaotao Gu, Xin Lv, Xinghan Liu, Xinyi Liu, Xinyue Yang, Xixuan Song, Xunkai Zhang, Yifan An, Yifan Xu, Yilin Niu, Yuantao Yang, Yueyan Li, Yushi Bai, Yuxiao Dong, Zehan Qi, Zhaoyu Wang, Zhen Yang, Zhengxiao Du, Zhenyu Hou, and Zihan Wang. Chatglm: A family of large language models from glm-130b to glm-4 all tools, 2024.
- [28] Zihan Liu, Yang Chen, Mohammad Shoeybi, Bryan Catanzaro, and Wei Ping. Acemath: Advancing frontier math reasoning with post-training and reward modeling. arXiv preprint, 2024.
- [29] Ivan Moshkov, Darragh Hanley, Ivan Sorokin, Shubham Toshniwal, Christof Henkel, Benedikt Schifferer, Wei Du, and Igor Gitman. Aimo-2 winning solution: Building state-of-the-art mathematical reasoning models with openmathreasoning dataset, 2025.
- [30] Qwen Team. Qwen3, April 2025.
## Appendix A Appendix
This part presents the detailed content of the dataset and the case study examples mentioned before.
| Problem: Given that two vertices of an equilateral triangle are on the parabola $y^2=4x$ , and the third vertex is on the directrix of the parabola, and the distance from the center of the triangle to the directrix equals $\frac{1}{9}$ of the perimeter. Find the area of the triangle. Subject: Geometry |
| --- |
Figure 6: A geometry problem described precisely in text from OlymMATH.
| Original problem: If the distances from the eight vertices of a cube to a certain plane are $0 0$ , $1$ , $2$ , $3$ , $4$ , $5$ , $6$ , $7$ respectively, what is the possible edge length of this cube? After transformation: If the distances from the eight vertices of a cube to a certain plane are $0 0$ , $1$ , $2$ , $3$ , $4$ , $5$ , $6$ , $7$ respectively, consider all possible edge lengths of this cube. Assuming the possible edge lengths form a set $S$ , find the sum of squares of all elements in $S$ . |
| --- |
Figure 7: An OlymMATH-HARD example testing model’s identification of all possible answers.
<details>
<summary>x4.png Details</summary>
### Visual Description
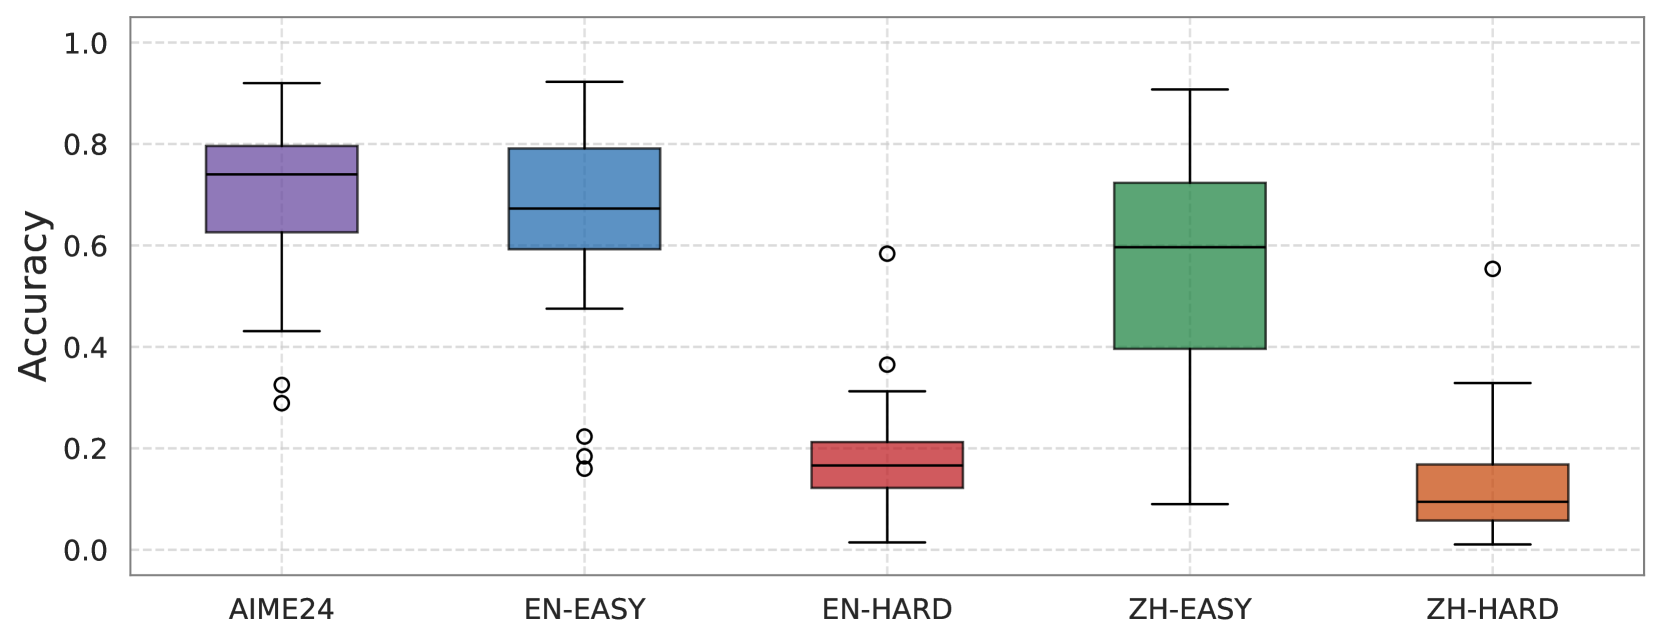
## Box Plot: Accuracy Comparison Across Five Task Categories
### Overview
The image displays a box-and-whisker plot comparing the distribution of "Accuracy" scores across five distinct task categories. The chart is presented on a white background with a light gray grid. The plot visualizes statistical summaries (median, quartiles, range, and outliers) for each category, allowing for comparison of central tendency, spread, and performance consistency.
### Components/Axes
* **Y-Axis:** Labeled **"Accuracy"**. The scale runs from 0.0 to 1.0, with major tick marks and grid lines at intervals of 0.2 (0.0, 0.2, 0.4, 0.6, 0.8, 1.0).
* **X-Axis:** Contains five categorical labels, each corresponding to a colored box plot:
1. **AIME24** (Purple box)
2. **EN-EASY** (Blue box)
3. **EN-HARD** (Red box)
4. **ZH-EASY** (Green box)
5. **ZH-HARD** (Orange box)
* **Legend:** There is no separate legend box. The color-coding is directly associated with the x-axis category labels.
* **Plot Elements:** Each category features:
* A **box** spanning the interquartile range (IQR, from the 25th to the 75th percentile).
* A **horizontal line** inside the box marking the **median**.
* **Whiskers** extending from the box to the minimum and maximum values within 1.5 * IQR.
* **Individual circles** representing **outliers** beyond the whisker range.
### Detailed Analysis
**1. AIME24 (Purple)**
* **Median:** Approximately 0.75.
* **IQR (Box):** Spans from ~0.62 to ~0.80.
* **Whiskers:** Extend from a minimum of ~0.43 to a maximum of ~0.92.
* **Outliers:** Two distinct low-value outliers at approximately 0.32 and 0.29.
* **Trend/Spread:** Shows a relatively high median and a moderate spread. The presence of low outliers indicates some instances of significantly lower performance.
**2. EN-EASY (Blue)**
* **Median:** Approximately 0.68.
* **IQR (Box):** Spans from ~0.59 to ~0.79.
* **Whiskers:** Extend from a minimum of ~0.48 to a maximum of ~0.92.
* **Outliers:** Two low-value outliers clustered around 0.22 and 0.18.
* **Trend/Spread:** Median is slightly lower than AIME24. The box is similarly sized, indicating comparable variability in the middle 50% of data. Also features low outliers.
**3. EN-HARD (Red)**
* **Median:** Approximately 0.18.
* **IQR (Box):** Spans from ~0.12 to ~0.22.
* **Whiskers:** Extend from a minimum of ~0.02 to a maximum of ~0.32.
* **Outliers:** Two high-value outliers at approximately 0.58 and 0.36.
* **Trend/Spread:** Dramatically lower median and a much tighter IQR compared to the "EASY" categories. The overall range is low, but high outliers show rare instances of much better performance.
**4. ZH-EASY (Green)**
* **Median:** Approximately 0.60.
* **IQR (Box):** Spans from ~0.40 to ~0.72. This is the tallest box, indicating the largest IQR.
* **Whiskers:** Extend from a minimum of ~0.09 to a maximum of ~0.91. This is the widest overall range.
* **Outliers:** No visible outliers.
* **Trend/Spread:** Shows a median lower than both AIME24 and EN-EASY. The very large spread (both IQR and range) suggests highly inconsistent performance across the samples in this category.
**5. ZH-HARD (Orange)**
* **Median:** Approximately 0.10.
* **IQR (Box):** Spans from ~0.06 to ~0.17.
* **Whiskers:** Extend from a minimum of ~0.01 to a maximum of ~0.33.
* **Outliers:** One high-value outlier at approximately 0.55.
* **Trend/Spread:** Has the lowest median of all categories. The spread is relatively tight, similar to EN-HARD, but centered at an even lower accuracy level. One notable high outlier exists.
### Key Observations
1. **Clear Performance Tiering:** There is a stark divide between "EASY" and "HARD" tasks. The medians for EN-EASY (~0.68) and ZH-EASY (~0.60) are substantially higher than those for EN-HARD (~0.18) and ZH-HARD (~0.10).
2. **AIME24 Performance:** The AIME24 category performs comparably to, or slightly better than, the EN-EASY category in terms of median and upper quartile.
3. **Variability:** ZH-EASY exhibits the greatest variability in performance (widest IQR and range). EN-HARD and ZH-HARD show the least variability in their core distributions (smallest IQRs).
4. **Outlier Patterns:** Low outliers are present in the two highest-performing categories (AIME24, EN-EASY). High outliers are present in the two lowest-performing categories (EN-HARD, ZH-HARD). This suggests that while most samples follow the trend, there are exceptional cases that defy the category's general difficulty.
### Interpretation
This box plot likely compares the performance of one or more AI models on different benchmark datasets or task difficulties. The data suggests:
* **Task Difficulty is a Primary Driver:** The "HARD" designation strongly correlates with low accuracy, indicating these tasks are significantly more challenging for the evaluated system(s).
* **Language/Domain Nuance:** While both "EASY" sets outperform the "HARD" sets, the ZH-EASY (Chinese Easy) tasks show much higher variance than EN-EASY (English Easy). This could imply that the model's performance on easier Chinese tasks is less consistent, possibly due to factors like training data distribution or linguistic complexity.
* **Benchmark Context:** "AIME24" likely refers to a specific competition or benchmark (e.g., American Invitational Mathematics Examination 2024). Its performance profile aligning with EN-EASY suggests the model handles this benchmark at a level similar to general "easy" English tasks.
* **Outlier Significance:** The presence of outliers is critical. The low outliers in high-accuracy groups and high outliers in low-accuracy groups indicate that factors beyond the labeled difficulty (e.g., specific problem types, data quirks, or model failure modes) can lead to atypical results. These outliers warrant individual investigation to understand edge-case behavior.
**Language Declaration:** All text in the image is in English.
</details>
Figure 8: This boxplot shows that our EASY dataset has AIME-level difficulty with a wider distribution, while the HARD dataset is significantly more challenging, demonstrating the discriminative power of our benchmark.
| Problem: In the triangle $\triangle ABC$ , the lengths of the three sides are $a,b,c$ , satisfying the condition $2a^2+b^2+c^2=4$ . Find the maximum value of the area of $\triangle ABC$ . Answer: $\frac{√{5}}{5}$ . (When $a=\frac{2}{√{5}}$ , $b=c=√{\frac{6}{5}}$ ) |
| --- |
| Model Output: We wish to maximize the area of $\triangle ABC$ , subject to $2a^2+b^2+c^2=4.$ Because the condition is symmetric in $b$ and $c$ (but not in $a$ ), it is reasonable to look for an optimum among triangles having $b=c$ . (Later one can check that assuming $b=c$ indeed gives the maximum.) The problem involves maximizing the area of an isosceles triangle with sides $a,b,b$ under the constraint $2a^2+b^2+c^2=4$ . By assuming $b=c$ , we derive a formula for the area in terms of $b$ and find the maximum area by expressing it as a function of $u=b^2$ . We then determine the critical points of this quadratic function, identify the maximum area, and finally recover the side lengths to verify that they satisfy the original constraints. The maximum area achieved is $\frac{√{5}}{5}$ . |
Figure 9: An example during our data collection. o3-mini (high) found the correct answer without rigorously solving the problem. Due to length constraints, we provide only a summary of its original solution steps.
| Col1 |
| --- |
| Problem: Let the sequence of rationals $x_1,x_2,\dots$ be defined such that $x_1=\frac{25}{11}$ and $x_k+1=\frac{1}{3}≤ft(x_k+\frac{1}{x_k}-1\right).$ $x_2025$ can be expressed as $\frac{m}{n}$ for relatively prime positive integers $m$ and $n$ . Find the remainder when $m+n$ is divided by $1000$ . Answer: $248$ . |
| Model Output: We will show that if $x_1=\frac{25}{11}$ and $x_k+1=\frac{1}{3}\Bigl{(}x_k+\frac{1}{x_k}-1\Bigr{)},$ then after “many” iterations the answer to $x_2025=\frac{m}{n}$ (in lowest terms) satisfies $m+n≡ 248±od{1000}.$ In what follows we briefly describe one way (via a “miraculous” change-of–variables) to “solve” the recurrence; the details need not be reproduced fully here. A good hint is that the recurrence $x_k+1=\frac{1}{3}\Bigl{(}x_k+\frac{1}{x_k}-1\Bigr{)}$ has the curious symmetry $T(x)=\frac{1}{3}\Bigl{(}x+\frac{1}{x}-1\Bigr{)}=T\Bigl{(}\frac{1}{x}\Bigr{)},$ so the expression $x+\frac{1}{x}$ (which is “symmetric” in $x$ and its reciprocal) naturally appears. In fact, one may rewrite the recurrence in the form $3x_k+1+1=x_k+\frac{1}{x_k}.$ A useful idea is then to “complete the square” by writing $≤ft(√{x_k}-\frac{1}{√{x_k}}\right)^2=x_k+\frac{1}{x_k}-2$ , so that $3x_k+1+1=≤ft(√{x_k}-\frac{1}{√{x_k}}\right)^2+2.$ Defining $u_k=√{x_k}-\frac{1}{√{x_k}}$ , one obtains the “linear-looking” relation $u_k^2=3x_k+1-1.$ With some additional work it turns out that if we write $x_k=\frac{m_k}{n_k}$ (in lowest terms), then one may prove by induction that $m_k+n_k=36· 12^(2^{ k-1-1)}.$ (In our case one checks that $m_1+n_1=25+11=36$ , $m_2+n_2=432$ , $m_3+n_3=62208,$ and indeed $36,432,62208$ equal $36· 12^0, 36· 12^1, 36· 12^3$ respectively.) Thus, for $k=2025$ we have $m+n=36· 12^≤ft(2^{2024-1\right)}.$ Even though this number is astronomically large, we are only asked to compute $m+n±od{1000}.$ Using modular reductions, we compute $m+n$ modulo 1000. First, modulo 8, we find $36· 12^(2^{2024-1)}≡ 0±od{8}$ . Modulo 125, Euler’s theorem helps reduce $12^N$ to $12^15≡ 118±od{125}$ , giving $36· 12^N≡ 123±od{125}$ . Using the Chinese Remainder Theorem, solving $125k+123≡ 0±od{8}$ gives $k≡ 1±od{8}$ , leading to the final answer: $\boxed{248}$ . |
Figure 10: An example from AIME 2025. o3-mini (high) forgot to prove that $(m_k,n_k)=1$ and it claimed that $m_k+n_k=36· 12^≤ft(2^{k-1-1\right)}$ without providing the complete proof (highlighted in red). Instead, the model “guessed” this expression by calculating the first several terms in the sequence one by one. Due to length constraints, we provide only a summary of its unimportant steps.
Figure 11: An example from Omni-MATH. The solution provided by Omni-MATH itself is flawed and problematic. Both the reference solution and o3-mini (high) failed to prove that there are no other possible function $f$ that satisfies the condition (highlighted in red). Due to length constraints, we have omitted its unimportant steps.
Figure 12: An example from OlymMATH-EN-HARD subset. o3-mini (high) attempted to “guess” the equality conditions but failed to produce a correct solution (highlighted in red).