# Knowledge Graph-extended Retrieval Augmented Generation for Question Answering
**Authors**: \fnmJasper\surLinders
> jasper.linders@gmail.com
> jmk.tomczak@gmail.com111Currently working at Chan Zuckerberg Initiative:jtomczak@chanzuckerberg.com[
[1] \fnm Jakub M. \sur Tomczak
1] \orgdiv Department of Mathematics and Computer Science, \orgname Eindhoven University of Technology, \orgaddress \street De Zaale, \city Eindhoven, \postcode 5600 MB, \country the Netherlands
Abstract
Large Language Models (LLMs) and Knowledge Graphs (KGs) offer a promising approach to robust and explainable Question Answering (QA). While LLMs excel at natural language understanding, they suffer from knowledge gaps and hallucinations. KGs provide structured knowledge but lack natural language interaction. Ideally, an AI system should be both robust to missing facts as well as easy to communicate with. This paper proposes such a system that integrates LLMs and KGs without requiring training, ensuring adaptability across different KGs with minimal human effort. The resulting approach can be classified as a specific form of a Retrieval Augmented Generation (RAG) with a KG, thus, it is dubbed Knowledge Graph-extended Retrieval Augmented Generation (KG-RAG). It includes a question decomposition module to enhance multi-hop information retrieval and answer explainability. Using In-Context Learning (ICL) and Chain-of-Thought (CoT) prompting, it generates explicit reasoning chains processed separately to improve truthfulness. Experiments on the MetaQA benchmark show increased accuracy for multi-hop questions, though with a slight trade-off in single-hop performance compared to LLM with KG baselines. These findings demonstrate KG-RAG’s potential to improve transparency in QA by bridging unstructured language understanding with structured knowledge retrieval.
keywords: Knowledge Graphs, Large Language Models, Retrieval-Augmented Generation, Question Answering
1 Introduction
As our world becomes increasingly digital and information is more widely available than ever before, technologies that enable information retrieval and processing have become indispensable in both our personal and professional lives. The advent of Large Language Models (LLMs) has had a great impact, by changing the way many internet users interact with information, through models like ChatGPT https://chatgpt.com/. This has arguably played a large role in sparking an immense interest in solutions that build on artificial intelligence.
The rapid adoption of LLMs has transformed the fields of natural language processing (NLP) and information retrieval (IR). Understanding of natural language, with its long range dependencies and contextual meanings, as well as human-like text generation capabilities, allows these models to be applied to a wide variety of tasks. Additionally, LLMs have proven to be few-shot learners, meaning that they have the ability to perform unseen tasks with only a couple of examples [1]. Unfortunately, the benefits of LLMs come at the cost of characteristic downsides, which are important to consider.
LLMs can hallucinate [2], generating untruthful or incoherent outputs. They also miss knowledge not present during training, leading to knowledge cutoff, and cannot guarantee that certain training data is remembered [3]. Because of their massive size and data requirements, LLMs are expensive to train, deploy, and maintain [4]. Thus, smaller models or those needing only fine-tuning can be more practical for many use cases.
By contrast, Knowledge Graphs (KGs) store information explicitly as entities and relationships, allowing symbolic reasoning and accurate answers [5]. Even if a direct link between entities is missing, inferences can be drawn from their shared associations. KGs may also recall underrepresented knowledge better than LLMs [3]. However, they are costly to build, specialized to a domain, and typically require querying languages rather than natural language [6]. They also do not easily generalize to other domains [5].
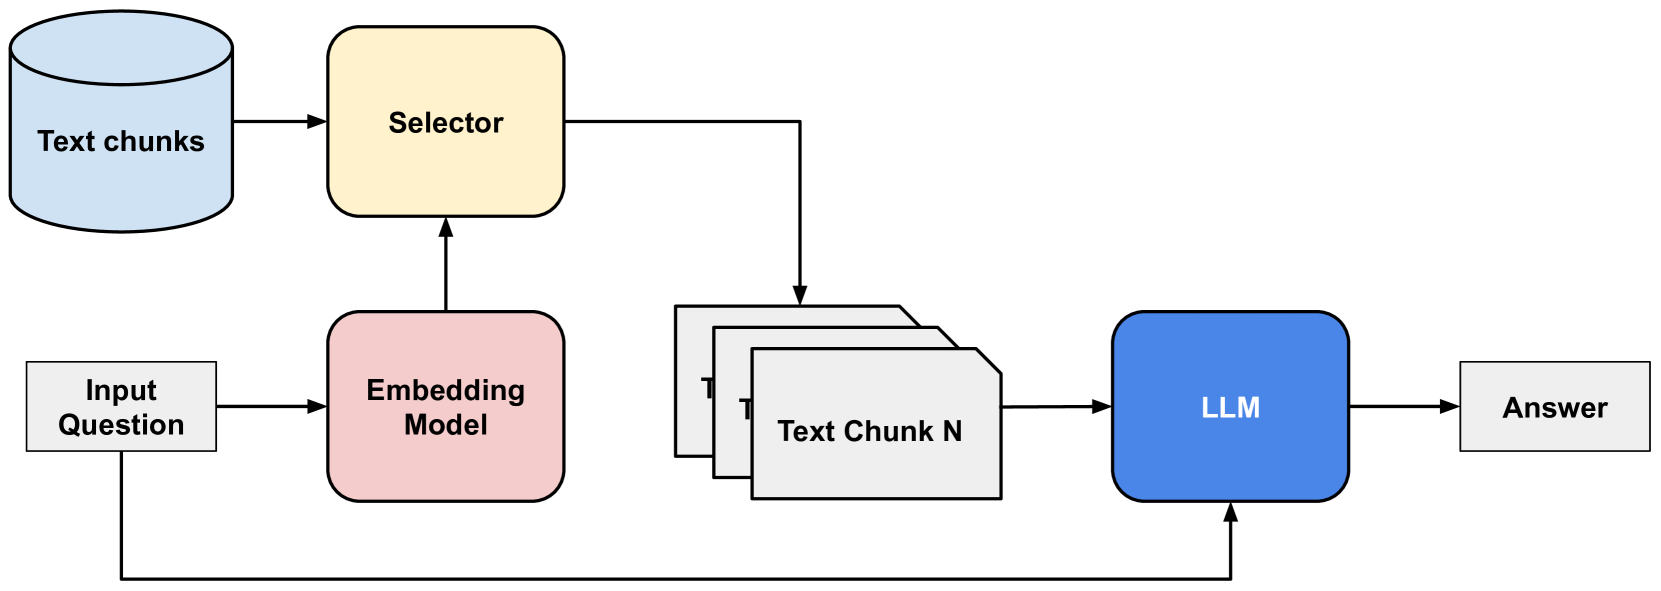
Retrieval-Augmented Generation (RAG) [7] addresses LLMs’ lack of external knowledge by augmenting them with a text document database. Text documents are split into chunks, embedded, and stored in a vector database; the most similar chunks to an input query are retrieved and added to a prompt so the LLM can generate an answer based on this external information [8] (see Figure 1). However, relying on unstructured text can miss comprehensive entity data and even introduce distracting misinformation [8].
<details>
<summary>x1.png Details</summary>
### Visual Description
## Diagram: LLM Workflow
### Overview
The image is a diagram illustrating the workflow of a Large Language Model (LLM) system. It shows the flow of information from an input question, through various components like an embedding model, a selector, and text chunks, culminating in an answer generated by the LLM.
### Components/Axes
* **Input Question:** A white rectangle on the left, representing the initial query.
* **Embedding Model:** A pink rounded rectangle, which processes the input question.
* **Text chunks:** A light blue cylinder, representing a collection of text data.
* **Selector:** A yellow rounded rectangle, which selects relevant text chunks.
* **Text Chunk N:** A stack of white rectangles, representing the selected text chunks.
* **LLM:** A blue rounded rectangle, representing the Large Language Model.
* **Answer:** A white rectangle on the right, representing the final output.
* Arrows indicate the flow of information between components.
### Detailed Analysis
1. **Input Question** flows into the **Embedding Model**.
2. The **Embedding Model** sends information to the **Selector**.
3. The **Text chunks** also send information to the **Selector**.
4. The **Selector** selects relevant **Text Chunk N**.
5. **Text Chunk N** is fed into the **LLM**.
6. The **Input Question** is also fed into the **LLM**.
7. The **LLM** generates an **Answer**.
### Key Observations
* The diagram illustrates a typical Retrieval-Augmented Generation (RAG) architecture.
* The Embedding Model and Selector components are crucial for retrieving relevant information from the text chunks.
* The LLM uses both the input question and the retrieved text chunks to generate the final answer.
### Interpretation
The diagram depicts a system where an LLM is augmented with external knowledge retrieved from a collection of text chunks. The input question is first processed by an embedding model, which helps to identify relevant text chunks. A selector then chooses the most pertinent chunks, which are fed into the LLM along with the original question. This allows the LLM to generate a more informed and accurate answer by leveraging the retrieved information. The system effectively combines the LLM's reasoning capabilities with external knowledge, improving its performance on complex tasks.
</details>
Figure 1: An example of a Retrieval-Augmented Generation (RAG) system, which combines information retrieval and text generation techniques. The red block indicates processing by a text embedding model, whereas the blue block depicts processing by an LLM. The yellow block shows a selector of nearest text chunks in the database.
To overcome these limitations, RAGs can utilize KGs. The resulting system integrates structured data from Knowledge Graphs in a RAG, enabling precise retrieval and complex reasoning. For example, KAPING [9] performs Knowledge Graph Question Answering (KGQA) without requiring any training. When training is needed for KG-enhanced LLMs, issues arise such as limited training data, domain specificity, and the need for frequent retraining as KGs evolve [10, 11]. In short, while RAG enhances LLMs by providing explainable, natural language outputs, incorporating structured Knowledge Graphs may offer improved reasoning and domain adaptability.
In this paper, we propose the Knowledge Graph-extended Retrieval Augmented Generation (KG-RAG) system, which combines the reliability of Retrieval Augmented Generation (RAG) with the high precision of Knowledge Graphs (KGs) and operates without any training or fine-tuning. We focus on the task of Knowledge Graph Question Answering; although this focus is narrow, our findings may have broader implications. For instance, certain insights could be applied to the development of other systems that utilize KG-based information retrieval, such as chatbots. The primary objective of this work is to investigate how LLMs can be enhanced through the integration of KGs. Since the term ”enhance” can encompass various improvements, we define it as follows. First, we aim to enable LLMs to be more readily applied across different domains requiring specialized or proprietary knowledge. Second, we seek to improve answer explainability, thereby assisting end users in validating LLM outputs. Eventually, we aim to answer the following research questions:
1. How can Large Language Models be enhanced with Knowledge Graphs without requiring any training?
1. How can answer explainability be improved with the use of Knowledge Graph-extended Retrieval Augmented Generation systems?
2 Related Work
Knowledge Graphs
Knowledge Graphs (KGs) are structured databases that model real-world entities and their relationships as graphs, which makes them highly amenable to machine processing. They enable efficient querying to retrieve all entities related to a given entity, a task that would be significantly more challenging with unstructured text databases. Complex queries are executed using specialized languages such as SPARQL [12]. As noted in recent research, ”the success of KGs can largely be attributed to their ability to provide factual information about entities with high accuracy” [3]. Typically, the information in KGs is stored as triples, i.e. $(subject,relation,object)$ .
Large Language Models
Large Language Models (LLMs) learn natural language patterns from extensive text data, enabling various NLP tasks such as text generation and sentiment classification. Their emergence was enabled by the Transformer architecture, introduced in Attention Is All You Need [13], which efficiently models sequential data via attention mechanisms. Scaling these models—by increasing compute, dataset size, and parameter count—yields performance improvements following a power law [14], with LLMs typically comprising hundreds of millions to hundreds of billions of parameters.
LLMs generate text in an autoregressive manner. Given a sequence $x_{1:t}$ , the model produces a probability distribution $p(x_{t+1}|x_{1:t})=\mathrm{softmax}(z/T)$ over its vocabulary, where $z$ are the raw logits and $T$ is a temperature parameter that controls randomness. Instead of selecting tokens via simple $\mathrm{argmax}$ , more sophisticated sampling methods are employed (see Section 3.5) to generate coherent and diverse output consistent with the input context [15].
In-Context Learning & Chain-of-Thought
In-Context Learning (ICL) improves LLM performance by providing few-shot examples instead of zero-shot queries. This method boosts task performance through prompt engineering without altering model parameters [16]. It is often combined with Chain-of-Thought (CoT) that can significantly enhance performance without modifying the model’s parameters or incurring the high cost of fine-tuning [17]. A CoT prompt instructs the model to generate intermediate reasoning steps that culminate in the final answer, rather than directly mapping a query to an answer [17]. This approach naturally decomposes complex queries into simpler steps, yielding more interpretable results.
Knowledge Graph Question Answering
Knowledge Graph Question Answering (KGQA) is the task of answering questions using a specific knowledge graph (KG). Benchmarks such as Mintaka [18], WebQuestionsSP [19], and MetaQA [20] provide datasets where each row includes a question, its associated entity/entities, and the answer entity/entities, along with the corresponding KG (provided as a file of triples or accessible via an API). In these benchmarks, the question entity is pre-identified (avoiding the need for entity matching or linking), and performance is evaluated using the binary Hit@1 metric.
KGQA systems are typically classified into three categories [9]:
- Neural Semantic Parsing-Based Methods: These map a question to a KG query (e.g., in SPARQL), reducing the search space between question and answer entities. Although effective [19], they require labor-intensive semantic parse labels.
- Differentiable KG-Based Methods: These employ differentiable representations of the KG (using sparse matrices for subjects, objects, and relations) to perform query execution in the embedding space. They enable end-to-end training on question-answer pairs [21, 22], but necessitate ample training data and may not generalize across different KGs.
- Information Retrieval-Based Methods: These combine KGs with LLMs by retrieving relevant facts—which are then injected into the prompt—to generate answers [9]. Although they leverage off-the-shelf components, they often require fine-tuning on KG-specific datasets [11].
Knowledge Graph-extended Retrieval Augmented Generation
Information retrieval-based KGQA (IR-KGQA) systems differ from neural semantic parsing and differentiable KG methods by delegating part of the reasoning over triples to the LLM. The process is split into retrieving candidate triples and then having the LLM reason over them to formulate an answer, whereas the other methods map directly from the question to the answer entities [21, 23].
KG-RAG is defined as an IR-KGQA system that employs a similarity-based retrieval mechanism using off-the-shelf text embedding models, akin to the original RAG system [7]. In KG-RAG (exemplified by the KAPING system [9]), candidate triples are retrieved up to $N$ hops from the question entity/entities, verbalized, and embedded alongside the question. Their similarity is computed via dot or cosine product, and the Top- $K$ similar triples are passed to an answer generation LLM, which then outputs the answer.
3 Methodology
3.1 Problem Statement
Let $G$ be a knowledge graph, defined as a set of triples of the form $(s,r,o)$ where:
- Each triple $(s,r,o)∈ G⊂eq\mathcal{E}×\mathcal{R}×\mathcal{E}$ represents a fact;
- $s,o∈\mathcal{E}$ are entities from the set of all entities $\mathcal{E}$ ;
- $r∈\mathcal{R}$ is a relation from the set of all relations $\mathcal{R}$ .
We assume that the following objects are given:
- A question $q$ that can be answered using facts from $G$
- The question entity/entities part of that question $e_{q}∈\mathcal{E}$
Moreover, let us introduce the following variables:
- $a$ denotes a natural language answer that can be derived from the facts in $G$ ;
- $c$ is a reasoning chain in natural language, explaining the logical steps from $q$ and $e_{q}$ to $a$
Our objective is to develop a function $f$ that maps given object to both an answer and the reasoning chain, namely:
$$
f:q\times e_{q}\times G\rightarrow(a,c)
$$
where:
- $a$ is a natural language answer that can be derived from the facts in $G$
- $c$ is a reasoning chain in natural language, explaining the logical steps from $q$ and $e_{q}$ to $a$
Additionally, we aim for the following:
- Answer Accuracy: The function $f$ should have high answer accuracy, as evaluated by the Hit@1 metric.
- Answer Explainability: For each answer $a$ generated by the function $f$ , the reasoning chain $c$ must provide a clear logical explanation of how the answer was derived, so that it is more easily verifiable by the user.
- Application Generalizability: The function $f$ must operate without training or finetuning on specific Knowledge Graphs, using only In-Context Learning examples. The Knowledge Graphs must include sufficient amounts of natural language information, as the system relies on natural language-based methods.
The degree to which the function $f$ achieves the objectives is evaluated using both quantitative and qualitative methods, based on experiments with a KGQA benchmark, namely:
- Quantitative evaluation of answer accuracy, based on the Hit@1 metric.
- Qualitative analysis of reasoning chain clarity and logical soundness, as judged by a human evaluator on a sample of results.
3.2 State-of-the-Art
Recent advances in question answering have seen the development of several state-of-the-art methods that leverage a diverse array of Large Language Models alongside innovative baseline strategies. For instance, one method employs multiple scales of models such as T5, T0, OPT, and GPT-3, while experimenting with baselines ranging from no knowledge to generated knowledge on datasets like WebQSP [19] and Mintaka [18]. Another approach expands this exploration by integrating Llama-2, Flan-T5, and ChatGPT, and introducing baselines that utilize triple-form knowledge and alternative KG-to-Text techniques, evaluated on datasets that include WebQSP, MetaQA [20], and even a Chinese benchmark, ZJQA [11]. Additionally, methods centered on ChatGPT are further compared with systems like StructGPT and KB-BINDER across varying complexities of MetaQA and WebQSP. The overview of the SOTA methods is presented in Table 1.
Table 1: Comparison of the question answering LLMs, baselines and benchmark datasets that were used for the different models. The full set of QA LMs is as follows: T0 [24], T5 [25], Flan-T5 [26], OPT [27], GPT-3 [1], ChatGPT, AlexaTM [28], and Llama-2 [29]. The full set of datasets is as follows: WebQuestions [30], WebQSP [19], ComplexWebQuestions [31], MetaQA [20], Mintaka [18], LC-QuAD [32], and ZJQA [11].
| KAPING [9] Retrieve-Rewrite-Answer [11] Keqing [10] | T5 (0.8B, 3B, 11B) T0 (3B, 11B) OPT (2.7B, 6.7B) GPT-3 (6.7B, 175B) Llama-2 (7B, 13B) T5 (0.8B, 3B, 11B) Flan-T5 (80M, 3B, 11B) T0 (3B, 11B) ChatGPT ChatGPT | No knowledge Random knowledge Popular knowledge Generated knowledge No knowledge Triple-form knowledge 2x Alternative KG-to-Text 2x Rival model ChatGPT StructGPT KB-BINDER | WebQSP (w/ 2 KGs) Mintaka WebQSP WebQ MetaQA ZJQA (Chinese) WebQSP MetaQA-1hop MetaQA-2hop MetaQA-3hop |
| --- | --- | --- | --- |
3.2.1 KAPING
KAPING [9] is one of the best IR-KGQA models that requires no training. For example, due to the large number of candidate triples–27 $\%$ of entities in WebQSP [19] have more than 1000 triples–a text embedding-based selection mechanism is employed, typically using cosine similarity [33], instead of appending all triples directly to the prompt. KAPING outperforms many baselines presented in Table 1 in terms of Hit@1, especially those with smaller LLMs, suggesting that external knowledge compensates for the limited parameter space. Notably, using 2-hop triples degrades performance, so only 1-hop triples are selected; when retrieval fails to fetch relevant triples, performance drops below a no-knowledge baseline. An additional finding is that triple-form text outperforms free-form text for retrieval, as converting triples to free-form via a KG-to-Text model often leads to semantic incoherence, and using free-form text in prompts does not improve answer generation.
3.2.2 Retrieve-Rewrite-Answer
Motivated by KAPING’s limitations, the Retrieve-Rewrite-Answer (RRA) architecture was developed for KGQA [11]. Unlike KAPING, which overlooked the impact of triple formatting, RRA introduces a novel triple verbalization module, among other changes. Specifically, question entities are extracted from annotated datasets (with entity matching deferred). The retrieval process consists of three steps: (i) a hop number is predicted via a classification task on the question embedding; (ii) relation paths–sequences of KG relationships–are predicted by sampling and selecting the top- $K$ candidates based on total probability; (iii) selected relation paths are transformed into free-form text using a fine-tuned LLM. This verbalized output, together with the question, is fed to a QA LLM via a prompt template.
For training, the hop number and relation path classifiers, as well as the KG-to-Text LLM, are tuned on each benchmark. Due to the lack of relation path labels and subgraph-text pairs in most benchmarks, the authors employ various data construction techniques, limiting the model’s generalizability across domains and KGs.
As detailed in Table 1, evaluations were carried out using QA LLM, baselines (no knowledge, triple-form knowledge and two standard KG-to-Text models), and benchmark datasets, compared with models from [9] and [22] on WebQ [30] and WebQSP [19] using the Hit@1 metric. The main results show that RRA significantly outperforms rival models, achieving an improvement of 1–8% over triple-form text and 1–5% over the best standard KG-to-Text model. Moreover, RRA is about 100 $×$ more likely to produce a correct answer when the no-knowledge baseline fails, confirming the added value of IR-based KGQA models over vanilla LLMs.
3.2.3 Keqing
Keqing, proposed in [10], is the third SOTA model that is positioned as an alternative to SQL-based retrieval systems. Its key innovation is a question decomposition module that uses a fine-tuned LLM to break a question into sub-questions. These subquestions are matched to predefined templates via cosine similarity, with each template linked to specific KG relation paths. Candidate triples are retrieved based on these relation paths, and sub-questions are answered sequentially–the answer to one sub-question seeds the next. The triples obtained are verbalized and processed through a prompt template by a Quality Assurance LLM, ultimately generating a final answer that reflects the model’s reasoning chain.
In this approach, only the question decomposition LLM is trained using LoRA [34], which adds only a small fraction of trainable weights. However, the construction of sub-question templates and the acquisition of relation path labels are not clearly detailed, which may limit the system’s scalability.
According to Table 1, Keqing outperforms vanilla ChatGPT and two rival models, achieving Hit@1 scores of 98.4% to 99.9% on the MetaQA benchmark and superior performance on the WebQSP benchmark. Its ability to clearly explain its reasoning through sub-question chains further underscores its contribution to answer explainability.
3.2.4 Research Gap
After KAPING was introduced as the first KG-Augmented LLM for KGQA, RRA [11] and Keqing [10] followed, each employing different triple retrieval methods. Although all three use an LLM for question answering, KAPING relies on an untrained similarity-based retriever, while RRA and Keqing develop trainable retrieval modules, improving performance at the cost of significant engineering. Specifically, RRA trains separate modules (hop number classifier, relation path classifier, and KG-to-Text LLM) for each benchmark, requiring two custom training datasets (one for questions with relation path labels and one for triples with free-form text labels). The need for KG-specific techniques limits generalizability and raises concerns about the extra labor required when no Q&A dataset is available. Keqing fine-tunes an LLM for question decomposition to enhance answer interpretability and triple retrieval. This approach also demands a training dataset with sub-question templates and relation path labels, though the methods for constructing these remain unclear. Consequently, it is debatable whether the performance gains justify the additional engineering effort.
In summary, these shortcomings reveal a gap for models that are both as generalizable as KAPING and as explainable as Keqing. KAPING’s training-free design allows minimal human intervention across diverse KGs and domains, even in the absence of benchmark datasets. For this reason, we propose an improvement to the KAPING model by introducing a question decomposition module.
3.3 Our Approach
KAPING, a SOTA method combinining KGs and LLMs, outperforms many zero-shot baselines. However, its retrieval process, a vital process for accurate answer generation, can benefit from reducing irrelevant triple inclusion [9]. Therefore, we build on top of the KAPING model and propose to enhance it by integrating a question decomposition module to improve triple retrieval, answer accuracy, and explainability while maintaining application generalizability.
The proposed question decomposition module decomposes complex, multi-hop questions into simpler sub-questions. This allows the similarity-based retriever to focus on smaller, manageable pieces of information, thereby improving retrieval precision and yielding a more interpretable reasoning chain. Unlike conventional Chain-of-Thought prompting, which may induce hallucinated reasoning [35], decomposing the question forces the LLM to independently resolve each sub-question, ensuring fidelity to the stated reasoning. Our question decomposition module uses manually curated in-context learning examples for the KGQA benchmark, obviating the need for additional training and minimizing human labor. As a result, our approach aligns well with the goals of enhanced generalizability and answer explainability while potentially outperforming KAPING for multi-hop questions. The following section details the overall system architecture and the roles of its individual components.
3.4 System Architecture
Our system comprises multiple components, each executing a specific role in answering KG-based questions. The overall process involves four primary steps, with the first two being non-sequential:
1. Question Decomposition: The decomposition module splits the question into sub-questions. For simple queries, it avoids unnecessary decomposition.
1. Candidate Triple Retrieval: Given the question entity, the system retrieves all triples up to $N$ hops from the KG. Each triple is verbalized into text for subsequent selection via a sentence embedding model.
1. Sub-Question Answering: This sequential step answers each sub-question using the candidate triples. The process involves embedding the candidate triples to form a vector database, selecting the Top- $K$ similar triples for the sub-question, and reformulating subsequent sub-questions based on prior sub-answers.
1. Answer Synthesis: Finally, the system synthesizes the final answer from the sub-questions and their corresponding answers. The output also includes the chain-of-thought from the decomposition stage, enhancing interpretability.
<details>
<summary>x2.png Details</summary>
### Visual Description
## Flow Diagram: Question Answering System
### Overview
The image is a flow diagram illustrating a question answering system. It outlines the process from receiving an input question to generating a final answer, breaking down the process into several stages: Candidate Triple Retrieval, Question Decomposition, Sub-Question Answering, and Answer Synthesis.
### Components/Axes
* **Input Question:** The starting point of the process.
* **Candidate Triple Retrieval:** This stage involves retrieving candidate triples related to the input question.
* **Entity:** A component within the Candidate Triple Retrieval stage.
* **Candidate Triple Retriever:** A module responsible for retrieving candidate triples.
* **Candidate Triples:** The output of the Candidate Triple Retriever.
* **Question Decomposition:** This stage decomposes the original question into sub-questions.
* **Decomposition Module:** A module responsible for decomposing the question.
* **CoT:** An intermediate step, likely representing "Chain of Thought".
* **Sub-Question 1:** The first sub-question generated.
* **Sub-Question 2:** The second sub-question generated.
* **Sub-Question Answering:** This stage focuses on answering the sub-questions.
* **Embedding Model:** A model used to embed the candidate triples.
* **Reformulated Sub-Question:** The sub-question after reformulation.
* **Top-K Selector:** A module that selects the top-K triples.
* **Question Reformulator:** A module that reformulates the sub-questions.
* **Top-K Triples (Sub-Question 1):** The top-K triples related to Sub-Question 1.
* **Top-K Triples (Sub-Question 2):** The top-K triples related to Sub-Question 2.
* **Answer Generator:** A module that generates answers to the sub-questions.
* **Sub-Answer 1:** The answer to Sub-Question 1.
* **Sub-Answer 2:** The answer to Sub-Question 2.
* **Answer Synthesis:** This stage synthesizes the sub-answers into a final answer.
* **Final Answer Generator:** A module that generates the final answer.
* **Final Answer:** The final answer to the input question.
### Detailed Analysis
The diagram illustrates the flow of information and processing steps in a question answering system.
1. **Input Question:** The process begins with an input question.
2. **Candidate Triple Retrieval:** The input question is used to identify an entity, which is then used to retrieve candidate triples.
3. **Question Decomposition:** The original question is decomposed into two sub-questions (Sub-Question 1 and Sub-Question 2) using a Decomposition Module and a Chain of Thought (CoT) process.
4. **Sub-Question Answering:**
* The candidate triples are processed by an Embedding Model.
* The sub-questions are reformulated.
* A Top-K Selector selects the top-K triples for each sub-question.
* An Answer Generator generates answers for each sub-question (Sub-Answer 1 and Sub-Answer 2).
5. **Answer Synthesis:** The sub-answers are combined by a Final Answer Generator to produce the final answer.
### Key Observations
* The system decomposes the original question into sub-questions to simplify the answering process.
* The system uses candidate triples to provide context and information for answering the questions.
* The system uses an embedding model to represent the candidate triples in a vector space.
* The system reformulates the sub-questions to improve the accuracy of the answers.
* The system synthesizes the sub-answers to generate a final answer.
### Interpretation
The diagram illustrates a complex question answering system that uses a decomposition approach to break down the original question into smaller, more manageable sub-questions. This approach allows the system to focus on specific aspects of the question and retrieve relevant information more effectively. The use of an embedding model and reformulation techniques further enhances the accuracy and relevance of the answers. The system's modular design allows for flexibility and scalability, making it suitable for a wide range of question answering tasks.
</details>
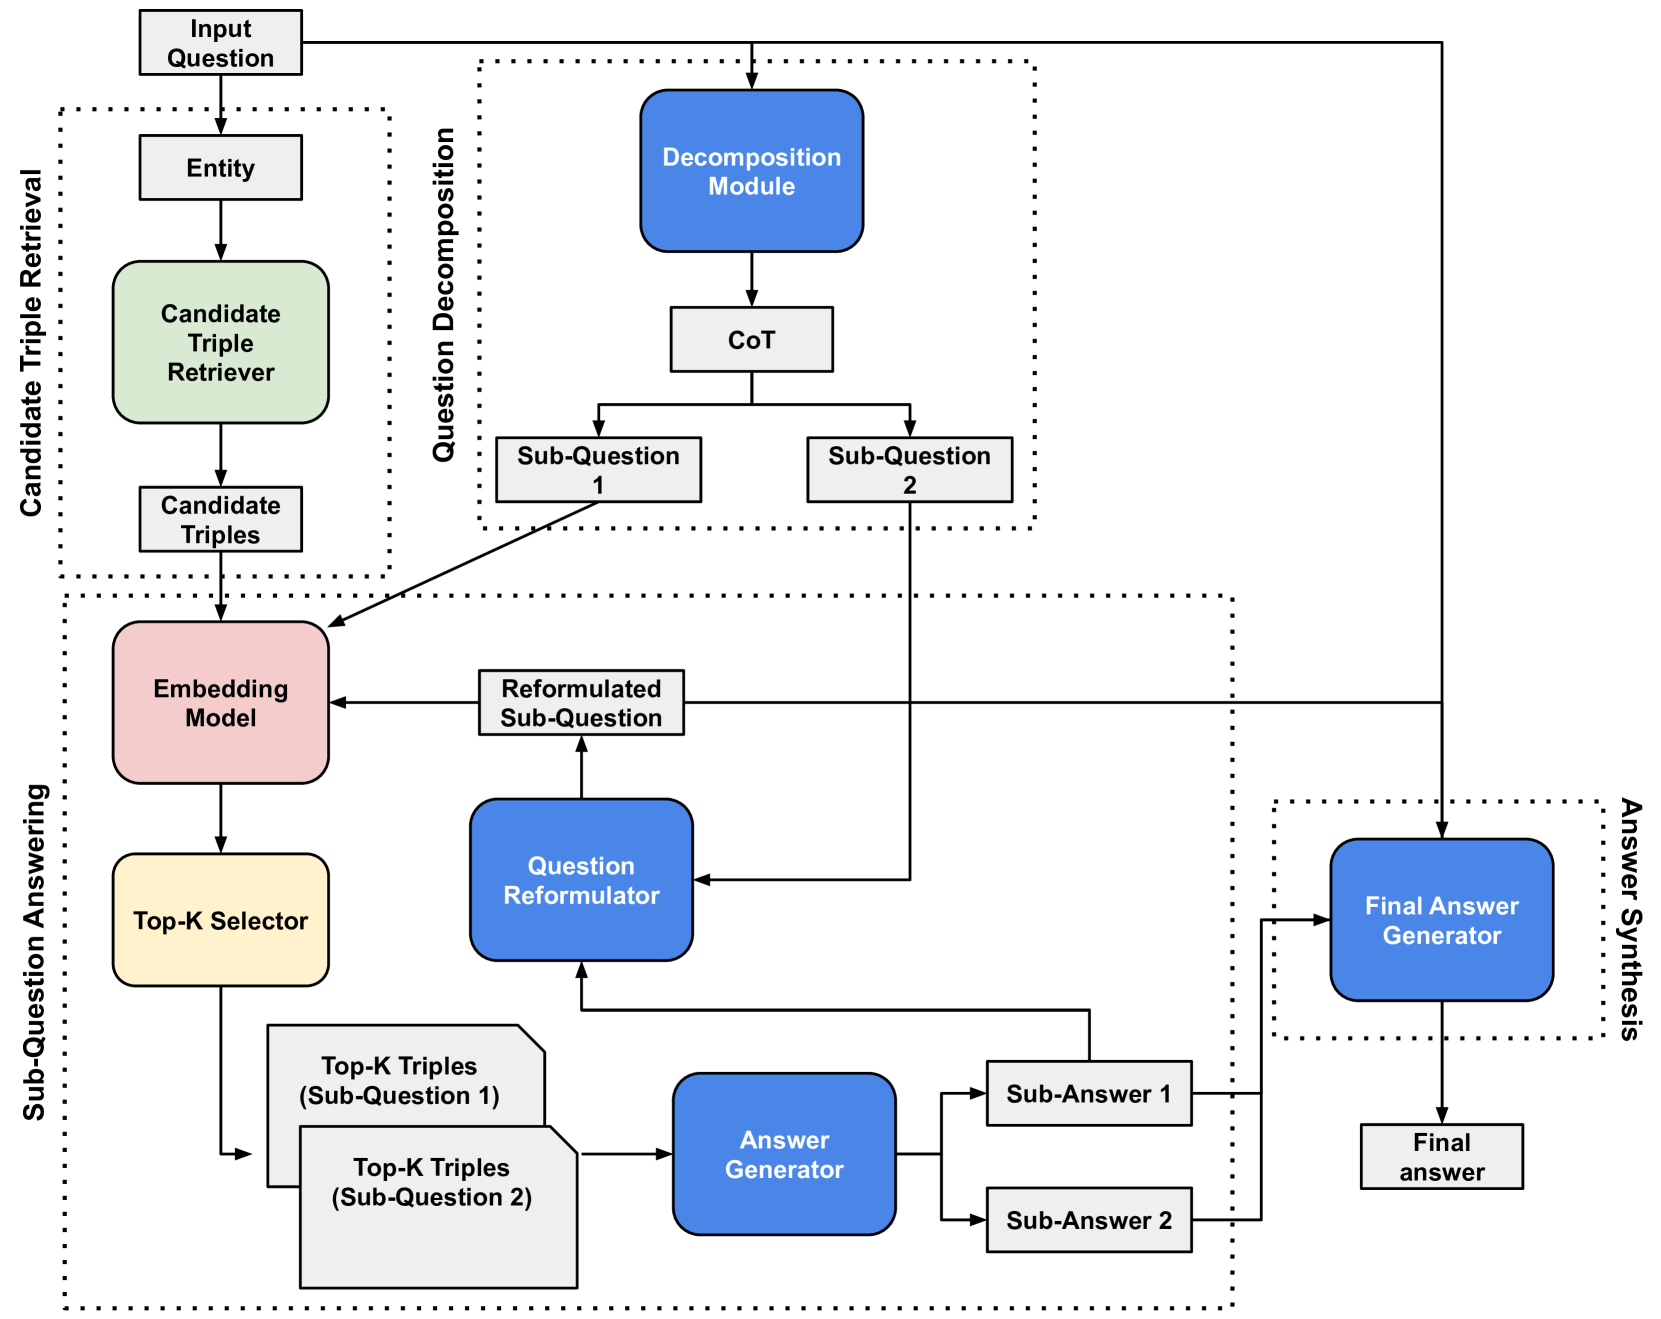
Figure 2: The architecture of the proposed system. An example of a 2-hop question is included, to give an idea of the data structures that are involved in the end-to-end process. The green color indicates processing with the KG; the red block shows the embedding model and the blue modules utilize an LLM.
Figure 2 illustrates the system architecture, highlighting the data structures and interactions between components. The diagram shows how the question reformulation module, which processes all previous sub-answers, enables the sequential resolution of sub-questions until the final answer is generated by the answer synthesis module.
Different components utilize distinct data sources and models. The candidate triple retriever directly accesses the KG, while the similarity-based triple selection leverages an off-the-shelf sentence embedding model trained on question-answer pairs. The remaining modules—the decomposition module, sub-answer generator, question reformulator, and final answer generator—are implemented using a LLM.
3.5 System Components
3.5.1 Question Decomposition
Overview
The question decomposition module splits a complex question into simpler sub-questions while generating an explicit reasoning chain, thereby enhancing both triple retrieval and answer explainability (Section 3.3). Inspired by Chain-of-Thought and In-Context Learning techniques [35], the module uses manually constructed ICL examples from the benchmark (Section 4.1). The prompt is designed to first elicit the reasoning chain (CoT) followed by the sub-questions, aligning with the natural text-based reasoning of LLMs.
Inputs and Outputs
As illustrated in Figure 2, the module takes a natural language question as input and outputs a string containing the reasoning chain and sub-questions. This output is post-processed to extract the CoT and store the sub-questions in a list.
Techniques
The decomposition prompt instructs the LLM to decide if a question requires decomposition. If so, it generates a CoT followed by sub-questions, strictly adhering to a specified format and avoiding irrelevant content. In-context examples–covering three question types from the MetaQA benchmark–guide the LLM, with the stop token “ $<$ END $>$ ” marking completion.
Implementation Details
Here, we use a 4-bit quantized version of Mistral-7B-Instruct-v0.2 [29, 36], originally a 7.24B-parameter model that outperforms Llama 2 and Llama 1 in reasoning, mathematics, and code generation. The quantized model, sized at 4.37 GB https://huggingface.co/TheBloke/Mistral-7B-Instruct-v0.2-GGUF, is compatible with consumer-grade hardware (e.g., NVIDIA RTX 3060 12GB https://www.msi.com/Graphics-Card/GeForce-RTX-3060-VENTUS-2X-12G-OC). Fast inference is achieved using the llama.cpp package https://github.com/ggerganov/llama.cpp, and prompts are designed with LM Studio https://lmstudio.ai/.
Inference parameters (see Table 2) include a max tokens limit (256) to prevent runaway generation, a temperature of 0.3 to reduce randomness, and top-k (40) and min-p (0.05) settings to ensure controlled token sampling [37].
Table 2: The inference parameters that were used for the question decomposition LLM.
| Max Tokens Temperature Min-p | 256 0.3 0.05 |
| --- | --- |
| Top-k | 40 |
3.5.2 Candidate Triple Retrieval
Overview
Candidate triple retrieval collects all triples up to $N$ hops from a given question entity in the KG, converting each triple into a text string of the form $(subject,relation,object)$ . Although the worst-case complexity is exponential in the number of hops—approximately $\Theta(d^{N})$ for an undirected KG with average degree $d$ —real-world KGs are sparse, making the average or median complexity more relevant (Section 4.1). The value of $N$ is treated as a hyperparameter.
Inputs and Outputs
This component accepts the question entity/entities as a natural language string and retrieves candidate triples from the KG. The output is a list of lists, where each sub-list corresponds to the candidate triples for each hop up to $N$ . Each triple is stored as a formatted text string, with underscores replaced by spaces (e.g., ”acted_in” becomes ”acted in”).
Techniques
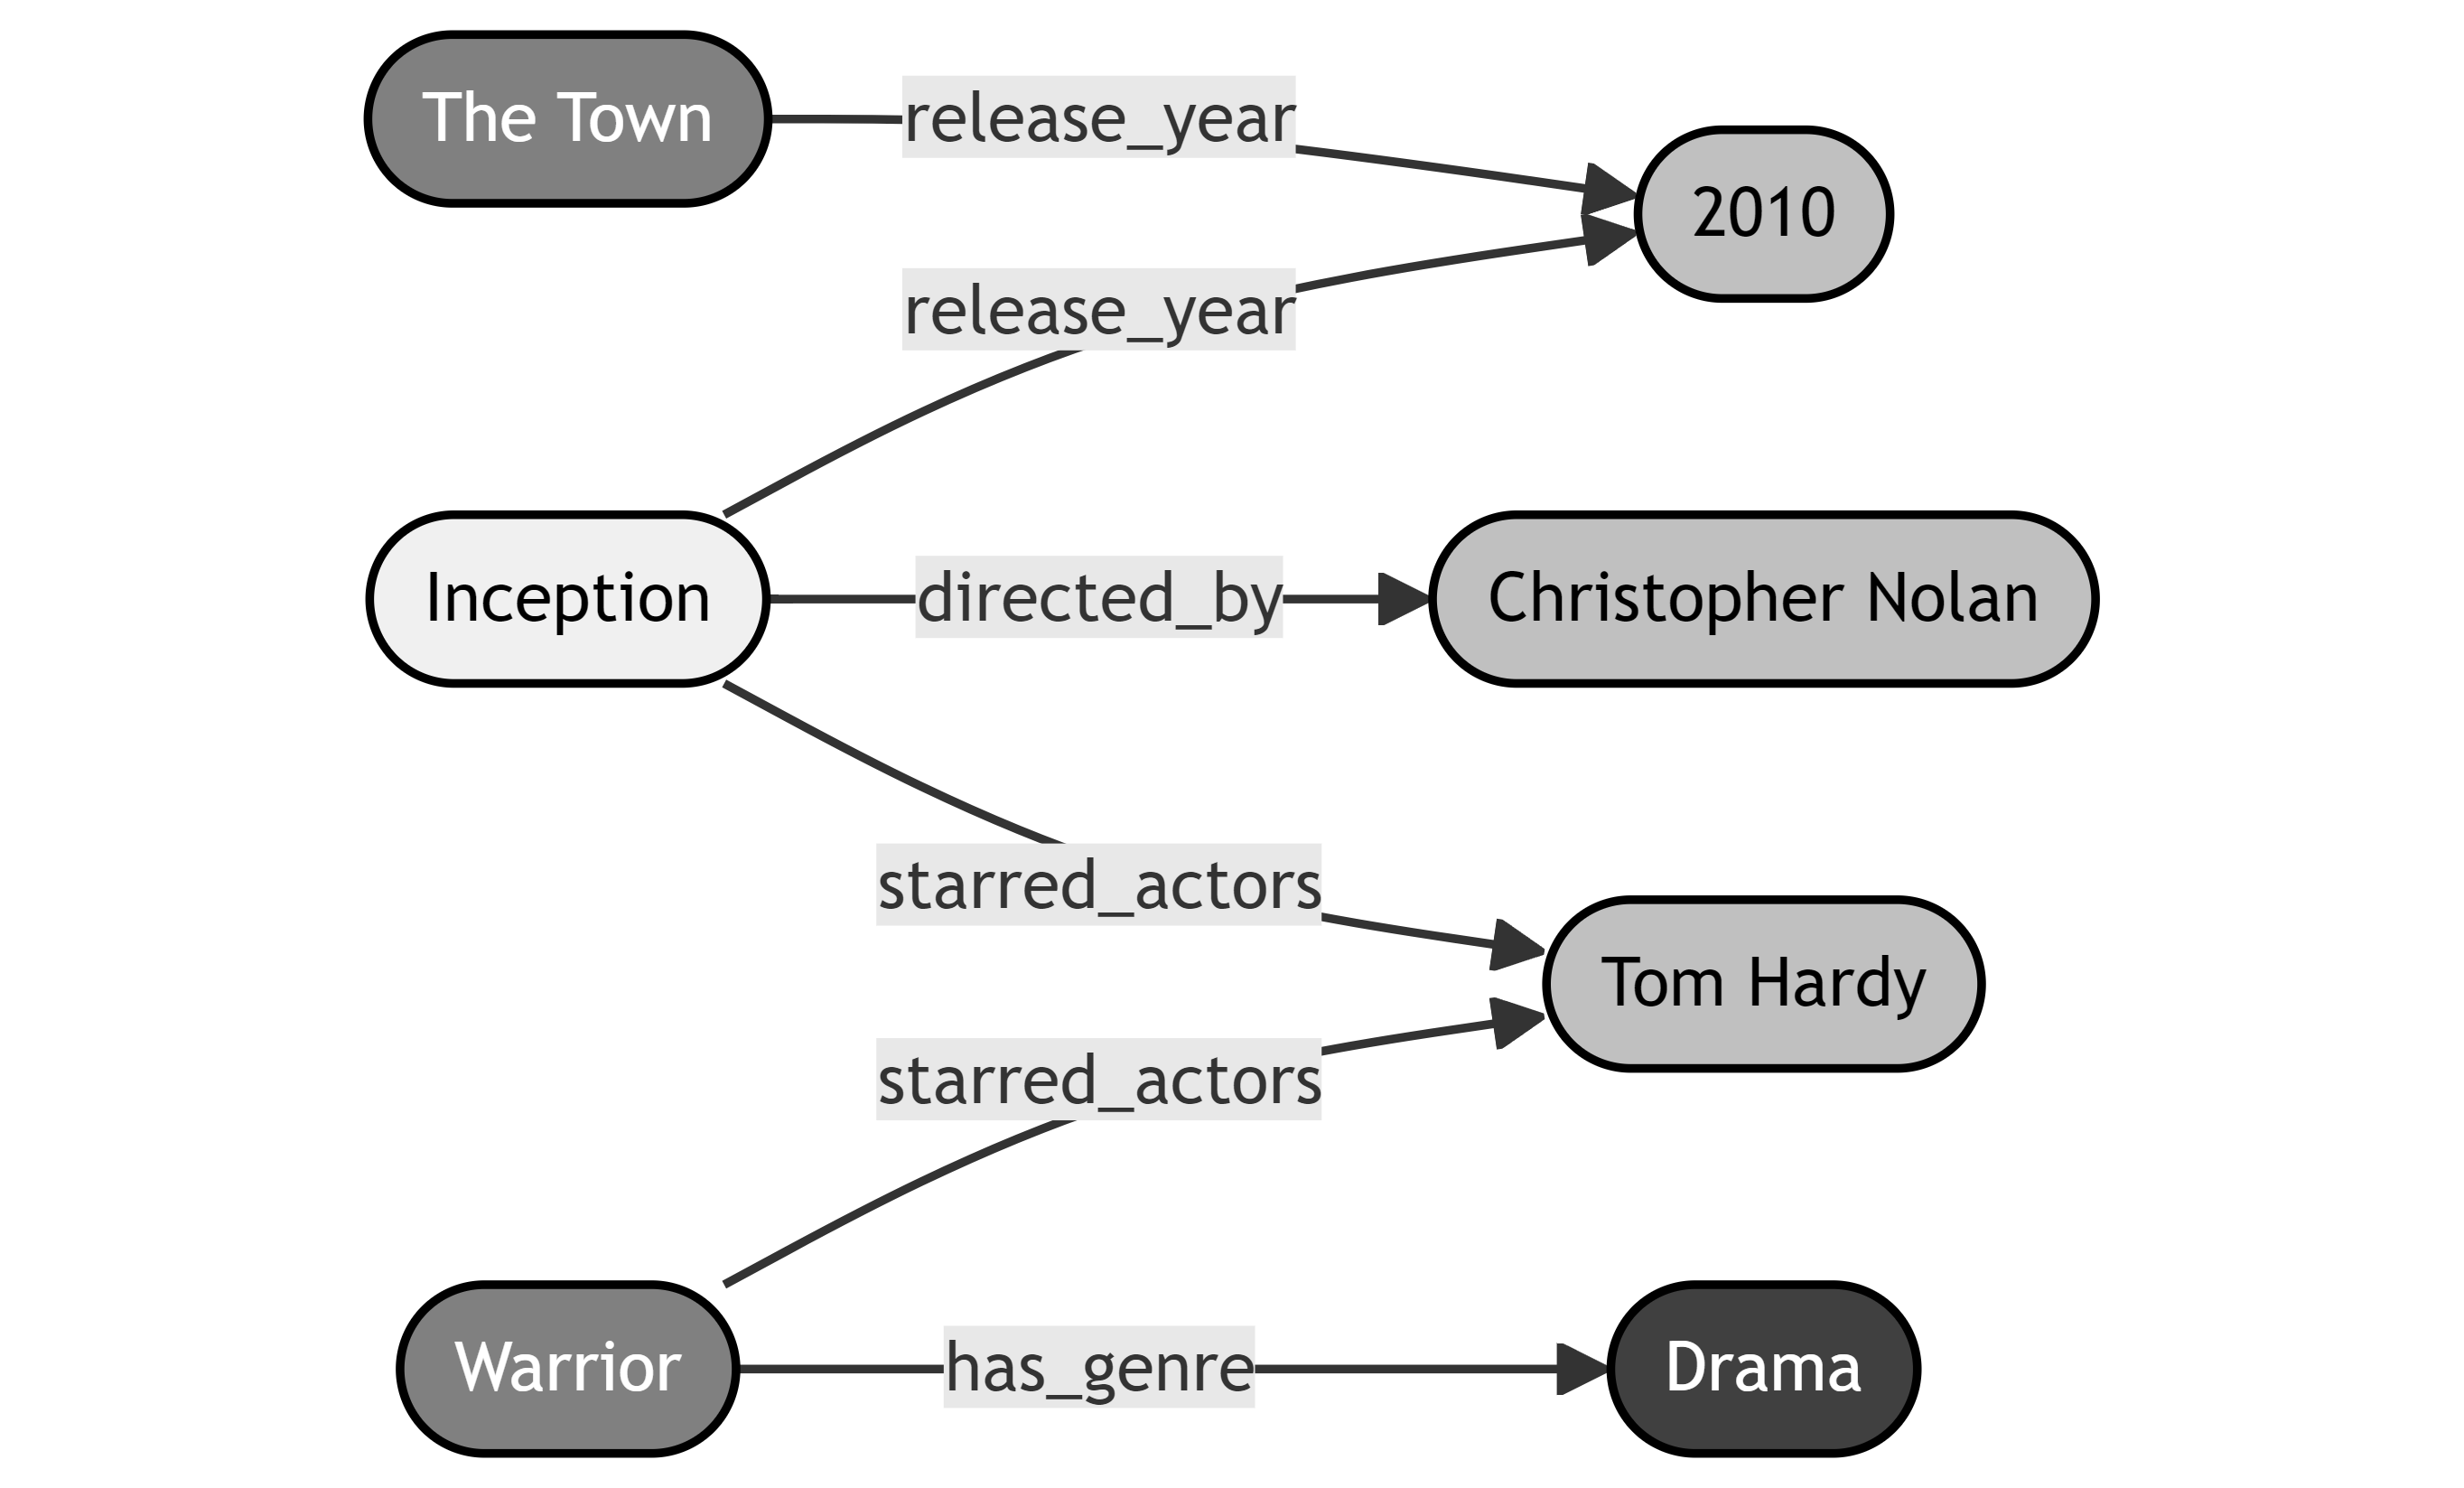
Candidate triple retrieval employs a breadth-first search strategy. In the MetaQA benchmark, which uses a directed KG, retrieval can be unidirectional (considering only outgoing edges) or bidirectional (including both outgoing and incoming edges). For example, as illustrated in Figure 3, unidirectional retrieval from the Inception entity would only yield entities like 2010, Christopher Nolan, and Tom Hardy, whereas bidirectional retrieval expands the search across successive hops. This example underscores the impact of retrieval direction on both the candidate set and computational load.
<details>
<summary>extracted/6354852/Figs/KG_Example.png Details</summary>
### Visual Description
## Knowledge Graph: Movie Relationships
### Overview
The image is a knowledge graph depicting relationships between movies and their attributes. It shows connections between movie titles ("The Town", "Inception", "Warrior") and related information such as release year, director, starred actors, and genre. The graph uses rounded rectangles to represent entities and labeled arrows to represent relationships.
### Components/Axes
* **Nodes:** Rounded rectangles representing entities (movies, years, people, genres).
* Movie Titles: "The Town", "Inception", "Warrior"
* Release Year: "2010"
* Director: "Christopher Nolan"
* Starred Actor: "Tom Hardy"
* Genre: "Drama"
* **Edges:** Arrows connecting nodes, labeled with the relationship between the entities.
* "release\_year": Connects movies to their release year.
* "directed\_by": Connects "Inception" to "Christopher Nolan".
* "starred\_actors": Connects "Inception" to "Tom Hardy".
* "has\_genre": Connects "Warrior" to "Drama".
### Detailed Analysis
* **"The Town"**:
* Relationship: "release\_year"
* Value: 2010
* **"Inception"**:
* Relationship 1: "release\_year"
* Value 1: 2010
* Relationship 2: "directed\_by"
* Value 2: "Christopher Nolan"
* Relationship 3: "starred\_actors"
* Value 3: "Tom Hardy"
* **"Warrior"**:
* Relationship: "has\_genre"
* Value: "Drama"
### Key Observations
* "The Town" and "Inception" both have a "release\_year" of 2010.
* "Inception" has multiple relationships: release year, director, and a starred actor.
* Tom Hardy is connected to Inception as a starred actor.
* "Warrior" is associated with the "Drama" genre.
### Interpretation
The knowledge graph visually represents relationships between movies and their attributes. It shows that "The Town" and "Inception" were released in 2010, "Inception" was directed by Christopher Nolan and starred Tom Hardy, and "Warrior" belongs to the "Drama" genre. The graph highlights connections between entities, allowing for easy understanding of the relationships between movies and their associated information. The graph demonstrates how movies can be linked to various attributes and other entities, forming a network of interconnected information.
</details>
Figure 3: A simple subgraph of triples from MetaQA [20]. As indicated by the arrows, this KG is a directed graph, which has implications for candidate triple retrieval. If Inception were the entity we were retrieving for, each darker tint of gray shows the entities that would be reached for a hop deeper.
Implementation Details
The MetaQA benchmark provides the KG as a text file with one triple per row. This file is pre-processed into a compressed KG with indexed entities and relationships to streamline retrieval and minimize memory usage. Each triple is embedded using a sentence embedding model (introduced in Section 3.5.3), forming a dictionary of embeddings that enhances retrieval efficiency by avoiding redundant computations. Retrieval is performed bidirectionally up to 3 hops, i.e., $N∈\{1,2,3\}$ .
3.5.3 Sub-Question Answering
Overview
Once the question is decomposed into sub-questions and candidate triples are retrieved for the given entity/entities, the sub-question answering process begins. Iteratively, the sub-question and candidate triples are embedded using a sentence embedding model, and the top- $K$ similar triples are selected to generate a sub-answer via an LLM. This sub-answer is then used to reformulate subsequent sub-questions if needed (see Figure 2), continuing until all sub-questions are answered.
Inputs and Outputs
Inputs include candidate triples (a list of strings, pre-embedded from the MetaQA KG) and a list of sub-questions. The output comprises two lists of strings: one containing the sub-answers and another with the reformulated sub-questions, both of which contribute to the final answer synthesis.
Techniques
The process employs similarity-based retrieval where both the sub-question and candidate triples are embedded with the same model, and their dot-product similarity is computed. The top- $K$ triples are then passed to a zero-shot LLM answer generator along with the sub-question. Unlike Keqing’s multiple-choice approach [10] (Section 3.2.3), this method allows the LLM to reason over the context. A zero-shot LLM also performs question reformulation.
Implementation Details
The similarity-based triple selection uses the multi-qa-mpnet-base-dot-v1 https://huggingface.co/sentence-transformers/multi-qa-mpnet-base-dot-v1 model from the sentence_transformers https://www.sbert.net/ package, which embeds text into 768-dimensional vectors. Similarity is computed as the dot product between these vectors, and the model is run locally on the GPU. Both the sub-question answering and question reformulation LLMs use parameters from Table 2 with minor adjustments: the sub-question answering LLM employs a repeat_penalty of 1.1 to mitigate repetitive output, while the reformulation module uses ”?” as the stop token to restrict its output to a properly reformulated question.
3.5.4 Answer Synthesis
Overview
The final step synthesizes an answer to the original question using the generated reasoning chain, sub-questions, and sub-answers. This output, which includes the reasoning chain, provides transparency into the system’s decision-making process.
Inputs and Outputs
Inputs comprise the main question, reasoning chain, sub-questions (reformulated if applicable), and sub-answers—all as strings. The output is a single natural language string that integrates both the final answer and the reasoning chain.
Techniques
A custom zero-shot prompt instructs the LLM to formulate the final answer from the provided context. The prompt template merges the main question, sub-questions, and sub-answers, and subsequently incorporates the reasoning chain into the final output. This straightforward zero-shot approach was preferred over ICL due to the simplicity of the final synthesis task compared to the more complex decomposition step.
Implementation Details
The LLM parameters mirror those in Table 2, with the exception of max_tokens, which is increased to 512 to accommodate the typically more complex final answers.
4 Experiments
The goal of our experiments is check whether the usefulness of a KG in question answering and whether our approach, i.e., using an additional question decomposition module, results in a better performance. For this purpose, we use a widely-used Knowledge Graph Question Answering (KGQA) benchmark called MetaQA [20]. In order to verify whether we achieved our objectives, we assess three baselines: a stand-alone LLM, an LLM with an LLM-based question-answering module, and an LLM with a KG (i.e., KAPING). Eventually, the experimental results are presented and discussed.
4.1 Dataset
The MetaQA benchmark, introduced in 2017, addresses the need for KGQA benchmarks featuring multi-hop questions over large-scale KGs, extending the original WikiMovies benchmark with movie-domain questions of varying hop counts [20].
Several factors motivated the selection of MetaQA for this research. First, its questions are categorized by hop count, enabling detailed analysis of multi-hop performance, a key area for improvement via question decomposition. Second, each question includes an entity label, avoiding the complexities of entity linking; many benchmarks, which focus on neural semantic parsing for SPARQL query generation, lack such labels [38]. Third, MetaQA’s simplicity and locally processable KG make it ideal for studies with limited resources, in contrast to highly complex KGs like Wikidata (over 130 GB, 1.57 billion triples, 12,175 relation types https://www.wikidata.org/wiki/Wikidata:Main_Page).
Data
MetaQA consists of three datasets (1-hop, 2-hop, and 3-hop), each split into train, validation, and test sets, and further divided into three components: vanilla, NTM text data, and audio data [20]. This research utilizes only the vanilla data, where the 1-hop dataset contains original WikiMovies questions and the 2-hop and 3-hop datasets are generated using predefined templates. Each dataset row includes a question, its associated entity, and answer entities.
Knowledge Graph
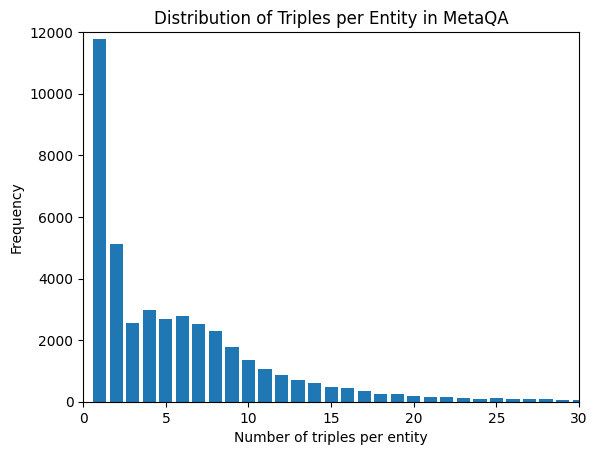
The MetaQA benchmark provides a KG as a text file with each row representing a triple. The KG comprises 43,234 entities and 9 relation types, with movie titles as subjects. Figure 4 illustrates the degree distribution: most entities have few associated triples (median of 4), while the long-tailed distribution includes entities with up to 4431 triples.
<details>
<summary>extracted/6354852/Figs/MetaQA_KG.png Details</summary>
### Visual Description
## Bar Chart: Distribution of Triples per Entity in MetaQA
### Overview
The image is a bar chart showing the distribution of triples per entity in the MetaQA dataset. The x-axis represents the number of triples per entity, and the y-axis represents the frequency (count) of entities with that number of triples. The chart indicates a highly skewed distribution, with a large number of entities having a small number of triples and a decreasing number of entities as the number of triples increases.
### Components/Axes
* **Title:** Distribution of Triples per Entity in MetaQA
* **X-axis:** Number of triples per entity
* Scale: 0 to 30, with tick marks at intervals of 5.
* **Y-axis:** Frequency
* Scale: 0 to 12000, with tick marks at intervals of 2000.
* **Bars:** Blue bars representing the frequency of each number of triples per entity.
### Detailed Analysis
The chart displays the frequency of entities based on the number of triples they contain. The data points are extracted from the bar heights.
* **1 triple per entity:** Approximately 11800
* **2 triples per entity:** Approximately 5200
* **3 triples per entity:** Approximately 2600
* **4 triples per entity:** Approximately 3000
* **5 triples per entity:** Approximately 2800
* **6 triples per entity:** Approximately 2700
* **7 triples per entity:** Approximately 2500
* **8 triples per entity:** Approximately 2000
* **9 triples per entity:** Approximately 1800
* **10 triples per entity:** Approximately 1200
* **11 triples per entity:** Approximately 900
* **12 triples per entity:** Approximately 800
* **13 triples per entity:** Approximately 700
* **14 triples per entity:** Approximately 600
* **15 triples per entity:** Approximately 500
* **16 triples per entity:** Approximately 400
* **17 triples per entity:** Approximately 350
* **18 triples per entity:** Approximately 300
* **19 triples per entity:** Approximately 250
* **20 triples per entity:** Approximately 200
* **21 triples per entity:** Approximately 150
* **22 triples per entity:** Approximately 125
* **23 triples per entity:** Approximately 100
* **24 triples per entity:** Approximately 75
* **25 triples per entity:** Approximately 50
* **26 triples per entity:** Approximately 40
* **27 triples per entity:** Approximately 30
* **28 triples per entity:** Approximately 20
* **29 triples per entity:** Approximately 10
### Key Observations
* The distribution is heavily skewed to the right.
* The frequency decreases rapidly as the number of triples per entity increases.
* A significant portion of entities have only 1 or 2 triples.
### Interpretation
The chart illustrates that in the MetaQA dataset, most entities have a relatively small number of triples associated with them. This suggests that the knowledge graph underlying MetaQA may be sparse, with many entities having limited connections to other entities. The long tail of the distribution indicates that some entities have a significantly larger number of triples, potentially representing more central or well-defined concepts within the dataset. This distribution is important for understanding the characteristics of the MetaQA dataset and can inform the design of effective question answering models.
</details>
Figure 4: The distribution of degrees (triples per entity) in the MetaQA KG. (Note that the distribution is long-tailed, so the cut-off at the value of 30 is for the purpose of visualization.)
4.2 Experimental design
In this study, we carry out two experiments:
1. The goal of experiment 1 is to find out how the model parameters impact performance, in order to find a parameter configuration that leads to consistent performance over the different question types. The chosen parameter configuration can then be used to compare the system to baselines in the second experiment.
1. The main goal of the second experiment is to find out how different components of the system impact performance and overall behavior. This is achieved by comparing the performance of the system with specific baselines, which are essentially made up of combinations of system components.
4.2.1 Experiment 1: Model selection
Experiment 1 investigates the effect of model parameters on performance to determine a configuration that yields consistent results across different question types. The parameters under examination are the number of hops $N$ for candidate triple retrieval (tested with values 1, 2, 3) and the number of top triples $K$ selected for each sub-question (tested with values 10, 20, 30), consistent with values reported in the literature (Section 2).
For each MetaQA test dataset, 100 questions are sampled using a fixed seed, and the system is evaluated across all parameter combinations. This process is repeated with 10 different seeds (0–9) to capture performance variability, and all LLM components use the same seed for inference to ensure reproducibility.
Performance is measured using the Hit@1 metric, which checks if the generated answer exactly matches any of the label answer entities (after lowercasing and stripping). For example, if the label is ”Brad Pitt” and the generated answer is ”Pitt is the actor in question,” the response is deemed incorrect. The final score for each dataset sample is the average Hit@1.
4.2.2 Experiment 2: A Comparative Analysis with Baselines
Experiment 2 serves a purpose of assessing how individual system components influence overall performance by comparing the full system to three baselines:
1. LLM: Uses only an LLM with a simple zero-shot prompt to directly answer the question.
1. LLM+QD: Incorporates the question decomposition module to split questions and reformulate sub-questions before answering with the same zero-shot prompt as the LLM baseline.
1. LLM+KG: Functions as the full system without the question decomposition component, which is equivalent to KAPING [9] by employing candidate triple retrieval, top- $K$ triple selection, and the sub-question answering module.
Both the full system and the LLM+KG baseline use the parameter configuration selected in Section 4.3.1. As in Experiment 1, 500 questions are sampled per MetaQA dataset using 8 different seeds (0–7) to ensure consistency. Performance is quantitatively evaluated using the Hit@1 metric to determine the impact of different components, and results are qualitatively analyzed for error insights and to assess accuracy, explainability, and generalizability as outlined in Section 3.1.
4.3 Results and Discussion
4.3.1 Experiment 1: Quantitative analysis
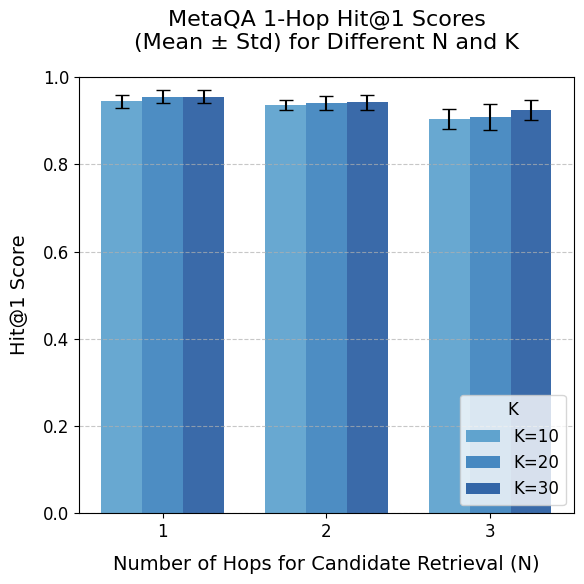
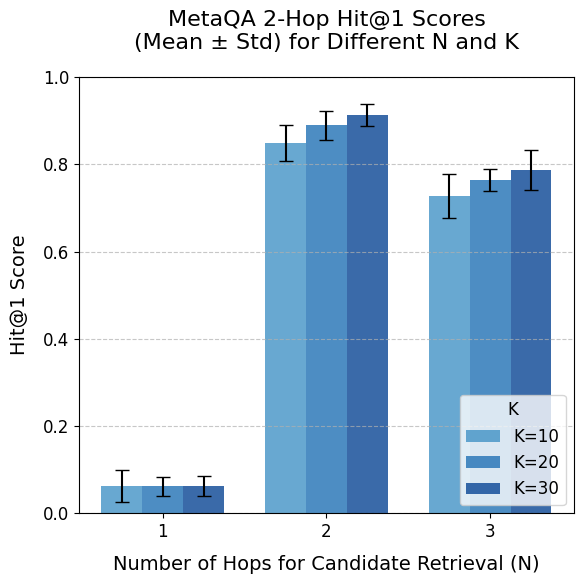
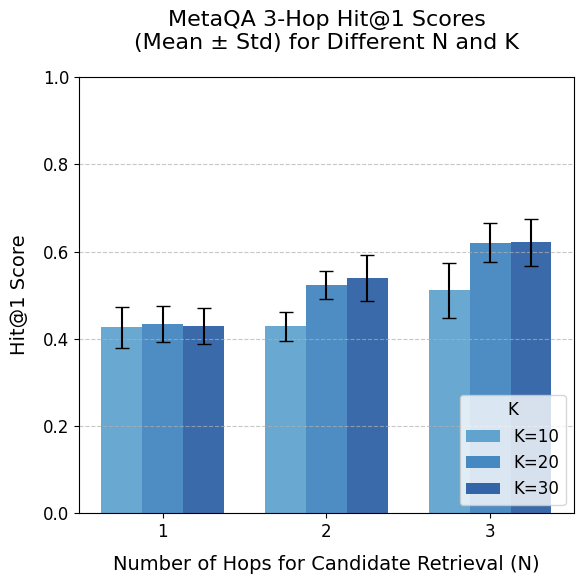
The results of Experiment 1 (Figure 5) indicate high overall performance that decreases with increasing question complexity, with standard deviations remaining low ( $≤ 0.063$ ) across samples.
<details>
<summary>extracted/6354852/Figs/exp1_metaqa_1.png Details</summary>
### Visual Description
## Bar Chart: MetaQA 1-Hop Hit@1 Scores
### Overview
The image is a bar chart comparing MetaQA 1-Hop Hit@1 scores (Mean ± Std) for different values of N (Number of Hops for Candidate Retrieval) and K. The chart displays the Hit@1 score on the y-axis against the number of hops (N) on the x-axis, with bars grouped by N and colored according to the value of K (10, 20, and 30). Error bars representing the standard deviation are shown on top of each bar.
### Components/Axes
* **Title:** MetaQA 1-Hop Hit@1 Scores (Mean ± Std) for Different N and K
* **X-axis:** Number of Hops for Candidate Retrieval (N)
* Values: 1, 2, 3
* **Y-axis:** Hit@1 Score
* Scale: 0.0 to 1.0, with increments of 0.2
* **Legend:** Located in the bottom-right corner.
* K=10 (light blue)
* K=20 (medium blue)
* K=30 (dark blue)
### Detailed Analysis
The chart presents Hit@1 scores for different combinations of N and K. Each group of bars represents a value of N (1, 2, or 3), and within each group, the bars represent K=10, K=20, and K=30, respectively.
* **N=1:**
* K=10 (light blue): Hit@1 score ≈ 0.94 ± 0.02
* K=20 (medium blue): Hit@1 score ≈ 0.96 ± 0.02
* K=30 (dark blue): Hit@1 score ≈ 0.96 ± 0.02
* **N=2:**
* K=10 (light blue): Hit@1 score ≈ 0.93 ± 0.02
* K=20 (medium blue): Hit@1 score ≈ 0.94 ± 0.02
* K=30 (dark blue): Hit@1 score ≈ 0.95 ± 0.02
* **N=3:**
* K=10 (light blue): Hit@1 score ≈ 0.90 ± 0.02
* K=20 (medium blue): Hit@1 score ≈ 0.91 ± 0.02
* K=30 (dark blue): Hit@1 score ≈ 0.93 ± 0.02
### Key Observations
* The Hit@1 scores are generally high, ranging from approximately 0.90 to 0.96.
* The Hit@1 score tends to decrease slightly as the number of hops (N) increases.
* For each value of N, the Hit@1 score tends to increase slightly as K increases from 10 to 30.
* The standard deviation (error bars) is relatively small, indicating consistent performance.
### Interpretation
The data suggests that the MetaQA model performs well in the 1-Hop setting, achieving high Hit@1 scores across different values of N and K. Increasing the number of hops (N) appears to have a slightly negative impact on performance, while increasing K tends to improve the Hit@1 score marginally. The small standard deviations indicate that the model's performance is stable and reliable. The model performs best when N is low (1 or 2) and K is high (30).
</details>
<details>
<summary>extracted/6354852/Figs/exp1_metaqa_2.png Details</summary>
### Visual Description
## Bar Chart: MetaQA 2-Hop Hit@1 Scores
### Overview
The image is a bar chart comparing MetaQA 2-Hop Hit@1 scores for different numbers of hops (N) and values of K. The chart displays the mean Hit@1 score with error bars representing the standard deviation. The x-axis represents the number of hops for candidate retrieval (N), with values 1, 2, and 3. The y-axis represents the Hit@1 score, ranging from 0.0 to 1.0. The chart includes a legend indicating the values of K: 10, 20, and 30, represented by different shades of blue.
### Components/Axes
* **Title:** MetaQA 2-Hop Hit@1 Scores (Mean ± Std) for Different N and K
* **X-axis:** Number of Hops for Candidate Retrieval (N)
* Values: 1, 2, 3
* **Y-axis:** Hit@1 Score
* Scale: 0.0 to 1.0, with increments of 0.2
* **Legend:** Located in the bottom-right corner.
* K=10 (light blue)
* K=20 (medium blue)
* K=30 (dark blue)
### Detailed Analysis
The chart presents Hit@1 scores for different combinations of N (number of hops) and K values. Each N value (1, 2, 3) has three bars representing K=10, K=20, and K=30. Error bars indicate the standard deviation for each bar.
* **N=1:**
* K=10 (light blue): Hit@1 score is approximately 0.06, with a standard deviation of approximately +/- 0.04.
* K=20 (medium blue): Hit@1 score is approximately 0.06, with a standard deviation of approximately +/- 0.03.
* K=30 (dark blue): Hit@1 score is approximately 0.06, with a standard deviation of approximately +/- 0.04.
* **N=2:**
* K=10 (light blue): Hit@1 score is approximately 0.84, with a standard deviation of approximately +/- 0.05.
* K=20 (medium blue): Hit@1 score is approximately 0.89, with a standard deviation of approximately +/- 0.03.
* K=30 (dark blue): Hit@1 score is approximately 0.91, with a standard deviation of approximately +/- 0.04.
* **N=3:**
* K=10 (light blue): Hit@1 score is approximately 0.72, with a standard deviation of approximately +/- 0.05.
* K=20 (medium blue): Hit@1 score is approximately 0.76, with a standard deviation of approximately +/- 0.03.
* K=30 (dark blue): Hit@1 score is approximately 0.78, with a standard deviation of approximately +/- 0.06.
### Key Observations
* For N=1, the Hit@1 scores are very low (around 0.06) regardless of the K value.
* For N=2, the Hit@1 scores are significantly higher, around 0.84 to 0.91, depending on the K value.
* For N=3, the Hit@1 scores are lower than N=2, ranging from 0.72 to 0.78.
* Generally, increasing K from 10 to 30 results in a slight increase in the Hit@1 score for N=2 and N=3.
### Interpretation
The data suggests that using two hops (N=2) for candidate retrieval yields the best Hit@1 scores for the MetaQA dataset. Increasing the value of K (number of candidates) generally improves the Hit@1 score, but the effect is more pronounced when moving from N=1 to N=2. The performance decreases when using three hops (N=3), indicating that there might be diminishing returns or increased noise with more hops. The low Hit@1 scores for N=1 suggest that a single hop is insufficient for effective candidate retrieval in this context.
</details>
<details>
<summary>extracted/6354852/Figs/exp1_metaqa_3.png Details</summary>
### Visual Description
## Bar Chart: MetaQA 3-Hop Hit@1 Scores
### Overview
The image is a bar chart comparing MetaQA 3-Hop Hit@1 scores for different numbers of hops (N) and values of K. The chart displays the mean Hit@1 score with error bars representing the standard deviation. The x-axis represents the number of hops for candidate retrieval (N), and the y-axis represents the Hit@1 score. There are three sets of bars for each N value, corresponding to K=10, K=20, and K=30.
### Components/Axes
* **Title:** MetaQA 3-Hop Hit@1 Scores (Mean ± Std) for Different N and K
* **X-axis:** Number of Hops for Candidate Retrieval (N)
* Values: 1, 2, 3
* **Y-axis:** Hit@1 Score
* Values: 0.0, 0.2, 0.4, 0.6, 0.8, 1.0
* **Legend:** Located in the bottom-right corner.
* K=10 (light blue)
* K=20 (medium blue)
* K=30 (dark blue)
### Detailed Analysis
The chart presents Hit@1 scores for different configurations of N (number of hops) and K. For each value of N, there are three bars representing K=10, K=20, and K=30. Error bars indicate the standard deviation of the scores.
* **N=1:**
* K=10: Hit@1 score is approximately 0.43, with a standard deviation of approximately 0.05.
* K=20: Hit@1 score is approximately 0.43, with a standard deviation of approximately 0.05.
* K=30: Hit@1 score is approximately 0.43, with a standard deviation of approximately 0.05.
* **N=2:**
* K=10: Hit@1 score is approximately 0.43, with a standard deviation of approximately 0.04.
* K=20: Hit@1 score is approximately 0.53, with a standard deviation of approximately 0.04.
* K=30: Hit@1 score is approximately 0.54, with a standard deviation of approximately 0.06.
* **N=3:**
* K=10: Hit@1 score is approximately 0.51, with a standard deviation of approximately 0.07.
* K=20: Hit@1 score is approximately 0.62, with a standard deviation of approximately 0.05.
* K=30: Hit@1 score is approximately 0.62, with a standard deviation of approximately 0.06.
### Key Observations
* The Hit@1 score generally increases as the number of hops (N) increases.
* For N=2 and N=3, increasing K from 10 to 20 and 30 results in higher Hit@1 scores.
* The standard deviation appears relatively consistent across different N and K values.
* When N=1, the Hit@1 score is nearly identical for all values of K.
### Interpretation
The data suggests that increasing the number of hops (N) and the value of K generally improves the Hit@1 score for the MetaQA 3-Hop task. This indicates that retrieving candidates over multiple hops and considering a larger set of candidates (higher K) leads to better performance. The consistent standard deviation suggests that the observed trends are relatively stable. The fact that K has no impact when N=1 suggests that the value of K only becomes relevant when multiple hops are involved in the retrieval process.
</details>
Figure 5: MetaQA performance results for experiment 1, over 10 samples of 100 questions for each of the three datasets. The bars show the mean Hit@1 for different parameter configurations; the error bars show the standard deviation.
Performance is highest when the parameter $N$ equals the actual number of hops in the questions. As expected, for the 2-hop dataset, $N=1$ yields poor results; however, for the 3-hop dataset, performance with $N<3$ is unexpectedly high due to MetaQA’s question templates–for instance, some 3-hop questions (e.g., ”Who are the directors of the films written by the writer of Blue Collar?”) can be answered with $N=1$ triples. This represents a limitation of the MetaQA benchmark.
When holding the dataset and $N$ constant, increasing $K$ (the number of top triples selected) from 10 to 30 shows minimal effect on the 1-hop dataset, with slight improvements observed for the 2-hop and 3-hop datasets. Given that a higher $K$ is unlikely to reduce performance and is more likely to include the necessary triples, $K=30$ is chosen.
Considering the trade-offs across datasets, a balanced configuration is selected. Since $N=1$ is unacceptable for 2-hop questions and improved performance on 3-hop questions likely requires all candidate triples up to 3 hops, $N=3$ is deemed the best choice despite a minor reduction in 2-hop performance (0.787 $±$ 0.046). Consequently, the optimal parameter configuration for MetaQA is $N=3$ and $K=30$ .
4.3.2 Experiment 2: Quantitative analysis
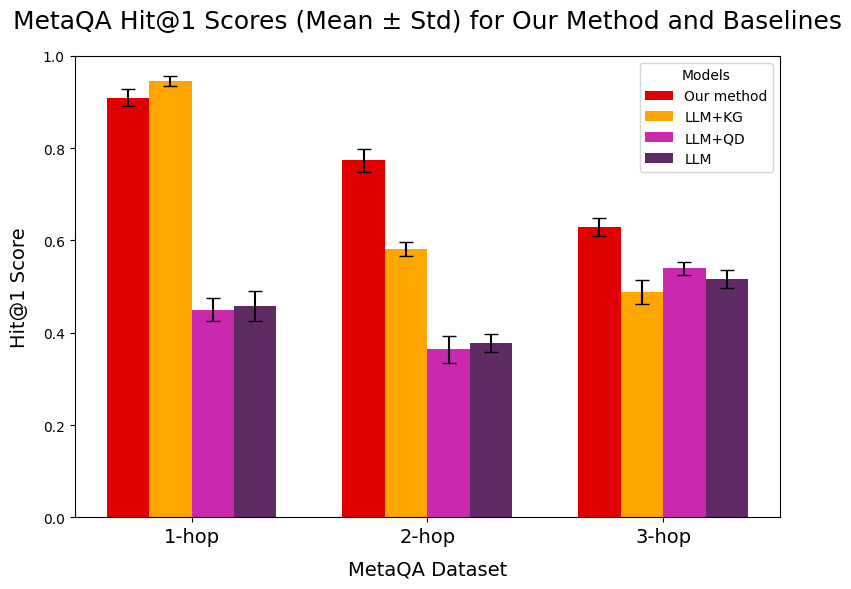
Figure 6 presents the performance results for Experiment 2 across 8 samples of 500 questions per MetaQA dataset. Our system significantly outperforms the baselines on 2-hop and 3-hop questions with minimal variance, while the LLM+KG baseline slightly outperforms on 1-hop questions. This is expected, as question decomposition adds unnecessary overhead for simple queries.
<details>
<summary>extracted/6354852/Figs/results_exp2_MetaQA.png Details</summary>
### Visual Description
## Bar Chart: MetaQA Hit@1 Scores (Mean ± Std) for Our Method and Baselines
### Overview
The image is a bar chart comparing the Hit@1 scores of different models on the MetaQA dataset. The x-axis represents the number of hops (1-hop, 2-hop, 3-hop), and the y-axis represents the Hit@1 score. The chart compares "Our method" with three baseline models: LLM+KG, LLM+QD, and LLM. Error bars indicate the standard deviation.
### Components/Axes
* **Title:** MetaQA Hit@1 Scores (Mean ± Std) for Our Method and Baselines
* **X-axis:** MetaQA Dataset, with categories 1-hop, 2-hop, and 3-hop.
* **Y-axis:** Hit@1 Score, ranging from 0.0 to 1.0 in increments of 0.2.
* **Legend (Top-Right):**
* Red: Our method
* Orange: LLM+KG
* Magenta: LLM+QD
* Purple: LLM
### Detailed Analysis
**1-hop:**
* **Our method (Red):** Hit@1 score is approximately 0.92, with a small standard deviation.
* **LLM+KG (Orange):** Hit@1 score is approximately 0.95, with a small standard deviation.
* **LLM+QD (Magenta):** Hit@1 score is approximately 0.45, with a small standard deviation.
* **LLM (Purple):** Hit@1 score is approximately 0.46, with a small standard deviation.
**2-hop:**
* **Our method (Red):** Hit@1 score is approximately 0.78, with a small standard deviation.
* **LLM+KG (Orange):** Hit@1 score is approximately 0.58, with a small standard deviation.
* **LLM+QD (Magenta):** Hit@1 score is approximately 0.37, with a small standard deviation.
* **LLM (Purple):** Hit@1 score is approximately 0.38, with a small standard deviation.
**3-hop:**
* **Our method (Red):** Hit@1 score is approximately 0.63, with a small standard deviation.
* **LLM+KG (Orange):** Hit@1 score is approximately 0.50, with a small standard deviation.
* **LLM+QD (Magenta):** Hit@1 score is approximately 0.54, with a small standard deviation.
* **LLM (Purple):** Hit@1 score is approximately 0.52, with a small standard deviation.
### Key Observations
* "Our method" consistently outperforms the baseline models (LLM+QD and LLM) across all hop counts.
* LLM+KG performs comparably to "Our method" for 1-hop questions, but its performance decreases more rapidly as the number of hops increases.
* The performance of all models generally decreases as the number of hops increases, indicating that answering multi-hop questions is more challenging.
* The standard deviations are relatively small, suggesting that the results are consistent.
### Interpretation
The chart demonstrates that "Our method" is effective in answering questions from the MetaQA dataset, particularly for multi-hop questions. The addition of Knowledge Graph information (LLM+KG) improves performance for simple questions (1-hop), but its effectiveness diminishes for more complex questions. The LLM+QD and LLM baselines perform significantly worse, indicating the importance of the techniques used in "Our method" for reasoning and knowledge integration. The decreasing performance with increasing hops highlights the challenge of multi-hop reasoning in question answering.
</details>
Figure 6: MetaQA performance results for experiment 2, over 8 samples of 500 questions for each of the three datasets. The bars show the mean Hit@1, and the error bars show the standard deviation. The results for both the system and the baselines are shown.
Comparing the baselines, the advantage of the KG retrieval module is most pronounced for 1-hop questions, but diminishes for 2-hop questions and disappears for 3-hop questions—likely because complex queries increase the difficulty of retrieving relevant triples. The integration of question decomposition in our system, however, maintains the benefits of KG retrieval for multi-hop questions while also enhancing answer explainability.
In summary, our system achieves improved performance on multi-hop questions with only a minor loss for 1-hop queries compared to the LLM+KG baseline. Although the relative and absolute advantage decreases as the number of hops increases, these quantitative results, combined with a forthcoming qualitative analysis (Section 4.4), support the effectiveness of our approach.
4.4 Qualitative Analysis
This section examines the model outputs to identify recurring behaviors, strengths, and weaknesses, and to suggest directions for future improvements. Given the inherent limitations of a small, quantized LLM, our focus is on common patterns rather than isolated errors.
Table 3: The datasets that were analyzed for the qualitative analysis.
| MetaQA 1-hop | KG-RAG | 1 | 0 | N=3, K=30 |
| --- | --- | --- | --- | --- |
| MetaQA 2-hop | KG-RAG | 1 | 0 | N=3, K=30 |
| MetaQA 3-hop | KG-RAG | 1 | 0 | N=3, K=30 |
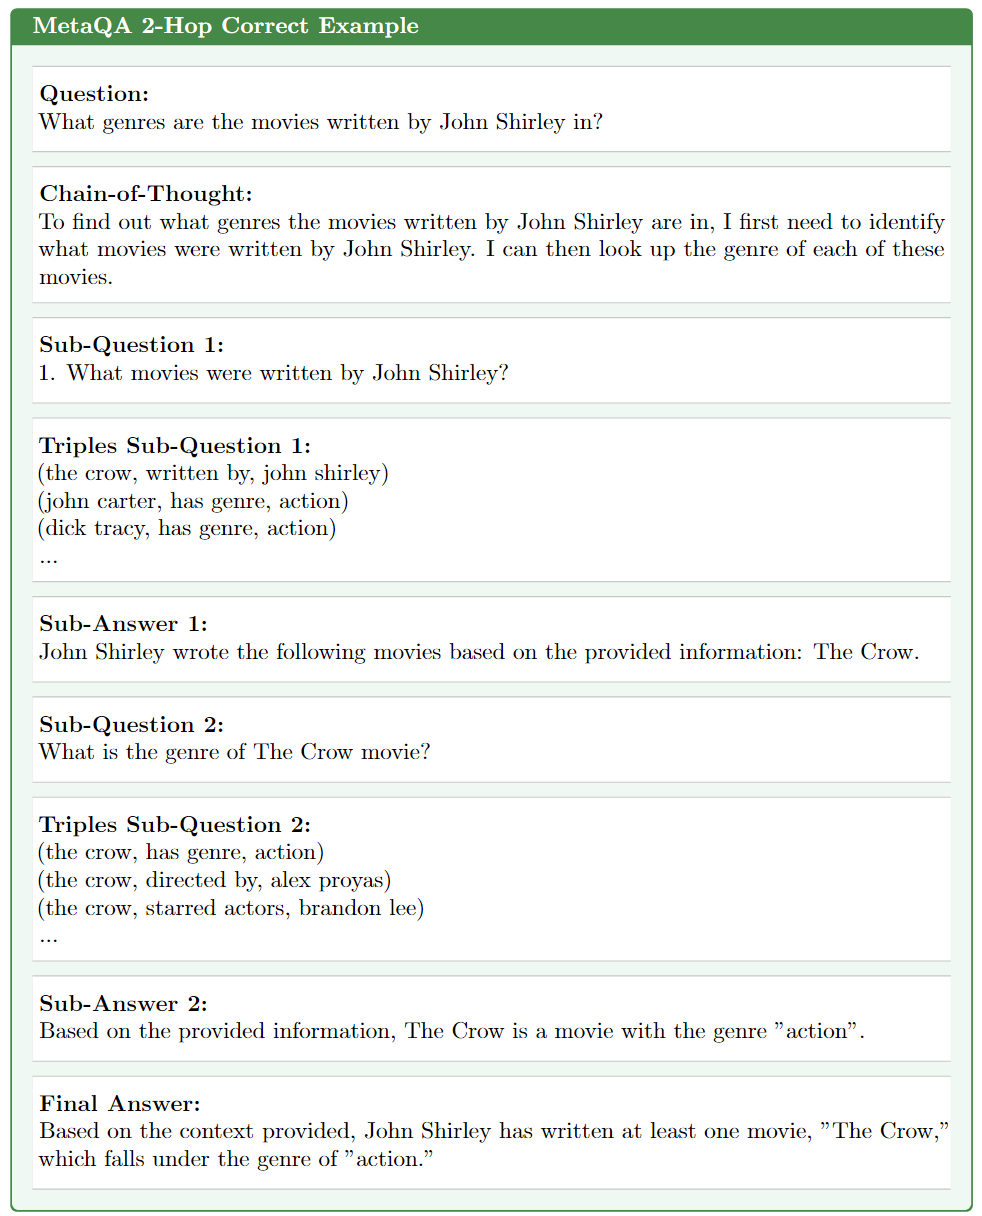
Table 3 lists the generated outputs used in this analysis. First, we present an example output from the MetaQA 2-hop dataset (Figure 7). This example demonstrates how the system correctly decomposes a question into coherent sub-questions, substitutes sub-answers appropriately, and synthesizes a final answer that accurately addresses the main question while maintaining a logical chain-of-thought.
<details>
<summary>extracted/6354852/Figs/output_example.png Details</summary>
### Visual Description
## Question Answering Example: MetaQA 2-Hop Correct Example
### Overview
The image presents an example of a multi-hop question-answering process using the MetaQA dataset. It demonstrates how a complex question is broken down into sub-questions, answered using provided information, and then combined to form a final answer. The example focuses on identifying the genres of movies written by John Shirley.
### Components/Axes
The example is structured as follows:
* **Title:** MetaQA 2-Hop Correct Example
* **Question:** "What genres are the movies written by John Shirley in?"
* **Chain-of-Thought:** A textual explanation of the reasoning process.
* **Sub-Question 1:** "What movies were written by John Shirley?"
* **Triples Sub-Question 1:** A list of triples representing relationships:
* (the crow, written by, john shirley)
* (john carter, has genre, action)
* (dick tracy, has genre, action)
* **Sub-Answer 1:** "John Shirley wrote the following movies based on the provided information: The Crow."
* **Sub-Question 2:** "What is the genre of The Crow movie?"
* **Triples Sub-Question 2:** A list of triples representing relationships:
* (the crow, has genre, action)
* (the crow, directed by, alex proyas)
* (the crow, starred actors, brandon lee)
* **Sub-Answer 2:** "Based on the provided information, The Crow is a movie with the genre "action"."
* **Final Answer:** "Based on the context provided, John Shirley has written at least one movie, "The Crow," which falls under the genre of "action"."
### Detailed Analysis or ### Content Details
The example demonstrates a two-hop reasoning process:
1. **First Hop:** Identifying movies written by John Shirley. The system uses triples to determine that John Shirley wrote "The Crow." Other movies like "John Carter" and "Dick Tracy" are also mentioned in the triples, but not directly attributed to John Shirley in the first sub-answer.
2. **Second Hop:** Determining the genre of "The Crow." The system uses triples to identify the genre of "The Crow" as "action." It also includes information about the director and actors of the movie.
The "Chain-of-Thought" section explains the overall strategy: first identify the movies written by John Shirley, then look up the genre of each of those movies.
### Key Observations
* The example uses triples to represent relationships between entities (movies, writers, genres, directors, actors).
* The system relies on provided information to answer the questions.
* The final answer is derived from the answers to the sub-questions.
* The example focuses on a single movie, "The Crow," to illustrate the process.
### Interpretation
The example demonstrates a basic question-answering system that can reason over structured data (triples) to answer complex questions. The system breaks down the question into smaller, more manageable sub-questions, and then combines the answers to these sub-questions to arrive at a final answer. This approach is useful for answering questions that require multiple steps of reasoning or accessing multiple sources of information. The use of triples allows the system to represent relationships between entities in a structured way, which facilitates reasoning and inference. The example highlights the importance of both knowledge representation (triples) and reasoning strategies (chain-of-thought) in question-answering systems.
</details>
Figure 7: An example of the system’s intermediate outputs, which lead to the final answer. The example was taken from the MetaQA 2-hop sample that was analyzed for the qualitative analysis.
4.4.1 Question Decomposition
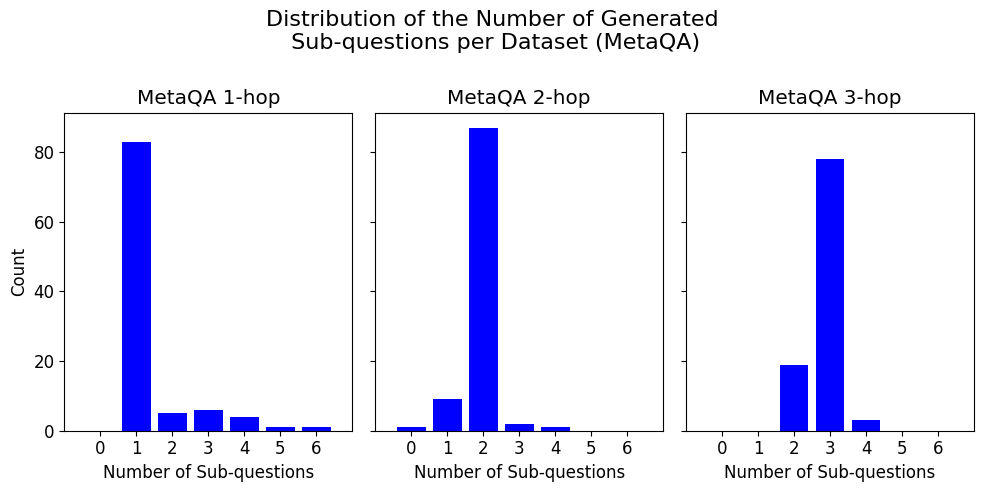
By analyzing the distribution of the number of generated sub-questions per dataset (Figure 8), we observe that the model generally recognizes the appropriate complexity of MetaQA multi-hop questions. For 1-hop questions, the model typically avoids decomposition, though ambiguous queries (e.g. asking for a movie description) sometimes lead to unnecessary sub-questions. For 2-hop and 3-hop questions, the model usually generates the expected number of sub-questions, although there are occasional cases of under-decomposition.
<details>
<summary>extracted/6354852/Figs/subq_distribution.png Details</summary>
### Visual Description
## Bar Chart: Distribution of the Number of Generated Sub-questions per Dataset (MetaQA)
### Overview
The image presents three bar charts, each displaying the distribution of the number of generated sub-questions for different MetaQA datasets: 1-hop, 2-hop, and 3-hop. The x-axis represents the number of sub-questions, ranging from 0 to 6, and the y-axis represents the count or frequency of each number of sub-questions. All bars are blue.
### Components/Axes
* **Title:** Distribution of the Number of Generated Sub-questions per Dataset (MetaQA)
* **X-axis Title:** Number of Sub-questions
* **Y-axis Title:** Count
* **Y-axis Scale:** 0 to 80, with tick marks at 20, 40, 60, and 80.
* **X-axis Scale:** 0 to 6, with tick marks at each integer value.
* **Subplots:**
* MetaQA 1-hop (left)
* MetaQA 2-hop (center)
* MetaQA 3-hop (right)
### Detailed Analysis
**MetaQA 1-hop:**
* The bar representing 0 sub-questions has a count of approximately 82.
* The bar representing 1 sub-question has a count of approximately 5.
* The bar representing 2 sub-questions has a count of approximately 6.
* The bar representing 3 sub-questions has a count of approximately 6.
* The bar representing 4 sub-questions has a count of approximately 4.
* The bar representing 5 sub-questions has a count of approximately 2.
* The bar representing 6 sub-questions has a count of approximately 1.
**MetaQA 2-hop:**
* The bar representing 0 sub-questions has a count of approximately 1.
* The bar representing 1 sub-question has a count of approximately 9.
* The bar representing 2 sub-questions has a count of approximately 86.
* The bar representing 3 sub-questions has a count of approximately 2.
* The bar representing 4 sub-questions has a count of approximately 1.
* The bar representing 5 sub-questions has a count of approximately 0.
* The bar representing 6 sub-questions has a count of approximately 0.
**MetaQA 3-hop:**
* The bar representing 0 sub-questions has a count of approximately 0.
* The bar representing 1 sub-question has a count of approximately 2.
* The bar representing 2 sub-questions has a count of approximately 19.
* The bar representing 3 sub-questions has a count of approximately 79.
* The bar representing 4 sub-questions has a count of approximately 3.
* The bar representing 5 sub-questions has a count of approximately 0.
* The bar representing 6 sub-questions has a count of approximately 0.
### Key Observations
* In MetaQA 1-hop, the majority of questions require 0 sub-questions.
* In MetaQA 2-hop, the majority of questions require 2 sub-questions.
* In MetaQA 3-hop, the majority of questions require 3 sub-questions.
* The distribution shifts towards higher numbers of sub-questions as the hop count increases.
### Interpretation
The charts illustrate the relationship between the complexity of questions (measured by hop count) and the number of sub-questions needed to answer them. As the hop count increases from 1 to 3, the distribution of the number of sub-questions shifts towards higher values. This suggests that more complex questions (higher hop count) require a greater number of sub-questions to be answered effectively. The data demonstrates that the MetaQA dataset is structured in a way that reflects the increasing complexity of questions as the hop count increases. The concentration of counts at 0, 2, and 3 sub-questions for 1-hop, 2-hop, and 3-hop questions, respectively, indicates a clear correlation between hop count and the optimal number of sub-questions.
</details>
Figure 8: The distribution of the number of sub-questions that were generated, for each of the MetaQA samples that was analyzed for the qualitative analysis (see Table 3 for more details).
4.4.2 Qualitative Performance
Overall, the system effectively distinguishes question complexity, but several systematic errors were identified:
- Over-decomposition: In approximately 16% of 1-hop cases, ambiguous questions lead to extra sub-questions, resulting in longer, sometimes overcomplicated answers.
- Under-decomposition: For 2-hop and 3-hop datasets, the system occasionally fails to generate enough sub-questions, sometimes producing only a 1-hop and a 2-hop question instead of the full decomposition.
- Sub-answer Inconsistencies: The LLM sometimes produces sub-answers that do not align with the provided triples, either by overlooking relevant data or by incorporating its own external knowledge.
- Final Answer Synthesis: While the final synthesis step generally succeeds, it occasionally yields overly long answers that may exceed token limits or include unwarranted information.
Despite these issues, the generated reasoning chains remain logical and coherent, allowing users to trace and verify the main answer. Many of the observed errors can be attributed to the limitations of the quantized LLM, and it is expected that a more sophisticated model or refined prompting strategies (potentially using ICL) could mitigate these problems.
In conclusion, while triple selection remains robust when question decomposition is successful, the identified issues in decomposition, sub-answer generation, and answer synthesis indicate clear avenues for future research and improvements.
4.5 Discussion: Limitations
Here, we outline key limitations of the carried out research, which subsequently allow us to formulate future work.
First, constrained computational resources forced the use of a quantized, relatively small LLM, significantly impacting absolute performance—despite potentially preserving relative improvements over baselines. These constraints also necessitated random sampling of test subsets rather than evaluating on full datasets.
Second, the MetaQA benchmark is relatively simple, with a narrow domain and exclusively multi-hop questions. As noted in Section 4.3.1, some 3-hop questions are answerable using only 1-hop triples, which may skew performance evaluations compared to more complex benchmarks.
Additionally, earlier experiments with another dataset, the Mintaka benchmark, revealed that the Hit@1 metric can be inaccurate, particularly for comparative questions where the system generates full answers instead of single answer entities. This limitation, highlighted in related work [9, 11, 10], underscores the need for more sophisticated evaluation methods. Recent research on automated evaluation of natural language outputs [39] may offer promising alternatives.
In summary, key limitations include the restricted LLM size, the simplicity and flaws of the MetaQA benchmark, and the inadequacy of the Hit@1 metric for modern KGQA systems.
5 Conclusion
5.1 Contributions
Our study addressed two primary research questions. First, we investigated enhancing LLMs with knowledge graphs (KGs) without requiring any training. By leveraging the synergy between LLM reasoning and the structured knowledge in KGs, we identified a gap in creating KGQA models that are both generalizable (as in KAPING) and explainable (as in Keqing). To bridge this gap, we developed an improved, training-free version of KAPING.
Second, we explored methods to improve answer explainability using a KG-RAG system. Inspired by Keqing [10] and the work of [35], we designed a question decomposition module that first generates a chain-of-thought (CoT) followed by coherent sub-questions. This approach not only improved performance on multi-hop questions but also provided transparent reasoning chains, thereby enhancing answer explainability. Overall, the proposed solution achieved higher answer accuracy (as measured by the Hit@1 metric) and improved transparency, though further validation is needed to confirm its generalizability across different domains, KGs, and question types.
5.2 Future Work
Future research should focus on deepening the investigation into application generalizability by employing benchmarks with KGs composed largely of natural language, ensuring the triple selection mechanism via text embeddings functions effectively. Given some limitations of the MetaQA benchmark, exploring alternative benchmarks with diverse question domains may yield more robust conclusions.
Improved evaluation methods are also necessary. Automated techniques—such as entity matching, coherence assessment of reasoning chains via LLM prompting, and verification of sub-answer validity—could offer more reliable metrics than the currently used Hit@1 [39].
Furthermore, employing more sophisticated LLMs and fine-tuning inference parameters could mitigate many of the systematic errors observed. Future work may also explore advanced, training-free triple retrieval methods or finetuning strategies for text embedding models, thereby enhancing performance and efficiency. Finally, addressing persistent research gaps in question entity identification and entity matching is crucial for real-world KGQA applications.
References
- \bibcommenthead
- Brown et al. [2020] Brown, T.B., Mann, B., Ryder, N., Subbiah, M., Kaplan, J., Dhariwal, P., Neelakantan, A., Shyam, P., Sastry, G., Askell, A., Agarwal, S., Herbert-Voss, A., Krueger, G., Henighan, T., Child, R., Ramesh, A., Ziegler, D.M., Wu, J., Winter, C., Hesse, C., Chen, M., Sigler, E., Litwin, M., Gray, S., Chess, B., Clark, J., Berner, C., McCandlish, S., Radford, A., Sutskever, I., Amodei, D.: Language models are few-shot learners. Advances in Neural Information Processing Systems 2020-Decem (2020)
- Ji et al. [2023] Ji, Z., Lee, N., Frieske, R., Yu, T., Su, D., Xu, Y., Ishii, E., Bang, Y.J., Madotto, A., Fung, P.: Survey of Hallucination in Natural Language Generation. ACM Computing Surveys 55 (12) (2023) https://doi.org/10.1145/3571730
- Pan et al. [2023] Pan, J.Z., Razniewski, S., Kalo, J.-C., Singhania, S., Chen, J., Dietze, S., Jabeen, H., Omeliyanenko, J., Zhang, W., Lissandrini, M., Biswas, R., Melo, G., Bonifati, A., Vakaj, E., Dragoni, M., Graux, D.: Large Language Models and Knowledge Graphs: Opportunities and Challenges 000 (111), 1–30 (2023)
- Bender et al. [2021] Bender, E.M., Gebru, T., McMillan-Major, A., Shmitchell, S.: On the dangers of stochastic parrots: Can language models be too big? FAccT 2021 - Proceedings of the 2021 ACM Conference on Fairness, Accountability, and Transparency, 610–623 (2021) https://doi.org/10.1145/3442188.3445922
- Pan et al. [2023] Pan, S., Luo, L., Wang, Y., Chen, C., Wang, J., Wu, X.: Unifying Large Language Models and Knowledge Graphs: A Roadmap 14 (8), 1–29 (2023)
- Yang et al. [2023] Yang, L., Chen, H., Li, Z., Ding, X., Wu, X.: ChatGPT is not Enough: Enhancing Large Language Models with Knowledge Graphs for Fact-aware Language Modeling 14 (8), 1–20 (2023)
- Lewis et al. [2020] Lewis, P., Perez, E., Piktus, A., Petroni, F., Karpukhin, V., Goyal, N., Küttler, H., Lewis, M., Yih, W.T., Rocktäschel, T., Riedel, S., Kiela, D.: Retrieval-augmented generation for knowledge-intensive NLP tasks. Advances in Neural Information Processing Systems 2020-Decem (2020)
- Gao et al. [2023] Gao, Y., Xiong, Y., Gao, X., Jia, K., Pan, J., Bi, Y., Dai, Y., Sun, J., Wang, M., Wang, H.: Retrieval-Augmented Generation for Large Language Models: A Survey (2023)
- Baek et al. [2023] Baek, J., Aji, A.F., Saffari, A.: Knowledge-Augmented Language Model Prompting for Zero-Shot Knowledge Graph Question Answering. Proceedings of the Annual Meeting of the Association for Computational Linguistics, 70–98 (2023) https://doi.org/10.18653/v1/2023.nlrse-1.7
- Wang et al. [2023] Wang, C., Xu, Y., Peng, Z., Zhang, C., Chen, B., Wang, X., Feng, L., An, B.: keqing: knowledge-based question answering is a nature chain-of-thought mentor of LLM (2023)
- Wu et al. [2023] Wu, Y., Hu, N., Bi, S., Qi, G., Ren, J., Xie, A., Song, W.: Retrieve-Rewrite-Answer: A KG-to-Text Enhanced LLMs Framework for Knowledge Graph Question Answering (2023)
- Arenas and Perez [2013] Arenas, M., Perez, J.: Querying Semantic Web Data with SPARQL. ACM (2013)
- Vaswani et al. [2017] Vaswani, A., Shazeer, N., Parmar, N., Uszkoreit, J., Jones, L., Gomez, A.N., Kaiser, L., Polosukhin, I.: Attention is all you need. Advances in neural information processing systems 30 (2017)
- Kaplan et al. [2020] Kaplan, J., McCandlish, S., Henighan, T., Brown, T.B., Chess, B., Child, R., Gray, S., Radford, A., Wu, J., Amodei, D.: Scaling Laws for Neural Language Models (2020)
- Zhao et al. [2023] Zhao, W.X., Zhou, K., Li, J., Tang, T., Wang, X., Hou, Y., Min, Y., Zhang, B., Zhang, J., Dong, Z., Du, Y., Yang, C., Chen, Y., Chen, Z., Jiang, J., Ren, R., Li, Y., Tang, X., Liu, Z., Liu, P., Nie, J.-Y., Wen, J.-R.: A Survey of Large Language Models, 1–97 (2023)
- [16] Chen, J., Chen, L., Zhu, C., Zhou, T.: How Many Demonstrations Do You Need for In-context Learning? Technical report
- Wei et al. [2022] Wei, J., Wang, X., Schuurmans, D., Bosma, M., Ichter, B., Xia, F., Chi, E., Le, Q., Zhou, D.: Chain-of-Thought Prompting Elicits Reasoning in Large Language Models (2022)
- Sen et al. [2022] Sen, P., Aji, A.F., Saffari, A.: Mintaka: A Complex, Natural, and Multilingual Dataset for End-to-End Question Answering. Proceedings - International Conference on Computational Linguistics, COLING 29 (1), 1604–1619 (2022)
- Yih et al. [2016] Yih, W.T., Richardson, M., Meek, C., Chang, M.W., Suh, J.: The value of semantic parse labeling for knowledge base question answering. 54th Annual Meeting of the Association for Computational Linguistics, ACL 2016 - Short Papers, 201–206 (2016) https://doi.org/10.18653/v1/p16-2033
- [20] Zhang, Y., Dai, H., Kozareva, Z., Smola, A.J., Song, L.: Variational Reasoning for Question Answering with Knowledge Graph, 1–22
- [21] Oliya, A., Saffari, A., Sen, P., Ayoola, T.: End-to-End Entity Resolution and Question Answering Using Differentiable Knowledge Graphs. Technical report
- Sen et al. [2023] Sen, P., Mavadia, S., Saffari, A.: Knowledge Graph-augmented Language Models for Complex Question Answering. Proceedings of the Annual Meeting of the Association for Computational Linguistics, 1–8 (2023) https://doi.org/10.18653/v1/2023.nlrse-1.1
- Gu et al. [2022] Gu, Y., Pahuja, V., Cheng, G., Su, Y.: Knowledge Base Question Answering: A Semantic Parsing Perspective (2022)
- Sanh et al. [2022] Sanh, V., Webson, A., Raffel, C., Bach, S.H., Sutawika, L., Alyafeai, Z., Chaffin, A., Stiegler, A., Le Scao, T., Raja, A., Dey, M., Bari, M.S., Xu, C., Thakker, U., Sharma, S., Szczechla, E., Kim, T., Chhablani, G., Nayak, N.V., Datta, D., Chang, J., Jiang, M.T.J., Wang, H., Manica, M., Shen, S., Yong, Z.X., Pandey, H., McKenna, M., Bawden, R., Wang, T., Neeraj, T., Rozen, J., Sharma, A., Santilli, A., Fevry, T., Fries, J.A., Teehan, R., Bers, T., Biderman, S., Gao, L., Wolf, T., Rush, A.M.: Multitask Prompted Training Enables Zero-Shot Task Generalization. ICLR 2022 - 10th International Conference on Learning Representations (2022)
- Raffel et al. [2020] Raffel, C., Shazeer, N., Roberts, A., Lee, K., Narang, S., Matena, M., Zhou, Y., Li, W., Liu, P.J.: Exploring the limits of transfer learning with a unified text-to-text transformer. Journal of Machine Learning Research 21, 1–67 (2020)
- Chung et al. [2022] Chung, H.W., Hou, L., Longpre, S., Zoph, B., Tay, Y., Fedus, W., Li, Y., Wang, X., Dehghani, M., Brahma, S., Webson, A., Gu, S.S., Dai, Z., Suzgun, M., Chen, X., Chowdhery, A., Castro-Ros, A., Pellat, M., Robinson, K., Valter, D., Narang, S., Mishra, G., Yu, A., Zhao, V., Huang, Y., Dai, A., Yu, H., Petrov, S., Chi, E.H., Dean, J., Devlin, J., Roberts, A., Zhou, D., Le, Q.V., Wei, J.: Scaling Instruction-Finetuned Language Models, 1–54 (2022)
- Zhang et al. [2022] Zhang, S., Roller, S., Goyal, N., Artetxe, M., Chen, M., Chen, S., Dewan, C., Diab, M., Li, X., Lin, X.V., Mihaylov, T., Ott, M., Shleifer, S., Shuster, K., Simig, D., Koura, P.S., Sridhar, A., Wang, T., Zettlemoyer, L.: OPT: Open Pre-trained Transformer Language Models (2022)
- Fitzgerald et al. [2022] Fitzgerald, J., Ananthakrishnan, S., Arkoudas, K., Bernardi, D., Bhagia, A., Delli Bovi, C., Cao, J., Chada, R., Chauhan, A., Chen, L., Dwarakanath, A., Dwivedi, S., Gojayev, T., Gopalakrishnan, K., Gueudre, T., Hakkani-Tur, D., Hamza, W., Hueser, J.J., Jose, K.M., Khan, H., Liu, B., Lu, J., Manzotti, A., Natarajan, P., Owczarzak, K., Oz, G., Palumbo, E., Peris, C., Prakash, C.S., Rawls, S., Rosenbaum, A., Shenoy, A., Soltan, S., Sridhar, M.H., Tan, L., Triefenbach, F., Wei, P., Yu, H., Zheng, S., Tur, G., Natarajan, P.: Alexa Teacher Model: Pretraining and Distilling Multi-Billion-Parameter Encoders for Natural Language Understanding Systems. Proceedings of the ACM SIGKDD International Conference on Knowledge Discovery and Data Mining, 2893–2902 (2022) https://doi.org/10.1145/3534678.3539173
- Touvron et al. [2023] Touvron, H., Martin, L., Stone, K., Albert, P., Almahairi, A., Babaei, Y., Bashlykov, N., Batra, S., Bhargava, P., Bhosale, S., Bikel, D., Blecher, L., Ferrer, C.C., Chen, M., Cucurull, G., Esiobu, D., Fernandes, J., Fu, J., Fu, W., Fuller, B., Gao, C., Goswami, V., Goyal, N., Hartshorn, A., Hosseini, S., Hou, R., Inan, H., Kardas, M., Kerkez, V., Khabsa, M., Kloumann, I., Korenev, A., Koura, P.S., Lachaux, M.-A., Lavril, T., Lee, J., Liskovich, D., Lu, Y., Mao, Y., Martinet, X., Mihaylov, T., Mishra, P., Molybog, I., Nie, Y., Poulton, A., Reizenstein, J., Rungta, R., Saladi, K., Schelten, A., Silva, R., Smith, E.M., Subramanian, R., Tan, X.E., Tang, B., Taylor, R., Williams, A., Kuan, J.X., Xu, P., Yan, Z., Zarov, I., Zhang, Y., Fan, A., Kambadur, M., Narang, S., Rodriguez, A., Stojnic, R., Edunov, S., Scialom, T.: Llama 2: Open Foundation and Fine-Tuned Chat Models (2023)
- Berant [2013] Berant, J.: Semantic Parsing on Freebase from Question-Answer Pairs (October), 1533–1544 (2013)
- Talmor and Berant [2013] Talmor, A., Berant, J.: The Web as a Knowledge-base for Answering Complex Questions (2013)
- [32] Dubey, M., Banerjee, D., Abdelkawi, A.: LC-QuAD 2 . 0 : A Large Dataset for Complex Question Answering over Wikidata and DBpedia
- [33] Pedersen, T., Patwardhan, S., Michelizzi, J.: WordNet::Similarity-Measuring the Relatedness of Concepts. Technical report. http://search.cpan.org/dist/WordNet-Similarityhttp://wn-similarity.sourceforge.net
- Hu et al. [2021] Hu, E.J., Shen, Y., Wallis, P., Allen-Zhu, Z., Li, Y., Wang, S., Wang, L., Chen, W.: LoRA: Low-Rank Adaptation of Large Language Models (2021)
- Radhakrishnan et al. [2023] Radhakrishnan, A., Nguyen, K., Chen, A., Chen, C., Denison, C., Hernandez, D., Durmus, E., Hubinger, E., Kernion, J., Lukošiūtė, K., Cheng, N., Joseph, N., Schiefer, N., Rausch, O., McCandlish, S., Showk, S.E., Lanham, T., Maxwell, T., Chandrasekaran, V., Hatfield-Dodds, Z., Kaplan, J., Brauner, J., Bowman, S.R., Perez, E.: Question Decomposition Improves the Faithfulness of Model-Generated Reasoning (2023)
- Jiang et al. [2023] Jiang, A.Q., Sablayrolles, A., Mensch, A., Bamford, C., Chaplot, D.S., Casas, D.d.l., Bressand, F., Lengyel, G., Lample, G., Saulnier, L., Lavaud, L.R., Lachaux, M.-A., Stock, P., Scao, T.L., Lavril, T., Wang, T., Lacroix, T., Sayed, W.E.: Mistral 7B (2023)
- Nguyen et al. [2024] Nguyen, M., Baker, A., Neo, C., Roush, A., Kirsch, A., Shwartz-Ziv, R.: Turning Up the Heat: Min-p Sampling for Creative and Coherent LLM Outputs (2024)
- Steinmetz and Sattler [2021] Steinmetz, N., Sattler, K.U.: What is in the KGQA Benchmark Datasets? Survey on Challenges in Datasets for Question Answering on Knowledge Graphs. Journal on Data Semantics 10 (3-4), 241–265 (2021) https://doi.org/10.1007/s13740-021-00128-9
- Guo et al. [2023] Guo, Z., Jin, R., Liu, C., Huang, Y., Shi, D., Supryadi, Yu, L., Liu, Y., Li, J., Xiong, B., Xiong, D.: Evaluating Large Language Models: A Comprehensive Survey (2023)