# Benchmarking Recommendation, Classification, and Tracing Based on Hugging Face Knowledge Graph
**Authors**: Qiaosheng Chen, Kaijia Huang, Xiao Zhou, Weiqing Luo, Yuanning Cui, Gong Cheng
> 0009-0002-0610-7725Nanjing UniversityState Key Laboratory for Novel Software TechnologyNanjingJiangsuChinaqschen@smail.nju.edu.cn
> 0009-0004-0359-7946Nanjing UniversityState Key Laboratory for Novel Software TechnologyNanjingJiangsuChinaatyou813@gmail.com
> 0009-0008-1132-6408Nanjing UniversityState Key Laboratory for Novel Software TechnologyNanjingJiangsuChinaxzhou@smail.nju.edu.cn
> 0009-0004-8041-3258Nanjing UniversityState Key Laboratory for Novel Software TechnologyNanjingJiangsuChinawqluo@smail.nju.edu.cn
> 0000-0002-9113-0155Nanjing UniversityState Key Laboratory for Novel Software TechnologyNanjingJiangsuChinayncui.nju@gmail.com
> 0000-0003-3539-7776Nanjing UniversityState Key Laboratory for Novel Software TechnologyNanjingJiangsuChinagcheng@nju.edu.cn
(2025)
Abstract.
The rapid growth of open source machine learning (ML) resources, such as models and datasets, has accelerated IR research. However, existing platforms like Hugging Face do not explicitly utilize structured representations, limiting advanced queries and analyses such as tracing model evolution and recommending relevant datasets. To fill the gap, we construct $\mathsf{HuggingKG}$ , the first large-scale knowledge graph built from the Hugging Face community for ML resource management. With 2.6 million nodes and 6.2 million edges, $\mathsf{HuggingKG}$ captures domain-specific relations and rich textual attributes. It enables us to further present $\mathsf{HuggingBench}$ , a multi-task benchmark with three novel test collections for IR tasks including resource recommendation, classification, and tracing. Our experiments reveal unique characteristics of $\mathsf{HuggingKG}$ and the derived tasks. Both resources are publicly available, expected to advance research in open source resource sharing and management. journalyear: 2025 copyright: acmlicensed conference: Proceedings of the 48th International ACM SIGIR Conference on Research and Development in Information Retrieval; July 13–18, 2025; Padua, Italy booktitle: Proceedings of the 48th International ACM SIGIR Conference on Research and Development in Information Retrieval (SIGIR ’25), July 13–18, 2025, Padua, Italy doi: 10.1145/3726302.3730277 isbn: 979-8-4007-1592-1/2025/07
1. Introduction
The proliferation of open source models and datasets has empowered researchers and developers to build on existing AI tools, driving innovation across diverse domains. It also highlights the critical role of resource sharing platforms in the advancement of AI research, which requires efficient frameworks to share, search, and manage software resources to ensure equitable access and foster collaboration (Longpre et al., 2024; Chapman et al., 2020; Paton et al., 2023; Cao et al., 2021; Liu et al., 2023). In this context, Hugging Face has emerged as a popular platform, democratizing access to cutting-edge ML resources and allowing users to find open models and datasets.
Motivation. Existing platforms for open source resource sharing, such as GitHub and Hugging Face, rely primarily on keyword-based search and simplistic metadata tagging (Lhoest et al., 2021). Although these platforms provide access to vast collections of models and datasets, they do not leverage semantic relations (e.g., model evolution, task dependencies, and user collaboration patterns) between resources during searches. As a result, they are unable to integrate structural information to recommend and manage resources effectively. This unstructured paradigm severely limits support for advanced queries and analyses, such as tracing a model’s evolution history, identifying relevant datasets for a specific task, or recommending underutilized resources based on structural dependencies.
<details>
<summary>x1.png Details</summary>
### Visual Description
## Diagram: Hugging Face Ecosystem Overview
### Overview
The image is a diagram illustrating the Hugging Face ecosystem and its components, including models, datasets, spaces, users, organizations, tasks, and papers. It shows how these components interact, particularly focusing on the pre-training and fine-tuning of BERT models and their applications in resource recommendation, task classification, and model tracing.
### Components/Axes
The diagram is divided into three main sections, each representing a different aspect of the Hugging Face ecosystem:
1. **Left Section (Hugging Face):**
* Icons representing: model, dataset, space, collection, user, organization, task, and paper.
* Label: "Hugging Face" with a smiling face emoji.
2. **Middle Section (HuggingKG):**
* Focuses on BERT model pre-training and fine-tuning.
* Elements include:
* "Embedding Models (Collection)"
* "BERT: Pre-training of ... (Paper)cite"
* "Google (Organization)"
* "Fill-Mask (Task)"
* "Wikipedia (Dataset)"
* "BookCorpus (Dataset)"
* "Pubmed (Dataset)"
* "BERT (Model)"
* "medBERT (Model)"
* "exBERT (Space)"
* "Bob (User)"
* "Jack (User)"
* Relationships are indicated by arrows and labels like "contain," "publish," "define for," "trained on," "use," "finetune," "like," and "follow."
3. **Right Section (HuggingBench):**
* Illustrates applications of the models.
* Numbered list:
1. "Resource Recommendation"
2. "Task Classification"
3. "Model Tracing"
### Detailed Analysis or ### Content Details
* **Left Section (Hugging Face):**
* The icons represent the core components of the Hugging Face platform.
* The orange arrow indicates a flow or progression towards the middle section.
* **Middle Section (HuggingKG):**
* "Embedding Models (Collection)" contain papers.
* "BERT: Pre-training of ... (Paper)cite" uses BERT model.
* "Google (Organization)" publishes and defines for tasks.
* "Fill-Mask (Task)" and "Wikipedia (Dataset)" are used to train BERT.
* "BookCorpus (Dataset)" and "Pubmed (Dataset)" are used to train medBERT.
* BERT is fine-tuned to create medBERT and exBERT.
* exBERT is a space.
* Bob likes exBERT.
* Jack follows Bob.
* **Right Section (HuggingBench):**
1. **Resource Recommendation:** A user "likes" a resource, leading to a recommendation of a model, dataset, space, and collection.
2. **Task Classification:** A model is defined for a task, leading to a question mark icon.
3. **Model Tracing:** A model is fine-tuned, leading to other models and datasets.
### Key Observations
* The diagram highlights the interconnectedness of the Hugging Face ecosystem.
* BERT model pre-training and fine-tuning are central themes.
* The diagram illustrates the flow of information and resources within the ecosystem.
### Interpretation
The diagram provides a high-level overview of the Hugging Face ecosystem, emphasizing the relationships between different components and the workflow of model development and application. It demonstrates how models are pre-trained on various datasets, fine-tuned for specific tasks, and used in applications like resource recommendation and task classification. The diagram also highlights the social aspect of the platform, with users "liking" and "following" resources and other users. The overall message is that Hugging Face provides a comprehensive platform for developing, sharing, and using machine learning models.
</details>
Figure 1. Illustration of $\mathsf{HuggingKG}$ and $\mathsf{HuggingBench}$ .
Knowledge graphs (KGs) offer a proven solution to this limitation. By explicitly representing entities as nodes and connecting them with edges representing typed relations, KGs enable sophisticated querying and analysis, as demonstrated in domains such as encyclopedias (Vrandecic and Krötzsch, 2014), academia (Zhang et al., 2019) and e-commerce (Ni et al., 2019). In the context of resource management, a structured KG can unify separated metadata, resource dependencies, and user interactions into a single heterogeneous graph. This representation supports complex tasks such as recommendation (Cao et al., 2021; Liu et al., 2023; Shao et al., 2020), link prediction (Bai et al., 2024), and node classification (Zhang et al., 2024). Therefore, our work aims to transform resource sharing platforms into KGs that enhance discovery, reproducibility, and management of open source resources.
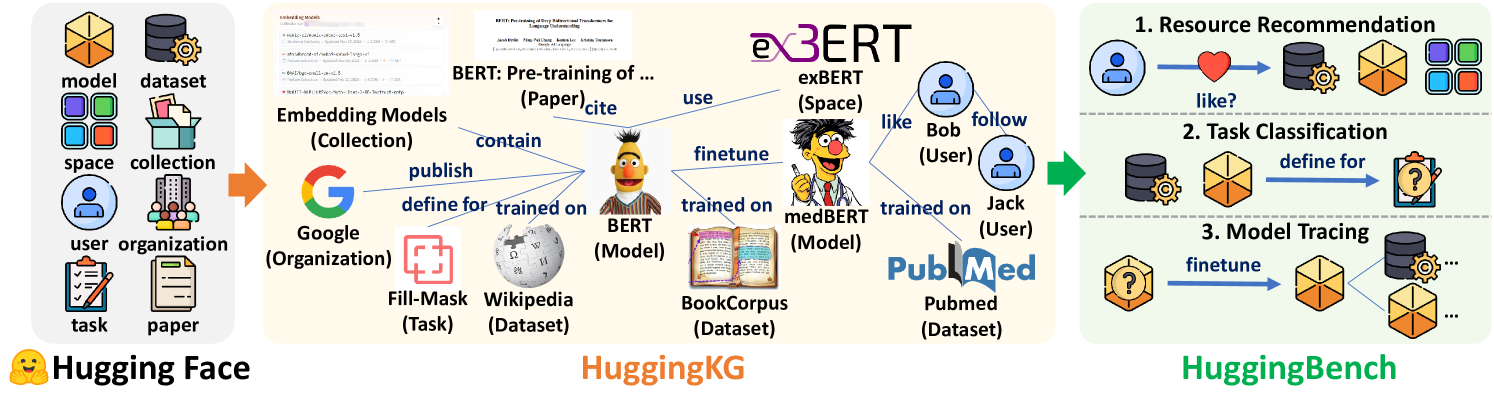
Our Resources. We construct two foundational resources as illustrated in Figure 1: $\mathsf{HuggingKG}$ , a large-scale ML resource KG built on the Hugging Face community, and $\mathsf{HuggingBench}$ , a multi-task benchmark designed to evaluate practical challenges in open source resource management. With more than 2.6 million nodes and 6.2 million triples, $\mathsf{HuggingKG}$ represents the largest publicly available KG in this domain (to our best knowledge). It integrates ML-related entities (e.g., Model, Dataset, User, Task) with ML-specific relations such as model evolution (e.g., Adapter, Finetune) and user interactions (e.g., Like, Follow), while incorporating rich textual attributes (e.g., extended descriptions). $\mathsf{HuggingBench}$ includes the first cross-type resource recommendation test collection in the ML resource domain and the first model tracing test collection, novel domain-specific tasks that existing benchmarks cannot support. We analyze the unique properties of $\mathsf{HuggingKG}$ and perform extensive evaluations with $\mathsf{HuggingBench}$ to reveal their special characteristics, which differ from traditional KGs or tasks in domains such as encyclopedias, academia, or e-commerce.
The main contributions of this work are as follows.
- $\mathsf{HuggingKG}$ : The first KG for ML resources on Hugging Face, featuring the largest scale among comparable works, and uniquely capturing domain-specific relations related to model evolution and user interaction as well as rich textual attributes.
- $\mathsf{HuggingBench}$ : A new multi-task benchmark including novel test collections for cross-type resource recommendation, task classification, and model lineage tracing, addressing unmet needs in open source resource management.
Availability. $\mathsf{HuggingKG}$ and $\mathsf{HuggingBench}$ are available on Hugging Face. https://huggingface.co/collections/cqsss/huggingbench-67b2ee02ca45b15e351009a2 The code for constructing $\mathsf{HuggingKG}$ and reproducing the experiments is available on GitHub. https://github.com/nju-websoft/HuggingBench Both resources are licensed under Apache License 2.0.
2. Related Work
KGs for Resource Management. KGs have been extensively used to represent and analyze complex relationships in various domains, including open source resource management. Previous works such as DEKR (Cao et al., 2021) and MLTaskKG (Liu et al., 2023) have constructed KGs to support recommendation tasks by capturing relationships among ML resources. DEKR (Cao et al., 2021) primarily relies on description enhancement for ML method recommendation. MLTaskKG (Liu et al., 2023) constructs an AI task-model KG by integrating static data to support task-oriented ML/DL library recommendation. However, both approaches focus on static attributes and a narrow set of relations, failing to capture dynamic user interactions and inter- Model relations. In contrast, as shown in Table 1, our proposed $\mathsf{HuggingKG}$ is built on the rich metadata provided by Hugging Face, offering a large-scale KG with a more extensive set of relations. In addition to generic relations (e.g., Defined For, Cite), $\mathsf{HuggingKG}$ incorporates multiple inter- Model relations (i.e., Adapter, Finetune, Merge, and Quantize) and captures user interaction signals (i.e., Publish, Like, and Follow). This enriched structure facilitates a deeper analysis of ML resources and supports more effective recommendation strategies.
KG-based Benchmarks. Various benchmark datasets have been proposed to evaluate KG-based tasks. For example, OAG-Bench (Zhang et al., 2024) provides a human-curated benchmark for academic graph mining, focusing on citation and collaboration networks. In the domain of open source resource management, our $\mathsf{HuggingBench}$ benchmark distinguishes itself by providing datasets for three IR tasks: resource recommendation, task classification, and model tracing.
For resource recommendation, paper2repo (Shao et al., 2020) introduces a distant-supervised recommender system that matches papers with related code repositories. However, it incorporates a limited range of entity types that are insufficient to build fine-grained interdependencies. Xu et al. (Xu et al., 2023) leverages multi-modal features from developers’ sequential behaviors and repository text to generate relevant and tailored suggestions for developers, yet it does not explicitly construct or exploit a structured KG. In contrast, as shown in Table 1, $\mathsf{HuggingBench}$ benefits from the inherent structure of $\mathsf{HuggingKG}$ that captures rich relational data for recommendation.
Furthermore, GRETA (Cai et al., 2016) and recent efforts in automated categorization (Sipio et al., 2024; Nguyen et al., 2024) address specific tagging/classification tasks. GRETA (Cai et al., 2016) constructs an Entity Tag Graph (ETG) using the cross-community knowledge from GitHub and Stack Overflow, and uses an iterative random walk with restart algorithm to automatically assign tags to repositories. $\mathsf{HuggingKG}$ integrates richer textual descriptions and metadata to construct a graph that encapsulates fine-grained relationships among models and datasets, thereby facilitating multi-label task classification for ML resources.
Table 1. Comparison between KGs and benchmarks on open source resource management.
| | Source | #Nodes | #Types | #Relations | #Edges | Key Entities & (Attributes) | Model Evolution | User Interaction | Tasks |
| --- | --- | --- | --- | --- | --- | --- | --- | --- | --- |
| DEKR (Cao et al., 2021) | Open academic platforms (e.g., PapersWithCode, GitHub) | 17,483 | 5 | 23 | 117,245 | Dataset, Method (Description) | No | No | Recommendation |
| MLTaskKG (Liu et al., 2023) | PapersWithCode, ML/DL Papers, ML/DL Framework Docs | 159,310 | 16 | 39 | 628,045 | Task, Model, Model Implementation | No | No | Recommendation |
| paper2repo (Shao et al., 2020) | GitHub, Microsoft Academic | 39,600 | 2 | - | - | Paper, Repository | No | Yes (Star) | Recommendation |
| GRETA (Cai et al., 2016) | GitHub, Stack Overflow | 707,891 | 4 | - | - | Repository, Tag | No | Yes (Search, Raise, Answer) | Tag Assignment |
| AIPL(Facebook/React) (Bai et al., 2024) | GitHub | 97,556 | 4 | 9 | 196,834 | Issue, PR, Repository, User | No | Yes | Issue-PR Link Prediction |
| AIPL(vuejs/vue) (Bai et al., 2024) | GitHub | 49,200 | 4 | 9 | 95,160 | Issue, PR, Repository, User | No | Yes | Issue-PR Link Prediction |
| $\mathsf{HuggingKG}$ & $\mathsf{HuggingBench}$ | Hugging Face | 2,614,270 | 8 | 30 | 6,246,353 | Model, Dataset, User, Task (Description) | Yes (Finetune, Adapter, Merge, Quantize) | Yes (Publish, Like, Follow) | Recommendation, Classification, Tracing |
Recent work by Bai et al. (Bai et al., 2024) uses a knowledge-aware heterogeneous graph learning approach to predict links between issues and pull requests on GitHub, effectively capturing complex relational information through metapath aggregation. However, it remains confined to linking Issue – PR pairs and does not address the broader challenge of tracking model evolution across ML resources. The novel model tracing task in $\mathsf{HuggingBench}$ not only pioneers the exploration of inter- Model relations, but also provides practical insights into the evolution, reuse, and optimization of ML models, thereby supporting more informed decision-making in real-world open source resource management.
3. $\mathsf{HuggingKG}$ Knowledge Graph
3.1. KG Construction
The construction of $\mathsf{HuggingKG}$ follows a principled process that includes defining nodes and edges, crawling and converting data from the Hugging Face community website, and performing data verification and cleaning.
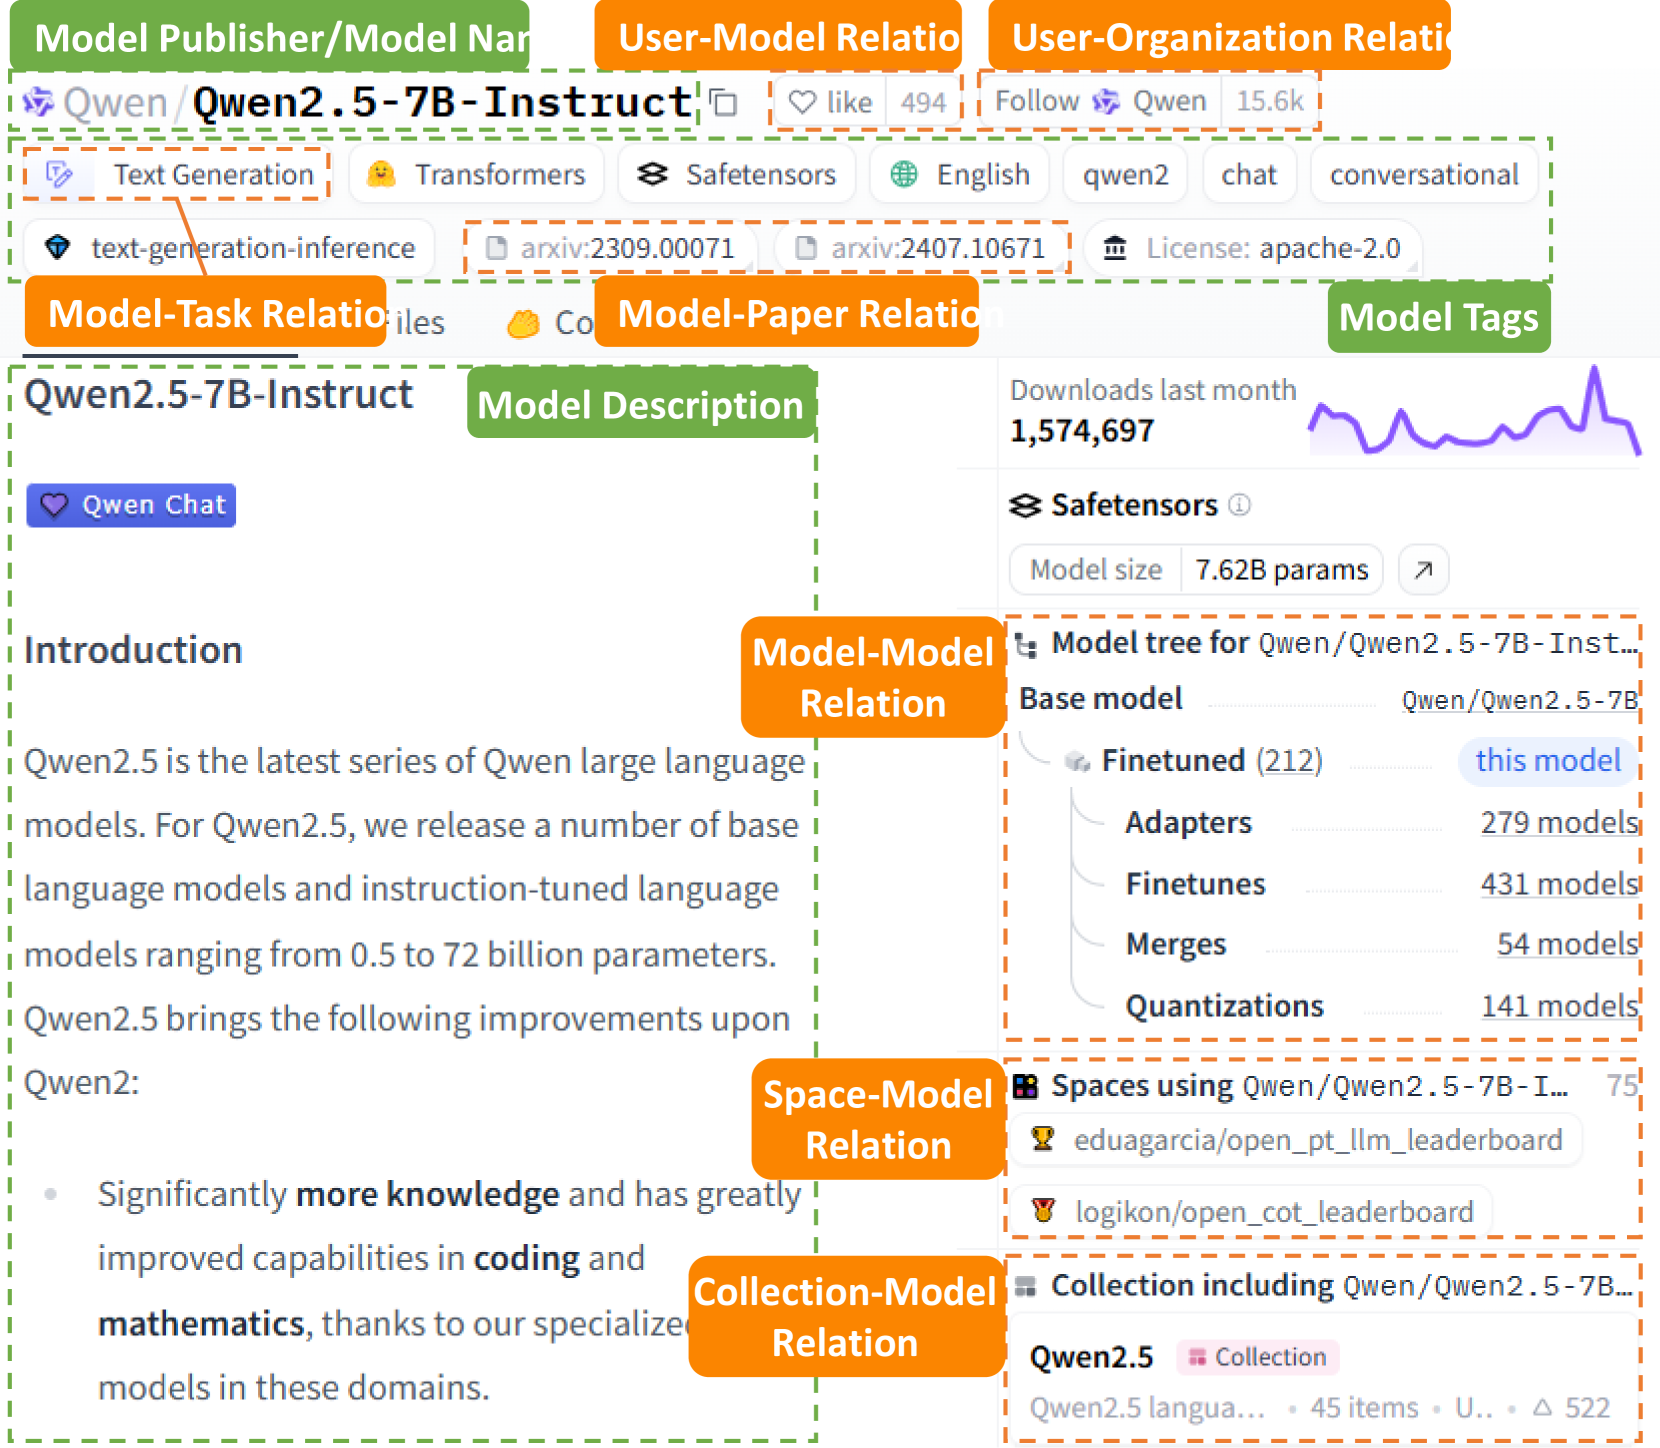
Schema Definition. The nodes and edges in $\mathsf{HuggingKG}$ are defined based on our meticulous analysis of the Hugging Face website and general IR needs in real-world scenarios. Figure 2 shows an example model page of $\mathtt{Qwen/Qwen2.5\text{-}7B\text{-}Instruct}$ https://huggingface.co/Qwen/Qwen2.5-7B-Instruct on the Hugging Face website. We can intuitively see that the key attributes of a Model include its name, publisher, tags, and text description on the model card, etc. The key relations that can be observed on the page include Finetune between Model s and Like between User and Model, etc.
<details>
<summary>x2.png Details</summary>
### Visual Description
## Model Information Card
### Overview
The image is a snapshot of a model information card, likely from a platform like Hugging Face. It provides details about the "Qwen/Qwen2.5-7B-Instruct" model, including its description, related models, usage spaces, collections, and performance metrics.
### Components/Axes
* **Header:**
* Model Publisher/Model Name: "Qwen/Qwen2.5-7B-Instruct"
* User-Model Relation: "like 494"
* User-Organization Relation: "Follow Qwen 15.6k"
* **Tags:**
* "Text Generation"
* "Transformers"
* "Safetensors"
* "English"
* "qwen2"
* "chat"
* "conversational"
* "text-generation-inference"
* "arxiv:2309.00071"
* "arxiv:2407.10671"
* "License: apache-2.0"
* **Model Description:**
* Title: "Introduction"
* Text: "Qwen2.5 is the latest series of Qwen large language models. For Qwen2.5, we release a number of base language models and instruction-tuned language models ranging from 0.5 to 72 billion parameters. Qwen2.5 brings the following improvements upon Qwen2: Significantly more knowledge and has greatly improved capabilities in coding and mathematics, thanks to our specialized models in these domains."
* **Model-Model Relation:**
* Downloads last month: 1,574,697. A small line graph shows a general upward trend with fluctuations.
* Safetensors
* Model size: 7.62B params
* Model tree for Qwen/Qwen2.5-7B-Inst...
* Base model: Qwen/Qwen2.5-7B
* Finetuned (212): this model
* Adapters: 279 models
* Finetunes: 431 models
* Merges: 54 models
* Quantizations: 141 models
* **Space-Model Relation:**
* Spaces using Qwen/Qwen2.5-7B-I...: 75
* eduagarcia/open\_pt\_llm\_leaderboard
* logikon/open\_cot\_leaderboard
* **Collection-Model Relation:**
* Collection including Qwen/Qwen2.5-7B...
* Qwen2.5 Collection
* Qwen2.5 langua... 45 items U... Δ 522
### Detailed Analysis or ### Content Details
* **Model Publisher/Model Name:** The model is published by "Qwen" and its name is "Qwen2.5-7B-Instruct".
* **User Interaction:** The model has 494 "likes" and the user can "Follow" "Qwen" with 15.6k followers.
* **Model Description:** The description highlights that Qwen2.5 is the latest in the Qwen series, with models ranging from 0.5 to 72 billion parameters. It emphasizes improvements in knowledge, coding, and mathematics.
* **Downloads:** The model was downloaded 1,574,697 times in the last month.
* **Model Size:** The model size is 7.62B parameters.
* **Model Tree:** The model tree shows the relationships between different versions and adaptations of the model. The base model is "Qwen/Qwen2.5-7B". There are 212 finetuned versions, 279 adapters, 431 finetunes, 54 merges, and 141 quantizations.
* **Spaces:** The model is used in 75 spaces. Two specific spaces are listed: "eduagarcia/open\_pt\_llm\_leaderboard" and "logikon/open\_cot\_leaderboard".
* **Collections:** The model is included in the "Qwen2.5" collection, which contains 45 items.
### Key Observations
* The model is popular, with a high number of downloads and likes.
* There are many variations of the model, including finetuned versions, adapters, and quantizations.
* The model is used in a variety of spaces and collections.
### Interpretation
The information card provides a comprehensive overview of the "Qwen/Qwen2.5-7B-Instruct" model. The high download count and user engagement suggest that it is a popular and widely used model. The presence of numerous finetuned versions and adapters indicates that the model is highly adaptable and customizable for different tasks. The inclusion in various spaces and collections further demonstrates its versatility and utility in different applications. The model's focus on improvements in coding and mathematics suggests that it is well-suited for tasks that require strong reasoning and problem-solving abilities.
</details>
Figure 2. An example model page on Hugging Face.
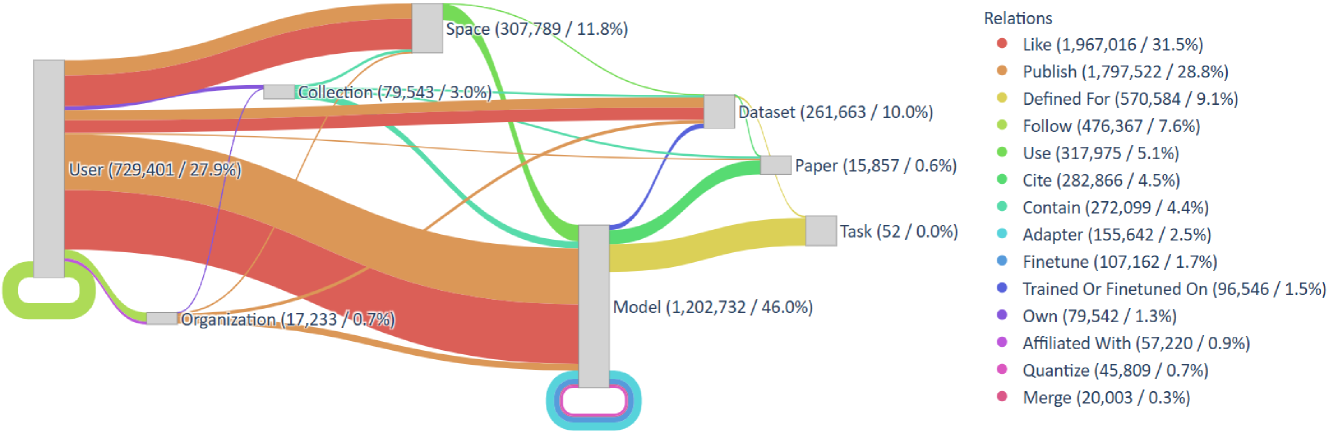
Through an analysis of pages such as models, datasets, and spaces, we identify 8 types of nodes and 30 types of edges between them, as illustrated in Figure 3. In addition, we determine the key attributes associated with each node type. For Model, Dataset, Space, and Collection, we adopt the “publisher/name” format used by Hugging Face serving as the primary identifier. To address potential name duplication across different node types (e.g., a model https://huggingface.co/aai540-group3/diabetes-readmission and a dataset https://huggingface.co/datasets/aai540-group3/diabetes-readmission sharing the same “publisher/name”), we introduce a type prefix for each node. For example, a Model might be represented as $\mathtt{model:Qwen/Qwen2.5\text{-}7B\text{-}Instruct}$ , ensuring its uniqueness. This string is used as a unique identifier to detect and prevent duplication during subsequent data crawling and processing.
Data Crawling and Conversion. The data crawling process is performed utilizing the huggingface_hub library https://huggingface.co/docs/hub/index and issuing requests to the relevant API endpoints. https://huggingface.co/docs/hub/api
For Model, Dataset, and Space, we retrieve their complete lists, as well as their key attributes (e.g., tags, download count) and edges through functions in the huggingface_hub library. Specifically, to capture the complete README file for each Model or Dataset node, we send a request to download and parse the README.md file, storing its content as the description field in text format. The list of Collection and additional metadata for these four node types are obtained by batch API requests.
<details>
<summary>x3.png Details</summary>
### Visual Description
## Sankey Diagram: Relations between Entities
### Overview
The image is a Sankey diagram illustrating the relationships between different entities (User, Space, Collection, Organization) and their connections to other entities (Dataset, Paper, Task, Model) through various relations (Like, Publish, Defined For, etc.). The diagram shows the flow of connections, with the width of the bands representing the magnitude of the relationship. The diagram is split into two columns, with the entities on the left and the relations on the right.
### Components/Axes
* **Entities (Left Side):**
* User (729,401 / 27.9%)
* Space (307,789 / 11.8%)
* Collection (79,543 / 3.0%)
* Organization (17,233 / 0.7%)
* **Entities (Right Side):**
* Dataset (261,663 / 10.0%)
* Paper (15,857 / 0.6%)
* Task (52 / 0.0%)
* Model (1,202,732 / 46.0%)
* **Relations (Legend - Top Right):**
* Like (1,967,016 / 31.5%) - Red
* Publish (1,797,522 / 28.8%) - Orange
* Defined For (570,584 / 9.1%) - Yellow
* Follow (476,367 / 7.6%) - Green
* Use (317,975 / 5.1%) - Light Green
* Cite (282,866 / 4.5%) - Teal
* Contain (272,099 / 4.4%) - Cyan
* Adapter (155,642 / 2.5%) - Light Blue
* Finetune (107,162 / 1.7%) - Blue
* Trained Or Finetuned On (96,546 / 1.5%) - Dark Blue
* Own (79,542 / 1.3%) - Purple
* Affiliated With (57,220 / 0.9%) - Pink
* Quantize (45,809 / 0.7%) - Light Pink
* Merge (20,003 / 0.3%) - Dark Pink
### Detailed Analysis
* **User:**
* The largest flow from User is to Like (Red), followed by Publish (Orange), Defined For (Yellow), Follow (Green), Use (Light Green), Cite (Teal), Contain (Cyan), Adapter (Light Blue), Finetune (Blue), Trained Or Finetuned On (Dark Blue), Own (Purple), Affiliated With (Pink), Quantize (Light Pink), Merge (Dark Pink).
* **Space:**
* The largest flow from Space is to Model (46.0%), followed by Dataset (10.0%).
* **Collection:**
* The largest flow from Collection is to Dataset (10.0%).
* **Organization:**
* The largest flow from Organization is to Model (46.0%).
* **Dataset:**
* The Dataset entity receives connections from User, Space, and Collection.
* **Paper:**
* The Paper entity receives connections from User.
* **Task:**
* The Task entity receives connections from User.
* **Model:**
* The Model entity receives connections from Space and Organization.
### Key Observations
* The Model entity has the highest percentage (46.0%) on the right side, indicating it is the most common destination for the relationships shown.
* The User entity has the highest percentage (27.9%) on the left side, indicating it is the most common origin for the relationships shown.
* The "Like" and "Publish" relations are the most frequent, with 31.5% and 28.8% respectively.
* The "Task" entity has the lowest percentage (0.0%) on the right side.
### Interpretation
The Sankey diagram visualizes the relationships between different entities and their connections through various relations. The diagram suggests that "Model" is the most common destination, indicating a strong focus on models in the data. "User" is the most common origin, suggesting that users are the primary actors in these relationships. The high percentages for "Like" and "Publish" indicate that these are the most common types of interactions. The low percentage for "Task" suggests that tasks are less frequently associated with the entities shown in this diagram. The diagram provides a high-level overview of the relationships between entities and relations, highlighting the most important connections and patterns.
</details>
Figure 3. The schema graph of $\mathsf{HuggingKG}$ , along with the quantity and proportion of each node and edge type.
The lists of User and Organization are extracted from the “publisher” fields of various nodes, including Model, Dataset, Space, Collection, and Paper. User and Organization nodes are distinguished by their profiles from the API endpoints, and edges such as Follow and Affiliated With are also captured.
Paper nodes are identified through arxiv: tags present in Model, Dataset, and Collection nodes. Detailed metadata, such as title, abstract, publication date, and authorship, is retrieved through API calls. For authors registered as User, we established edges between User nodes and their associated Paper nodes.
Task nodes are identified from three primary sources: “tasks” fields in Dataset, “pipeline tags” fields in Model, and direct definitions from the API. Edges between Task nodes and Model or Dataset nodes, are established by parsing metadata fields, allowing us to align models and datasets with the tasks they serve for.
Data Verification and Cleaning. After data crawling is completed, we verify and clean all nodes and edges to ensure the accuracy and completeness of $\mathsf{HuggingKG}$ . The verification process involves scanning all collected edges and checking whether the nodes involved in each edge exist within the set of collected nodes. Some models may have been deleted by the publisher, but edges involving those models (e.g., a model finetuned from the original) may still appear on Web pages. If any invalid edges are detected, they are removed. The data cleaning process primarily focuses on eliminating outliers in node attributes and removing invalid characters from text fields.
Time and Space Cost. To reduce time overhead, the construction process employs multi-threaded parallel processing at each step. Consequently, the entire process takes approximately 20 hours and the storage of node attributes and edges in the graph amounts to around 5.8 GB. This indicates that the graph can be updated daily. The current version of $\mathsf{HuggingKG}$ is constructed with data collected on December 15, 2024.
<details>
<summary>x4.png Details</summary>
### Visual Description
## Heatmap: Model/Dataset Category Correlation
### Overview
The image presents two heatmaps visualizing the correlation between different model categories and dataset categories. The left heatmap shows the correlation between "Model Category A" and "Model Category B," while the right heatmap shows the correlation between "Dataset Category A" and "Dataset Category B." The color intensity represents the strength of the correlation, ranging from yellow (low correlation) to dark blue (high correlation).
### Components/Axes
**Left Heatmap:**
* **Y-axis (Model Category A):**
* Categories: Multimodal, NLP, CV, Audio, Tabular, RL, Graph, Robotics, Time Series
* **X-axis (Model Category B):**
* Categories: Multimodal, NLP, CV, Audio, Tabular, RL, Graph, Robotics, Time Series
* **Color Scale:** Ranges from 0.00 (yellow) to 1.00 (dark blue), with increments of 0.25.
**Right Heatmap:**
* **Y-axis (Dataset Category A):**
* Categories: Multimodal, NLP, CV, Audio, Tabular, RL, Graph, Robotics, Time Series
* **X-axis (Dataset Category B):**
* Categories: Multimodal, NLP, CV, Audio, Tabular, RL, Graph, Robotics, Time Series
* **Color Scale:** Ranges from 0.00 (yellow) to 1.00 (dark blue), with increments of 0.25.
### Detailed Analysis
**Left Heatmap (Model Category A vs. Model Category B):**
* **Multimodal:** Shows high correlation (dark blue, ~0.75-1.00) with Multimodal, moderate correlation (blue, ~0.50-0.75) with NLP and CV, and low correlation (yellow, ~0.00-0.25) with the rest.
* **NLP:** Shows high correlation (dark blue, ~0.75-1.00) with NLP, moderate correlation (blue, ~0.50-0.75) with Multimodal and CV, and low correlation (yellow, ~0.00-0.25) with the rest.
* **CV:** Shows high correlation (dark blue, ~0.75-1.00) with CV, moderate correlation (blue, ~0.50-0.75) with Multimodal and NLP, and low correlation (yellow, ~0.00-0.25) with the rest.
* **Audio:** Shows high correlation (dark blue, ~0.75-1.00) with Audio, and low correlation (yellow, ~0.00-0.25) with the rest.
* **Tabular:** Shows high correlation (dark blue, ~0.75-1.00) with Tabular, and low correlation (yellow, ~0.00-0.25) with the rest.
* **RL:** Shows high correlation (dark blue, ~0.75-1.00) with RL, and low correlation (yellow, ~0.00-0.25) with the rest.
* **Graph:** Shows high correlation (dark blue, ~0.75-1.00) with Graph, and low correlation (yellow, ~0.00-0.25) with the rest.
* **Robotics:** Shows high correlation (dark blue, ~0.75-1.00) with Robotics, and low correlation (yellow, ~0.00-0.25) with the rest.
* **Time Series:** Shows high correlation (dark blue, ~0.75-1.00) with Time Series, and low correlation (yellow, ~0.00-0.25) with the rest.
**Right Heatmap (Dataset Category A vs. Dataset Category B):**
* **Multimodal:** Shows high correlation (dark blue, ~0.75-1.00) with Multimodal, moderate correlation (blue, ~0.50-0.75) with NLP and CV, and low correlation (yellow, ~0.00-0.25) with the rest.
* **NLP:** Shows high correlation (dark blue, ~0.75-1.00) with NLP, moderate correlation (blue, ~0.50-0.75) with Multimodal and CV, and low correlation (yellow, ~0.00-0.25) with the rest.
* **CV:** Shows high correlation (dark blue, ~0.75-1.00) with CV, moderate correlation (blue, ~0.50-0.75) with Multimodal and NLP, and low correlation (yellow, ~0.00-0.25) with the rest.
* **Audio:** Shows high correlation (dark blue, ~0.75-1.00) with Audio, and low correlation (yellow, ~0.00-0.25) with the rest.
* **Tabular:** Shows high correlation (dark blue, ~0.75-1.00) with Tabular, and low correlation (yellow, ~0.00-0.25) with the rest.
* **RL:** Shows high correlation (dark blue, ~0.75-1.00) with RL, and low correlation (yellow, ~0.00-0.25) with the rest.
* **Graph:** Shows high correlation (dark blue, ~0.75-1.00) with Graph, and low correlation (yellow, ~0.00-0.25) with the rest.
* **Robotics:** Shows high correlation (dark blue, ~0.75-1.00) with Robotics, and low correlation (yellow, ~0.00-0.25) with the rest.
* **Time Series:** Shows high correlation (dark blue, ~0.75-1.00) with Time Series, and low correlation (yellow, ~0.00-0.25) with the rest.
### Key Observations
* Both heatmaps exhibit a strong diagonal pattern, indicating a high correlation between the same categories (e.g., Multimodal models are highly correlated with Multimodal models, and Multimodal datasets are highly correlated with Multimodal datasets).
* Multimodal, NLP, and CV categories show some degree of inter-correlation in both heatmaps.
* The remaining categories (Audio, Tabular, RL, Graph, Robotics, Time Series) show very little correlation with each other.
### Interpretation
The heatmaps suggest that models and datasets within the same category are strongly related. This is expected, as models are typically designed and trained for specific data types. The inter-correlation between Multimodal, NLP, and CV categories might indicate that these areas share some common techniques or are often used together in certain applications. The lack of correlation between the other categories suggests that they are more specialized and distinct from each other. The data demonstrates the expected relationships between model and dataset categories, highlighting the importance of matching models to appropriate data types.
</details>
(a) $P(A|B)$ for within-type nodes.
<details>
<summary>x5.png Details</summary>
### Visual Description
## Heatmaps: Model/Dataset Category Performance
### Overview
The image presents two heatmaps comparing the performance of different model and dataset categories. The left heatmap shows the performance of models (Model Category B) on different datasets (Dataset Category A), while the right heatmap shows the performance of datasets (Dataset Category B) when used with different models (Model Category A). The color intensity represents the performance score, ranging from 0.00 (yellow) to 1.00 (dark blue).
### Components/Axes
**Left Heatmap:**
* **Y-axis (Dataset Category A):**
* Multimodal
* NLP
* CV
* Audio
* Tabular
* RL
* Graph
* Robotics
* Time Series
* **X-axis (Model Category B):**
* Multimodal
* NLP
* CV
* Audio
* Tabular
* RL
* Graph
* Robotics
* Time Series
* **Color Scale:** Ranges from 0.00 (yellow) to 1.00 (dark blue), with increments of 0.25.
**Right Heatmap:**
* **Y-axis (Model Category A):**
* Multimodal
* NLP
* CV
* Audio
* Tabular
* RL
* Graph
* Robotics
* Time Series
* **X-axis (Dataset Category B):**
* Multimodal
* NLP
* CV
* Audio
* Tabular
* RL
* Graph
* Robotics
* Time Series
* **Color Scale:** Ranges from 0.00 (yellow) to 1.00 (dark blue), with increments of 0.25.
### Detailed Analysis
**Left Heatmap (Model Category B vs. Dataset Category A):**
* **Multimodal Models:** Perform relatively well (around 0.50) on Multimodal, NLP, and CV datasets.
* **NLP Models:** Show high performance (0.75-1.00) on NLP datasets, and moderate performance (0.50-0.75) on Multimodal, CV, and Audio datasets.
* **CV Models:** Perform moderately well (0.50-0.75) on CV datasets, and lower on others.
* **Audio Models:** Show moderate performance (around 0.50) on Audio datasets.
* **Tabular, RL, Graph, Robotics, and Time Series Models:** Generally show low performance (close to 0.00-0.25) across most datasets.
* **Specific Data Points:**
* NLP Model on NLP Dataset: ~0.90 (dark blue)
* CV Model on CV Dataset: ~0.60 (light blue)
* Time Series Model on Time Series Dataset: ~0.20 (yellow)
**Right Heatmap (Dataset Category B vs. Model Category A):**
* **Multimodal Datasets:** Show low performance (close to 0.00-0.25) across most models.
* **NLP Datasets:** Perform moderately well (0.50-0.75) with NLP, CV, Audio, Tabular, and RL models.
* **CV Datasets:** Show low performance (close to 0.00-0.25) across most models.
* **Audio Datasets:** Show low performance (close to 0.00-0.25) across most models.
* **Tabular Datasets:** Show low performance (close to 0.00-0.25) across most models.
* **RL Datasets:** Show low performance (close to 0.00-0.25) across most models.
* **Graph Datasets:** Show low performance (close to 0.00-0.25) across most models.
* **Robotics Datasets:** Show low performance (close to 0.00-0.25) across most models.
* **Time Series Datasets:** Show low performance (close to 0.00-0.25) across most models.
* **Specific Data Points:**
* NLP Dataset with NLP Model: ~0.70 (light blue)
* CV Dataset with CV Model: ~0.20 (yellow)
### Key Observations
* The left heatmap shows that NLP models perform well on NLP datasets, and CV models perform moderately well on CV datasets.
* The right heatmap shows that NLP datasets perform moderately well across a range of models.
* Other model/dataset combinations generally show low performance.
* There is a clear diagonal trend in the left heatmap, indicating that models tend to perform best on datasets of the same category.
### Interpretation
The heatmaps suggest that certain model categories are better suited for specific dataset categories. NLP models excel on NLP datasets, and CV models show reasonable performance on CV datasets. The right heatmap indicates that NLP datasets are more versatile and can be used with a wider range of models. The low performance of other model/dataset combinations suggests that these models may not be well-suited for these datasets, or that further optimization is needed. The diagonal trend in the left heatmap highlights the importance of matching model and dataset categories for optimal performance.
</details>
(b) $P(A|B)$ for cross-type nodes.
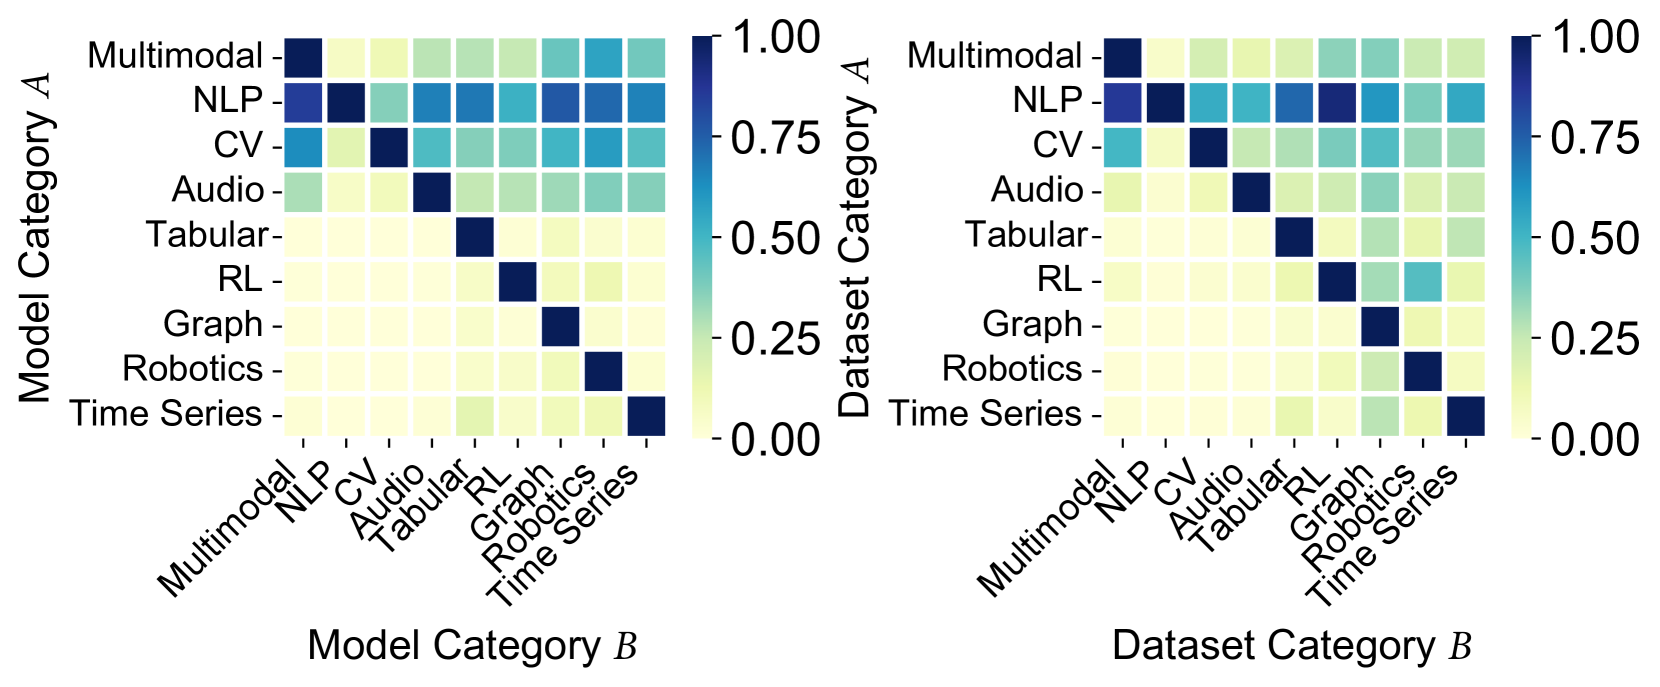
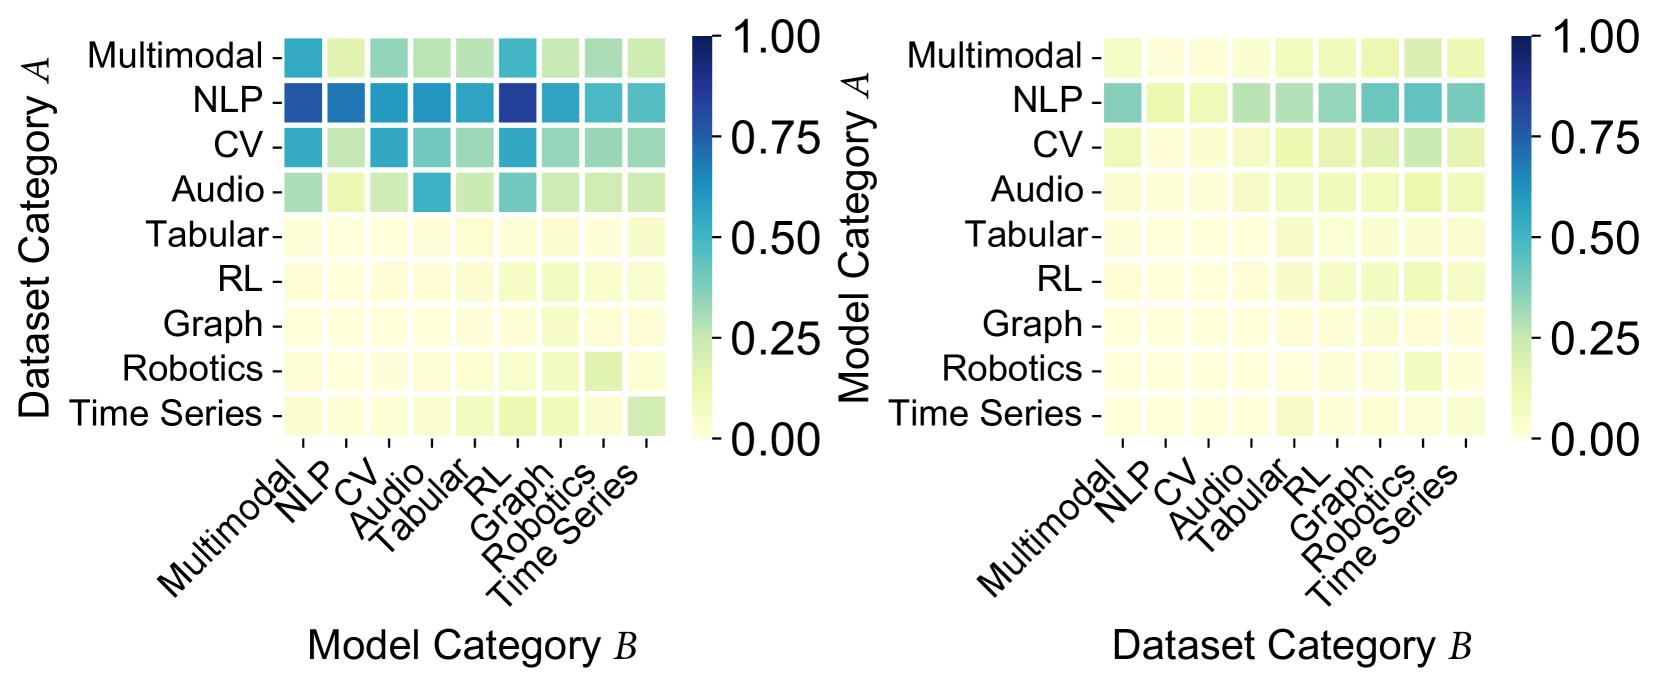
Figure 4. Conditional probability $P(A|B)$ of user co-likes.
<details>
<summary>x6.png Details</summary>
### Visual Description
## Bar Charts: Description Length vs. Number of Models/Datasets
### Overview
The image presents two bar charts side-by-side. Both charts depict the distribution of description lengths, with the left chart showing the number of models and the right chart showing the number of datasets. The y-axis uses a logarithmic scale.
### Components/Axes
**Left Chart (Models):**
* **Title:** "# of Models"
* **Y-axis:** "# of Models" (logarithmic scale from 10^3 to 10^5)
* **X-axis:** "Description Length"
* **X-axis Markers:** 0, 500, 1000, 1500, ">2000"
* **Bar Color:** Light Blue
**Right Chart (Datasets):**
* **Title:** "# of Datasets"
* **Y-axis:** "# of Datasets" (logarithmic scale from 10^3 to 10^5)
* **X-axis:** "Description Length"
* **X-axis Markers:** 0, 500, 1000, 1500, ">2000"
* **Bar Color:** Light Green
### Detailed Analysis
**Left Chart (Models):**
* **Trend:** The number of models decreases as the description length increases, with a spike at ">2000".
* **Approximate Values:**
* Description Length 0: ~2.5 * 10^5
* Description Length 500: ~4 * 10^4
* Description Length 1000: ~1.5 * 10^5
* Description Length 1500: ~2 * 10^3
* Description Length >2000: ~1 * 10^4
**Right Chart (Datasets):**
* **Trend:** The number of datasets generally decreases as the description length increases, with local maxima at 0, 1500, and >2000.
* **Approximate Values:**
* Description Length 0: ~2 * 10^5
* Description Length 500: ~5 * 10^3
* Description Length 1000: ~7 * 10^2
* Description Length 1500: ~4 * 10^3
* Description Length >2000: ~1.5 * 10^3
### Key Observations
* Both charts show a high concentration of models and datasets with shorter description lengths.
* The number of models with description length around 1000 is higher than expected given the general trend.
* There is a noticeable increase in both models and datasets with description lengths greater than 2000.
### Interpretation
The data suggests that shorter descriptions are more common for both models and datasets. The spike at ">2000" could indicate a category of models and datasets with very long, potentially detailed descriptions. The difference in distribution between models and datasets at description length 1000 suggests that models may have a preference for descriptions of this length. The overall trend indicates a preference for concise descriptions, possibly due to ease of understanding or storage limitations.
</details>
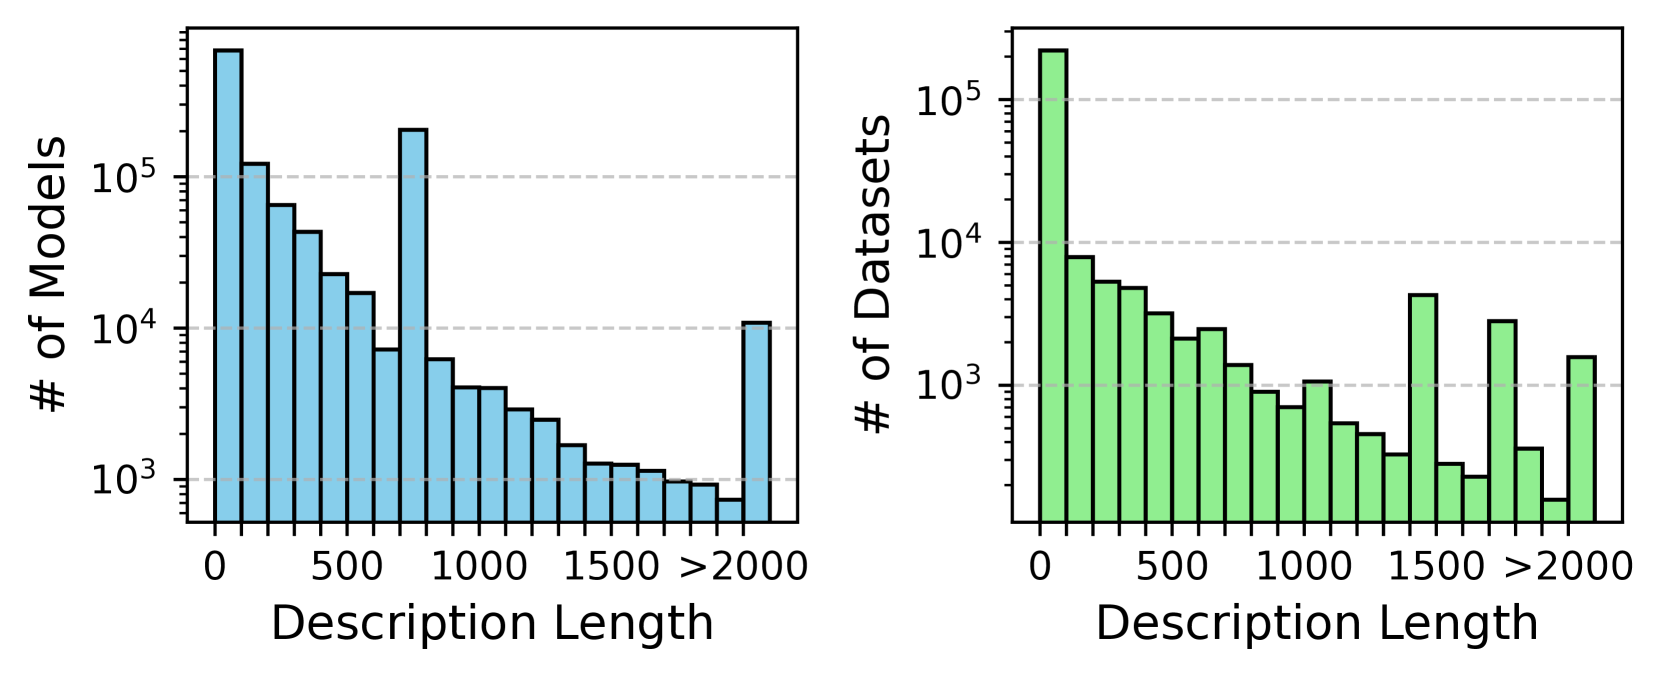
Figure 5. Description length of Model and Dataset.
3.2. Statistics and Analysis
Distribution of Node and Relation Types. Figure 3 shows the distribution of node and relation types in $\mathsf{HuggingKG}$ . Of the 2,614,270 nodes, Model makes up 46.0%, followed by User (27.9%) and Space (11.8%). Smaller node types such as Task (0.0%) and Paper (0.6%) are important for identifying the characteristics of the resources. Among the 6,246,353 edges, user interactions such as Like (31.5%) and Publish (28.8%) dominate. Edges about model evolution, e.g., Adapter (2.5%), Finetune (1.7%), highlight the technical connections in the community. These patterns reflect a community-driven environment focused on user activity and model interoperability.
Resource Contextualization. To analyze patterns of user interest, we compute the conditional probabilities $P(A|B)$ of user co-likes for Model and Dataset across categories, as shown in Figure 4. NLP is the most popular research area, with users from other fields showing a strong interest in NLP resources. RL, in particular, is highly involved in NLP, likely due to advances in reinforcement learning with human feedback (RLHF) with large language models (LLMs). The multimodal community is also interested in NLP, CV, and audio resources. A comparison of Figures 4(a) and 4(b) shows clear differences in interest distribution, both within and between resource types. For example, a strong interest in NLP models is from users who like robotics datasets instead of NLP or RL, reflecting the intersection of embodied intelligence and LLMs. These patterns suggest that $\mathsf{HuggingKG}$ captures valuable information on user interests, useful for tasks like resource recommendation and trend prediction.
Textual Attributes. In $\mathsf{HuggingKG}$ , the average length of the description is 270.2 words for Model and 134.1 words for Dataset, much longer than 8.1 words in (Cao et al., 2021). The longest Model description exceeds 2.5M words, and the longest Dataset description exceeds 400K words. As shown in Figure 5, the description length distribution exhibits a long tail, with 57.2% of Model and 33.4% of Dataset lacking descriptions. Peaks at 700–800 words for Model and 1500–1600 words for Dataset are mostly due to template usage. These patterns highlight the challenges of incomplete documentation and information overload, underlining the need for methods that improve metadata quality by combining textual and graph-based data.
4. $\mathsf{HuggingBench}$ Benchmark
By combining search needs in open source resource communities with the structured information available in $\mathsf{HuggingKG}$ , we identify three IR tasks in this domain: resource recommendation (Section 4.1), task classification (Section 4.2), and model tracing (Section 4.3). We develop their test collections, which result in a novel benchmark, $\mathsf{HuggingBench}$ .
4.1. Resource Recommendation
Application Scenario. For ML practitioners, selecting an appropriate pre-trained model from thousands of options on platforms like Hugging Face is a significant challenge. For example, an NLP practitioner working on sentiment analysis requires a model tailored to their dataset and task. The resource recommendation task addresses this by recommending models based on user interaction history. It enables practitioners to efficiently identify and deploy the most suitable model, reducing time and effort in resource discovery.
Task Definition. The resource recommendation task can be framed as a hybrid problem that integrates general collaborative filtering, social recommendation, and KG-based recommendation.
For general collaborative filtering, let $\mathcal{U}=\{u_{1},u_{2},...,u_{M}\}$ represent the set of users and $\mathcal{I}=\{i_{1},i_{2},...,i_{N}\}$ represent the set of items (e.g., Model, Dataset, and Space). The user-item interaction matrix $\mathbf{Y}=\{y_{ui}\mid u∈\mathcal{U},i∈\mathcal{I}\}$ is captured from Like edges, where $y_{ui}=1$ if User $u$ liked item $i$ , and $y_{ui}=0$ otherwise. This matrix serves as the foundation for general recommendation systems.
Social recommendation is facilitated by using social relationships between users represented by a graph $\mathcal{S}=\{s_{uv}\mid u,v∈\mathcal{U}\}$ where $s_{uv}=1$ indicates a Follow edge between User nodes $u$ and $v$ .
KG-based recommendation draws on structured external knowledge from the $\mathsf{HuggingKG}$ knowledge graph, denoted $\mathcal{G}=(\mathcal{V},\mathcal{E})$ , which encodes external entities (e.g., Paper, Collection) and their interrelations as edges (a.k.a. triples in this context).
The objective of the recommendation task is to learn a prediction function $\hat{y}_{ui}=\mathcal{F}(u,i)$ , where $\hat{y}_{ui}$ is the predicted probability that user $u$ interacts with item $i$ . The goal is to rank the items for each user based on these predicted probabilities, prioritizing those with the highest likelihood of interaction to ensure that the most relevant items appear at the top of the recommendation list.
Table 2. Test collection for resource recommendation. Avg. means the average number of interactions per user.
| | #Users | #Items | #Interactions | Avg. |
| --- | --- | --- | --- | --- |
| Model | 29,720 | 16,200 | 667,365 | 22.46 |
| Dataset | 5,072 | 3,634 | 100,561 | 19.83 |
| Space | 14,171 | 5,246 | 297,294 | 20.98 |
| Total | 38,624 | 25,080 | 1,065,220 | 27.58 |
Table 3. External KGs for KG-based recommendation.
| | 2hop | 1hop | Homo | Publish |
| --- | --- | --- | --- | --- |
| #Nodes | 1,242,578 | 462,213 | 25,080 | 31,754 |
| #Edges (Triples) | 3,063,081 | 1,180,911 | 28,346 | 25,078 |
| #Relations | 27 | 27 | 7 | 6 |
Dataset Construction. Based on $\mathsf{HuggingKG}$ , we extract a bipartite graph representing the Like edges between User nodes and three types of item nodes (Model, Dataset, and Space). Following standard practices in recommendation tasks, we derive a 5-core subgraph (where each node has at least 5 edges to other nodes) from this bipartite graph. Subsequently, we partition the liked-item list for each user into training, validation, and test sets with a split of 60%, 20%, and 20%, respectively. Table 2 shows statistics of the resource recommendation test collection.
To support social recommendation, we introduce 84,913 Follow edges between User nodes in the test collection as external Social information. To support KG-based recommendation, we consider three types of subgraphs of $\mathsf{HuggingKG}$ as external KGs: 1hop / 2hop are 1-step/2-step neighborhood subgraphs from item-aligned KG nodes, Homo is the subgraph induced from all item nodes, and Publish is the relation-specific subgraph induced from the Publish edges. Table 3 shows statistics of these external KGs.
4.2. Task Classification
Application Scenario. Platform curators face the challenge of organizing and tagging models and datasets to improve searchability and usability. For example, a newly uploaded model without clear task annotations becomes difficult for users to discover. The task classification task automates this process by analyzing the metadata and structure information from the platforms to classify the models into relevant tasks (e.g., “text classification” or “named entity recognition”). This ensures proper categorization and improves accessibility for users seeking specific features.
Task Definition. The task of classifying Model and Dataset nodes by their associated Task (according to Defined For edges) is framed as a multi-label attributed node classification problem, where each instance can be assigned multiple labels from a set $\mathcal{L}=\{l_{1},l_{2},...,l_{K}\}$ . The input consists of a graph $\mathcal{G}=(\mathcal{V},\mathcal{E})$ , where the nodes $\mathcal{V}$ represent Model and Dataset nodes, and the edges $\mathcal{E}$ captured include Finetune edges between Model nodes, Trained Or Finetuned On edges between Model nodes and Dataset nodes, etc. Additionally, a feature matrix $\mathbf{X}∈\mathbb{R}^{|\mathcal{V}|× d}$ encodes node features such as textual descriptions or metadata. The output for each node $v∈\mathcal{V}$ is a binary vector $\mathbf{y}_{v}∈\{0,1\}^{K}$ , where $y_{v,k}=1$ indicates an association with task $t_{k}$ . The goal is to learn a function $\hat{\mathbf{y}}_{v}=\mathcal{F}(\mathcal{G},\mathbf{X})$ that accurately predicts task labels, using both graph structure and textual information, while optimizing precision and recall across all labels.
Table 4. Test collection for task classification.
| | #Nodes | #Edges | #Labels | #Train | #Valid | #Test |
| --- | --- | --- | --- | --- | --- | --- |
| Model | 145,466 | 131,274 | 50 | 103,276 | 19,167 | 27,974 |
| Dataset | 6,969 | - | 48 | 6,792 | 1,501 | 708 |
| Total | 152,435 | 166,199 | 52 | 110,068 | 20,668 | 28,682 |
Dataset Construction. We first select the Model and Dataset nodes in the graph that have associated task labels, based on the Defined For edges between the Model / Dataset nodes and the Task nodes in $\mathsf{HuggingKG}$ . We then add all edges between these nodes and remove any isolated nodes. To better align the task with the scenario of helping the community website automatically predict the task types of newly created models or datasets, we divide the data into training, validation, and test sets based on the creation dates of Model and Dataset. Due to the faster release rate of models compared to datasets, we set a longer time range for Dataset than for Model. Specifically, we select Model nodes created between 2024-08-15 and 2024-10-15, and Dataset nodes created between 2024-04-15 and 2024-08-15 for the validation set. The test set comprises Model nodes created between 2024-10-15 and 2024-12-15, as well as Dataset nodes created between 2024-08-15 and 2024-12-15. The remaining Model and Dataset nodes, released before these periods, are used as the training set. Table 4 shows statistics of the task classification test collection.
4.3. Model Tracing
Application Scenario. Researchers often need to investigate the lineage and dependencies of model architectures, such as understanding the evolution of GPT-3. The model tracing task facilitates this by tracing the base model of a model, identifying base models (e.g., GPT-2) and related variants, along with their associated datasets and tasks. This capability supports in-depth analysis of model development histories and their connections within the community, aiding reproducibility and innovation.
Task Definition. The model tracing task can be formally defined as a specialized link prediction problem within a heterogeneous graph $\mathcal{G}=(\mathcal{V},\mathcal{E})$ , where $\mathcal{V}$ represents the set of nodes, including Model and other nodes (e.g., Dataset, Space), and $\mathcal{E}$ represents the set of edges. Each edge is represented as a triple $(h,r,t)$ , where $h∈\mathcal{V}$ is the head node, $r∈\mathcal{R}$ is the relation (i.e., Adapter, Finetune, Merge or Quantize between Model nodes), and $t∈\mathcal{V}$ is the tail node. Unlike general link prediction tasks, this task specifically predicts the reverse relation between Model nodes: given a relation $r$ and a tail node $t$ , the goal is to predict the corresponding head node $h$ that completes the triple $(h,r,t)$ . The output of the task is a probability distribution $\mathbf{y}∈[0,1]^{|\mathcal{V}|}$ on all candidate head nodes, with $y_{h}$ indicating the probability that node $h$ is the correct match for the triple $(h,r,t)$ . The objective is to learn a function $\hat{\mathbf{y}}_{(r,t)}=\mathcal{F}(\mathcal{G},r,t)$ that maximizes the likelihood of correctly identifying the true head node $h^{*}$ for the triple $(h^{*},r,t)$ .
Table 5. Test collection for model tracing.
| | #Train | #Valid | #Test |
| --- | --- | --- | --- |
| Adapter | 565 | 65 | 80 |
| Finetune | 15,639 | 1,944 | 1,935 |
| Merge | 138 | 24 | 17 |
| Quantize | 178 | 16 | 23 |
| Total | 16,520 | 2,049 | 2,055 |
Dataset Construction. Due to the large size of the complete $\mathsf{HuggingKG}$ , we extract a subgraph to construct the test collection for model tracing. We select the Model nodes associated with the task type “text classification”. Next, we identify the triples where these nodes appear as the head or tail node, incorporating the other node in the triple into the node set $\mathcal{V}$ . We then include all edges between these nodes to form the edge set $\mathcal{E}$ . The resulting subgraph consists of 121,404 nodes, 339,429 edges, and 30 relations.
We subsequently partition the inter- Model edges into training, validation, and test sets with a split of 80%, 10%, and 10%, respectively. Table 5 shows statistics of the model tracing test collection.
Table 6. Evaluation results of resource recommendation.
| Method | KG | Recall@5 | Recall@10 | Recall@20 | Recall@40 | NDCG@5 | NDCG@10 | NDCG@20 | NDCG@40 |
| --- | --- | --- | --- | --- | --- | --- | --- | --- | --- |
| General Collaborative Filtering | | | | | | | | | |
| LightGCN | - | 0.0856 | 0.1301 | 0.1932 | 0.2759 | 0.0868 | 0.1003 | 0.1192 | 0.1413 |
| HCCF | - | 0.0834 | 0.1254 | 0.1820 | 0.2504 | 0.0847 | 0.0975 | 0.1143 | 0.1328 |
| SimGCL | - | 0.0999 | 0.1515 | 0.2186 | 0.3010 | 0.0998 | 0.1158 | 0.1358 | 0.1581 |
| LightGCL | - | 0.1033 | 0.1558 | 0.2228 | 0.3017 | 0.1035 | 0.1198 | 0.1398 | 0.1611 |
| AutoCF | - | 0.1003 | 0.1530 | 0.2190 | 0.3039 | 0.1012 | 0.1174 | 0.1371 | 0.1598 |
| DCCF | - | 0.0985 | 0.1493 | 0.2167 | 0.3003 | 0.0983 | 0.1142 | 0.1343 | 0.1567 |
| Social Recommendation | | | | | | | | | |
| MHCN | Social | 0.0979 | 0.1490 | 0.2162 | 0.3007 | 0.0998 | 0.1154 | 0.1353 | 0.1579 |
| DSL | 0.0932 | 0.1425 | 0.2123 | 0.2986 | 0.0948 | 0.1099 | 0.1307 | 0.1538 | |
| KG-Based Recommendation | | | | | | | | | |
| KGIN | 1hop | 0.0001 | 0.0004 | 0.0010 | 0.0017 | 0.0002 | 0.0003 | 0.0005 | 0.0007 |
| KGCL | 0.0993 | 0.1490 | 0.2135 | 0.2918 | 0.1009 | 0.1160 | 0.1351 | 0.1563 | |
| KGRec | 0.0558 | 0.0897 | 0.1395 | 0.2076 | 0.0575 | 0.0681 | 0.0832 | 0.1014 | |
| KGIN | 2hop | 0.0002 | 0.0004 | 0.0008 | 0.0016 | 0.0003 | 0.0004 | 0.0005 | 0.0007 |
| KGCL | 0.1007 | 0.1510 | 0.2165 | 0.2959 | 0.1016 | 0.1170 | 0.1364 | 0.1579 | |
| KGRec | 0.0597 | 0.0941 | 0.1423 | 0.2122 | 0.0625 | 0.0729 | 0.0872 | 0.1057 | |
| KGIN | Homo | 0.0061 | 0.0096 | 0.0146 | 0.0219 | 0.0065 | 0.0076 | 0.0091 | 0.0111 |
| KGCL | 0.1054 | 0.1578 | 0.2237 | 0.3059 | 0.1058 | 0.1220 | 0.1416 | 0.1637 | |
| KGRec | 0.0628 | 0.0985 | 0.1476 | 0.2106 | 0.0638 | 0.0751 | 0.0898 | 0.1067 | |
| KGIN | Publish | 0.0002 | 0.0003 | 0.0007 | 0.0016 | 0.0002 | 0.0003 | 0.0004 | 0.0007 |
| KGCL | 0.1036 | 0.1543 | 0.2205 | 0.3011 | 0.1038 | 0.1195 | 0.1392 | 0.1609 | |
| KGRec | 0.0609 | 0.0941 | 0.1385 | 0.2002 | 0.0636 | 0.0734 | 0.0863 | 0.1027 | |
5. Evaluation
We evaluate with $\mathsf{HuggingBench}$ . All experiments are conducted on a server with four NVIDIA Tesla V100 SXM2 32 GB GPUs.
5.1. Resource Recommendation
Evaluation Metrics. Following standard practices in recommender systems (Ren et al., 2024b; He et al., 2020), we use Recall@ $K$ and NDCG@ $K$ as evaluation metrics to evaluate the ranked list of recommended items. The value of $K$ is set to 5, 10, 20, and 40 for the evaluation.
Baselines. Following common practice in recommendation (Ren et al., 2024b, a), we select six representative general collaborative filtering methods, including four graph-based methods: LightGCN (He et al., 2020), HCCF (Xia et al., 2022), SimGCL (Yu et al., 2022), and LightGCL (Cai et al., 2023) and two representation learning methods: AutoCF (Xia et al., 2023) and DCCF (Ren et al., 2023). These methods rely on the bipartite user-item graph for interaction modeling. We also adopt two state-of-the-art social recommendation methods: MHCN (Yu et al., 2021) and DSL (Wang et al., 2023). These methods introduce the social graph to capture richer user preferences. In addition, we employ three KG-based recommendation methods: KGIN (Wang et al., 2021), KGCL (Yang et al., 2022), and KGRec (Yang et al., 2023). These methods utilize a unified heterogeneous structure that aligns items in the bipartite graph with nodes from external KGs. We use SSLRec https://github.com/HKUDS/SSLRec (Ren et al., 2024b) to implement the above methods.
Implementation Details. For all baseline models, the representation dimension is set to 64. Each model is trained for up to 100 epochs, with a fixed batch size of 4,096 and early stopping based on MRR@5 on the validation set. Validation is performed every 3 epochs, and the patience of early stopping is set to 5. We perform a grid search to select the optimal learning rate from {1e-3, 1e-4, 1e-5} and the number of GNN layers from {2, 3}.
Evaluation Results. As shown in Table 6, among the general collaborative filtering methods, LightGCL achieves the best performance, suggesting that interaction graph augmentation through singular value decomposition provides a strong baseline.
For social recommendation, MHCN outperforms DSL by +4.80% in Recall@ $5$ , showing the effectiveness of multi-channel hypergraph convolution and self-supervised learning. However, it surpasses only two of the six general collaborative filtering methods, indicating that adding social data does not secure improvement.
For KG-based recommendation, KGCL consistently outperforms others in all subgraph types, highlighting the benefits of KG augmentation and contrastive learning. Homo subgraph yields the best results, suggesting that item-related nodes provide high-quality context. In sparse graphs, KGCL is robust due to the use of contrastive learning with well-defined positive and negative pairs, which improves the quality of learned representations. In contrast, KGIN’s performance is highly sensitive to its negative sampling strategy and hyperparameter setting, often instable in sparse or cold-start scenarios. KGRec relies heavily on the quality of entity representations and performs moderately when the graph density is low.
Moreover, KG-based methods exhibit higher variance, with Recall@ $5$ having a standard deviation of $0.0431$ , compared to $0.0084$ and $0.0033$ for social and collaborative filtering methods. This suggests that applying KG-based methods requires careful selection and tuning of the specific approach based on data characteristics such as graph density and relation sparsity.
Comparison with Other Benchmarks. To investigate the underwhelming performance of social recommendation methods, we compare the social relation statistics of our test collection with those of the LastFM, Douban and Yelp datasets where MHCN has demonstrated strong performance (Yu et al., 2021). LastFM includes $1,892$ users with $25,434$ relations, Douban has $2,848$ users with $35,770$ relations, and Yelp contains $19,535$ users with $864,157$ relations, all of which are considerably denser than our test collection, which consists of $38,624$ users and $84,913$ relations. MHCN relies on dense connections to form meaningful hyperedges, facilitate contrastive learning, and effectively propagate signals. Similarly, despite KGIN’s strong performance on the Amazon-Book, LastFM, and Alibaba datasets (Wang et al., 2021), it performs the worst on our test collection. A possible factor is the KG sparsity: Amazon-Book has $2,557,746$ triples and $88,572$ nodes, LastFM has $464,567$ triples and $58,266$ nodes, and Alibaba has $279,155$ triples and $59,156$ nodes, while our dataset is significantly sparser (Table 3). KGIN relies on dense multi-hop paths ( $≥ 3$ hops) for user-item semantics, which are often missing in sparse KGs. Compared with the aforementioned benchmarks, the metrics of various baselines on our test collection are generally lower, reflecting the difficulty of this recommendation task. In summary, because our test collection provides more domain-specific external relations, which are relatively sparse and specialized compared to relations aligned from huge KGs such as Wikidata, it provides new challenges and benchmarks for recommendation methods that use special additional information for domain adaptation.
5.2. Task Classification
Evaluation Metrics. Following standard practices in multi-label node classification (Cen et al., 2023), we use Micro-F1.
Baselines. We select nine representative GNN-based methods for node classification. GCN (Kipf and Welling, 2017), GAT (Velickovic et al., 2018), and GraphSAGE (Hamilton et al., 2017) establish fundamental architectures with different aggregation schemes. Memory and computation optimization approaches are represented by GraphSAINT (Hamilton et al., 2017), RevGCN (Li et al., 2021), and RevGAT (Li et al., 2021). The remaining methods (APPNP (Klicpera et al., 2019), GRAND (Feng et al., 2020), GCNII (Chen et al., 2020)) focus on addressing specific challenges like label propagation, robustness, and over-smoothing in deep GNNs. We use CogDL (Cen et al., 2023) https://github.com/THUDM/cogdl to implement the above methods.
For node feature initialization, we try the following settings:
- Binary: Binary one-dimensional vectors for distinguishing between Model (0) and Dataset (1).
- Pre-trained Text Embeddings: Embeddings of node description attributes generated using base versions of BERT https://huggingface.co/google-bert/bert-base-uncased and BGE. https://huggingface.co/BAAI/bge-base-en-v1.5
- Finetuned Text Embeddings: Node description attribute embeddings derived from the aforementioned models after finetuning for 1 epoch. We perform a grid search to select the optimal learning rate from {1e-4, 5e-5, 1e-5} and batch size from {8, 16}. The resulting models are denoted as BERT (ft) and BGE (ft).
Implementation Details. The hidden size dimension is set to 1,024 for all baselines based on GNN, except GAT and RevGAT, for which it is set to 256 to accommodate GPU memory limitations. Each GNN model is trained for up to 500 epochs, with early stopping based on the Micro-F1 score on the validation set. The patience of validation early stopping is set to 100 epochs. For the training process, the batch size is set at 4,096. We perform a grid search to select the optimal learning rate from {1e-3, 1e-4, 1e-5}, weight decay from {0, 1e-5, 1e-4}, and the number of GNN layers from {2, 3, 4}.
Table 7. Evaluation results (Micro-F1) of task classification.
| Method | Binary | BERT | BERT (ft) | BGE | BGE (ft) |
| --- | --- | --- | --- | --- | --- |
| GCN | 0.0662 | 0.7620 | 0.8291 | 0.7411 | 0.8522 |
| GAT | 0.0390 | 0.5105 | 0.8125 | 0.5444 | 0.8261 |
| GRAND | 0.1228 | 0.1297 | 0.6089 | 0.2646 | 0.4532 |
| GraphSAGE | 0.1800 | 0.5341 | 0.8845 | 0.8199 | 0.8830 |
| APPNP | 0.0448 | 0.7297 | 0.8304 | 0.7571 | 0.8419 |
| GCNII | 0.1149 | 0.6456 | 0.8836 | 0.7779 | 0.8802 |
| GraphSAINT | 0.0579 | 0.2703 | 0.8342 | 0.0540 | 0.8251 |
| RevGCN | 0.1071 | 0.6763 | 0.8851 | 0.8039 | 0.8770 |
| RevGAT | 0.0335 | 0.7412 | 0.8849 | 0.7569 | 0.8716 |
Evaluation Results. As shown in Table 7, all models demonstrate limited performance with binary features, with GraphSAGE achieving the best score of only 0.1800. When using pre-trained embeddings, we observe significant improvements across most models, with GCN achieving 0.7620 with BERT embeddings and GraphSAGE reaching 0.8199 with BGE embeddings. For finetuned embeddings, the performance improves substantially, with RevGCN achieving 0.8851 and GraphSAGE reaching 0.8830 with finetuned BERT and BGE respectively, followed closely by GCNII. The experimental results clearly demonstrate that using pre-trained text embeddings as initial features significantly enhances model performance, with an average improvement of 0.5391 in the Micro-F1 score. Furthermore, finetuning the embeddings for task-specific feature learning consistently brings additional gains across all methods and embeddings, with an average improvement of 0.2543 and 0.1871 over BERT and BGE pre-trained embeddings, respectively, suggesting that incorporating domain knowledge through finetuning is important for improving performance in this task.
We notice an interesting pattern where simpler architectures like GraphSAGE outperform sophisticated models such as GCNII and RevGAT, particularly with BGE embeddings. This suggests that complex architectural designs might not always be beneficial when working with high-quality pre-trained embeddings, as they may introduce noise or over-smoothing in the feature space.
Comparison with Other Benchmarks. We find that sampling-based models such as GRAND and GraphSAINT exhibit unexpectedly poor performance with pre-trained embeddings (0.1297 and 0.2703 with BERT, respectively), despite their effectiveness (Cen et al., 2023) in other multi-label node classification datasets such as ogbn-arxiv (Hu et al., 2020). This performance degradation might be attributed to their sampling strategies potentially disrupting the semantic relations encoded in the pre-trained embeddings. Compared with other commonly used benchmarks, the metrics of our test collection of various baselines are at a medium level (Cen et al., 2023). In summary, for such a new domain-specific classification task, it not only poses new challenges to text embedding models, but also generates new issues worthy of consideration for the GNN-based node classification methods.
Table 8. Evaluation results of model tracing.
| Method | MRR | Hit@1 | Hit@3 | Hit@5 | Hit@10 |
| --- | --- | --- | --- | --- | --- |
| Supervised | | | | | |
| RESCAL | 0.2694 | 0.2380 | 0.2667 | 0.2929 | 0.3470 |
| TransE | 0.5589 | 0.4496 | 0.6321 | 0.6973 | 0.7562 |
| DistMult | 0.2050 | 0.1421 | 0.2321 | 0.2735 | 0.3324 |
| ComplEx | 0.1807 | 0.1109 | 0.2122 | 0.2599 | 0.3066 |
| ConvE | 0.4739 | 0.3766 | 0.5119 | 0.5903 | 0.6735 |
| RotatE | 0.5317 | 0.4195 | 0.6029 | 0.6803 | 0.7392 |
| HittER | 0.3678 | 0.2900 | 0.4078 | 0.4657 | 0.5314 |
| Unsupervised | | | | | |
| ULTRA | 0.3373 | 0.1440 | 0.4803 | 0.5309 | 0.6672 |
| KG-ICL | 0.4008 | 0.3354 | 0.3792 | 0.4854 | 0.5938 |
5.3. Model Tracing
Evaluation Metrics. Following standard practices in link prediction (Cui et al., 2024; Sun et al., 2019), we use Mean Reciprocal Rank (MRR) and Hit@ $K$ as evaluation metrics for the model tracing experiments, with $K$ set to 1, 3, 5, and 10. As mentioned in Section 4.3, we only evaluate the results considering the given Model node as the tail node $t$ and the given relation $r$ to predict the head node $h$ .
Baselines. According to common practice in the field of link prediction (Broscheit et al., 2020; Galkin et al., 2024; Cui et al., 2024), we select seven supervised methods, including five embedding-based methods: RESCAL (Nickel et al., 2011), TransE (Bordes et al., 2013), DistMult (Yang et al., 2015), ComplEx (Trouillon et al., 2016), and RotatE (Sun et al., 2019) and two deep neural network-based methods: CNN-based ConvE (Dettmers et al., 2018a) and transformer-based HittER (Chen et al., 2021). Among these, TransE is one of the most classic methods, which simply represents nodes as continuous vectors in the embedding space and represents the relations between nodes as translation vectors from the head node to the tail node. We also adopt two recent unsupervised KG foundation models, ULTRA (Galkin et al., 2024) and KG-ICL (Cui et al., 2024). These models represent relations using relation graphs and prompt graphs, respectively, which encode nodes and their scores. Since they do not rely on specific learnable representation vectors for nodes or relations, they can directly utilize frozen pre-trained models on our test collection. We use LibKGE (Broscheit et al., 2020) https://github.com/uma-pi1/kge to implement supervised methods and use the official code https://github.com/DeepGraphLearning/ULTRA https://github.com/nju-websoft/KG-ICL of the two unsupervised models.
Implementation Details. For all the baseline methods, the representation dimension is set to 64. Each baseline is trained for up to 100 epochs, with early stopping based on the MRR score on the validation set. Validation is performed every 3 epochs, and the patience of early stopping is set to 5. For training process, the batch size is fixed at 256. We perform a grid search to select the optimal learning rate from {1e-2, 1e-3, 1e-4, 1e-5} and the number of GNN layers from {2, 3}.
Evaluation Results. The results for the model tracing task are presented in Table 8. Supervised models, particularly TransE, outperform all other methods, achieving the highest scores in all metrics. In contrast, bilinear models like RESCAL and DistMult, and neural models like ConvE, underperform due to their reliance on multiplicative interactions or convolutions, which fail to capture critical dependencies. In conclusion, simpler geometric transformations are better suited for this task.
For unsupervised models, KG-ICL excels in MRR and Hit@1, while ULTRA performs better in Hit@3/5/10 but struggles with accuracy in top-ranked predictions. This difference can be attributed to that ULTRA performs message passing across the entire graph, while KG-ICL initiates message passing from the head node, expanding one hop at each layer, which allows it to focus more on nearby nodes. As a result, KG-ICL achieves a higher Hit@1 score. In conclusion, unsupervised models exhibit a good trade-off between precision and recall for this task.
Comparison with Other Benchmarks. In contrast to the results of widely used KG link prediction benchmarks such as FB15k-237 (Toutanova and Chen, 2015) and WN18RR (Dettmers et al., 2018b), TransE performs the best among supervised methods. Although TransE is a classic and effective method, its linear modeling struggles with one-to-many relations (where a single head node and a relation can correspond to multiple tail nodes) (Sun et al., 2019). Consequently, many subsequent models focus on addressing this issue. We analyze the test sets of FB15k-237, WN18RR and our dataset, counting the number of answers corresponding to each (head node, relation) pair. The results show that FB15k-237 has an average of 399.82 answers, WN18RR has 24.57, while our dataset has only 1.04. It indicates that the answers in our test set are nearly unique, making TransE sufficient for our needs. More complex methods tend to focus on distinguishing similar nodes at the many end of one-to-many relations, resulting in suboptimal performance. Compared to the metrics of these baselines on FB15k-237 and WN18RR, the metrics on our test collection are generally lower, suggesting that our test collection is overall more challenging. In summary, the unique distribution of relations in our test collection makes model tracing difficult for existing methods and raises new requirements for approaches designed for this task.
6. Conclusion
Predicted Impact. $\mathsf{HuggingKG}$ and $\mathsf{HuggingBench}$ will enable impactful IR research activities, particularly in advancing resource recommendation and automatic management within open source communities. These resources not only advance well-established research areas (e.g., recommendation, classification, and KG), but also foster emerging domains related to LLM. For example, by introducing $\mathsf{HuggingKG}$ into the model selection step of methods such as HuggingGPT (Shen et al., 2023), it has the potential to improve the integration of AI tools for LLMs. Given their foundational nature, these resources are designed to remain relevant and useful over an extended period. To ensure long-term sustainability, we plan to release an updated version of $\mathsf{HuggingKG}$ periodically and have provided open source code for KG and benchmark construction, allowing the community to maintain and customize the resources for various use cases. The anticipated research user community spans multiple disciplines, including IR, ML, data mining, and software engineering, with a substantial base of current users. This community is expected to grow significantly in the coming years as the demand for structured knowledge and robust evaluation frameworks increases, driven by advances in the communities of LLM and AI tools. Taken together, these contributions position $\mathsf{HuggingKG}$ and $\mathsf{HuggingBench}$ as enduring assets for the academic and industrial communities.
Limitations and Future Work. Our resources have the following limitations to be addressed in future work. First, the data is currently limited to Hugging Face, which restricts the diversity of entities and relations. In future work, we plan to expand $\mathsf{HuggingKG}$ to include additional resource platforms such as GitHub and Kaggle to introduce more types of cross-platform entities and relations. This expansion will enable applications such as cross-domain entity alignment. Second, the test collections in $\mathsf{HuggingBench}$ are automatically generated from $\mathsf{HuggingKG}$ and lack tasks that require manual annotation, such as question answering (QA), limiting the breadth of the benchmark. To address this, we will focus on designing more advanced LLM agents to support annotation for IR tasks including QA and retrieval, or combining graph-based methods and manual annotations for richer benchmarks.
Acknowledgements. This work was supported by the Postgraduate Research & Practice Innovation Program of Jiangsu Province.
References
- (1)
- Bai et al. (2024) Shuotong Bai, Huaxiao Liu, Enyan Dai, and Lei Liu. 2024. Improving Issue-PR Link Prediction via Knowledge-Aware Heterogeneous Graph Learning. IEEE Trans. Software Eng. 50, 7 (2024), 1901–1920. doi: 10.1109/TSE.2024.3408448
- Bordes et al. (2013) Antoine Bordes, Nicolas Usunier, Alberto García-Durán, Jason Weston, and Oksana Yakhnenko. 2013. Translating Embeddings for Modeling Multi-relational Data. In Advances in Neural Information Processing Systems 26: 27th Annual Conference on Neural Information Processing Systems 2013. Proceedings of a meeting held December 5-8, 2013, Lake Tahoe, Nevada, United States. 2787–2795. https://proceedings.neurips.cc/paper/2013/hash/1cecc7a77928ca8133fa24680a88d2f9-Abstract.html
- Broscheit et al. (2020) Samuel Broscheit, Daniel Ruffinelli, Adrian Kochsiek, Patrick Betz, and Rainer Gemulla. 2020. LibKGE - A knowledge graph embedding library for reproducible research. In Proceedings of the 2020 Conference on Empirical Methods in Natural Language Processing: System Demonstrations, EMNLP 2020 - Demos, Online, November 16-20, 2020. 165–174. doi: 10.18653/V1/2020.EMNLP-DEMOS.22
- Cai et al. (2023) Xuheng Cai, Chao Huang, Lianghao Xia, and Xubin Ren. 2023. LightGCL: Simple Yet Effective Graph Contrastive Learning for Recommendation. In The Eleventh International Conference on Learning Representations, ICLR 2023, Kigali, Rwanda, May 1-5, 2023. https://openreview.net/forum?id=FKXVK9dyMM
- Cai et al. (2016) Xuyang Cai, Jiangang Zhu, Beijun Shen, and Yuting Chen. 2016. GRETA: Graph-Based Tag Assignment for GitHub Repositories. In 40th IEEE Annual Computer Software and Applications Conference, COMPSAC 2016, Atlanta, GA, USA, June 10-14, 2016. 63–72. doi: 10.1109/COMPSAC.2016.124
- Cao et al. (2021) Xianshuai Cao, Yuliang Shi, Han Yu, Jihu Wang, Xinjun Wang, Zhongmin Yan, and Zhiyong Chen. 2021. DEKR: Description Enhanced Knowledge Graph for Machine Learning Method Recommendation. In SIGIR ’21: The 44th International ACM SIGIR Conference on Research and Development in Information Retrieval, Virtual Event, Canada, July 11-15, 2021. 203–212. doi: 10.1145/3404835.3462900
- Cen et al. (2023) Yukuo Cen, Zhenyu Hou, Yan Wang, Qibin Chen, Yizhen Luo, Zhongming Yu, Hengrui Zhang, Xingcheng Yao, Aohan Zeng, Shiguang Guo, Yuxiao Dong, Yang Yang, Peng Zhang, Guohao Dai, Yu Wang, Chang Zhou, Hongxia Yang, and Jie Tang. 2023. CogDL: A Comprehensive Library for Graph Deep Learning. In Proceedings of the ACM Web Conference 2023, WWW 2023, Austin, TX, USA, 30 April 2023 - 4 May 2023. 747–758. doi: 10.1145/3543507.3583472
- Chapman et al. (2020) Adriane Chapman, Elena Simperl, Laura Koesten, George Konstantinidis, Luis-Daniel Ibáñez, Emilia Kacprzak, and Paul Groth. 2020. Dataset search: a survey. VLDB J. 29, 1 (2020), 251–272. doi: 10.1007/S00778-019-00564-X
- Chen et al. (2020) Ming Chen, Zhewei Wei, Zengfeng Huang, Bolin Ding, and Yaliang Li. 2020. Simple and Deep Graph Convolutional Networks. In Proceedings of the 37th International Conference on Machine Learning, ICML 2020, 13-18 July 2020, Virtual Event (Proceedings of Machine Learning Research, Vol. 119). 1725–1735. http://proceedings.mlr.press/v119/chen20v.html
- Chen et al. (2021) Sanxing Chen, Xiaodong Liu, Jianfeng Gao, Jian Jiao, Ruofei Zhang, and Yangfeng Ji. 2021. HittER: Hierarchical Transformers for Knowledge Graph Embeddings. In Proceedings of the 2021 Conference on Empirical Methods in Natural Language Processing, EMNLP 2021, Virtual Event / Punta Cana, Dominican Republic, 7-11 November, 2021. 10395–10407. doi: 10.18653/V1/2021.EMNLP-MAIN.812
- Cui et al. (2024) Yuanning Cui, Zequn Sun, and Wei Hu. 2024. A Prompt-Based Knowledge Graph Foundation Model for Universal In-Context Reasoning. In Advances in Neural Information Processing Systems 38: Annual Conference on Neural Information Processing Systems 2024, NeurIPS 2024, Vancouver, BC, Canada, December 10 - 15, 2024. http://papers.nips.cc/paper_files/paper/2024/hash/0d70af566e69f1dfb687791ecf955e28-Abstract-Conference.html
- Dettmers et al. (2018a) Tim Dettmers, Pasquale Minervini, Pontus Stenetorp, and Sebastian Riedel. 2018a. Convolutional 2D Knowledge Graph Embeddings. In Proceedings of the Thirty-Second AAAI Conference on Artificial Intelligence, (AAAI-18), the 30th innovative Applications of Artificial Intelligence (IAAI-18), and the 8th AAAI Symposium on Educational Advances in Artificial Intelligence (EAAI-18), New Orleans, Louisiana, USA, February 2-7, 2018. 1811–1818. doi: 10.1609/AAAI.V32I1.11573
- Dettmers et al. (2018b) Tim Dettmers, Pasquale Minervini, Pontus Stenetorp, and Sebastian Riedel. 2018b. Convolutional 2D Knowledge Graph Embeddings. In Proceedings of the Thirty-Second AAAI Conference on Artificial Intelligence, (AAAI-18), the 30th innovative Applications of Artificial Intelligence (IAAI-18), and the 8th AAAI Symposium on Educational Advances in Artificial Intelligence (EAAI-18), New Orleans, Louisiana, USA, February 2-7, 2018. AAAI Press, 1811–1818. doi: 10.1609/AAAI.V32I1.11573
- Feng et al. (2020) Wenzheng Feng, Jie Zhang, Yuxiao Dong, Yu Han, Huanbo Luan, Qian Xu, Qiang Yang, Evgeny Kharlamov, and Jie Tang. 2020. Graph Random Neural Networks for Semi-Supervised Learning on Graphs. In Advances in Neural Information Processing Systems 33: Annual Conference on Neural Information Processing Systems 2020, NeurIPS 2020, December 6-12, 2020, virtual. https://proceedings.neurips.cc/paper/2020/hash/fb4c835feb0a65cc39739320d7a51c02-Abstract.html
- Galkin et al. (2024) Mikhail Galkin, Xinyu Yuan, Hesham Mostafa, Jian Tang, and Zhaocheng Zhu. 2024. Towards Foundation Models for Knowledge Graph Reasoning. In The Twelfth International Conference on Learning Representations, ICLR 2024, Vienna, Austria, May 7-11, 2024. https://openreview.net/forum?id=jVEoydFOl9
- Hamilton et al. (2017) William L. Hamilton, Zhitao Ying, and Jure Leskovec. 2017. Inductive Representation Learning on Large Graphs. In Advances in Neural Information Processing Systems 30: Annual Conference on Neural Information Processing Systems 2017, December 4-9, 2017, Long Beach, CA, USA. 1024–1034. https://proceedings.neurips.cc/paper/2017/hash/5dd9db5e033da9c6fb5ba83c7a7ebea9-Abstract.html
- He et al. (2020) Xiangnan He, Kuan Deng, Xiang Wang, Yan Li, Yong-Dong Zhang, and Meng Wang. 2020. LightGCN: Simplifying and Powering Graph Convolution Network for Recommendation. In Proceedings of the 43rd International ACM SIGIR conference on research and development in Information Retrieval, SIGIR 2020, Virtual Event, China, July 25-30, 2020. 639–648. doi: 10.1145/3397271.3401063
- Hu et al. (2020) Weihua Hu, Matthias Fey, Marinka Zitnik, Yuxiao Dong, Hongyu Ren, Bowen Liu, Michele Catasta, and Jure Leskovec. 2020. Open Graph Benchmark: Datasets for Machine Learning on Graphs. In Advances in Neural Information Processing Systems 33: Annual Conference on Neural Information Processing Systems 2020, NeurIPS 2020, December 6-12, 2020, virtual.
- Kipf and Welling (2017) Thomas N. Kipf and Max Welling. 2017. Semi-Supervised Classification with Graph Convolutional Networks. In 5th International Conference on Learning Representations, ICLR 2017, Toulon, France, April 24-26, 2017, Conference Track Proceedings. https://openreview.net/forum?id=SJU4ayYgl
- Klicpera et al. (2019) Johannes Klicpera, Aleksandar Bojchevski, and Stephan Günnemann. 2019. Predict then Propagate: Graph Neural Networks meet Personalized PageRank. In 7th International Conference on Learning Representations, ICLR 2019, New Orleans, LA, USA, May 6-9, 2019. https://openreview.net/forum?id=H1gL-2A9Ym
- Lhoest et al. (2021) Quentin Lhoest, Albert Villanova del Moral, Yacine Jernite, Abhishek Thakur, Patrick von Platen, Suraj Patil, Julien Chaumond, Mariama Drame, Julien Plu, Lewis Tunstall, Joe Davison, Mario Sasko, Gunjan Chhablani, Bhavitvya Malik, Simon Brandeis, Teven Le Scao, Victor Sanh, Canwen Xu, Nicolas Patry, Angelina McMillan-Major, Philipp Schmid, Sylvain Gugger, Clément Delangue, Théo Matussière, Lysandre Debut, Stas Bekman, Pierric Cistac, Thibault Goehringer, Victor Mustar, François Lagunas, Alexander M. Rush, and Thomas Wolf. 2021. Datasets: A Community Library for Natural Language Processing. In Proceedings of the 2021 Conference on Empirical Methods in Natural Language Processing: System Demonstrations, EMNLP 2021, Online and Punta Cana, Dominican Republic, 7-11 November, 2021. 175–184. doi: 10.18653/V1/2021.EMNLP-DEMO.21
- Li et al. (2021) Guohao Li, Matthias Müller, Bernard Ghanem, and Vladlen Koltun. 2021. Training Graph Neural Networks with 1000 Layers. In Proceedings of the 38th International Conference on Machine Learning, ICML 2021, 18-24 July 2021, Virtual Event (Proceedings of Machine Learning Research, Vol. 139). 6437–6449. http://proceedings.mlr.press/v139/li21o.html
- Liu et al. (2023) Mingwei Liu, Chengyuan Zhao, Xin Peng, Simin Yu, Haofen Wang, and Chaofeng Sha. 2023. Task-Oriented ML/DL Library Recommendation Based on a Knowledge Graph. IEEE Trans. Software Eng. 49, 8 (2023), 4081–4096. doi: 10.1109/TSE.2023.3285280
- Longpre et al. (2024) Shayne Longpre, Robert Mahari, Anthony Chen, Naana Obeng-Marnu, Damien Sileo, William Brannon, Niklas Muennighoff, Nathan Khazam, Jad Kabbara, Kartik Perisetla, Xinyi Wu, Enrico Shippole, Kurt D. Bollacker, Tongshuang Wu, Luis Villa, Sandy Pentland, and Sara Hooker. 2024. A large-scale audit of dataset licensing and attribution in AI. Nat. Mac. Intell. 6, 8 (2024), 975–987. doi: 10.1038/S42256-024-00878-8
- Nguyen et al. (2024) Phuong T. Nguyen, Juri Di Rocco, Claudio Di Sipio, Mudita Shakya, Davide Di Ruscio, and Massimiliano Di Penta. 2024. Automatic Categorization of GitHub Actions with Transformers and Few-shot Learning. In Proceedings of the 18th ACM/IEEE International Symposium on Empirical Software Engineering and Measurement, ESEM 2024, Barcelona, Spain, October 24-25, 2024, Xavier Franch, Maya Daneva, Silverio Martínez-Fernández, and Luigi Quaranta (Eds.). ACM, 468–474. doi: 10.1145/3674805.3690752
- Ni et al. (2019) Jianmo Ni, Jiacheng Li, and Julian J. McAuley. 2019. Justifying Recommendations using Distantly-Labeled Reviews and Fine-Grained Aspects. In Proceedings of the 2019 Conference on Empirical Methods in Natural Language Processing and the 9th International Joint Conference on Natural Language Processing, EMNLP-IJCNLP 2019, Hong Kong, China, November 3-7, 2019. Association for Computational Linguistics, 188–197. doi: 10.18653/V1/D19-1018
- Nickel et al. (2011) Maximilian Nickel, Volker Tresp, and Hans-Peter Kriegel. 2011. A Three-Way Model for Collective Learning on Multi-Relational Data. In Proceedings of the 28th International Conference on Machine Learning, ICML 2011, Bellevue, Washington, USA, June 28 - July 2, 2011. 809–816. https://icml.cc/2011/papers/438_icmlpaper.pdf
- Paton et al. (2023) Norman W. Paton, Jiaoyan Chen, and Zhenyu Wu. 2023. Dataset Discovery and Exploration: A Survey. ACM Comput. Surv. 56, 4 (2023), 37 pages. doi: 10.1145/3626521
- Ren et al. (2024a) Xubin Ren, Wei Wei, Lianghao Xia, Lixin Su, Suqi Cheng, Junfeng Wang, Dawei Yin, and Chao Huang. 2024a. Representation learning with large language models for recommendation. In Proceedings of the ACM on Web Conference 2024. 3464–3475.
- Ren et al. (2024b) Xubin Ren, Lianghao Xia, Yuhao Yang, Wei Wei, Tianle Wang, Xuheng Cai, and Chao Huang. 2024b. SSLRec: A Self-Supervised Learning Framework for Recommendation. In Proceedings of the 17th ACM International Conference on Web Search and Data Mining, WSDM 2024, Merida, Mexico, March 4-8, 2024. 567–575. doi: 10.1145/3616855.3635814
- Ren et al. (2023) Xubin Ren, Lianghao Xia, Jiashu Zhao, Dawei Yin, and Chao Huang. 2023. Disentangled Contrastive Collaborative Filtering. In Proceedings of the 46th International ACM SIGIR Conference on Research and Development in Information Retrieval, SIGIR 2023, Taipei, Taiwan, July 23-27, 2023. 1137–1146. doi: 10.1145/3539618.3591665
- Shao et al. (2020) Huajie Shao, Dachun Sun, Jiahao Wu, Zecheng Zhang, Aston Zhang, Shuochao Yao, Shengzhong Liu, Tianshi Wang, Chao Zhang, and Tarek F. Abdelzaher. 2020. paper2repo: GitHub Repository Recommendation for Academic Papers. In WWW ’20: The Web Conference 2020, Taipei, Taiwan, April 20-24, 2020. 629–639. doi: 10.1145/3366423.3380145
- Shen et al. (2023) Yongliang Shen, Kaitao Song, Xu Tan, Dongsheng Li, Weiming Lu, and Yueting Zhuang. 2023. HuggingGPT: solving AI tasks with chatgpt and its friends in hugging face. In Proceedings of the 37th International Conference on Neural Information Processing Systems.
- Sipio et al. (2024) Claudio Di Sipio, Riccardo Rubei, Juri Di Rocco, Davide Di Ruscio, and Phuong T. Nguyen. 2024. Automated categorization of pre-trained models in software engineering: A case study with a Hugging Face dataset. In Proceedings of the 28th International Conference on Evaluation and Assessment in Software Engineering, EASE 2024, Salerno, Italy, June 18-21, 2024. ACM, 351–356. doi: 10.1145/3661167.3661215
- Sun et al. (2019) Zhiqing Sun, Zhi-Hong Deng, Jian-Yun Nie, and Jian Tang. 2019. RotatE: Knowledge Graph Embedding by Relational Rotation in Complex Space. In 7th International Conference on Learning Representations, ICLR 2019, New Orleans, LA, USA, May 6-9, 2019. https://openreview.net/forum?id=HkgEQnRqYQ
- Toutanova and Chen (2015) Kristina Toutanova and Danqi Chen. 2015. Observed versus latent features for knowledge base and text inference. In Proceedings of the 3rd Workshop on Continuous Vector Space Models and their Compositionality, CVSC 2015, Beijing, China, July 26-31, 2015. Association for Computational Linguistics, 57–66. doi: 10.18653/V1/W15-4007
- Trouillon et al. (2016) Théo Trouillon, Johannes Welbl, Sebastian Riedel, Éric Gaussier, and Guillaume Bouchard. 2016. Complex Embeddings for Simple Link Prediction. In Proceedings of the 33nd International Conference on Machine Learning, ICML 2016, New York City, NY, USA, June 19-24, 2016 (JMLR Workshop and Conference Proceedings, Vol. 48). 2071–2080. http://proceedings.mlr.press/v48/trouillon16.html
- Velickovic et al. (2018) Petar Velickovic, Guillem Cucurull, Arantxa Casanova, Adriana Romero, Pietro Liò, and Yoshua Bengio. 2018. Graph Attention Networks. In 6th International Conference on Learning Representations, ICLR 2018, Vancouver, BC, Canada, April 30 - May 3, 2018, Conference Track Proceedings. https://openreview.net/forum?id=rJXMpikCZ
- Vrandecic and Krötzsch (2014) Denny Vrandecic and Markus Krötzsch. 2014. Wikidata: a free collaborative knowledgebase. Commun. ACM 57, 10 (2014), 78–85. doi: 10.1145/2629489
- Wang et al. (2023) Tianle Wang, Lianghao Xia, and Chao Huang. 2023. Denoised Self-Augmented Learning for Social Recommendation. In Proceedings of the Thirty-Second International Joint Conference on Artificial Intelligence, IJCAI 2023, 19th-25th August 2023, Macao, SAR, China. 2324–2331. doi: 10.24963/IJCAI.2023/258
- Wang et al. (2021) Xiang Wang, Tinglin Huang, Dingxian Wang, Yancheng Yuan, Zhenguang Liu, Xiangnan He, and Tat-Seng Chua. 2021. Learning Intents behind Interactions with Knowledge Graph for Recommendation. In WWW ’21: The Web Conference 2021, Virtual Event / Ljubljana, Slovenia, April 19-23, 2021. 878–887. doi: 10.1145/3442381.3450133
- Xia et al. (2023) Lianghao Xia, Chao Huang, Chunzhen Huang, Kangyi Lin, Tao Yu, and Ben Kao. 2023. Automated Self-Supervised Learning for Recommendation. In Proceedings of the ACM Web Conference 2023, WWW 2023, Austin, TX, USA, 30 April 2023 - 4 May 2023. 992–1002. doi: 10.1145/3543507.3583336
- Xia et al. (2022) Lianghao Xia, Chao Huang, Yong Xu, Jiashu Zhao, Dawei Yin, and Jimmy X. Huang. 2022. Hypergraph Contrastive Collaborative Filtering. In SIGIR ’22: The 45th International ACM SIGIR Conference on Research and Development in Information Retrieval, Madrid, Spain, July 11 - 15, 2022. 70–79. doi: 10.1145/3477495.3532058
- Xu et al. (2023) Yueshen Xu, Yuhong Jiang, Xinkui Zhao, Ying Li, and Rui Li. 2023. Personalized Repository Recommendation Service for Developers with Multi-modal Features Learning. In IEEE International Conference on Web Services, ICWS 2023, Chicago, IL, USA, July 2-8, 2023. 455–464. doi: 10.1109/ICWS60048.2023.00064
- Yang et al. (2015) Bishan Yang, Wen-tau Yih, Xiaodong He, Jianfeng Gao, and Li Deng. 2015. Embedding Entities and Relations for Learning and Inference in Knowledge Bases. In 3rd International Conference on Learning Representations, ICLR 2015, San Diego, CA, USA, May 7-9, 2015, Conference Track Proceedings. http://arxiv.org/abs/1412.6575
- Yang et al. (2023) Yuhao Yang, Chao Huang, Lianghao Xia, and Chunzhen Huang. 2023. Knowledge Graph Self-Supervised Rationalization for Recommendation. In Proceedings of the 29th ACM SIGKDD Conference on Knowledge Discovery and Data Mining, KDD 2023, Long Beach, CA, USA, August 6-10, 2023. 3046–3056. doi: 10.1145/3580305.3599400
- Yang et al. (2022) Yuhao Yang, Chao Huang, Lianghao Xia, and Chenliang Li. 2022. Knowledge Graph Contrastive Learning for Recommendation. In SIGIR ’22: The 45th International ACM SIGIR Conference on Research and Development in Information Retrieval, Madrid, Spain, July 11 - 15, 2022. 1434–1443. doi: 10.1145/3477495.3532009
- Yu et al. (2021) Junliang Yu, Hongzhi Yin, Jundong Li, Qinyong Wang, Nguyen Quoc Viet Hung, and Xiangliang Zhang. 2021. Self-Supervised Multi-Channel Hypergraph Convolutional Network for Social Recommendation. In WWW ’21: The Web Conference 2021, Virtual Event / Ljubljana, Slovenia, April 19-23, 2021. 413–424. doi: 10.1145/3442381.3449844
- Yu et al. (2022) Junliang Yu, Hongzhi Yin, Xin Xia, Tong Chen, Lizhen Cui, and Quoc Viet Hung Nguyen. 2022. Are Graph Augmentations Necessary?: Simple Graph Contrastive Learning for Recommendation. In SIGIR ’22: The 45th International ACM SIGIR Conference on Research and Development in Information Retrieval, Madrid, Spain, July 11 - 15, 2022. 1294–1303. doi: 10.1145/3477495.3531937
- Zhang et al. (2019) Fanjin Zhang, Xiao Liu, Jie Tang, Yuxiao Dong, Peiran Yao, Jie Zhang, Xiaotao Gu, Yan Wang, Bin Shao, Rui Li, and Kuansan Wang. 2019. OAG: Toward Linking Large-scale Heterogeneous Entity Graphs. In Proceedings of the 25th ACM SIGKDD International Conference on Knowledge Discovery & Data Mining, KDD 2019, Anchorage, AK, USA, August 4-8, 2019. ACM, 2585–2595. doi: 10.1145/3292500.3330785
- Zhang et al. (2024) Fanjin Zhang, Shijie Shi, Yifan Zhu, Bo Chen, Yukuo Cen, Jifan Yu, Yelin Chen, Lulu Wang, Qingfei Zhao, Yuqing Cheng, Tianyi Han, Yuwei An, Dan Zhang, Weng Lam Tam, Kun Cao, Yunhe Pang, Xinyu Guan, Huihui Yuan, Jian Song, Xiaoyan Li, Yuxiao Dong, and Jie Tang. 2024. OAG-Bench: A Human-Curated Benchmark for Academic Graph Mining. In Proceedings of the 30th ACM SIGKDD Conference on Knowledge Discovery and Data Mining, KDD 2024, Barcelona, Spain, August 25-29, 2024. ACM, 6214–6225. doi: 10.1145/3637528.3672354