# DreamPRM: Domain-Reweighted Process Reward Model for Multimodal Reasoning
**Authors**:
- Qi Cao (University of California, San Diego)
- &Ruiyi Wang (University of California, San Diego)
- &Ruiyi Zhang (University of California, San Diego)
- &Sai Ashish Somayajula (University of California, San Diego)
- &Pengtao Xie (University of California, San Diego)
Abstract
Reasoning has substantially improved the performance of large language models (LLMs) on complicated tasks. Central to the current reasoning studies, Process Reward Models (PRMs) offer a fine-grained evaluation of intermediate reasoning steps and guide the reasoning process. However, extending PRMs to multimodal large language models (MLLMs) introduces challenges. Since multimodal reasoning covers a wider range of tasks compared to text-only scenarios, the resulting distribution shift from the training to testing sets is more severe, leading to greater generalization difficulty. Training a reliable multimodal PRM, therefore, demands large and diverse datasets to ensure sufficient coverage. However, current multimodal reasoning datasets suffer from a marked quality imbalance, which degrades PRM performance and highlights the need for an effective data selection strategy. To address the issues, we introduce DreamPRM, a domain-reweighted training framework for multimodal PRMs which employs bi-level optimization. In the lower-level optimization, DreamPRM performs fine-tuning on multiple datasets with domain weights, allowing the PRM to prioritize high-quality reasoning signals and alleviating the impact of dataset quality imbalance. In the upper-level optimization, the PRM is evaluated on a separate meta-learning dataset; this feedback updates the domain weights through an aggregation loss function, thereby improving the generalization capability of trained PRM. Extensive experiments on multiple multimodal reasoning benchmarks covering both mathematical and general reasoning show that test-time scaling with DreamPRM consistently improves the performance of state-of-the-art MLLMs. Further comparisons reveal that DreamPRM’s domain-reweighting strategy surpasses other data selection methods and yields higher accuracy gains than existing test-time scaling approaches. Notably, DreamPRM achieves a top-1 accuracy of 85.2% on the MathVista leaderboard using the o4-mini model, demonstrating its strong generalization in complex multimodal reasoning tasks.
Project Page: https://github.com/coder-qicao/DreamPRM
1 Introduction
<details>
<summary>x1.png Details</summary>
### Visual Description
## Bar Chart and Text Snippets: DreamPRM Performance and Question Examples
### Overview
The image presents a bar chart comparing the accuracy improvement of DreamPRM against PRM without data selection across five datasets. Additionally, it includes two example questions with associated metadata, illustrating different levels of difficulty and reasoning requirements.
### Components/Axes
**Left Side: Bar Chart**
* **Y-axis:** "Accuracy Improvement (%)" with a scale from 0 to 6, with implied increments of 1.
* **X-axis:** Datasets: WeMath, MMVet, MathVista, MMStar, MathVision.
* **Legend:** Located at the top-left:
* Blue: DreamPRM
* Yellow: PRM w/o data selection
* **Horizontal Line:** A dashed line is present at the y-axis value of 4, labeled "avg. = +4.0".
**Right Side: Question Examples**
* Two question examples are displayed, each including:
* Question text
* Multiple-choice options (A, B, C, D)
* Correct answer
* Dataset name and year
* Dataset difficulty (easy/hard)
* Accuracy on InternVL-2.5-MPO-8B
* Unnecessary modality (can/cannot answer without image)
* Requirements for reasoning (do/do not require complicated reasoning)
* Domain weight (Determined by DreamPRM)
### Detailed Analysis
**Bar Chart Data:**
* **WeMath:**
* DreamPRM (Blue): +5.7%
* PRM w/o data selection (Yellow): +2.5%
* **MMVet:**
* DreamPRM (Blue): +5.5%
* PRM w/o data selection (Yellow): +3.0%
* **MathVista:**
* DreamPRM (Blue): +3.5%
* PRM w/o data selection (Yellow): +1.8%
* **MMStar:**
* DreamPRM (Blue): +3.4%
* PRM w/o data selection (Yellow): +1.9%
* **MathVision:**
* DreamPRM (Blue): +1.7%
* PRM w/o data selection (Yellow): +0.2%
**Question Examples:**
* **Top Question:**
* Question: "What does the bird feed on?"
* Choices: A. zooplankton, B. grass, C. predator fish, D. none of the above
* Answer: C
* Dataset: AI2D (2016)
* Dataset difficulty: easy (InternVL-2.5-MPO-8B's accuracy 84.6%)
* Unnecessary modality: can answer without image
* Requirements for reasoning: do not require complicated reasoning
* Domain weight: 0.55 (Determined by DreamPRM)
* **Bottom Question:**
* Question: "Determine the scientific nomenclature of the organism shown in the primary image."
* Choices: A. Hemidactylus turcicus, B. Felis silvestris, C. Macropus agilis, D. None of the above
* Answer: D
* Dataset: M3CoT (2024)
* Dataset difficulty: hard (InternVL-2.5-MPO-8B's accuracy 62.1%)
* Unnecessary modality: cannot answer without image
* Requirements for reasoning ability: require complicated reasoning
* Domain weight: 1.49 (Determined by DreamPRM)
### Key Observations
* DreamPRM consistently outperforms PRM without data selection across all datasets.
* The average accuracy improvement of DreamPRM is +4.0%.
* The WeMath and MMVet datasets show the highest accuracy improvements with DreamPRM.
* The question examples illustrate the range of difficulty and reasoning requirements in the datasets.
* The domain weight is higher for the harder question, suggesting DreamPRM prioritizes more complex reasoning tasks.
### Interpretation
The bar chart demonstrates the effectiveness of DreamPRM in improving accuracy compared to a baseline PRM model. The question examples provide context for the types of tasks the model is evaluated on, highlighting the model's ability to handle both simple and complex reasoning. The domain weight assigned to each question suggests that DreamPRM is designed to focus on tasks requiring more sophisticated reasoning abilities. The higher domain weight for the "hard" question indicates that DreamPRM places greater emphasis on correctly answering questions that demand more complex reasoning processes.
</details>
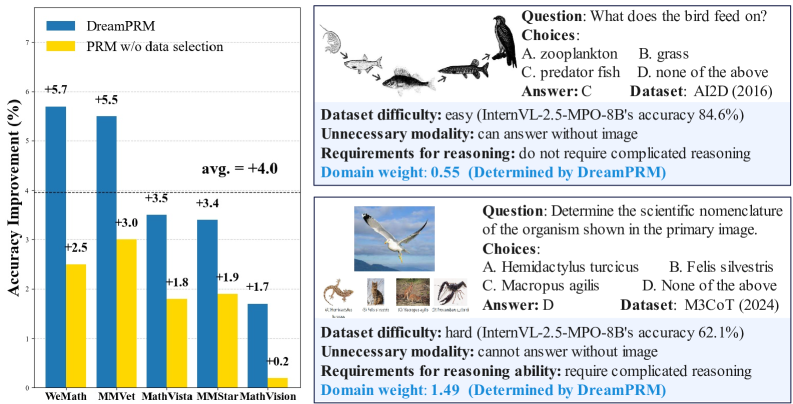
Figure 1: DreamPRM improves multimodal reasoning by mitigating the dataset quality imbalance problem. Left: On five benchmarks, DreamPRM outperforms base model (InternVL-2.5-8B-MPO [67]) by an average of $+4.0\%$ . DreamPRM also consistently surpasses Vanilla PRM trained without data selection. Right: Easy AI2D [23] questions (weight 0.55) vs. hard M3CoT [6] questions (weight 1.49) shows how DreamPRM prioritizes data that demand deeper reasoning - samples requiring knowledge from both textual and visual modalities for step-by-step logical deduction.
Reasoning [55] has significantly enhanced the logical and critical thinking capabilities of large language models (LLMs) [2, 8, 59, 49]. Post-training [45, 10] and test-time scaling strategies [44] enable sophisticated reasoning behaviors in LLMs and extend the length of Chain-of-Thoughts (CoTs) [71], thereby achieving strong results on challenging benchmarks [80, 47]. A key component of these advances is the Process Reward Models (PRMs) [29, 27], which provide fine-grained, step-wise supervision of the reasoning process and reliable selection of high-quality reasoning trajectories. These developments are proven highly effective for improving the performance of LLMs in complex tasks [38, 61].
Given the success with LLMs, a natural extension is to apply PRMs to multimodal large language models (MLLMs) [72, 28] to enhance their reasoning abilities. Early studies of multimodal PRMs demonstrate promise results, yet substantial challenges persist. Distinct from text-only inputs of LLMs, MLLMs must combine diverse visual and language signals: a high-dimensional, continuous image space coupled with discrete language tokens. This fusion dramatically broadens the input manifold and leads to more severe distribution shifts [56] from training to testing distributions. Consequently, directly utilizing PRM training strategies from the text domain [69, 37] underperforms, mainly due to the decreased generalizability [11] caused by the insufficient coverage of the multimodal input space.
A straightforward solution to this problem is to combine multiple datasets that emphasize different multimodal reasoning skills, thereby enlarging the sampling space. However, quality imbalance among existing multimodal reasoning datasets is more severe than in text-only settings: many contain noisy inputs such as unnecessary modalities [78] or questions of negligible difficulty [33], as illustrated in Fig. 1. Since these easy datasets contribute little to effective sampling, paying much attention to them can substantially degrade PRM performance. Therefore, an effective data selection strategy that filters out unreliable datasets and instances is crucial to training a high-quality multimodal PRM.
To overcome these challenges, we propose DreamPRM, a domain-reweighted training framework for multimodal PRMs. Inspired by domain-reweighting techniques [53, 12, 57], DreamPRM dynamically learns appropriate weights for each multimodal reasoning dataset, allowing them to contribute unequally during training. Datasets that contain many noisy samples tend to receive lower domain weights, reducing their influence on PRM parameter updates. Conversely, high-quality datasets are assigned higher weights and thus play a more important role in optimization. This domain-reweighting strategy alleviates the issue of dataset quality imbalances. DreamPRM adopts a bi-level optimization (BLO) framework [14, 31] to jointly learn the domain weights and PRM parameters. At the lower level, the PRM parameters are optimized with Monte Carlo signals on multiple training domains under different domain weights. At the upper level, the optimized PRM is evaluated on a separate meta domain to compute a novel aggregation function loss, which is used to optimized the domain weights. Extensive experiments on a wide range of multimodal reasoning benchmarks verify the effectiveness of DreamPRM.
Our contributions are summarized as follows:
- We propose DreamPRM, a domain-reweighted multimodal process reward model training framework that dynamically adjusts the importance of different training domains. We formulate the training process of DreamPRM as a bi-level optimization (BLO) problem, where the lower level optimizes the PRM via domain-reweighted fine-tuning, and the upper level optimizes domain weights with an aggregation function loss. Our method helps address dataset quality imbalance issue in multimodal reasoning, and improves the generalization ability of PRM.
- We conduct extensive experiments using DreamPRM on a wide range of multimodal reasoning benchmarks. Results indicate that DreamPRM consistently surpasses PRM baselines with other data selection strategies, confirming the effectiveness of its bi-level optimization based domain-reweighting strategy. Notably, DreamPRM achieves a top-1 accuracy of 85.2% on the MathVista leaderboard using the o4-mini model, demonstrating its strong generalization in complex multimodal reasoning tasks. Carefully designed evaluations further demonstrate that DreamPRM possesses both scaling capability and generalization ability to stronger models.
2 Related Works
Multimodal reasoning
Recent studies have demonstrated that incorporating Chain-of-Thought (CoT) reasoning [70, 25, 81] into LLMs encourages a step-by-step approach, thereby significantly enhancing question-answering performance. However, it has been reported that CoT prompting can’t be easily extended to MLLMs, mainly due to hallucinated outputs during the reasoning process [67, 82, 19]. Therefore, some post-training methods have been proposed for enhancing reasoning capability of MLLMs. InternVL-MPO [67] proposes a mixed preference optimization that jointly optimizes preference ranking, response quality, and response generation loss to improve the reasoning abilities. Llava-CoT [74] creates a structured thinking fine-tuning dataset to make MLLM to perform systematic step-by-step reasoning. Some efforts have also been made for inference time scaling. RLAIF-V [77] proposes a novel self-feedback guidance for inference-time scaling and devises a simple length-normalization strategy tackling the bias towards shorter responses. AR-MCTS [11] combines Monte-Carlo Tree Search (MCTS) and Retrival Augmented Generation (RAG) to guide MLLM search step by step and explore the answer space.
Process reward model
Process Reward Model (PRM) [29, 27, 38, 61] provides a more finer-grained verification than Outcome Reward Model (ORM) [9, 52], scoring each step of the reasoning trajectory. However, a central challenge in designing PRMs is obtaining process supervision signals, which require supervised labels for each reasoning step. Current approaches typically depend on costly, labor-intensive human annotation [29], highlighting the need for automated methods to improve scalability and efficiency. Math-Shepherd [64] proposes a method utilizing Monte-Carlo estimation to provide hard labels and soft labels for automatic process supervision. OmegaPRM [37] proposes a Monte Carlo Tree Search (MCTS) for finer-grained exploration for automatical labeling. MiPS [69] further explores the Monte Carlo estimation method and studies the aggregation of PRM signals.
Domain-reweighting
Domain reweighting methodologies are developed to modulate the influence of individual data domains, thereby enabling models to achieve robust generalization. Recently, domain reweighting has emerged as a key component in large language model pre-training, where corpora are drawn from heterogeneous sources. DoReMi [73] trains a lightweight proxy model with group distributionally robust optimization to assign domain weights that maximize excess loss relative to a reference model. DOGE [13] proposes a first-order bi-level optimization framework, using gradient alignment between source and target domains to update mixture weights online during training. Complementary to these optimization-based approaches, Data Mixing Laws [76] derives scaling laws that could predict performance under different domain mixtures, enabling low-cost searches for near-optimal weights without proxy models. In this paper, we extend these ideas to process supervision and introduce a novel bi-level domain-reweighting framework.
3 Problem Setting and Preliminaries
Notations.
Let $\mathcal{I}$ , $\mathcal{T}$ , and $\mathcal{Y}$ denote the multimodal input space (images), textual instruction space, and response space, respectively. A multimodal large language model (MLLM) is formalized as a parametric mapping $M_{\theta}:\mathcal{T}×\mathcal{I}→\Delta(\mathcal{Y})$ , where $\hat{y}\sim M_{\theta}(·|x)$ represents the stochastic generation of responses conditioned on input pair $x=(t,I)$ including visual input $I∈\mathcal{I}$ and textual instruction $t∈\mathcal{T}$ , with $\Delta(\mathcal{Y})$ denoting the probability simplex over the response space. We use $y∈\mathcal{Y}$ to denote the ground truth label from a dataset.
The process reward model (PRM) constitutes a sequence classification function $\mathcal{V}_{\phi}:\mathcal{T}×\mathcal{I}×\mathcal{Y}→[0,1]$ , parameterized by $\phi$ , which quantifies the epistemic value of partial reasoning state $\hat{y}_{i}$ through scalar reward $p_{i}=\mathcal{V}_{\phi}(x,\hat{y}_{i})$ , modeling incremental utility toward solving instruction $t$ under visual grounding $I$ . Specifically, $\hat{y}_{i}$ represents the first $i$ steps of a complete reasoning trajectory $\hat{y}$ .
PRM training with Monte Carlo signals.
Due to the lack of ground truth epistemic value for each partial reasoning state $\hat{y}_{i}$ , training of PRM requires automatic generation of approximated supervision signals. An effective approach to obtain these signals is to use the Monte Carlo method [69, 65]. We first feed the input question-image pair $x=(t,I)$ and the prefix solution $\hat{y}_{i}$ into the MLLM, and let it complete the remaining steps until reaching the final answer. We randomly sample multiple completions, compare their final answers to the gold answer $y$ , and thereby obtain multiple correctness labels. PRM is trained as a sequence classification task to predict these correctness labels. The ratio of correct completions at the $i$ -th step estimates the “correctness level” up to step $i$ , which is used as the approximated supervision signals $p_{i}$ to train the PRM. Formally,
$$
p_{i}=\texttt{MonteCarlo}(x,\hat{y}_{i},y)=\frac{\texttt{num(correct completions from }\hat{y}_{i})}{\texttt{num(total completions from }\hat{y}_{i})} \tag{1}
$$
PRM-based inference with aggregation function.
<details>
<summary>x2.png Details</summary>
### Visual Description
## Diagram: Training and Testing Sets with Distribution Shift
### Overview
The image illustrates a diagram comparing a training set and a testing set, highlighting a distribution shift between them. The diagram shows how questions are processed by a Multi-Layer Language Model (MLLM) and a Probabilistic Reasoning Model (PRM). The training set uses map-based questions, while the testing set uses a bar graph question.
### Components/Axes
* **Training Set:** Located in the top half of the image, enclosed by a blue bracket.
* **Input:** A map image with a yellow region and a question: "What is the area of the yellow region?"
* **Input:** A map image with a park and a question: "Which building is west of the park?"
* **MLLM:** A robot icon labeled "MLLM" processes the questions.
* **Monte Carlo signal:** A label pointing to a split in the processing path.
* **PRM:** A robot icon labeled "PRM" receives the processed information.
* **Testing Set:** Located in the bottom half of the image, enclosed by an orange bracket.
* **Input:** A bar graph image with a question: "What is the value of the highest bar?"
* **MLLM:** A robot icon labeled "MLLM" processes the question.
* **PRM:** A robot icon labeled "PRM" receives the processed information. One PRM has a red "X" indicating an incorrect result, while the other has a green checkmark indicating a correct result.
* **Distribution Shift:** A curved line connecting the training and testing sets, labeled "Distribution shift". The top half of the line is blue, and the bottom half is orange.
### Detailed Analysis or ### Content Details
* **Training Set Processing:**
* The map-based questions are fed into the MLLM.
* The MLLM outputs a series of blue circles, representing processing steps.
* The "Monte Carlo signal" indicates a branching path, with some paths leading to dashed circles.
* The final output is fed into the PRM.
* **Testing Set Processing:**
* The bar graph question is fed into the MLLM.
* The MLLM outputs a series of teal circles, representing processing steps.
* Multiple paths converge towards the PRM.
* One PRM gives an incorrect result (marked with a red "X"), while the other gives a correct result (marked with a green checkmark).
### Key Observations
* The training set uses map-based questions, while the testing set uses a bar graph question, indicating a change in the type of input data.
* The "Monte Carlo signal" in the training set suggests a probabilistic approach to processing the information.
* The incorrect result in the testing set highlights the challenges of applying a model trained on one distribution to a different distribution.
### Interpretation
The diagram illustrates the concept of distribution shift, where a model trained on one type of data (the training set) performs poorly on a different type of data (the testing set). The change from map-based questions to bar graph questions represents this shift. The incorrect result in the testing set demonstrates the impact of distribution shift on model performance. The diagram suggests that the model may need to be adapted or retrained to handle the new distribution effectively. The Monte Carlo signal in the training set suggests that the model uses a probabilistic approach to reasoning, which may be sensitive to changes in the input distribution.
</details>
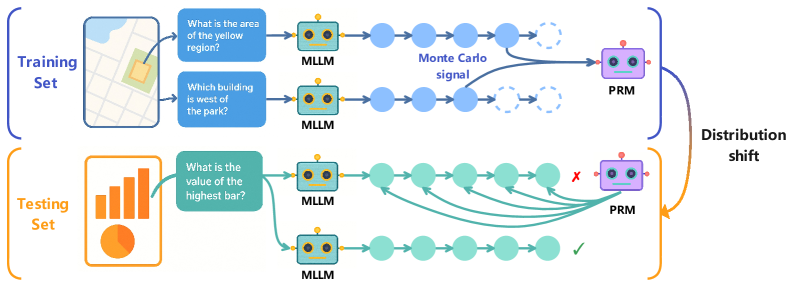
Figure 2: General flow of training PRM and using PRM for inference. Training phase: Train PRM with Monte Carlo signals from intermediate steps of Chain-of-Thoughts (CoTs). Inference phase: Use the trained PRM to verify CoTs step by step and select the best CoT. Conventional training of PRM has poor generalization capability due to distribution shift between training set and testing set.
After training a PRM, a typical way of conducting PRM-based MLLM inference is to use aggregation function [69]. Specifically, for each candidate solution $\hat{y}$ from the MLLM, PRM will generate a list of predicted probabilities ${p}=\{{p_{1}},{p_{2}},...,{p_{n}}\}$ accordingly, one for each step $\hat{y}_{i}$ in the solution. The list of predicted probabilities are then aggregated using the following function:
$$
\mathcal{A}({p})=\sum_{i=1}^{n}\log\frac{{p_{i}}}{1-{p_{i}}}. \tag{2}
$$
The aggregated value corresponds to the score of a specific prediction $\hat{y}$ , and the final PRM-based solution is the one with the highest aggregated score.
Bi-level optimization.
Bi-level optimization (BLO) has been widely used in meta-learning [14], neural architecture search [31], and data reweighting [54]. A BLO problem is usually formulated as:
$$
\displaystyle\min_{\alpha}\mathcal{U}(\alpha,\phi^{*}(\alpha)) \displaystyle s.t. \displaystyle\phi^{*}(\alpha)=\underset{\mathbf{\phi}}{\arg\min}\mathcal{L}(\phi,\alpha) \tag{3}
$$
where $\mathcal{U}$ is the upper-level optimization problem (OP) with parameter $\alpha$ , and $\mathcal{L}$ is the lower-level OP with parameter $\phi$ . The lower-level OP is nested within the upper-level one, and the two OPs are mutually dependent.
4 The Proposed Domain-reweighting Method
<details>
<summary>x3.png Details</summary>
### Visual Description
## Diagram: Multi-Level Optimization Process
### Overview
The image illustrates a multi-level optimization process, comprising a lower-level and an upper-level optimization. It depicts how different domains and their associated tasks are processed using Multi-Layer Language Models (MLLMs) and Parameter Recommendation Modules (PRMs), with a focus on domain weights and parameter activation/freezing.
### Components/Axes
* **Title:** Lower-level Optimization (top), Upper-level Optimization (bottom)
* **Domains:**
* Lower-level: Domain 1, ..., Domain k
* Upper-level: Domain k+1
* **Tasks:**
* Domain 1: "What is the area of yellow region?"
* Domain k: "What is the largest pie area?"
* Domain k+1: "What is the value of x?" (given the equation 2x+6=13)
* **Modules:** MLLM (Multi-Layer Language Model), PRM (Parameter Recommendation Module)
* **Processes:**
* Forward pass through MLLMs
* Domain weight adjustment
* Parameter activation/freezing
* **Legend:**
* Activated parameters (flame icon)
* Frozen parameters (snowflake icon)
* **Arrows:** Indicate the flow of information and processes.
* **BLO:** Bi-Level Optimization
### Detailed Analysis
* **Lower-level Optimization:**
* Starts with Domain 1, which includes an image with a yellow region. The task is "What is the area of yellow region?". This is processed by an MLLM. The output is represented by a series of blue circles, which eventually lead to DreamPRM.
* Domain k includes a pie chart. The task is "What is the largest pie area?". This is processed by an MLLM. The output is represented by a series of orange circles, which eventually lead to DreamPRM.
* The outputs from the MLLMs are fed into a "Domain weights" component within DreamPRM, which is represented by a bar graph.
* The PRM module is connected to the "Domain weights" component. The parameters of the PRM are marked as "Activated parameters" (flame icon).
* There is a "Quality imbalance" label between Domain k and Domain k+1.
* **Upper-level Optimization:**
* Starts with Domain k+1, which includes the equation "2x+6=13". The task is "What is the value of x?". This is processed by an MLLM. The output is represented by a series of teal circles, which eventually lead to a "Domain weights" component.
* The outputs from the MLLMs are fed into a "Domain weights" component, which is represented by a bar graph.
* The PRM module is connected to the "Domain weights" component. The parameters of the PRM are marked as "Frozen parameters" (snowflake icon).
* **Connections:**
* The "Domain weights" component in the lower-level optimization is connected to the "Domain weights" component in the upper-level optimization via a dashed arrow labeled "BLO".
* The PRM in the lower-level optimization is connected to the PRM in the upper-level optimization via a dashed arrow.
### Key Observations
* The diagram illustrates a hierarchical optimization process.
* The lower-level optimization deals with tasks related to image analysis and area calculation.
* The upper-level optimization deals with tasks related to equation solving.
* The MLLMs are used to process the tasks in each domain.
* The PRMs are used to recommend parameters based on the domain weights.
* The parameters of the PRM are activated in the lower-level optimization and frozen in the upper-level optimization.
* The BLO connects the domain weights between the lower and upper levels.
### Interpretation
The diagram represents a bi-level optimization strategy where the lower level focuses on processing diverse data types (images, charts) and the upper level handles symbolic reasoning (equation solving). The MLLMs extract relevant information from each domain, and the PRMs adjust parameters based on the learned domain weights. The BLO mechanism suggests a feedback loop or information transfer between the two levels, potentially allowing the system to adapt and improve its performance across different tasks. The "Quality imbalance" label suggests that the system is designed to handle variations in the quality or relevance of data from different domains. The activation/freezing of parameters in the PRM modules may indicate a strategy for transferring knowledge or preventing overfitting in specific tasks.
</details>
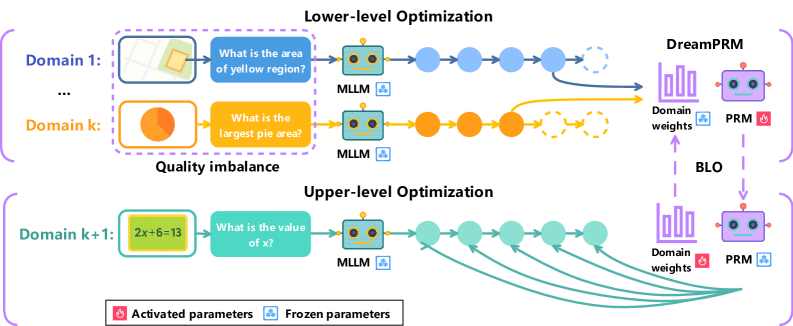
Figure 3: The proposed bi-level optimization based domain-reweighting method. Lower-level optimization: In this stage, PRM’s parameters are updated on multiple datasets with domain weights, allowing the PRM to prioritize domains with better quality. Upper-level optimization: In this stage, the PRM is evaluated on a separate meta dataset to compute an aggregation function loss and optimize the domain weights. DreamPRM helps address dataset quality imbalance problems and leads to stronger and more generalizable reasoning performance.
Overview.
Training process reward models (PRMs) for MLLMs is challenging for two reasons: (1) dataset (domain) quality imbalance, and (2) discrepancy between training and inference procedures. To address these two challenges, we propose DreamPRM, which automatically searches for domain importance using a novel aggregation function loss that better simulates the inference process of PRM. Under a bi-level optimization framework, it optimizes PRM parameters with Monte Carlo signals at the lower level, and optimizes trainable domain importance weights with aggregation function loss at the upper level. An overview of DreamPRM method is shown in Fig. 3.
Datasets.
We begin with $K{+}1$ datasets, each from a distinct domain (e.g., science, geometry). The first $K$ datasets form the training pool $\mathcal{D}_{\mathrm{tr}}=\{\mathcal{D}_{1},...,\mathcal{D}_{K}\}$ , while the remaining dataset, $\mathcal{D}_{\mathrm{meta}}=\mathcal{D}_{K+1}$ , is a meta (validation) dataset with better quality.
Lower-level optimization: domain-reweighted training of PRM.
In lower-level optimization, we aim to update the weights $\phi$ of PRM with domain-reweighted training. We first define the typical PRM training loss $\mathcal{L}_{tr}$ on a single domain $\mathcal{D}_{k}$ , given PRM parameters $\phi$ , as follows:
$$
\displaystyle\mathcal{L}_{tr}(\mathcal{D}_{k},\phi)=\sum_{(x,y)\in\mathcal{D}_{k}}\sum_{i=1}^{n}\mathcal{L}_{MSE}(\mathcal{V}_{\phi}(x,\hat{y}_{i}),p_{i}) \tag{5}
$$
where $\hat{y}_{i}$ is the prefix of MLLM generated text $\hat{y}=M_{\theta}(x)$ given input pair $x=(t,I)$ , and $p_{i}$ is the process supervision signal value obtained by Monte Carlo estimation given input pair $x$ , prefix $\hat{y}_{i}$ and ground truth label $y$ , as previously defined in Equation 1. The PRM is optimized by minimizing the mean squared error (MSE) between supervision signal and PRM predicted score $\mathcal{V}_{\phi}(x,\hat{y}_{i})$ . With the PRM training loss on a single domain $\mathcal{D}_{k}$ above, we next define the domain-reweighted training objective of PRM on multiple training domains $\mathcal{D}=\{\mathcal{D}_{k}\}_{k=1}^{K}$ . The overall objective is a weighted sum of the single-domain PRM training losses, allowing the contribution of each domain to be adjusted during the learning process:
$$
\displaystyle\mathcal{L}_{tr}(\mathcal{D}_{tr},\phi,\alpha)=\sum_{k=1}^{K}\alpha_{k}\mathcal{L}_{tr}(\mathcal{D}_{k},\phi) \tag{6}
$$
Here, $\alpha=\{\alpha_{k}\}_{k=1}^{K}$ represents the trainable domain weight parameters, indicating the importance of each domain. By optimizing this objective, we obtain the optimal value of PRM parameters $\phi^{*}$ :
$$
\displaystyle\phi^{*}(\alpha)= \displaystyle\underset{\mathbf{\phi}}{\arg\min}\mathcal{L}_{tr}(\mathcal{D}_{tr},\phi,\alpha) \tag{7}
$$
It is worth mentioning that only $\phi$ is optimized at this level, while $\alpha$ remains fixed.
Upper-level optimization: learning domain reweighting parameters.
In upper-level optimization, we optimize the domain reweighting parameter $\alpha$ on meta dataset $\mathcal{D}_{meta}$ given optimal PRM weights $\phi^{*}(\alpha)$ obtained from the lower level. To make the meta learning target more closely reflect the actual PRM-based inference process, we propose a novel meta loss function $\mathcal{L}_{meta}$ , different from the training loss $\mathcal{L}_{tr}$ . Specifically, we first obtain an aggregated score $\mathcal{A}({p})$ for each generated solution $\hat{y}$ from the MLLM given input pair $x=(t,I)$ , following process in Section 3. We then create a ground truth signal $r(\hat{y},y)$ by assigning it a value of 1 if the generated $\hat{y}$ contains ground truth $y$ , and 0 otherwise. The meta loss is defined as the mean squared error between aggregated score and ground truth signal:
$$
\displaystyle\mathcal{L}_{meta}(\mathcal{D}_{meta},\phi^{*}(\alpha))=\sum_{(x,y)\in\mathcal{D}_{meta}}\mathcal{L}_{MSE}(\sigma(\mathcal{A}(\mathcal{V}_{\phi^{*}(\alpha)}(x,\hat{y}))),r(\hat{y},y)) \tag{8}
$$
where $\mathcal{A}$ represents the aggregation function as previously defined in Equation 2, and $\sigma$ denotes the sigmoid function to map the aggregated score to a probability. Accordingly, the optimization problem at the upper level is formulated as follows:
$$
\displaystyle\underset{\alpha}{\min}\mathcal{L}_{meta}(\mathcal{D}_{meta},\phi^{*}(\alpha)) \tag{9}
$$
To solve this optimization problem, we propose an efficient gradient-based algorithm, which is detailed in Appendix A.
5 Experimental Results
5.1 Experimental settings
Multistage reasoning.
To elicit consistent steady reasoning responses from current MLLMs, we draw on the Llava-CoT approach [75], which fosters structured thinking prior to answer generation. Specifically, we prompt MLLMs to follow five reasoning steps: (1) Restate the question. (2) Gather evidence from the image. (3) Identify any background knowledge needed. (4) Reason with the current evidence. (5) Summarize and conclude with all the information. We also explore zero-shot prompting settings in conjunction with structural reasoning, which can be found in Appendix C. We use 8 different chain-of-thought reasoning trajectories for all test-time scaling methods, unless otherwise stated.
Table 1: Comparative evaluation of DreamPRM and baselines on multimodal reasoning benchmarks. Bold numbers indicate the best performance, while underlined numbers indicate the second best. The table reports accuracy (%) on five datasets: WeMath, MathVista, MathVision, MMVet, and MMStar.
| | Math Reasoning WeMath (loose) | General Reasoning MathVista (testmini) | MathVision (test) | MMVet (v1) | MMStar (test) |
| --- | --- | --- | --- | --- | --- |
| Zero-shot Methods | | | | | |
| Gemini-1.5-Pro [50] | 46.0 | 63.9 | 19.2 | 64.0 | 59.1 |
| GPT-4v [46] | 51.4 | 49.9 | 21.7 | 67.7 | 62.0 |
| LLaVA-OneVision-7B [26] | 44.8 | 63.2 | 18.4 | 57.5 | 61.7 |
| Qwen2-VL-7B [66] | 42.9 | 58.2 | 16.3 | 62.0 | 60.7 |
| InternVL-2.5-8B-MPO [67] | 51.7 | 65.4 | 20.4 | 55.9 | 58.9 |
| Test-time Scaling Methods (InternVL-2.5-8B-MPO based) | | | | | |
| Self-consistency [68] | 56.4 | 67.1 | 20.7 | 57.4 | 59.6 |
| Self-correction [17] | 54.0 | 63.8 | 21.6 | 54.9 | 59.7 |
| ORM [52] | 56.9 | 65.3 | 20.5 | 55.9 | 60.1 |
| Vanilla PRM [29] | 54.2 | 67.2 | 20.6 | 58.9 | 60.8 |
| CaR-PRM [16] | 54.7 | 67.5 | 21.0 | 60.6 | 61.1 |
| s1-PRM [44] | 57.1 | 65.8 | 20.2 | 60.1 | 60.4 |
| DreamPRM (ours) | 57.4 | 68.9 | 22.1 | 61.4 | 62.3 |
Base models.
For inference, we use InternVL-2.5-8B-MPO [67] as the base MLLM, which has undergone post-training to enhance its reasoning abilities and is well-suited for our experiment. For fine-tuning PRM, we adopt Qwen2-VL-2B-Instruct [66]. Qwen2-VL is a state-of-the-art multimodal model pretrained for general vision-language understanding tasks. This pretrained model serves as the initialization for our fine-tuning process.
Training hyperparameters.
In the lower-level optimization, we perform 5 inner gradient steps per outer update (unroll steps = 5) using the AdamW [32] optimizer with learning rate set to $5× 10^{-7}$ . In the upper-level optimization, we use the AdamW optimizer ( $\mathrm{lr}=0.01$ , weight decay $=10^{-3}$ ) and a StepLR scheduler (step size = 5000, $\gamma=0.5$ ). In total, DreamPRM is fine-tuned for 10000 iterations. Our method is implemented with Betty [7], and the fine-tuning process takes approximately 10 hours on one NVIDIA A100 GPUs.
Baselines.
We use three major categories of baselines: (1) State-of-the-art models on public leaderboards, including Gemini-1.5-Pro [50], GPT-4V [46], LLaVA-OneVision-7B [26], Qwen2-VL-7B [66]. We also carefully reproduce the results of InternVL-2.5-8B-MPO with structural thinking. (2) Test-time scaling methods (excluding PRM) based on the InternVL-2.5-8B-MPO model, including: (i) Self-consistency [68], which selects the most consistent reasoning chain via majority voting over multiple responses; (ii) Self-correction [17], which prompts the model to critically reflect on and revise its initial answers; and (iii) Outcome Reward Model (ORM) [52], which evaluates and scores the final response to select the most promising one. (3) PRM-based methods, including: (i) Vanilla PRM trained without any data selection, as commonly used in LLM settings [29]; (ii) s1-PRM, which selects high-quality reasoning responses based on three criteria - difficulty, quality, and diversity - following the s1 strategy [44]; and (iii) CaR-PRM, which filters high-quality visual questions using clustering and ranking techniques, as proposed in CaR [16].
Datasets and benchmarks.
We use 15 multimodal datasets for lower-level optimization ( $\mathcal{D}_{tr}$ ), covering four domains: science, chart, geometry, and commonsense, as listed in Appendix Table 2. For upper-level optimization ( $\mathcal{D}_{meta}$ ), we adopt the MMMU [79] dataset. Evaluation is conducted on five multimodal reasoning benchmarks: WeMath [48], MathVista [33], MathVision [63], MMVet [78], and MMStar [5]. Details are provided in Appendix B.
5.2 Benchmark evaluation of DreamPRM
Tab. 1 presents the primary experimental results. We observe that: (1) DreamPRM outperforms other PRM-based methods, highlighting the effectiveness of our domain reweighting strategy. Compared to the vanilla PRM trained without any data selection, DreamPRM achieves a consistent performance gain of 2%-3% across all five datasets, suggesting that effective data selection is crucial for training high-quality multimodal PRMs. Moreover, DreamPRM also outperforms s1-PRM and CaR-PRM, which rely on manually designed heuristic rules for data selection. These results indicate that selecting suitable reasoning datasets for PRM training is a complex task, and handcrafted rules are often suboptimal. In contrast, our automatic domain-reweighting approach enables the model to adaptively optimize its learning process, illustrating how data-driven optimization offers a scalable solution to dataset selection challenges. (2) DreamPRM outperforms SOTA MLLMs with much fewer parameters, highlighting the effectiveness of DreamPRM. For example, DreamPRM significantly surpasses two trillion-scale closed-source LLMs (GPT-4v and Gemini-1.5-Pro) on 4 out of 5 datasets. In addition, it consistently improves the performance of the base model, InternVL-2.5-8B-MPO, achieving an average gain of 4% on the five datasets. These results confirm that DreamPRM effectively yields a high-quality PRM, which is capable of enhancing multimodal reasoning across a wide range of benchmarks. (3) DreamPRM outperforms other test-time scaling methods, primarily because it enables the training of a high-quality PRM that conducts fine-grained, step-level evaluation. While most test-time scaling methods yield moderate improvements, DreamPRM leads to the most substantial gains, suggesting that the quality of the reward model is critical for effective test-time scaling. We further provide case studies in Appendix D, which intuitively illustrate how DreamPRM assigns higher scores to coherent and high-quality reasoning trajectories.
<details>
<summary>x4.png Details</summary>
### Visual Description
## Bar Chart: Leaderboard on MathVista
### Overview
The image is a bar chart displaying a leaderboard of different models on MathVista. The y-axis represents a percentage score, ranging from 0% to 100%. The x-axis lists the names of the models. Each bar represents the score of a specific model.
### Components/Axes
* **Title:** Leaderboard on MathVista
* **Y-axis:**
* Label: (Implied Percentage)
* Scale: 0%, 10%, 20%, 30%, 40%, 50%, 60%, 70%, 80%, 90%, 100%
* **X-axis:**
* Labels (Model Names, from left to right):
* o4-mini + DreamPRM
* VL-Rethinker
* Step R1 -V-Mini
* Kimi-k1.6 -preview-20250308
* Doubao-pro-1.5
* Ovis2\_34B
* Kimi-k1.5
* OpenAI o1
* Llama 4 Maverick
* Vision-R1-7B
### Detailed Analysis
* **o4-mini + DreamPRM:** Blue bar, score of 85.2%
* **VL-Rethinker:** Orange bar, score of 80.3%
* **Step R1 -V-Mini:** Green bar, score of 80.1%
* **Kimi-k1.6 -preview-20250308:** Red bar, score of 80.0%
* **Doubao-pro-1.5:** Purple bar, score of 79.5%
* **Ovis2\_34B:** Brown bar, score of 77.1%
* **Kimi-k1.5:** Pink bar, score of 74.9%
* **OpenAI o1:** Gray bar, score of 73.9%
* **Llama 4 Maverick:** Yellow-Green bar, score of 73.7%
* **Vision-R1-7B:** Cyan bar, score of 73.2%
### Key Observations
* The model "o4-mini + DreamPRM" has the highest score at 85.2%.
* The scores range from 73.2% to 85.2%.
* There is a relatively small difference in scores between the models, with most scores clustered between 73% and 80%.
### Interpretation
The bar chart presents a performance comparison of different models on the MathVista benchmark. "o4-mini + DreamPRM" outperforms the other models, while "Vision-R1-7B" has the lowest score among the listed models. The close proximity of the scores suggests that the models are relatively competitive on this particular benchmark. The chart provides a snapshot of the relative performance of these models, which can be useful for model selection or further research and development.
</details>
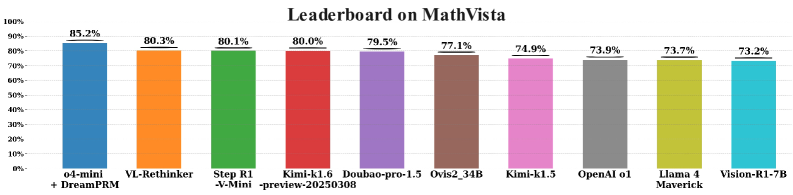
Figure 4: Leaderboard on MathVista (as of October 15, 2025). The first column (“o4-mini + DreamPRM”) reports our own evaluation, while the remaining results are taken from the official MathVista leaderboard. The compared models include VL-Rethinker [62], Step R1-V-Mini [58], Kimi-k1.6-preview [43], Kimi-k1.5 [24], Doubao-pro-1.5 [60], Ovis2-34B [1], OpenAI o1 [45], Llama 4 Maverick [41, 42], and Vision-R1-7B [18].
5.3 Leaderboard performance of DreamPRM
As shown in Fig. 4, DreamPRM achieves the top-1 accuracy of 85.2% on the MathVista leaderboard (as of October 15, 2025). The result (o4-mini + DreamPRM) has been officially verified through the MathVista evaluation. Compared with a series of strong multimodal reasoning baselines, including VL-Rethinker [62], Step R1-V-Mini [58], Kimi-k1.6-preview [43], Doubao-pro-1.5 [60], Ovis2-34B [1], OpenAI o1 [45], Llama 4 Maverick [41, 42], and Vision-R1-7B [18], DreamPRM demonstrates clearly superior multimodal reasoning capability.
Table 5 in Appendix provides a detailed comparison among various Process Reward Model (PRM) variants built on the same o4-mini backbone. DreamPRM surpasses all counterparts, improving the base o4-mini model from 80.6% (pass@1) and 81.7% (self-consistency@8) to 85.2%. This consistent gain verifies the effectiveness of DreamPRM in enhancing reasoning accuracy through process-level supervision and reliable consensus across multiple chains of thought.
<details>
<summary>x5.png Details</summary>
### Visual Description
## Radar Charts: Data Selection, Test-Time Scaling, and Ablation Study
### Overview
The image presents three radar charts comparing different methods related to data selection, test-time scaling, and ablation studies. Each chart visualizes the performance across five categories: MathVista, WeMath, MMStar, MMVet, and MathVision. Different colored lines represent different selection methods or ablation conditions.
### Components/Axes
* **Chart Titles (Top):**
* Left: "Data selection comparison"
* Center: "Test-time scaling comparison"
* Right: "Ablation study"
* **Axes (Radial):** The radial axes represent performance metrics, presumably accuracy or a similar measure. The scale ranges approximately from 20 to 70.
* **Categories (Around the Circle):**
* MathVista (Top)
* WeMath (Top-Right)
* MMStar (Bottom-Right)
* MMVet (Bottom-Left)
* MathVision (Top-Left)
* **Axis Markers:** Concentric circles indicate approximate values. The outermost circle corresponds to a value near 70, and the innermost circle corresponds to a value near 20.
* **Legends (Bottom):**
* **Left Chart (Data selection comparison):**
* Orange: No selection
* Pink: CaR selection
* Red: s1 selection
* Cyan: DreamPRM
* **Center Chart (Test-time scaling comparison):**
* Orange: Self-consistency
* Pink: ORM
* Red: Self-correction
* Cyan: DreamPRM
* **Right Chart (Ablation study):**
* Orange: w/o AFL
* Pink: w/o ST
* Red: w/o BLO
* Cyan: DreamPRM
### Detailed Analysis
#### Data selection comparison (Left Chart)
* **No selection (Orange):** The "No selection" line forms a pentagon.
* MathVista: ~67.5
* WeMath: ~65.8
* MMStar: ~60.4
* MMVet: ~60.1
* MathVision: ~20.2
* **CaR selection (Pink):** The "CaR selection" line forms a pentagon.
* MathVista: ~68.9
* WeMath: ~57.1
* MMStar: ~62.3
* MMVet: ~61.4
* MathVision: ~54.7
* **s1 selection (Red):** The "s1 selection" line forms a pentagon.
* MathVista: ~21.0
* WeMath: ~54.2
* MMStar: ~61.1
* MMVet: ~58.9
* MathVision: ~20.7
* **DreamPRM (Cyan):** The "DreamPRM" line forms a pentagon.
* MathVista: ~68.9
* WeMath: ~57.1
* MMStar: ~62.3
* MMVet: ~61.4
* MathVision: ~21.0
#### Test-time scaling comparison (Center Chart)
* **Self-consistency (Orange):** The "Self-consistency" line forms a pentagon.
* MathVista: ~67.1
* WeMath: ~65.3
* MMStar: ~59.7
* MMVet: ~57.4
* MathVision: ~63.8
* **ORM (Pink):** The "ORM" line forms a pentagon.
* MathVista: ~68.9
* WeMath: ~56.9
* MMStar: ~62.3
* MMVet: ~61.4
* MathVision: ~20.5
* **Self-correction (Red):** The "Self-correction" line forms a pentagon.
* MathVista: ~21.5
* WeMath: ~54.0
* MMStar: ~60.1
* MMVet: ~55.9
* MathVision: ~54.9
* **DreamPRM (Cyan):** The "DreamPRM" line forms a pentagon.
* MathVista: ~68.9
* WeMath: ~57.1
* MMStar: ~62.3
* MMVet: ~61.4
* MathVision: ~20.5
#### Ablation study (Right Chart)
* **w/o AFL (Orange):** The "w/o AFL" line forms a pentagon.
* MathVista: ~66.1
* WeMath: ~55.0
* MMStar: ~59.6
* MMVet: ~61.2
* MathVision: ~65.4
* **w/o ST (Pink):** The "w/o ST" line forms a pentagon.
* MathVista: ~68.9
* WeMath: ~56.3
* MMStar: ~61.6
* MMVet: ~61.2
* MathVision: ~19.9
* **w/o BLO (Red):** The "w/o BLO" line forms a pentagon.
* MathVista: ~20.4
* WeMath: ~56.0
* MMStar: ~61.0
* MMVet: ~57.3
* MathVision: ~49.9
* **DreamPRM (Cyan):** The "DreamPRM" line forms a pentagon.
* MathVista: ~68.9
* WeMath: ~57.4
* MMStar: ~62.3
* MMVet: ~61.4
* MathVision: ~20.4
### Key Observations
* **DreamPRM:** The "DreamPRM" method (cyan line) consistently achieves high performance on MathVista, WeMath, MMStar, and MMVet, but performs poorly on MathVision across all three charts.
* **MathVision Performance:** MathVision consistently shows the lowest performance for most methods, especially in the "Data selection comparison" and "Test-time scaling comparison" charts.
* **Ablation Impact:** Removing AFL ("w/o AFL") seems to have a more significant impact on MathVista and MathVision compared to removing ST ("w/o ST") or BLO ("w/o BLO").
### Interpretation
The radar charts provide a comparative analysis of different methods and their impact on performance across various categories. The consistent high performance of DreamPRM on most categories suggests its robustness, while its poor performance on MathVision indicates a potential limitation or bias. The ablation study highlights the importance of AFL for MathVista and MathVision, suggesting that AFL plays a crucial role in these categories. The data suggests that the choice of data selection method, test-time scaling technique, and ablation conditions can significantly impact performance, and the optimal choice may depend on the specific category being considered.
</details>
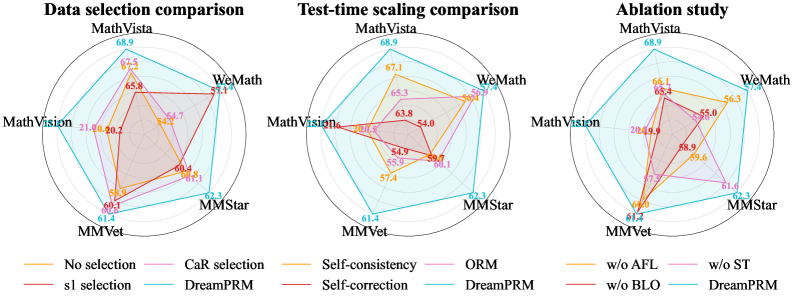
Figure 5: Comparative evaluation of DreamPRM on multimodal reasoning benchmarks. Radar charts report accuracy (%) on five datasets (WeMath, MathVista, MathVision, MMVet, and MMStar). (a) Impact of different data selection strategies. (b) Comparison with existing test-time scaling methods. (c) Ablation study of three key components, i.e. w/o aggregation function loss (AFL), w/o bi-level optimization (BLO), and w/o structural thinking (ST).
<details>
<summary>x6.png Details</summary>
### Visual Description
## Radar Chart: Scaling ability
### Overview
The image is a radar chart displaying the scaling ability of different models (Zero-shot, DreamPRM@2, DreamPRM@4, and DreamPRM@8) across five categories: MathVista, WeMath, MMStar, MMVet, and MathVision. The chart visualizes the performance of each model in each category, with higher values indicating better scaling ability.
### Components/Axes
* **Title:** Scaling ability
* **Categories (Axes):** MathVista, WeMath, MMStar, MMVet, MathVision. These are arranged in a circular fashion.
* **Data Series:**
* Zero-shot (Orange line)
* DreamPRM@2 (Red line)
* DreamPRM@4 (Pink line)
* DreamPRM@8 (Cyan line)
* **Scale:** The chart has concentric circular gridlines, but no explicit numerical scale is provided. Values are labeled directly next to each data point.
* **Legend:** Located at the bottom of the chart, associating colors with model names.
### Detailed Analysis
* **MathVista:**
* DreamPRM@8: 68.9
* **WeMath:**
* DreamPRM@8: 57.4
* DreamPRM@4: 53.6
* **MMStar:**
* DreamPRM@8: 62.3
* DreamPRM@4: 60.0
* **MMVet:**
* DreamPRM@8: 61.4
* DreamPRM@2: 60.4
* **MathVision:**
* DreamPRM@8: 66.5
* DreamPRM@4: 55.9
* DreamPRM@2: 58.9
* Zero-shot: 65.3
**Trend Verification and Data Points:**
* **Zero-shot (Orange):** The Zero-shot model shows relatively consistent performance across MathVision (65.3).
* **DreamPRM@2 (Red):** The DreamPRM@2 model shows relatively consistent performance across MathVision (58.9), MMVet (60.4), WeMath (54.5).
* **DreamPRM@4 (Pink):** The DreamPRM@4 model shows relatively consistent performance across MathVision (55.9), MMStar (60.0), WeMath (53.6).
* **DreamPRM@8 (Cyan):** The DreamPRM@8 model generally outperforms the other models across all categories. The values are MathVista (68.9), WeMath (57.4), MMStar (62.3), MMVet (61.4), and MathVision (66.5).
### Key Observations
* DreamPRM@8 consistently achieves the highest scaling ability across all categories.
* Zero-shot has the highest scaling ability in MathVision.
* The performance of DreamPRM@2 and DreamPRM@4 is generally lower than DreamPRM@8.
### Interpretation
The radar chart effectively visualizes the scaling ability of different models across various categories. The DreamPRM@8 model demonstrates superior scaling ability compared to the other models, suggesting that increasing the parameter size or complexity of the DreamPRM model leads to improved performance. The Zero-shot model shows competitive performance in MathVision, indicating its potential in specific areas. The chart highlights the strengths and weaknesses of each model, providing valuable insights for model selection and optimization.
</details>
<details>
<summary>x7.png Details</summary>
### Visual Description
## Line Chart: Best-of-N accuracy with different models
### Overview
The image is a line chart comparing the "Best-of-N" accuracy of three different models (InternVL-2.5-8B-MPO, GPT-4.1-mini (4-14-25), and o4-mini (4-16-25)) as the number of selected CoTs (Chain of Thoughts) increases from 2 to 8. The chart displays accuracy (%) on the y-axis and the number of selected CoTs (k) on the x-axis.
### Components/Axes
* **Title:** Best-of-N accuracy with different models
* **X-axis:**
* Label: Number of selected CoTs (k)
* Scale: 2, 4, 6, 8
* **Y-axis:**
* Label: Accuracy (%)
* Scale: 65.0, 67.5, 70.0, 72.5, 75.0, 77.5, 80.0, 82.5, 85.0
* **Legend:** Located in the center of the chart.
* Blue line with circle markers: InternVL-2.5-8B-MPO
* Red line with square markers: GPT-4.1-mini (4-14-25)
* Green line with cross markers: o4-mini (4-16-25)
* **Horizontal dashed lines:**
* Blue dashed line at approximately 65.3%
* Red dashed line at approximately 71.5%
* Green dashed line at approximately 80.7%
### Detailed Analysis
* **InternVL-2.5-8B-MPO (Blue):** The line slopes upward.
* At 2 CoTs: Accuracy is approximately 65.3%
* At 4 CoTs: Accuracy is approximately 66.5%
* At 6 CoTs: Accuracy is approximately 67.7%
* At 8 CoTs: Accuracy is approximately 69.0%
* **GPT-4.1-mini (4-14-25) (Red):** The line slopes upward.
* At 2 CoTs: Accuracy is approximately 71.8%
* At 4 CoTs: Accuracy is approximately 72.5%
* At 6 CoTs: Accuracy is approximately 73.3%
* At 8 CoTs: Accuracy is approximately 74.4%
* **o4-mini (4-16-25) (Green):** The line slopes upward.
* At 2 CoTs: Accuracy is approximately 81.7%
* At 4 CoTs: Accuracy is approximately 82.5%
* At 6 CoTs: Accuracy is approximately 84.0%
* At 8 CoTs: Accuracy is approximately 85.3%
### Key Observations
* The o4-mini model consistently outperforms the other two models across all numbers of selected CoTs.
* The InternVL-2.5-8B-MPO model has the lowest accuracy among the three models.
* All three models show an increase in accuracy as the number of selected CoTs increases.
* The dashed lines appear to represent a baseline accuracy for each model, potentially without the use of CoTs.
### Interpretation
The chart illustrates the impact of increasing the number of selected Chain of Thoughts (CoTs) on the accuracy of three different models. The o4-mini model demonstrates the highest accuracy, suggesting it benefits most from the CoT approach or is inherently better at the task being evaluated. The increasing trend in accuracy for all models indicates that using more CoTs generally improves performance, although the extent of improvement varies between models. The horizontal dashed lines may represent the baseline accuracy of each model without CoTs, providing a reference point for evaluating the effectiveness of the CoT strategy.
</details>
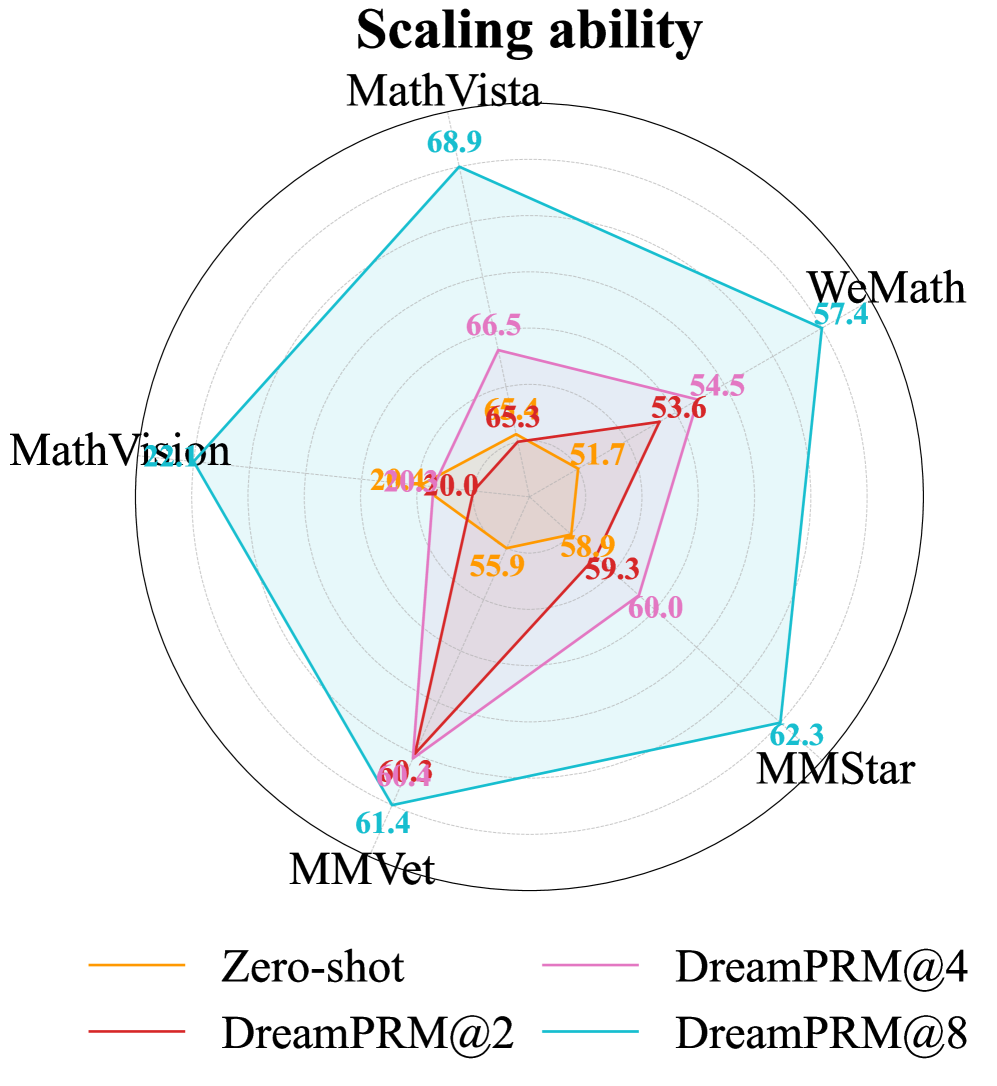
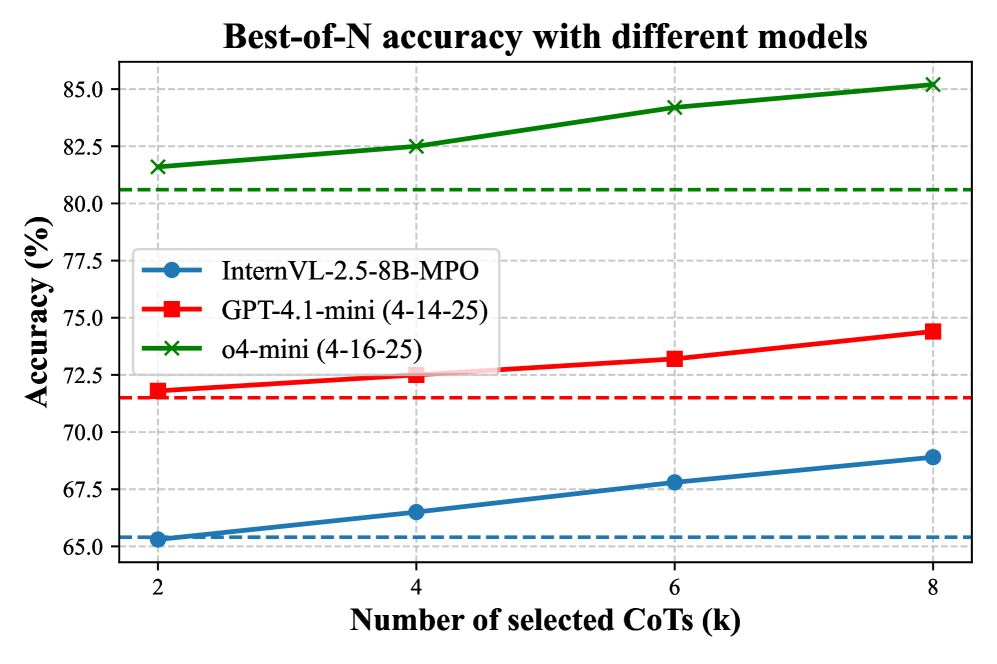
Figure 6: Scaling ability and cross-model generalization. (a) Radar chart of five multimodal reasoning benchmarks shows that DreamPRM delivers monotonic accuracy gains as the number of selected chains-of-thought increases (@2, @4, @8) over the pass@1 baseline. (b) Best-of- N accuracy curves for InternVL-2.5-8B-MPO (blue), GPT-4.1-mini (red) and o4-mini (green) on MathVista confirm that the same DreamPRM-ranked CoTs generalize across models, consistently outperforming pass@1 performance (dashed lines) as $k$ grows.
5.4 Scaling and generalization analysis of DreamPRM
DreamPRM scales reliably with more CoT candidates. As shown in the left panel of Fig. 6, the accuracy of DreamPRM consistently improves on all five benchmarks as the number of CoTs increases from $k{=}2$ to $k{=}8$ , expanding the radar plot outward. Intuitively, a larger set of candidates increases the likelihood of including high-quality reasoning trajectories, but it also makes identifying the best ones more challenging. The consistent performance gains indicate that DreamPRM effectively verifies and ranks CoTs, demonstrating its robustness in selecting high-quality reasoning trajectories under more complex candidate pools.
DreamPRM transfers seamlessly to stronger base MLLMs. The right panel of Fig. 6 shows the MathVista accuracy when applying DreamPRM to recent MLLMs, GPT-4.1-mini (2025-04-14) [46] and o4-mini (2025-04-16) [45]. For o4-mini model, the pass@1 score of 80.6% steadily increases to 85.2% at $k{=}8$ , surpassing the previous state-of-the-art performance. This best-of- $N$ trend, previously observed with InternVL, also holds for GPT-4.1-mini and o4-mini, demonstrating the generalization ability of DreamPRM. Full results of these experiments are provided in Tab. 3.
5.5 Ablation study
In this section, we investigate the importance of three components in DreamPRM: (1) bi-level optimization, (2) aggregation function loss in upper-level, and (3) structural thinking prompt (detailed in Section 5.1). As shown in the rightmost panel of Fig. 5, the complete DreamPRM achieves the best results compared to three ablation baselines across all five benchmarks. Eliminating bi-level optimization causes large performance drop (e.g., -3.5% on MathVista and -3.4% on MMStar). Removing aggregation function loss leads to a consistent 1%-2% decline (e.g., 57.4% $→$ 56.3% on WeMath). Excluding structural thinking also degrades performance (e.g., -1.8% on MathVision). These results indicate that all three components are critical for DreamPRM to achieve the best performance. More detailed results are shown in Appendix Tab. 4.
5.6 Analysis of learned domain weights
<details>
<summary>x8.png Details</summary>
### Visual Description
## Horizontal Bar Chart: Domain Weights
### Overview
The image is a horizontal bar chart titled "Domain Weights". It displays the weights of different domains, with the domain names listed on the vertical axis and the corresponding weights represented by the length of the horizontal bars. The weights are also numerically labeled at the end of each bar.
### Components/Axes
* **Title:** Domain Weights
* **Vertical Axis (Domains):**
* m3cot
* figureqa
* unigeo
* infographics
* chartqa
* geo170k
* scienceqa
* geos
* geomverse
* mapqa
* clevr
* geometry3k
* dvqa
* iconqa
* ai2d
* **Horizontal Axis (Weights):** Scale from 0.0 to 1.4, with increments of 0.2.
### Detailed Analysis
The chart presents the domain weights in descending order. Here's a breakdown of the weights for each domain:
* **m3cot:** 1.49 (Orange bar, top)
* **figureqa:** 1.47 (Tan bar)
* **unigeo:** 1.16 (Pink bar)
* **infographics:** 1.16 (Gray bar)
* **chartqa:** 1.10 (Light Blue bar)
* **geo170k:** 1.06 (Salmon bar)
* **scienceqa:** 1.05 (Light Green bar)
* **geos:** 1.01 (Gray bar)
* **geomverse:** 0.98 (Light Green bar)
* **mapqa:** 0.97 (Light Green bar)
* **clevr:** 0.95 (Brown bar)
* **geometry3k:** 0.84 (Purple bar)
* **dvqa:** 0.79 (Teal bar)
* **iconqa:** 0.75 (Light Yellow bar)
* **ai2d:** 0.55 (Blue bar, bottom)
### Key Observations
* "m3cot" has the highest domain weight (1.49).
* "ai2d" has the lowest domain weight (0.55).
* The domain weights range from 0.55 to 1.49.
* There is a noticeable drop in weight between "clevr" (0.95) and "geometry3k" (0.84).
### Interpretation
The chart illustrates the relative importance or influence of different domains, as quantified by their weights. "m3cot" and "figureqa" are the most significant domains, while "ai2d" is the least significant. The weights could represent various factors, such as the frequency of occurrence, relevance, or contribution of each domain within a specific context. The distribution of weights suggests that some domains are considerably more influential than others. The specific meaning of "weight" would depend on the application or study from which this chart originates.
</details>
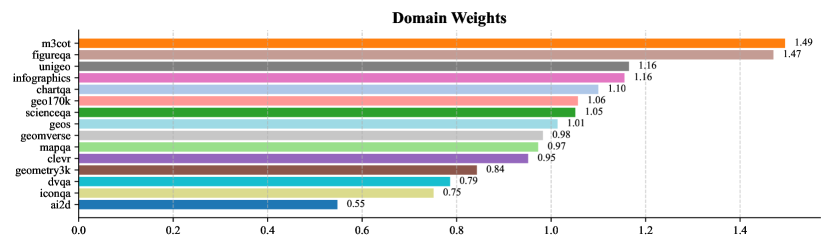
Figure 7: Learned domain weights after the convergence of the DreamPRM training process.
The final domain weights (Fig. 7) range from 0.55 to 1.49: M3CoT [6] and FigureQA [21] receive the highest weights (approximately 1.5), while AI2D [23] and IconQA [36] are assigned lower weights (less than 0.8). This learned weighting pattern contributes to improved PRM performance, indicating that the quality imbalance problem across reasoning datasets is real and consequential. Additionally, as shown in Fig. 9 in Appendix, all domain weights are initialized to 1.0 and eventually converge during the training process of DreamPRM.
6 Conclusions
We propose DreamPRM, the first domain-reweighted PRM framework for multimodal reasoning. By automatically searching for domain weights using a bi-level optimization framework, DreamPRM effectively mitigates issues caused by dataset quality imbalance and significantly enhances the generalizability of multimodal PRMs. Extensive experiments on five diverse benchmarks confirm that DreamPRM outperforms both vanilla PRMs without domain reweighting and PRMs using heuristic data selection methods. We also observe that the domain weights learned by DreamPRM correlate with dataset quality, effectively separating challenging, informative sources from overly simplistic or noisy ones. These results highlight the effectiveness of our proposed automatic domain reweighting strategy.
Acknowledgments
This work was supported by the National Science Foundation (IIS2405974 and IIS2339216) and the National Institutes of Health (R35GM157217).
References
- [1] AIDC-AI. Ovis2-34b (model card). https://huggingface.co/AIDC-AI/Ovis2-34B, 2025. Related paper: arXiv:2405.20797; Accessed 2025-10-15.
- [2] Tom B. Brown, Benjamin Mann, Nick Ryder, Melanie Subbiah, Jared Kaplan, Prafulla Dhariwal, Arvind Neelakantan, Pranav Shyam, Girish Sastry, Amanda Askell, Sandhini Agarwal, Ariel Herbert-Voss, Gretchen Krueger, Tom Henighan, Rewon Child, Aditya Ramesh, Daniel M. Ziegler, Jeffrey Wu, Clemens Winter, Christopher Hesse, Mark Chen, Eric Sigler, Mateusz Litwin, Scott Gray, Benjamin Chess, Jack Clark, Christopher Berner, Sam McCandlish, Alec Radford, Ilya Sutskever, and Dario Amodei. Language models are few-shot learners, 2020.
- [3] Shuaichen Chang, David Palzer, Jialin Li, Eric Fosler-Lussier, and Ningchuan Xiao. Mapqa: A dataset for question answering on choropleth maps, 2022.
- [4] Jiaqi Chen, Tong Li, Jinghui Qin, Pan Lu, Liang Lin, Chongyu Chen, and Xiaodan Liang. Unigeo: Unifying geometry logical reasoning via reformulating mathematical expression, 2022.
- [5] Lin Chen, Jinsong Li, Xiaoyi Dong, Pan Zhang, Yuhang Zang, Zehui Chen, Haodong Duan, Jiaqi Wang, Yu Qiao, Dahua Lin, and Feng Zhao. Are we on the right way for evaluating large vision-language models?, 2024.
- [6] Qiguang Chen, Libo Qin, Jin Zhang, Zhi Chen, Xiao Xu, and Wanxiang Che. M 3 cot: A novel benchmark for multi-domain multi-step multi-modal chain-of-thought, 2024.
- [7] Sang Keun Choe, Willie Neiswanger, Pengtao Xie, and Eric Xing. Betty: An automatic differentiation library for multilevel optimization. In The Eleventh International Conference on Learning Representations, 2023.
- [8] Aakanksha Chowdhery, Sharan Narang, Jacob Devlin, Maarten Bosma, Gaurav Mishra, Adam Roberts, Paul Barham, Hyung Won Chung, Charles Sutton, Sebastian Gehrmann, Parker Schuh, Kensen Shi, Sasha Tsvyashchenko, Joshua Maynez, Abhishek Rao, Parker Barnes, Yi Tay, Noam Shazeer, Vinodkumar Prabhakaran, Emily Reif, Nan Du, Ben Hutchinson, Reiner Pope, James Bradbury, Jacob Austin, Michael Isard, Guy Gur-Ari, Pengcheng Yin, Toju Duke, Anselm Levskaya, Sanjay Ghemawat, Sunipa Dev, Henryk Michalewski, Xavier Garcia, Vedant Misra, Kevin Robinson, Liam Fedus, Denny Zhou, Daphne Ippolito, David Luan, Hyeontaek Lim, Barret Zoph, Alexander Spiridonov, Ryan Sepassi, David Dohan, Shivani Agrawal, Mark Omernick, Andrew M. Dai, Thanumalayan Sankaranarayana Pillai, Marie Pellat, Aitor Lewkowycz, Erica Moreira, Rewon Child, Oleksandr Polozov, Katherine Lee, Zongwei Zhou, Xuezhi Wang, Brennan Saeta, Mark Diaz, Orhan Firat, Michele Catasta, Jason Wei, Kathy Meier-Hellstern, Douglas Eck, Jeff Dean, Slav Petrov, and Noah Fiedel. Palm: Scaling language modeling with pathways, 2022.
- [9] Karl Cobbe, Vineet Kosaraju, Mohammad Bavarian, Mark Chen, Heewoo Jun, Lukasz Kaiser, Matthias Plappert, Jerry Tworek, Jacob Hilton, Reiichiro Nakano, Christopher Hesse, and John Schulman. Training verifiers to solve math word problems, 2021.
- [10] DeepSeek-AI, Daya Guo, Dejian Yang, Haowei Zhang, Junxiao Song, Ruoyu Zhang, Runxin Xu, Qihao Zhu, Shirong Ma, Peiyi Wang, Xiao Bi, Xiaokang Zhang, Xingkai Yu, Yu Wu, Z. F. Wu, Zhibin Gou, Zhihong Shao, Zhuoshu Li, Ziyi Gao, Aixin Liu, Bing Xue, Bingxuan Wang, Bochao Wu, Bei Feng, Chengda Lu, Chenggang Zhao, Chengqi Deng, Chenyu Zhang, Chong Ruan, Damai Dai, Deli Chen, Dongjie Ji, Erhang Li, Fangyun Lin, Fucong Dai, Fuli Luo, Guangbo Hao, Guanting Chen, Guowei Li, H. Zhang, Han Bao, Hanwei Xu, Haocheng Wang, Honghui Ding, Huajian Xin, Huazuo Gao, Hui Qu, Hui Li, Jianzhong Guo, Jiashi Li, Jiawei Wang, Jingchang Chen, Jingyang Yuan, Junjie Qiu, Junlong Li, J. L. Cai, Jiaqi Ni, Jian Liang, Jin Chen, Kai Dong, Kai Hu, Kaige Gao, Kang Guan, Kexin Huang, Kuai Yu, Lean Wang, Lecong Zhang, Liang Zhao, Litong Wang, Liyue Zhang, Lei Xu, Leyi Xia, Mingchuan Zhang, Minghua Zhang, Minghui Tang, Meng Li, Miaojun Wang, Mingming Li, Ning Tian, Panpan Huang, Peng Zhang, Qiancheng Wang, Qinyu Chen, Qiushi Du, Ruiqi Ge, Ruisong Zhang, Ruizhe Pan, Runji Wang, R. J. Chen, R. L. Jin, Ruyi Chen, Shanghao Lu, Shangyan Zhou, Shanhuang Chen, Shengfeng Ye, Shiyu Wang, Shuiping Yu, Shunfeng Zhou, Shuting Pan, S. S. Li, Shuang Zhou, Shaoqing Wu, Shengfeng Ye, Tao Yun, Tian Pei, Tianyu Sun, T. Wang, Wangding Zeng, Wanjia Zhao, Wen Liu, Wenfeng Liang, Wenjun Gao, Wenqin Yu, Wentao Zhang, W. L. Xiao, Wei An, Xiaodong Liu, Xiaohan Wang, Xiaokang Chen, Xiaotao Nie, Xin Cheng, Xin Liu, Xin Xie, Xingchao Liu, Xinyu Yang, Xinyuan Li, Xuecheng Su, Xuheng Lin, X. Q. Li, Xiangyue Jin, Xiaojin Shen, Xiaosha Chen, Xiaowen Sun, Xiaoxiang Wang, Xinnan Song, Xinyi Zhou, Xianzu Wang, Xinxia Shan, Y. K. Li, Y. Q. Wang, Y. X. Wei, Yang Zhang, Yanhong Xu, Yao Li, Yao Zhao, Yaofeng Sun, Yaohui Wang, Yi Yu, Yichao Zhang, Yifan Shi, Yiliang Xiong, Ying He, Yishi Piao, Yisong Wang, Yixuan Tan, Yiyang Ma, Yiyuan Liu, Yongqiang Guo, Yuan Ou, Yuduan Wang, Yue Gong, Yuheng Zou, Yujia He, Yunfan Xiong, Yuxiang Luo, Yuxiang You, Yuxuan Liu, Yuyang Zhou, Y. X. Zhu, Yanhong Xu, Yanping Huang, Yaohui Li, Yi Zheng, Yuchen Zhu, Yunxian Ma, Ying Tang, Yukun Zha, Yuting Yan, Z. Z. Ren, Zehui Ren, Zhangli Sha, Zhe Fu, Zhean Xu, Zhenda Xie, Zhengyan Zhang, Zhewen Hao, Zhicheng Ma, Zhigang Yan, Zhiyu Wu, Zihui Gu, Zijia Zhu, Zijun Liu, Zilin Li, Ziwei Xie, Ziyang Song, Zizheng Pan, Zhen Huang, Zhipeng Xu, Zhongyu Zhang, and Zhen Zhang. Deepseek-r1: Incentivizing reasoning capability in llms via reinforcement learning, 2025.
- [11] Guanting Dong, Chenghao Zhang, Mengjie Deng, Yutao Zhu, Zhicheng Dou, and Ji-Rong Wen. Progressive multimodal reasoning via active retrieval, 2024.
- [12] Simin Fan, Matteo Pagliardini, and Martin Jaggi. Doge: Domain reweighting with generalization estimation, 2024.
- [13] Simin Fan, Matteo Pagliardini, and Martin Jaggi. DOGE: Domain reweighting with generalization estimation. In Ruslan Salakhutdinov, Zico Kolter, Katherine Heller, Adrian Weller, Nuria Oliver, Jonathan Scarlett, and Felix Berkenkamp, editors, Proceedings of the 41st International Conference on Machine Learning, volume 235 of Proceedings of Machine Learning Research, pages 12895–12915. PMLR, 21–27 Jul 2024.
- [14] Chelsea Finn, P. Abbeel, and Sergey Levine. Model-agnostic meta-learning for fast adaptation of deep networks. In International Conference on Machine Learning, 2017.
- [15] Jiahui Gao, Renjie Pi, Jipeng Zhang, Jiacheng Ye, Wanjun Zhong, Yufei Wang, Lanqing Hong, Jianhua Han, Hang Xu, Zhenguo Li, and Lingpeng Kong. G-llava: Solving geometric problem with multi-modal large language model, 2023.
- [16] Yuan Ge, Yilun Liu, Chi Hu, Weibin Meng, Shimin Tao, Xiaofeng Zhao, Hongxia Ma, Li Zhang, Boxing Chen, Hao Yang, Bei Li, Tong Xiao, and Jingbo Zhu. Clustering and ranking: Diversity-preserved instruction selection through expert-aligned quality estimation, 2024.
- [17] Jiayi He, Hehai Lin, Qingyun Wang, Yi Fung, and Heng Ji. Self-correction is more than refinement: A learning framework for visual and language reasoning tasks, 2024.
- [18] Wenxuan Huang, Bohan Jia, Zijie Zhai, et al. Vision-r1: Incentivizing reasoning capability in multimodal large language models. arXiv preprint arXiv:2503.06749, 2025.
- [19] Dongzhi Jiang, Renrui Zhang, Ziyu Guo, Yanwei Li, Yu Qi, Xinyan Chen, Liuhui Wang, Jianhan Jin, Claire Guo, Shen Yan, Bo Zhang, Chaoyou Fu, Peng Gao, and Hongsheng Li. Mme-cot: Benchmarking chain-of-thought in large multimodal models for reasoning quality, robustness, and efficiency, 2025.
- [20] Kushal Kafle, Brian Price, Scott Cohen, and Christopher Kanan. Dvqa: Understanding data visualizations via question answering, 2018.
- [21] Samira Ebrahimi Kahou, Vincent Michalski, Adam Atkinson, Akos Kadar, Adam Trischler, and Yoshua Bengio. Figureqa: An annotated figure dataset for visual reasoning, 2018.
- [22] Mehran Kazemi, Hamidreza Alvari, Ankit Anand, Jialin Wu, Xi Chen, and Radu Soricut. Geomverse: A systematic evaluation of large models for geometric reasoning, 2023.
- [23] Aniruddha Kembhavi, Mike Salvato, Eric Kolve, Minjoon Seo, Hannaneh Hajishirzi, and Ali Farhadi. A diagram is worth a dozen images, 2016.
- [24] Kimi Team. Kimi k1.5: Scaling reinforcement learning with llms. arXiv preprint arXiv:2501.12599, 2025.
- [25] Takeshi Kojima, Shixiang (Shane) Gu, Machel Reid, Yutaka Matsuo, and Yusuke Iwasawa. Large language models are zero-shot reasoners. In Advances in Neural Information Processing Systems, volume 35, pages 22199–22213, 2022.
- [26] Bo Li, Yuanhan Zhang, Dong Guo, Renrui Zhang, Feng Li, Hao Zhang, Kaichen Zhang, Peiyuan Zhang, Yanwei Li, Ziwei Liu, and Chunyuan Li. Llava-onevision: Easy visual task transfer, 2024.
- [27] Yifei Li, Zeqi Lin, Shizhuo Zhang, Qiang Fu, Bei Chen, Jian-Guang Lou, and Weizhu Chen. Making large language models better reasoners with step-aware verifier, 2023.
- [28] Zongxia Li, Xiyang Wu, Hongyang Du, Fuxiao Liu, Huy Nghiem, and Guangyao Shi. A survey of state of the art large vision language models: Alignment, benchmark, evaluations and challenges. arXiv preprint arXiv:2501.02189, 2025.
- [29] Hunter Lightman, Vineet Kosaraju, Yuri Burda, Harrison Edwards, Bowen Baker, Teddy Lee, Jan Leike, John Schulman, Ilya Sutskever, and Karl Cobbe. Let’s verify step by step. In The Twelfth International Conference on Learning Representations, 2024.
- [30] Adam Dahlgren Lindström and Savitha Sam Abraham. Clevr-math: A dataset for compositional language, visual and mathematical reasoning, 2022.
- [31] Hanxiao Liu, Karen Simonyan, and Yiming Yang. DARTS: Differentiable architecture search. In International Conference on Learning Representations, 2019.
- [32] Ilya Loshchilov and Frank Hutter. Decoupled weight decay regularization, 2019.
- [33] Pan Lu, Hritik Bansal, Tony Xia, Jiacheng Liu, Chunyuan Li, Hannaneh Hajishirzi, Hao Cheng, Kai-Wei Chang, Michel Galley, and Jianfeng Gao. Mathvista: Evaluating mathematical reasoning of foundation models in visual contexts. In International Conference on Learning Representations (ICLR), 2024.
- [34] Pan Lu, Ran Gong, Shibiao Jiang, Liang Qiu, Siyuan Huang, Xiaodan Liang, and Song-Chun Zhu. Inter-gps: Interpretable geometry problem solving with formal language and symbolic reasoning. In The 59th Annual Meeting of the Association for Computational Linguistics (ACL), 2021.
- [35] Pan Lu, Swaroop Mishra, Tony Xia, Liang Qiu, Kai-Wei Chang, Song-Chun Zhu, Oyvind Tafjord, Peter Clark, and Ashwin Kalyan. Learn to explain: Multimodal reasoning via thought chains for science question answering, 2022.
- [36] Pan Lu, Liang Qiu, Jiaqi Chen, Tony Xia, Yizhou Zhao, Wei Zhang, Zhou Yu, Xiaodan Liang, and Song-Chun Zhu. Iconqa: A new benchmark for abstract diagram understanding and visual language reasoning, 2022.
- [37] Liangchen Luo, Yinxiao Liu, Rosanne Liu, Samrat Phatale, Meiqi Guo, Harsh Lara, Yunxuan Li, Lei Shu, Yun Zhu, Lei Meng, Jiao Sun, and Abhinav Rastogi. Improve mathematical reasoning in language models by automated process supervision, 2024.
- [38] Qianli Ma, Haotian Zhou, Tingkai Liu, Jianbo Yuan, Pengfei Liu, Yang You, and Hongxia Yang. Let’s reward step by step: Step-level reward model as the navigators for reasoning, 2023.
- [39] Ahmed Masry, Do Xuan Long, Jia Qing Tan, Shafiq Joty, and Enamul Hoque. Chartqa: A benchmark for question answering about charts with visual and logical reasoning, 2022.
- [40] Minesh Mathew, Viraj Bagal, Rubèn Pérez Tito, Dimosthenis Karatzas, Ernest Valveny, and C. V Jawahar. Infographicvqa, 2021.
- [41] Meta AI. The llama 4 herd: The beginning of a new era of natively multimodal intelligence. https://ai.meta.com/blog/llama-4-multimodal-intelligence/, 2025. Llama 4 Maverick announcement; Accessed 2025-10-15.
- [42] Meta Llama. Llama-4-maverick-17b-128e-instruct (model card). https://huggingface.co/meta-llama/Llama-4-Maverick-17B-128E-Instruct, 2025. Accessed 2025-10-15.
- [43] Moonshot AI / Kimi. Kimi-k1.6-preview-20250308 (preview announcement). https://x.com/RotekSong/status/1900061355945926672, 2025. Accessed 2025-10-15; preview model announcement.
- [44] Niklas Muennighoff, Zitong Yang, Weijia Shi, Xiang Lisa Li, Li Fei-Fei, Hannaneh Hajishirzi, Luke Zettlemoyer, Percy Liang, Emmanuel Candès, and Tatsunori Hashimoto. s1: Simple test-time scaling, 2025.
- [45] OpenAI, :, Aaron Jaech, Adam Kalai, Adam Lerer, Adam Richardson, Ahmed El-Kishky, Aiden Low, Alec Helyar, Aleksander Madry, Alex Beutel, Alex Carney, Alex Iftimie, Alex Karpenko, Alex Tachard Passos, Alexander Neitz, Alexander Prokofiev, Alexander Wei, Allison Tam, Ally Bennett, Ananya Kumar, Andre Saraiva, Andrea Vallone, Andrew Duberstein, Andrew Kondrich, Andrey Mishchenko, Andy Applebaum, Angela Jiang, Ashvin Nair, Barret Zoph, Behrooz Ghorbani, Ben Rossen, Benjamin Sokolowsky, Boaz Barak, Bob McGrew, Borys Minaiev, Botao Hao, Bowen Baker, Brandon Houghton, Brandon McKinzie, Brydon Eastman, Camillo Lugaresi, Cary Bassin, Cary Hudson, Chak Ming Li, Charles de Bourcy, Chelsea Voss, Chen Shen, Chong Zhang, Chris Koch, Chris Orsinger, Christopher Hesse, Claudia Fischer, Clive Chan, Dan Roberts, Daniel Kappler, Daniel Levy, Daniel Selsam, David Dohan, David Farhi, David Mely, David Robinson, Dimitris Tsipras, Doug Li, Dragos Oprica, Eben Freeman, Eddie Zhang, Edmund Wong, Elizabeth Proehl, Enoch Cheung, Eric Mitchell, Eric Wallace, Erik Ritter, Evan Mays, Fan Wang, Felipe Petroski Such, Filippo Raso, Florencia Leoni, Foivos Tsimpourlas, Francis Song, Fred von Lohmann, Freddie Sulit, Geoff Salmon, Giambattista Parascandolo, Gildas Chabot, Grace Zhao, Greg Brockman, Guillaume Leclerc, Hadi Salman, Haiming Bao, Hao Sheng, Hart Andrin, Hessam Bagherinezhad, Hongyu Ren, Hunter Lightman, Hyung Won Chung, Ian Kivlichan, Ian O’Connell, Ian Osband, Ignasi Clavera Gilaberte, Ilge Akkaya, Ilya Kostrikov, Ilya Sutskever, Irina Kofman, Jakub Pachocki, James Lennon, Jason Wei, Jean Harb, Jerry Twore, Jiacheng Feng, Jiahui Yu, Jiayi Weng, Jie Tang, Jieqi Yu, Joaquin Quiñonero Candela, Joe Palermo, Joel Parish, Johannes Heidecke, John Hallman, John Rizzo, Jonathan Gordon, Jonathan Uesato, Jonathan Ward, Joost Huizinga, Julie Wang, Kai Chen, Kai Xiao, Karan Singhal, Karina Nguyen, Karl Cobbe, Katy Shi, Kayla Wood, Kendra Rimbach, Keren Gu-Lemberg, Kevin Liu, Kevin Lu, Kevin Stone, Kevin Yu, Lama Ahmad, Lauren Yang, Leo Liu, Leon Maksin, Leyton Ho, Liam Fedus, Lilian Weng, Linden Li, Lindsay McCallum, Lindsey Held, Lorenz Kuhn, Lukas Kondraciuk, Lukasz Kaiser, Luke Metz, Madelaine Boyd, Maja Trebacz, Manas Joglekar, Mark Chen, Marko Tintor, Mason Meyer, Matt Jones, Matt Kaufer, Max Schwarzer, Meghan Shah, Mehmet Yatbaz, Melody Y. Guan, Mengyuan Xu, Mengyuan Yan, Mia Glaese, Mianna Chen, Michael Lampe, Michael Malek, Michele Wang, Michelle Fradin, Mike McClay, Mikhail Pavlov, Miles Wang, Mingxuan Wang, Mira Murati, Mo Bavarian, Mostafa Rohaninejad, Nat McAleese, Neil Chowdhury, Neil Chowdhury, Nick Ryder, Nikolas Tezak, Noam Brown, Ofir Nachum, Oleg Boiko, Oleg Murk, Olivia Watkins, Patrick Chao, Paul Ashbourne, Pavel Izmailov, Peter Zhokhov, Rachel Dias, Rahul Arora, Randall Lin, Rapha Gontijo Lopes, Raz Gaon, Reah Miyara, Reimar Leike, Renny Hwang, Rhythm Garg, Robin Brown, Roshan James, Rui Shu, Ryan Cheu, Ryan Greene, Saachi Jain, Sam Altman, Sam Toizer, Sam Toyer, Samuel Miserendino, Sandhini Agarwal, Santiago Hernandez, Sasha Baker, Scott McKinney, Scottie Yan, Shengjia Zhao, Shengli Hu, Shibani Santurkar, Shraman Ray Chaudhuri, Shuyuan Zhang, Siyuan Fu, Spencer Papay, Steph Lin, Suchir Balaji, Suvansh Sanjeev, Szymon Sidor, Tal Broda, Aidan Clark, Tao Wang, Taylor Gordon, Ted Sanders, Tejal Patwardhan, Thibault Sottiaux, Thomas Degry, Thomas Dimson, Tianhao Zheng, Timur Garipov, Tom Stasi, Trapit Bansal, Trevor Creech, Troy Peterson, Tyna Eloundou, Valerie Qi, Vineet Kosaraju, Vinnie Monaco, Vitchyr Pong, Vlad Fomenko, Weiyi Zheng, Wenda Zhou, Wes McCabe, Wojciech Zaremba, Yann Dubois, Yinghai Lu, Yining Chen, Young Cha, Yu Bai, Yuchen He, Yuchen Zhang, Yunyun Wang, Zheng Shao, and Zhuohan Li. Openai o1 system card, 2024.
- [46] OpenAI, Josh Achiam, Steven Adler, Sandhini Agarwal, Lama Ahmad, Ilge Akkaya, Florencia Leoni Aleman, Diogo Almeida, Janko Altenschmidt, Sam Altman, Shyamal Anadkat, Red Avila, Igor Babuschkin, Suchir Balaji, Valerie Balcom, Paul Baltescu, Haiming Bao, Mohammad Bavarian, Jeff Belgum, Irwan Bello, Jake Berdine, Gabriel Bernadett-Shapiro, Christopher Berner, Lenny Bogdonoff, Oleg Boiko, Madelaine Boyd, Anna-Luisa Brakman, Greg Brockman, Tim Brooks, Miles Brundage, Kevin Button, Trevor Cai, Rosie Campbell, Andrew Cann, Brittany Carey, Chelsea Carlson, Rory Carmichael, Brooke Chan, Che Chang, Fotis Chantzis, Derek Chen, Sully Chen, Ruby Chen, Jason Chen, Mark Chen, Ben Chess, Chester Cho, Casey Chu, Hyung Won Chung, Dave Cummings, Jeremiah Currier, Yunxing Dai, Cory Decareaux, Thomas Degry, Noah Deutsch, Damien Deville, Arka Dhar, David Dohan, Steve Dowling, Sheila Dunning, Adrien Ecoffet, Atty Eleti, Tyna Eloundou, David Farhi, Liam Fedus, Niko Felix, Simón Posada Fishman, Juston Forte, Isabella Fulford, Leo Gao, Elie Georges, Christian Gibson, Vik Goel, Tarun Gogineni, Gabriel Goh, Rapha Gontijo-Lopes, Jonathan Gordon, Morgan Grafstein, Scott Gray, Ryan Greene, Joshua Gross, Shixiang Shane Gu, Yufei Guo, Chris Hallacy, Jesse Han, Jeff Harris, Yuchen He, Mike Heaton, Johannes Heidecke, Chris Hesse, Alan Hickey, Wade Hickey, Peter Hoeschele, Brandon Houghton, Kenny Hsu, Shengli Hu, Xin Hu, Joost Huizinga, Shantanu Jain, Shawn Jain, Joanne Jang, Angela Jiang, Roger Jiang, Haozhun Jin, Denny Jin, Shino Jomoto, Billie Jonn, Heewoo Jun, Tomer Kaftan, Łukasz Kaiser, Ali Kamali, Ingmar Kanitscheider, Nitish Shirish Keskar, Tabarak Khan, Logan Kilpatrick, Jong Wook Kim, Christina Kim, Yongjik Kim, Jan Hendrik Kirchner, Jamie Kiros, Matt Knight, Daniel Kokotajlo, Łukasz Kondraciuk, Andrew Kondrich, Aris Konstantinidis, Kyle Kosic, Gretchen Krueger, Vishal Kuo, Michael Lampe, Ikai Lan, Teddy Lee, Jan Leike, Jade Leung, Daniel Levy, Chak Ming Li, Rachel Lim, Molly Lin, Stephanie Lin, Mateusz Litwin, Theresa Lopez, Ryan Lowe, Patricia Lue, Anna Makanju, Kim Malfacini, Sam Manning, Todor Markov, Yaniv Markovski, Bianca Martin, Katie Mayer, Andrew Mayne, Bob McGrew, Scott Mayer McKinney, Christine McLeavey, Paul McMillan, Jake McNeil, David Medina, Aalok Mehta, Jacob Menick, Luke Metz, Andrey Mishchenko, Pamela Mishkin, Vinnie Monaco, Evan Morikawa, Daniel Mossing, Tong Mu, Mira Murati, Oleg Murk, David Mély, Ashvin Nair, Reiichiro Nakano, Rajeev Nayak, Arvind Neelakantan, Richard Ngo, Hyeonwoo Noh, Long Ouyang, Cullen O’Keefe, Jakub Pachocki, Alex Paino, Joe Palermo, Ashley Pantuliano, Giambattista Parascandolo, Joel Parish, Emy Parparita, Alex Passos, Mikhail Pavlov, Andrew Peng, Adam Perelman, Filipe de Avila Belbute Peres, Michael Petrov, Henrique Ponde de Oliveira Pinto, Michael, Pokorny, Michelle Pokrass, Vitchyr H. Pong, Tolly Powell, Alethea Power, Boris Power, Elizabeth Proehl, Raul Puri, Alec Radford, Jack Rae, Aditya Ramesh, Cameron Raymond, Francis Real, Kendra Rimbach, Carl Ross, Bob Rotsted, Henri Roussez, Nick Ryder, Mario Saltarelli, Ted Sanders, Shibani Santurkar, Girish Sastry, Heather Schmidt, David Schnurr, John Schulman, Daniel Selsam, Kyla Sheppard, Toki Sherbakov, Jessica Shieh, Sarah Shoker, Pranav Shyam, Szymon Sidor, Eric Sigler, Maddie Simens, Jordan Sitkin, Katarina Slama, Ian Sohl, Benjamin Sokolowsky, Yang Song, Natalie Staudacher, Felipe Petroski Such, Natalie Summers, Ilya Sutskever, Jie Tang, Nikolas Tezak, Madeleine B. Thompson, Phil Tillet, Amin Tootoonchian, Elizabeth Tseng, Preston Tuggle, Nick Turley, Jerry Tworek, Juan Felipe Cerón Uribe, Andrea Vallone, Arun Vijayvergiya, Chelsea Voss, Carroll Wainwright, Justin Jay Wang, Alvin Wang, Ben Wang, Jonathan Ward, Jason Wei, CJ Weinmann, Akila Welihinda, Peter Welinder, Jiayi Weng, Lilian Weng, Matt Wiethoff, Dave Willner, Clemens Winter, Samuel Wolrich, Hannah Wong, Lauren Workman, Sherwin Wu, Jeff Wu, Michael Wu, Kai Xiao, Tao Xu, Sarah Yoo, Kevin Yu, Qiming Yuan, Wojciech Zaremba, Rowan Zellers, Chong Zhang, Marvin Zhang, Shengjia Zhao, Tianhao Zheng, Juntang Zhuang, William Zhuk, and Barret Zoph. Gpt-4 technical report, 2024.
- [47] Guilherme Penedo, Anton Lozhkov, Hynek Kydlíček, Loubna Ben Allal, Edward Beeching, Agustín Piqueres Lajarín, Quentin Gallouédec, Nathan Habib, Lewis Tunstall, and Leandro von Werra. Codeforces. https://huggingface.co/datasets/open-r1/codeforces, 2025.
- [48] Runqi Qiao, Qiuna Tan, Guanting Dong, Minhui Wu, Chong Sun, Xiaoshuai Song, Zhuoma GongQue, Shanglin Lei, Zhe Wei, Miaoxuan Zhang, Runfeng Qiao, Yifan Zhang, Xiao Zong, Yida Xu, Muxi Diao, Zhimin Bao, Chen Li, and Honggang Zhang. We-math: Does your large multimodal model achieve human-like mathematical reasoning?, 2024.
- [49] Qwen, :, An Yang, Baosong Yang, Beichen Zhang, Binyuan Hui, Bo Zheng, Bowen Yu, Chengyuan Li, Dayiheng Liu, Fei Huang, Haoran Wei, Huan Lin, Jian Yang, Jianhong Tu, Jianwei Zhang, Jianxin Yang, Jiaxi Yang, Jingren Zhou, Junyang Lin, Kai Dang, Keming Lu, Keqin Bao, Kexin Yang, Le Yu, Mei Li, Mingfeng Xue, Pei Zhang, Qin Zhu, Rui Men, Runji Lin, Tianhao Li, Tianyi Tang, Tingyu Xia, Xingzhang Ren, Xuancheng Ren, Yang Fan, Yang Su, Yichang Zhang, Yu Wan, Yuqiong Liu, Zeyu Cui, Zhenru Zhang, and Zihan Qiu. Qwen2.5 technical report, 2025.
- [50] Alex Reid et al. Gemini 1.5: Unlocking multimodal understanding across millions of tokens, 2024.
- [51] Minjoon Seo, Hannaneh Hajishirzi, Ali Farhadi, Oren Etzioni, and Clint Malcolm. Solving geometry problems: Combining text and diagram interpretation. In Lluís Màrquez, Chris Callison-Burch, and Jian Su, editors, Proceedings of the 2015 Conference on Empirical Methods in Natural Language Processing, pages 1466–1476, Lisbon, Portugal, September 2015. Association for Computational Linguistics.
- [52] Zhihong Shao, Peiyi Wang, Qihao Zhu, Runxin Xu, Junxiao Song, Xiao Bi, Haowei Zhang, Mingchuan Zhang, Y. K. Li, Y. Wu, and Daya Guo. Deepseekmath: Pushing the limits of mathematical reasoning in open language models, 2024.
- [53] Jun Shu, Qi Xie, Lixuan Yi, Qian Zhao, Sanping Zhou, Zongben Xu, and Deyu Meng. Meta-weight-net: Learning an explicit mapping for sample weighting, 2019.
- [54] Jun Shu, Qi Xie, Lixuan Yi, Qian Zhao, Sanping Zhou, Zongben Xu, and Deyu Meng. Meta-weight-net: Learning an explicit mapping for sample weighting. In H. Wallach, H. Larochelle, A. Beygelzimer, F. d'Alché-Buc, E. Fox, and R. Garnett, editors, Advances in Neural Information Processing Systems, volume 32. Curran Associates, Inc., 2019.
- [55] Charlie Snell, Jaehoon Lee, Kelvin Xu, and Aviral Kumar. Scaling llm test-time compute optimally can be more effective than scaling model parameters, 2024.
- [56] Shezheng Song, Xiaopeng Li, Shasha Li, Shan Zhao, Jie Yu, Jun Ma, Xiaoguang Mao, and Weimin Zhang. How to bridge the gap between modalities: Survey on multimodal large language model, 2025.
- [57] Daouda Sow, Herbert Woisetschläger, Saikiran Bulusu, Shiqiang Wang, Hans-Arno Jacobsen, and Yingbin Liang. Dynamic loss-based sample reweighting for improved large language model pretraining, 2025.
- [58] StepFun. Step-r1-v-mini: A lightweight yet powerful multimodal reasoning model. https://www.stepfun.com/docs/en/step-r1-v-mini, 2025. Accessed 2025-10-15.
- [59] Hugo Touvron, Thibaut Lavril, Gautier Izacard, Xavier Martinet, Marie-Anne Lachaux, Timothée Lacroix, Baptiste Rozière, Naman Goyal, Eric Hambro, Faisal Azhar, Aurelien Rodriguez, Armand Joulin, Edouard Grave, and Guillaume Lample. Llama: Open and efficient foundation language models, 2023.
- [60] Volcengine / ByteDance. Doubao large models (product page). https://www.volcengine.com/product/doubao, 2025. Accessed 2025-10-15.
- [61] Chaojie Wang, Yanchen Deng, Zhiyi Lyu, Liang Zeng, Jujie He, Shuicheng Yan, and Bo An. Q*: Improving multi-step reasoning for llms with deliberative planning, 2024.
- [62] Haozhe Wang, Chao Qu, Zuming Huang, Wei Chu, Fangzhen Lin, and Wenhu Chen. Vl-rethinker: Incentivizing self-reflection of vision-language models with reinforcement learning. arXiv preprint arXiv:2504.08837, 2025.
- [63] Ke Wang, Junting Pan, Weikang Shi, Zimu Lu, Mingjie Zhan, and Hongsheng Li. Measuring multimodal mathematical reasoning with math-vision dataset, 2024.
- [64] Peiyi Wang, Lei Li, Zhihong Shao, Runxin Xu, Damai Dai, Yifei Li, Deli Chen, Yu Wu, and Zhifang Sui. Math-shepherd: Verify and reinforce LLMs step-by-step without human annotations. In Lun-Wei Ku, Andre Martins, and Vivek Srikumar, editors, Proceedings of the 62nd Annual Meeting of the Association for Computational Linguistics (Volume 1: Long Papers), pages 9426–9439, Bangkok, Thailand, August 2024. Association for Computational Linguistics.
- [65] Peiyi Wang, Lei Li, Zhihong Shao, Runxin Xu, Damai Dai, Yifei Li, Deli Chen, Yu Wu, and Zhifang Sui. Math-shepherd: Verify and reinforce LLMs step-by-step without human annotations. In Lun-Wei Ku, Andre Martins, and Vivek Srikumar, editors, Proceedings of the 62nd Annual Meeting of the Association for Computational Linguistics (Volume 1: Long Papers), pages 9426–9439, Bangkok, Thailand, August 2024. Association for Computational Linguistics.
- [66] Peng Wang, Shuai Bai, Sinan Tan, Shijie Wang, Zhihao Fan, Jinze Bai, Keqin Chen, Xuejing Liu, Jialin Wang, Wenbin Ge, Yang Fan, Kai Dang, Mengfei Du, Xuancheng Ren, Rui Men, Dayiheng Liu, Chang Zhou, Jingren Zhou, and Junyang Lin. Qwen2-vl: Enhancing vision-language model’s perception of the world at any resolution. arXiv preprint arXiv:2409.12191, 2024.
- [67] Weiyun Wang, Zhe Chen, Wenhai Wang, Yue Cao, Yangzhou Liu, Zhangwei Gao, Jinguo Zhu, Xizhou Zhu, Lewei Lu, Yu Qiao, and Jifeng Dai. Enhancing the reasoning ability of multimodal large language models via mixed preference optimization. arXiv preprint arXiv:2411.10442, 2024.
- [68] Xuezhi Wang, Jason Wei, Dale Schuurmans, Quoc Le, Ed Chi, Sharan Narang, Aakanksha Chowdhery, and Denny Zhou. Self-consistency improves chain of thought reasoning in language models, 2023.
- [69] Zihan Wang, Yunxuan Li, Yuexin Wu, Liangchen Luo, Le Hou, Hongkun Yu, and Jingbo Shang. Multi-step problem solving through a verifier: An empirical analysis on model-induced process supervision, 2024.
- [70] Jason Wei, Xuezhi Wang, Dale Schuurmans, Maarten Bosma, brian ichter, Fei Xia, Ed H. Chi, Quoc V Le, and Denny Zhou. Chain of thought prompting elicits reasoning in large language models. In Alice H. Oh, Alekh Agarwal, Danielle Belgrave, and Kyunghyun Cho, editors, Advances in Neural Information Processing Systems, 2022.
- [71] Jason Wei, Xuezhi Wang, Dale Schuurmans, Maarten Bosma, Brian Ichter, Fei Xia, Ed H. Chi, Quoc V. Le, and Denny Zhou. Chain-of-thought prompting elicits reasoning in large language models. In Advances in Neural Information Processing Systems, volume 35, pages 24824–24837. Curran Associates, Inc., 2022.
- [72] Jiayang Wu, Wensheng Gan, Zefeng Chen, Shicheng Wan, and Philip S. Yu. Multimodal large language models: A survey, 2023.
- [73] Sang Michael Xie, Hieu Pham, Xuanyi Dong, Nan Du, Hanxiao Liu, Yifeng Lu, Percy Liang, Quoc V Le, Tengyu Ma, and Adams Wei Yu. Doremi: Optimizing data mixtures speeds up language model pretraining. In Thirty-seventh Conference on Neural Information Processing Systems, 2023.
- [74] Guowei Xu, Peng Jin, Hao Li, Yibing Song, Lichao Sun, and Li Yuan. Llava-cot: Let vision language models reason step-by-step, 2024.
- [75] Guowei Xu, Peng Jin, Hao Li, Yibing Song, Lichao Sun, and Li Yuan. Llava-cot: Let vision language models reason step-by-step, 2025.
- [76] Jiasheng Ye, Peiju Liu, Tianxiang Sun, Jun Zhan, Yunhua Zhou, and Xipeng Qiu. Data mixing laws: Optimizing data mixtures by predicting language modeling performance. In The Thirteenth International Conference on Learning Representations, 2025.
- [77] Tianyu Yu, Haoye Zhang, Qiming Li, Qixin Xu, Yuan Yao, Da Chen, Xiaoman Lu, Ganqu Cui, Yunkai Dang, Taiwen He, Xiaocheng Feng, Jun Song, Bo Zheng, Zhiyuan Liu, Tat-Seng Chua, and Maosong Sun. Rlaif-v: Open-source ai feedback leads to super gpt-4v trustworthiness. arXiv preprint arXiv:2405.17220, 2024.
- [78] Weihao Yu, Zhengyuan Yang, Linjie Li, Jianfeng Wang, Kevin Lin, Zicheng Liu, Xinchao Wang, and Lijuan Wang. Mm-vet: Evaluating large multimodal models for integrated capabilities, 2024.
- [79] Xiang Yue, Yuansheng Ni, Kai Zhang, Tianyu Zheng, Ruoqi Liu, Ge Zhang, Samuel Stevens, Dongfu Jiang, Weiming Ren, Yuxuan Sun, Cong Wei, Botao Yu, Ruibin Yuan, Renliang Sun, Ming Yin, Boyuan Zheng, Zhenzhu Yang, Yibo Liu, Wenhao Huang, Huan Sun, Yu Su, and Wenhu Chen. Mmmu: A massive multi-discipline multimodal understanding and reasoning benchmark for expert agi, 2024.
- [80] Di Zhang. Aime_1983_2024 (revision 6283828), 2025.
- [81] Zhuosheng Zhang, Aston Zhang, Mu Li, and Alex Smola. Automatic chain of thought prompting in large language models. In The Eleventh International Conference on Learning Representations, 2023.
- [82] Haojie Zheng, Tianyang Xu, Hanchi Sun, Shu Pu, Ruoxi Chen, and Lichao Sun. Thinking before looking: Improving multimodal llm reasoning via mitigating visual hallucination, 2024.
NeurIPS Paper Checklist
1. Claims
1. Question: Do the main claims made in the abstract and introduction accurately reflect the paper’s contributions and scope?
1. Answer: [Yes]
1. Justification: The abstract and introduction faithfully present the contributions and scope of the paper.
1. Guidelines:
- The answer NA means that the abstract and introduction do not include the claims made in the paper.
- The abstract and/or introduction should clearly state the claims made, including the contributions made in the paper and important assumptions and limitations. A No or NA answer to this question will not be perceived well by the reviewers.
- The claims made should match theoretical and experimental results, and reflect how much the results can be expected to generalize to other settings.
- It is fine to include aspirational goals as motivation as long as it is clear that these goals are not attained by the paper.
1. Limitations
1. Question: Does the paper discuss the limitations of the work performed by the authors?
1. Answer: [Yes]
1. Justification: We include the limitations of our work in Section E.
1. Guidelines:
- The answer NA means that the paper has no limitation while the answer No means that the paper has limitations, but those are not discussed in the paper.
- The authors are encouraged to create a separate "Limitations" section in their paper.
- The paper should point out any strong assumptions and how robust the results are to violations of these assumptions (e.g., independence assumptions, noiseless settings, model well-specification, asymptotic approximations only holding locally). The authors should reflect on how these assumptions might be violated in practice and what the implications would be.
- The authors should reflect on the scope of the claims made, e.g., if the approach was only tested on a few datasets or with a few runs. In general, empirical results often depend on implicit assumptions, which should be articulated.
- The authors should reflect on the factors that influence the performance of the approach. For example, a facial recognition algorithm may perform poorly when image resolution is low or images are taken in low lighting. Or a speech-to-text system might not be used reliably to provide closed captions for online lectures because it fails to handle technical jargon.
- The authors should discuss the computational efficiency of the proposed algorithms and how they scale with dataset size.
- If applicable, the authors should discuss possible limitations of their approach to address problems of privacy and fairness.
- While the authors might fear that complete honesty about limitations might be used by reviewers as grounds for rejection, a worse outcome might be that reviewers discover limitations that aren’t acknowledged in the paper. The authors should use their best judgment and recognize that individual actions in favor of transparency play an important role in developing norms that preserve the integrity of the community. Reviewers will be specifically instructed to not penalize honesty concerning limitations.
1. Theory assumptions and proofs
1. Question: For each theoretical result, does the paper provide the full set of assumptions and a complete (and correct) proof?
1. Answer: [N/A]
1. Justification: This paper does not include theoretical results.
1. Guidelines:
- The answer NA means that the paper does not include theoretical results.
- All the theorems, formulas, and proofs in the paper should be numbered and cross-referenced.
- All assumptions should be clearly stated or referenced in the statement of any theorems.
- The proofs can either appear in the main paper or the supplemental material, but if they appear in the supplemental material, the authors are encouraged to provide a short proof sketch to provide intuition.
- Inversely, any informal proof provided in the core of the paper should be complemented by formal proofs provided in appendix or supplemental material.
- Theorems and Lemmas that the proof relies upon should be properly referenced.
1. Experimental result reproducibility
1. Question: Does the paper fully disclose all the information needed to reproduce the main experimental results of the paper to the extent that it affects the main claims and/or conclusions of the paper (regardless of whether the code and data are provided or not)?
1. Answer: [Yes]
1. Justification: All the information needed to reproduce the main experimental results are provided in Section 3, 4, and 5. We will release the implementation if the paper is accepted.
1. Guidelines:
- The answer NA means that the paper does not include experiments.
- If the paper includes experiments, a No answer to this question will not be perceived well by the reviewers: Making the paper reproducible is important, regardless of whether the code and data are provided or not.
- If the contribution is a dataset and/or model, the authors should describe the steps taken to make their results reproducible or verifiable.
- Depending on the contribution, reproducibility can be accomplished in various ways. For example, if the contribution is a novel architecture, describing the architecture fully might suffice, or if the contribution is a specific model and empirical evaluation, it may be necessary to either make it possible for others to replicate the model with the same dataset, or provide access to the model. In general. releasing code and data is often one good way to accomplish this, but reproducibility can also be provided via detailed instructions for how to replicate the results, access to a hosted model (e.g., in the case of a large language model), releasing of a model checkpoint, or other means that are appropriate to the research performed.
- While NeurIPS does not require releasing code, the conference does require all submissions to provide some reasonable avenue for reproducibility, which may depend on the nature of the contribution. For example
1. If the contribution is primarily a new algorithm, the paper should make it clear how to reproduce that algorithm.
1. If the contribution is primarily a new model architecture, the paper should describe the architecture clearly and fully.
1. If the contribution is a new model (e.g., a large language model), then there should either be a way to access this model for reproducing the results or a way to reproduce the model (e.g., with an open-source dataset or instructions for how to construct the dataset).
1. We recognize that reproducibility may be tricky in some cases, in which case authors are welcome to describe the particular way they provide for reproducibility. In the case of closed-source models, it may be that access to the model is limited in some way (e.g., to registered users), but it should be possible for other researchers to have some path to reproducing or verifying the results.
1. Open access to data and code
1. Question: Does the paper provide open access to the data and code, with sufficient instructions to faithfully reproduce the main experimental results, as described in supplemental material?
1. Answer: [Yes]
1. Justification: We will release the code if the paper is accepted or through an anonymous link per reviewer’s request.
1. Guidelines:
- The answer NA means that paper does not include experiments requiring code.
- Please see the NeurIPS code and data submission guidelines (https://nips.cc/public/guides/CodeSubmissionPolicy) for more details.
- While we encourage the release of code and data, we understand that this might not be possible, so “No” is an acceptable answer. Papers cannot be rejected simply for not including code, unless this is central to the contribution (e.g., for a new open-source benchmark).
- The instructions should contain the exact command and environment needed to run to reproduce the results. See the NeurIPS code and data submission guidelines (https://nips.cc/public/guides/CodeSubmissionPolicy) for more details.
- The authors should provide instructions on data access and preparation, including how to access the raw data, preprocessed data, intermediate data, and generated data, etc.
- The authors should provide scripts to reproduce all experimental results for the new proposed method and baselines. If only a subset of experiments are reproducible, they should state which ones are omitted from the script and why.
- At submission time, to preserve anonymity, the authors should release anonymized versions (if applicable).
- Providing as much information as possible in supplemental material (appended to the paper) is recommended, but including URLs to data and code is permitted.
1. Experimental setting/details
1. Question: Does the paper specify all the training and test details (e.g., data splits, hyperparameters, how they were chosen, type of optimizer, etc.) necessary to understand the results?
1. Answer: [Yes]
1. Justification: The detailed experimental settings are included in Section 5.1 and Appendix B, C.
1. Guidelines:
- The answer NA means that the paper does not include experiments.
- The experimental setting should be presented in the core of the paper to a level of detail that is necessary to appreciate the results and make sense of them.
- The full details can be provided either with the code, in appendix, or as supplemental material.
1. Experiment statistical significance
1. Question: Does the paper report error bars suitably and correctly defined or other appropriate information about the statistical significance of the experiments?
1. Answer: [No]
1. Justification: Due to the resource limitation, we do not report error bars. But note that we conduct experiments on diverse datasets and follow the protocol used by previous works for fair comparisons.
1. Guidelines:
- The answer NA means that the paper does not include experiments.
- The authors should answer "Yes" if the results are accompanied by error bars, confidence intervals, or statistical significance tests, at least for the experiments that support the main claims of the paper.
- The factors of variability that the error bars are capturing should be clearly stated (for example, train/test split, initialization, random drawing of some parameter, or overall run with given experimental conditions).
- The method for calculating the error bars should be explained (closed form formula, call to a library function, bootstrap, etc.)
- The assumptions made should be given (e.g., Normally distributed errors).
- It should be clear whether the error bar is the standard deviation or the standard error of the mean.
- It is OK to report 1-sigma error bars, but one should state it. The authors should preferably report a 2-sigma error bar than state that they have a 96% CI, if the hypothesis of Normality of errors is not verified.
- For asymmetric distributions, the authors should be careful not to show in tables or figures symmetric error bars that would yield results that are out of range (e.g. negative error rates).
- If error bars are reported in tables or plots, The authors should explain in the text how they were calculated and reference the corresponding figures or tables in the text.
1. Experiments compute resources
1. Question: For each experiment, does the paper provide sufficient information on the computer resources (type of compute workers, memory, time of execution) needed to reproduce the experiments?
1. Answer: [Yes]
1. Justification: Compute resources used in the experiments are reported in Section 5.1.
1. Guidelines:
- The answer NA means that the paper does not include experiments.
- The paper should indicate the type of compute workers CPU or GPU, internal cluster, or cloud provider, including relevant memory and storage.
- The paper should provide the amount of compute required for each of the individual experimental runs as well as estimate the total compute.
- The paper should disclose whether the full research project required more compute than the experiments reported in the paper (e.g., preliminary or failed experiments that didn’t make it into the paper).
1. Code of ethics
1. Question: Does the research conducted in the paper conform, in every respect, with the NeurIPS Code of Ethics https://neurips.cc/public/EthicsGuidelines?
1. Answer: [Yes]
1. Justification: Our paper followed the NeurIPS Code of Ethics.
1. Guidelines:
- The answer NA means that the authors have not reviewed the NeurIPS Code of Ethics.
- If the authors answer No, they should explain the special circumstances that require a deviation from the Code of Ethics.
- The authors should make sure to preserve anonymity (e.g., if there is a special consideration due to laws or regulations in their jurisdiction).
1. Broader impacts
1. Question: Does the paper discuss both potential positive societal impacts and negative societal impacts of the work performed?
1. Answer: [Yes]
1. Justification: Our work helps to enhance multimodal reasoning with DreamPRM. Although the models could still produce errors, we suggest not to rely completely on LLMs and don’t perceive it as major negative societal impact.
1. Guidelines:
- The answer NA means that there is no societal impact of the work performed.
- If the authors answer NA or No, they should explain why their work has no societal impact or why the paper does not address societal impact.
- Examples of negative societal impacts include potential malicious or unintended uses (e.g., disinformation, generating fake profiles, surveillance), fairness considerations (e.g., deployment of technologies that could make decisions that unfairly impact specific groups), privacy considerations, and security considerations.
- The conference expects that many papers will be foundational research and not tied to particular applications, let alone deployments. However, if there is a direct path to any negative applications, the authors should point it out. For example, it is legitimate to point out that an improvement in the quality of generative models could be used to generate deepfakes for disinformation. On the other hand, it is not needed to point out that a generic algorithm for optimizing neural networks could enable people to train models that generate Deepfakes faster.
- The authors should consider possible harms that could arise when the technology is being used as intended and functioning correctly, harms that could arise when the technology is being used as intended but gives incorrect results, and harms following from (intentional or unintentional) misuse of the technology.
- If there are negative societal impacts, the authors could also discuss possible mitigation strategies (e.g., gated release of models, providing defenses in addition to attacks, mechanisms for monitoring misuse, mechanisms to monitor how a system learns from feedback over time, improving the efficiency and accessibility of ML).
1. Safeguards
1. Question: Does the paper describe safeguards that have been put in place for responsible release of data or models that have a high risk for misuse (e.g., pretrained language models, image generators, or scraped datasets)?
1. Answer: [N/A]
1. Justification: This paper poses no such risks.
1. Guidelines:
- The answer NA means that the paper poses no such risks.
- Released models that have a high risk for misuse or dual-use should be released with necessary safeguards to allow for controlled use of the model, for example by requiring that users adhere to usage guidelines or restrictions to access the model or implementing safety filters.
- Datasets that have been scraped from the Internet could pose safety risks. The authors should describe how they avoided releasing unsafe images.
- We recognize that providing effective safeguards is challenging, and many papers do not require this, but we encourage authors to take this into account and make a best faith effort.
1. Licenses for existing assets
1. Question: Are the creators or original owners of assets (e.g., code, data, models), used in the paper, properly credited and are the license and terms of use explicitly mentioned and properly respected?
1. Answer: [Yes]
1. Justification: We have properly cited papers and models used in our paper.
1. Guidelines:
- The answer NA means that the paper does not use existing assets.
- The authors should cite the original paper that produced the code package or dataset.
- The authors should state which version of the asset is used and, if possible, include a URL.
- The name of the license (e.g., CC-BY 4.0) should be included for each asset.
- For scraped data from a particular source (e.g., website), the copyright and terms of service of that source should be provided.
- If assets are released, the license, copyright information, and terms of use in the package should be provided. For popular datasets, paperswithcode.com/datasets has curated licenses for some datasets. Their licensing guide can help determine the license of a dataset.
- For existing datasets that are re-packaged, both the original license and the license of the derived asset (if it has changed) should be provided.
- If this information is not available online, the authors are encouraged to reach out to the asset’s creators.
1. New assets
1. Question: Are new assets introduced in the paper well documented and is the documentation provided alongside the assets?
1. Answer: [Yes]
1. Justification: We will release our code with detailed readme files and instructions.
1. Guidelines:
- The answer NA means that the paper does not release new assets.
- Researchers should communicate the details of the dataset/code/model as part of their submissions via structured templates. This includes details about training, license, limitations, etc.
- The paper should discuss whether and how consent was obtained from people whose asset is used.
- At submission time, remember to anonymize your assets (if applicable). You can either create an anonymized URL or include an anonymized zip file.
1. Crowdsourcing and research with human subjects
1. Question: For crowdsourcing experiments and research with human subjects, does the paper include the full text of instructions given to participants and screenshots, if applicable, as well as details about compensation (if any)?
1. Answer: [N/A]
1. Justification: This work does not involve crowdsourcing nor research with human subjects.
1. Guidelines:
- The answer NA means that the paper does not involve crowdsourcing nor research with human subjects.
- Including this information in the supplemental material is fine, but if the main contribution of the paper involves human subjects, then as much detail as possible should be included in the main paper.
- According to the NeurIPS Code of Ethics, workers involved in data collection, curation, or other labor should be paid at least the minimum wage in the country of the data collector.
1. Institutional review board (IRB) approvals or equivalent for research with human subjects
1. Question: Does the paper describe potential risks incurred by study participants, whether such risks were disclosed to the subjects, and whether Institutional Review Board (IRB) approvals (or an equivalent approval/review based on the requirements of your country or institution) were obtained?
1. Answer: [N/A]
1. Justification: This work does not involve crowdsourcing nor research with human subjects.
1. Guidelines:
- The answer NA means that the paper does not involve crowdsourcing nor research with human subjects.
- Depending on the country in which research is conducted, IRB approval (or equivalent) may be required for any human subjects research. If you obtained IRB approval, you should clearly state this in the paper.
- We recognize that the procedures for this may vary significantly between institutions and locations, and we expect authors to adhere to the NeurIPS Code of Ethics and the guidelines for their institution.
- For initial submissions, do not include any information that would break anonymity (if applicable), such as the institution conducting the review.
1. Declaration of LLM usage
1. Question: Does the paper describe the usage of LLMs if it is an important, original, or non-standard component of the core methods in this research? Note that if the LLM is used only for writing, editing, or formatting purposes and does not impact the core methodology, scientific rigorousness, or originality of the research, declaration is not required.
1. Answer: [Yes]
1. Justification: LLMs, specifically MLLMs, are used in the experiments as the paper is about multimodal reasoning. The usage is described in Secion 3, 4. In terms of writing, LLMs are only used for checking grammar, spelling, and word choices.
1. Guidelines:
- The answer NA means that the core method development in this research does not involve LLMs as any important, original, or non-standard components.
- Please refer to our LLM policy (https://neurips.cc/Conferences/2025/LLM) for what should or should not be described.
Appendix
Appendix A Optimization algorithm
Directly solving the bi-level optimization problem in Equation 9 can be computational prohibitive due to its nested structure. Following previous work [7], we use approximated algorithm with a few unrolling steps. For example, under one-step unrolling, the updating of PRM’s weights can be expressed as:
$$
\phi^{(t+1)}=\phi^{(t)}-\beta_{1}\nabla_{\phi}\mathcal{L}_{tr}(\mathcal{D}_{tr},\phi,\alpha) \tag{10}
$$
where $\beta_{1}$ is the learning rate in lower level optimization. After obtaining the updated PRM parameter $\phi^{(t+1)}$ from Equation 10, the domain-reweighting parameter $\alpha$ is then updated as follows:
$$
\alpha^{(t+1)}=\alpha^{(t)}-\beta_{2}\nabla_{\alpha}\mathcal{L}_{meta}(\mathcal{D}_{meta},\phi^{*}(\alpha)) \tag{11}
$$
where $\beta_{2}$ is the learning rate for upper level optimization. The two optimization steps in Equation 10 and Equation 11 are conducted iteratively until convergence to get optimal PRM weights $\phi^{*}$ and optimal domain reweighting parameter $\alpha^{*}$ .
Appendix B Datasets and benchmarks
Table 2: Multimodal datasets involved in the fine-tuning of DreamPRM, organized by task category.
| Science Chart Geometry | AI2D [23], ScienceQA [35], M3CoT [6] ChartQA [39], DVQA [20], MapQA [3], FigureQA [21] Geo170k [15], Geometry3K [34], UniGeo [4], GeomVerse [22], GeoS [51] |
| --- | --- |
| Commonsense | IconQA [36], InfographicsVQA [40], CLEVR-Math [30] |
For datasets used in lower-level optimization ( $\mathcal{D}_{tr}$ in Section 4), our study utilizes a diverse set of datasets, spanning multiple domains to ensure a comprehensive coverage of multimodal reasoning tasks, as reported in Tab. 2. The selected 15 multimodal datasets covers 4 major categories including science, chart, geometry and commonsense, with a wide range of task types (QA, OCR, spatial understanding). Additionally, we observe that for some questions, given the current structural thinking prompts, MLLMs consistently produce either correct or incorrect answers. Continuing to sample such questions is a waste of computational resources. Inspired by the dynamic sampling strategy in DAPO [78], we propose a similar dynamic sampling technique for Monte Carlo estimation that focuses on prompts with varied outcomes to improve efficiency. After processing and sampling, the training datasets in lower-level $\mathcal{D}_{tr}$ have around 15k examples (1k per each of the 15 domains), while the meta dataset in the upper-level $\mathcal{D}_{meta}$ has around 1k validation examples from the MMMU [79] dataset.
For the dataset used in upper-level optimization ( $\mathcal{D}_{meta}$ in Section 4), we select data from MMMU [79] to simulate a realistic and diverse reasoning scenario. MMMU focuses on advanced perception and reasoning with domain-specific knowledge. Its questions span 30 subjects and 183 subfields, comprising 30 highly heterogeneous image types, such as charts, diagrams, maps, tables, music sheets, and chemical structures.
At evaluation time, we use five multimodal reasoning benchmarks for testing the capability of DreamPRM. WeMath [48], MathVista [33], and MathVision [63] focus more on math-related reasoning tasks and logic and critical thinking, while MMVet [78] and MMStar [5] focus more on real-life tasks that require common knowledge and general reasoning abilities.
Appendix C Structural Thinking Prompt
The detailed structural thinking prompt applied in our experiments is reported in Fig. 8. We carefully design 5 reasoning steps to boost the reasoning capabilities of the MLLMs and enable process supervision.
<details>
<summary>figures/7-1.png Details</summary>
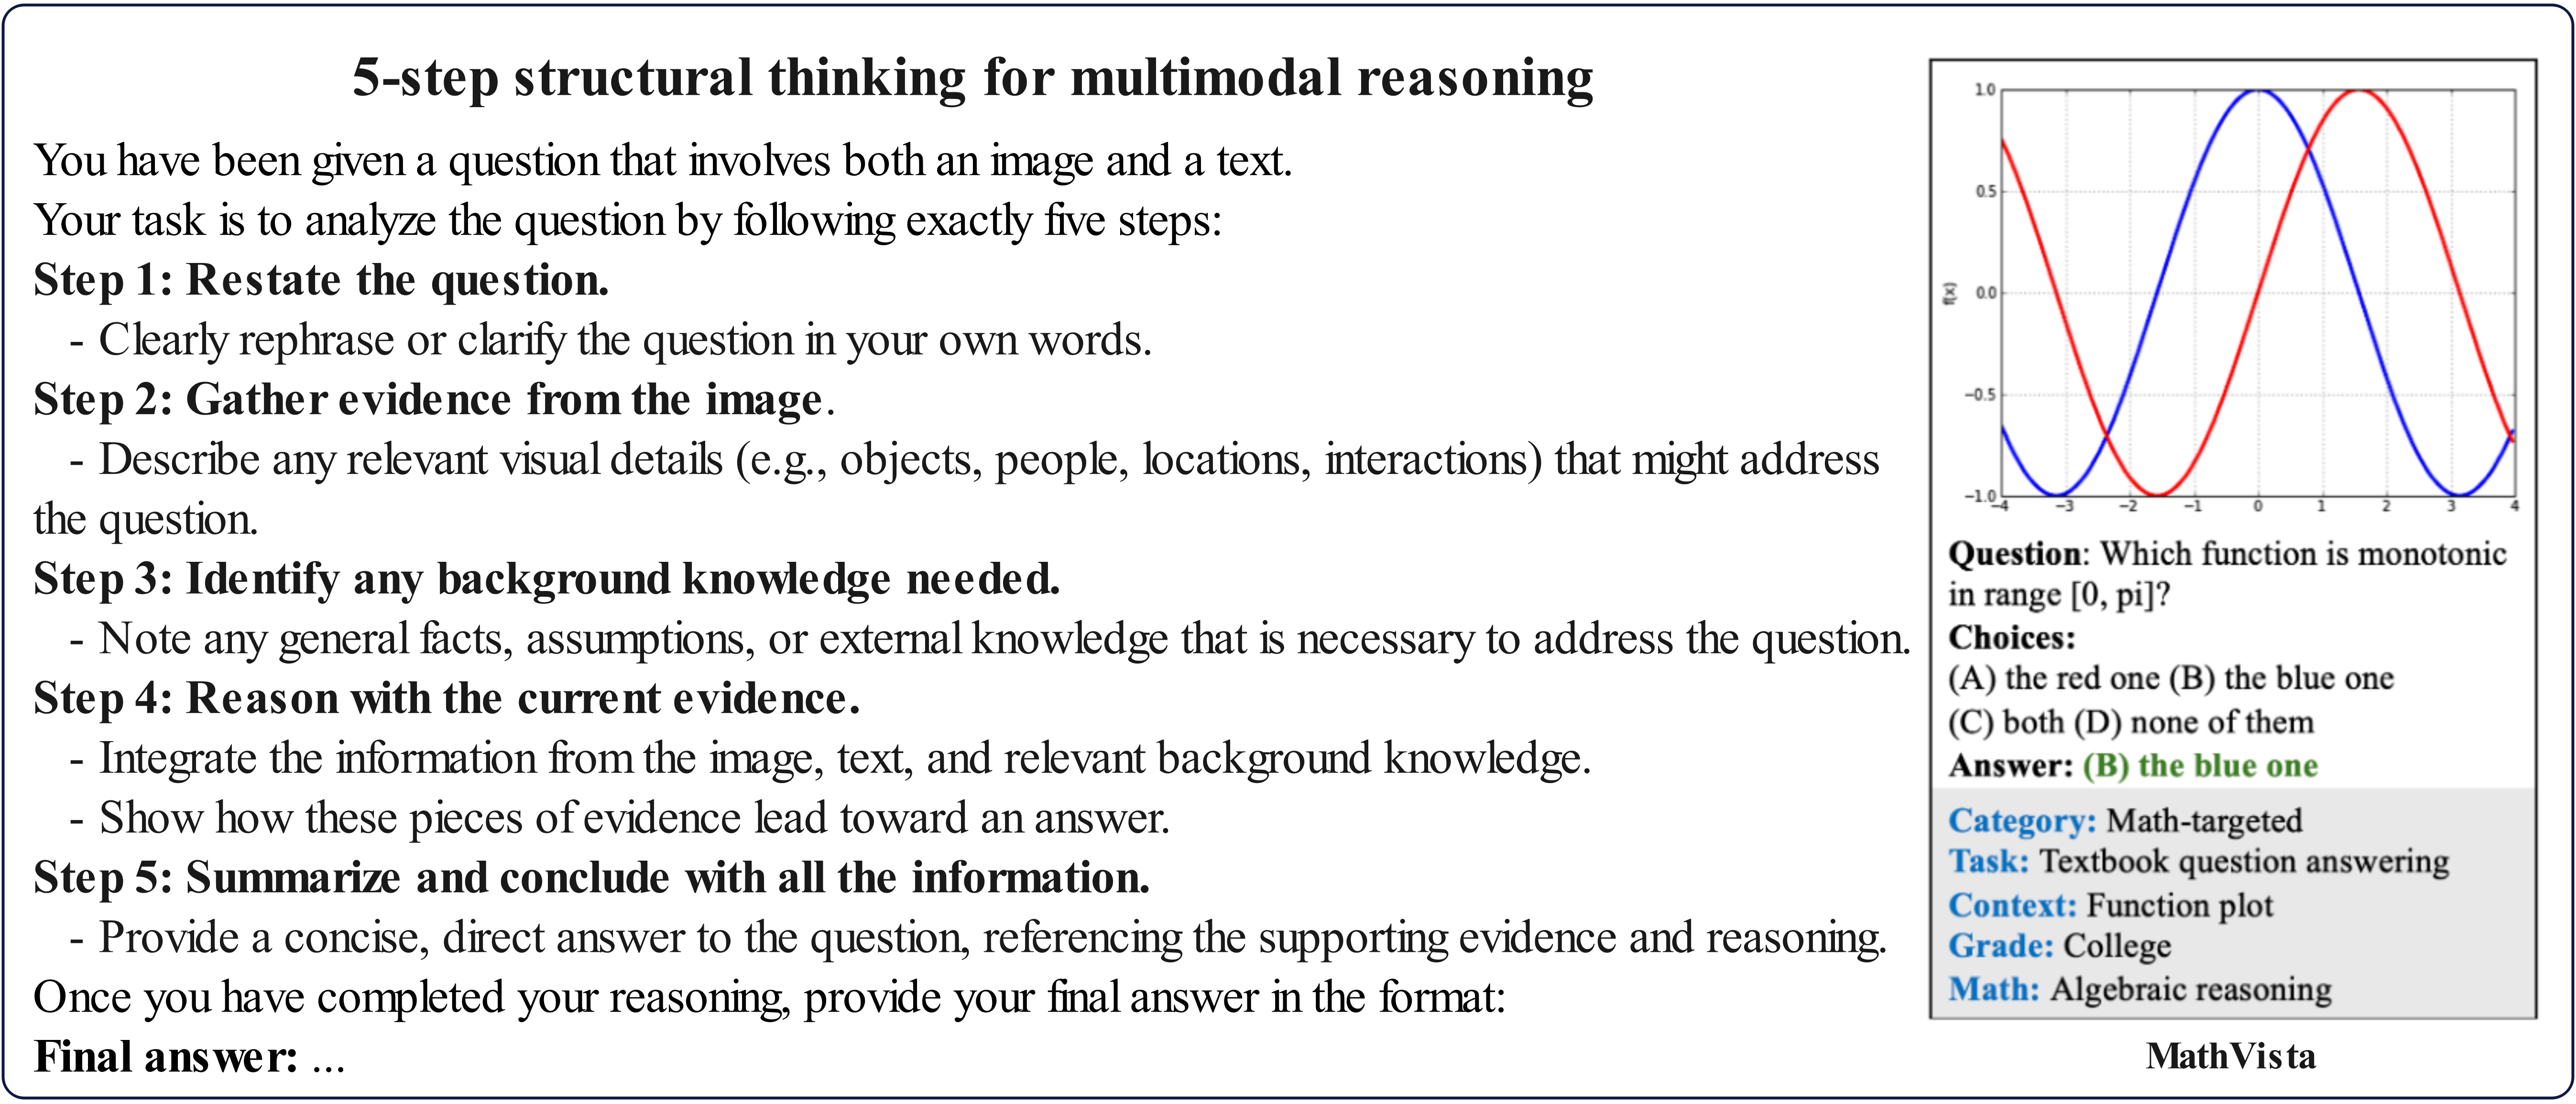
### Visual Description
## Chart/Diagram Type: Multimodal Reasoning Guide and Function Plot
### Overview
The image presents a 5-step guide for structural thinking in multimodal reasoning, accompanied by a function plot and a multiple-choice question related to the plot. The guide outlines a process for analyzing questions involving both images and text. The function plot displays two trigonometric functions, one red and one blue, over the range of approximately -4 to 4 on the x-axis. The question asks which function is monotonic in the range [0, pi].
### Components/Axes
* **Title:** 5-step structural thinking for multimodal reasoning
* **Steps:**
* Step 1: Restate the question.
* Step 2: Gather evidence from the image.
* Step 3: Identify any background knowledge needed.
* Step 4: Reason with the current evidence.
* Step 5: Summarize and conclude with all the information.
* **Function Plot:**
* X-axis: Ranges from approximately -4 to 4, with tick marks at each integer.
* Y-axis: Labeled "f(x)", ranges from -1.0 to 1.0, with tick marks at -0.5, 0.0, 0.5.
* Red Line: A cosine-like function, peaking at approximately x=2 and x=-2.
* Blue Line: A sine-like function, peaking at approximately x=0.
* **Question:** Which function is monotonic in range [0, pi]?
* **Choices:**
* (A) the red one
* (B) the blue one
* (C) both
* (D) none of them
* **Answer:** (B) the blue one
* **Metadata:**
* Category: Math-targeted
* Task: Textbook question answering
* Context: Function plot
* Grade: College
* Math: Algebraic reasoning
### Detailed Analysis or ### Content Details
* **5-Step Guide:** The guide provides a structured approach to answering questions that involve both images and text. Each step is clearly defined, encouraging a systematic analysis of the problem.
* **Function Plot:**
* The red line starts at approximately 0.8 at x=-4, decreases to -1.0 at x=-1, increases to 1.0 at x=2, and decreases again to approximately -0.8 at x=4.
* The blue line starts at approximately -0.8 at x=-4, increases to 1.0 at x=0, decreases to -1.0 at x=3, and increases again to approximately 0.8 at x=4.
* **Question and Answer:** The question tests the understanding of monotonic functions within a specific range. The correct answer is (B), the blue one, indicating that the blue function is monotonically decreasing in the range [0, pi].
* **Metadata:** The metadata provides context for the question, categorizing it as math-targeted, a textbook question, and suitable for college-level algebraic reasoning.
### Key Observations
* The 5-step guide is designed to promote structured thinking and problem-solving skills.
* The function plot visually represents two trigonometric functions, allowing for a graphical analysis of their behavior.
* The question assesses the ability to identify monotonic functions within a given range.
* The metadata provides valuable context for understanding the purpose and target audience of the question.
### Interpretation
The image combines a methodological guide with a practical example in the form of a mathematical problem. The 5-step guide offers a general framework for approaching multimodal reasoning tasks, while the function plot and question provide a specific instance of such a task. The combination highlights the importance of both structured thinking and domain-specific knowledge in problem-solving. The metadata further contextualizes the problem, indicating its relevance to math education and algebraic reasoning at the college level. The correct answer to the question suggests that the user should be able to visually analyze the graph and understand the concept of monotonicity.
</details>
Figure 8: Zero-shot prompting for structural thinking.
Table 3: Accuracy on MathVista using DreamPRM with varying numbers $k$ of CoTs.
| InternVL-2.5-8B-MPO [67] GPT-4.1-mini (4-14-25) [46] | 65.4 71.5 | 65.3 71.8 | 66.5 72.5 | 67.8 73.2 | 68.9 74.4 |
| --- | --- | --- | --- | --- | --- |
Table 4: Ablation study evaluating the impact of individual components of DreamPRM
| DreamPRM (original) w/o aggregation function loss w/o bi-level optimization | 57.4 56.3 (-1.1) 55.0 (-2.4) | 68.9 66.1 (-2.8) 65.4 (-3.5) | 22.1 20.1 (-2.0) 19.9 (-2.2) | 61.4 60.0 (-1.4) 61.2 (-0.2) | 62.3 59.6 (-2.7) 58.9 (-3.4) |
| --- | --- | --- | --- | --- | --- |
| w/o structural thinking | 54.6 (-2.8) | 65.7 (-3.2) | 20.3 (-1.8) | 57.5 (-3.9) | 61.6 (-0.7) |
Appendix D Additional Experimental Results
Leaderboard performance details. Table 5 presents a comprehensive comparison of different PRM variants built upon the same o4-mini backbone. DreamPRM consistently outperforms all baselines, elevating the base o4-mini performance from 80.6These steady improvements demonstrate the effectiveness of DreamPRM in enhancing reasoning accuracy through process-level supervision and promoting more reliable consensus across multiple chains of thought.
Best-of-N results. Tab. 3 reports the accuracy of two state-of-the-art models on MathVista dataset using DreamPRM with varying numbers $k$ of CoTs. The results indicate that the performance scales well with the number of CoTs.
Table 5: Comparison of different PRM variants on the o4-mini model (evaluated on eight CoTs).
| o4-mini + Self-consistency + ORM | 80.6 81.7 80.8 |
| --- | --- |
| + Vanilla-PRM | 84.2 |
| + DreamPRM | 85.2 |
Ablation studies. The exact results of ablation experiments in the main paper are included in Tab. 4, which emphasizes the importance of all the components in DreamPRM.
Loss curves and domain weights. The loss curves and domain weights during the fine-tuning of DreamPRM are illustrated in Fig. 9. It can be observed that the learnt distribution emphasizes informative mathematical figure domains while attenuating less relevant sources. Additionally, domain weights start at 1.0 and quickly diverge, stabilizing after roughly half the training, and the inner and outer losses decrease steadily and plateau, indicating stable convergence of the bi‑level training procedure.
Case study. A complete case study illustrating DreamPRM’s step-wise evaluation is reported in Fig. 10. DreamPRM assigns higher scores to high-quality, coherent reasoning steps, while penalizes flawed or unsupported steps.
<details>
<summary>figures/6-3.png Details</summary>
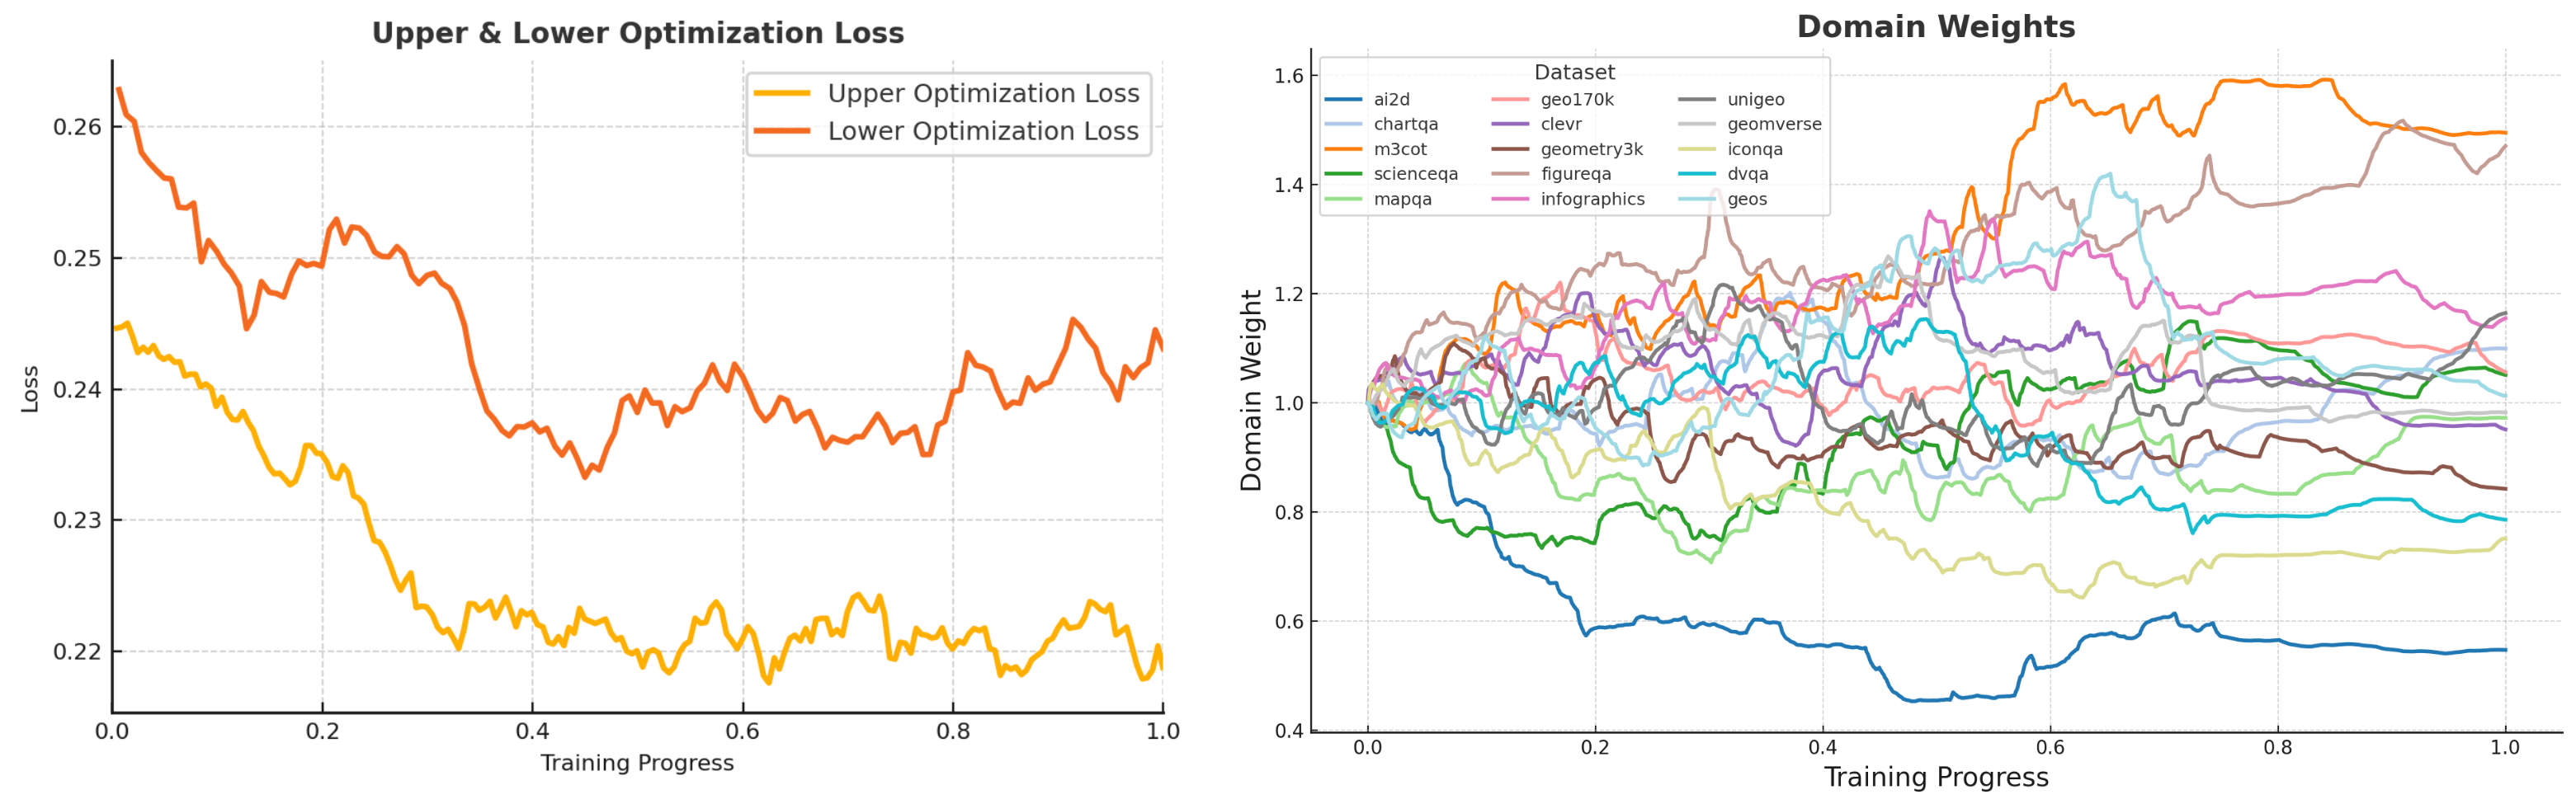
### Visual Description
## Chart: Optimization Loss and Domain Weights During Training
### Overview
The image presents two line charts side-by-side. The left chart displays the "Upper & Lower Optimization Loss" as a function of "Training Progress". The right chart shows "Domain Weights" for various datasets, also plotted against "Training Progress". Both charts share the same x-axis, representing training progress from 0.0 to 1.0.
### Components/Axes
**Left Chart: Upper & Lower Optimization Loss**
* **Title:** Upper & Lower Optimization Loss
* **X-axis:** Training Progress, ranging from 0.0 to 1.0 in increments of 0.2.
* **Y-axis:** Loss, ranging from 0.22 to 0.26 in increments of 0.01.
* **Legend:** Located in the top-right corner.
* Orange line: Upper Optimization Loss
* Red line: Lower Optimization Loss
**Right Chart: Domain Weights**
* **Title:** Domain Weights
* **X-axis:** Training Progress, ranging from 0.0 to 1.0 in increments of 0.2.
* **Y-axis:** Domain Weight, ranging from 0.4 to 1.6 in increments of 0.2.
* **Legend:** Located in the top-left corner, listing the datasets and their corresponding line colors:
* Blue: ai2d
* Light Blue: chartqa
* Orange: m3cot
* Green: scienceqa
* Light Green: mapqa
* Gray: geo170k
* Light Gray: clevr
* Yellow: geometry3k
* Pink: figureqa
* Brown: infographics
* Light Pink: unigeo
* Purple: geomverse
* Teal: iconqa
* Cyan: dvqa
* Dark Green: geos
### Detailed Analysis
**Left Chart: Upper & Lower Optimization Loss**
* **Upper Optimization Loss (Orange):** Starts at approximately 0.245 at Training Progress 0.0, decreases to approximately 0.22 at Training Progress 0.4, and then fluctuates between 0.22 and 0.225 for the remainder of the training progress.
* **Lower Optimization Loss (Red):** Starts at approximately 0.265 at Training Progress 0.0, decreases to approximately 0.24 at Training Progress 0.4, and then fluctuates between 0.235 and 0.25 for the remainder of the training progress.
**Right Chart: Domain Weights**
* **ai2d (Blue):** Starts at 1.0, decreases sharply to approximately 0.45 by Training Progress 0.4, and then remains relatively stable around 0.5 for the rest of the training.
* **chartqa (Light Blue):** Starts at 1.0, increases to approximately 1.2 by Training Progress 0.4, and then fluctuates around 1.2 for the rest of the training.
* **m3cot (Orange):** Starts at 1.0, increases to approximately 1.6 by Training Progress 0.6, and then decreases slightly to approximately 1.55 for the rest of the training.
* **scienceqa (Green):** Starts at 1.0, decreases to approximately 0.75 by Training Progress 0.4, and then fluctuates around 0.8 for the rest of the training.
* **mapqa (Light Green):** Starts at 1.0, decreases to approximately 0.8 by Training Progress 0.2, and then fluctuates around 0.8 for the rest of the training.
* **geo170k (Gray):** Starts at 1.0, increases to approximately 1.2 by Training Progress 0.4, and then fluctuates around 1.1 for the rest of the training.
* **clevr (Light Gray):** Starts at 1.0, increases to approximately 1.2 by Training Progress 0.4, and then fluctuates around 1.1 for the rest of the training.
* **geometry3k (Yellow):** Starts at 1.0, increases to approximately 1.1 by Training Progress 0.2, and then fluctuates around 1.0 for the rest of the training.
* **figureqa (Pink):** Starts at 1.0, increases to approximately 1.2 by Training Progress 0.4, and then fluctuates around 1.1 for the rest of the training.
* **infographics (Brown):** Starts at 1.0, increases to approximately 1.1 by Training Progress 0.2, and then fluctuates around 1.0 for the rest of the training.
* **unigeo (Light Pink):** Starts at 1.0, increases to approximately 1.5 by Training Progress 0.6, and then fluctuates around 1.5 for the rest of the training.
* **geomverse (Purple):** Starts at 1.0, increases to approximately 1.2 by Training Progress 0.4, and then fluctuates around 1.1 for the rest of the training.
* **iconqa (Teal):** Starts at 1.0, increases to approximately 1.2 by Training Progress 0.4, and then fluctuates around 1.1 for the rest of the training.
* **dvqa (Cyan):** Starts at 1.0, increases to approximately 1.2 by Training Progress 0.4, and then fluctuates around 1.1 for the rest of the training.
* **geos (Dark Green):** Starts at 1.0, increases to approximately 1.2 by Training Progress 0.4, and then fluctuates around 1.1 for the rest of the training.
### Key Observations
* The Upper and Lower Optimization Losses both decrease during the initial phase of training and then stabilize.
* The Domain Weights for different datasets exhibit varying trends. Some datasets, like "ai2d", experience a decrease in weight, while others, like "m3cot" and "unigeo", show a significant increase. Most datasets converge to a weight around 1.0-1.2.
### Interpretation
The charts provide insights into the training dynamics of a model across different datasets. The decreasing optimization losses suggest that the model is learning and improving its performance as training progresses. The varying domain weights indicate that the model is adapting its focus to different datasets during training. The "ai2d" dataset seems to be less important for the model, as its weight decreases significantly, while "m3cot" and "unigeo" become more important. The stabilization of most domain weights around 1.0-1.2 suggests that the model eventually balances its attention across these datasets.
</details>
Figure 9: Optimization loss curves and dynamic domain weights throughout DreamPRM fine-tuning.
<details>
<summary>x9.png Details</summary>
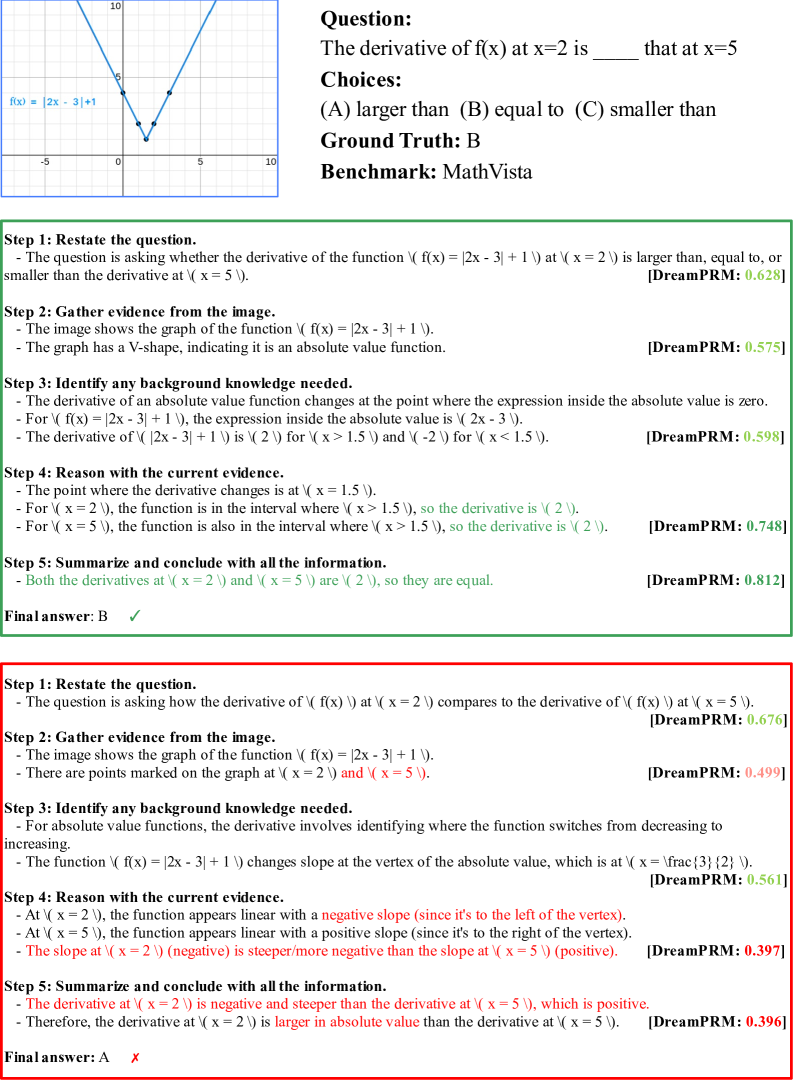
### Visual Description
## Chart/Diagram Type: Graph and Text Analysis
### Overview
The image presents a graph of the function f(x) = |2x - 3| + 1, along with a question about the derivative of the function at x=2 compared to x=5. It also includes two different reasoning processes, one leading to the correct answer and one leading to an incorrect answer, along with DreamPRM scores for each step.
### Components/Axes
**Graph:**
* **Function:** f(x) = |2x - 3| + 1 (located on the top-left of the graph)
* **X-axis:** Ranges from approximately -5 to 10, with tick marks at intervals of 5.
* **Y-axis:** Ranges from approximately -5 to 10, with tick marks at intervals of 5.
* **Shape:** The graph is a V-shaped absolute value function. The vertex of the V is at x = 1.5.
* **Points:** There are several points marked on the graph.
**Textual Elements:**
* **Question:** "The derivative of f(x) at x=2 is ____ that at x=5"
* **Choices:** (A) larger than (B) equal to (C) smaller than
* **Ground Truth:** B
* **Benchmark:** MathVista
* **Reasoning Processes:** Two separate "Step 1" to "Step 5" sequences, one marked with a green background and a checkmark indicating a correct answer (B), and the other marked with a red background and an X indicating an incorrect answer (A). Each step includes a statement and a DreamPRM score.
### Detailed Analysis or Content Details
**Graph Data:**
* The V-shape of the graph indicates an absolute value function.
* The vertex of the V is at x = 1.5, y = 1.
* For x < 1.5, the slope of the line is negative.
* For x > 1.5, the slope of the line is positive.
* At x = 2, the function is on the decreasing side of the V.
* At x = 5, the function is on the increasing side of the V.
**Reasoning Process 1 (Green Background - Correct):**
* **Step 1:** Restates the question. [DreamPRM: 0.628]
* **Step 2:** Gathers evidence from the image, noting the function and the V-shape. [DreamPRM: 0.575]
* **Step 3:** Identifies background knowledge about absolute value function derivatives. [DreamPRM: 0.598]
* **Step 4:** Reasons with the current evidence, noting the derivative is 2 for x > 1.5. [DreamPRM: 0.748]
* **Step 5:** Summarizes and concludes that the derivatives at x=2 and x=5 are both 2, so they are equal. [DreamPRM: 0.812]
* **Final Answer:** B (Equal) - Correct.
**Reasoning Process 2 (Red Background - Incorrect):**
* **Step 1:** Restates the question. [DreamPRM: 0.676]
* **Step 2:** Gathers evidence from the image, noting the function and the points at x=2 and x=5. [DreamPRM: 0.499]
* **Step 3:** Identifies background knowledge about absolute value function derivatives. [DreamPRM: 0.561]
* **Step 4:** Reasons with the current evidence, noting the negative slope at x=2 and the positive slope at x=5, and incorrectly concludes the slope at x=2 is steeper/more negative. [DreamPRM: 0.397]
* **Step 5:** Summarizes and concludes that the derivative at x=2 is negative and steeper, therefore larger in absolute value. [DreamPRM: 0.396]
* **Final Answer:** A (Larger than) - Incorrect.
### Key Observations
* The graph visually represents the absolute value function.
* The correct reasoning process identifies that the derivative is constant (2) for x > 1.5.
* The incorrect reasoning process focuses on the negative and positive slopes without considering the absolute value.
* The DreamPRM scores vary across the steps in both reasoning processes.
### Interpretation
The image illustrates a problem-solving scenario involving the derivative of an absolute value function. It highlights the importance of understanding the properties of absolute value functions and their derivatives. The two reasoning processes demonstrate how different approaches can lead to correct or incorrect conclusions. The DreamPRM scores provide a measure of confidence or accuracy for each step in the reasoning process, although their precise meaning is not defined within the image. The incorrect reasoning fails to account for the fact that the derivative of |2x-3| is -2 for x < 1.5 and 2 for x > 1.5. Therefore, at x=2, the derivative is -2, and at x=5, the derivative is 2. The question asks about the value of the derivative, not the absolute value.
</details>
Figure 10: A case study of DreamPRM’s step-wise evaluation.
Appendix E Limitations & Future Work.
DreamPRM currently assumes a fixed set of domains and requires Monte-Carlo sampling, which can be computationally heavy. Future work could explore instance-level reweighting, adaptive sampling strategies, and integration with retrieval-augmented generation to further cut compute while broadening coverage. We will release code, trained weights, and evaluation scripts to facilitate reproducibility and community adoption.