# Experience-based Knowledge Correction for Robust Planning in Minecraft
footnotetext: Corresponding author: Jungseul Ok <jungseul@postech.ac.kr>
## Abstract
Large Language Model (LLM)-based planning has advanced embodied agents in long-horizon environments such as Minecraft, where acquiring latent knowledge of goal (or item) dependencies and feasible actions is critical. However, LLMs often begin with flawed priors and fail to correct them through prompting, even with feedback. We present XENON (eXpErience-based kNOwledge correctioN), an agent that algorithmically revises knowledge from experience, enabling robustness to flawed priors and sparse binary feedback. XENON integrates two mechanisms: Adaptive Dependency Graph, which corrects item dependencies using past successes, and Failure-aware Action Memory, which corrects action knowledge using past failures. Together, these components allow XENON to acquire complex dependencies despite limited guidance. Experiments across multiple Minecraft benchmarks show that XENON outperforms prior agents in both knowledge learning and long-horizon planning. Remarkably, with only a 7B open-weight LLM, XENON surpasses agents that rely on much larger proprietary models. Project page: https://sjlee-me.github.io/XENON
## 1 Introduction
Large Language Model (LLM)-based planning has advanced in developing embodied AI agents that tackle long-horizon goals in complex, real-world-like environments (Szot et al., 2021; Fan et al., 2022). Among such environments, Minecraft has emerged as a representative testbed for evaluating planning capability that captures the complexity of such environments (Wang et al., 2023b; c; Zhu et al., 2023; Yuan et al., 2023; Feng et al., 2024; Li et al., 2024b). Success in these environments often depends on agents acquiring planning knowledge, including the dependencies among goal items and the valid actions needed to obtain them. For instance, to obtain an iron nugget
<details>
<summary>x1.png Details</summary>

### Visual Description
Icon/Small Image (23x20)
</details>
, an agent should first possess an iron ingot
<details>
<summary>x2.png Details</summary>

### Visual Description
Icon/Small Image (20x20)
</details>
, which can only be obtained by the action smelt.
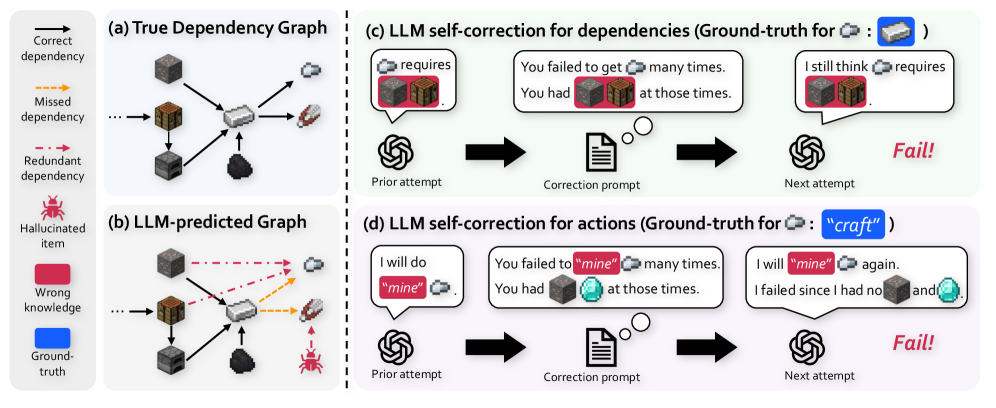
However, LLMs often begin with flawed priors about these dependencies and actions. This issue is indeed critical, since a lack of knowledge for a single goal can invalidate all subsequent plans that depend on it (Guss et al., 2019; Lin et al., 2021; Mao et al., 2022). We find several failure cases stemming from these flawed priors, a problem that is particularly pronounced for the lightweight LLMs suitable for practical embodied agents. First, an LLM often fails to predict planning knowledge accurately enough to generate a successful plan (Figure ˜ 1 b), resulting in a complete halt in progress toward more challenging goals. Second, an LLM cannot robustly correct its flawed knowledge, even when prompted to self-correct with failure feedback (Shinn et al., 2023; Chen et al., 2024), often repeating the same errors (Figures 1 c and 1 d). To improve self-correction, one can employ more advanced techniques that leverage detailed reasons for failure (Zhang et al., 2024; Wang et al., 2023a). Nevertheless, LLMs often stubbornly adhere to their erroneous parametric knowledge (i.e. knowledge implicitly stored in model parameters), as evidenced by Stechly et al. (2024) and Du et al. (2024).
<details>
<summary>x3.png Details</summary>
### Visual Description
## Diagram: LLM Dependency and Action Self-Correction Failure Modes
### Overview
This technical diagram illustrates the failure modes of Large Language Models (LLMs) when attempting to self-correct their reasoning about dependencies and actions, using a crafting/mining scenario (likely from a game like Minecraft). It contrasts a ground-truth dependency graph with an LLM's flawed prediction and shows how correction prompts fail to fix the errors. The diagram is divided into four main panels: (a) True Dependency Graph, (b) LLM-predicted Graph, (c) LLM self-correction for dependencies, and (d) LLM self-correction for actions.
### Components/Axes
The diagram is organized into a 2x2 grid with a shared legend on the far left.
**Legend (Leftmost Column):**
* **Correct dependency:** Solid black arrow.
* **Missed dependency:** Dashed orange arrow.
* **Redundant dependency:** Dashed red arrow.
* **Hallucinated item:** Red spider icon.
* **Wrong knowledge:** Red rounded rectangle background.
* **Ground-truth:** Blue rounded rectangle background.
**Panel (a) True Dependency Graph (Top-Left):**
* **Title:** "(a) True Dependency Graph"
* **Components:** A network of item icons connected by solid black arrows (correct dependencies).
* Items include: a log, a plank, a crafting table, sticks, a wooden pickaxe, cobblestone, an iron ore, an iron ingot, and a stone pickaxe.
* The flow shows dependencies required to craft items (e.g., log → plank → crafting table).
**Panel (b) LLM-predicted Graph (Bottom-Left):**
* **Title:** "(b) LLM-predicted Graph"
* **Components:** The same set of item icons as in (a), but with different connections.
* **Solid black arrows:** Some correct dependencies are present.
* **Dashed orange arrows (Missed dependency):** Several required dependencies are missing (e.g., from iron ore to iron ingot).
* **Dashed red arrows (Redundant dependency):** Incorrect, unnecessary dependencies are added (e.g., from cobblestone to wooden pickaxe).
* **Hallucinated item:** A red spider icon appears, connected by a dashed red arrow to the stone pickaxe, indicating the LLM invented a non-existent requirement.
**Panel (c) LLM self-correction for dependencies (Top-Right):**
* **Title:** "(c) LLM self-correction for dependencies (Ground-truth for [Iron Ingot Icon]: [Iron Ore Icon] )"
* **Process Flow (Left to Right):**
1. **Prior attempt:** An LLM icon (spiral) with a speech bubble: "requires [Iron Ingot Icon] [Iron Ore Icon]". The "[Iron Ore Icon]" has a red background (Wrong knowledge).
2. **Correction prompt:** An arrow points to a document icon with a thought bubble. The text reads: "You failed to get [Iron Ingot Icon] many times. You had [Iron Ore Icon] [Cobblestone Icon] at those times." The "[Iron Ore Icon]" and "[Cobblestone Icon]" have red backgrounds.
3. **Next attempt:** An arrow points to another LLM icon with a speech bubble: "I still think [Iron Ingot Icon] requires [Iron Ore Icon] [Cobblestone Icon]". Both item icons have red backgrounds.
4. **Outcome:** The word "Fail!" in red, italic text.
**Panel (d) LLM self-correction for actions (Bottom-Right):**
* **Title:** "(d) LLM self-correction for actions (Ground-truth for [Iron Ingot Icon]: "craft" )"
* **Process Flow (Left to Right):**
1. **Prior attempt:** An LLM icon with a speech bubble: "I will do "mine" [Iron Ingot Icon]". The word "mine" has a red background (Wrong knowledge).
2. **Correction prompt:** An arrow points to a document icon. The text reads: "You failed to "mine" [Iron Ingot Icon] many times. You had [Cobblestone Icon] [Diamond Icon] at those times." The words "mine" and the item icons have red backgrounds.
3. **Next attempt:** An arrow points to another LLM icon with a speech bubble: "I will "mine" [Iron Ingot Icon] again. I failed since I had no [Cobblestone Icon] and [Diamond Icon]". The word "mine" and the item icons have red backgrounds.
4. **Outcome:** The word "Fail!" in red, italic text.
### Detailed Analysis
* **Graph Comparison:** The true graph (a) is a clean, directed acyclic graph. The LLM-predicted graph (b) is noisy, containing missed dependencies (orange), redundant dependencies (red), and a hallucinated item (spider).
* **Self-Correction Process (c & d):** Both processes follow the same three-step structure: flawed prior attempt → correction prompt with feedback → repeated flawed next attempt.
* **Text Transcription (Panel c):**
* Ground-truth label: "Ground-truth for [Iron Ingot Icon]: [Iron Ore Icon]"
* Prior attempt: "requires [Iron Ingot Icon] [Iron Ore Icon]"
* Correction prompt: "You failed to get [Iron Ingot Icon] many times. You had [Iron Ore Icon] [Cobblestone Icon] at those times."
* Next attempt: "I still think [Iron Ingot Icon] requires [Iron Ore Icon] [Cobblestone Icon]"
* **Text Transcription (Panel d):**
* Ground-truth label: "Ground-truth for [Iron Ingot Icon]: "craft""
* Prior attempt: "I will do "mine" [Iron Ingot Icon]"
* Correction prompt: "You failed to "mine" [Iron Ingot Icon] many times. You had [Cobblestone Icon] [Diamond Icon] at those times."
* Next attempt: "I will "mine" [Iron Ingot Icon] again. I failed since I had no [Cobblestone Icon] and [Diamond Icon]"
### Key Observations
1. **Persistent Error:** In both (c) and (d), the LLM repeats its initial错误 (wrong knowledge) in the "Next attempt" despite receiving corrective feedback.
2. **Error Types:** The LLM demonstrates two distinct failure modes: (1) incorrect dependency reasoning (c), and (2) incorrect action planning (e.g., using "mine" instead of "craft") (d).
3. **Hallucination:** Panel (b) explicitly shows the LLM inventing a dependency on a non-existent item (the spider).
4. **Correction Prompt Structure:** The prompts provide specific, instance-based feedback ("You failed... You had..."), but this is insufficient to alter the model's underlying incorrect belief.
### Interpretation
This diagram serves as a critical investigation into the limitations of LLM self-correction. It suggests that when an LLM's error stems from a fundamental misunderstanding of a system's rules (the true dependency graph) or a misclassification of required actions, simply providing feedback on past failures is ineffective. The model's "knowledge" or "reasoning process" appears rigid; it either cannot integrate the corrective information to update its internal model or defaults to reasserting its initial (flawed) prediction. This has significant implications for building reliable AI agents, highlighting that self-correction mechanisms may need to be supplemented with external verification tools or more structured knowledge representations to overcome deep-seated reasoning errors. The visual contrast between the clean true graph and the noisy predicted graph powerfully illustrates the gap between ground truth and LLM-generated understanding in procedural tasks.
</details>
Figure 1: An LLM exhibits flawed planning knowledge and fails at self-correction. (b) The dependency graph predicted by Qwen2.5-VL-7B (Bai et al., 2025) contains multiple errors (e.g., missed dependencies, hallucinated items) compared to (a) the ground truth. (c, d) The LLM fails to correct its flawed knowledge about dependencies and actions from failure feedbacks, often repeating the same errors. See Appendix ˜ B for the full prompts and LLM’s self-correction examples.
In response, we propose XENON (eXpErience-based kNOwledge correctioN), an agent that robustly learns planning knowledge from only binary success/failure feedback. To this end, instead of relying on an LLM for correction, XENON algorithmically and directly revises its external knowledge memory using its own experience, which in turn guides its planning. XENON learns this planning knowledge through two synergistic components. The first component, Adaptive Dependency Graph (ADG), revises flawed dependency knowledge by leveraging successful experiences to propose plausible new required items. The second component, Failure-aware Action Memory (FAM), builds and corrects its action knowledge by exploring actions upon failures. In the challenging yet practical setting of using only binary feedbacks, FAM enables XENON to disambiguate the cause of a failure, distinguishing between flawed dependency knowledge and invalid actions, which in turn triggers a revision in ADG for the former.
Extensive experiments in three Minecraft testbeds show that XENON excels at both knowledge acquisition and planning. XENON outperforms prior agents in learning knowledge, showing unique robustness to LLM hallucinations and modified ground-truth environmental rules. Furthermore, with only a 7B LLM, XENON significantly outperforms prior agents that rely on much larger proprietary models like GPT-4 in solving diverse long-horizon goals. These results suggest that robust algorithmic knowledge management can be a promising direction for developing practical embodied agents with lightweight LLMs (Belcak et al., 2025).
Our contributions are as follows. First, we propose XENON, an LLM-based agent that robustly learns planning knowledge from experience via algorithmic knowledge correction, instead of relying on the LLM to self-correct its own knowledge. We realize this idea through two synergistic mechanisms that explicitly store planning knowledge and correct it: Adaptive Dependency Graph (ADG) for correcting dependency knowledge based on successes, and Failure-aware Action Memory (FAM) for correcting action knowledge and disambiguating failure causes. Second, extensive experiments demonstrate that XENON significantly outperforms prior state-of-the-art agents in both knowledge learning and long-horizon goal planning in Minecraft.
## 2 Related work
### 2.1 LLM-based planning in Minecraft
Prior work has often address LLMs’ flawed planning knowledge in Minecraft using impractical methods. For example, such methods typically involve directly injecting knowledge through LLM fine-tuning (Zhao et al., 2023; Feng et al., 2024; Liu et al., 2025; Qin et al., 2024) or relying on curated expert data (Wang et al., 2023c; Zhu et al., 2023; Wang et al., 2023a).
Another line of work attempts to learn planning knowledge via interaction, by storing the experience of obtaining goal items in an external knowledge memory. However, these approaches are often limited by unrealistic assumptions or lack robust mechanisms to correct the LLM’s flawed prior knowledge. For example, ADAM and Optimus-1 artificially simplify the challenge of predicting and learning dependencies via shortcuts like pre-supplied items, while also relying on expert data such as learning curriculum (Yu and Lu, 2024) or Minecraft wiki (Li et al., 2024b). They also lack a robust way to correct wrong action choices in a plan: ADAM has none, and Optimus-1 relies on unreliable LLM self-correction. Our most similar work, DECKARD (Nottingham et al., 2023), uses an LLM to predict item dependencies but does not revise its predictions for items that repeatedly fail, and when a plan fails, it cannot disambiguate whether the failure is due to incorrect dependencies or incorrect actions. In contrast, our work tackles the more practical challenge of learning planning knowledge and correcting flawed priors from only binary success/failure feedback.
### 2.2 LLM-based self-correction
LLM self-correction, i.e., having an LLM correct its own outputs, is a promising approach to overcome the limitations of flawed parametric knowledge. However, for complex tasks like planning, LLMs struggle to identify and correct their own errors without external feedback (Huang et al., 2024; Tyen et al., 2024). To improve self-correction, prior works fine-tune LLMs (Yang et al., 2025) or prompt LLMs to correct themselves using environmental feedback (Shinn et al., 2023) and tool-execution results (Gou et al., 2024). While we also use binary success/failure feedbacks, we directly correct the agent’s knowledge in external memory by leveraging experience, rather than fine-tuning the LLM or prompting it to self-correct.
## 3 Preliminaries
We aim to develop an agent capable of solving long-horizon goals by learning planning knowledge from experience. As a representative environment which necessitates accurate planning knowledge, we consider Minecraft as our testbed. Minecraft is characterized by strict dependencies among game items (Guss et al., 2019; Fan et al., 2022), which can be formally represented as a directed acyclic graph $G^*=(V^*,E^*)$ , where $V^*$ is the set of all items and each edge $(u,q,v)∈E^*$ indicates that $q$ quantities of an item $u$ are required to obtain an item $v$ . In our actual implementation, each edge also stores the resulting item quantity, but we omit it from the notation for presentation simplicity, since most edges have resulting item quantity 1 and this multiplicity is not essential for learning item dependencies. A goal is to obtain an item $g∈V^*$ . To obtain $g$ , an agent must possess all of its prerequisites as defined by $G^*$ in its inventory, and perform the valid high-level action in $A=\{``mine'', ``craft'', ``smelt''\}$ .
Framework: Hierarchical agent with graph-augmented planning
We employ a hierarchical agent with an LLM planner and a low-level controller, adopting a graph-augmented planning strategy (Li et al., 2024b; Nottingham et al., 2023). In this strategy, agent maintains its knowledge graph $G$ and plans with $G$ to decompose a goal $g$ into subgoals in two stages. First, the agent identifies prerequisite items it does not possess by traversing $\hat{G}$ backward from $g$ to nodes with no incoming edges (i.e., basic items with no known requirements), and aggregates them into a list of (quantity, item) tuples, $((q_1,u_1),...,(q_L_{g},u_L_{g})=(1,g))$ . Second, the planner LLM converts this list into executable language subgoals $\{(a_l,q_l,u_l)\}_l=1^L_g$ , where it takes each $u_l$ as input and outputs a high-level action $a_l$ to obtain $u_l$ . Then the controller executes each subgoal, i.e., it takes each language subgoal as input and outputs a sequence of low-level actions in the environment to achieve it. After each subgoal execution, the agent receives only binary success/failure feedback.
Problem formulation: Dependency and action learning
To plan correctly, the agent must acquire knowledge of the true dependency graph $G^*$ . However, $G^*$ is latent, making it necessary for the agent to learn this structure from experience. We model this as revising a learned graph, $\hat{G}=(\hat{V},\hat{E})$ , where $\hat{V}$ contains known items and $\hat{E}$ represents the agent’s current belief about item dependencies. Following Nottingham et al. (2023), whenever the agent obtains a new item $v$ , it identifies the experienced requirement set $R_exp(v)$ , the set of (item, quantity) pairs consumed during this item acquisition. The agent then updates $\hat{G}$ by replacing all existing incoming edges to $v$ with the newly observed $R_exp(v)$ . The detailed update procedure is in Appendix C.
We aim to maximize the accuracy of learned graph $\hat{G}$ against true graph $G^*$ . We define this accuracy $N_true(\hat{G})$ as the number of items whose incoming edges are identical in $\hat{G}$ and $G^*$ , i.e.,
$$
\displaystyle N_true(\hat{G}) \displaystyle\coloneqq∑_v∈V^*I(R(v,\hat{G})=R(v,G^*)) , \tag{1}
$$
where the dependency set, $R(v,G)$ , denotes the set of all incoming edges to the item $v$ in the graph $G$ .
## 4 Methods
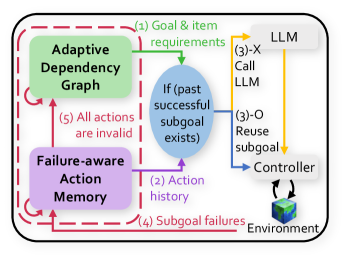
XENON is an LLM-based agent with two core components: Adaptive Dependency Graph (ADG) and Failure-aware Action Memory (FAM), as shown in Figure ˜ 3. ADG manages dependency knowledge, while FAM manages action knowledge. The agent learns this knowledge in a loop that starts by selecting an unobtained item as an exploratory goal (detailed in Appendix ˜ G). Once an item goal $g$ is selected, ADG, our learned dependency graph $G$ , traverses itself to construct $((q_1,u_1),\dots,(q_L_{g},u_L_{g})=(1,g))$ . For each $u_l$ in this list, FAM either reuses a previously successful action for $u_l$ or, if none exists, the planner LLM selects a high-level action $a_l∈A$ given $u_l$ and action histories from FAM. The resulting actions form language subgoals $\{(a_l,q_l,u_l)\}_l=1^L_g$ . The controller then takes each subgoal as input, executes a sequence of low-level actions to achieve it, and returns binary success/failure feedback, which is used to update both ADG and FAM. The full procedure is outlined in Algorithm ˜ 1 in Appendix ˜ D. We next detail each component, beginning with ADG.
<details>
<summary>x4.png Details</summary>
### Visual Description
\n
## Diagram: LLM-Based Agent Control System with Failure-Aware Memory
### Overview
The image is a technical system diagram illustrating a control flow for an AI agent (likely using a Large Language Model) that manages tasks through subgoals, incorporates memory of past failures, and adapts its internal dependency graph. The diagram uses color-coded components, numbered flow arrows, and a dashed boundary to define the system's scope.
### Components/Axes
The diagram is contained within a rounded rectangle with a **dashed red border**. The primary components are:
1. **Adaptive Dependency Graph** (Green box, top-left): Represents a dynamic model of task dependencies.
2. **Failure-aware Action Memory** (Purple box, bottom-left): Stores historical data on actions and their outcomes.
3. **Decision Node** (Blue oval, center): Contains the conditional logic: `If (past successful subgoal exists)`.
4. **LLM** (Grey cloud, top-right): The Large Language Model, acting as the high-level planner or reasoner.
5. **Controller** (White box, bottom-right): Executes commands or manages the interface with the environment.
6. **Environment** (3D cube icon, bottom-right): The external world or system the agent interacts with.
**Flow Arrows (Numbered Steps):**
* **(1) Goal & item requirements**: Green arrow from **LLM** to the **Decision Node**.
* **(2) Action history**: Purple arrow from **Failure-aware Action Memory** to the **Decision Node**.
* **(3)-X Call LLM**: Orange arrow from the **Decision Node** to the **LLM**.
* **(3)-O Reuse subgoal**: Blue arrow from the **Decision Node** to the **Controller**.
* **(4) Subgoal failures**: Red arrow from the **Environment** back to **Failure-aware Action Memory**.
* **(5) All actions are invalid**: Red arrow from **Failure-aware Action Memory** to the **Adaptive Dependency Graph**.
### Detailed Analysis
The diagram outlines a cyclical, feedback-driven process:
1. **Initialization**: The process begins with the **LLM** providing **(1) Goal & item requirements** to the central decision node.
2. **Context Gathering**: The decision node simultaneously receives **(2) Action history** from the **Failure-aware Action Memory**.
3. **Decision Point**: At the blue oval, the system checks: `If (past successful subgoal exists)`.
* **Path (3)-X**: If the condition is **false** (no successful past subgoal), it triggers **Call LLM**, sending a request back to the LLM for new planning.
* **Path (3)-O**: If the condition is **true**, it triggers **Reuse subgoal**, sending a command directly to the **Controller** for execution.
4. **Execution & Feedback**: The **Controller** acts upon the **Environment**. Outcomes, specifically failures, are fed back as **(4) Subgoal failures** to update the **Failure-aware Action Memory**.
5. **Adaptation**: If the memory determines that **(5) All actions are invalid** for a given context, it signals the **Adaptive Dependency Graph** to update its structure, presumably to avoid repeating failed pathways.
### Key Observations
* **Dual-Path Control**: The system has a clear branching logic based on historical success, creating a fast path (reuse) and a slow path (re-plan).
* **Centralized Memory**: The **Failure-aware Action Memory** is a critical hub, receiving failure data and providing history to inform both the immediate decision and long-term adaptation.
* **Explicit Failure Loop**: There is a dedicated, labeled feedback loop **(4)** for failures, highlighting that learning from errors is a core design principle.
* **Adaptation Trigger**: The condition for updating the dependency graph **(5)** is stringent—"All actions are invalid"—suggesting the graph changes only upon comprehensive failure, not single instances.
### Interpretation
This diagram depicts a sophisticated agent architecture designed for resilience and efficiency in sequential decision-making tasks. The core innovation is the tight integration of a **failure-aware memory** that directly influences both short-term action selection (via the decision node) and long-term strategy (via the adaptive graph).
The system prioritizes efficiency by reusing successful subgoals **(3)-O**, avoiding costly re-planning by the LLM. However, it remains robust by constantly checking action history and explicitly logging failures **(4)**. The most significant adaptation—modifying the dependency graph **(5)**—is reserved for scenarios where the current action repertoire is entirely exhausted, indicating a conservative approach to altering the core task model.
The flow suggests an agent that learns online from its interaction history, becoming more efficient by caching successes and more reliable by systematically recording and adapting to failures. The dashed red boundary implies this entire process is encapsulated as a single module or system.
</details>
Figure 2: Overview. XENON updates Adaptive Dependency Graph and Failure-aware Action Memory with environmental experiences.
### 4.1 Adaptive Dependency Graph (ADG)
<details>
<summary>x5.png Details</summary>

### Visual Description
## System Architecture Diagram: LLM-Based Agent Control Loop with Failure Memory
### Overview
This image is a technical system architecture diagram illustrating a control loop for an AI agent that uses a Large Language Model (LLM) for planning and execution. The diagram shows the flow of information and decision-making between core components, emphasizing goal processing, subgoal validation, action execution, and failure memory. The system is designed to handle subgoal failures by referencing past successful actions.
### Components/Axes
The diagram consists of several labeled components connected by numbered, directional arrows indicating process flow. The components are spatially arranged as follows:
* **Top-Left (Green Box):** `Adaptive Dependency Graph`
* **Bottom-Left (Purple Box):** `Failure-aware Action Memory`
* **Center (Blue Oval):** `If (past successful subgoal exists)`
* **Top-Right (Grey Box):** `LLM`
* **Right (White Box):** `Controller`
* **Bottom-Right (3D Cube Icon):** `Environment`
A dashed red line encloses the `Adaptive Dependency Graph`, `Failure-aware Action Memory`, and the central decision oval, suggesting they form a core subsystem.
### Detailed Analysis: Process Flow and Components
The process flow is indicated by numbered arrows. The sequence and labels are as follows:
1. **(1) Goal & item requirements:** A green arrow flows from the `LLM` to the `Adaptive Dependency Graph`. This indicates the LLM provides high-level goals and requirements to the graph structure.
2. **(2) Action history:** A purple arrow flows from the `Failure-aware Action Memory` to the central decision oval (`If (past successful subgoal exists)`). This provides historical data on past actions and their outcomes.
3. **(3)-X Call LLM / (3)-O Reuse subgoal:** This is a decision point. Two arrows originate from the central oval:
* **(3)-X Call LLM (Yellow Arrow):** If the condition ("past successful subgoal exists") is *not* met (implied by 'X'), the flow goes to the `LLM` to generate a new plan or subgoal.
* **(3)-O Reuse subgoal (Blue Arrow):** If the condition *is* met (implied by 'O'), the flow goes directly to the `Controller`, reusing a previously successful subgoal.
4. **(4) Subgoal failures:** A red arrow flows from the `Environment` back to the `Failure-aware Action Memory`. This logs failures encountered during execution in the environment into the memory system.
5. **(5) All actions are invalid:** A red, dashed arrow flows from the `Failure-aware Action Memory` back to the `Adaptive Dependency Graph`. This indicates that when actions are deemed invalid (likely due to recorded failures), the dependency graph is updated accordingly.
The `Controller` has a bidirectional arrow connecting it to the `Environment`, representing the execution of actions and the reception of feedback or state changes from the environment.
### Key Observations
* **Dual-Path Decision Logic:** The core innovation is the conditional check for past successful subgoals, creating two distinct pathways: one for novel planning (calling the LLM) and one for efficient reuse of known-good strategies.
* **Closed-Loop Learning:** The system forms a closed loop where outcomes (successes and failures) from the `Environment` are fed back into the `Failure-aware Action Memory`, which in turn influences future decisions via the central condition and updates the `Adaptive Dependency Graph`.
* **Explicit Failure Handling:** The diagram explicitly models failure propagation (arrows 4 and 5) as a critical input for system adaptation, not just an error state.
* **Spatial Grouping:** The dashed red box visually groups the memory, graph, and decision logic, highlighting them as the agent's internal cognitive core, separate from the external LLM and Environment.
### Interpretation
This diagram depicts a sophisticated agent architecture designed for robustness and efficiency in sequential decision-making tasks. The system aims to reduce reliance on costly or slow LLM calls by caching and reusing successful subgoals, a form of experiential learning.
The **Adaptive Dependency Graph** likely models the relationships between tasks, items, and goals, providing a structured representation of the problem space. The **Failure-aware Action Memory** acts as an episodic memory, storing not just actions but their contextual success/failure status.
The central conditional (`If (past successful subgoal exists)`) is the key investigative mechanism. It suggests the agent first attempts to solve a new problem by analogy to past experiences before resorting to general reasoning (the LLM). This mimics human problem-solving heuristics.
The flow of "All actions are invalid" (5) is particularly noteworthy. It implies a mechanism for **negative learning**—when a set of actions consistently fails, the system doesn't just remember the failure; it actively updates its core understanding of task dependencies (the graph) to avoid those invalid paths in the future. This represents a deeper level of adaptation than simple action avoidance.
Overall, the architecture balances the generality of an LLM with the efficiency and robustness of a structured memory and planning system, creating an agent that can learn from both its successes and its mistakes to improve its performance over time.
</details>
Figure 3: Overview. XENON updates Adaptive Dependency Graph and Failure-aware Action Memory with environmental experiences.
Dependency graph initialization
To make the most of the LLM’s prior knowledge, albeit incomplete, we initialize the learned dependency graph $\hat{G}=(\hat{V},\hat{E})$ using an LLM. We follow the initialization process of DECKARD (Nottingham et al., 2023), which consists of two steps. First, $\hat{V}$ is assigned $V_0$ , which is the set of goal items whose dependencies must be learned, and $\hat{E}$ is assigned $∅$ . Second, for each item $v$ in $\hat{V}$ , the LLM is prompted to predict its requirement set (i.e. incoming edges of $v$ ), aggregating them to construct the initial graph.
However, those LLM-predicted requirement sets often include items not present in the initial set $V_0$ , which is a phenomenon overlooked by DECKARD. Since $V_0$ may be an incomplete subset of all possible game items $V^*$ , we cannot determine whether such items are genuine required items or hallucinated items which do not exist in the environment. To address this, we provisionally accept all LLM requirement set predictions. We iteratively expand the graph by adding any newly mentioned item to $\hat{V}$ and, in turn, querying the LLM for its own requirement set. This expansion continues until a requirement set has been predicted for every item in $\hat{V}$ . Since we assume that the true graph $G^*$ is a DAG, we algorithmically prevent cycles in $\hat{G}$ ; see Section ˜ E.2 for the cycle-check procedure. The quality of this initial LLM-predicted graph is analyzed in detail in Appendix K.1.
Dependency graph revision
Correcting the agent’s flawed dependency knowledge involves two challenges: (1) detecting and handling hallucinated items from the graph initialization, and (2) proposing a new requirement set. Simply prompting an LLM for corrections is ineffective, as it often predicts a new, flawed requirement set, as shown in Figures 1 c and 1 d. Therefore, we revise $\hat{G}$ algorithmically using the agent’s experiences, without relying on the LLM.
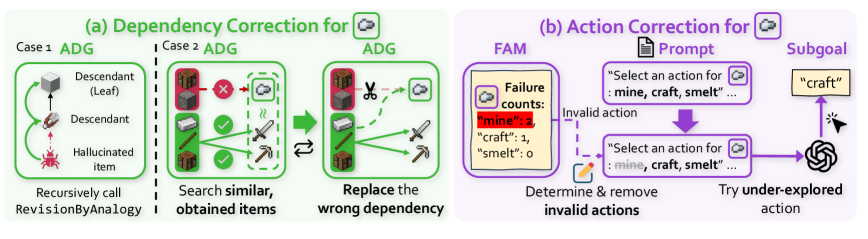
To implement this, we introduce a dependency revision procedure called RevisionByAnalogy and a revision count $C(v)$ for each item $v∈\hat{V}$ . This procedure outputs a revised graph by taking item $v$ whose dependency needs to be revised, its revision count $C(v)$ , and the current graph $\hat{G}$ as inputs, leveraging the required items of previously obtained items. When a revision for an item $v$ is triggered by FAM (Section ˜ 4.2), the procedure first discards $v$ ’s existing requirement set ( $i.e.\hbox{},R(v,\hat{G})←∅$ ). It increments the revision count $C(v)$ for $v$ . Based on whether $C(v)$ exceeds a hyperparameter $c_0$ , RevisionByAnalogy proceeds with one of the following two cases:
- Case 1: Handling potentially hallucinated items ( $C(v)>c_0$ ). If an item $v$ remains unobtainable after excessive revisions, the procedure flags it as inadmissible to signify that it may be a hallucinated item. This reveals a critical problem: if $v$ is indeed a hallucinated item, any of its descendants in $\hat{G}$ become permanently unobtainable. To enable XENON to try these descendant items through alternative paths, we recursively call RevisionByAnalogy for all of $v$ ’s descendants in $\hat{G}$ , removing their dependency on the inadmissible item $v$ (Figure ˜ 4 a, Case 1). Finally, to account for cases where $v$ may be a genuine item that is simply difficult to obtain, its requirement set $R(v,\hat{G})$ is reset to a general set of all resource items (i.e. items previously consumed for crafting other items), each with a quantity of hyperparameter $α_i$ .
- Case 2: Plausible revision for less-tried items ( $C(v)≤ c_0$ ). The item $v$ ’s requirement set, $R(v,\hat{G})$ , is revised to determine both a plausible set of new items and their quantities. First, for plausible required items, we use an idea that similar goals often share similar preconditions (Yoon et al., 2024). Therefore, we set the new required items referencing the required items of the top- $K$ similar, successfully obtained items (Figure ˜ 4 a, Case 2). We compute this item similarity as the cosine similarity between the Sentence-BERT (Reimers and Gurevych, 2019) embeddings of item names. Second, to determine their quantities, the agent should address the trade-off between sufficient amounts to avoid failures and an imperfect controller’s difficulty in acquiring them. Therefore, the quantities of those new required items are determined by gradually scaling with the revision count, $α_sC(v)$ .
Here, the hyperparameter $c_0$ serves as the revision count threshold for flagging an item as inadmissible. $α_i$ and $α_s$ control the quantity of each required item for inadmissible items (Case 1), and for less-tried items (Case 2), respectively, to maintain robustness when dealing with an imperfect controller. $K$ determines the number of similar, successfully obtained items to reference for (Case 2). Detailed pseudocode of RevisionByAnalogy is in Section ˜ E.3, Algorithm ˜ 3.
<details>
<summary>x6.png Details</summary>
### Visual Description
\n
## Diagram: AI Correction Mechanisms for Hallucination and Invalid Actions
### Overview
The image is a technical diagram illustrating two distinct correction mechanisms for an AI agent, likely operating in a simulated environment (e.g., Minecraft). The left side (a) details a process for correcting erroneous item dependencies in the agent's knowledge graph. The right side (b) details a process for correcting invalid action selection. The diagram uses a combination of flowchart elements, icons, and text to explain these processes.
### Components/Axes
The diagram is divided into two primary, color-coded sections:
1. **Section (a) - Dependency Correction (Green Theme):** Located on the left half. It is subdivided into "Case 1" and "Case 2," each showing an "ADG" (likely Action Dependency Graph).
2. **Section (b) - Action Correction (Purple Theme):** Located on the right half. It shows a flow involving a "FAM" (Failure Action Memory), a "Prompt," and a "Subgoal."
**Key Textual Elements and Labels:**
* **Main Titles:** "(a) Dependency Correction for [Cloud Icon]" and "(b) Action Correction for [Cloud Icon]".
* **Section (a) Labels:** "Case 1 ADG", "Case 2 ADG", "Descendant (Leaf)", "Descendant", "Hallucinated item", "Recursively call RevisionByAnalogy", "Search similar, obtained items", "Replace the wrong dependency".
* **Section (b) Labels:** "FAM", "Failure counts:", "Prompt", "Subgoal", "Invalid action", "Determine & remove invalid actions", "Try under-explored action".
* **Embedded Text in Boxes:**
* In the FAM box: `"mine": 3`, `"craft": 1`, `"smelt": 0`.
* In the Prompt box: `"Select an action for : mine, craft, smelt ..."` (appears twice).
* The Subgoal box contains the word: `"craft"`.
### Detailed Analysis
**Section (a): Dependency Correction**
* **Case 1 ADG (Top-Left):** Shows a simple vertical dependency chain. From top to bottom: an icon of a crafting table labeled "Descendant (Leaf)", connected by a downward arrow to an icon of a pickaxe labeled "Descendant", which is connected by a downward arrow to a red, spiky icon labeled "Hallucinated item". The instruction below reads: "Recursively call RevisionByAnalogy".
* **Case 2 ADG (Center-Left):** Shows a more complex graph. A redstone ore block (top) has a red "X" over its connection to a cloud icon. Below it, an iron ore block has green checkmarks on its connections to an iron ingot and an iron pickaxe. A dashed box encloses the iron ingot and pickaxe, with a wavy line suggesting a search or similarity function. The instruction below reads: "Search similar, obtained items".
* **Correction Process (Center):** A large green arrow points from the Case 2 ADG to a corrected ADG. In the corrected graph, the connection from the redstone ore to the cloud is severed by a scissors icon. A new, solid green arrow connects the iron ore to the cloud. The instruction below reads: "Replace the wrong dependency".
**Section (b): Action Correction**
* **Flow Direction:** The process flows from left to right.
* **FAM (Failure Action Memory) Box (Left):** Contains a cloud icon and the text "Failure counts:" followed by a list: `"mine": 3`, `"craft": 1`, `"smelt": 0`. A dashed purple arrow labeled "Invalid action" points from this box to the next step.
* **Determination Step (Center-Bottom):** An icon of a pencil and eraser is shown with the text "Determine & remove invalid actions".
* **Prompt Box (Center-Top):** A purple box containing the text: `"Select an action for : mine, craft, smelt ..."`. A thick purple arrow points downward from this box.
* **Action Selection & Subgoal (Right):** The downward arrow leads to a second, identical Prompt box. From this box, a purple arrow points right to a yellow box labeled "Subgoal" containing the word `"craft"`. A final arrow points from the Subgoal to a swirling icon (representing the AI agent or policy), with the label "Try under-explored action".
### Key Observations
1. **Two-Pronged Approach:** The system addresses errors at two levels: the foundational knowledge graph (dependencies between items) and the runtime decision-making (action selection).
2. **Use of Memory:** The Action Correction mechanism explicitly uses a "Failure Action Memory" (FAM) to track and avoid previously failed actions (`"mine"` has failed 3 times).
3. **Analogical Reasoning:** The Dependency Correction for "Case 1" relies on "RevisionByAnalogy," suggesting it uses similar, known correct structures to fix hallucinated or incorrect dependencies.
4. **Exploration Bias:** The final step in Action Correction is to "Try under-explored action," indicating a strategy to overcome repetitive failure by encouraging exploration of less-tried options within the valid action space.
5. **Visual Coding:** Green is consistently used for dependency-related processes and successful corrections. Purple is used for action-selection processes and failure memory.
### Interpretation
This diagram outlines a sophisticated self-correction framework for an AI agent. The **Dependency Correction** process is a form of knowledge graph repair. It identifies "hallucinated" items—concepts the agent incorrectly believes are necessary—and either finds analogies to correct the graph (Case 1) or replaces the faulty dependency with a link to an item the agent has actually obtained and used successfully (Case 2). This ensures the agent's internal model of the world is grounded in its experiences.
The **Action Correction** process is a behavioral adaptation loop. By maintaining a memory of failed actions (FAM), the agent can dynamically filter its available action space (`mine, craft, smelt`). When prompted to select an action, it removes the invalid ones (e.g., it might stop trying to "mine" if it has failed repeatedly) and instead selects from the remaining valid actions, prioritizing those it has explored less. This prevents the agent from being stuck in a loop of repeating the same mistakes.
Together, these mechanisms allow the agent to recover from both **conceptual errors** (wrong beliefs about how the world works) and **procedural errors** (repeating failed actions), making its behavior more robust and adaptive. The cloud icon in both titles suggests these corrections are triggered by or related to some form of external feedback or a failure signal (a "cloud" of uncertainty or error).
</details>
Figure 4: XENON’s algorithmic knowledge correction. (a) Dependency Correction via RevisionByAnalogy. Case 1: For an inadmissible item (e.g., a hallucinated item), its descendants are recursively revised to remove the flawed dependency. Case 2: A flawed requirement set is revised by referencing similar, obtained items. (b) Action Correction via FAM. FAM prunes invalid actions from the LLM’s prompt based on failures, guiding it to select an under-explored action.
### 4.2 Failure-aware Action Memory (FAM)
FAM is designed to address two challenges of learning only from binary success/failure feedback: (1) discovering valid high-level actions for each item, and (2) disambiguating the cause of persistent failures between invalid actions and flawed dependency knowledge. This section first describes FAM’s core mechanism, and then details how it addresses each of these challenges in turn.
Core mechanism: empirical action classification
FAM classifies actions as either empirically valid or empirically invalid for each item, based on their history of past subgoal outcomes. Specifically, for each item $v∈\hat{V}$ and action $a∈A$ , FAM maintains the number of successful and failed outcomes, denoted as $S(a,v)$ and $F(a,v)$ respectively. Based on these counts, an action $a$ is classified as empirically invalid for $v$ if it has failed repeatedly, (i.e., $F(a,v)≥ S(a,v)+x_0$ ); otherwise, it is classified as empirically valid if it has succeeded at least once (i.e., $S(a,v)>0$ and $S(a,v)>F(a,v)-x_0$ ). The hyperparameter $x_0$ controls the tolerance for this classification, accounting for the possibility that an imperfect controller might fail even with an indeed valid action.
Addressing challenge 1: discovering valid actions
FAM helps XENON discover valid actions by avoiding repeatedly failed actions when making a subgoal $sg_l=(a_l,q_l,u_l)$ . Only when FAM has no empirically valid action for $u_l$ , XENON queries the LLM to select an under-explored action for constructing $sg_l$ . To accelerate this search for a valid action, we query the LLM with (i) the current subgoal item $u_l$ , (ii) empirically valid actions for top- $K$ similar items successfully obtained and stored in FAM (using Sentence-BERT similarity as in Section ˜ 4.1), and (iii) candidate actions for $u_l$ that remain after removing all empirically invalid actions from $A$ (Figure ˜ 4 b). We prune action candidates rather than include the full failure history because LLMs struggle to effectively utilize long prompts (Li et al., 2024a; Liu et al., 2024). If FAM already has an empirically valid one, XENON reuses it to make $sg_l$ without using LLM. Detailed procedures and prompts are in Appendix ˜ F.
Addressing challenge 2: disambiguating failure causes
By ensuring systematic action exploration, FAM allows XENON to determine that persistent subgoal failures stem from flawed dependency knowledge rather than from the actions. Specifically, once FAM classifies all actions in $A$ for an item as empirically invalid, XENON concludes that the error lies within ADG and triggers its revision. Subsequently, XENON resets the item’s history in FAM to allow for a fresh exploration of actions with the revised ADG.
### 4.3 Additional technique: context-aware reprompting (CRe) for controller
In real-world-like environments, an imperfect controller can stall (e.g., in deep water). To address this, XENON employs context-aware reprompting (CRe), where an LLM uses the current image observation and the controller’s language subgoal to decide whether to replace the subgoal and propose a new temporary subgoal to escape the stalled state (e.g., “get out of the water”). Our CRe is adapted from Optimus-1 (Li et al., 2024b) to be suitable for smaller LLMs, with two differences: (1) a two-stage reasoning process that captions the observation first and then makes a text-only decision on whether to replace the subgoal, and (2) a conditional trigger that activates only when the subgoal for item acquisition makes no progress, rather than at fixed intervals. See Appendix ˜ H for details.
## 5 Experiments
### 5.1 Setups
Environments
We conduct experiments in three Minecraft environments, which we separate into two categories based on their controller capacity. First, as realistic, visually-rich embodied AI environments, we use MineRL (Guss et al., 2019) and Mineflayer (PrismarineJS, 2023) with imperfect low-level controllers: STEVE-1 (Lifshitz et al., 2023) in MineRL and hand-crafted codes (Yu and Lu, 2024) in Mineflayer. Second, we use MC-TextWorld (Zheng et al., 2025) as a controlled testbed with a perfect controller. Each experiment in this environment is repeated over 15 runs; in our results, we report the mean and standard deviation, omitting the latter when it is negligible. In all environments, the agent starts with an empty inventory. Further details on environments are provided in Appendix ˜ J. Additional experiments in a household task planning domain other than Minecraft are reported in Appendix ˜ A, where XENON also exhibits robust performance.
Table 1: Comparison of knowledge correction mechanisms across agents. ○: Our proposed mechanism (XENON), $\triangle$ : LLM self-correction, ✗: No correction, –: Not applicable.
| Agent | Dependency Correction | Action Correction |
| --- | --- | --- |
| XENON | ○ | ○ |
| SC | $\triangle$ | $\triangle$ |
| DECKARD | ✗ | ✗ |
| ADAM | - | ✗ |
| RAND | ✗ | ✗ |
Evaluation metrics
For both dependency learning and planning evaluations, we utilize the 67 goals from 7 groups proposed in the long-horizon task benchmark (Li et al., 2024b). To evaluate dependency learning with an intuitive performance score between 0 and 1, we report $N_true(\hat{G})/67$ , where $N_true(\hat{G})$ is defined in Equation ˜ 1. We refer to this normalized score as Experienced Graph Accuracy (EGA). To evaluate planning performance, we follow the benchmark setting (Li et al., 2024b): at the beginning of each episode, a goal item is specified externally for the agent, and we measure the average success rate (SR) of obtaining this goal item in MineRL. See Table ˜ 10 for the full list of goals.
Implementation details
For the planner, we use Qwen2.5-VL-7B (Bai et al., 2025). The learned dependency graph is initialized with human-written plans for three goals (“craft an iron sword
<details>
<summary>x7.png Details</summary>

### Visual Description
Icon/Small Image (20x20)
</details>
”, “craft a golden sword
<details>
<summary>x8.png Details</summary>

### Visual Description
Icon/Small Image (20x20)
</details>
,” “mine a diamond
<details>
<summary>x9.png Details</summary>

### Visual Description
Icon/Small Image (20x20)
</details>
”), providing minimal knowledge; the agent must learn dependencies for over 80% of goal items through experience. We employ CRe only for long-horizon goal planning in MineRL. All hyperparameters are kept consistent across experiments. Further details on hyperparameters and human-written plans are in Appendix ˜ I.
Baselines
As no prior work learns dependencies in our exact setting, we adapt four baselines, whose knowledge correction mechanisms are summarized in Table 1. For dependency knowledge, (1) LLM Self-Correction (SC) starts with an LLM-predicted dependency graph and prompts the LLM to revise it upon failures; (2) DECKARD (Nottingham et al., 2023) also relies on an LLM-predicted graph but with no correction mechanism; (3) ADAM (Yu and Lu, 2024) assumes that any goal item requires all previously used resource items, each in a sufficient quantity; and (4) RAND, the simplest baseline, uses a static graph similar to DECKARD. Regarding action knowledge, all baselines except for RAND store successful actions. However, only the SC baseline attempts to correct its flawed knowledge upon failures. The SC prompts the LLM to revise both its dependency and action knowledge using previous LLM predictions and interaction trajectories, as done in many self-correction methods (Shinn et al., 2023; Stechly et al., 2024). See Appendix ˜ B for the prompts of SC and Section ˜ J.1 for detailed descriptions of these baselines. To evaluate planning on diverse long-horizon goals, we further compare XENON with recent planning agents that are provided with oracle dependencies: DEPS Wang et al. (2023b), Jarvis-1 Wang et al. (2023c), Optimus-1 Li et al. (2024b), and Optimus-2 Li et al. (2025b).
### 5.2 Robust dependency learning against flawed prior knowledge
<details>
<summary>x10.png Details</summary>
### Visual Description
## Line Chart: Performance Comparison of Five Methods Over Episodes
### Overview
The image is a line chart comparing the performance of five different methods (XENON, SC, DECKARD, ADAM, RAND) across a series of training episodes. The performance metric is labeled "EGA" on the y-axis. The chart demonstrates that one method (XENON) shows significant improvement over time, while two others (SC, DECKARD) show initial improvement before plateauing, and two (ADAM, RAND) show negligible change.
### Components/Axes
* **Chart Type:** Line chart with markers.
* **Y-Axis:**
* **Label:** "EGA"
* **Scale:** Linear, ranging from 0.0 to 1.0.
* **Major Ticks:** 0.0, 0.2, 0.4, 0.6, 0.8, 1.0.
* **X-Axis:**
* **Label:** "Episode"
* **Scale:** Linear, representing discrete episode counts.
* **Major Ticks:** 000, 100, 200, 300, 400.
* **Legend:**
* **Position:** Top-left corner of the plot area.
* **Content:** Maps five distinct line/marker combinations to method names.
1. **XENON:** Light blue line with circular markers.
2. **SC:** Pink line with diamond markers.
3. **DECKARD:** Light green line with square markers.
4. **ADAM:** Orange line with pentagon (house-shaped) markers.
5. **RAND:** Dark grey/blue line with plus-sign (+) markers.
### Detailed Analysis
**Data Series Trends and Approximate Values:**
1. **XENON (Light Blue, Circles):**
* **Trend:** Shows a consistent, near-linear upward trend across all episodes. It is the only series that continues to improve significantly after episode 100.
* **Approximate Data Points:**
* Episode 0: ~0.15
* Episode 100: ~0.35
* Episode 200: ~0.50
* Episode 300: ~0.55
* Episode 400: ~0.62
2. **SC (Pink, Diamonds):**
* **Trend:** Increases sharply from episode 0 to 100, then plateaus, showing very little change from episode 100 to 400.
* **Approximate Data Points:**
* Episode 0: ~0.15
* Episode 100: ~0.38
* Episode 200: ~0.40
* Episode 300: ~0.39
* Episode 400: ~0.40
3. **DECKARD (Light Green, Squares):**
* **Trend:** Follows a nearly identical pattern to SC. Sharp increase to episode 100, followed by a flat plateau.
* **Approximate Data Points:**
* Episode 0: ~0.15
* Episode 100: ~0.42
* Episode 200: ~0.42
* Episode 300: ~0.42
* Episode 400: ~0.42
4. **ADAM (Orange, Pentagons):**
* **Trend:** Essentially flat across all episodes, hovering just above the baseline.
* **Approximate Data Points:** Consistently ~0.15 from Episode 0 to 400.
5. **RAND (Dark Grey/Blue, Plus Signs):**
* **Trend:** Also essentially flat, overlapping closely with ADAM.
* **Approximate Data Points:** Consistently ~0.16 from Episode 0 to 400.
### Key Observations
* **Performance Hierarchy:** At the final episode (400), the clear performance order is: XENON (~0.62) > DECKARD (~0.42) ≈ SC (~0.40) > RAND (~0.16) ≈ ADAM (~0.15).
* **Convergence Point:** All five methods start at approximately the same performance level (~0.15) at Episode 0.
* **Plateau Behavior:** SC and DECKARD reach their maximum performance by Episode 100 and show no further learning. ADAM and RAND show no learning at all.
* **Divergence:** The XENON series diverges positively from the others starting at Episode 100, and the gap widens with each subsequent episode.
### Interpretation
This chart likely visualizes the results of a machine learning or reinforcement learning experiment. "EGA" is the performance metric being optimized, and "Episode" represents training iterations.
* **What the data suggests:** The method named "XENON" is demonstrably more effective and scalable for this task than the other four methods. It continues to learn and improve over a longer timeframe (400 episodes), whereas the next-best methods (SC, DECKARD) quickly reach a performance ceiling. ADAM and RAND appear to be ineffective baselines or random agents, as they show no improvement.
* **Relationship between elements:** The chart is designed to highlight the superiority of XENON. The use of a bright, distinct color (light blue) and a rising line draws the eye. The plateau of SC/DECKARD and the flatlines of ADAM/RAND serve as critical points of comparison, emphasizing that XENON's continued growth is significant and non-trivial.
* **Notable anomalies:** The near-perfect overlap of the ADAM and RAND lines is striking. It suggests that the ADAM method performs no better than a random (RAND) strategy for this specific task and metric. The very similar performance and trend of SC and DECKARD might indicate they are related algorithms or share a fundamental limitation.
**Language:** All text in the chart (labels, legend, axis ticks) is in English. No other languages are present.
</details>
(a) MineRL
<details>
<summary>x11.png Details</summary>
### Visual Description
## Line Chart: Performance Comparison Across Episodes
### Overview
The image displays a line chart comparing the performance of five different methods or algorithms over a series of training episodes. The performance metric is labeled "EGA" on the y-axis, and the x-axis represents the progression of "Episode" from 0 to 400. The chart shows that all methods start at a similar low performance level, but their trajectories diverge significantly as training progresses.
### Components/Axes
* **X-Axis (Horizontal):**
* **Label:** "Episode"
* **Scale:** Linear, with major tick marks at 000, 100, 200, 300, and 400.
* **Y-Axis (Vertical):**
* **Label:** "EGA"
* **Scale:** Linear, ranging from 0.0 to 1.0, with major tick marks at intervals of 0.2 (0.0, 0.2, 0.4, 0.6, 0.8, 1.0).
* **Data Series (Lines):** There are five distinct lines, each identified by a unique color and marker shape. **Note:** A formal legend is not present within the chart area. The series are identified below by their visual properties.
1. **Light Blue Line with Circle Markers:** The top-performing series.
2. **Orange Line with 'X' (Cross) Markers:** The second-highest performing series.
3. **Light Green Line with Square Markers:** A mid-tier performer.
4. **Pink Line with Diamond Markers:** A mid-tier performer, closely following the green line.
5. **Dark Gray Line with Plus ('+') Markers:** The lowest-performing series.
### Detailed Analysis
**Trend Verification & Data Point Extraction (Approximate Values):**
1. **Light Blue Line (Circles):**
* **Trend:** Slopes steeply upward from episode 0 to 200, then continues to rise at a slower rate, appearing to plateau near the top of the chart.
* **Data Points:**
* Episode 0: ~0.15
* Episode 100: ~0.68
* Episode 200: ~0.88
* Episode 300: ~0.91
* Episode 400: ~0.91
2. **Orange Line (Crosses):**
* **Trend:** Rises sharply from episode 0 to 100, then immediately plateaus, maintaining a constant value for the remainder of the episodes.
* **Data Points:**
* Episode 0: ~0.15
* Episode 100: ~0.64
* Episode 200: ~0.64
* Episode 300: ~0.64
* Episode 400: ~0.64
3. **Light Green Line (Squares):**
* **Trend:** Increases from episode 0 to 100, then shows very gradual improvement, nearly plateauing.
* **Data Points:**
* Episode 0: ~0.15
* Episode 100: ~0.40
* Episode 200: ~0.42
* Episode 300: ~0.43
* Episode 400: ~0.43
4. **Pink Line (Diamonds):**
* **Trend:** Follows a similar trajectory to the green line but starts slightly lower at episode 100 and converges with it by episode 300.
* **Data Points:**
* Episode 0: ~0.15
* Episode 100: ~0.34
* Episode 200: ~0.38
* Episode 300: ~0.43
* Episode 400: ~0.43
5. **Dark Gray Line (Plus Signs):**
* **Trend:** Shows minimal improvement. It rises slightly from episode 0 to 100 and then remains essentially flat at a low performance level.
* **Data Points:**
* Episode 0: ~0.15
* Episode 100: ~0.20
* Episode 200: ~0.20
* Episode 300: ~0.21
* Episode 400: ~0.21
### Key Observations
* **Performance Hierarchy:** A clear and consistent ranking is established by episode 100 and maintained thereafter: Light Blue > Orange > Light Green ≈ Pink > Dark Gray.
* **Convergence Points:** The Light Green and Pink lines converge to the same final performance value (~0.43). All lines start from the same approximate point (~0.15) at episode 0.
* **Plateau Behavior:** The Orange line exhibits the most abrupt plateau, showing no learning after episode 100. The Light Blue line shows the most sustained learning, continuing to improve (albeit slowly) until episode 300.
* **Lowest Performer:** The Dark Gray line demonstrates significantly limited learning capacity compared to the other four methods.
### Interpretation
This chart likely compares the learning efficiency or final performance of different reinforcement learning agents, machine learning models, or optimization algorithms on a specific task. The "EGA" metric is probably a performance score (e.g., "Expected Goal Advantage," "Episode Gain Average," or a similar domain-specific measure) where higher is better.
The data suggests that the method represented by the **Light Blue line is superior**, achieving near-maximal performance (~0.91) and continuing to learn effectively throughout the training period. The **Orange method** learns very quickly but hits a hard performance ceiling early. The **Green and Pink methods** show moderate, stable learning. The **Dark Gray method** appears to be poorly suited for the task or is a weak baseline, as it learns very little.
The absence of a legend is a significant limitation for precise interpretation, as the specific algorithms or conditions corresponding to each color are unknown. However, the visual trends alone provide a clear comparative analysis of learning dynamics and asymptotic performance. The chart effectively communicates that not all methods are equal in both learning speed and final capability for this particular task.
</details>
(b) Mineflayer
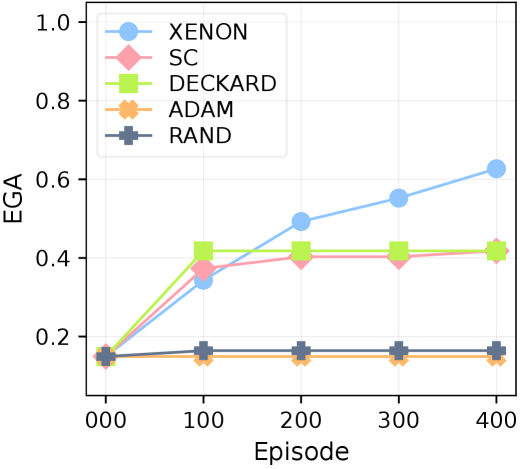
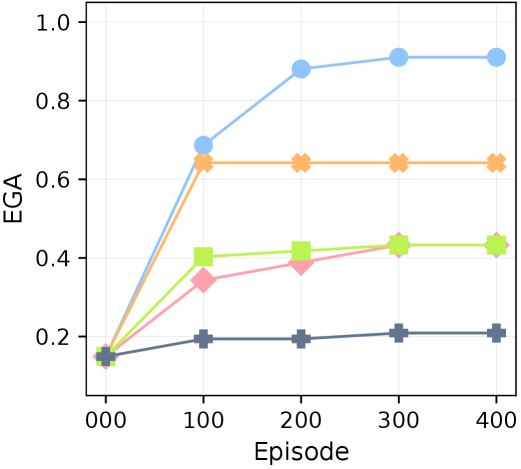
Figure 5: Robustness against flawed prior knowledge. EGA over 400 episodes in (a) MineRL and (b) Mineflayer. XENON consistently outperforms the baselines.
Table 2: Robustness to LLM hallucinations. The number of correctly learned dependencies of items that are descendants of a hallucinated item in the initial LLM-predicted dependency graph (out of 12).
| Agent | Learned descendants of hallucinated items |
| --- | --- |
| XENON | 0.33 |
| SC | 0 |
| ADAM | 0 |
| DECKARD | 0 |
| RAND | 0 |
XENON demonstrates robust dependency learning from flawed prior knowledge, consistently outperforming baselines with an EGA of approximately 0.6 in MineRL and 0.9 in Mineflayer (Figure ˜ 5), despite the challenging setting with imperfect controllers. This superior performance is driven by its algorithmic correction mechanism, RevisionByAnalogy, which corrects flawed dependency knowledge while also accommodating imperfect controllers by gradually scaling required items quantities. The robustness of this algorithmic correction is particularly evident in two key analyses of the learned graph for each agent from the MineRL experiments. First, as shown in Table ˜ 2, XENON is uniquely robust to LLM hallucinations, learning dependencies for descendant items of non-existent, hallucinated items in the initial LLM-predicted graph. Second, XENON outperforms the baselines in learning dependencies for items that are unobtainable by the initial graph, as shown in Table ˜ 13.
Our results demonstrate the unreliability of relying on LLM self-correction or blindly trusting an LLM’s flawed knowledge; in practice, SC achieves the same EGA as DECKARD, with both plateauing around 0.4 in both environments.
We observe that controller capacity strongly impacts dependency learning. This is evident in ADAM, whose EGA differs markedly between MineRL ( $≈$ 0.1), which has a limited controller, and Mineflayer ( $≈$ 0.6), which has a more competent controller. While ADAM unrealistically assumes a controller can gather large quantities of all resource items before attempting a new item, MineRL’s controller STEVE-1 (Lifshitz et al., 2023) cannot execute this demanding strategy, causing ADAM’s EGA to fall below even the simplest baseline, RAND. Controller capacity also accounts for XENON’s lower EGA in MineRL. For instance, XENON learns none of the dependencies of the Redstone group items, as STEVE-1 cannot execute XENON’s strategy for inadmissible items (Section ˜ 4.1). In contrast, the more capable Mineflayer controller executes this strategy successfully, allowing XENON to learn the correct dependencies for 5 of 6 Redstone items. This difference highlights the critical role of controllers for dependency learning, as detailed in our analysis in Section ˜ K.3
### 5.3 Effective planning to solve diverse goals
Table 3: Performance on long-horizon task benchmark. Average success rate of each group on the long-horizon task benchmark Li et al. (2024b) in MineRL. Oracle indicates that the true dependency graph is known in advance, Learned indicates that the graph is learned via experience across 400 episodes. For fair comparison across LLMs, we include Optimus-1 †, our reproduction of Optimus-1 using Qwen2.5-VL-7B. Due to resource limits, results for DEPS, Jarvis-1, Optimus-1, and Optimus-2 are cited directly from (Li et al., 2025b). See Section ˜ K.12 for the success rate on each goal.
| Method | Dependency | Planner LLM | Overall |
<details>
<summary>x12.png Details</summary>

### Visual Description
Icon/Small Image (20x20)
</details>
|
<details>
<summary>x13.png Details</summary>

### Visual Description
Icon/Small Image (20x20)
</details>
|
<details>
<summary>x14.png Details</summary>

### Visual Description
Icon/Small Image (20x20)
</details>
|
<details>
<summary>x15.png Details</summary>

### Visual Description
Icon/Small Image (20x20)
</details>
|
<details>
<summary>x16.png Details</summary>

### Visual Description
Icon/Small Image (20x20)
</details>
|
<details>
<summary>x17.png Details</summary>

### Visual Description
Icon/Small Image (20x20)
</details>
|
<details>
<summary>x18.png Details</summary>

### Visual Description
Icon/Small Image (20x20)
</details>
|
| --- | --- | --- | --- | --- | --- | --- | --- | --- | --- | --- |
| Wood | Stone | Iron | Diamond | Gold | Armor | Redstone | | | | |
| DEPS | - | Codex | 0.22 | 0.77 | 0.48 | 0.16 | 0.01 | 0.00 | 0.10 | 0.00 |
| Jarvis-1 | Oracle | GPT-4 | 0.38 | 0.93 | 0.89 | 0.36 | 0.08 | 0.07 | 0.15 | 0.16 |
| Optimus-1 | Oracle | GPT-4V | 0.43 | 0.98 | 0.92 | 0.46 | 0.11 | 0.08 | 0.19 | 0.25 |
| Optimus-2 | Oracle | GPT-4V | 0.45 | 0.99 | 0.93 | 0.53 | 0.13 | 0.09 | 0.21 | 0.28 |
| Optimus-1 † | Oracle | Qwen2.5-VL-7B | 0.34 | 0.92 | 0.80 | 0.22 | 0.10 | 0.09 | 0.17 | 0.04 |
| XENON ∗ | Oracle | Qwen2.5-VL-7B | 0.79 | 0.95 | 0.93 | 0.83 | 0.75 | 0.73 | 0.61 | 0.75 |
| XENON | Learned | Qwen2.5-VL-7B | 0.54 | 0.85 | 0.81 | 0.46 | 0.64 | 0.74 | 0.28 | 0.00 |
As shown in Table ˜ 3, XENON significantly outperforms baselines in solving diverse long-horizon goals despite using the lightweight Qwen2.5-VL-7B LLM (Bai et al., 2025), while the baselines rely on large proprietary models such as Codex (Chen et al., 2021), GPT-4 (OpenAI, 2024), and GPT-4V (OpenAI, 2023). Remarkably, even with its learned dependency knowledge (Section ˜ 5.2), XENON surpasses the baselines with the oracle knowledge on challenging late-game goals, achieving high SRs for item groups like Gold (0.74) and Diamond (0.64).
XENON’s superiority stems from two key factors. First, its FAM provides systematic, fine-grained action correction for each goal. Second, it reduces reliance on the LLM for planning in two ways: it shortens prompts and outputs by requiring it to predict one action per subgoal item, and it bypasses the LLM entirely by reusing successful actions from FAM. In contrast, the baselines lack a systematic, fine-grained action correction mechanism and instead make LLMs generate long plans from lengthy prompts—a strategy known to be ineffective for LLMs (Wu et al., 2024; Li et al., 2024a). This challenge is exemplified by Optimus-1 †. Despite using a knowledge graph for planning like XENON, its long-context generation strategy causes LLM to predict incorrect actions or omit items explicitly provided in its prompt, as detailed in Section ˜ K.5.
We find that accurate knowledge is critical for long-horizon planning, as its absence can make even a capable agent ineffective. The Redstone group from Table ˜ 3 provides an example: while XENON ∗ with oracle knowledge succeeds (0.75 SR), XENON with learned knowledge fails entirely (0.00 SR), because it failed to learn the dependencies for Redstone goals due to the controller’s limited capacity in MineRL (Section ˜ 5.2). This finding is further supported by our comprehensive ablation study, which confirms that accurate dependency knowledge is most critical for success across all goals (See Table ˜ 17 in Section ˜ K.7).
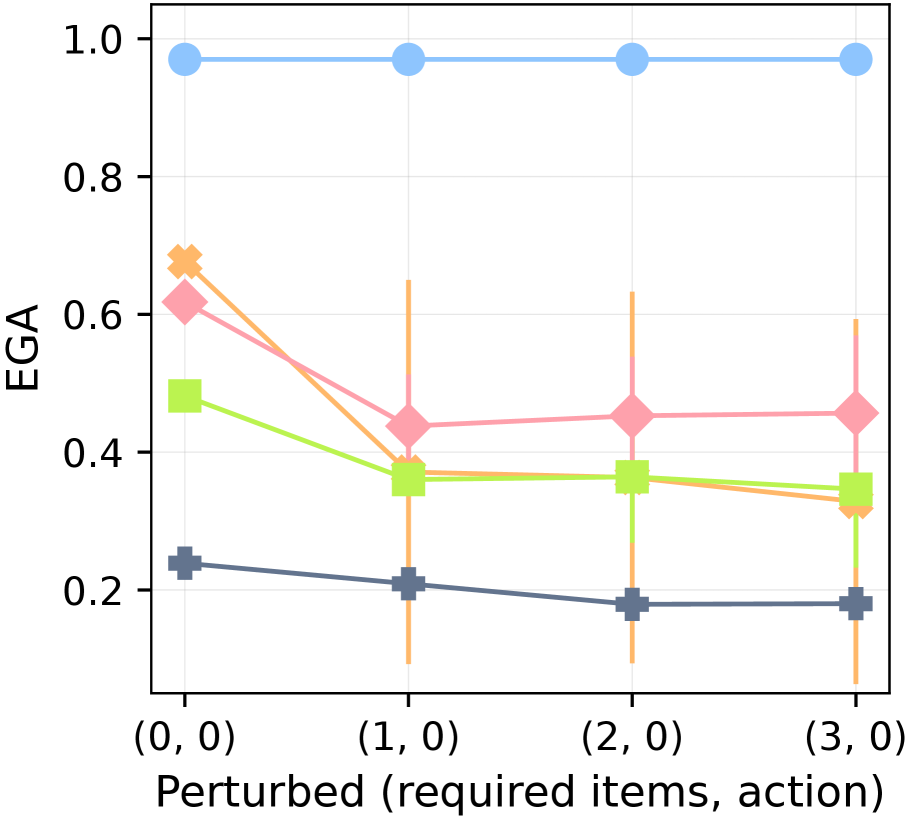
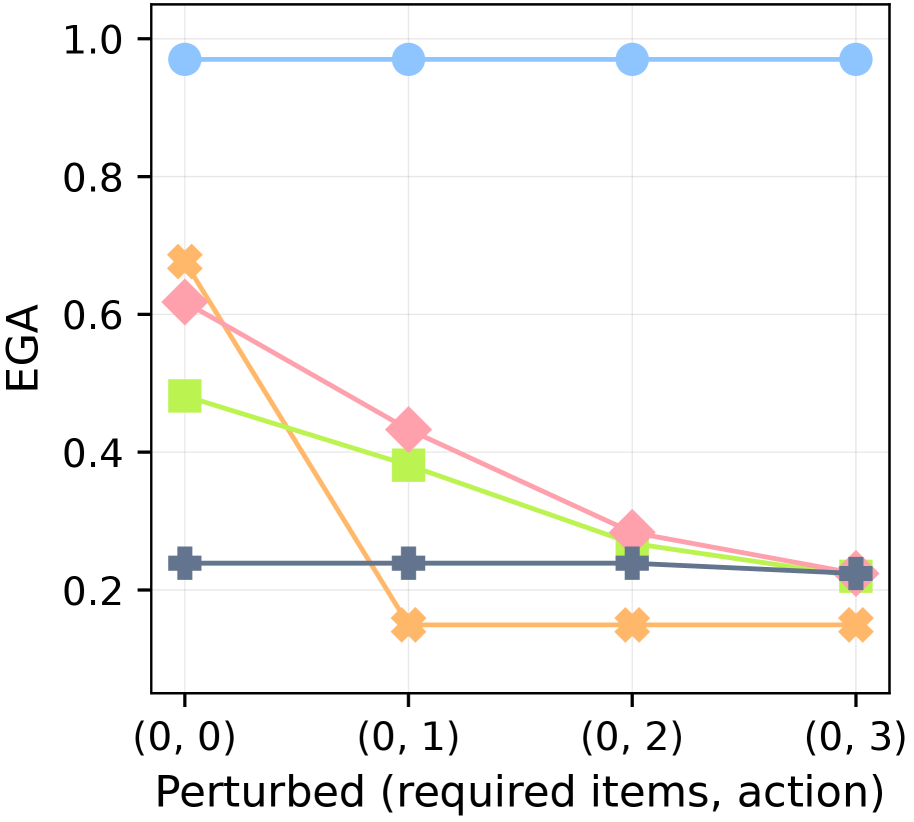
### 5.4 Robust dependency learning against knowledge conflicts
<details>
<summary>x19.png Details</summary>

### Visual Description
## Chart Legend: Multi-Series Data Key
### Overview
The image displays a horizontal legend or key, typically used to identify multiple data series in an accompanying chart (not shown). It contains five distinct entries, each pairing a colored geometric marker with a text label.
### Components/Axes
The legend is a single-row, bordered container with a white background. It is arranged horizontally from left to right. Each entry consists of a colored marker followed by a text label in uppercase, black, sans-serif font.
### Detailed Analysis
The legend contains the following five entries, listed in order from left to right:
1. **Marker:** Light blue circle.
**Label:** `XENON`
2. **Marker:** Pink diamond.
**Label:** `SC`
3. **Marker:** Orange circle.
**Label:** `ADAM`
4. **Marker:** Light green square.
**Label:** `DECKARD`
5. **Marker:** Dark blue-gray circle with a horizontal line through its center.
**Label:** `RAND`
### Key Observations
* **Visual Differentiation:** The legend uses a combination of color (light blue, pink, orange, light green, dark blue-gray) and shape (circle, diamond, square, circle-with-line) to uniquely identify each data series. This dual encoding ensures clarity even if printed in grayscale or for users with color vision deficiencies.
* **Label Content:** The labels are short, capitalized words or acronyms (`XENON`, `SC`, `ADAM`, `DECKARD`, `RAND`). They appear to be proper nouns or project/algorithm names, suggesting the chart compares the performance or characteristics of these five distinct entities.
* **Spatial Grounding:** The legend is positioned as a standalone element, likely intended to be placed at the top, bottom, or side of a chart. The entries are evenly spaced within a single horizontal row.
### Interpretation
This legend is a critical component for interpreting an associated, but absent, data visualization. Its design indicates the chart it belongs to is a multi-series plot (e.g., line chart, scatter plot, bar chart) comparing five different items.
* **Purpose:** The primary function is to map visual properties (color and shape) in the chart to the conceptual entities they represent (`XENON`, `SC`, etc.).
* **Inference about the Chart:** The use of distinct shapes (circle, diamond, square) alongside colors suggests the chart may be a scatter plot or line chart where markers are used to denote data points. The unique marker for `RAND` (circle with a line) might indicate it is a baseline, reference, or control series against which the others are compared.
* **Missing Context:** Without the main chart, the specific data, trends, or relationships between these five entities cannot be determined. The legend alone provides the "who" but not the "what" or "how" of the data story. The names (`ADAM`, `DECKARD`, `RAND`) are reminiscent of characters from Philip K. Dick's works, which might hint at the chart's subject matter (e.g., AI, robotics, cognitive science), but this is speculative.
</details>
<details>
<summary>x20.png Details</summary>
### Visual Description
## Line Chart: EGA Performance Under Perturbed Conditions
### Overview
The image displays a line chart with error bars, plotting the performance metric "EGA" against four distinct perturbed conditions. The chart compares four different model configurations, showing how their performance changes as more components (subgoals, actions, items) are removed from the system.
### Components/Axes
* **Chart Type:** Line chart with vertical error bars.
* **Y-Axis:**
* **Label:** "EGA"
* **Scale:** Linear, ranging from 0.0 to 1.0.
* **Major Ticks:** 0.0, 0.2, 0.4, 0.6, 0.8, 1.0.
* **X-Axis:**
* **Label:** "Perturbed (required items, action)"
* **Categories (from left to right):** `(0, 0)`, `(1, 0)`, `(2, 0)`, `(3, 0)`. These tuples likely represent the number of required items perturbed (first number) and whether the action is perturbed (second number, 0 for no).
* **Legend:**
* **Position:** Top-right corner of the plot area.
* **Entries (from top to bottom in legend):**
1. **Label:** "Ours (Oracle)"
* **Color:** Light blue.
* **Marker:** Circle.
2. **Label:** "Ours (Oracle, No-Subgoal)"
* **Color:** Pink.
* **Marker:** Diamond.
3. **Label:** "Ours (Oracle, No-Subgoal, No-Action)"
* **Color:** Light green.
* **Marker:** Square.
4. **Label:** "Ours (Oracle, No-Subgoal, No-Action, No-Item)"
* **Color:** Orange.
* **Marker:** X (cross).
* **Note:** A fifth data series (dark blue line with plus markers) is present in the chart but is **not listed in the legend**. Its label is unknown.
### Detailed Analysis
**Data Series and Trends:**
1. **Ours (Oracle) - Light Blue Line, Circle Markers:**
* **Trend:** Perfectly flat, horizontal line at the top of the chart.
* **Data Points (Approximate):**
* `(0, 0)`: EGA ≈ 0.97
* `(1, 0)`: EGA ≈ 0.97
* `(2, 0)`: EGA ≈ 0.97
* `(3, 0)`: EGA ≈ 0.97
* **Error Bars:** Not visible, suggesting negligible or zero variance.
2. **Ours (Oracle, No-Subgoal) - Pink Line, Diamond Markers:**
* **Trend:** Sharp initial decline from `(0,0)` to `(1,0)`, then stabilizes.
* **Data Points (Approximate):**
* `(0, 0)`: EGA ≈ 0.61
* `(1, 0)`: EGA ≈ 0.44
* `(2, 0)`: EGA ≈ 0.45
* `(3, 0)`: EGA ≈ 0.45
* **Error Bars:** Visible vertical lines at `(1,0)`, `(2,0)`, and `(3,0)`. The bar at `(1,0)` is the longest, spanning roughly from EGA 0.25 to 0.65.
3. **Ours (Oracle, No-Subgoal, No-Action) - Light Green Line, Square Markers:**
* **Trend:** Moderate decline from `(0,0)` to `(1,0)`, then a very slight, gradual decline.
* **Data Points (Approximate):**
* `(0, 0)`: EGA ≈ 0.48
* `(1, 0)`: EGA ≈ 0.37
* `(2, 0)`: EGA ≈ 0.36
* `(3, 0)`: EGA ≈ 0.35
* **Error Bars:** Visible at `(1,0)`, `(2,0)`, and `(3,0)`, generally shorter than those for the pink series.
4. **Ours (Oracle, No-Subgoal, No-Action, No-Item) - Orange Line, X Markers:**
* **Trend:** Steep, continuous decline across all perturbation levels.
* **Data Points (Approximate):**
* `(0, 0)`: EGA ≈ 0.68 (This is an outlier, being higher than the pink and green series at this point).
* `(1, 0)`: EGA ≈ 0.36
* `(2, 0)`: EGA ≈ 0.36
* `(3, 0)`: EGA ≈ 0.32
* **Error Bars:** Very prominent, especially at `(1,0)` where the bar spans from near 0.1 to over 0.6. Bars remain large at `(2,0)` and `(3,0)`.
5. **Unlabeled Series - Dark Blue Line, Plus Markers:**
* **Trend:** Slow, steady decline.
* **Data Points (Approximate):**
* `(0, 0)`: EGA ≈ 0.23
* `(1, 0)`: EGA ≈ 0.21
* `(2, 0)`: EGA ≈ 0.18
* `(3, 0)`: EGA ≈ 0.18
* **Error Bars:** Not visible.
### Key Observations
1. **Performance Hierarchy:** The "Oracle" model (light blue) maintains near-perfect performance (~0.97 EGA) regardless of perturbation, serving as an upper-bound baseline.
2. **Impact of Removing Components:** Removing subgoals (pink) causes a significant initial performance drop. Further removing actions (green) lowers performance more. Removing items as well (orange) leads to the most severe decline, especially at higher perturbation levels.
3. **Anomaly at (0,0):** The orange series ("No-Item") starts at a higher EGA (~0.68) than both the pink (~0.61) and green (~0.48) series at the `(0,0)` perturbation point. This is counter-intuitive given its label suggests it has the most components removed.
4. **Error Bar Magnitude:** The orange series exhibits the largest error bars, indicating high variance or instability in its performance, particularly when perturbations are introduced (`(1,0)` onwards).
5. **Unidentified Baseline:** The dark blue line represents a consistently low-performing model or baseline whose identity is not provided in the legend.
### Interpretation
This chart demonstrates the **critical importance of subgoals, actions, and items** for robust performance in the evaluated task. The "Oracle" model's flat line shows that with full information, performance is unaffected by the tested perturbations.
The progressive decline of the other series illustrates a **cascading failure effect**: removing subgoals first hurts performance significantly. Removing actions on top of that degrades it further. The final removal of items leads to the worst performance and highest instability (large error bars), suggesting the system becomes highly sensitive and unreliable without this foundational component.
The anomaly at `(0,0)` for the "No-Item" model is puzzling. It may indicate that in the *unperturbed* state, the absence of item requirements somehow simplifies the task for that specific configuration, but this advantage completely vanishes—and reverses—once any perturbation is introduced. This highlights that the model's architecture is not robust.
In summary, the data argues for the necessity of a complete, hierarchical structure (items → actions → subgoals) to achieve both high performance and resilience to perturbations in the environment. The large error bars on the most stripped-down model (orange) further emphasize that removing core components doesn't just lower average performance; it makes outcomes unpredictable.
</details>
(a) Perturbed True Required Items
<details>
<summary>x21.png Details</summary>
### Visual Description
\n
## Line Chart: EGA vs. Perturbation Level
### Overview
This is a line chart plotting a metric called "EGA" against four discrete perturbation levels, represented as tuples. The chart compares the performance of five distinct methods or models (represented by different colored lines) as the perturbation increases. The overall trend shows that most methods degrade in performance with increased perturbation, except for one method that remains stable at a high level.
### Components/Axes
* **Chart Type:** Multi-series line chart with markers.
* **Y-Axis:**
* **Label:** "EGA"
* **Scale:** Linear, ranging from 0.0 to 1.0.
* **Major Ticks:** 0.0, 0.2, 0.4, 0.6, 0.8, 1.0.
* **X-Axis:**
* **Label:** "Perturbed (required items, action)"
* **Categories (from left to right):** `(0, 0)`, `(0, 1)`, `(0, 2)`, `(0, 3)`. These appear to represent increasing levels of a perturbation applied to a system, defined by two parameters.
* **Legend:**
* **Position:** Top-right corner of the plot area.
* **Series (from top to bottom in legend order):**
1. **Blue line with circle markers:** Label not visible in the provided crop. Represents a method with consistently high EGA.
2. **Orange line with 'X' (cross) markers:** Label not visible. Shows a sharp initial drop.
3. **Pink line with diamond markers:** Label not visible. Shows a steady decline.
4. **Green line with square markers:** Label not visible. Shows a steady decline.
5. **Gray line with plus ('+') markers:** Label not visible. Shows consistently low EGA.
### Detailed Analysis
**Data Series Trends and Approximate Values:**
1. **Blue Line (Circle Markers):**
* **Trend:** Nearly perfectly horizontal, indicating no sensitivity to the perturbation.
* **Values:** Consistently at approximately **EGA = 0.97** across all four x-axis points: `(0,0)`, `(0,1)`, `(0,2)`, `(0,3)`.
2. **Orange Line ('X' Markers):**
* **Trend:** Sharp, significant decline between the first two points, then plateaus at a low level.
* **Values:**
* At `(0,0)`: **EGA ≈ 0.68**
* At `(0,1)`: **EGA ≈ 0.15** (a drop of ~0.53)
* At `(0,2)`: **EGA ≈ 0.15**
* At `(0,3)`: **EGA ≈ 0.15**
3. **Pink Line (Diamond Markers):**
* **Trend:** Steady, approximately linear decline across all perturbation levels.
* **Values:**
* At `(0,0)`: **EGA ≈ 0.62**
* At `(0,1)`: **EGA ≈ 0.43**
* At `(0,2)`: **EGA ≈ 0.28**
* At `(0,3)`: **EGA ≈ 0.22**
4. **Green Line (Square Markers):**
* **Trend:** Steady, approximately linear decline, parallel to but slightly below the pink line.
* **Values:**
* At `(0,0)`: **EGA ≈ 0.48**
* At `(0,1)`: **EGA ≈ 0.38**
* At `(0,2)`: **EGA ≈ 0.26**
* At `(0,3)`: **EGA ≈ 0.21**
5. **Gray Line ('+' Markers):**
* **Trend:** Nearly horizontal, indicating stable but low performance.
* **Values:** Consistently at approximately **EGA = 0.23** across all four x-axis points.
### Key Observations
* **Performance Hierarchy:** At the baseline `(0,0)`, the methods rank from highest to lowest EGA: Blue > Orange > Pink > Green > Gray.
* **Sensitivity Divergence:** The methods exhibit dramatically different sensitivities to perturbation. The Blue method is completely robust, the Gray method is consistently poor, and the Orange method is extremely fragile, collapsing after the first perturbation step.
* **Convergence:** At the highest perturbation level `(0,3)`, the Pink, Green, and Gray methods converge to a similar low EGA range (~0.21-0.23), while the Orange method is slightly lower (~0.15).
* **Anomaly:** The Orange line's behavior is an outlier—it starts as the second-best performer but becomes the worst after the first perturbation.
### Interpretation
This chart likely evaluates the robustness of different AI models, algorithms, or system configurations against a specific type of adversarial or environmental perturbation. The "EGA" metric is probably a performance measure (e.g., accuracy, success rate).
* The **Blue method** demonstrates exceptional robustness, maintaining near-perfect performance regardless of the perturbation level applied. This suggests it has learned a fundamentally invariant representation or employs a highly effective defense mechanism.
* The **Orange method** appears to be a brittle, "overfitted" solution. It performs well on clean data `(0,0)` but fails catastrophically with even minimal perturbation `(0,1)`, indicating it relies on superficial features easily disrupted by the perturbation.
* The **Pink and Green methods** show a predictable, graceful degradation. Their parallel decline suggests they share a similar underlying vulnerability to the perturbation, with Green being slightly less effective overall.
* The **Gray method** serves as a low-performance baseline, possibly representing a naive or random approach that is unaffected by the perturbation because it never performs well.
The x-axis tuples `(required items, action)` hint that the perturbation involves manipulating the number of required items and the action in a task. The chart answers a critical question: "How does increasing task complexity or adversarial manipulation affect different solutions?" The data strongly argues for the superiority of the Blue method in non-stationary or adversarial environments.
</details>
(b) Perturbed True Actions
<details>
<summary>x22.png Details</summary>
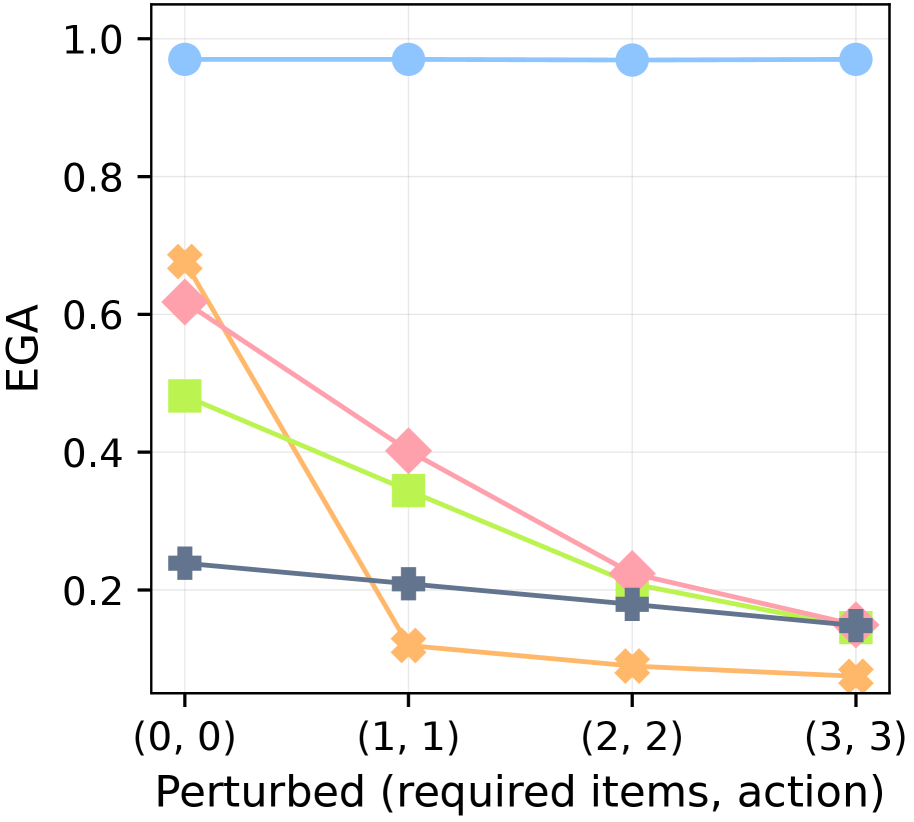
### Visual Description
## Line Chart: EGA vs. Perturbation Level
### Overview
This is a line chart plotting the metric "EGA" against increasing levels of perturbation, defined by the tuple "(required items, action)". The chart displays five distinct data series, each represented by a unique color and marker shape, showing how EGA changes as the perturbation parameters increase from (0,0) to (3,3).
### Components/Axes
* **Y-Axis:** Labeled "EGA". The scale is linear, ranging from 0.0 to 1.0, with major tick marks at 0.0, 0.2, 0.4, 0.6, 0.8, and 1.0.
* **X-Axis:** Labeled "Perturbed (required items, action)". It features four discrete, equally spaced categorical points: (0, 0), (1, 1), (2, 2), and (3, 3).
* **Data Series (Identified by Color and Marker):**
1. **Light Blue Line with Circle Markers:** Positioned at the top of the chart.
2. **Orange Line with 'X' (Cross) Markers:** Starts high, drops sharply.
3. **Pink Line with Diamond Markers:** Shows a steady decline.
4. **Light Green Line with Square Markers:** Shows a steady decline.
5. **Dark Gray/Blue Line with Plus (+) Markers:** Starts lowest, shows a gradual decline.
* **Legend:** No explicit legend is present within the chart area. Series are identified solely by their visual properties (color and marker).
### Detailed Analysis
**Data Point Extraction (Approximate Values):**
| Perturbation (x-axis) | Light Blue (Circle) | Orange (X) | Pink (Diamond) | Light Green (Square) | Dark Gray (+) |
| :--- | :--- | :--- | :--- | :--- | :--- |
| **(0, 0)** | ~0.98 | ~0.68 | ~0.62 | ~0.48 | ~0.24 |
| **(1, 1)** | ~0.98 | ~0.12 | ~0.40 | ~0.34 | ~0.21 |
| **(2, 2)** | ~0.98 | ~0.08 | ~0.22 | ~0.18 | ~0.18 |
| **(3, 3)** | ~0.98 | ~0.06 | ~0.15 | ~0.14 | ~0.15 |
**Trend Verification:**
* **Light Blue (Circle):** The line is nearly horizontal, indicating EGA remains stable and high (~0.98) regardless of perturbation level.
* **Orange (X):** The line exhibits a very steep negative slope between (0,0) and (1,1), followed by a continued but shallower decline. It shows the most dramatic sensitivity to initial perturbation.
* **Pink (Diamond):** The line has a consistent, moderately steep negative slope across all points, indicating a steady decrease in EGA with increased perturbation.
* **Light Green (Square):** The line has a consistent negative slope, similar to but slightly less steep than the pink line initially. It converges with the pink and gray lines at higher perturbation levels.
* **Dark Gray (+):** The line has a gentle negative slope, showing the most gradual decline. It starts as the lowest-performing series at (0,0) but converges with the pink and green series by (3,3).
### Key Observations
1. **Performance Hierarchy at Baseline (0,0):** There is a wide spread in initial EGA values, from ~0.98 (Blue) down to ~0.24 (Gray).
2. **Convergence at High Perturbation:** At the highest perturbation level (3,3), four of the five series (Orange, Pink, Green, Gray) converge within a narrow band between approximately 0.06 and 0.15. The Blue series remains an outlier, unaffected.
3. **Differential Sensitivity:** The series demonstrate vastly different sensitivities to perturbation. The Blue series is robust, the Orange series is highly sensitive to the first step of perturbation, and the Pink, Green, and Gray series show varying degrees of linear degradation.
4. **Crossover Point:** The Dark Gray (+) line, which starts lowest, crosses above the Orange (X) line between (0,0) and (1,1) as the Orange series plummets.
### Interpretation
The chart likely illustrates the robustness of different models, algorithms, or system configurations (represented by the colored lines) to increasing levels of a specific type of challenge or noise ("Perturbed (required items, action)").
* The **Light Blue series** represents a highly robust method or a control condition that maintains near-perfect performance (EGA ≈ 1.0) regardless of the perturbation applied.
* The **Orange series** represents a method that performs well under ideal conditions (0,0) but is extremely fragile, suffering a catastrophic performance drop with the slightest perturbation.
* The **Pink, Green, and Gray series** represent methods with varying baseline performance that degrade in a more predictable, linear fashion as the problem difficulty increases. Their convergence suggests that under sufficiently challenging conditions, their performance becomes similarly poor.
* The **x-axis tuple "(required items, action)"** suggests the perturbation involves simultaneously increasing the number of required items and the complexity or number of actions needed. The chart shows that most methods' performance (EGA) is inversely related to this combined difficulty metric.
**In summary, the data demonstrates a clear trade-off between baseline performance and robustness for most methods, with one notable exception (Blue) that achieves both. The visualization effectively argues for the superiority of the approach represented by the Blue line in scenarios where perturbation or difficulty is expected.**
</details>
(c) Perturbed Both Rules
Figure 6: Robustness against knowledge conflicts. EGA after 3,000 environment steps in MC-TextWorld under different perturbations of the ground-truth rules. The plots show performance with increasing intensities of perturbation applied to: (a) requirements only, (b) actions only, and (c) both (see Table ˜ 4).
Table 4: Effect of ground-truth perturbations on prior knowledge.
| Perturbation Intensity | Goal items obtainable via prior knowledge |
| --- | --- |
| 0 | 16 (no perturbation) |
| 1 | 14 (12 %) |
| 2 | 11 (31 %) |
| 3 | 9 (44 %) |
To isolate dependency learning from controller capacity, we shift to the MC-TextWorld environment with a perfect controller. In this setting, we test each agent’s robustness to conflicts with its prior knowledge (derived from the LLM’s initial predictions and human-written plans) by introducing arbitrary perturbations to the ground-truth required items and actions. These perturbations are applied with an intensity level; a higher intensity affects a greater number of items, as shown in Table ˜ 4. This intensity is denoted by a tuple (r,a) for required items and actions, respectively. (0,0) represents the vanilla setting with no perturbations. See Figure ˜ 21 for the detailed perturbation process.
Figure ˜ 6 shows XENON’s robustness to knowledge conflicts, as it maintains a near-perfect EGA ( $≈$ 0.97). In contrast, the performance of all baselines degrades as perturbation intensity increases across all three perturbation scenarios (required items, actions, or both). We find that prompting an LLM to self-correct is ineffective when the ground truth conflicts with its parametric knowledge: SC shows no significant advantage over DECKARD, which lacks a correction mechanism. ADAM is vulnerable to action perturbations; its strategy of gathering all resource items before attempting a new item fails when the valid actions for those resources are perturbed, effectively halting its learning.
### 5.5 Ablation studies on knowledge correction mechanisms
Table 5: Ablation study of knowledge correction mechanisms. ○: XENON; $\triangle$ : LLM self-correction; ✗: No correction. All entries denote the EGA after 3,000 environment steps. Columns denote the perturbation setting (r,a). For LLM self-correction, we use the same prompt as the SC baseline (see Appendix ˜ B).
| Dependency Correction | Action Correction | (0,0) | (3,0) | (0,3) | (3,3) |
| --- | --- | --- | --- | --- | --- |
| ○ | ○ | 0.97 | 0.97 | 0.97 | 0.97 |
| ○ | $\triangle$ | 0.93 | 0.93 | 0.12 | 0.12 |
| ○ | ✗ | 0.84 | 0.84 | 0.12 | 0.12 |
| $\triangle$ | ○ | 0.57 | 0.30 | 0.57 | 0.29 |
| ✗ | ○ | 0.53 | 0.13 | 0.53 | 0.13 |
| ✗ | ✗ | 0.46 | 0.13 | 0.19 | 0.11 |
As shown in Table ˜ 5, to analyze XENON’s knowledge correction mechanisms for dependencies and actions, we conduct ablation studies in MC-TextWorld. While dependency correction is generally more important for overall performance, action correction becomes vital under action perturbations. In contrast, LLM self-correction is ineffective for complex scenarios: it offers minimal gains for dependency correction even in the vanilla setting and fails entirely for perturbed actions. Its effectiveness is limited to simpler scenarios, such as action correction in the vanilla setting. These results demonstrate that our algorithmic knowledge correction approach enables robust learning from experience, overcoming the limitations of both LLM self-correction and flawed initial knowledge.
### 5.6 Ablation studies on hyperparameters
<details>
<summary>x23.png Details</summary>
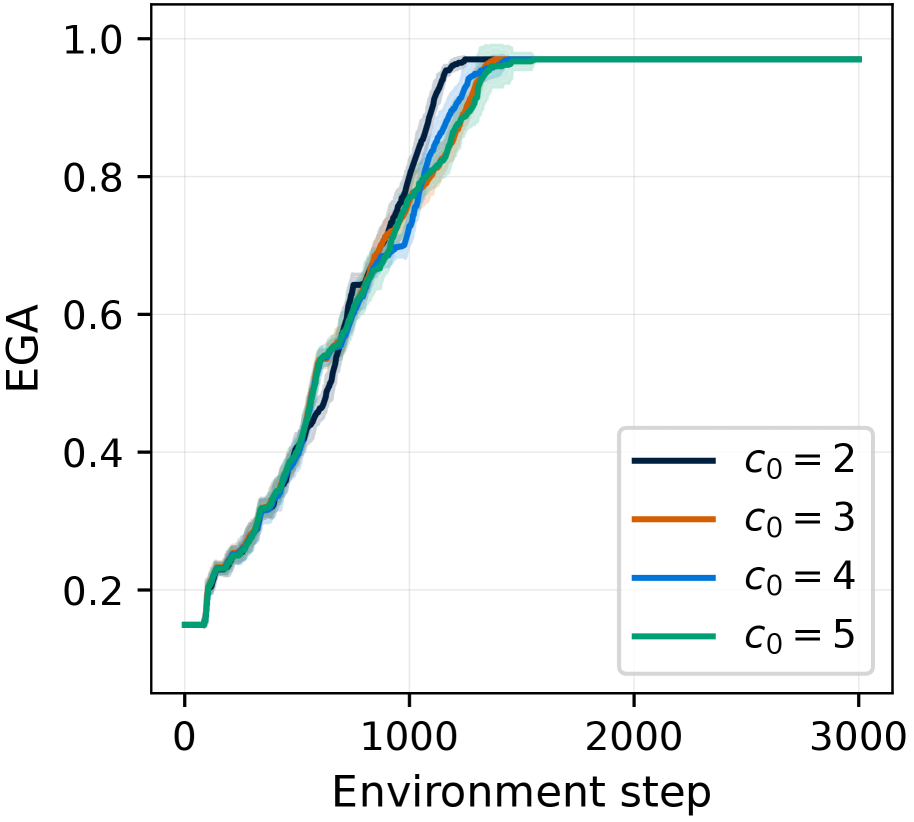
### Visual Description
## Line Chart: EGA vs. Environment Step for Different \( c_0 \) Values
### Overview
The image is a line chart plotting a metric called "EGA" against "Environment step" for four different experimental conditions, labeled by the parameter \( c_0 \). The chart shows the learning or performance progression of a system over time (steps), with each line representing a different initial condition or hyperparameter setting. All series exhibit a similar sigmoidal growth pattern, starting low, rising steeply, and then plateauing near the maximum value.
### Components/Axes
* **Y-Axis (Vertical):**
* **Label:** "EGA"
* **Scale:** Linear, ranging from 0.0 to 1.0.
* **Major Tick Marks:** 0.0, 0.2, 0.4, 0.6, 0.8, 1.0.
* **X-Axis (Horizontal):**
* **Label:** "Environment step"
* **Scale:** Linear, ranging from 0 to 3000.
* **Major Tick Marks:** 0, 1000, 2000, 3000.
* **Legend:**
* **Position:** Bottom-right corner of the plot area.
* **Content:** Four entries, each associating a colored line with a value of \( c_0 \).
* Dark Blue Line: \( c_0 = 2 \)
* Orange Line: \( c_0 = 3 \)
* Blue Line: \( c_0 = 4 \)
* Green Line: \( c_0 = 5 \)
* **Data Series:** Four solid lines, each surrounded by a semi-transparent shaded band of the same color, likely representing standard deviation or confidence intervals across multiple runs.
### Detailed Analysis
**Trend Verification & Data Points:**
All four data series follow an identical visual trend: a steep, roughly linear increase from a low starting point, followed by a sharp knee and a flat plateau.
1. **Starting Point (Step 0):** All lines begin at an EGA value of approximately **0.15**.
2. **Growth Phase (Steps ~0 to ~1500):** The EGA increases rapidly and nearly identically for all \( c_0 \) values. The lines are tightly clustered, with their shaded bands overlapping significantly. The growth appears roughly linear between steps 200 and 1200.
3. **Knee/Transition (Steps ~1200 to ~1600):** The rate of increase slows as the curves approach the maximum value. The dark blue line (\( c_0 = 2 \)) appears to reach the plateau marginally earlier (around step 1400) than the others.
4. **Plateau Phase (Steps ~1600 to 3000):** All four lines converge and stabilize at an EGA value very close to **1.0** (approximately 0.97-0.99). From step 1600 onward to step 3000, the lines are essentially flat and indistinguishable from one another.
**Component Isolation:**
* **Header/Title:** No explicit chart title is present above the plot area.
* **Main Chart:** Contains the four plotted lines with their confidence bands against a white background with light gray grid lines.
* **Footer/Labels:** The axis labels ("EGA", "Environment step") and tick marks are clearly rendered in a sans-serif font. The legend is contained within a white box with a light gray border.
### Key Observations
1. **Convergence:** The most striking observation is the final convergence of all experimental conditions. Despite different \( c_0 \) values, the system achieves the same near-maximal EGA performance.
2. **Minimal Variance:** The shaded confidence bands are relatively narrow, suggesting consistent performance across different runs for a given \( c_0 \).
3. **Early Saturation:** The system reaches over 95% of its final performance by approximately step 1500, indicating rapid learning or adaptation.
4. **Negligible Parameter Impact:** Within the visual precision of the chart, the parameter \( c_0 \) (ranging from 2 to 5) has no discernible long-term effect on the final EGA value and only a very minor effect on the speed of convergence in the transition phase.
### Interpretation
This chart demonstrates the learning curve of an agent or system in an environment, where "EGA" is likely a performance metric (e.g., "Expected Goal Achievement," "Episodic Goal Accuracy," or similar). The "Environment step" represents time or experience.
The data suggests that the system is robust to variations in the initial parameter \( c_0 \) within the tested range. Regardless of this starting condition, the system reliably learns to perform the task, achieving near-perfect performance (EGA ≈ 1.0) within about 1500-1600 interactions with the environment. The sigmoidal shape is characteristic of learning processes: initial slow progress (not fully visible here as it starts at 0.15), followed by a period of rapid gain, and finally diminishing returns as mastery is achieved.
The primary takeaway is not about the difference between \( c_0 \) values, but their similarity. This implies that for this specific task and metric, the system's final performance is not sensitive to this hyperparameter, which could simplify future tuning or indicate a fundamental property of the learning algorithm or environment. The slight lead of the \( c_0 = 2 \) curve might hint at a very minor advantage for lower values in the learning speed, but this effect is small and would require more precise data to confirm.
</details>
(a) $c_0$
<details>
<summary>x24.png Details</summary>
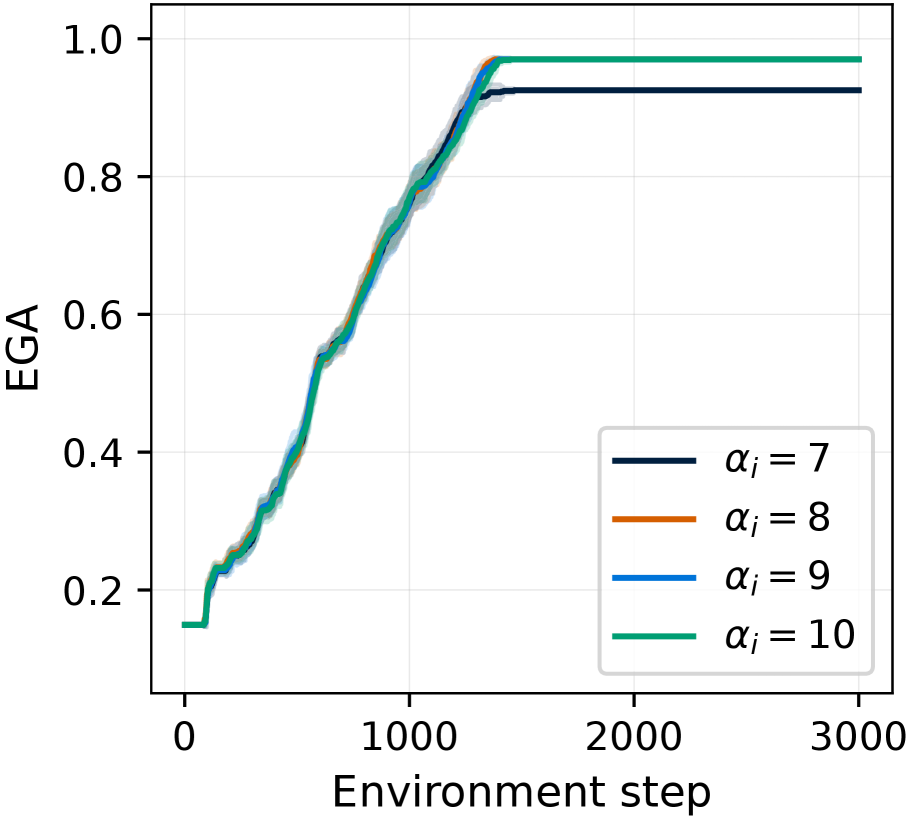
### Visual Description
## Line Chart: EGA vs. Environment Step for Different α_i Values
### Overview
The image displays a line chart plotting the metric "EGA" against "Environment step" for four different values of a parameter labeled α_i. The chart shows a learning or performance curve where EGA increases rapidly with environment steps before plateauing. All four lines follow a very similar trajectory, with minor differences in their final plateau values.
### Components/Axes
* **X-Axis (Horizontal):**
* **Label:** "Environment step"
* **Scale:** Linear scale from 0 to 3000.
* **Major Tick Marks:** 0, 1000, 2000, 3000.
* **Y-Axis (Vertical):**
* **Label:** "EGA"
* **Scale:** Linear scale from 0.2 to 1.0.
* **Major Tick Marks:** 0.2, 0.4, 0.6, 0.8, 1.0.
* **Legend:**
* **Position:** Bottom-right corner of the plot area.
* **Content:** Four entries, each associating a line color with a value of α_i.
* Dark Blue Line: α_i = 7
* Orange Line: α_i = 8
* Blue Line: α_i = 9
* Green Line: α_i = 10
* **Data Series:** Four colored lines, each with a shaded band of the same color surrounding it, likely representing variance or confidence intervals.
### Detailed Analysis
**Trend Verification:** All four data series exhibit the same fundamental trend: a steep, roughly linear increase from the start (step 0) until approximately step 1500, followed by a sharp transition to a flat plateau for the remainder of the steps (up to 3000).
**Data Point Extraction (Approximate):**
* **Starting Point (Step 0):** All lines begin at an EGA value of approximately **0.15**.
* **Growth Phase (Steps 0-1500):** The lines are tightly clustered, making individual values difficult to distinguish. They cross key EGA thresholds at approximate environment steps:
* EGA = 0.4: ~Step 500
* EGA = 0.6: ~Step 800
* EGA = 0.8: ~Step 1100
* **Plateau Phase (Steps 1500-3000):** The lines diverge slightly at their final, stable values.
* **α_i = 7 (Dark Blue):** Plateaus at the lowest value, approximately **EGA = 0.92**.
* **α_i = 8 (Orange), α_i = 9 (Blue), α_i = 10 (Green):** These three lines plateau at a very similar, higher value, approximately **EGA = 0.97**. The green line (α_i=10) may be infinitesimally higher than the orange and blue lines, but the difference is within the visual uncertainty of the plot.
### Key Observations
1. **High Similarity in Learning Dynamics:** The primary observation is the remarkable similarity in the learning trajectory for all four α_i values during the growth phase (0-1500 steps). The lines overlap significantly, suggesting the parameter α_i has minimal impact on the *rate* of EGA improvement during this phase.
2. **Parameter Impact on Final Performance:** The main differentiating effect of α_i appears in the final plateau value. The lowest tested value (α_i=7) results in a slightly lower asymptotic performance compared to the higher values (8, 9, 10), which cluster together.
3. **Clear Phase Transition:** There is a distinct "knee" in the curve around step 1500, marking a rapid shift from active learning/improvement to a stable, converged state.
4. **Low Variance:** The shaded error bands around each line are relatively narrow, indicating consistent performance across multiple runs or low variance in the measurement of EGA for each condition.
### Interpretation
This chart likely illustrates the performance of a learning agent (e.g., in reinforcement learning) where "EGA" is a success metric (e.g., Expected Goal Achievement, Episode Gain Average) and "Environment step" represents training time or interaction count. The parameter α_i could be a hyperparameter like a learning rate, exploration factor, or network capacity.
The data suggests that within the tested range (7-10), α_i is not a critical factor for the *speed* of learning, as all agents learn at nearly the same rate. However, it does influence the *final quality* of the learned policy or solution. A value of α_i=7 leads to a sub-optimal plateau, while values of 8 and above allow the agent to reach a higher, near-maximal performance ceiling (close to 1.0). The clustering of α_i=8,9,10 indicates a saturation point; increasing α_i beyond 8 yields diminishing returns for final performance. The sharp transition to a plateau suggests the task has a clear maximum achievable score, which the agents with α_i ≥ 8 successfully reach and maintain.
</details>
(b) $α_i$
<details>
<summary>x25.png Details</summary>
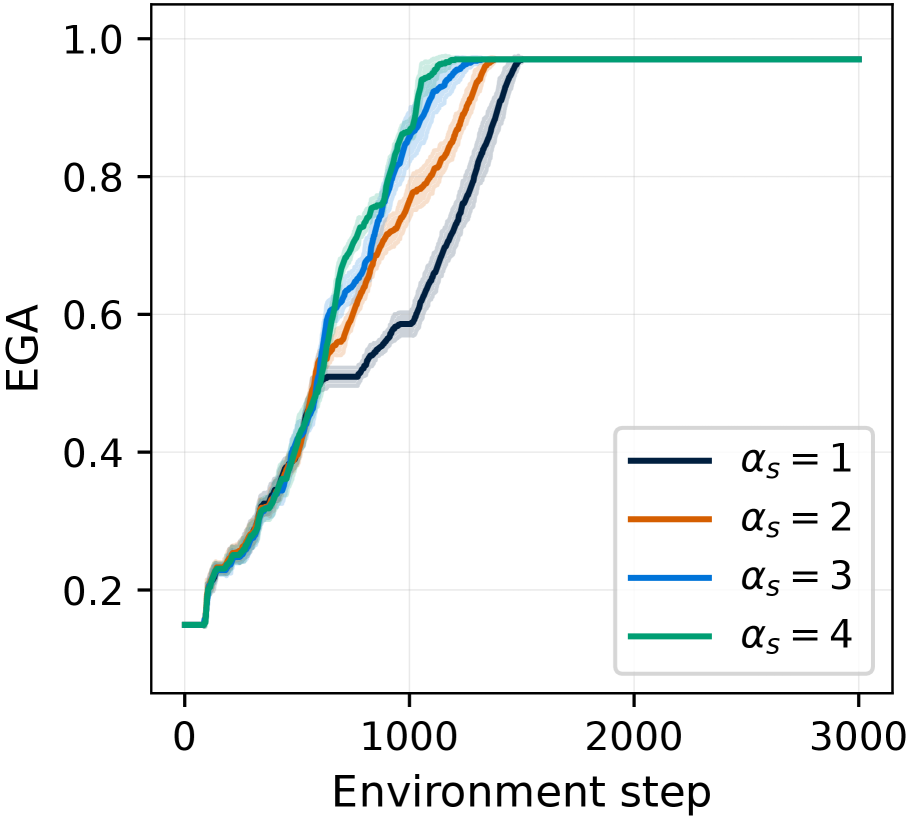
### Visual Description
## Line Chart: EGA vs. Environment Step for Different αₛ Values
### Overview
The image is a line chart plotting the performance metric "EGA" against "Environment step" for four different experimental conditions, labeled by the parameter αₛ. The chart shows learning curves where performance improves with more environment steps, eventually plateauing near a maximum value.
### Components/Axes
* **X-Axis (Horizontal):**
* **Label:** "Environment step"
* **Scale:** Linear, ranging from 0 to 3000.
* **Major Tick Marks:** 0, 1000, 2000, 3000.
* **Y-Axis (Vertical):**
* **Label:** "EGA"
* **Scale:** Linear, ranging from 0.0 to 1.0.
* **Major Tick Marks:** 0.0, 0.2, 0.4, 0.6, 0.8, 1.0.
* **Legend:**
* **Position:** Bottom-right corner of the plot area.
* **Content:** Four entries, each associating a colored line with a value of αₛ.
* Dark Blue Line: αₛ = 1
* Orange Line: αₛ = 2
* Blue Line: αₛ = 3
* Green Line: αₛ = 4
* **Data Series:** Four lines, each with a shaded region (likely representing confidence intervals or standard deviation) around the central trend line.
### Detailed Analysis
**Trend Verification & Data Points:**
All four lines follow a similar sigmoidal (S-shaped) learning curve: a slow start, a period of rapid increase, and a final plateau. The primary difference is the speed of learning.
1. **αₛ = 4 (Green Line):**
* **Trend:** This line shows the fastest initial learning. It rises most steeply from the start.
* **Key Points:** Begins at EGA ≈ 0.15 at step 0. Crosses EGA = 0.6 at approximately step 600. Reaches a near-plateau (EGA ≈ 0.95) by step ~1200. It is the first to converge.
2. **αₛ = 3 (Blue Line):**
* **Trend:** The second-fastest learning curve. It closely follows the green line initially but begins to lag slightly after step ~500.
* **Key Points:** Similar starting point (≈0.15). Crosses EGA = 0.6 at approximately step 700. Reaches the plateau (EGA ≈ 0.95) by step ~1400.
3. **αₛ = 2 (Orange Line):**
* **Trend:** Shows a moderate learning speed, clearly slower than αₛ=3 and 4.
* **Key Points:** Starts at ≈0.15. Crosses EGA = 0.6 at approximately step 800. Reaches the plateau (EGA ≈ 0.95) by step ~1600.
4. **αₛ = 1 (Dark Blue Line):**
* **Trend:** This is the slowest learning curve. It has the most gradual slope during the rapid learning phase.
* **Key Points:** Starts at ≈0.15. Crosses EGA = 0.6 at approximately step 1000. Reaches the plateau (EGA ≈ 0.95) by step ~1800.
**Convergence:** All four lines converge to the same final performance level, a plateau at an EGA value of approximately 0.95 to 0.97, by step 2000. From step 2000 to 3000, all lines are flat and overlapping at this maximum value.
### Key Observations
1. **Clear Performance Ordering:** There is a strict, monotonic relationship between the αₛ parameter and learning speed. Higher αₛ values (4 > 3 > 2 > 1) result in faster convergence to the maximum EGA.
2. **Identical Starting and Ending Points:** All conditions begin at the same low performance (EGA ≈ 0.15) and end at the same high performance (EGA ≈ 0.96). The parameter αₛ affects the *rate* of learning, not the initial state or final asymptotic performance.
3. **Convergence Point:** The lines begin to merge and become indistinguishable from each other starting around step 1500-1800, with full convergence by step 2000.
4. **Shaded Regions:** The shaded confidence bands are narrowest at the start and end of training and widest during the period of most rapid learning (between steps 500 and 1500), indicating higher variance in performance across runs during this phase.
### Interpretation
This chart demonstrates the effect of the hyperparameter αₛ on the sample efficiency of a learning algorithm (likely in reinforcement learning, given the "Environment step" axis). The data suggests that **increasing αₛ accelerates the learning process** without affecting the final achievable performance.
* **What it means:** A higher αₛ value allows the agent or model to extract more useful signal from each environment interaction, leading to faster skill acquisition. This could be due to αₛ controlling a learning rate, a target update frequency, or a similar mechanism that governs how aggressively the model updates its knowledge.
* **Why it matters:** In practical applications, sample efficiency is critical. Reducing the number of environment steps needed to reach peak performance (e.g., from 1800 steps with αₛ=1 to 1200 steps with αₛ=4) translates to significantly lower computational cost and faster development cycles.
* **Underlying Pattern:** The sigmoidal shape is characteristic of learning curves, where initial exploration is slow, followed by a phase of rapid insight and improvement, and finally a refinement phase as performance approaches its limit. The parameter αₛ effectively stretches or compresses this curve along the time (step) axis. The fact that all curves reach the same plateau indicates the task has a fixed maximum difficulty or performance ceiling that is achievable by all configurations, given enough time.
</details>
(c) $α_s$
<details>
<summary>x26.png Details</summary>
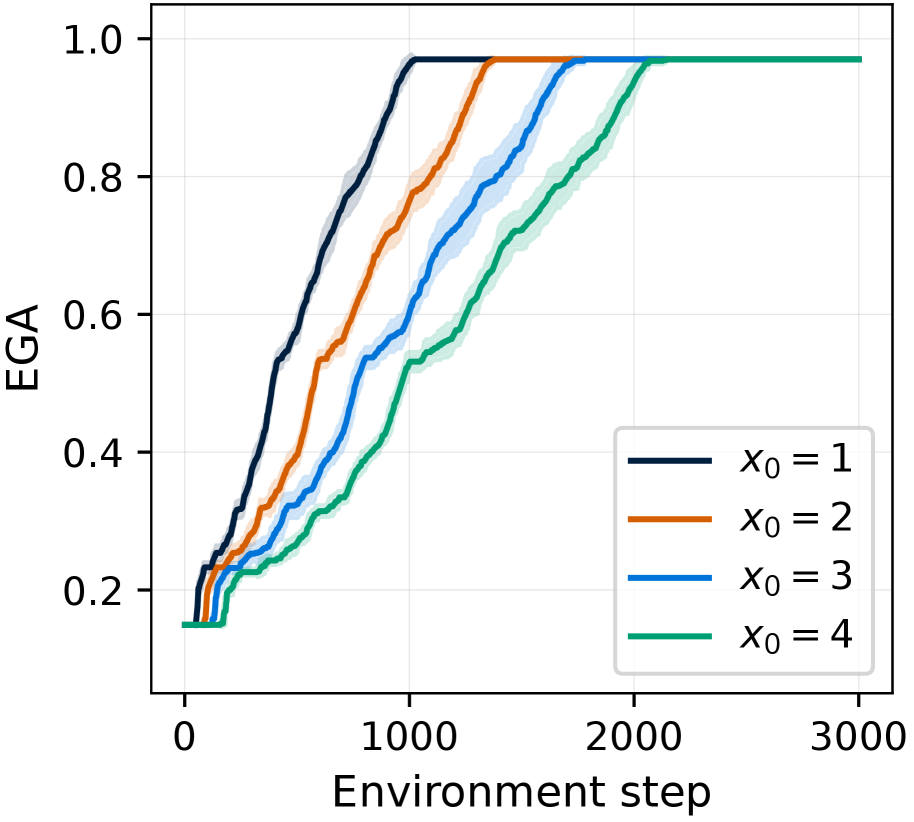
### Visual Description
## Line Chart: EGA vs. Environment Step for Different Initial Conditions
### Overview
The image is a line chart displaying the performance metric "EGA" over the course of "Environment step" for four different initial conditions, denoted as \(x_0\). Each condition is represented by a distinct colored line with a shaded region around it, likely indicating variance or confidence intervals. All lines show an upward trend that eventually plateaus at the maximum value of 1.0, but at different rates.
### Components/Axes
* **Chart Type:** Line chart with shaded error bands.
* **X-Axis:**
* **Label:** "Environment step"
* **Scale:** Linear, ranging from 0 to 3000.
* **Major Tick Marks:** 0, 1000, 2000, 3000.
* **Y-Axis:**
* **Label:** "EGA"
* **Scale:** Linear, ranging from 0.0 to 1.0.
* **Major Tick Marks:** 0.0, 0.2, 0.4, 0.6, 0.8, 1.0.
* **Legend:**
* **Position:** Bottom-right corner of the plot area.
* **Content:** Four entries, each associating a color with an initial condition.
* Dark Blue Line: \(x_0 = 1\)
* Orange Line: \(x_0 = 2\)
* Light Blue Line: \(x_0 = 3\)
* Green Line: \(x_0 = 4\)
* **Grid:** A light gray grid is present in the background.
### Detailed Analysis
**Trend Verification & Data Points:**
All four data series begin at approximately the same starting point on the y-axis (EGA ≈ 0.15) at Environment step 0. They all follow a sigmoidal (S-shaped) growth curve, rising steeply before leveling off at EGA = 1.0. The primary difference is the speed of convergence.
1. **\(x_0 = 1\) (Dark Blue Line):**
* **Trend:** Steepest initial ascent. Reaches the plateau (EGA ≈ 1.0) first.
* **Approximate Key Points:** Starts at ~0.15. Crosses EGA=0.5 at ~step 400. Crosses EGA=0.8 at ~step 800. Reaches and stabilizes at 1.0 by approximately step 1000.
2. **\(x_0 = 2\) (Orange Line):**
* **Trend:** Second steepest ascent. Follows a similar shape to the dark blue line but is shifted to the right (slower).
* **Approximate Key Points:** Starts at ~0.15. Crosses EGA=0.5 at ~step 600. Crosses EGA=0.8 at ~step 1100. Reaches and stabilizes at 1.0 by approximately step 1400.
3. **\(x_0 = 3\) (Light Blue Line):**
* **Trend:** Third steepest ascent. Noticeably slower than the first two.
* **Approximate Key Points:** Starts at ~0.15. Crosses EGA=0.5 at ~step 800. Crosses EGA=0.8 at ~step 1500. Reaches and stabilizes at 1.0 by approximately step 1800.
4. **\(x_0 = 4\) (Green Line):**
* **Trend:** Slowest ascent of the four series.
* **Approximate Key Points:** Starts at ~0.15. Crosses EGA=0.5 at ~step 1000. Crosses EGA=0.8 at ~step 1800. Reaches and stabilizes at 1.0 by approximately step 2200.
**Shaded Regions:** Each line is surrounded by a semi-transparent shaded band of the same color. The width of these bands appears relatively consistent across all lines and throughout their ascent, suggesting a stable level of variance or uncertainty in the EGA measurement at each step.
### Key Observations
1. **Clear Inverse Relationship:** There is a direct, inverse relationship between the initial condition value \(x_0\) and the rate of learning/performance improvement. A lower \(x_0\) leads to faster convergence to the maximum EGA.
2. **Identical Starting and Ending Points:** All conditions start at the same low performance level and ultimately achieve the same perfect performance (EGA=1.0). The variable is solely the *speed* of achievement.
3. **Consistent Variance:** The shaded error bands do not dramatically widen or narrow, indicating that the variability in performance between different runs (or within the measurement) for a given \(x_0\) is fairly constant over time.
4. **No Performance Degradation:** Once a line reaches the plateau at EGA=1.0, it remains stable for the remainder of the observed steps (up to 3000), showing no signs of decline or instability.
### Interpretation
This chart likely visualizes results from a reinforcement learning or optimization experiment. "EGA" is probably a performance metric (e.g., "Expected Goal Achievement," "Episodic Goal Accuracy") where 1.0 represents optimal or successful task completion. "Environment step" represents the number of interactions or training iterations.
The data demonstrates that the **initial state or condition (\(x_0\)) of the agent or system is a critical factor determining learning efficiency**. The system with the most favorable initial condition (\(x_0=1\)) masters the task in roughly half the time (steps) required by the system with the least favorable condition (\(x_0=4\)). This suggests that the problem landscape may have a gradient that is easier to navigate from certain starting points, or that \(x_0\) represents a parameter like initial knowledge, resource level, or proximity to a goal.
The consistent variance (shaded bands) implies that the learning process is stochastic but reliable; while individual runs may vary, the overall trajectory for a given \(x_0\) is predictable. The eventual convergence of all lines to 1.0 indicates that the task is solvable from all tested initial conditions, given sufficient experience. The key practical insight is that investing resources to place a system in a better initial state (\(x_0=1\)) can dramatically reduce the training time or sample complexity required to achieve peak performance.
</details>
(d) $x_0$
Figure 7: Hyperparameter ablation study in MC-TextWorld. EGA over 3,000 environment steps under different hyperparameters. The plots show EGA when varying: (a) $c_0$ (revision count threshold for inadmissible items), (b) $α_i$ (required items quantities for inadmissible items), (c) $α_s$ (required items quantities for less-tried items), and (d) $x_0$ (invalid action threshold). Each study varies one hyperparameter while keeping the others fixed to their default values ( $c_0=3$ , $α_i=8$ , $α_s=2$ , $x_0=2$ ).
<details>
<summary>x27.png Details</summary>
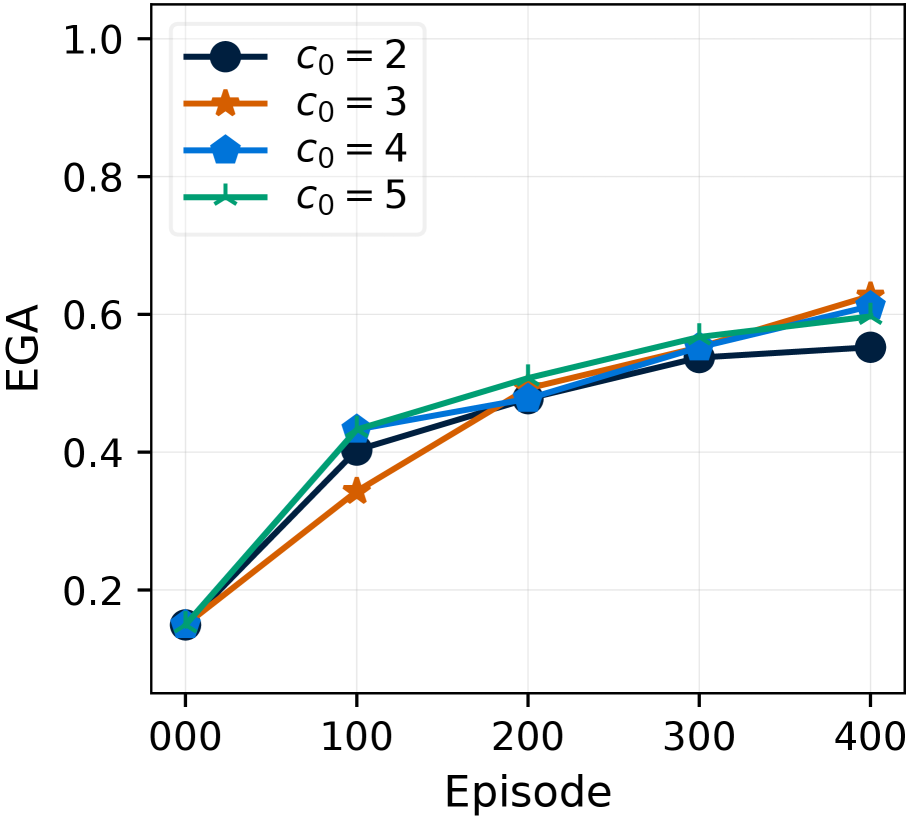
### Visual Description
\n
## Line Chart: EGA vs. Episode for Different c₀ Values
### Overview
The image is a line chart plotting the metric "EGA" against "Episode" for four different experimental conditions, labeled by the parameter `c₀`. The chart shows the progression of EGA over 400 episodes for each condition. All series begin at a similar low point and show an upward trend, converging towards a similar final value.
### Components/Axes
* **Chart Type:** Multi-series line chart with markers.
* **X-Axis:**
* **Label:** "Episode"
* **Scale:** Linear, from 0 to 400.
* **Tick Marks:** 000, 100, 200, 300, 400.
* **Y-Axis:**
* **Label:** "EGA"
* **Scale:** Linear, from 0.0 to 1.0.
* **Tick Marks:** 0.0, 0.2, 0.4, 0.6, 0.8, 1.0.
* **Legend:** Positioned in the top-left corner of the plot area. It defines four data series:
1. `c₀ = 2`: Dark blue line with circle markers.
2. `c₀ = 3`: Orange line with star markers.
3. `c₀ = 4`: Medium blue line with pentagon markers.
4. `c₀ = 5`: Green line with 'x' (cross) markers.
### Detailed Analysis
**Data Series Trends and Approximate Values:**
1. **c₀ = 2 (Dark Blue, Circles):**
* **Trend:** Slopes upward steadily, with the rate of increase slowing after Episode 200. It ends as the lowest of the four series.
* **Approximate Data Points:**
* Episode 0: EGA ≈ 0.15
* Episode 100: EGA ≈ 0.40
* Episode 200: EGA ≈ 0.48
* Episode 300: EGA ≈ 0.54
* Episode 400: EGA ≈ 0.55
2. **c₀ = 3 (Orange, Stars):**
* **Trend:** Shows the steepest initial increase between Episodes 0 and 100. It then continues to rise, ending as the highest series at Episode 400.
* **Approximate Data Points:**
* Episode 0: EGA ≈ 0.15
* Episode 100: EGA ≈ 0.34
* Episode 200: EGA ≈ 0.49
* Episode 300: EGA ≈ 0.56
* Episode 400: EGA ≈ 0.63
3. **c₀ = 4 (Medium Blue, Pentagons):**
* **Trend:** Rises sharply to become the highest value at Episode 100, then continues a steady, slightly decelerating climb.
* **Approximate Data Points:**
* Episode 0: EGA ≈ 0.15
* Episode 100: EGA ≈ 0.43
* Episode 200: EGA ≈ 0.49
* Episode 300: EGA ≈ 0.56
* Episode 400: EGA ≈ 0.61
4. **c₀ = 5 (Green, Crosses):**
* **Trend:** Follows a path very similar to `c₀ = 4`, remaining just slightly above it for most of the chart after Episode 100.
* **Approximate Data Points:**
* Episode 0: EGA ≈ 0.15
* Episode 100: EGA ≈ 0.42
* Episode 200: EGA ≈ 0.50
* Episode 300: EGA ≈ 0.57
* Episode 400: EGA ≈ 0.60
### Key Observations
* **Convergence at Start:** All four conditions start at nearly the identical EGA value (~0.15) at Episode 0.
* **Divergence and Re-convergence:** The series diverge significantly by Episode 100, with `c₀=4` leading and `c₀=3` lagging. By Episode 400, all series have re-converged within a narrow band between approximately 0.55 and 0.63.
* **Performance Hierarchy:** At the final episode (400), the approximate performance order from highest to lowest EGA is: `c₀=3` > `c₀=4` ≈ `c₀=5` > `c₀=2`.
* **Diminishing Returns:** All curves show a decreasing slope as episodes increase, indicating that gains in EGA slow down over time.
### Interpretation
This chart likely visualizes the learning or performance curve of an algorithm or system (where "EGA" is a performance metric) over repeated trials or training steps ("Episode"). The parameter `c₀` appears to be a hyperparameter or initial condition influencing the learning dynamics.
The data suggests that while different `c₀` values affect the *rate* of early learning (with `c₀=4` and `c₀=5` providing the fastest initial gains), they have a less dramatic effect on the *final achievable performance* after 400 episodes, as all conditions end within a ~0.08 EGA range. The condition `c₀=3` is notable for a slower start but the highest final value, potentially indicating a trade-off between early efficiency and ultimate performance. The consistent upward trend for all series confirms that the system is learning or improving with experience across all tested conditions. The narrowing gap between lines suggests the system's performance may be approaching an asymptotic limit inherent to the task or model architecture, regardless of the `c₀` initialization.
</details>
(e) $c_0$
<details>
<summary>x28.png Details</summary>
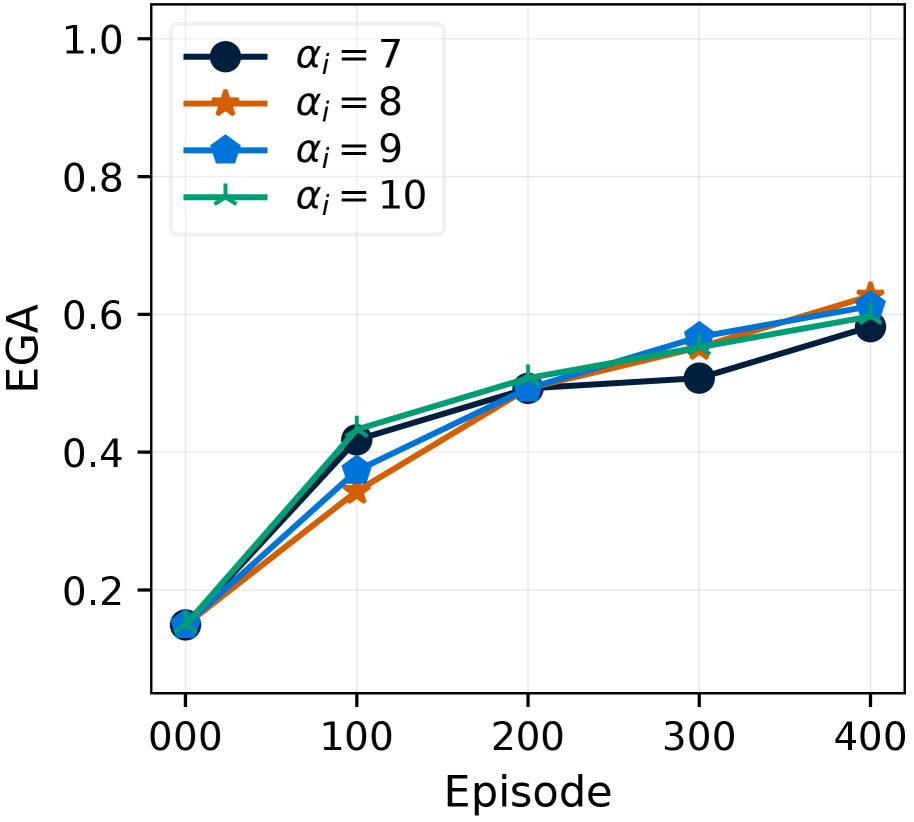
### Visual Description
## Line Chart: EGA vs. Episode for Different α_i Values
### Overview
The image displays a line chart plotting the metric "EGA" against "Episode" for four different series, each corresponding to a distinct value of a parameter labeled α_i. The chart shows the progression of EGA over 400 episodes, with all series starting at the same point and exhibiting an upward trend, though with different trajectories and final values.
### Components/Axes
* **Chart Type:** Multi-series line chart with markers.
* **X-Axis:**
* **Label:** "Episode"
* **Scale:** Linear, ranging from 0 to 400.
* **Major Tick Marks:** 000, 100, 200, 300, 400.
* **Y-Axis:**
* **Label:** "EGA"
* **Scale:** Linear, ranging from 0.0 to 1.0.
* **Major Tick Marks:** 0.0, 0.2, 0.4, 0.6, 0.8, 1.0.
* **Legend:** Positioned in the top-left quadrant of the plot area. It contains four entries:
1. **Dark Blue Line with Circle Marker:** Labeled "α_i = 7"
2. **Orange Line with Star Marker:** Labeled "α_i = 8"
3. **Blue Line with Pentagon Marker:** Labeled "α_i = 9"
4. **Green Line with Cross ('x') Marker:** Labeled "α_i = 10"
### Detailed Analysis
**Data Series and Approximate Values:**
All four series begin at Episode 0 with an EGA value of approximately 0.15.
1. **α_i = 7 (Dark Blue, Circles):**
* **Trend:** Shows the most gradual and steady increase among the series after the initial jump.
* **Data Points (Episode, EGA):** (0, ~0.15), (100, ~0.42), (200, ~0.49), (300, ~0.51), (400, ~0.58).
2. **α_i = 8 (Orange, Stars):**
* **Trend:** Has the lowest value at Episode 100 but exhibits the strongest growth in the later episodes (300-400), ending with the highest final EGA.
* **Data Points (Episode, EGA):** (0, ~0.15), (100, ~0.34), (200, ~0.49), (300, ~0.55), (400, ~0.63).
3. **α_i = 9 (Blue, Pentagons):**
* **Trend:** Follows a path very similar to α_i=10, closely tracking it until Episode 300 where it is slightly higher, before converging near the same final value.
* **Data Points (Episode, EGA):** (0, ~0.15), (100, ~0.38), (200, ~0.50), (300, ~0.57), (400, ~0.61).
4. **α_i = 10 (Green, Crosses):**
* **Trend:** Shows the highest value at Episode 100, indicating the fastest initial improvement. Its growth rate then moderates.
* **Data Points (Episode, EGA):** (0, ~0.15), (100, ~0.44), (200, ~0.51), (300, ~0.56), (400, ~0.60).
**Cross-Reference Check:** The legend colors and markers were verified against the lines on the chart. The dark blue circle line corresponds to α_i=7, the orange star line to α_i=8, the blue pentagon line to α_i=9, and the green cross line to α_i=10.
### Key Observations
1. **Common Origin:** All series start at the identical point (Episode 0, EGA ≈ 0.15).
2. **Universal Growth:** Every series shows a positive correlation between Episode and EGA; the metric improves over time for all tested α_i values.
3. **Initial Divergence (Episode 0-100):** The series diverge significantly in the first 100 episodes. α_i=10 shows the fastest initial gain, while α_i=8 shows the slowest.
4. **Mid-Chart Convergence (Episode 200):** All four lines converge closely around Episode 200, with EGA values clustered near 0.5.
5. **Final Ranking (Episode 400):** The final EGA values at Episode 400, from highest to lowest, are: α_i=8 (~0.63) > α_i=9 (~0.61) > α_i=10 (~0.60) > α_i=7 (~0.58). The spread is relatively narrow (≈0.05).
6. **Diminishing Returns:** The rate of increase (slope) for all lines is steepest between Episodes 0-100 and generally flattens in subsequent intervals, suggesting diminishing returns as episodes increase.
### Interpretation
This chart likely visualizes the performance (measured by EGA) of a learning system or algorithm over training episodes, where α_i is a key hyperparameter. The data suggests:
* **Hyperparameter Sensitivity:** The choice of α_i affects the learning trajectory. A higher α_i (e.g., 10) may accelerate early learning, while a moderate value (e.g., 8) might lead to better long-term performance, albeit with a slower start.
* **Convergence Behavior:** The system's performance tends to converge across different hyperparameter settings over time (around Episode 200), but the final asymptotic performance can still differ.
* **Optimal Setting:** Based solely on the final data point at Episode 400, α_i=8 yields the highest EGA. However, the optimal choice could depend on the operational context: if early performance is critical, α_i=10 is preferable; if final performance is the sole metric, α_i=8 is best.
* **Underlying Process:** The consistent upward trend and eventual flattening are characteristic of learning curves, indicating the system is successfully improving but approaching a performance plateau. The narrow final spread suggests the system is relatively robust to variations in α_i within the tested range (7-10).
</details>
(f) $α_i$
<details>
<summary>x29.png Details</summary>
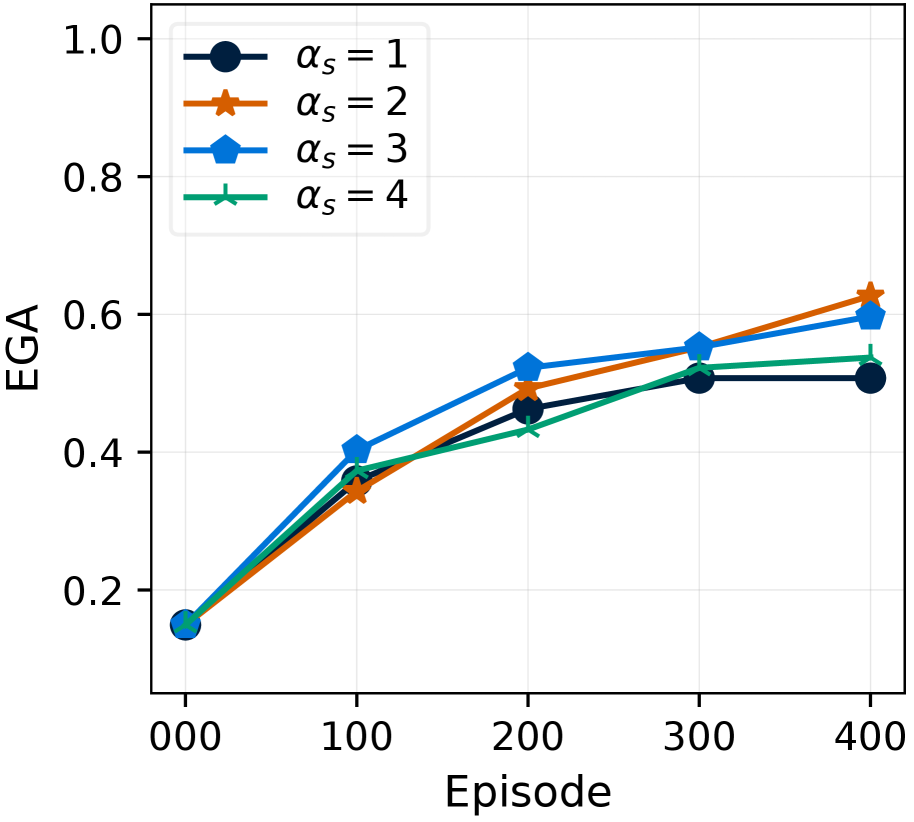
### Visual Description
## Line Chart: EGA vs. Episode for Different αₛ Values
### Overview
The image is a line chart plotting the metric "EGA" against "Episode" for four different experimental conditions, labeled by the parameter αₛ (alpha subscript s). All four conditions show an increasing trend in EGA as the number of episodes increases, with the lines converging and then slightly diverging in the later episodes.
### Components/Axes
* **X-Axis (Horizontal):**
* **Label:** "Episode"
* **Scale:** Linear, with major tick marks and labels at 000, 100, 200, 300, and 400.
* **Y-Axis (Vertical):**
* **Label:** "EGA"
* **Scale:** Linear, ranging from 0.0 to 1.0, with major tick marks at intervals of 0.2 (0.0, 0.2, 0.4, 0.6, 0.8, 1.0).
* **Legend:**
* **Position:** Top-left corner of the chart area.
* **Content:** Four entries, each associating a line color and marker style with a value of αₛ.
1. **Dark Blue Line with Circle Marker:** αₛ = 1
2. **Orange Line with Star Marker:** αₛ = 2
3. **Light Blue Line with Diamond Marker:** αₛ = 3
4. **Green Line with 'X' Marker:** αₛ = 4
### Detailed Analysis
The chart displays four data series. For each series, the visual trend is a generally upward slope, indicating EGA increases with more training episodes. The lines start at the same point and follow a similar trajectory before separating.
**Data Series & Approximate Values:**
1. **αₛ = 1 (Dark Blue, Circle):**
* **Trend:** Increases steadily, then plateaus after Episode 300.
* **Data Points (Episode, EGA):**
* (000, ~0.15)
* (100, ~0.35)
* (200, ~0.46)
* (300, ~0.51)
* (400, ~0.51)
2. **αₛ = 2 (Orange, Star):**
* **Trend:** Shows the steepest and most consistent increase, ending as the highest-performing series.
* **Data Points (Episode, EGA):**
* (000, ~0.15)
* (100, ~0.34)
* (200, ~0.49)
* (300, ~0.55)
* (400, ~0.63)
3. **αₛ = 3 (Light Blue, Diamond):**
* **Trend:** Increases rapidly early on, maintains a strong upward slope, and ends as the second-highest.
* **Data Points (Episode, EGA):**
* (000, ~0.15)
* (100, ~0.40)
* (200, ~0.52)
* (300, ~0.55)
* (400, ~0.60)
4. **αₛ = 4 (Green, 'X'):**
* **Trend:** Increases at a slightly slower rate than the others after Episode 100, resulting in the lowest final value.
* **Data Points (Episode, EGA):**
* (000, ~0.15)
* (100, ~0.37)
* (200, ~0.43)
* (300, ~0.52)
* (400, ~0.54)
### Key Observations
1. **Common Origin:** All four experimental conditions begin at the same EGA value (~0.15) at Episode 0.
2. **General Improvement:** EGA improves for all αₛ values as the number of episodes increases from 0 to 400.
3. **Performance Ordering:** By Episode 400, the performance order from highest to lowest EGA is: αₛ=2 > αₛ=3 > αₛ=4 > αₛ=1.
4. **Convergence Point:** Around Episode 300, the values for αₛ=2, αₛ=3, and αₛ=4 are very close (clustered between ~0.51 and ~0.55), while αₛ=1 is slightly lower.
5. **Divergence:** After Episode 300, the lines for αₛ=2 and αₛ=3 continue to rise noticeably, while αₛ=1 plateaus and αₛ=4 rises only slightly.
### Interpretation
This chart likely visualizes the learning curve of a reinforcement learning or iterative optimization agent, where "EGA" is a performance metric (e.g., Expected Gain/Accuracy) and "Episode" represents training iterations. The parameter αₛ appears to be a hyperparameter influencing the learning dynamics.
The data suggests that:
* **Moderate αₛ values (2 and 3) yield the best final performance.** They promote strong, sustained learning throughout the 400 episodes.
* **A low αₛ (1) leads to early learning that stalls,** resulting in the lowest final performance. This could indicate insufficient exploration or an overly conservative update step.
* **A high αₛ (4) results in decent but suboptimal learning.** It may cause the agent to be too "aggressive," potentially overshooting optimal policies or introducing instability that limits final performance.
* The **convergence around Episode 300** suggests a phase where the learning dynamics for different hyperparameters temporarily align before their long-term effects become distinct.
In essence, the chart demonstrates a non-monotonic relationship between αₛ and final performance, with an optimal range (around 2-3) that balances learning speed and stability for this specific task.
</details>
(g) $α_s$
<details>
<summary>x30.png Details</summary>
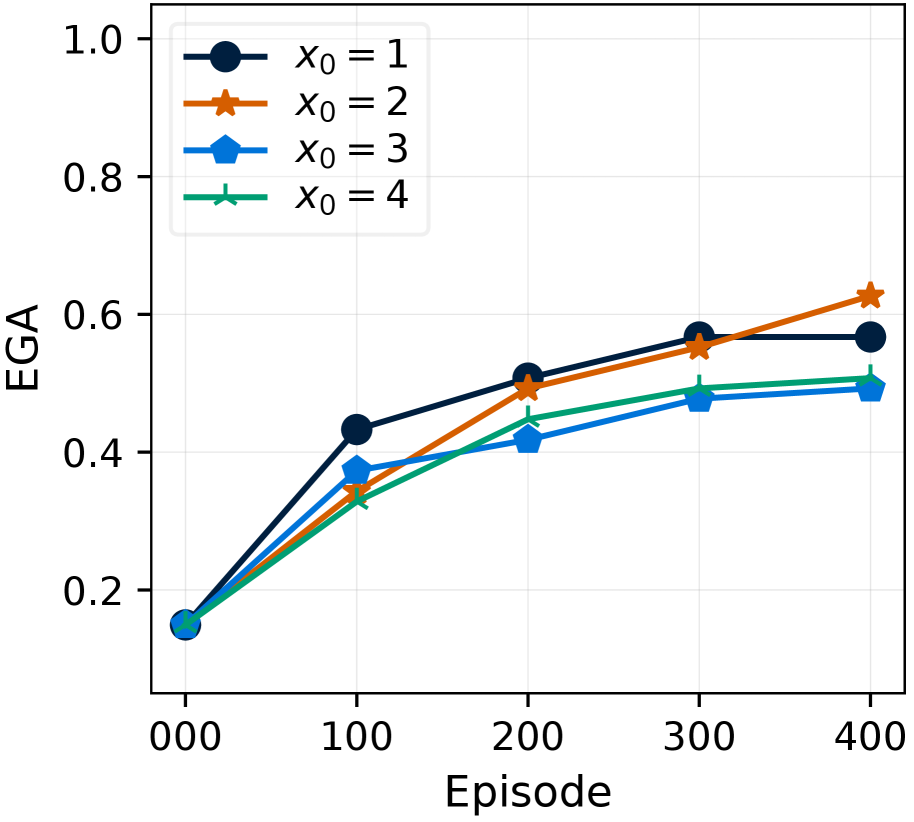
### Visual Description
## Line Chart: EGA vs. Episode for Different Initial Conditions (x₀)
### Overview
The image displays a line chart plotting the performance metric "EGA" against "Episode" for four distinct experimental conditions, differentiated by their initial value parameter, x₀. The chart illustrates how the EGA metric evolves over 400 episodes for each condition, showing learning or performance curves.
### Components/Axes
* **Chart Type:** Multi-series line chart with markers.
* **X-Axis:**
* **Label:** "Episode"
* **Scale:** Linear, from 0 to 400.
* **Tick Marks:** 000, 100, 200, 300, 400.
* **Y-Axis:**
* **Label:** "EGA"
* **Scale:** Linear, from 0.0 to 1.0.
* **Tick Marks:** 0.0, 0.2, 0.4, 0.6, 0.8, 1.0.
* **Legend:** Located in the top-left corner of the plot area. It defines four data series:
1. **x₀ = 1:** Dark blue line with circle markers.
2. **x₀ = 2:** Orange line with star markers.
3. **x₀ = 3:** Blue line with pentagon markers.
4. **x₀ = 4:** Green line with 'x' (cross) markers.
* **Grid:** Light gray grid lines are present for both major x and y ticks.
### Detailed Analysis
**Data Series and Trends:**
1. **x₀ = 1 (Dark Blue, Circles):**
* **Trend:** Shows a steep initial increase, then plateaus.
* **Approximate Data Points:**
* Episode 000: EGA ≈ 0.15
* Episode 100: EGA ≈ 0.43
* Episode 200: EGA ≈ 0.51
* Episode 300: EGA ≈ 0.57
* Episode 400: EGA ≈ 0.57
2. **x₀ = 2 (Orange, Stars):**
* **Trend:** Shows a steady, near-linear increase throughout, ending as the highest-performing series.
* **Approximate Data Points:**
* Episode 000: EGA ≈ 0.15
* Episode 100: EGA ≈ 0.34
* Episode 200: EGA ≈ 0.49
* Episode 300: EGA ≈ 0.55
* Episode 400: EGA ≈ 0.62
3. **x₀ = 3 (Blue, Pentagons):**
* **Trend:** Increases at a moderate rate, consistently performing below the x₀=1 and x₀=2 series after Episode 100.
* **Approximate Data Points:**
* Episode 000: EGA ≈ 0.15
* Episode 100: EGA ≈ 0.37
* Episode 200: EGA ≈ 0.42
* Episode 300: EGA ≈ 0.47
* Episode 400: EGA ≈ 0.49
4. **x₀ = 4 (Green, Crosses):**
* **Trend:** Follows a trajectory very similar to x₀=3, with slightly higher values at later episodes.
* **Approximate Data Points:**
* Episode 000: EGA ≈ 0.15
* Episode 100: EGA ≈ 0.33
* Episode 200: EGA ≈ 0.44
* Episode 300: EGA ≈ 0.49
* Episode 400: EGA ≈ 0.51
**Spatial Grounding & Cross-Reference:**
* All four lines originate from the same point at Episode 000 (EGA ≈ 0.15).
* The legend is positioned in the top-left, overlapping the grid but not obscuring data points.
* The color and marker for each line have been verified against the legend at multiple points (start, middle, end) to ensure accurate series identification.
### Key Observations
1. **Common Starting Point:** All conditions begin with identical performance (EGA ≈ 0.15) at Episode 0.
2. **Performance Crossover:** The x₀=1 series (dark blue) leads initially but is overtaken by x₀=2 (orange) between Episodes 300 and 400.
3. **Clustering:** The x₀=3 (blue) and x₀=4 (green) series cluster together, performing similarly but distinctly lower than the top two series after the initial episodes.
4. **Plateau vs. Growth:** The x₀=1 series appears to plateau after Episode 300, while the x₀=2 series continues a clear upward trend.
5. **Final Ranking (Episode 400):** From highest to lowest EGA: x₀=2 > x₀=1 > x₀=4 > x₀=3.
### Interpretation
This chart likely visualizes the results of a reinforcement learning or optimization experiment where "EGA" is a performance metric (e.g., Expected Gain Average, Episodic Goal Achievement) and "Episode" represents training iterations. The parameter `x₀` represents different initial conditions or hyperparameter settings for the agent or system.
The data suggests that the initial condition `x₀=2` yields the most favorable long-term learning trajectory, resulting in the highest final performance. While `x₀=1` enables faster initial learning, it saturates earlier. The conditions `x₀=3` and `x₀=4` lead to slower and ultimately lower performance. This implies a non-monotonic relationship between the initial parameter `x₀` and final performance; a middle value (`x₀=2`) is optimal in this context. The convergence of all lines at the start confirms a controlled experimental setup. The chart effectively communicates that tuning the `x₀` parameter is critical for both the speed of learning and the ultimate performance ceiling achieved by the system.
</details>
(h) $x_0$
Figure 8: Hyperparameter ablation study in MineRL. EGA over 400 episodes under different hyperparameters. The plots show EGA when varying: (a) $c_0$ (revision count threshold for inadmissible items), (b) $α_i$ (required items quantities for inadmissible items), (c) $α_s$ (required items quantities for less-tried items), and (d) $x_0$ (invalid action threshold). Each study varies one hyperparameter while keeping the others fixed to their default values ( $c_0=3,α_i=8,α_s=2,x_0=2$ ).
To validate XENON’s stability to its hyperparameters, we conduct comprehensive ablation studies in both MC-TextWorld and MineRL. In these studies, we vary one hyperparameter at a time while keeping the others fixed to their default values ( $c_0=3$ , $α_i=8$ , $α_s=2$ , $x_0=2$ ).
Our results (Figure ˜ 8, Figure ˜ 8) show that although XENON is generally stable across hyperparameters, an effective learning strategy should account for controller capacity when the controller is imperfect. In MC-TextWorld (Figure ˜ 8), XENON maintains near-perfect EGA across a wide range of all tested hyperparameters, confirming its stability when a perfect controller is used. In MineRL (Figure ˜ 8), with an imperfect controller, the results demonstrate two findings. First, while influenced by hyperparameters, XENON still demonstrates robust performance, showing EGA after 400 episodes for all tested values remains near or above 0.5, outperforming baselines that plateau around or below 0.4 (Figure ˜ 5(a)). Second, controller capacity should be considered when designing dependency and action learning strategies. For example, the ablation on $α_s$ (Figure ˜ 7(g)) shows that while gathering a sufficient quantity of items is necessary ( $α_s=1$ ), overburdening the controller with excessive items ( $α_s=4$ ) also degrades performance. Similarly, the ablation on $x_0$ (Figure ˜ 7(h)) shows the need to balance tolerating controller failures against wasting time on invalid actions.
We provide additional ablations in the Appendix on dependency and action learning—when initializing the dependency graph from an external source mismatched to the environment (Figure ˜ 23), when scaling to more goals/actions (Figure ˜ 24), and when using a smaller 4B planner LLM (Figure ˜ 26)—as well as an ablation of action selection methods for subgoal construction (Figure ˜ 25).
## 6 Conclusion
We address the challenge of robust planning via experience-based algorithmic knowledge correction. With XENON, we show that directly revising external knowledge through experience enables an LLM-based agent to overcome flawed priors and sparse feedback, surpassing the limits of LLM self-correction. Experiments across diverse Minecraft benchmarks demonstrate that this approach not only strengthens knowledge acquisition and long-horizon planning, but also enables an agent with a lightweight 7B open-weight LLM to outperform prior methods that rely on much larger proprietary models. Our work delivers a key lesson for building robust LLM-based embodied agents: LLM priors should be treated with skepticism and continuously managed and corrected algorithmically.
Limitations
Despite its contributions, XENON faces a limitation. XENON’s performance is influenced by the underlying controller; in MineRL, STEVE-1 (Lifshitz et al., 2023) controller struggles with spatial exploration tasks, making a performance gap compared to more competent controllers like Mineflayer. Future work could involve jointly training the planner and controller, potentially using hierarchical reinforcement learning.
#### Acknowledgments
This work was supported by the Institute of Information & Communications Technology Planning & Evaluation (IITP) and IITP-ITRC (Information Technology Research Center) grant funded by the Korea government (MSIT) (No. RS-2019-II191906, Artificial Intelligence Graduate School Program (POSTECH); IITP-2026-RS-2024-00437866; RS-2024-00509258, Global AI Frontier Lab), by a grant from the Korea Institute for Advancement of Technology (KIAT), funded by the Ministry of Trade, Industry and Energy (MOTIE), Republic of Korea (RS-2025-00564342), and by Seoul R&BD Program (SP240008) through the Seoul Business Agency (SBA) funded by The Seoul Metropolitan Government.
## References
- S. Bai, K. Chen, X. Liu, J. Wang, W. Ge, S. Song, K. Dang, P. Wang, S. Wang, J. Tang, H. Zhong, Y. Zhu, M. Yang, Z. Li, J. Wan, P. Wang, W. Ding, Z. Fu, Y. Xu, J. Ye, X. Zhang, T. Xie, Z. Cheng, H. Zhang, Z. Yang, H. Xu, and J. Lin (2025) Qwen2.5-vl technical report. arXiv preprint arXiv:2502.13923. Cited by: Figure 26, §K.1, §K.11, Figure 1, §5.1, §5.3.
- B. Baker, I. Akkaya, P. Zhokhov, J. Huizinga, J. Tang, A. Ecoffet, B. Houghton, R. Sampedro, and J. Clune (2022) Video pretraining (vpt): learning to act by watching unlabeled online videos. External Links: 2206.11795, Link Cited by: §J.2.1.
- P. Belcak, G. Heinrich, S. Diao, Y. Fu, X. Dong, S. Muralidharan, Y. C. Lin, and P. Molchanov (2025) Small language models are the future of agentic ai. External Links: 2506.02153, Link, Document Cited by: §1.
- M. Chen, J. Tworek, H. Jun, Q. Yuan, H. P. de Oliveira Pinto, J. Kaplan, H. Edwards, Y. Burda, N. Joseph, G. Brockman, A. Ray, R. Puri, G. Krueger, M. Petrov, H. Khlaaf, G. Sastry, P. Mishkin, B. Chan, S. Gray, N. Ryder, M. Pavlov, A. Power, L. Kaiser, M. Bavarian, C. Winter, P. Tillet, F. P. Such, D. Cummings, M. Plappert, F. Chantzis, E. Barnes, A. Herbert-Voss, W. H. Guss, A. Nichol, A. Paino, N. Tezak, J. Tang, I. Babuschkin, S. Balaji, S. Jain, W. Saunders, C. Hesse, A. N. Carr, J. Leike, J. Achiam, V. Misra, E. Morikawa, A. Radford, M. Knight, M. Brundage, M. Murati, K. Mayer, P. Welinder, B. McGrew, D. Amodei, S. McCandlish, I. Sutskever, and W. Zaremba (2021) Evaluating large language models trained on code. External Links: 2107.03374 Cited by: §5.3.
- M. Chen, Y. Li, Y. Yang, S. Yu, B. Lin, and X. He (2024) AutoManual: constructing instruction manuals by llm agents via interactive environmental learning. External Links: 2405.16247 Cited by: §E.1, §1.
- M. Côté, Á. Kádár, X. Yuan, B. Kybartas, T. Barnes, E. Fine, J. Moore, R. Y. Tao, M. Hausknecht, L. E. Asri, M. Adada, W. Tay, and A. Trischler (2018) TextWorld: a learning environment for text-based games. CoRR abs/1806.11532. Cited by: Appendix A.
- K. Du, V. Snæbjarnarson, N. Stoehr, J. White, A. Schein, and R. Cotterell (2024) Context versus prior knowledge in language models. In Proceedings of the 62nd Annual Meeting of the Association for Computational Linguistics (Volume 1: Long Papers), L. Ku, A. Martins, and V. Srikumar (Eds.), Bangkok, Thailand, pp. 13211–13235. External Links: Link, Document Cited by: §1.
- L. Fan, G. Wang, Y. Jiang, A. Mandlekar, Y. Yang, H. Zhu, A. Tang, D. Huang, Y. Zhu, and A. Anandkumar (2022) MineDojo: building open-ended embodied agents with internet-scale knowledge. In Thirty-sixth Conference on Neural Information Processing Systems Datasets and Benchmarks Track, External Links: Link Cited by: §1, §3.
- Y. Feng, Y. Wang, J. Liu, S. Zheng, and Z. Lu (2024) LLaMA-rider: spurring large language models to explore the open world. In Findings of the Association for Computational Linguistics: NAACL 2024, K. Duh, H. Gomez, and S. Bethard (Eds.), Mexico City, Mexico, pp. 4705–4724. External Links: Link, Document Cited by: §1, §2.1.
- Z. Gou, Z. Shao, Y. Gong, Y. Shen, Y. Yang, N. Duan, and W. Chen (2024) CRITIC: large language models can self-correct with tool-interactive critiquing. External Links: 2305.11738, Link Cited by: §2.2.
- W. H. Guss, B. Houghton, N. Topin, P. Wang, C. Codel, M. Veloso, and R. Salakhutdinov (2019) MineRL: a large-scale dataset of minecraft demonstrations. External Links: 1907.13440, Link Cited by: §J.2.2, §J.2.5, §1, §3, §5.1.
- J. Huang, X. Chen, S. Mishra, H. S. Zheng, A. W. Yu, X. Song, and D. Zhou (2024) Large language models cannot self-correct reasoning yet. External Links: 2310.01798, Link Cited by: §2.2.
- J. Li, Q. Wang, Y. Wang, X. Jin, Y. Li, W. Zeng, and X. Yang (2025a) Open-world reinforcement learning over long short-term imagination. In ICLR, Cited by: §J.2.1.
- T. Li, G. Zhang, Q. D. Do, X. Yue, and W. Chen (2024a) Long-context llms struggle with long in-context learning. External Links: 2404.02060 Cited by: §4.2, §5.3.
- Z. Li, Y. Xie, R. Shao, G. Chen, D. Jiang, and L. Nie (2024b) Optimus-1: hybrid multimodal memory empowered agents excel in long-horizon tasks. Advances in neural information processing systems 37, pp. 49881–49913. Cited by: §J.2.2, §J.2.3, §J.2.5, Appendix H, §1, §2.1, §3, §4.3, §5.1, §5.1, Table 3.
- Z. Li, Y. Xie, R. Shao, G. Chen, D. Jiang, and L. Nie (2025b) Optimus-2: multimodal minecraft agent with goal-observation-action conditioned policy. In 2025 IEEE/CVF Conference on Computer Vision and Pattern Recognition (CVPR), Cited by: §5.1, Table 3.
- S. Lifshitz, K. Paster, H. Chan, J. Ba, and S. McIlraith (2023) STEVE-1: a generative model for text-to-behavior in minecraft. External Links: 2306.00937 Cited by: §5.1, §5.2, §6.
- Z. Lin, J. Li, J. Shi, D. Ye, Q. Fu, and W. Yang (2021) Juewu-mc: playing minecraft with sample-efficient hierarchical reinforcement learning. arXiv preprint arXiv:2112.04907. Cited by: §J.2.1, §1.
- N. F. Liu, K. Lin, J. Hewitt, A. Paranjape, M. Bevilacqua, F. Petroni, and P. Liang (2024) Lost in the middle: how language models use long contexts. Transactions of the Association for Computational Linguistics 12, pp. 157–173. External Links: Link, Document Cited by: §4.2.
- S. Liu, Y. Li, K. Zhang, Z. Cui, W. Fang, Y. Zheng, T. Zheng, and M. Song (2025) Odyssey: empowering minecraft agents with open-world skills. In International Joint Conference on Artificial Intelligence, Cited by: §2.1.
- H. Mao, C. Wang, X. Hao, Y. Mao, Y. Lu, C. Wu, J. Hao, D. Li, and P. Tang (2022) Seihai: a sample-efficient hierarchical ai for the minerl competition. In Distributed Artificial Intelligence: Third International Conference, DAI 2021, Shanghai, China, December 17–18, 2021, Proceedings 3, pp. 38–51. Cited by: §J.2.1, §1.
- Microsoft, :, A. Abouelenin, A. Ashfaq, A. Atkinson, H. Awadalla, N. Bach, J. Bao, A. Benhaim, M. Cai, V. Chaudhary, C. Chen, D. Chen, D. Chen, J. Chen, W. Chen, Y. Chen, Y. Chen, Q. Dai, X. Dai, R. Fan, M. Gao, M. Gao, A. Garg, A. Goswami, J. Hao, A. Hendy, Y. Hu, X. Jin, M. Khademi, D. Kim, Y. J. Kim, G. Lee, J. Li, Y. Li, C. Liang, X. Lin, Z. Lin, M. Liu, Y. Liu, G. Lopez, C. Luo, P. Madan, V. Mazalov, A. Mitra, A. Mousavi, A. Nguyen, J. Pan, D. Perez-Becker, J. Platin, T. Portet, K. Qiu, B. Ren, L. Ren, S. Roy, N. Shang, Y. Shen, S. Singhal, S. Som, X. Song, T. Sych, P. Vaddamanu, S. Wang, Y. Wang, Z. Wang, H. Wu, H. Xu, W. Xu, Y. Yang, Z. Yang, D. Yu, I. Zabir, J. Zhang, L. L. Zhang, Y. Zhang, and X. Zhou (2025) Phi-4-mini technical report: compact yet powerful multimodal language models via mixture-of-loras. External Links: 2503.01743, Link Cited by: Figure 26, §K.11.
- K. Nottingham, P. Ammanabrolu, A. Suhr, Y. Choi, H. Hajishirzi, S. Singh, and R. Fox (2023) Do embodied agents dream of pixelated sheep? embodied decision making using language guided world modelling. In Proceedings of the 40th International Conference on Machine Learning, ICML’23. Cited by: §J.1, Table 8, Appendix C, Appendix G, §2.1, §3, §3, §4.1, §5.1.
- OpenAI (2023) Gpt-4v(ision) system card. External Links: Link Cited by: §5.3.
- OpenAI (2024) GPT-4 technical report. External Links: 2303.08774, Link Cited by: §5.3.
- PrismarineJS (2023) Prismarinejs/mineflayer. Note: https://github.com/PrismarineJS/mineflayer External Links: Link Cited by: §J.3, §5.1.
- Y. Qin, E. Zhou, Q. Liu, Z. Yin, L. Sheng, R. Zhang, Y. Qiao, and J. Shao (2024) Mp5: a multi-modal open-ended embodied system in minecraft via active perception. In 2024 IEEE/CVF Conference on Computer Vision and Pattern Recognition (CVPR), pp. 16307–16316. Cited by: §2.1.
- N. Reimers and I. Gurevych (2019) Sentence-bert: sentence embeddings using siamese bert-networks. In Proceedings of the 2019 Conference on Empirical Methods in Natural Language Processing, External Links: Link Cited by: Appendix I, 2nd item.
- N. Shinn, F. Cassano, E. Berman, A. Gopinath, K. Narasimhan, and S. Yao (2023) Reflexion: language agents with verbal reinforcement learning. External Links: 2303.11366 Cited by: §J.1, §1, §2.2, §5.1.
- K. Stechly, K. Valmeekam, and S. Kambhampati (2024) On the self-verification limitations of large language models on reasoning and planning tasks. External Links: 2402.08115, Link Cited by: §J.1, §1, §5.1.
- A. Szot, A. Clegg, E. Undersander, E. Wijmans, Y. Zhao, J. Turner, N. Maestre, M. Mukadam, D. Chaplot, O. Maksymets, A. Gokaslan, V. Vondrus, S. Dharur, F. Meier, W. Galuba, A. Chang, Z. Kira, V. Koltun, J. Malik, M. Savva, and D. Batra (2021) Habitat 2.0: training home assistants to rearrange their habitat. In Advances in Neural Information Processing Systems (NeurIPS), Cited by: §1.
- G. Tyen, H. Mansoor, V. Carbune, P. Chen, and T. Mak (2024) LLMs cannot find reasoning errors, but can correct them given the error location. In Findings of the Association for Computational Linguistics: ACL 2024, L. Ku, A. Martins, and V. Srikumar (Eds.), Bangkok, Thailand, pp. 13894–13908. External Links: Link, Document Cited by: §2.2.
- G. Wang, Y. Xie, Y. Jiang, A. Mandlekar, C. Xiao, Y. Zhu, L. Fan, and A. Anandkumar (2023a) Voyager: an open-ended embodied agent with large language models. arXiv preprint arXiv: Arxiv-2305.16291. Cited by: §1, §2.1.
- Z. Wang, S. Cai, G. Chen, A. Liu, X. (. Ma, and Y. Liang (2023b) Describe, explain, plan and select: interactive planning with llms enables open-world multi-task agents. Advances in Neural Information Processing Systems 36, pp. 34153–34189. Cited by: §J.2.5, §1, §5.1.
- Z. Wang, S. Cai, A. Liu, Y. Jin, J. Hou, B. Zhang, H. Lin, Z. He, Z. Zheng, Y. Yang, X. Ma, and Y. Liang (2023c) JARVIS-1: open-world multi-task agents with memory-augmented multimodal language models. arXiv preprint arXiv: 2311.05997. Cited by: §1, §2.1, §5.1.
- Y. Wu, M. S. Hee, Z. Hu, and R. K. Lee (2024) LongGenBench: benchmarking long-form generation in long context llms. External Links: 2409.02076, Link Cited by: §5.3.
- L. Yang, Z. Yu, T. Zhang, M. Xu, J. E. Gonzalez, B. Cui, and S. Yan (2025) SuperCorrect: supervising and correcting language models with error-driven insights. In International Conference on Learning Representations, Cited by: §2.2.
- Y. Yoon, G. Lee, S. Ahn, and J. Ok (2024) Breadth-first exploration on adaptive grid for reinforcement learning. In Forty-first International Conference on Machine Learning, Cited by: 2nd item.
- S. Yu and C. Lu (2024) ADAM: an embodied causal agent in open-world environments. arXiv preprint arXiv:2410.22194. Cited by: §J.1, §J.3.1, Table 8, §K.1, §2.1, §5.1, §5.1.
- H. Yuan, C. Zhang, H. Wang, F. Xie, P. Cai, H. Dong, and Z. Lu (2023) Plan4MC: skill reinforcement learning and planning for open-world Minecraft tasks. arXiv preprint arXiv:2303.16563. Cited by: §1.
- Y. Zhang, M. Khalifa, L. Logeswaran, J. Kim, M. Lee, H. Lee, and L. Wang (2024) Small language models need strong verifiers to self-correct reasoning. In Findings of the Association for Computational Linguistics: ACL 2024, L. Ku, A. Martins, and V. Srikumar (Eds.), Bangkok, Thailand, pp. 15637–15653. External Links: Link, Document Cited by: §1.
- A. Zhao, D. Huang, Q. Xu, M. Lin, Y. Liu, and G. Huang (2024) ExpeL: llm agents are experiential learners. In Thirty-Eighth AAAI Conference on Artificial Intelligence, AAAI 2024, Thirty-Sixth Conference on Innovative Applications of Artificial Intelligence, IAAI 2024, Fourteenth Symposium on Educational Advances in Artificial Intelligence, EAAI 2024, February 20-27, 2024, Vancouver, Canada, M. J. Wooldridge, J. G. Dy, and S. Natarajan (Eds.), pp. 19632–19642. External Links: Link, Document Cited by: §E.1.
- Z. Zhao, W. Chai, X. Wang, L. Boyi, S. Hao, S. Cao, T. Ye, J. Hwang, and G. Wang (2023) See and think: embodied agent in virtual environment. arXiv preprint arXiv:2311.15209. Cited by: §2.1.
- X. Zheng, H. Lin, K. He, Z. Wang, Z. Zheng, and Y. Liang (2025) MCU: an evaluation framework for open-ended game agents. External Links: 2310.08367, Link Cited by: §J.4, §5.1.
- X. Zhu, Y. Chen, H. Tian, C. Tao, W. Su, C. Yang, G. Huang, B. Li, L. Lu, X. Wang, Y. Qiao, Z. Zhang, and J. Dai (2023) Ghost in the minecraft: generally capable agents for open-world environments via large language models with text-based knowledge and memory. arXiv preprint arXiv:2305.17144. Cited by: §1, §2.1.
This appendix is organized as follows:
- Appendix ˜ A: Experiments in a domain other than Minecraft (Microsoft TextWorld Cooking).
- Appendix ˜ B: Prompts and qualitative results of LLM self-correction in our experiments.
- Appendix ˜ C: Detailed procedure for experienced requirement set determination and dependency graph updates, as discussed in Section ˜ 3.
- Appendix ˜ E: Detailed pseudocode and the prompt for ADG in Section ˜ 4.1.
- Appendix ˜ F: Detailed pseudocode and the prompt for step-by-step planning using FAM in Section ˜ 4.2.
- Appendix ˜ H: Detailed descriptions and the prompt for CRe in Section ˜ 4.3.
- Appendix ˜ I: Detailed descriptions of implementation, human-written plans, and hyperparameters.
- Appendix ˜ J: Detailed descriptions of the baselines and experimental environments in Section ˜ 5.
- Appendix ˜ K: Analysis of experimental results and additional experimental results.
- Appendix ˜ L: Descriptions about LLM usage.
## Appendix A Additional experiments in another domain
To assess generalization beyond Minecraft, we evaluate XENON on the Microsoft TextWorld Cooking environment (Côté et al., 2018), a text-based household task planning benchmark. We demonstrate XENON can correct an LLM’s flawed knowledge of preconditions (e.g., required tools) and valid actions for plans using ADG and FAM in this domain as well. We note that XENON is applied with minimal modification: FAM is applied without modification, while ADG is adapted from its original design, which supports multiple incoming edges (preconditions) for a node, to one that allows only a single incoming edge, as this domain requires only a single precondition per node.
### A.1 Experiment Setup
Environment Rules
The goal is to prepare and eat a meal by reading a cookbook, which provides a plan as a list of (action, ingredient) pairs, e.g., (“fry”, “pepper”). We note that an agent cannot succeed by naively following this plan. This is because the agent must solve two key challenges: (1) it must discover the valid tool required for each cookbook action, and (2) it must discover the valid, executable action for each cookbook action, as some cookbook actions are not directly accepted by the environment (i.e., not in its action space).
Specifically, to succeed a cookbook’s (action, ingredient) pair, an agent must make a subgoal, formatted as (executable action, ingredient, tool), where the executable action and tool must be valid for the cookbook action. For example, the cookbook’s (“fry”, “pepper”) pair requires the agent to make a subgoal (cook, “pepper”, stove). The available executable action space consists of { “chop”, “close”, “cook”, “dice”, “drop”, “eat”, “examine”, “slice”, “prepare” }, and the available tools are { “knife”, “oven”, “stove”, “fridge”, “table”, “counter” }.
Baselines and Evaluation
All agents use an LLM (Qwen2.5-VL-7B) to make subgoals. The tool for each cookbook action is predicted by the LLM from the available tools before an episode begins. At each timestep during the episode, given a cookbook action, the LLM predicts an executable action from the executable action space, constructing a subgoal from this predicted executable action, the input ingredient, and the predicted tool.
To isolate the challenge of planning knowledge correction, we assume a competent controller gathers all ingredients and tools; thus, an agent starts each episode with all necessary ingredients and tools. An episode (max 50 timesteps) is successful if the agent completes the plan.
### A.2 Results
Table 6: Success rates in the TextWorld Cooking environment, comparing XENON against the SC (LLM self-correction) and DECKARD baselines from Section ˜ 5.1. We report the mean $±$ standard deviation over 3 independent runs, where each run consists of 100 episodes.
| | DECKARD | SC | XENON |
| --- | --- | --- | --- |
| Success Rate | $0.09± 0.02$ | $0.75± 0.04$ | $1.00± 0.00$ |
Table ˜ 6 shows that XENON achieves a perfect success rate ( $1.00± 0.00$ ), significantly outperforming both SC ( $0.75± 0.04$ ) and DECKARD ( $0.09± 0.02$ ). These results demonstrate that XENON’s core mechanisms (ADG and FAM) are generalizable, effectively correcting flawed planning knowledge in a domain that requires the agent to discover valid symbolic actions and preconditions. Notably, the SC baseline fails to achieve high performance, even in the TextWorld Cooking environment which is simpler than Minecraft. This reinforces our claim that relying on LLM self-correction is less reliable than XENON’s experience-based algorithmic knowledge correction.
## Appendix B Prompts and qualitative results of LLM self-correction
### B.1 Dependency correction
Figure ˜ 9 shows the prompt used for dependency correction.
⬇
1 You are a professional game analyst. For a given < item _ name >, you need to make < required _ items > to get the item.
2 If you make < required _ items > well, I will give you 1 $.
3
4 I will give you recent transitions.
5 % Recent failed trajectories are given
6 [Failed example]
7 < item _ name >: {item _ name}
8 < hypothesized _ required _ items >: {original _ prediction}
9 < inventory >: {inventory}
10 < plan >: {failed _ subgoal}
11 < success >: false
12
13 I will give you learned items similar to < item _ name >, and their validated required items, just for reference.
14 % K similar experienced items and their requirements are given
15 [Success Example]
16 < item _ name >: {experienced _ item}
17 < required _ items > {experienced _ requirements}
18
19 % Make a new predicted requirement set
20 [Your turn]
21 Here is < item _ name >, you MUST output < required _ items > to obtain the item in JSON format. Remember < required _ items > MUST be in JSON format.
22
23 < item _ name >: {item _ name}
24 < required _ items >:
Figure 9: Prompt used for LLM self-correction about dependencies.
We provide some examples of actual prompts and LLM outputs in Figure ˜ 10, Figure ˜ 11
⬇
1 You are a professional game analyst. For a given < item _ name >, you need to make < required _ items > to get the item.
2 If you make < required _ items > well, I will give you 1 $.
3
4 I will give you recent transitions.
5
6 [Failed example]
7 < item _ name >: iron _ nugget
8 < hypothesized _ required _ items >: {’ iron _ ore ’: 1, ’ crafting _ table ’: 1}
9 < inventory >: {’ crafting _ table ’: 1, ’ wooden _ sword ’: 1, ’ wooden _ pickaxe ’: 1, ’ torch ’: 4, ’ furnace ’: 1, ’ stone _ pickaxe ’: 1, ’ iron _ axe ’: 1, ’ iron _ shovel ’: 1, ’ stick ’: 2, ’ iron _ pickaxe ’: 1, ’ diamond ’: 3, ’ iron _ ingot ’: 2, ’ iron _ ore ’: 2, ’ gold _ ore ’: 1, ’ coal ’: 1}
10 < plan >: dig down and mine iron _ nugget
11 < success >: false
12
13 I will give you learned items similar to < item _ name >, and their validated required items, just for reference.
14 [Success Example]
15 < item _ name >:
16 iron _ ingot
17 < required _ items >:
18 {’ recipe ’: {’ furnace ’: 1, ’ iron _ ore ’: 1, ’ coals ’: 1}}
19 [Success Example]
20 < item _ name >:
21 iron _ pickaxe
22 < required _ items >:
23 {’ recipe ’: {’ stick ’: 2, ’ iron _ ingot ’: 3, ’ crafting _ table ’: 1}}
24 [Success Example]
25 < item _ name >:
26 iron _ shovel
27 < required _ items >:
28 {’ recipe ’: {’ stick ’: 2, ’ iron _ ingot ’: 1, ’ crafting _ table ’: 1}}
29
30 [Your turn]
31 Here is < item _ name >, you MUST output < required _ items > to obtain the item in JSON format. Remember < required _ items > MUST be in JSON format.
32
33 < item _ name >:
34 iron _ nugget
35 < required _ items >:
36 % LLM output: {’recipe’: {’iron_ore’: 1, ’crafting_table’: 1}}
Figure 10: Example of dependency self-correction for iron_nugget.
⬇
1 You are a professional game analyst. For a given < item _ name >, you need to make < required _ items > to get the item.
2 If you make < required _ items > well, I will give you 1 $.
3
4 I will give you recent transitions.
5
6 [Failed example]
7 < item _ name >: charcoal
8 < hypothesized _ required _ items >: {’ oak _ log ’: 8}
9 < inventory >: {’ dirt ’: 1, ’ oak _ log ’: 2, ’ crafting _ table ’: 1, ’ wooden _ hoe ’: 1, ’ wooden _ pickaxe ’: 1, ’ torch ’: 4, ’ stone _ axe ’: 1, ’ furnace ’: 1, ’ stone _ pickaxe ’: 1, ’ stick ’: 2, ’ iron _ pickaxe ’: 1, ’ diamond ’: 1, ’ iron _ ingot ’: 3, ’ iron _ ore ’: 2, ’ coal ’: 2}
10 < action >: craft charcoal
11 < success >: false
12
13 I will give you learned items similar to < item _ name >, and their validated required items, just for reference.
14 [Success Example]
15 < item _ name >:
16 coals
17 < required _ items >:
18 {’ recipe ’: {’ wooden _ pickaxe ’: 1}}
19 [Success Example]
20 < item _ name >:
21 furnace
22 < required _ items >:
23 {’ recipe ’: {’ cobblestone ’: 8, ’ crafting _ table ’: 1}}
24 [Success Example]
25 < item _ name >:
26 diamond
27 < required _ items >:
28 {’ recipe ’: {’ iron _ pickaxe ’: 1}}
29
30 [Your turn]
31 Here is < item _ name >, you MUST output < required _ items > to achieve charcoal in JSON format. Remember < required _ items > MUST be in JSON format.
32
33 < item _ name >:
34 charcoal
35 < required _ items >:
36 % LLM output: {’recipe’: {’oak_log’: 8}}
Figure 11: Example of dependency self-correction for charcoal.
### B.2 Action correction
Figure ˜ 12 shows the prompt used self-reflection for failed actions.
⬇
1 % LLM self-reflection to analyze failure reasons
2 You are a professional game analyst.
3 For a given < item _ name > and < inventory >, you need to analyze why < plan > failed to get the item.
4 I will give you examples of analysis as follow.
5
6 [Example]
7 < item _ name >: wooden _ pickaxe
8 < inventory >: {’ stick ’: 4, ’ planks ’: 4, ’ crafting _ table ’: 1}
9 < plan >: smelt wooden _ pickaxe
10 < failure _ analysis >
11 {" analysis ": " You failed because you cannot smelt a wooden _ pickaxe. You should craft it instead."}
12
13 [Example]
14 < item _ name >: stone _ pickaxe
15 < inventory >: {’ stick ’: 4, ’ planks ’: 4, ’ crafting _ table ’: 1}
16 < plan >: craft stone _ pickaxe
17 < failure _ analysis >
18 {" analysis ": " You failed because you do not have enough cobblestones."}
19
20 [Your turn]
21 Here is < item _ name >, < inventory > and < plan >, you MUST output < failure _ analysis > concisely in JSON format.
22
23 < item _ name >: {item _ name}
24 < inventory >: {inventory}
25 < plan >: {plan}
26 < failure _ analysis >
27
28 % Then, using the self-reflection results, LLM self-correct its actions.
29 For an item name, you need to make a plan, by selecting one among provided options.
30 I will give you examples of which plans are needed to achieve an item, just for reference.
31 [Example]
32 < item name >
33 {similar _ item}
34 < task planning >
35 {successful _ plan
36
37 Here are some analyses on previous failed plans for this item.
38 [Analysis]
39 {’ item _ name ’: {item}, ’ inventory ’: {inventory}, ’ plan ’: ’{plan}’, ’ failure _ analysis ’: ’{self - reflection}’}
40
41 [Your turn]
42 Here is < item name >, you MUST select one from below < options >, to make < task planning >.
43 you MUST select one from below < options >. DO NOT MAKE A PLAN NOT IN < options >.
44
45 < options >:
46 1: {" task ": " dig down and mine {item}", " goal ": [{item}, {quantity}]}
47 2: {" task ": " craft {item}", " goal ": [{item}, {quantity}]}
48 3: {" task ": " smelt {item}", " item ": [{item}, {quantity}}
49
50 < item name >
51 {item}
52 < task planning >
Figure 12: Prompts used for LLM self-correction about actions.
We provide some examples of actual prompts and LLM outputs in Figure ˜ 13, Figure ˜ 14
⬇
1 For an item name, you need to make a plan, by selecting one among provided options.
2 I will give you examples of which plans are needed to achieve an item, just for reference.
3
4 [Example]
5 < item name >
6 iron _ ingot
7 < task planning >
8 {" task ": " smelt iron _ ingot ", " goal ": [" iron _ ingot ", 1]}
9
10 [Example]
11 < item name >
12 iron _ pickaxe
13 < task planning >
14 {" task ": " craft iron _ pickaxe ", " goal ": [" iron _ pickaxe ", 1]}
15
16 [Example]
17 < item name >
18 iron _ shovel
19 < task planning >
20 {" task ": " craft iron _ shovel ", " goal ": [" iron _ shovel ", 1]}
21
22 Here are some analyses on previous failed plans for this item.
23 [Analysis]
24 {’ item _ name ’: ’ iron _ nugget ’,
25 ’ inventory ’: {’ crafting _ table ’: 1, ’ wooden _ sword ’: 1, ’ wooden _ pickaxe ’: 1, ’ torch ’: 4, ’ furnace ’: 1, ’ stone _ pickaxe ’: 1, ’ iron _ axe ’: 1, ’ iron _ shovel ’: 1, ’ stick ’: 2, ’ iron _ pickaxe ’: 1, ’ diamond ’: 3, ’ iron _ ingot ’: 2, ’ iron _ ore ’: 2, ’ gold _ ore ’: 1, ’ coal ’: 1},
26 ’ plan ’: ’ dig down and mine iron _ nugget ’,
27 ’ failure _ analysis ’: ’ You failed because you do not have any iron ore or diamond ore to mine for iron nuggets.’}
28
29 [Your turn]
30 Here is < item name >, you MUST select one from below < options >, to make < task planning >.
31 you MUST select one from below < options >. DO NOT MAKE A PLAN NOT IN < options >.
32
33 < options >
34 1. {" task ": " dig down and mine iron _ nugget ", " goal ": [" iron _ nugget ", 1]}
35 2. {" task ": " craft iron _ nugget ", " goal ": [" iron _ nugget ", 1]}
36 3. {" task ": " smelt iron _ nugget ", " goal ": [" iron _ nugget ", 1]}
37
38 < item name >
39 iron _ nugget
40 % LLM output: ’{"task": "dig down and mine iron_nugget", "goal": ["iron_nugget", 1]}’
Figure 13: Example of action self-correction for iron_nugget.
⬇
1 For an item name, you need to make a plan, by selecting one among provided options.
2 I will give you examples of which plans are needed to achieve an item, just for reference.
3
4 [Example]
5 < item name >
6 coals
7 < task planning >
8 {" task ": " dig down and mine coals ", " goal ": [" coals ", 1]}
9
10 [Example]
11 < item name >
12 furnace
13 < task planning >
14 {" task ": " craft furnace ", " goal ": [" furnace ", 1]}
15
16 [Example]
17 < item name >
18 diamond
19 < task planning >
20 {" task ": " dig down and mine diamond ", " goal ": [" diamond ", 1]}
21
22 Here are some analyses on previous failed plans for this item.
23 [Analysis]
24 {’ item _ name ’: ’ charcoal ’,
25 ’ inventory ’: {’ dirt ’: 1, ’ oak _ log ’: 2, ’ crafting _ table ’: 1, ’ wooden _ hoe ’: 1, ’ wooden _ pickaxe ’: 1, ’ torch ’: 4, ’ stone _ axe ’: 1, ’ furnace ’: 1, ’ stone _ pickaxe ’: 1, ’ stick ’: 2, ’ iron _ pickaxe ’: 1, ’ diamond ’: 1, ’ iron _ ingot ’: 3, ’ iron _ ore ’: 2, ’ coal ’: 2},
26 ’ plan ’: ’ mine iron _ nugget ’,
27 ’ failure _ analysis ’: ’ You failed because you already have enough charcoal.’}
28
29
30 [Your turn]
31 Here is < item name >, you MUST select one from below < options >, to make < task planning >.
32 you MUST select one from below < options >. DO NOT MAKE A PLAN NOT IN < options >.
33
34 < options >
35 1. {" task ": " mine iron _ nugget ", " goal ": [" charcoal ", 1]}
36 2. {" task ": " craft charcoal ", " goal ": [" charcoal ", 1]}
37 3. {" task ": " smelt charcoal ", " goal ": [" charcoal ", 1]}
38
39 < item name >
40 charcoal
41 < task planning >
42 % LLM output: ’{"task": "craft charcoal", "goal": ["charcoal", 1]}’
Figure 14: Example of action self-correction for charcoal.
## Appendix C Experienced requirement set and dependency graph update
We note that the assumptions explained in this section are largely similar to those in the implementation of DECKARD (Nottingham et al., 2023) https://github.com/DeckardAgent/deckard.
Determining experienced requirement set
When the agent obtains item $v$ while executing a subgoal $(a,q,u)$ , it determines the experienced requirement set $R_exp(v)$ differently depending on whether the high-level action $a$ is “mine” or falls under “craft” or “smelt”. If $a$ is “mine”, the agent determines $R_exp(v)$ based on the pickaxe in its inventory. If no pickaxe is held, $R_exp(v)$ is $∅$ . Otherwise, $R_exp(v)$ becomes $\{(the highest-tier pickaxe the agent has,1)\}$ , where the highest-tier pickaxe is determined following the hierarchy: “wooden_pickaxe”, “stone_pickaxe”, “iron_pickaxe”, “diamond_pickaxe”. If $a$ is “craft” or “smelt”, the agent determines the used items and their quantities as $R_exp(v)$ by observing inventory changes when crafting or smelting $v$ .
Dependency graph update
When the agent obtains an item $v$ and its $R_exp(v)$ for the first time, it updates its dependency graph $\hat{G}=(\hat{V},\hat{E})$ . Since $R_exp(v)$ only contains items acquired before $v$ , no cycles can be introduced to ADG during learning. The update proceeds as follows: The agent adds $v$ to both the set of known items $\hat{V}$ . Then, it updates the edge set $\hat{E}$ by replacing $v$ ’s incoming edges with $R_exp(v)$ : it removes all of $v$ ’s incoming edges $(u,·,v)∈\hat{E}$ and adds new edges $(u_i,q_i,v)$ to $\hat{E}$ for every $(u_i,q_i)∈R_exp(v)$ .
## Appendix D Full procedure of XENON
input : invalid action threshold $x_0$ , inadmissible item threshold $c_0$ , less-explored item scale $α_s$ , inadmissible item scale $α_i$
1 Initialize dependency $\hat{G}←(\hat{V},\hat{E})$ , revision counts $C[v]← 1$ for all $v∈\hat{V}$
2 Initialize memory $S(a,v)=0,F(a,v)=0$ for all $v∈\hat{V},a∈A$
3 while learning do
4 Get an empty inventory $inv$
$v_g←\texttt{SelectGoalWithDifficulty}(\hat{G},C[·])$
// DEX Appendix ˜ G
5 while $H_episode$ do
6 if $v_g∈ inv$ then
7 $v_g←\texttt{SelectGoalWithDifficulty}(\hat{G},C[·])$
8
9
Series of aggregated requirements $((q_l,u_l))_l=1^L_v_{g}$ using $\hat{G}$ and $inv$
// from Section ˜ 3
10 Plan $P←((a_l,q_l,u_l))_l=1^L_v_{g}$ by selecting $a_l$ for each $u_l$ , using LLM, $S$ , $F$ , $x_0$
11 foreach subgoal $(a,q,u)∈ P$ do
12 Execute $(a,q,u)$ then get the execution result $success$
Get an updated inventory $inv$ , dependency graph $\hat{G}$
// from Section ˜ 3
13
14 if success then $S(a,u)← S(a,u)+1$
15 else $F(a,u)← F(a,u)+1$
16
17 if not $success$ then
18 if All actions are invalid then
$\hat{G},C←\texttt{RevisionByAnalogy}(\hat{G},u,C[·],c_0,α_s,α_i)$
// ADG Section ˜ 4.1
19 Reset memory $S(·,u)← 0,F(·,u)← 0$
20 $v_g←\texttt{SelectGoalWithDifficulty}(\hat{G},C[·])$
21 break
22
23
24
25
Algorithm 1 Pseudocode of XENON
The full procedure of XENON is outlined in Algorithm ˜ 1
## Appendix E Details in Adaptive Dependency Graph (ADG)
### E.1 Rationale for initial knowledge
In real-world applications, a human user may wish for an autonomous agent to accomplish certain goals, yet the user themselves may have limited or no knowledge of how to achieve them within a complex environment. We model this scenario by having a user specify goal items without providing the detailed requirements, and then the agent should autonomously learn how to obtain these goal items. The set of 67 goal item names ( $V_0$ ) provided to the agent represents such user-specified goal items, defining the learning objectives.
To bootstrap learning in complex environments, LLM-based planning literature often utilizes minimal human-written plans for initial knowledge (Zhao et al., 2024; Chen et al., 2024). In our case, we provide the agent with 3 human-written plans (shown in Appendix ˜ I). By executing these plans, our agent can experience items and their dependencies, thereby bootstrapping the dependency learning process.
### E.2 Details in dependency graph initialization
Keeping ADG acyclic during initialization
During initialization, XENON prevents cycles in ADG algorithmically and maintains ADG as a directed acyclic graph, by, whenever adding an LLM-predicted requirement set for an item, discarding any set that would make a cycle and instead assign an empty requirement set to that item. Specifically, we identify and prevent cycles in three steps when adding LLM-predicted incoming edges for an item $v$ . First, we tentatively insert the LLM-predicted incoming edges of $v$ into the current ADG. Second, we detect cycles by checking whether any of $v$ ’s parents now appears among $v$ ’s descendants in the updated graph. Third, if a cycle is detected, we discard the LLM-predicted incoming edges for $v$ and instead assign an empty set of incoming edges to $v$ in the ADG.
Pseudocode is shown in Algorithm ˜ 2. The prompt is shown in Figure ˜ 15.
1
input : Goal items $V_0$ , (optional) human written plans $P_0$
output : Initialized dependency graph $\hat{G}=(\hat{V},\hat{E})$ , experienced items $V$
2
3 Initialize a set of known items $\hat{V}←V_0$ , edge set $\hat{E}←∅$
4 Initialize a set of experienced items $V←∅$
5
6 foreach plan in $P_0$ do
7 Execute the plan and get experienced items and their experienced requirement sets $\bigl\{(v_n,R_exp(v_n))\bigr\}_n=1^N$
8 foreach $(v,R_exp(v))∈\bigl\{(v_n,R_exp(v_n))\bigr\}_n=1^N$ do
9 if $v∉V$ then
/* graph update from Appendix ˜ C */
10 $V←V∪\{v\}$ , $\hat{V}←\hat{V}∪\{v\}$
11 Add edges to $\hat{E}$ according to $R_exp(v)$
12
13
/* Graph construction using LLM predictions */
14 while $∃ v∈\hat{V}∖V$ whose requirement set $R(v)$ has not yet been predicted by the LLM do
15 Select such an item $v∈\hat{V}∖V$ (i.e., $R(v)$ has not yet been predicted)
16 Select $V_K⊆V$ based on Top-K semantic similarity to $v$ , $|V_K|=K$
17 Predict $R(v)← LLM(v,\{\big(u,R(u,\hat{G})\big)\}_u∈V_K)$
18
19 foreach $(u_j,q_j)∈R(v)$ do
20 $\hat{E}←\hat{E}∪\{(u_j,q_j,v)\}$
21 if $u_j∉\hat{V}$ then
22 $\hat{V}←\hat{V}∪\{u_j\}$
23
24
25
Algorithm 2 GraphInitialization
⬇
1 You are a professional game analyst. For a given < item _ name >, you need to make < required _ items > to get the item.
2 If you make < required _ items > well, I will give you 1 $.
3
4 I will give you some examples < item _ name > and < required _ items >.
5
6 [Example] % TopK similar experienced items are given as examples
7 < item _ name >: {experienced _ item}
8 < required _ items >: {experienced _ requirement _ set}
9
10 [Your turn]
11 Here is a item name, you MUST output < required _ items > in JSON format. Remember < required _ items > MUST be in JSON format.
12
13 < item _ name >: {item _ name}
14 < required _ items >:
Figure 15: Prompt for requirement set prediction for dependency graph initialization
### E.3 Pseudocode of RevisionByAnalogy
Pseudocode is shown in Algorithm ˜ 3.
1
input : Dependency graph $\hat{G}=(\hat{V},\hat{E})$ , an item to revise $v$ , exploration counts $C[·]$ , inadmissible item threshold $c_0$ , less-explored item scale $α_s$ , inadmissible item scale $α_i$
output : Revised dependency graph $\hat{G}=(\hat{V},\hat{E})$ , exploration counts $C[·]$
2
3 Consider cases based on $C[v]$ :
4 if $C[v]>c_0$ then
/* $v$ is inadmissible */
5
/* resource set: items previously consumed for crafting other items */
6 $R(v)←\{(u,α_i)\mid u∈``resource'' set\}$
/* Remove all incoming edges to $v$ in $\hat{E}$ and add new edges */
7 $\hat{E}←\hat{E}∖\{(x,q,v)\mid(x,q,v)∈\hat{E}\}$
8 foreach $(u,α_i)∈R(v)$ do
9 $\hat{E}←\hat{E}∪\{(u,α_i,v)\}$
10
11
/* Revise requirement sets of descendants of $v$ */
12 Find the set of all descendants of $v$ in $\hat{G}$ (excluding $v$ ): $W←FindAllDescendants(v,\hat{G})$
13
14 for each item $w$ in $W$ do
15 Invoke RevisionByAnalogy for $w$
16
17
18 else
/* $v$ is less explored yet. Revise based on analogy */
19 Find similar successfully obtained items $V_K⊆\hat{V}$ based on Top-K semantic similarity to $v$
20
Candidate items $U_cand←\{u\mid∃ w∈V_K,(u,·,w)∈\hat{E}\}$ /* all items required to obtain similar successfully obtained items $V_K$ */
21
22 Start to construct a requirement set, $R(v)←∅$
23 for each item $u$ in $U_cand$ do
24 if $u$ is in “resource” set then
25 Add $(u,α_s× C[v])$ to $R(v)$
26
27 else
28 Add $(u,1)$ to $R(v)$
29
30
31 Update $\hat{G}$ : Remove all incoming edges to $v$ in $\hat{E}$ , and add new edges $(u,q,v)$ to $\hat{E}$ for each $(u,q)∈R(v)$
32
33
Algorithm 3 RevisionByAnalogy
## Appendix F Step-by-step planning using FAM
Given a sequence of aggregated requirements $((q_l,v_l))_l=1^L$ , XENON employs a step-by-step planning approach, iteratively selecting an high-level action $a_l$ for each requirement item $v_l$ to make a subgoal $(a_l,q_l,v_l)$ . This process considers the past attempts to obtain $v_l$ using specific actions. Specifically, for a given item $v_l$ , if FAM has an empirically valid action, XENON reuses it without prompting the LLM. Otherwise, XENON prompts the LLM to select an action, leveraging information from (i) valid actions for items semantically similar to $v_l$ , (ii) empirically invalid actions for $v_l$ .
The pseudocode for this action selection process is detailed in Algorithm ˜ 4. The prompt is shown in Figure ˜ 16.
1
Input : An item $v$ , Action set $A$ , Success/Failure counts from FAM $S(·,·)$ and $F(·,·)$ , Invalid action threshold $x_0$
Output : Selected action $a_selected$
2
/* 1. Classify actions based on FAM history (S and F counts) */
3 $A^valid_v←\{a∈A\mid S(a,v)>0∧ S(a,v)>F(a,v)-x_0\}$
4 $A^invalid_v←\{a∈A\mid F(a,v)≥ S(a,v)+x_0\}$
5
6 if $A^valid_v≠∅$ then
/* Reuse the empirically valid action if it exists */
7 Select $a_selected$ from $A^valid_v$
8 return $a_selected$
9
10 else
/* Otherwise, query LLM with similar examples and filtered candidates */
11
/* (i) Retrieve valid actions from other items for examples */
12 $V_source←\{u∈\hat{V}∖\{v\}\mid∃ a^\prime,S(a^\prime,u)>0∧ S(a^\prime,u)>F(a^\prime,u)-x_0\}$
13 Identify $V_topK⊆V_source$ as the $K$ items most similar to $v$ (using S-BERT)
14 $D_examples←\{(u,a_valid)\mid u∈V_topK,a_valid∈A^valid_u\}$
15
/* (ii) Prune invalid actions to form candidates */
16 $A^cand_v←A∖A^invalid_v$
17
18 if $A^cand_v=∅$ then
19 $A^cand_v←A$
20
21 $a_selected←LLM(v,D_examples,A^cand_v)$
22 return $a_selected$
23
Algorithm 4 Step-by-step Planning with FAM
⬇
1 For an item name, you need to make a plan, by selecting one among provided options.
2 I will give you examples of which plans are needed to achieve an item, just for reference.
3
4 % Similar items and their successful plans are given
5 [Example]
6 < item name >
7 {similar _ item}
8 < task planning >
9 {successful _ plan}
10
11 [Your turn]
12 Here is < item name >, you MUST select one from below < options >, to make < task planning >.
13 you MUST select one from below < options >. DO NOT MAKE A PLAN NOT IN < options >.
14
15 % Three actions are given, excluding any that were empirically invalid
16 < options >:
17 1: {" task ": " dig down and mine {item}", " goal ": [{item}, {quantity}]}
18 2: {" task ": " craft {item}", " goal ": [{item}, {quantity}]}
19 3: {" task ": " smelt {item}", " item ": [{item}, {quantity}}
20
21 < item name >
22 {item}
23 < task planning >
Figure 16: Prompt for action selection
## Appendix G Difficulty-based Exploration (DEX)
For autonomous dependency learning, we introduce DEX. DEX strategically selects items that (1) appear easier to obtain, prioritizing those (2) under-explored for diversity and (3) having fewer immediate prerequisite items according to the learned graph $\hat{G}$ . (line 5 in Algorithm ˜ 1). First, DEX defines the previously unobtained items but whose required items are all obtained according to learned dependency $\hat{G}$ as the frontier $F$ . Next, the least explored frontier set $F_min\coloneqq\{f∈ F\mid C(f)=\min_f^\prime∈ FC(f^\prime)\}$ is identified, based on revision counts $C(·)$ . For items $f^\prime∈F_min$ , difficulty $D(f^\prime)$ is estimated as $L_f^\prime$ , the number of distinct required items needed to obtain $f^\prime$ according to $\hat{G}$ . The intrinsic goal $g$ is then selected as the item in $F_min$ with the minimum estimated difficulty: $g=\arg\min_f^\prime∈F_minD(f^\prime)$ . Ties are broken uniformly at random.
While our frontier concept is motivated by DECKARD (Nottingham et al., 2023), DEX’s selection process differs significantly. DECKARD selects randomly from $\{v∈F\mid C(v)≤ c_0\}$ , but if this set is empty, it selects randomly from the union of frontier set and previously obtained item set. This risks inefficient attempts on already obtained items. In contrast, DEX exclusively selects goals from $F_min$ , inherently avoiding obtained items. This efficiently guides exploration towards achievable, novel dependencies.
## Appendix H Context-aware Reprompting (CRe)
Minecraft, a real-world-like environment can lead to situations where the controller stalls (e.g., when stuck in deep water or a cave). To assist the controller, the agent provides temporary prompts to guide it (e.g., "get out of the water and find trees"). XENON proposes a context-aware reprompting scheme. It is inspired by Optimus-1 Li et al. (2024b) but introduces two key differences:
1. Two-stage reasoning. When invoked, in Optimus-1, LLM simultaneously interprets image observations, decides whether to reprompt, and generates new prompts. XENON decomposes this process into two distinct steps:
1. the LLM generates a caption for the current image observation, and
1. using text-only input (the generated caption and the current subgoal prompt), the LLM determines if reprompting is necessary and, if so, produces a temporary prompt.
1. Trigger. Unlike Optimus-1, which invokes the LLM at fixed intervals, XENON calls the LLM only if the current subgoal item has not been obtained within that interval. This approach avoids unnecessary or spurious interventions from a smaller LLM.
The prompt is shown in Figure ˜ 17.
⬇
1 % Prompt for the first step: image captioning
2 Given a Minecraft game image, describe nearby Minecraft objects, like tree, grass, cobblestone, etc.
3 [Example]
4 " There is a large tree with dark green leaves surrounding the area."
5 " The image shows a dark, cave - like environment in Minecraft. The player is digging downwards. There are no visible trees or grass in this particular view."
6 " The image shows a dark, narrow tunnel made of stone blocks. The player is digging downwards."
7 [Your turn]
8 Describe the given image, simply and clearly like the examples.
9
10 % Prompt for the second step: reasoning whether reprompting is needed or not
11 Given < task > and < visual _ description >, determine if the player needs intervention to achieve the goal. If intervention is needed, suggest a task that the player should perform.
12 I will give you examples.
13 [Example]
14 < task >: chop tree
15 < visual _ description >: There is a large tree with dark green leaves surrounding the area.
16 < goal _ item >: logs
17 < reasoning >:
18 {{
19 " need _ intervention ": false,
20 " thoughts ": " The player can see a tree and can chop it down to get logs.",
21 " task ": "",
22}}
23 [Example]
24 < task >: chop tree
25 < visual _ description >: The image shows a dirt block in Minecraft. There is a tree in the image, but it is too far from here.
26 < goal _ item >: logs
27 < reasoning >:
28 {{
29 " need _ intervention ": true,
30 " thoughts ": " The player is far from trees. The player needs to move to the trees.",
31 " task ": " explore to find trees ",
32}}
33 [Example]
34 < task >: dig down to mine iron _ ore
35 < visual _ description >: The image shows a dark, narrow tunnel made of stone blocks. The player is digging downwards.
36 < goal _ item >: iron _ ore
37 < reasoning >:
38 {{
39 " need _ intervention ": false,
40 " thoughts ": " The player is already digging down and is likely to find iron ore.",
41 " task ": "",
42}}
43 [Your turn]
44 Here is the < task >, < visual _ description >, and < goal _ item >.
45 You MUST output the < reasoning > in JSON format.
46 < task >: {task} % current prompt for the controller
47 < visual _ description >: {visual _ description} % caption from the step 1
48 < goal _ item >: {goal _ item} % current subgoal item
49 < reasoning >:
Figure 17: Prompt for context-aware reprompting
## Appendix I Implementation details
To identify similar items, semantic similarity between two items is computed as the cosine similarity of their Sentence-BERT (all-MiniLM-L6-v2 model) embeddings (Reimers and Gurevych, 2019). This metric is utilized whenever item similarity comparisons are needed, such as in Algorithm ˜ 2, Algorithm ˜ 3, and Algorithm ˜ 4.
### I.1 Hyperparameters
Table 7: Hyperparameters used in our experiments.
| Hyperparameter | Notation | Value |
| --- | --- | --- |
| Failure threshold for invalid action | $x_0$ | $2$ |
| Revision count threshold for inadmissible items | $c_0$ | $3$ |
| Required items quantity scale for less explored items | $α_s$ | $2$ |
| Required items quantity scale for inadmissible items | $α_i$ | $8$ |
| Number of top-K similar experienced items used | $K$ | $3$ |
For all experiments, we use consistent hyperparameters across environments. The hyperparameters, whose values are determined with mainly considering robustness against imperfect controllers. All hyperparameters are listed in Table ˜ 7. The implications of increasing each hyperparameter’s value are detailed below:
- $x_0$ (failure threshold for empirically invalid action): Prevents valid actions from being misclassified as invalid due to accidental failures from an imperfect controller or environmental stochasticity. Values that are too small or large hinder dependency learning and planning by hampering the discovery of valid actions.
- $c_0$ (exploration count threshold for inadmissible items): Ensures an item is sufficiently attempted before being deemed ’inadmissible’ and triggering a revision for its descendants. Too small/large values could cause inefficiency; small values prematurely abandon potentially correct LLM predictions for descendants, while large values prevent attempts on descendant items.
- $α_s$ (required items quantity scale for less explored items): Controls the gradual increase of required quantities for revised required items. Small values make learning inefficient by hindering item obtaining due to insufficient required items, yet large values lower robustness by overburdening controllers with excessive quantity demands.
- $α_i$ (required items quantity scale for inadmissible items): Ensures sufficient acquisition of potential required items before retrying inadmissible items to increase the chance of success. Improper values reduce robustness; too small leads to failure in obtaining items necessitating many items; too large burdens controllers with excessive quantity demands.
- $K$ (Number of similar items to retrieve): Determines how many similar, previously successful experiences are retrieved to inform dependency revision (Algorithm ˜ 3) and action selection (Algorithm ˜ 4).
### I.2 Human-written plans
We utilize three human-written plans (for iron sword, golden sword, and diamond, shown in Plan 18, 19, and 20, respectively), the format of which is borrowed from the human-written plan examples in the publicly released Optimus-1 repository https://github.com/JiuTian-VL/Optimus-1/blob/main/src/optimus1/example.py. We leverage the experiences gained from executing these plans to initialize XENON’s knowledge.
⬇
1 iron_sword: str = "" "
2 <goal>: craft an iron sword.
3 <requirements>:
4 1. log: need 7
5 2. planks: need 21
6 3. stick: need 5
7 4. crafting_table: need 1
8 5. wooden_pickaxe: need 1
9 6. cobblestone: need 11
10 7. furnace: need 1
11 8. stone_pickaxe: need 1
12 9. iron_ore: need 2
13 10. iron_ingot: need 2
14 11. iron_sword: need 1
15 <plan>
16 {
17 " step 1 ": {" prompt ": " mine logs ", " item ": [" logs ", 7]},
18 " step 2 ": {" prompt ": " craft planks ", " item ": [" planks ", 21]},
19 " step 3 ": {" prompt ": " craft stick ", " item ": [" stick ", 5]},
20 " step 4 ": {" prompt ": " craft crafting_table ", " item ": [" crafting_table ", 1]},
21 " step 5 ": {" prompt ": " craft wooden_pickaxe ", " item ": [" wooden_pickaxe ", 1]},
22 " step 6 ": {" prompt ": " mine cobblestone ", " item ": [" cobblestone ", 11]},
23 " step 7 ": {" prompt ": " craft furnace ", " item ": [" furnace ", 1]},
24 " step 8 ": {" prompt ": " craft stone_pickaxe ", " item ": [" stone_pickaxe ", 1]},
25 " step 9 ": {" prompt ": " mine iron_ore ", " item ": [" iron_ore ", 2]},
26 " step 10 ": {" prompt ": " smelt iron_ingot ", " item ": [" iron_ingot ", 2]},
27 " step 11 ": {" prompt ": " craft iron_sword ", " item ": [" iron_sword ", 1]}
28}
29 " ""
Figure 18: Human-written plan for crafting an iron sword.
⬇
1 golden_sword: str = "" "
2 <goal>: craft a golden sword.
3 <requirements>:
4 1. log: need 9
5 2. planks: need 27
6 3. stick: need 7
7 4. crafting_table: need 1
8 5. wooden_pickaxe: need 1
9 6. cobblestone: need 11
10 7. furnace: need 1
11 8. stone_pickaxe: need 1
12 9. iron_ore: need 3
13 10. iron_ingot: need 3
14 11. iron_pickaxe: need 1
15 12. gold_ore: need 2
16 13. gold_ingot: need 2
17 14. golden_sword: need 1
18 <plan>
19 {
20 " step 1 ": {" prompt ": " mine logs ", " item ": [" logs ", 7]},
21 " step 2 ": {" prompt ": " craft planks ", " item ": [" planks ", 21]},
22 " step 3 ": {" prompt ": " craft stick ", " item ": [" stick ", 5]},
23 " step 4 ": {" prompt ": " craft crafting_table ", " item ": [" crafting_table ", 1]},
24 " step 5 ": {" prompt ": " craft wooden_pickaxe ", " item ": [" wooden_pickaxe ", 1]},
25 " step 6 ": {" prompt ": " mine cobblestone ", " item ": [" cobblestone ", 11]},
26 " step 7 ": {" prompt ": " craft furnace ", " item ": [" furnace ", 1]},
27 " step 8 ": {" prompt ": " craft stone_pickaxe ", " item ": [" stone_pickaxe ", 1]},
28 " step 9 ": {" prompt ": " mine iron_ore ", " item ": [" iron_ore ", 3]},
29 " step 10 ": {" prompt ": " smelt iron_ingot ", " item ": [" iron_ingot ", 3]},
30 " step 11 ": {" task ": " craft iron_pickaxe ", " goal ": [" iron_pickaxe ", 1]},
31 " step 12 ": {" prompt ": " mine gold_ore ", " item ": [" gold_ore ", 2]},
32 " step 13 ": {" prompt ": " smelt gold_ingot ", " item ": [" gold_ingot ", 2]},
33 " step 14 ": {" task ": " craft golden_sword ", " goal ": [" golden_sword ", 1]}
34}
35 " ""
Figure 19: Human-written plan for crafting a golden sword.
⬇
1 diamond: str = "" "
2 <goal>: mine a diamond.
3 <requirements>:
4 1. log: need 7
5 2. planks: need 21
6 3. stick: need 6
7 4. crafting_table: need 1
8 5. wooden_pickaxe: need 1
9 6. cobblestone: need 11
10 7. furnace: need 1
11 8. stone_pickaxe: need 1
12 9. iron_ore: need 3
13 10. iron_ingot: need 3
14 11. iron_pickaxe: need 1
15 12. diamond: need 1
16 <plan>
17 {
18 " step 1 ": {" prompt ": " mine logs ", " item ": [" logs ", 7]},
19 " step 2 ": {" prompt ": " craft planks ", " item ": [" planks ", 21]},
20 " step 3 ": {" prompt ": " craft stick ", " item ": [" stick ", 5]},
21 " step 4 ": {" prompt ": " craft crafting_table ", " item ": [" crafting_table ", 1]},
22 " step 5 ": {" prompt ": " craft wooden_pickaxe ", " item ": [" wooden_pickaxe ", 1]},
23 " step 6 ": {" prompt ": " mine cobblestone ", " item ": [" cobblestone ", 11]},
24 " step 7 ": {" prompt ": " craft furnace ", " item ": [" furnace ", 1]},
25 " step 8 ": {" prompt ": " craft stone_pickaxe ", " item ": [" stone_pickaxe ", 1]},
26 " step 9 ": {" prompt ": " mine iron_ore ", " item ": [" iron_ore ", 2]},
27 " step 10 ": {" prompt ": " smelt iron_ingot ", " item ": [" iron_ingot ", 2]},
28 " step 11 ": {" prompt ": " craft iron_pickaxe ", " item ": [" iron_pickaxe ", 1]},
29 " step 12 ": {" prompt ": " mine diamond ", " item ": [" diamond ", 1]}
30}
31 " ""
Figure 20: Human-written plan for mining a diamond.
## Appendix J Details for experimental setup
### J.1 Compared baselines for dependency learning
We compare our proposed method, XENON, against four baselines: LLM self-correction (SC), DECKARD Nottingham et al. (2023), ADAM (Yu and Lu, 2024), and RAND (the simplest baseline). As no prior baselines were evaluated under our specific experimental setup (i.e., empty initial inventory, pre-trained low-level controller), we adapted their implementation to align with our environment. SC is implemented following common methods that prompt the LLM to correct its own knowledge upon plan failures (Shinn et al., 2023; Stechly et al., 2024). A summary of all methods compared in our experiments is provided in Table ˜ 8. All methods share the following common experimental setting: each episode starts with an initial experienced requirements for some items, derived from human-written plans (details in Appendix ˜ I). Additionally, all agents begin each episode with an initial empty inventory.
Table 8: Summary of methods compared in our experiments.
$$
× \tag{2024}
$$
LLM self-correction (SC)
While no prior work specifically uses LLM self-correction to learn Minecraft item dependencies in our setting, we include this baseline to demonstrate the unreliability of this approach. For predicted requirements, similar to XENON, SC initializes its dependency graph with LLM-predicted requirements for each item. When a plan for an item fails repeatedly, it attempts to revise the requirements using LLM. SC prompts the LLM itself to perform the correction, providing it with recent trajectories and the validated requirements of similar, previously obtained items in the input prompt. SC’s action memory stores both successful and failed actions for each item. Upon a plan failure, the LLM is prompted to self-reflect on the recent trajectory to determine the cause of failure. When the agent later plans to obtain an item on which it previously failed, this reflection is included in the LLM’s prompt to guide its action selection. Intrinsic goals are selected randomly from the set of previously unobtained items. The specific prompts used for the LLM self-correction and self-reflection in this baseline are provided in Appendix ˜ B.
DECKARD
The original DECKARD utilizes LLM-predicted requirements for each item but does not revise these initial predictions. It has no explicit action memory for the planner; instead, it trains and maintains specialized policies for each obtained item. It selects an intrinsic goal randomly from less explored frontier items (i.e., $\{v∈F\mid C(v)≤ c_0\}$ ). If no such items are available, it selects randomly from the union of experienced items and all frontier items.
In our experiments, the DECKARD baseline is implemented to largely mirror the original version, with the exception of its memory system. Its memory is implemented to store only successful actions without recording failures. This design choice aligns with the original DECKARD’s approach, which, by only learning policies for successfully obtained items, lacks policies for unobtained items.
ADAM
The original ADAM started with an initial inventory containing 32 quantities of experienced resource items (i.e., items used for crafting other items) and 1 quantity of tool items (e.g., pickaxes, crafting table), implicitly treating those items as a predicted requirement set for each item. Its memory recorded which actions were used for each subgoal item without noting success or failure, and its intrinsic goal selection was guided by an expert-defined exploration curriculum.
In our experiments, ADAM starts with an empty initial inventory. The predicted requirements for each goal item in our ADAM implementation assume a fixed quantity of 8 for all resource items. This quantity was chosen to align with $α_i$ , the hyperparameter for the quantity scale of requirement items for inadmissible items, thereby ensuring a fair comparison with XENON. The memory stores successful actions for each item, but did not record failures. This modification aligns the memory mechanism with SC and DECKARD baselines, enabling a more consistent comparison across baselines in our experimental setup. Intrinsic goal selection is random, as we do not assume such an expert-defined exploration curriculum.
RAND
RAND is a simple baseline specifically designed for our experimental setup. It started with an empty initial inventory and an LLM-predicted requirement set for each item. RAND did not incorporate any action memory. Its intrinsic goal selection involved randomly selecting from unexperienced items.
### J.2 MineRL environment
#### J.2.1 Basic rules
Minecraft has been adopted as a suitable testbed for validating performance of AI agents on long-horizon tasks (Mao et al., 2022; Lin et al., 2021; Baker et al., 2022; Li et al., 2025a), largely because of the inherent dependency in item acquisition where agents must obtain prerequisite items before more advanced ones. Specifically, Minecraft features multiple technology levels—including wood, stone, iron, gold, diamond, etc. —which dictate item and tool dependencies. For instance, an agent must first craft a lower-level tool like a wooden pickaxe to mine materials such as stone. Subsequently, a stone pickaxe is required to mine even higher-level materials like iron. An iron pickaxe is required to mine materials like gold and diamond. Respecting the dependency is crucial for achieving complex goals, such as crafting an iron sword or mining a diamond.
#### J.2.2 Observation and action space
First, we employ MineRL (Guss et al., 2019) with Minecraft version 1.16.5.
Observation
When making a plan, our agent receives inventory information (i.e., item with their quantities) as text. When executing the plan, our agent receives an RGB image with dimensions of $640× 360$ , including the hotbar, health indicators, food saturation, and animations of the player’s hands.
Action space
Following Optimus-1 (Li et al., 2024b), our low-level action space primarily consists of keyboard and mouse controls, except for craft and smelt high-level actions. Crucially, craft and smelt actions are included into our action space, following (Li et al., 2024b). This means these high-level actions automatically succeed in producing an item if the agent possesses all the required items and a valid actions for that item is chosen; otherwise, they fail. This abstraction removes the need for complex, precise low-level mouse control for these specific actions. For low-level controls, keyboard presses control agent movement (e.g., jumping, moving forward, backward) and mouse movements control the agent’s perspective. The mouse’s left and right buttons are used for attacking, using, or placing items. The detailed action space is described in Table ˜ 9.
Table 9: Action space in MineRL environment
| Index | Action | Human Action | Description |
| --- | --- | --- | --- |
| 1 | Forward | key W | Move forward. |
| 2 | Back | key S | Move back. |
| 3 | Left | key A | Move left. |
| 4 | Right | key D | Move right. |
| 5 | Jump | key Space | Jump. When swimming, keeps the player afloat. |
| 6 | Sneak | key left Shift | Slowly move in the current direction of movement. |
| 7 | Sprint | key left Ctrl | Move quickly in the direction of current movement. |
| 8 | Attack | left Button | Destroy blocks (hold down); Attack entity (click once). |
| 9 | Use | right Button | Place blocks, entity, open items or other interact actions defined by game. |
| 10 | hotbar [1-9] | keys 1-9 | Selects the appropriate hotbar item. |
| 11 | Open/Close Inventory | key E | Opens the Inventory. Close any open GUI. |
| 12 | Yaw | move Mouse X | Turning; aiming; camera movement.Ranging from -180 to +180. |
| 13 | Pitch | move Mouse Y | Turning; aiming; camera movement.Ranging from -180 to +180. |
| 14 | Craft | - | Execute crafting to obtain new item |
| 15 | Smelt | - | Execute smelting to obtain new item. |
#### J.2.3 Goals
We consider 67 goals from the long-horizon tasks benchmark suggested in (Li et al., 2024b). These goals are categorized into 7 groups based on Minecraft’s item categories: Wood
<details>
<summary>x31.png Details</summary>

### Visual Description
Icon/Small Image (20x20)
</details>
, Stone
<details>
<summary>x32.png Details</summary>

### Visual Description
Icon/Small Image (20x20)
</details>
, Iron
<details>
<summary>x33.png Details</summary>

### Visual Description
Icon/Small Image (20x20)
</details>
, Gold
<details>
<summary>x34.png Details</summary>

### Visual Description
Icon/Small Image (20x20)
</details>
, Diamond
<details>
<summary>x35.png Details</summary>

### Visual Description
Icon/Small Image (20x20)
</details>
, Redstone
<details>
<summary>x36.png Details</summary>

### Visual Description
Icon/Small Image (20x20)
</details>
, and Armor
<details>
<summary>x37.png Details</summary>

### Visual Description
Icon/Small Image (20x20)
</details>
. All goal items within each group are listed in Table ˜ 10.
Table 10: Setting of 7 groups encompassing 67 Minecraft long-horizon goals.
| Group | Goal Num. | All goal items |
| --- | --- | --- |
|
<details>
<summary>x38.png Details</summary>

### Visual Description
Icon/Small Image (20x20)
</details>
Wood | 10 | bowl, crafting_table, chest, ladder, stick, wooden_axe, wooden_hoe, wooden_pickaxe, wooden_shovel, wooden_sword |
|
<details>
<summary>x39.png Details</summary>

### Visual Description
Icon/Small Image (20x20)
</details>
Stone | 9 | charcoal, furnace, smoker, stone_axe, stone_hoe, stone_pickaxe, stone_shovel, stone_sword, torch |
|
<details>
<summary>x40.png Details</summary>

### Visual Description
Icon/Small Image (20x20)
</details>
Iron | 16 | blast_furnace, bucket, chain, hopper, iron_axe, iron_bars, iron_hoe, iron_nugget, iron_pickaxe, iron_shovel, iron_sword, rail, shears, smithing_table, stonecutter, tripwire_hook |
|
<details>
<summary>x41.png Details</summary>

### Visual Description
Icon/Small Image (20x20)
</details>
Gold | 6 | gold_ingot, golden_axe, golden_hoe, golden_pickaxe, golden_shovel, golden_sword |
|
<details>
<summary>x42.png Details</summary>

### Visual Description
Icon/Small Image (20x20)
</details>
Redstone | 6 | activator_rail, compass, dropper, note_block, piston, redstone_torch |
|
<details>
<summary>x43.png Details</summary>

### Visual Description
Icon/Small Image (20x20)
</details>
Diamond | 7 | diamond, diamond_axe, diamond_hoe, diamond_pickaxe, diamond_shovel, diamond_sword, jukebox |
|
<details>
<summary>x44.png Details</summary>

### Visual Description
Icon/Small Image (20x20)
</details>
Armor | 13 | diamond_boots, diamond_chestplate, diamond_helmet, diamond_leggings, golden_boots, golden_chestplate, golden_helmet, golden_leggings, iron_boots, iron_chestplate, iron_helmet, iron_leggings, shield |
Additional goals for scalability experiments.
To evaluate the scalability of XENON with respect to the number of goals Section ˜ K.9, we extend the above 67-goal set (Table ˜ 10) by adding additional goal items to construct two larger settings with 100 and 120 goals; the added goals are listed in Table 11.
Specifically, in the setting with 100 goals, we add 33 goals in total by introducing new “leather”, “paper”, and “flint” groups and by adding more items to the existing “wood” and “stone” groups. In the setting with 120 goals, we further add 20 goals in the “iron”, “gold”, “redstone”, and “diamond” groups.
Table 11: Additional goals used for the scalability experiments. The setting with 100 goals extends the 67-goal set in Table 10 by adding all items in the top block; the setting with 120 goals further includes both the top and bottom blocks.
| Group | Goal Num. | Added goal items |
| --- | --- | --- |
| Additional items in the setting with 100 goals (33 items) | | |
| leather | 7 | leather, leather_boots, leather_chestplate, leather_helmet, leather_leggings, leather_horse_armor, item_frame |
| paper | 5 | map, book, cartography_table, bookshelf, lectern |
| flint | 4 | flint, flint_and_steel, fletching_table, arrow |
| wood | 8 | bow, boat, wooden_slab, wooden_stairs, wooden_door, wooden_sign, wooden_fence, woodenfence_gate |
| stone | 9 | cobblestone_slab, cobblestone_stairs, cobblestone_wall, lever, stone_slab, stone_button, stone_pressure_plate, stone_bricks, grindstone |
| Additional items only in the setting with 120 goals (20 more items) | | |
| iron | 7 | iron_trapdoor, heavy_weighted_pressure_plate, iron_door, crossbow, minecart, cauldron, lantern |
| gold | 4 | gold_nugget, light_weighted_pressure_plate, golden_apple, golden_carrot |
| redstone | 7 | redstone, powered_rail, target, dispenser, clock, repeater, detector_rail |
| diamond | 2 | obsidian, enchanting_table |
#### J.2.4 Episode horizon
The episode horizon varies depending on the experiment phase: dependency learning or long-horizon goal planning. During the dependency learning phase, each episode has a fixed horizon of 36,000 steps. In this phase, if the agent successfully achieves an intrinsic goal within an episode, it is allowed to select another intrinsic goal and continue exploration without the episode ending. After dependency learning, when measuring the success rate of goals from the long-horizon task benchmark, the episode horizon differs based on the goal’s category group. And in this phase, the episode immediately terminates upon success of a goal. The specific episode horizons for each group are as follows: Wood: 3,600 steps; Stone: 7,200 steps; Iron: 12,000 steps; and Gold, Diamond, Redstone, and Armor: 36,000 steps each.
#### J.2.5 Item spawn probability details
Following Optimus-1’s public implementation, we have modified environment configuration different from original MineRL environment (Guss et al., 2019). In Minecraft, obtaining essential resources such as iron, gold, and diamond requires mining their respective ores. However, these ores are naturally rare, making them challenging to obtain. This inherent difficulty can significantly hinder an agent’s goal completion, even with an accurate plan. This challenge in resource gathering due to an imperfect controller is a common bottleneck, leading many prior works to employ environmental modifications to focus on planning. For example, DEPS (Wang et al., 2023b) restricts the controller’s actions based on the goal items https://github.com/CraftJarvis/MC-Planner/blob/main/controller.py. Optimus-1 (Li et al., 2024b) also made resource items easier to obtain by increasing item ore spawn probabilities. To focus on our primary goal of robust planning and isolate this challenge, we follow Optimus-1 and adopt its item ore spawn procedure directly from the publicly released Optimus-1 repository, without any modifications to its source code https://github.com/JiuTian-VL/Optimus-1/blob/main/src/optimus1/env/wrapper.py.
The ore spawn procedure probabilistically spawns ore blocks in the vicinity of the agent’s current coordinates $(x,y,z)$ . Specifically, at each timestep, the procedure has a 10% chance of activating. When activated, it spawns a specific type of ore block based on the agent’s y-coordinate. Furthermore, for any given episode, the procedure is not activate more than once at the same y-coordinate. The types of ore blocks spawned at different y-levels are as follows:
-
<details>
<summary>x45.png Details</summary>

### Visual Description
Icon/Small Image (20x20)
</details>
Coal Ore: between y=45 and y=50.
-
<details>
<summary>x46.png Details</summary>

### Visual Description
Icon/Small Image (20x20)
</details>
Iron Ore: between y=26 and y=43.
-
<details>
<summary>x47.png Details</summary>

### Visual Description
Icon/Small Image (20x20)
</details>
Gold Ore: between y=15 and y=26
-
<details>
<summary>x48.png Details</summary>

### Visual Description
Icon/Small Image (20x20)
</details>
Redstone Ore: between y=15 and y=26
-
<details>
<summary>x49.png Details</summary>

### Visual Description
Icon/Small Image (20x20)
</details>
Diamond Ore: below y=14
### J.3 Mineflayer Environment
We use the Mineflayer (PrismarineJS, 2023) environment with Minecraft version 1.19. In Mineflayer, resource item spawn probabilities do not need to be adjusted, unlike in MineRL Section ˜ J.2.5. This is because the controller, JavaScript APIs provided by Mineflayer, is competent to gather many resource items.
#### J.3.1 Observation and Action Space
The agent’s observation space is multimodal. For planning, the agent receives its current inventory (i.e., item names and their quantities) as text. For plan execution, it receives a first-person RGB image that includes the hotbar, health and food indicators, and player hand animations. For action space, following ADAM (Yu and Lu, 2024), we use the JavaScript APIs provided by Mineflayer for low-level control. Specifically, our high-level actions, such as “craft”, “smelt”, and “mine”, are mapped to corresponding Mineflayer APIs like craftItem, smeltItem, and mineBlock.
#### J.3.2 Episode Horizon
For dependency learning, each episode has a fixed horizon of 30 minutes, which is equivalent to 36,000 steps in the MineRL environment. If the agent successfully achieves a goal within this horizon, it selects another exploratory goal and continues within the same episode.
### J.4 MC-TextWorld
MC-Textworld is a text-based environment based on Minecraft game rules (Zheng et al., 2025). We employ Minecraft version 1.16.5. In this environment, basic rules and goals are the same as those in the MineRL environment Section ˜ J.2. Furthermore, resource item spawn probabilities do not need to be adjusted, unlike in MineRL Section ˜ J.2.5. This is because an agent succeeds in mining an item immediately without spatial exploration, if it has a required tool and “mine” is a valid action for that item.
In the following subsections, we detail the remaining aspects of experiment setups in this environment: the observation and action space, and the episode horizon.
#### J.4.1 Observation and action space
The agent receives a text-based observation consisting of inventory information (i.e., currently possessed items and their quantities). Actions are also text-based, where each action is represented as an high-level action followed by an item name (e.g., "mine diamond"). Thus, to execute a subgoal specified as $(a,q,v)$ (high-level action $a$ , quantity $q$ , item $v$ ), the agent repeatedly performs the action $(a,v)$ until $q$ units of $v$ are obtained.
#### J.4.2 Episode horizon
In this environment, we conduct experiments for dependency learning only. Each episode has a fixed horizon of 3,000 steps. If the agent successfully achieves an intrinsic goal within an episode, it is then allowed to select another intrinsic goal and continue exploration, without termination of the episode.
#### J.4.3 Perturbation on ground truth rules
<details>
<summary>x50.png Details</summary>
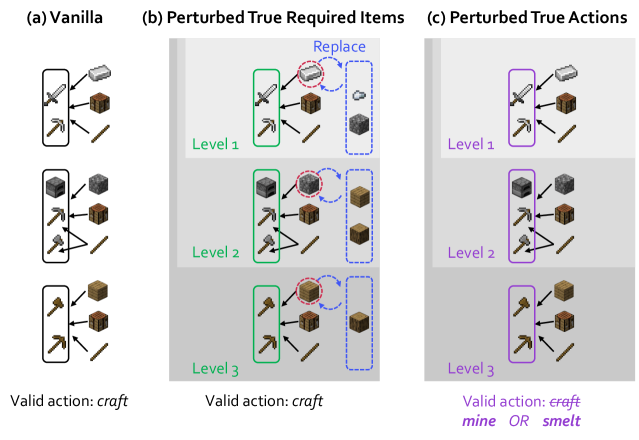
### Visual Description
## Diagram: Crafting System Perturbation Analysis
### Overview
The image is a technical diagram comparing three variations of a crafting system, likely from a game or simulation environment. It illustrates how "perturbations" (modifications) to either the required items or the allowed actions affect the validity of crafting recipes across three difficulty levels. The diagram is divided into three vertical panels labeled (a), (b), and (c).
### Components/Axes
The diagram is organized into three main panels, each with a header and a footer containing text.
**Panel Headers (Top of each column):**
* **(a) Vanilla**
* **(b) Perturbed True Required Items**
* **(c) Perturbed True Actions**
**Panel Footers (Bottom of each column):**
* **(a) Valid action: craft**
* **(b) Valid action: craft**
* **(c) Valid action: craft, mine OR smelt**
**Internal Structure:**
* **Panel (a):** Contains three vertically stacked rows of item diagrams. Each row shows a set of input items (e.g., swords, pickaxes, blocks) connected by arrows to a central crafting grid (a 2x2 square), indicating a recipe.
* **Panel (b):** Contains three rows, each labeled with a level on the left side: **Level 1**, **Level 2**, **Level 3**. Each row shows a modified version of the corresponding recipe from panel (a). Modifications are indicated by:
* **Green solid-line boxes:** Enclose the original, required items.
* **Blue dashed-line boxes:** Enclose the "perturbed" or replacement items.
* **Red dashed circles and arrows:** Highlight the specific item being replaced and point to its substitute.
* The word **"Replace"** is written in blue text at the top of the panel, with an arrow pointing to the first replacement example.
* **Panel (c):** Contains three rows, also labeled **Level 1**, **Level 2**, **Level 3**. Each row shows the same item sets as in panel (a), but the entire set of input items is enclosed in a **purple solid-line box**.
### Detailed Analysis
**Panel (a) - Vanilla:**
* **Level 1 Recipe:** Inputs appear to be a stone sword, a stone pickaxe, and a cobblestone block. They point to a crafting grid.
* **Level 2 Recipe:** Inputs appear to be a stone block, a stone pickaxe, and a cobblestone block.
* **Level 3 Recipe:** Inputs appear to be a stone pickaxe, a wooden pickaxe, and a wooden plank block.
* **Commonality:** All three recipes are valid for the single action: **craft**.
**Panel (b) - Perturbed True Required Items:**
* **Level 1:** The cobblestone block (in the green box) is replaced by a different block (possibly a furnace, in the blue box). The recipe remains valid only for **craft**.
* **Level 2:** The stone block (in the green box) is replaced by a different block (possibly a crafting table, in the blue box). The recipe remains valid only for **craft**.
* **Level 3:** The cobblestone block (in the green box) is replaced by a different block (possibly a chest, in the blue box). The recipe remains valid only for **craft**.
* **Trend:** The perturbation involves substituting one of the required material blocks with an alternative block, while the core action (**craft**) remains unchanged.
**Panel (c) - Perturbed True Actions:**
* **Levels 1, 2, and 3:** The item sets are visually identical to the vanilla recipes in panel (a). The key difference is the purple bounding box and the expanded list of valid actions in the footer.
* **Valid Actions:** The system now accepts **craft**, **mine**, **OR smelt** as valid actions for these item sets. This suggests the same configuration of items can be interpreted as the starting point for multiple different processes.
### Key Observations
1. **Action vs. Item Perturbation:** The diagram contrasts two types of system modifications. Panel (b) changes *what* is needed (the items), while panel (c) changes *what you can do* (the actions).
2. **Level Progression:** The three levels likely represent increasing complexity or different stages within the system, though the specific nature of the progression (e.g., difficulty, resource tier) is not explicitly defined.
3. **Visual Coding:** The diagram uses a consistent visual language: green for original/required elements, blue for perturbed items, red for the change operation, and purple for perturbed action sets.
4. **Action Generalization:** Panel (c) demonstrates a significant generalization where a single set of items becomes valid for multiple, distinct actions, increasing the flexibility or ambiguity of the system.
### Interpretation
This diagram is a conceptual model for analyzing the robustness or flexibility of a rule-based system, such as a game's crafting mechanic or an AI planning environment.
* **What it demonstrates:** It shows how the definition of a "valid" state (a craftable recipe) can be altered. In the vanilla state (a), validity is strict: specific items for one specific action. Perturbations can either relax the *input requirements* (b) by allowing substitutions, or relax the *output/action mapping* (c) by allowing the same inputs to trigger different processes.
* **Relationship between elements:** The three panels are directly comparable. Each row across the panels represents the same conceptual "level" or problem instance under different rule sets. The arrows and boxes explicitly map the transformation from the vanilla state to the perturbed states.
* **Implications:** This type of analysis is crucial for designing systems that are either **resilient** (can handle incorrect or substituted inputs, as in b) or **versatile** (can support multiple outcomes from the same starting point, as in c). It could be used to test AI agents, balance game difficulty, or study how changes to rules affect problem-solving strategies. The "Perturbed True" phrasing suggests these are intentional, known modifications to a ground-truth system, likely for experimental or diagnostic purposes.
</details>
Figure 21: Illustration of the ground-truth rule perturbation settings. (a) in the vanilla setting, goal items (black boxes) have standard required items (incoming edges) and “craft” is the valid action; (b) in the Perturbed Requirements setting, one required item (red dashed circle) is replaced by a new one randomly from a candidate pool (blue dashed box); (c) in the Perturbed Actions setting, the valid action is changed to either “mine” or “smelt”.
To evaluate each agent’s robustness to conflicts with its prior knowledge, we perturb the ground-truth rules (required items and actions) for a subset of goal items, as shown in Figure ˜ 21. The perturbation is applied at different intensity levels (from 1 to 3), where higher levels affect a greater number of items. These levels are cumulative, meaning a Level 2 perturbation includes all perturbations from Level 1 plus additional ones.
- Vanilla Setting: In the setting with no perturbation (Figure ˜ 21, a), the ground-truth rules are unmodified. In the figure, items in the black solid boxes are the goal items, and those with arrows pointing to them are their true required items. Each goal item has “craft” as a valid action.
- Perturbed True Required Items: In this setting (Figure ˜ 21, b), one of the true required items (indicated by a red dashed circle) for a goal is replaced. The new required item is chosen uniformly at random from a candidate pool (blue dashed box). The valid action remains craft.
- Perturbed True Actions: In this setting (Figure ˜ 21, c), the valid action for a goal is randomly changed from “craft” to either “mine” or “smelt”. The required items are not modified.
- Perturbed Both Rules: In this setting, both the required items and the valid actions are modified according to the rules described above.
## Appendix K Additional experimental results
### K.1 LLM-predicted initial dependency graph analysis
Table 12: Performance analysis for the initial LLM-predicted requirement sets over 75 Minecraft items, used to build the initial dependency graph. Note that while we began the prediction process with 67 goal items, the total number of predicted items expanded to 75. This expansion occurred because, as the LLM predicted requirement sets for items in the dependency graph (initially for those goal items), any newly mentioned items that were not yet part of the graph are also included. This iterative process is detailed in Section ˜ 4.1 (Dependency graph initialization) of our method.
| Metric | Value |
| --- | --- |
| Requirement Set Prediction Accuracy | |
| Correct items (ignoring quantities) | 23% |
| Exact items & quantities | 8% |
| Non-existent Item Rates | |
| Non-existent items | 8% |
| Descendants of non-existent items | 23% |
| Required Items Errors | |
| Unnecessary items included | 57% |
| Required items omitted | 57% |
| Required Item Quantity Prediction Errors | |
| Standard deviation of quantity error | 2.74 |
| Mean absolute quantity error | 2.05 |
| Mean signed quantity error | -0.55 |
The initial dependency graph, constructed from predictions by Qwen2.5-VL-7B (Bai et al., 2025), forms the initial planning knowledge for XENON (Section ˜ 4.1). This section analyzes its quality, highlighting limitations that necessitate our adaptive dependency learning.
As shown in Table ˜ 12, the 7B LLM’s initial requirement sets exhibit significant inaccuracies. Accuracy for correct item types was 23%, dropping to 8% for exact items and quantities. Errors in dependency among items are also prevalent: 57% of items included unnecessary items, and 57% omitted required items. Furthermore, 8% of predicted items were non-existent (hallucinated), making 23% of descendant items unattainable. Quantity predictions also showed substantial errors, with a mean absolute error of 2.05.
These results clearly demonstrate that the LLM-generated initial dependency graph is imperfect. Its low accuracy and high error rates underscore the unreliability of raw LLM knowledge for precise planning, particularly for smaller models like the 7B LLM which are known to have limited prior knowledge on Minecraft, as noted in previous work (ADAM, Yu and Lu (2024), Appendix A. LLMs’ Prior Knowledge on Minecraft). This analysis therefore highlights the importance of the adaptive dependency learning within XENON, which is designed to refine this initial, imperfect knowledge for robust planning.
Table 13: Ratio of dependencies learned for items which are unobtainable by the flawed initial dependency graph (out of 51). Analysis is based on the final learned graphs from the MineRL experiments.
| Agent | Learned ratio (initially unobtainable items) |
| --- | --- |
| XENON | 0.51 |
| SC | 0.25 |
| DECKARD | 0.25 |
| ADAM | 0.00 |
| RAND | 0.02 |
### K.2 Additional analysis of learned dependency graph
As shown in Table ˜ 13, XENON demonstrates significantly greater robustness to the LLM’s flawed prior knowledge compared to all baselines. It successfully learned the correct dependencies for over half (0.51) of the 51 items that were initially unobtainable by the flawed graph. In contrast, both DECKARD (with no correction) and the SC baseline (with LLM self-correction) learned only a quarter of these items (0.25). This result strongly indicates that relying on the LLM to correct its own errors is as ineffective as having no correction mechanism at all in this setting. The other baselines, ADAM and RAND, failed almost completely, highlighting the difficulty of this challenge.
### K.3 Impact of controller capacity on dependency learning
We observe that controller capacity significantly impacts an agent’s ability to learn dependencies from interaction. Specifically, in our MineRL experiments, we find that ADAM fails to learn any new dependencies due to the inherent incompatibility between its strategy and the controller’s limitations. In our realistic setting with empty initial inventories, ADAM’s strategy requires gathering a sufficient quantity (fixed at 8, same with our hyperparameter $α_i$ The scaling factor for required item quantities for inadmissible items.) of all previously used resources before attempting a new item. This list of required resource items includes gold ingot
<details>
<summary>x51.png Details</summary>

### Visual Description
Icon/Small Image (20x20)
</details>
, because of an initially provided human-written plan for golden sword; however, the controller STEVE-1 never managed to collect more than seven units of gold in a single episode across all our experiments. Consequently, this controller bottleneck prevents ADAM from ever attempting to learn new items, causing its dependency learning to stall completely.
Although XENON fails to learn dependencies for the Redstone group items in MineRL, our analysis shows this stems from controller limitations rather than algorithmic ones. Specifically, in MineRL, STEVE-1 cannot execute XENON’s exploration strategy for inadmissible items, which involves gathering a sufficient quantity of all previously used resources before a retry (Section ˜ 4.1). The Redstone group items become inadmissible because the LLM’s initial predictions for them are entirely incorrect. This lack of a valid starting point prevents XENON from ever experiencing the core item, redstone, being used as a requirement for any other item. Consequently, our RevisionByAnalogy mechanism has no analogous experience to propose redstone as a potential required item for other items during its revision process.
In contrast, with more competent controllers, XENON successfully overcomes even such severely flawed prior knowledge to learn the challenging Redstone group dependencies, as demonstrated in Mineflayer and MC-TextWorld. First, in Mineflayer, XENON learns the correct dependencies for 5 out of 6 Redstone items. This success is possible because its more competent controller can execute the exploration strategy for inadmissible items, which increases the chance of possessing the core required item (redstone) during resource gathering. Second, with a perfect controller in MC-TextWorld, XENON successfully learns the dependencies for all 6 Redstone group items in every single episode.
### K.4 Impact of Controller Capacity in Long-horizon Goal Planning
Table 14: Long-horizon task success rate (SR) comparison between the Modified MineRL (a setting where resource items are easier to obtain) and Standard MineRL environments. All methods are provided with the correct dependency graph. DEPS $†$ and Optimus-1 $†$ are our reproductions of the respective methods using Qwen2.5-VL-7B as a planner. OracleActionPlanner, which generates the correct plan for all goals, represents the performance upper bound. SR for Optimus-1 $†$ and XENON ∗ in the Modified MineRL column are taken from Table ˜ 3 in Section ˜ 5.3.
| Method | Dependency | Modified MineRL | Standard MineRL | | | | |
| --- | --- | --- | --- | --- | --- | --- | --- |
| Iron | Diamond | Gold | Iron | Diamond | Gold | | |
| DEPS $†$ | - | 0.02 | 0.00 | 0.01 | 0.01 | 0.00 | 0.00 |
| Optimus-1 $†$ | Oracle | 0.23 | 0.10 | 0.11 | 0.13 | 0.00 | 0.00 |
| XENON ∗ | Oracle | 0.83 | 0.75 | 0.73 | 0.24 | 0.00 | 0.00 |
| OracleActionPlanner | Oracle | - | - | - | 0.27 | 0.00 | 0.00 |
Because our work focuses on building a robust planner, to isolate the planning from the significant difficulty of item gathering—a task assigned to the controller—our main experiments for long-horizon tasks (Section ˜ 5.3) uses a modified MineRL environment following the official implementation of Optimus-1. This modification makes essential resource items like iron, gold, and diamond easier for the controller to find, allowing for a clearer evaluation of planning algorithms (modifications are detailed in Section ˜ J.2.5). However, to provide a more comprehensive analysis, we also evaluated our agent and baselines in the unmodified, standard MineRL environment. In this setting, items like iron, gold, and diamond are naturally rare, making item gathering a major bottleneck.
The results are shown in Table ˜ 14. Most importantly, XENON ∗ consistently outperforms the baselines in both the modified and standard MineRL. Notably, in the standard environment, XENON ∗ ’s performance on the Iron group (0.24 SR) is comparable to that of the OracleActionPlanner (0.27 SR), which always generates correct plans for all goals. This comparison highlights the severity of the controller bottleneck: even the OracleActionPlanner achieves a 0.00 success rate for the Diamond and Gold groups in the standard MineRL. This shows that the failures are due to the controller’s inability to gather rare resources in the standard environment.
### K.5 Long-horizon task benchmark experiments analysis
This section provides a detailed analysis of the performance differences observed in Table ˜ 3 between Optimus-1 † and XENON ∗ on long-horizon tasks, even when both access to a true dependency graph and increased item spawn probabilities (Section ˜ J.2.5). We specifically examine various plan errors encountered when reproducing Optimus-1 † using Qwen2.5-VL-7B as the planner, and explain how XENON ∗ robustly constructs plans through step-by-step planning with FAM.
Table 15: Analysis of primary plan errors observed in Optimus-1 † and XENON ∗ during long-horizon tasks benchmark experiments. This table presents the ratio of specified plan error among the failed episodes for Optimus-1 † and XENON ∗ respectively. Invalid Action indicates errors where an invalid action is used for an item in a subgoal. Subgoal Omission refers to errors where a necessary subgoal for a required item is omitted from the plan. Note that these plan error values are not exclusive; one episode can exhibit multiple types of plan errors.
| Plan Error Type | Optimus-1 † Error Rate (%) | XENON ∗ Error Rate (%) |
| --- | --- | --- |
| Invalid Action | 37 | 2 |
| Subgoal Omission | 44 | 0 |
Optimus-1 † has no fine-grained action knowledge correction mechanism. Furthermore, Optimus-1 † ’s LLM planner generates a long plan at once with a long input prompt including a sequence of aggregated requirements $((q_1,u_1),\dots,(q_L_{v},u_L_{v})=(1,v))$ for the goal item $v$ . Consequently, as shown in Table ˜ 15, Optimus-1 generates plans with invalid actions for required items, denoted as Invalid Action. Furthermore, Optimus-1 omits necessary subgoals for required items, even they are in the input prompts, denoted as Subgoal Omission.
In contrast, XENON discovers valid actions by leveraging FAM, which records the outcomes of each action for every item, thereby enabling it to avoid empirically failed ones and and reuse successful ones. Furthermore, XENON mitigates the problem of subgoal omission through constructing a plan by making a subgoal for each required item one-by-one.
### K.6 Robust Dependency learning under dynamic true knowledge
<details>
<summary>x52.png Details</summary>

### Visual Description
## Legend: Chart Data Series Key
### Overview
The image displays a horizontal legend box, likely extracted from a larger chart or graph. It contains five distinct entries, each representing a data series with a unique combination of color, symbol, and label. The legend is presented on a light gray background with a subtle border.
### Components/Axes
The legend is a single-row container with the following elements, listed from left to right:
1. **Entry 1:**
* **Label:** `XENON`
* **Symbol:** A solid circle (dot).
* **Color:** Light blue (approximate hex: #7EB6FF).
* **Line:** A thin horizontal line of the same light blue color passes through the circle.
2. **Entry 2:**
* **Label:** `SC`
* **Symbol:** A diamond shape.
* **Color:** Light pink (approximate hex: #FFB3BA).
* **Line:** A thin horizontal line of the same light pink color passes through the diamond.
3. **Entry 3:**
* **Label:** `ADAM`
* **Symbol:** A plus sign (+).
* **Color:** Light orange/peach (approximate hex: #FFDFBA).
* **Line:** A thin horizontal line of the same light orange color passes through the plus sign.
4. **Entry 4:**
* **Label:** `DECKARD`
* **Symbol:** A square.
* **Color:** Light green (approximate hex: #BAFFC9).
* **Line:** A thin horizontal line of the same light green color passes through the square.
5. **Entry 5:**
* **Label:** `RAND`
* **Symbol:** An 'X' or cross mark.
* **Color:** Grayish-blue (approximate hex: #B5B9FF).
* **Line:** A thin horizontal line of the same grayish-blue color passes through the 'X'.
### Detailed Analysis
* **Text Language:** All labels (`XENON`, `SC`, `ADAM`, `DECKARD`, `RAND`) are in English.
* **Spatial Layout:** The legend is arranged horizontally. The symbols are positioned to the left of their corresponding text labels. The entire legend box is centered within the cropped image frame.
* **Visual Design:** Each entry uses a distinct, pastel-toned color and a simple geometric marker. The consistent use of a horizontal line through each symbol suggests these markers are used on line graphs or scatter plots where the line connects data points.
### Key Observations
* The labels appear to be proper nouns or acronyms (`XENON`, `SC`, `ADAM`, `DECKARD`, `RAND`). Without the parent chart, their specific meaning is unknown, but they likely represent different models, algorithms, systems, or experimental conditions being compared.
* The color palette is soft and distinct, designed for clear differentiation between series.
* The order of the legend entries (left to right) may correspond to the order of data series in the main chart or to a specific ranking.
### Interpretation
This legend serves as the critical key for decoding a multi-series chart. Its presence indicates the main visual contains at least five distinct data trends or categories being plotted against common axes (e.g., time, performance metric, cost).
* **Function:** It maps abstract visual properties (color, symbol) to meaningful categorical labels. A viewer must cross-reference this legend with the chart to understand which line or set of points corresponds to `XENON`, which to `SC`, and so on.
* **Implied Chart Type:** The combination of unique symbols and connecting lines strongly suggests the parent chart is a **line graph** or a **scatter plot with connected lines**. The symbols mark individual data points, and the lines show the trend between them.
* **Data Relationship:** The five series are meant to be compared directly against each other on the same set of axes. The legend enables this comparison by providing the necessary identification.
* **Missing Context:** The image contains no factual data, trends, or numerical values. Its sole purpose is categorical identification. To extract any data trends or insights, the main chart to which this legend belongs is required. The labels themselves (`ADAM`, `DECKARD`, `RAND`) might hint at a technical or research context, possibly in computing, AI, or engineering, but this is speculative without the chart's title and axes.
</details>
<details>
<summary>x53.png Details</summary>
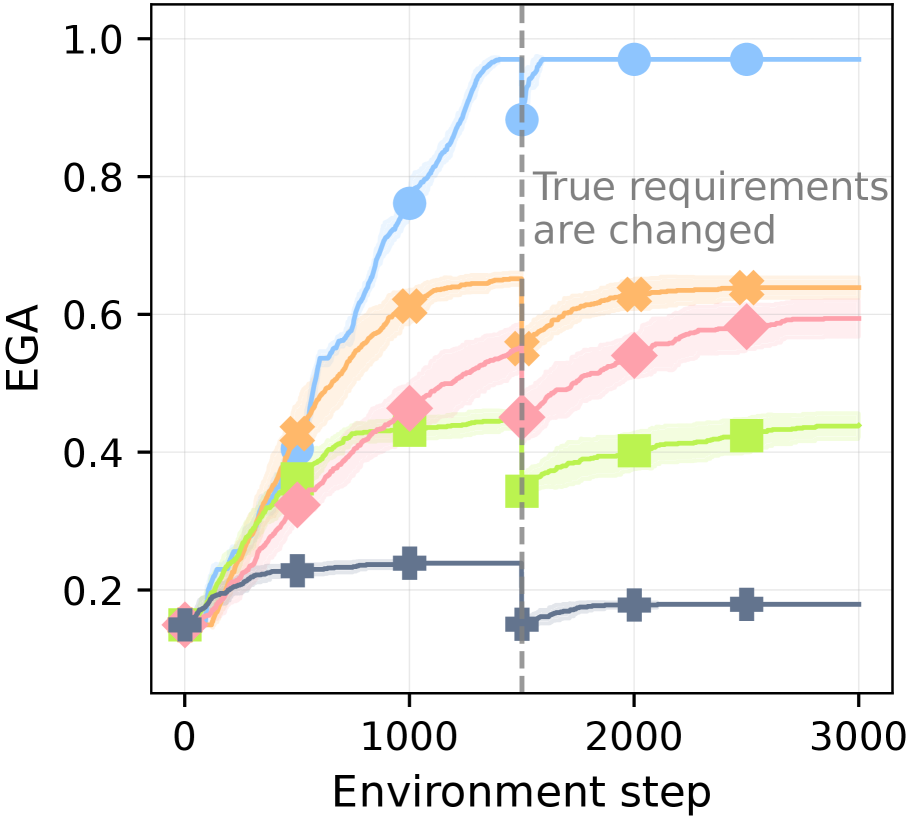
### Visual Description
## Line Chart: Performance of Multiple Algorithms Over Environment Steps
### Overview
The image is a line chart plotting the performance metric "EGA" against "Environment step" for five distinct algorithms or methods. The chart illustrates how each method's performance evolves over 3000 steps, with a critical intervention point at step 1500 where the "True requirements are changed." The chart includes shaded regions around each line, likely representing confidence intervals or standard deviation across multiple runs.
### Components/Axes
* **X-Axis:** Labeled "Environment step". The scale runs from 0 to 3000, with major tick marks at 0, 1000, 2000, and 3000.
* **Y-Axis:** Labeled "EGA". The scale runs from 0.0 to 1.0, with major tick marks at 0.2, 0.4, 0.6, 0.8, and 1.0.
* **Key Event Marker:** A vertical, gray, dashed line is positioned at Environment step = 1500. To the right of this line, in the upper-right quadrant of the chart, is the annotation text: "True requirements are changed".
* **Data Series (Identified by Color and Marker):**
1. **Light Blue Line with Circle Markers (●):** Top-performing series.
2. **Orange Line with 'X' Markers (✖):** Second-highest performing series.
3. **Pink Line with Diamond Markers (◆):** Middle-performing series.
4. **Light Green Line with Square Markers (■):** Lower-middle performing series.
5. **Dark Gray Line with Plus Markers (✚):** Lowest-performing series.
* **Legend:** There is no explicit legend box within the chart area. The series are distinguished solely by their unique color and marker combination.
### Detailed Analysis
**Trend Verification & Data Point Extraction (Approximate Values):**
* **Light Blue (●):**
* **Trend:** Starts low, increases rapidly and smoothly, plateaus near the top, experiences a sharp dip at the requirement change, then recovers and plateaus again at a very high level.
* **Key Points:** At step 0, EGA ≈ 0.15. Rises steeply to ≈ 0.75 at step 1000. Reaches a pre-change peak of ≈ 0.95 just before step 1500. At the change (step 1500), it dips to ≈ 0.88. Recovers quickly to ≈ 0.97 by step 2000 and remains stable until step 3000.
* **Orange (✖):**
* **Trend:** Increases steadily, plateaus before the change, shows a slight dip and recovery post-change, then stabilizes.
* **Key Points:** Starts near 0.15. Reaches ≈ 0.6 at step 1000. Plateaus around 0.65 before step 1500. At the change, it dips slightly to ≈ 0.55. Recovers to ≈ 0.63 by step 2000 and remains stable.
* **Pink (◆):**
* **Trend:** Increases at a moderate rate, continues a gradual upward trend even after the requirement change.
* **Key Points:** Starts near 0.15. Reaches ≈ 0.45 at step 1000. At step 1500, it is ≈ 0.45. Shows a slight dip then continues climbing to ≈ 0.55 at step 2000 and ≈ 0.6 at step 2500.
* **Light Green (■):**
* **Trend:** Increases initially, plateaus, then experiences a significant drop at the requirement change, followed by a partial, slow recovery.
* **Key Points:** Starts near 0.15. Reaches ≈ 0.42 at step 1000. Plateaus around 0.44 before step 1500. At the change, it drops sharply to ≈ 0.35. Recovers slowly to ≈ 0.4 by step 2000 and ≈ 0.42 by step 2500.
* **Dark Gray (✚):**
* **Trend:** Shows minimal improvement, plateaus early, and suffers a severe, permanent drop at the requirement change.
* **Key Points:** Starts near 0.15. Reaches a low plateau of ≈ 0.23 by step 500, which it maintains until step 1500. At the change, it drops sharply to ≈ 0.15. Shows a very slight recovery to ≈ 0.18 by step 2000 and remains there.
### Key Observations
1. **Performance Hierarchy:** A clear and consistent performance ranking is maintained throughout most of the experiment: Light Blue > Orange > Pink > Light Green > Dark Gray.
2. **Impact of Requirement Change:** The event at step 1500 acts as a major perturbation. All series show a negative reaction (a dip or drop in EGA), but the magnitude and recovery differ drastically.
3. **Differential Robustness:** The Light Blue (●) and Orange (✖) methods demonstrate high robustness, recovering quickly and fully (or nearly fully) to their pre-change performance levels. The Pink (◆) method is uniquely unaffected in the long term, continuing its upward trend. The Light Green (■) and especially the Dark Gray (✚) methods are highly sensitive, suffering significant performance degradation with limited recovery.
4. **Convergence:** Before the change, the top three methods (Blue, Orange, Pink) appear to be converging toward high EGA values. After the change, the gap between the top method (Blue) and the others widens significantly.
### Interpretation
This chart likely compares different reinforcement learning or adaptive algorithms in a non-stationary environment where the underlying task goals ("true requirements") shift at a known point (step 1500).
* **The Light Blue (●) algorithm** is the most robust and high-performing. Its rapid recovery suggests it has an effective mechanism for detecting and adapting to change, possibly through meta-learning, a large capacity for policy adjustment, or an intrinsic motivation to explore. Its final performance is near-perfect (EGA ≈ 0.97).
* **The Orange (✖) algorithm** is also robust but has a lower performance ceiling. It adapts well but to a sub-optimal policy compared to the blue method.
* **The Pink (◆) algorithm** exhibits a different, interesting behavior. Its continuous improvement suggests it may be learning a more general or fundamental skill that is less dependent on the specific "requirements" that changed. It is not thrown off by the shift because its objective is aligned with a deeper invariance in the environment.
* **The Light Green (■) and Dark Gray (✚) algorithms** appear to be brittle. They likely overfit to the initial set of requirements. When those requirements change, their learned policies become maladaptive, and they lack the flexibility to re-learn effectively. The Dark Gray method, in particular, seems to have learned a very narrow, fixed behavior early on.
**In summary, the data demonstrates that not all learning algorithms are equal in the face of changing goals. The experiment highlights a trade-off or distinction between methods that achieve high performance in a fixed setting (potentially the early plateau of Dark Gray) and those that maintain high performance and adaptability in a dynamic, non-stationary world (exemplified by Light Blue).** The Pink method's trajectory suggests an alternative path: learning invariants that render specific requirement changes irrelevant.
</details>
(a) Dynamic True Required Items
<details>
<summary>x54.png Details</summary>
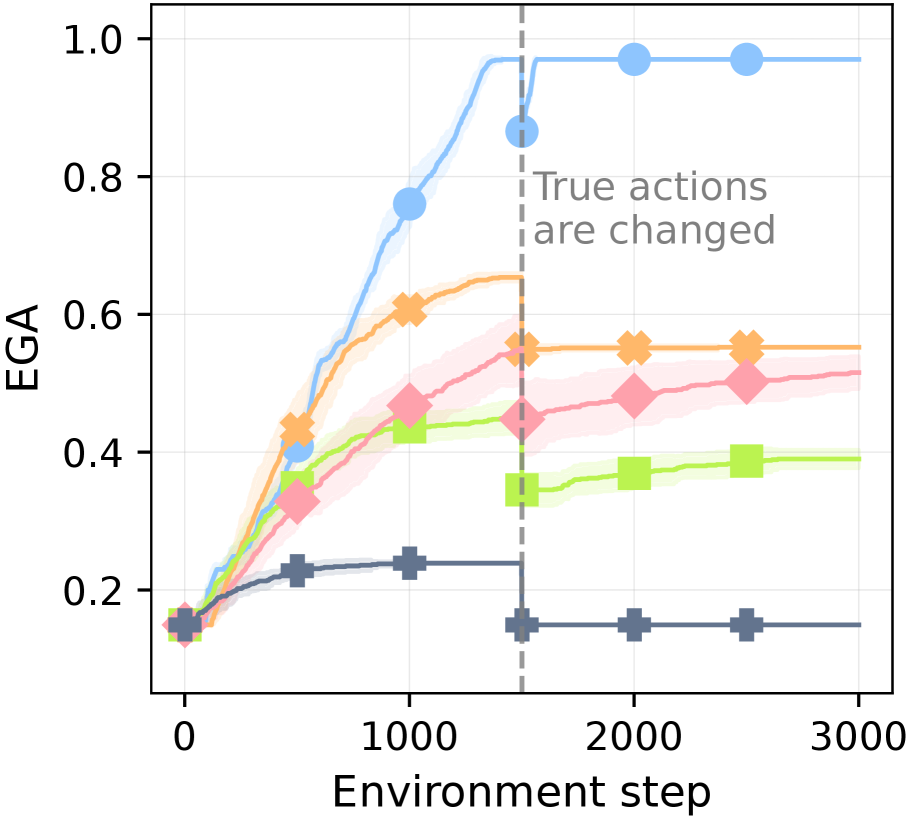
### Visual Description
## Line Chart: EGA vs. Environment Step
### Overview
The image is a line chart plotting the performance metric "EGA" against "Environment step" for five distinct algorithms or conditions. The chart shows learning curves that generally increase and then plateau, with a significant event marked by a vertical dashed line where the "True actions are changed." The data includes shaded regions around each line, likely representing confidence intervals or standard deviation.
### Components/Axes
* **X-Axis:** Labeled "Environment step". The scale runs from 0 to 3000, with major tick marks at 0, 1000, 2000, and 3000.
* **Y-Axis:** Labeled "EGA". The scale runs from 0.0 to 1.0, with major tick marks at 0.0, 0.2, 0.4, 0.6, 0.8, and 1.0.
* **Legend:** There is no explicit legend box. The five data series are distinguished by color and marker shape:
1. **Light Blue Line with Circle Markers (●)**
2. **Orange Line with 'X' Markers (✖)**
3. **Pink/Red Line with Diamond Markers (◆)**
4. **Light Green Line with Square Markers (■)**
5. **Dark Gray/Blue Line with Plus Markers (✚)**
* **Annotation:** A vertical, gray, dashed line is positioned at approximately Environment step = 1500. Text to the right of this line reads: "True actions are changed".
### Detailed Analysis
**Data Series Trends and Approximate Values:**
1. **Light Blue (●):**
* **Trend:** Shows the steepest and highest learning curve. It rises rapidly from step 0, approaches a plateau near EGA=1.0 before step 1500, and remains stable at that high level after the action change.
* **Key Points:** Starts ~0.15 at step 0. Reaches ~0.75 at step 1000. At the action change (step ~1500), it is at ~0.85. Post-change, it stabilizes at ~0.98.
2. **Orange (✖):**
* **Trend:** Rises steadily, plateaus around step 1000, and shows a slight dip immediately after the action change before recovering to a stable level.
* **Key Points:** Starts ~0.15. Reaches ~0.6 at step 1000. At the action change, it is ~0.55. Post-change, it stabilizes at ~0.55.
3. **Pink/Red (◆):**
* **Trend:** Shows a moderate, steady increase throughout, with a very slight dip or flattening after the action change before continuing a slow rise.
* **Key Points:** Starts ~0.15. Reaches ~0.45 at step 1000. At the action change, it is ~0.45. Post-change, it rises slowly to ~0.5 by step 3000.
4. **Light Green (■):**
* **Trend:** Increases to a moderate level, then experiences a noticeable drop immediately after the action change, followed by a partial recovery and stabilization.
* **Key Points:** Starts ~0.15. Reaches ~0.42 at step 1000. At the action change, it is ~0.45. Immediately after, it drops to ~0.35, then recovers to stabilize at ~0.39.
5. **Dark Gray/Blue (✚):**
* **Trend:** Shows the lowest performance. It rises slightly initially, plateaus early, and then drops sharply at the action change, remaining flat at a low level afterward.
* **Key Points:** Starts ~0.15. Reaches ~0.23 at step 1000. At the action change, it is ~0.23. Immediately after, it drops to ~0.15 and remains constant.
### Key Observations
1. **Performance Hierarchy:** A clear and consistent performance ranking is established by step 1000 and maintained throughout: Light Blue > Orange > Pink/Red > Light Green > Dark Gray.
2. **Impact of Action Change:** The event at step 1500 ("True actions are changed") has a varying impact:
* **Highly Robust:** The top-performing Light Blue series is largely unaffected.
* **Moderately Affected:** The Orange and Pink/Red series show minor, temporary disruptions.
* **Significantly Affected:** The Light Green and Dark Gray series experience a clear performance drop, with the Dark Gray series losing all its prior gains.
3. **Stability Post-Change:** After the initial reaction to the action change, all series stabilize at new or previous levels, indicating adaptation or convergence to a new policy.
4. **Initial Conditions:** All series begin at approximately the same EGA value (~0.15) at step 0.
### Interpretation
This chart likely compares the robustness and adaptability of different reinforcement learning algorithms or agent policies when faced with a non-stationary environment (where the mapping from states to "true actions" changes).
* **The Light Blue algorithm** demonstrates superior learning capability and exceptional robustness. It not only achieves near-perfect performance (EGA≈1.0) but also maintains it seamlessly despite the environmental change, suggesting it has learned a highly generalizable or stable policy.
* **The Orange and Pink/Red algorithms** show good learning but are less robust. They adapt to the change but settle at a lower performance level than the top performer, indicating some dependency on the original action mapping.
* **The Light Green and Dark Gray algorithms** are the most sensitive to environmental change. The sharp drop, especially for Dark Gray, suggests these policies were overfitted to the initial action mapping and lack the flexibility to adapt. The Dark Gray series' return to its starting value implies a complete failure to retain useful knowledge after the change.
* **Overall,** the data suggests a strong correlation between an algorithm's peak performance and its robustness to this specific type of environmental perturbation. The experiment highlights the importance of testing agent performance under changing conditions, not just in a static environment. The shaded confidence intervals are relatively narrow, indicating consistent performance across multiple runs for each condition.
</details>
(b) Dynamic True Actions
<details>
<summary>x55.png Details</summary>
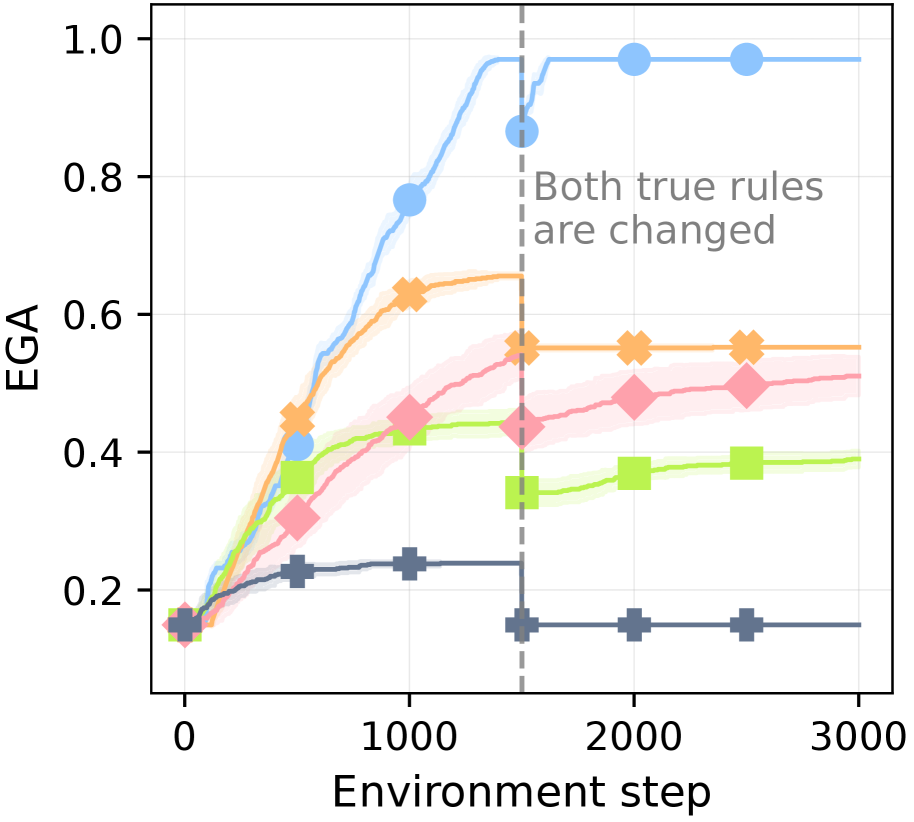
### Visual Description
## Line Chart: EGA Performance Over Environment Steps with Rule Change
### Overview
The image is a line chart plotting the performance metric "EGA" against "Environment step" for five distinct experimental conditions or algorithms. The chart shows learning curves that are impacted by a significant event at step 1500, where the underlying rules of the environment are changed. The data is presented with shaded regions around each line, likely representing confidence intervals or standard deviation across multiple runs.
### Components/Axes
* **X-Axis:** Labeled "Environment step". The scale runs from 0 to 3000, with major tick marks at 0, 1000, 2000, and 3000.
* **Y-Axis:** Labeled "EGA". The scale runs from 0.0 to 1.0, with major tick marks at 0.0, 0.2, 0.4, 0.6, 0.8, and 1.0.
* **Data Series:** Five distinct lines, each identified by a unique color and marker shape. A legend is not explicitly shown, but the series can be distinguished as follows:
1. **Blue Line with Circle Markers:** Appears to be the top-performing series.
2. **Orange Line with 'X' Markers:** The second-highest performing series.
3. **Pink/Red Line with Diamond Markers:** The third-highest performing series.
4. **Light Green Line with Square Markers:** The fourth-highest performing series.
5. **Gray/Dark Blue Line with Plus ('+') Markers:** The lowest-performing series.
* **Key Annotation:** A vertical, dashed gray line is positioned at approximately **Environment step = 1500**. To the right of this line, centered vertically, is the text annotation: **"Both true rules are changed"**.
### Detailed Analysis
**Trend Verification & Data Points (Approximate):**
1. **Blue Line (Circles):**
* **Trend:** Starts low, increases rapidly and steeply until step ~1500, experiences a brief dip immediately after the rule change, then recovers and plateaus at a high level.
* **Key Points:** At step 0, EGA ≈ 0.15. At step 1000, EGA ≈ 0.78. At step 1500 (just before the line), EGA ≈ 0.95. At step 1500 (just after the line), EGA ≈ 0.85 (dip). At step 2000, EGA ≈ 0.98. At step 3000, EGA ≈ 0.98.
2. **Orange Line ('X' Markers):**
* **Trend:** Increases steadily, plateaus before the rule change, shows a slight drop after the rule change, and then maintains a stable, lower plateau.
* **Key Points:** At step 0, EGA ≈ 0.15. At step 1000, EGA ≈ 0.63. At step 1500 (before), EGA ≈ 0.65. At step 1500 (after), EGA ≈ 0.55. At step 2000, EGA ≈ 0.55. At step 3000, EGA ≈ 0.55.
3. **Pink/Red Line (Diamonds):**
* **Trend:** Shows a steady, moderate increase throughout, with a very slight dip or flattening after the rule change, followed by continued slow improvement.
* **Key Points:** At step 0, EGA ≈ 0.15. At step 1000, EGA ≈ 0.45. At step 1500, EGA ≈ 0.44. At step 2000, EGA ≈ 0.48. At step 3000, EGA ≈ 0.51.
4. **Light Green Line (Squares):**
* **Trend:** Increases to a moderate level, plateaus, then experiences a noticeable drop after the rule change, followed by a slow, partial recovery.
* **Key Points:** At step 0, EGA ≈ 0.15. At step 1000, EGA ≈ 0.43. At step 1500 (before), EGA ≈ 0.44. At step 1500 (after), EGA ≈ 0.33 (drop). At step 2000, EGA ≈ 0.36. At step 3000, EGA ≈ 0.39.
5. **Gray/Dark Blue Line ('+' Markers):**
* **Trend:** Shows minimal improvement, plateaus early at a low level, and then drops significantly after the rule change to a new, very low plateau.
* **Key Points:** At step 0, EGA ≈ 0.15. At step 1000, EGA ≈ 0.23. At step 1500 (before), EGA ≈ 0.23. At step 1500 (after), EGA ≈ 0.15 (drop). At step 2000, EGA ≈ 0.15. At step 3000, EGA ≈ 0.15.
### Key Observations
* **Performance Hierarchy:** A clear and consistent performance ranking is established by step 1000 and maintained throughout: Blue > Orange > Pink > Green > Gray.
* **Impact of Rule Change:** The event at step 1500 ("Both true rules are changed") causes an immediate negative impact on all five series, evidenced by a drop or plateau in EGA.
* **Differential Resilience:** The series demonstrate varying degrees of resilience and adaptation to the rule change:
* **Blue:** Most resilient. Suffers only a minor, temporary dip and quickly recovers to surpass its pre-change performance.
* **Orange & Gray:** Show a permanent step-down in performance. They adapt to a new, lower stable level but do not recover to prior highs.
* **Green:** Shows a significant drop followed by a slow, partial recovery trend.
* **Pink:** Appears least affected in terms of trend direction, showing only a minor flattening before continuing its slow upward trajectory.
* **Convergence:** The Blue line converges to near-perfect performance (EGA ≈ 1.0). The Gray line converges to near its starting point (EGA ≈ 0.15).
### Interpretation
This chart likely visualizes the performance of different reinforcement learning agents or adaptive algorithms in a non-stationary environment. The "EGA" metric is probably a measure of success, such as "Expected Goal Achievement" or a similar performance score.
The data suggests that the **Blue algorithm possesses superior initial learning capability and, more importantly, robust adaptability**. Its ability to quickly recover and even improve after a fundamental change in environmental rules indicates a mechanism for rapid re-learning or meta-learning. This is the hallmark of a highly robust and flexible system.
In contrast, the **Gray algorithm appears brittle**. It learns little initially and fails to adapt to change, suggesting it may be overfitted to the initial rules or lacks an effective mechanism for updating its policy. The **Orange algorithm learns well but is not adaptable**; its performance permanently degrades after the change, indicating it may have memorized a strategy that is no longer optimal.
The **Green and Pink algorithms show intermediate levels of adaptability**. Green's partial recovery suggests it can relearn but slowly, while Pink's steady trend implies its learning process is less sensitive to the specific rule change, perhaps because it learns more general features.
**Overall, the chart demonstrates that in environments where rules can change, the capacity for adaptation (as shown by the Blue line) is as critical, if not more so, than initial learning speed.** The rule change acts as a stress test that clearly separates robust, generalizable learning from brittle, context-specific optimization.
</details>
(c) Dynamic Both Rules
Figure 22: Robustness against dynamic true knowledge. EGA over 3,000 environment steps in the where the true item acquisition rules are changed during the learning process.
Table 16: The ratio of correctly learned dependencies among whose rules are dynamically changed (out of 7 total) by each agent. Columns correspond to the type of ground-truth rules changed during learning: requirements only, actions only, or both.
| Agent | (3,0) | (0,3) | (3,3) |
| --- | --- | --- | --- |
| XENON | 1.0 | 1.0 | 1.0 |
| SC | 0.80 | 0.0 | 0.0 |
| ADAM | 0.83 | 0.0 | 0.0 |
| DECKARD | 0.49 | 0.0 | 0.0 |
| RAND | 0.29 | 0.0 | 0.0 |
Additionally, We show XENON is also applicable to scenarios where the latent true knowledge changes dynamically. We design three dynamic scenarios where the environment begins with the vanilla setting, (0,0), for the first 1,500 steps, then transitions to a level-3 perturbation setting for the subsequent 1,500 steps: either required items-only (3,0), action-only (0,3), or both (3,3). Upon this change, the agent is informed of which items’ rules are modified but not what the new rules are, forcing it to relearn from experience. As shown in Figure ˜ 22, XENON rapidly adapts by re-learning the new dependencies and recovering its near-perfect EGA in all three scenarios. In contrast, all baselines fail to adapt effectively, with their performance remaining significantly degraded after the change. Specifically, for the 7 items whose rules are altered, Table ˜ 16 shows that XENON achieves a perfect re-learning ratio of 1.0 in all scenarios, while all baselines score 0.0 whenever actions are modified.
### K.7 Ablation studies for long-horzion goal planning
Table 17: Ablation experiment results for long-horizon goal planning in MineRL. Without Learned Dependency, XENON employs a dependency graph initialized with LLM predictions and human-written examples. Without Action Correction, XENON saves and reuses successful actions in FAM, but it does not utilize the information of failed actions.
| Learned Dependency | Action Correction | CRe |
<details>
<summary>x56.png Details</summary>

### Visual Description
Icon/Small Image (20x20)
</details>
|
<details>
<summary>x57.png Details</summary>

### Visual Description
Icon/Small Image (20x20)
</details>
|
<details>
<summary>x58.png Details</summary>

### Visual Description
Icon/Small Image (20x20)
</details>
|
<details>
<summary>x59.png Details</summary>

### Visual Description
Icon/Small Image (20x20)
</details>
|
<details>
<summary>x60.png Details</summary>

### Visual Description
Icon/Small Image (20x20)
</details>
|
<details>
<summary>x61.png Details</summary>

### Visual Description
Icon/Small Image (20x20)
</details>
|
<details>
<summary>x62.png Details</summary>

### Visual Description
Icon/Small Image (20x20)
</details>
|
| --- | --- | --- | --- | --- | --- | --- | --- | --- | --- |
| Wood | Stone | Iron | Diamond | Gold | Armor | Redstone | | | |
| 0.54 | 0.39 | 0.10 | 0.26 | 0.45 | 0.0 | 0.0 | | | |
| 0.54 | 0.38 | 0.09 | 0.29 | 0.45 | 0.0 | 0.0 | | | |
| 0.82 | 0.69 | 0.36 | 0.59 | 0.69 | 0.22 | 0.0 | | | |
| 0.82 | 0.79 | 0.45 | 0.59 | 0.68 | 0.21 | 0.0 | | | |
| 0.85 | 0.81 | 0.46 | 0.64 | 0.74 | 0.28 | 0.0 | | | |
To analyze how each of XENON’s components contributes to its long-horizon planning, we conducted an ablation study in MineRL, with results shown in Table ˜ 17. The findings first indicate that without accurate dependency knowledge, our action correction using FAM provides no significant benefit on its own (row 1 vs. row 2). The most critical component is the learned dependency graph, which dramatically improves success rates across all item groups (row 3). Building on this, adding FAM’s action correction further boosts performance, particularly for the Stone and Iron groups where it helps overcome the LLM’s flawed action priors (row 4). Finally, Context-aware Reprompting (CRe, Section ˜ 4.3) provides an additional performance gain on more challenging late-game items, such as Iron, Gold, and Armor. This is likely because their longer episode horizons offer more opportunities for CRe to rescue a stalled controller.
### K.8 The Necessity of Knowledge Correction even with External Sources
<details>
<summary>x63.png Details</summary>
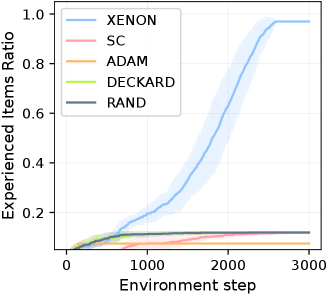
### Visual Description
## Line Chart: Experienced Items Ratio vs. Environment Step
### Overview
The image is a line chart comparing the performance of five different methods or algorithms over the course of 3000 environment steps. The performance metric is the "Experienced Items Ratio." One method, XENON, shows a dramatic, near-sigmoidal increase in performance, while the other four methods (SC, ADAM, DECKARD, RAND) show minimal to no improvement, remaining near the baseline.
### Components/Axes
* **Chart Type:** Line chart with shaded confidence intervals/variance bands.
* **Y-Axis:**
* **Label:** "Experienced Items Ratio"
* **Scale:** Linear, from 0.0 to 1.0.
* **Major Ticks:** 0.0, 0.2, 0.4, 0.6, 0.8, 1.0.
* **X-Axis:**
* **Label:** "Environment step"
* **Scale:** Linear, from 0 to 3000.
* **Major Ticks:** 0, 1000, 2000, 3000.
* **Legend:** Located in the top-left corner of the plot area. It contains five entries, each with a colored line sample and a text label.
1. **XENON:** Light blue line.
2. **SC:** Pink line.
3. **ADAM:** Orange line.
4. **DECKARD:** Light green line.
5. **RAND:** Gray line.
### Detailed Analysis
**Data Series Trends and Approximate Values:**
1. **XENON (Light Blue Line):**
* **Trend:** Starts near 0.0. Shows a slow, steady increase until approximately step 1500. After step 1500, the slope increases dramatically, exhibiting a steep, nearly linear rise until about step 2500. The growth then decelerates, approaching an asymptote near 1.0 by step 3000. A light blue shaded region surrounds the line, indicating variance or a confidence interval, which widens during the period of steepest ascent (steps ~1500-2500).
* **Approximate Data Points:**
* Step 0: ~0.0
* Step 1000: ~0.1
* Step 1500: ~0.2
* Step 2000: ~0.6
* Step 2500: ~0.95
* Step 3000: ~0.98
2. **SC (Pink Line):**
* **Trend:** Remains very low and flat throughout. Shows a very slight, gradual increase from near 0.0 to approximately 0.1 over 3000 steps.
* **Approximate Data Points:** Hovers between 0.0 and 0.1 for the entire duration.
3. **ADAM (Orange Line):**
* **Trend:** Similar to SC, remains very low and flat. It appears to be the lowest-performing method for most of the timeline, ending slightly above 0.0.
* **Approximate Data Points:** Consistently near or just above 0.0.
4. **DECKARD (Light Green Line):**
* **Trend:** Remains low and flat, with a slight initial rise in the first 500 steps before plateauing. It performs slightly better than ADAM and SC for most of the chart.
* **Approximate Data Points:** Plateaus around 0.05 to 0.08 after step 500.
5. **RAND (Gray Line):**
* **Trend:** Remains low and flat, closely tracking the performance of DECKARD and SC. It shows minimal growth.
* **Approximate Data Points:** Hovers around 0.05 to 0.1, similar to DECKARD and SC.
### Key Observations
1. **Dominant Performance:** The XENON method is the clear outlier, demonstrating a capability to achieve a high "Experienced Items Ratio" (approaching 1.0 or 100%) that the other methods fail to achieve.
2. **Phase Transition:** XENON's performance exhibits a distinct phase transition around step 1500, shifting from slow growth to rapid, sustained improvement.
3. **Baseline Cluster:** SC, ADAM, DECKARD, and RAND form a tight cluster of low performance, all remaining below a ratio of 0.2. Their relative ordering is not strongly differentiated.
4. **Variance:** The shaded blue area indicates that the XENON method's performance has higher variance or uncertainty during its rapid growth phase compared to its stable start and end points. The other methods show negligible visible variance.
### Interpretation
This chart likely comes from a machine learning or reinforcement learning context, comparing different exploration or experience-gathering strategies. The "Experienced Items Ratio" probably measures the proportion of a state space, object set, or task repertoire that an agent has encountered.
* **What the data suggests:** The XENON strategy is fundamentally more effective at systematically discovering and experiencing novel items/states over time. Its sigmoidal curve suggests a process that starts slowly (perhaps building a foundational model), then hits a "tipping point" where discovery accelerates rapidly, and finally saturates as it exhausts the available items.
* **How elements relate:** The stark contrast between XENON and the cluster of other methods (including RAND, which likely represents random exploration) implies that XENON employs a non-random, directed, and highly efficient exploration mechanism. The other methods appear no more effective than random chance or simple heuristics for this specific metric.
* **Notable Anomalies:** The most significant anomaly is the performance gap itself. The fact that four methods cluster near the bottom while one soars suggests a qualitative difference in approach, not just a quantitative tuning. The widening variance band for XENON during its ascent is also notable, indicating that while the *average* performance rises sharply, individual runs or episodes may have more variable discovery rates during this critical learning phase.
**Language:** All text in the image is in English.
</details>
Figure 23: Ratio of goal items obtained in one MC-TextWorld episode when each agent’s dependency graph is initialized from an oracle graph while the environment’s ground-truth dependency graph is perturbed. Solid lines denote the mean over 15 runs; shaded areas denote the standard deviation.
Even when an external source is available to initialize an agent’s knowledge, correcting that knowledge from interaction remains essential for dependency and action learning, because such sources can be flawed or outdated. To support this, we evaluate XENON and the baselines in the MC-TextWorld environment where each agent’s dependency graph is initialized from an oracle graph, while the environment’s ground-truth dependency graph is perturbed (perturbation level 3 in Table ˜ 4). We measure performance as the ratio of the 67 goal items obtained within a single episode. We use an intrinsic exploratory item selection method for all agents (i.e., which item each agent chooses on its own to try to obtain next): they choose, among items not yet obtained in the current episode, the one with the fewest attempts so far.
As shown in Figure ˜ 23, this experiment demonstrates that, even when an external source is available, (1) interaction experience-based knowledge correction remains crucial when the external source is mismatched with the environment, and (2) XENON is also applicable and robust in this scenario. By continually revising its dependency knowledge, XENON achieves a much higher ratio of goal items obtained in an episode than all baselines. In contrast, the baselines either rely on unreliable LLM self-correction (e.g., SC) or do not correct flawed knowledge at all (e.g., DECKARD, ADAM, RAND), and therefore fail to obtain many goal items. Their performance is especially poor because there are dependencies between goals: for example, when the true required items for stone pickaxe and iron pickaxe are perturbed, the baselines cannot obtain these items and thus cannot obtain other goal items that depend on them.
### K.9 Scalability of Dependency and Action Learning with More Goals and Actions
<details>
<summary>x64.png Details</summary>
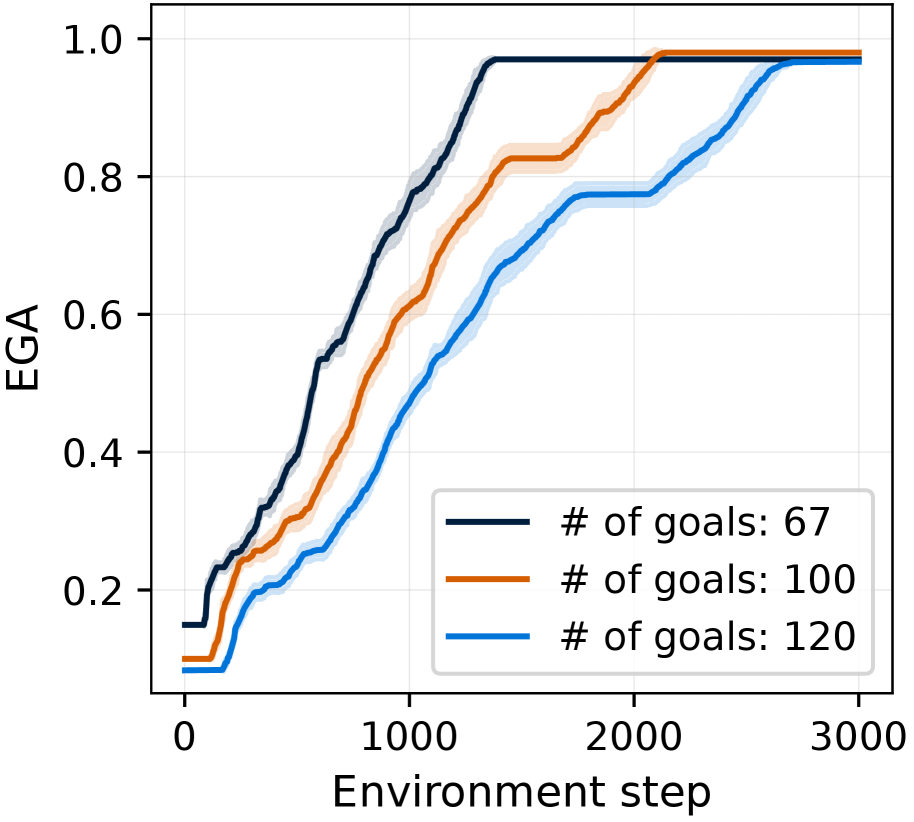
### Visual Description
## Line Chart: EGA vs. Environment Step for Different Goal Counts
### Overview
The image displays a line chart plotting the performance metric "EGA" against "Environment step" for three different experimental conditions, each defined by a specific number of goals. The chart illustrates the learning or convergence curves for these conditions, showing how performance improves over time (steps). All three curves exhibit a sigmoidal (S-shaped) growth pattern, starting low, increasing rapidly, and then plateauing near the maximum value of 1.0.
### Components/Axes
* **Chart Type:** Line chart with shaded confidence bands or variance regions.
* **X-Axis:**
* **Label:** "Environment step"
* **Scale:** Linear, ranging from 0 to 3000.
* **Major Ticks:** 0, 1000, 2000, 3000.
* **Y-Axis:**
* **Label:** "EGA"
* **Scale:** Linear, ranging from 0.0 to 1.0.
* **Major Ticks:** 0.0, 0.2, 0.4, 0.6, 0.8, 1.0.
* **Legend:**
* **Position:** Bottom-right corner of the plot area.
* **Entries:**
1. **Dark Blue Line:** "# of goals: 67"
2. **Orange Line:** "# of goals: 100"
3. **Light Blue Line:** "# of goals: 120"
* **Data Series:** Three distinct lines, each with a corresponding semi-transparent shaded area of the same color, likely representing standard deviation or confidence intervals.
### Detailed Analysis
**Trend Verification & Data Point Extraction:**
1. **Dark Blue Line (# of goals: 67):**
* **Trend:** This line shows the fastest initial growth. It starts at approximately EGA = 0.15 at step 0, rises steeply, and begins to plateau around step 1500. It reaches a near-maximum value (≈0.98) first.
* **Approximate Data Points:**
* Step 0: EGA ≈ 0.15
* Step 500: EGA ≈ 0.55
* Step 1000: EGA ≈ 0.80
* Step 1500: EGA ≈ 0.97 (plateau begins)
* Step 3000: EGA ≈ 0.98
2. **Orange Line (# of goals: 100):**
* **Trend:** This line has an intermediate growth rate. It starts lower than the dark blue line, at approximately EGA = 0.10 at step 0. Its steepest ascent occurs between steps 500 and 1500. It plateaus later than the dark blue line, around step 2000.
* **Approximate Data Points:**
* Step 0: EGA ≈ 0.10
* Step 500: EGA ≈ 0.30
* Step 1000: EGA ≈ 0.65
* Step 1500: EGA ≈ 0.85
* Step 2000: EGA ≈ 0.97 (plateau begins)
* Step 3000: EGA ≈ 0.98
3. **Light Blue Line (# of goals: 120):**
* **Trend:** This line shows the slowest growth. It starts at the lowest point, approximately EGA = 0.05 at step 0. Its growth is more gradual, with the steepest section between steps 1000 and 2000. It is the last to plateau, reaching its maximum around step 2500.
* **Approximate Data Points:**
* Step 0: EGA ≈ 0.05
* Step 500: EGA ≈ 0.20
* Step 1000: EGA ≈ 0.45
* Step 1500: EGA ≈ 0.70
* Step 2000: EGA ≈ 0.85
* Step 2500: EGA ≈ 0.97 (plateau begins)
* Step 3000: EGA ≈ 0.98
### Key Observations
1. **Inverse Relationship:** There is a clear inverse relationship between the number of goals and the rate of learning (convergence speed). The condition with the fewest goals (67) learns the fastest, while the condition with the most goals (120) learns the slowest.
2. **Common Asymptote:** Despite different learning speeds, all three conditions appear to converge to approximately the same final performance level (EGA ≈ 0.98) by the end of the plotted environment steps (3000).
3. **Performance Gap:** The performance gap between the conditions is most pronounced during the middle phase of learning (between steps 500 and 2000). For example, at step 1000, the EGA for 67 goals is ~0.80, while for 120 goals it is only ~0.45.
4. **Variance:** The shaded bands suggest that variance or uncertainty in the EGA measurement is relatively consistent across the learning phase for each condition and narrows slightly as performance plateaus.
### Interpretation
The data demonstrates a fundamental trade-off in the system being measured: **task complexity (represented by the number of goals) negatively impacts learning efficiency.** While the system is capable of achieving high performance (near-perfect EGA) regardless of the goal count within the tested range, the "cost" is measured in environment steps. More complex tasks (more goals) require significantly more interaction with the environment to reach the same level of mastery.
This has practical implications for training or optimization processes. If environment steps correspond to real-world time, computational cost, or data collection effort, then reducing the number of concurrent or sequential goals could lead to much faster training times without sacrificing final performance. The plateau indicates a saturation point where additional steps yield negligible improvement, suggesting that for this specific metric and setup, 3000 steps are sufficient for convergence even in the most complex condition shown. The consistent final value implies that the ultimate capability of the system is not limited by the number of goals, but the path to reach that capability is.
</details>
(a) Effect of increasing the number of goals
<details>
<summary>x65.png Details</summary>
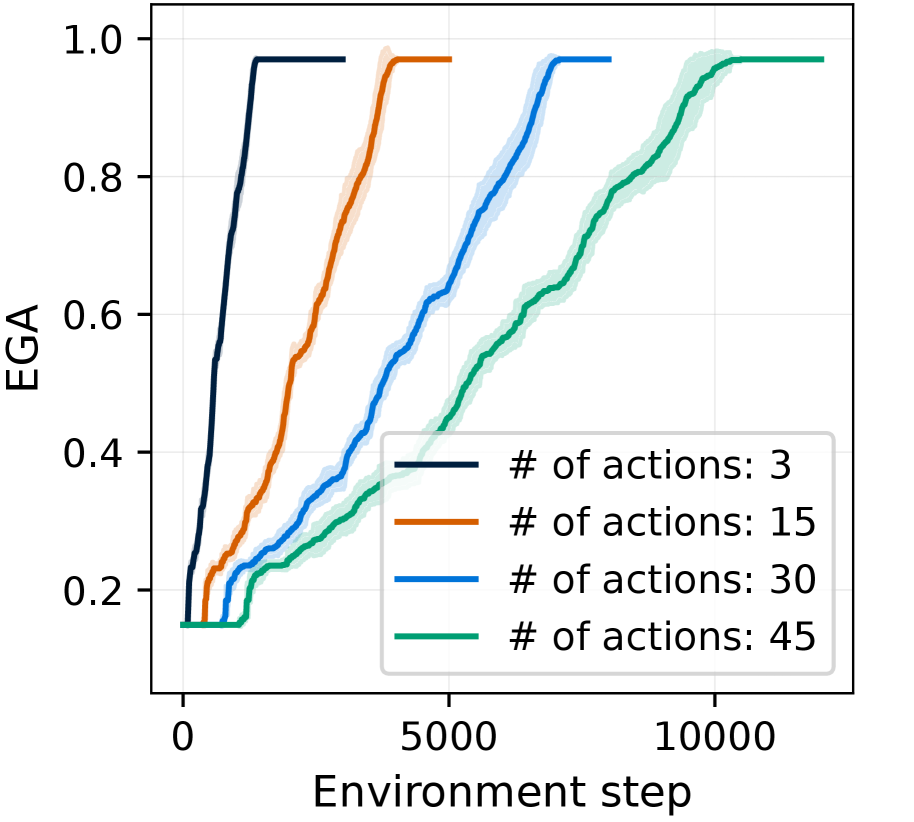
### Visual Description
## Line Chart: EGA Performance vs. Environment Steps for Different Action Counts
### Overview
The image is a line chart comparing the performance of a system (measured by "EGA") over the course of training ("Environment step") for four different configurations, each defined by a different number of available actions. The chart demonstrates how the learning speed and final performance plateau are affected by the complexity of the action space.
### Components/Axes
* **Chart Type:** Line chart with shaded confidence intervals or variance bands.
* **Y-Axis:**
* **Label:** "EGA"
* **Scale:** Linear, ranging from 0.0 to 1.0, with major tick marks at 0.0, 0.2, 0.4, 0.6, 0.8, and 1.0.
* **X-Axis:**
* **Label:** "Environment step"
* **Scale:** Linear, ranging from 0 to over 10,000, with major tick marks at 0, 5000, and 10000.
* **Legend:** Located in the bottom-right quadrant of the chart area. It contains four entries, each associating a colored line with a specific condition:
* **Dark Blue Line:** "# of actions: 3"
* **Orange Line:** "# of actions: 15"
* **Light Blue Line:** "# of actions: 30"
* **Green Line:** "# of actions: 45"
* **Data Series:** Four distinct lines, each with a corresponding semi-transparent shaded area of the same color, likely representing standard deviation or confidence intervals across multiple runs.
### Detailed Analysis
The chart plots the trajectory of EGA (likely a performance metric like "Expected Goal Achievement" or similar) as a function of training steps. All four lines follow a similar sigmoidal (S-shaped) growth pattern, starting near 0.15 and eventually plateauing near 1.0, but at markedly different rates.
1. **# of actions: 3 (Dark Blue Line):**
* **Trend:** Exhibits the steepest and fastest ascent.
* **Key Points:** Begins rising almost immediately from step 0. Reaches a performance of ~0.6 by approximately 1,000 steps. Plateaus at a value very close to 1.0 by around 2,000 steps and remains stable thereafter. The shaded variance band is very narrow, indicating consistent performance.
2. **# of actions: 15 (Orange Line):**
* **Trend:** Rises more slowly than the 3-action line but faster than the 30 and 45-action lines.
* **Key Points:** Starts its significant ascent around 500-1,000 steps. Crosses the 0.6 EGA mark at roughly 2,500 steps. Reaches its plateau near 1.0 at approximately 4,000 steps. The variance band is slightly wider than for the 3-action case.
3. **# of actions: 30 (Light Blue Line):**
* **Trend:** Shows a more gradual, nearly linear increase over a long period before plateauing.
* **Key Points:** Begins rising noticeably after 1,000 steps. Reaches 0.6 EGA at about 4,500 steps. Continues a steady climb, approaching the 1.0 plateau around 7,000-8,000 steps. The variance band is moderately wide.
4. **# of actions: 45 (Green Line):**
* **Trend:** Has the slowest rate of increase, with the most prolonged learning phase.
* **Key Points:** Remains near the baseline (~0.15) until approximately 2,000 steps. Shows a steady, almost linear increase from 2,000 to 10,000 steps. Crosses 0.6 EGA at around 6,500 steps. It appears to be approaching but has not fully plateaued at 1.0 by the end of the plotted data at ~12,000 steps. This line has the widest shaded variance band, indicating the highest variability in learning progress.
### Key Observations
* **Clear Inverse Relationship:** There is a direct and consistent inverse relationship between the number of actions and the speed of learning. Fewer actions lead to dramatically faster convergence to high performance.
* **Convergence to Similar Final Performance:** All four configurations appear to be converging toward a similar maximum EGA value of approximately 1.0, suggesting the task is solvable with any of these action space sizes, but the sample efficiency differs greatly.
* **Variance Increases with Complexity:** The width of the shaded confidence intervals increases with the number of actions (widest for 45 actions, narrowest for 3 actions). This indicates that learning becomes not only slower but also more variable and less predictable as the action space grows.
* **Delayed Onset for Complex Tasks:** The start of significant performance improvement is delayed as action count increases. The 45-action line shows a long initial period of minimal improvement before learning begins in earnest.
### Interpretation
This chart illustrates a fundamental trade-off in reinforcement learning or similar sequential decision-making systems: **the curse of dimensionality in the action space.**
* **What the data suggests:** The system learns the task much more efficiently when it has fewer choices (actions) to consider at each step. A smaller action space simplifies the exploration problem, allowing the agent to discover rewarding strategies more quickly. As the action space expands (from 3 to 45), the agent must explore a vastly larger combinatorial space, which requires significantly more environment interactions (steps) to identify effective policies.
* **How elements relate:** The X-axis (Environment step) represents the cost of learning in terms of data or experience. The Y-axis (EGA) represents the payoff or competence. The different lines show how the "price" (in steps) of achieving a certain level of competence (e.g., EGA=0.6) escalates with problem complexity (number of actions).
* **Notable implications:** The findings have practical implications for system design. If possible, simplifying an agent's action space (e.g., through hierarchical action selection, action abstraction, or better state representation) can lead to orders-of-magnitude improvements in learning speed. The increased variance for larger action spaces also suggests that training such agents may require more hyperparameter tuning or more robust algorithms to ensure reliable convergence. The plateau near 1.0 for all lines indicates the task's inherent difficulty is bounded; the challenge lies entirely in the efficiency of the learning process.
</details>
(b) Effect of increasing the number of actions
Figure 24: Scalability of XENON with more goals and actions. EGA over environment steps in MC-TextWorld when (a) increasing the number of goal items and (b) increasing the number of available actions. In (a), we keep the three actions (“mine”, “craft”, “smelt”) fixed, while in (b) we keep the 67 goal items fixed. Solid lines denote the mean over 15 runs; shaded areas denote the standard deviation.
To evaluate the scalability of XENON’s dependency and action learning, we vary the number of goal items and available actions in the MC-TextWorld environment. For the goal-scaling experiment, we increase the number of goals from 67 to 100 and 120 by adding new goal items (see Table ˜ 11 for the added goals), while keeping the original three actions “mine”, “craft”, and “smelt” fixed. For the action-scaling experiment, we increase the available actions from 3 to 15, 30, and 45 (e.g., “harvest”, “hunt”, “place”), while keeping the original 67 goals fixed.
The results in Figure ˜ 24 show that XENON maintains high EGA as both the number of goals and the number of actions grow, although the number of environment steps required for convergence naturally increases. As seen in Figure ˜ 24(a), increasing the number of goals from 67 to 100 and 120 only moderately delays convergence (from around 1,400 to about 2,100 and 2,600 steps). In contrast, Figure ˜ 24(b) shows a larger slowdown when increasing the number of actions (from about 1,400 steps with 3 actions to roughly 4,000, 7,000, and 10,000 steps with 15, 30, and 45 actions), which is expected because XENON only revises an item’s dependency after all available actions for that item have been classified as empirically invalid by FAM. We believe this convergence speed could be improved with minimal changes, such as by lowering $x_0$ , the failure count threshold for classifying an action as invalid, or by triggering dependency revision once the agent has failed to obtain an item a fixed number of times, regardless of which actions were tried in subgoals.
### K.10 Ablation on action selection methods for making subgoals
<details>
<summary>x66.png Details</summary>

### Visual Description
## Legend from a Chart: Data Series Identification
### Overview
The image is a cropped section of a larger chart, displaying only the legend. It contains five distinct data series, each represented by a unique combination of a colored symbol and a text label. The legend is presented in a horizontal layout within a light gray bordered box against a white background.
### Components/Axes
The legend contains the following five entries, listed from left to right:
1. **Symbol:** A brown upward-pointing triangle. **Label:** `Random+FAM`
2. **Symbol:** A purple five-pointed star. **Label:** `UCB`
3. **Symbol:** A blue square. **Label:** `LLM`
4. **Symbol:** A pink diamond. **Label:** `SC`
5. **Symbol:** A light blue circle. **Label:** `XENON`
### Detailed Analysis
* **Visual Structure:** The legend is a single-row, horizontal list. Each entry consists of a colored symbol followed immediately by its corresponding text label.
* **Color Palette:** The colors used are distinct and appear chosen for clear differentiation: brown, purple, blue, pink, and light blue.
* **Symbol Types:** The symbols are simple geometric shapes (triangle, star, square, diamond, circle), which are standard for distinguishing data series in line charts or scatter plots.
* **Text Content:** All text is in English. The labels are acronyms or compound terms, suggesting they represent different algorithms, models, or experimental conditions (e.g., `LLM` likely stands for Large Language Model, `UCB` for Upper Confidence Bound).
### Key Observations
1. **Cropped Context:** The image provides only the legend. The main chart area containing the plotted data, axes, titles, and overall trends is not visible.
2. **Series Differentiation:** The chart uses a dual-coding system (color + shape) for its data series, which is a best practice for accessibility and clarity, especially in black-and-white printing or for color-blind viewers.
3. **Label Semantics:** The labels imply a comparison between different methods. `Random+FAM` suggests a randomized baseline with some augmentation (`FAM`). `UCB` is a classic algorithm in bandit problems and reinforcement learning. `LLM` and `XENON` point to modern AI/ML approaches. `SC` could refer to several concepts (e.g., Self-Consistency, Supervised Classification).
### Interpretation
This legend is the key to decoding a comparative performance or results chart. Based on the labels, the missing chart likely visualizes a benchmark or experiment comparing:
* A randomized strategy (`Random+FAM`).
* A traditional optimization algorithm (`UCB`).
* A large language model-based approach (`LLM`).
* A method abbreviated as `SC`.
* Another model or system named `XENON`.
The primary function of this element is to allow the viewer to map the visual properties (color, shape) of lines or data points in the main chart back to their respective categorical identities. Without the accompanying chart, no trends, data values, or relationships between these series can be determined. The design is functional and clear, prioritizing immediate recognition of the five distinct series.
</details>
<details>
<summary>x67.png Details</summary>
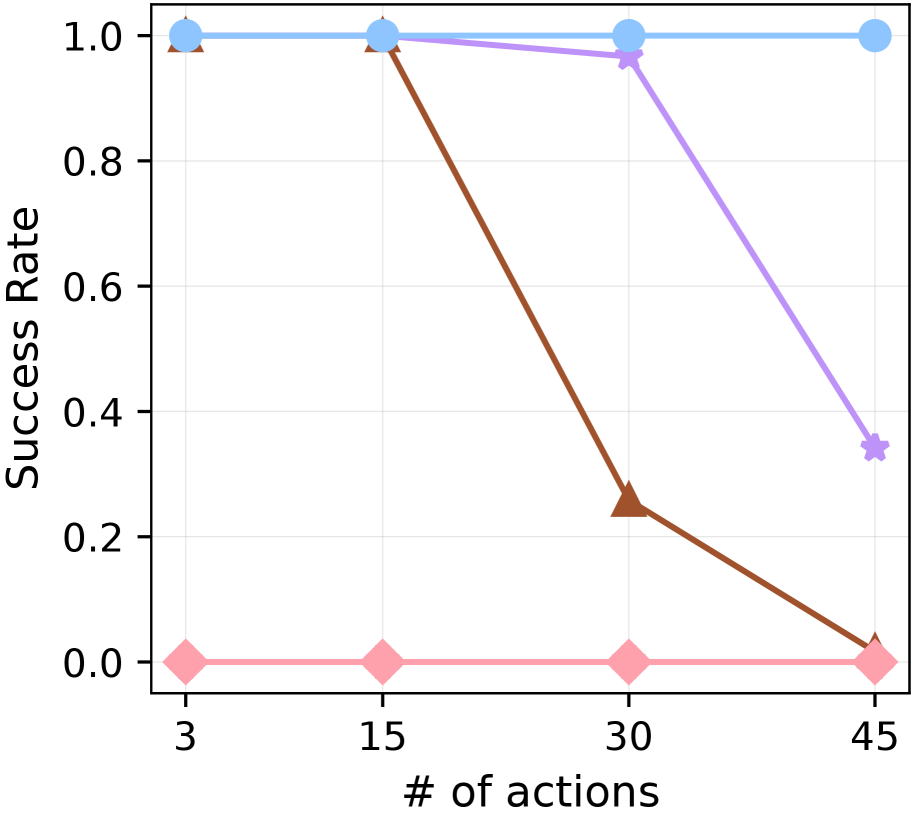
### Visual Description
## Line Chart: Success Rate vs. Number of Actions
### Overview
The image is a line chart plotting "Success Rate" against the "# of actions". It displays the performance of four distinct series, differentiated by color and marker shape, as the number of actions increases from 3 to 45. The chart suggests an analysis of how task complexity (proxied by action count) affects the success rate of different methods or agents.
### Components/Axes
* **X-Axis (Horizontal):**
* **Label:** "# of actions"
* **Scale/Markers:** The axis has four discrete, labeled tick marks: `3`, `15`, `30`, and `45`.
* **Y-Axis (Vertical):**
* **Label:** "Success Rate"
* **Scale/Markers:** The axis ranges from `0.0` to `1.0`, with labeled increments at `0.0`, `0.2`, `0.4`, `0.6`, `0.8`, and `1.0`.
* **Data Series (Legend inferred from visual attributes):**
1. **Light Blue Line with Circle Markers:** Positioned at the top of the chart.
2. **Purple Line with Star Markers:** Starts near the top, then declines.
3. **Brown Line with Triangle Markers:** Starts near the top, then declines sharply.
4. **Pink Line with Diamond Markers:** Positioned at the bottom of the chart.
* **Spatial Layout:** The chart area is bounded by a black frame. The x-axis label is centered at the bottom. The y-axis label is rotated 90 degrees and centered on the left side. The data lines are plotted within the grid defined by the axes.
### Detailed Analysis
**Trend Verification & Data Point Extraction:**
1. **Light Blue Line (Circle Markers):**
* **Trend:** Perfectly flat, horizontal line at the maximum success rate.
* **Data Points:**
* At # actions = 3: Success Rate ≈ 1.0
* At # actions = 15: Success Rate ≈ 1.0
* At # actions = 30: Success Rate ≈ 1.0
* At # actions = 45: Success Rate ≈ 1.0
2. **Purple Line (Star Markers):**
* **Trend:** Maintains a high success rate initially, then experiences a significant decline between 30 and 45 actions.
* **Data Points:**
* At # actions = 3: Success Rate ≈ 1.0
* At # actions = 15: Success Rate ≈ 1.0
* At # actions = 30: Success Rate ≈ 0.97 (slightly below 1.0)
* At # actions = 45: Success Rate ≈ 0.35
3. **Brown Line (Triangle Markers):**
* **Trend:** Starts high but shows a steep, consistent decline as the number of actions increases.
* **Data Points:**
* At # actions = 3: Success Rate ≈ 1.0
* At # actions = 15: Success Rate ≈ 1.0
* At # actions = 30: Success Rate ≈ 0.25
* At # actions = 45: Success Rate ≈ 0.02 (very close to 0.0)
4. **Pink Line (Diamond Markers):**
* **Trend:** Perfectly flat, horizontal line at the minimum success rate.
* **Data Points:**
* At # actions = 3: Success Rate ≈ 0.0
* At # actions = 15: Success Rate ≈ 0.0
* At # actions = 30: Success Rate ≈ 0.0
* At # actions = 45: Success Rate ≈ 0.0
### Key Observations
* **Performance Stratification:** The chart shows four distinct performance tiers. One method (light blue) is perfectly robust, one (pink) fails completely, and two (purple, brown) degrade with increased task complexity.
* **Critical Threshold:** For the degrading methods, the performance drop is not linear. The brown line begins its sharp decline after 15 actions, while the purple line holds until after 30 actions, suggesting different thresholds of complexity tolerance.
* **Convergence at Extremes:** At the lowest complexity (3 actions), three of the four methods achieve perfect success. At the highest complexity (45 actions), only one method maintains perfect success, one fails completely, and the other two have low to moderate success.
### Interpretation
This chart likely compares the scalability or robustness of different algorithms, agents, or strategies on a task where success is measured by completion rate. The "# of actions" serves as a proxy for task difficulty or length.
* The **light blue series** represents a highly scalable and reliable approach that is unaffected by the tested range of task complexity.
* The **pink series** represents a baseline or ineffective approach that fails regardless of task length.
* The **brown and purple series** reveal methods that work well for simple tasks but have fundamental limitations that cause failure as tasks become more complex. The brown method appears less robust than the purple one, as its performance degrades earlier and more severely.
* The **key insight** is that method selection is critical for complex tasks. While several approaches work for simple scenarios (3-15 actions), only one (light blue) is suitable for the most complex scenario tested (45 actions). The data argues for the superiority of the light blue method in terms of scalability and reliability.
</details>
(a) Success rate
<details>
<summary>x68.png Details</summary>
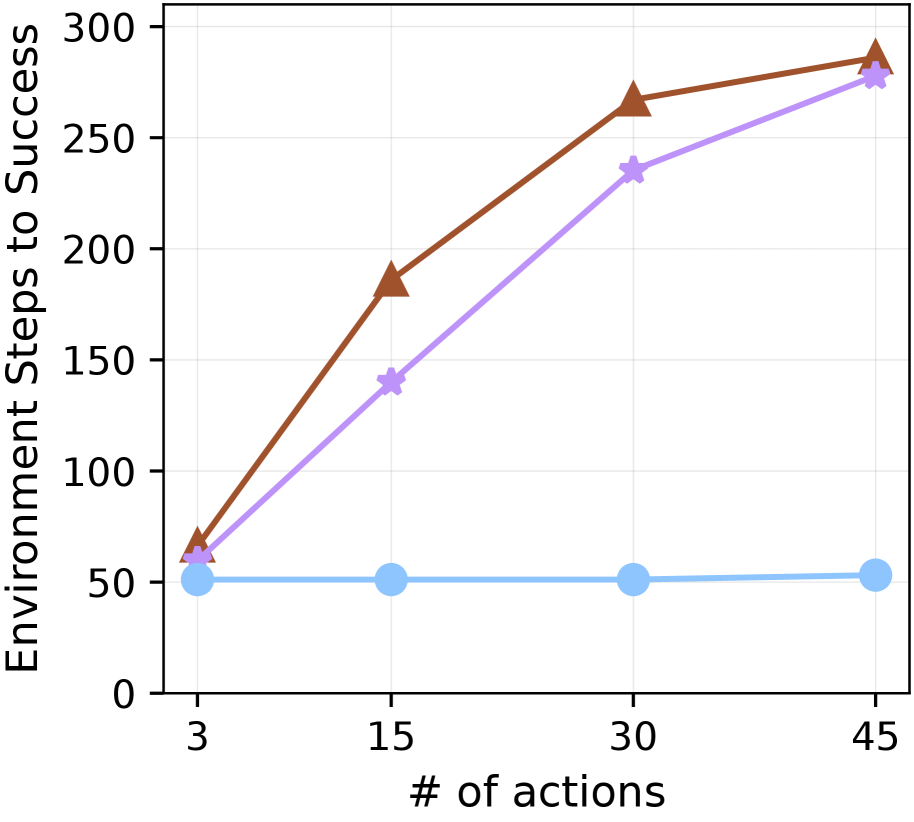
### Visual Description
## Line Chart: Environment Steps to Success vs. Number of Actions
### Overview
This is a line chart plotting "Environment Steps to Success" against the "# of actions". It displays three distinct data series, each represented by a different color and marker shape, showing how the required steps change as the number of actions increases. The chart has a clean, white background with light gray grid lines.
### Components/Axes
* **X-Axis (Horizontal):**
* **Label:** "# of actions"
* **Scale/Ticks:** The axis is marked with four discrete values: 3, 15, 30, and 45.
* **Y-Axis (Vertical):**
* **Label:** "Environment Steps to Success"
* **Scale/Ticks:** The axis ranges from 0 to 300, with major tick marks at intervals of 50 (0, 50, 100, 150, 200, 250, 300).
* **Data Series (Legend inferred from visual markers):**
1. **Brown Line with Upward-Pointing Triangle Markers:** Represents one method or condition.
2. **Purple Line with Star Markers:** Represents a second method or condition.
3. **Light Blue Line with Circle Markers:** Represents a third method or condition.
* **Spatial Grounding:** There is no explicit legend box within the chart area. The series are identified solely by their line color and marker shape as plotted.
### Detailed Analysis
**Data Points (Approximate Values):**
| # of Actions (X) | Brown Line (Triangles) | Purple Line (Stars) | Light Blue Line (Circles) |
| :--- | :--- | :--- | :--- |
| **3** | ~65 | ~60 | ~50 |
| **15** | ~185 | ~140 | ~50 |
| **30** | ~265 | ~235 | ~50 |
| **45** | ~285 | ~275 | ~52 |
**Trend Verification:**
* **Brown Line (Triangles):** Exhibits a strong, positive, and slightly decelerating upward trend. The slope is steepest between 3 and 15 actions, remains strong between 15 and 30, and flattens slightly between 30 and 45.
* **Purple Line (Stars):** Shows a consistent, positive upward trend. The slope is relatively steady across the entire range, though it appears slightly less steep than the brown line's initial segment.
* **Light Blue Line (Circles):** Displays a flat, horizontal trend. The value remains nearly constant at approximately 50 steps across all measured action counts, with a very slight, possibly negligible, increase at 45 actions.
### Key Observations
1. **Diverging Performance:** The performance (in terms of steps required) of the three methods diverges significantly as the number of actions increases. At 3 actions, all three are clustered closely between ~50-65 steps. By 45 actions, a gap of over 200 steps separates the highest (Brown) from the lowest (Blue).
2. **Efficiency of the Blue Method:** The method represented by the light blue line demonstrates remarkable scalability. Its success cost (environment steps) is invariant to the increase in the number of actions within the tested range.
3. **Relative Cost:** The brown method is consistently the most "expensive" (requires the most steps) for any given number of actions greater than 3. The purple method is intermediate, and the blue method is the most efficient.
4. **Convergence at Low Action Count:** At the lowest action count (3), the brown and purple methods start at nearly the same point (~60-65 steps), suggesting similar initial overhead or baseline cost.
### Interpretation
This chart likely compares the efficiency or scalability of different algorithms, policies, or system configurations in a sequential decision-making or reinforcement learning context. The "# of actions" could represent task complexity, planning horizon, or the number of decisions an agent must make. "Environment Steps to Success" is a common metric for sample efficiency or computational cost.
* **The Blue Line's Flat Trend** suggests a method whose performance is **decoupled from the action count**. This could indicate a highly optimized planner, a heuristic-based approach, or a system that pre-computes a solution, making its execution cost constant regardless of problem size (within this range).
* **The Brown and Purple Lines' Upward Trends** indicate methods whose cost scales with problem size. The brown method scales more poorly (steeper slope) than the purple one. This could represent different search algorithms (e.g., brute-force vs. heuristic search), where more actions exponentially increase the search space for the brown method.
* **The Divergence** highlights a critical trade-off: methods that may be competitive on simple tasks (3 actions) can become prohibitively expensive on more complex tasks (45 actions). The blue method appears to be the most robust and scalable solution presented.
**Notable Anomaly:** The data point for the brown line at 45 actions (~285) is very close to the purple line's value (~275). This near-convergence at the high end might suggest a ceiling effect or that both methods are approaching a fundamental limit for the task, though the brown method still requires slightly more steps.
</details>
(b) Steps to success (lower is better)
Figure 25: Ablation on action selection methods for subgoal construction. We evaluate different action selection methods for solving long-horizon goals given an oracle dependency graph, as the size of the available action set increases. (a) Success rate and (b) number of environment steps per successful episode. Note that in (a), the curves for LLM and SC overlap at 0.0 because they fail on all episodes, and in (b), they are omitted since they never succeed.
We find that, while LLMs can in principle accelerate the search for valid actions, they do so effectively only when their flawed knowledge is corrected algorithmically. To support this, we study how different action selection methods for subgoal construction affect performance on long-horizon goals. In this ablation, the agent is given an oracle dependency graph and a long-horizon goal, and only needs to output one valid action from the available actions for each subgoal item to achieve that goal. Each episode specifies a single goal item, and it is counted as successful if the agent obtains this item within 300 environment steps in MC-TextWorld. To study scalability with respect to the size of the available action set, we vary the number of actions as 3, 15, 30, and 45 by gradually adding actions such as “harvest” and “hunt” to the original three actions (“mine”, “craft”, “smelt”).
Methods and metrics
We compare five action selection methods: Random+FAM (which randomly samples from available actions that have not yet repeatedly failed and reuses past successful actions), UCB, LLM without memory, LLM self-correction (SC), and XENON, which combines an LLM with FAM. We report the average success rate and the average number of environment steps to success over 20 runs per goal item, where goal items are drawn from the Redstone group.
As shown in Figure ˜ 25, among the three LLM-based methods (LLM, SC, XENON), only XENON—which corrects the LLM’s action knowledge by removing repeatedly failed actions from the set of candidate actions the LLM is allowed to select—solves long-horizon goals reliably, maintaining a success rate of 1.0 and requiring roughly 50 environment steps across all sizes of the available action set. In contrast, LLM and SC never succeed in any episode, because they keep selecting incorrect actions for subgoal items (e.g., redstone), and therefore perform worse than the non-LLM baselines, Random+FAM and UCB. Random+FAM and UCB perform well when the number of available actions is small, but become increasingly slow and unreliable as the number of actions grows, often failing to reach the goal within the episode horizon.
### K.11 Robustness to Smaller Planner LLMs and Limited Initial Knowledge
<details>
<summary>x69.png Details</summary>

### Visual Description
\n
## Chart Legend: Series Identification
### Overview
The image displays a horizontal legend box, typically used to identify data series in a chart or graph. It contains five distinct entries, each pairing a colored geometric symbol with a text label. The legend is presented on a white background with a subtle, light gray border.
### Components/Axes
The legend is a single-row container with the following elements, listed from left to right:
1. **Symbol 1:** A light blue circle with a horizontal line through its center.
* **Label:** `XENON`
2. **Symbol 2:** A pink diamond.
* **Label:** `SC`
3. **Symbol 3:** An orange "X" or cross symbol.
* **Label:** `ADAM`
4. **Symbol 4:** A lime green square.
* **Label:** `DECKARD`
5. **Symbol 5:** A dark blue plus sign (`+`).
* **Label:** `RAND`
**Spatial Layout:** The legend is horizontally oriented. Each symbol is positioned to the immediate left of its corresponding text label. The entries are evenly spaced across the width of the legend box.
### Detailed Analysis
This is a legend-only image. The primary chart or graph to which this legend refers is **not present**. Therefore, no numerical data, axes, scales, or data trends can be extracted.
The legend defines five categorical series:
* **XENON** (Light Blue Circle-Line)
* **SC** (Pink Diamond)
* **ADAM** (Orange Cross)
* **DECKARD** (Lime Green Square)
* **RAND** (Dark Blue Plus)
### Key Observations
1. **Distinct Visual Encoding:** Each series is differentiated by both a unique color and a unique symbol shape, which is a best practice for accessibility and clarity in data visualization.
2. **Label Content:** The labels (`XENON`, `SC`, `ADAM`, `DECKARD`, `RAND`) appear to be proper nouns or codenames. They do not describe generic categories (e.g., "Series A," "Control") but suggest specific entities, models, or project names.
3. **Missing Context:** The critical context—the chart itself—is absent. Without the main visual, it is impossible to determine what these series represent, what is being measured, or how they relate to one another.
### Interpretation
This image is a **component** of a larger technical visualization. Its sole purpose is to provide a key for decoding the main chart.
* **What it suggests:** The legend implies the existence of a multi-series chart (likely a line chart, scatter plot, or similar) comparing five distinct items. The use of specific, non-descriptive names like "DECKARD" and "RAND" could indicate:
* Code names for software models, algorithms, or system components.
* Identifiers for specific datasets, experiments, or test subjects.
* Names of proprietary technologies or products.
* **Why it matters:** In a complete document, this legend would be essential for interpreting the data. The choice of distinct colors and symbols indicates the author intended for the five series to be easily distinguishable, even when plotted closely together or viewed in grayscale.
* **Limitation:** As an isolated element, it provides **no factual data or trends**. It is a navigational aid, not a source of information. To understand the data, the main chart to which this legend belongs is required.
**Language Declaration:** All text in the image is in English. No other languages are present.
</details>
<details>
<summary>x70.png Details</summary>
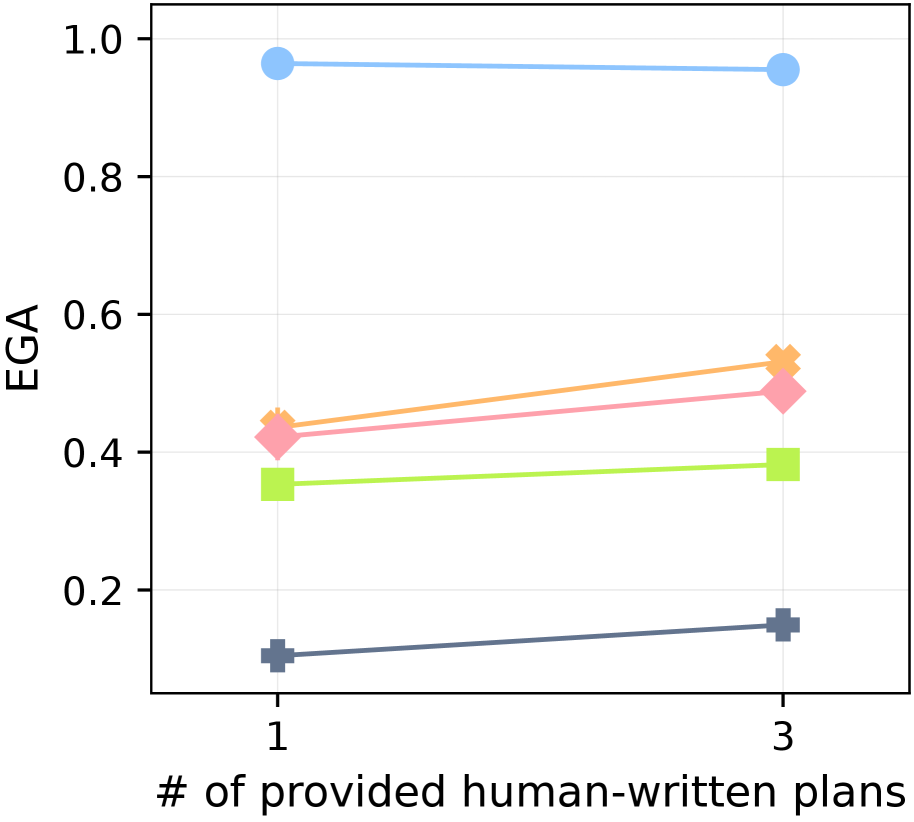
### Visual Description
\n
## Line Chart: EGA vs. Number of Provided Human-Written Plans
### Overview
This is a line chart plotting the performance metric "EGA" against the number of provided human-written plans. The chart compares five distinct data series, each represented by a unique color and marker shape, across two data points on the x-axis (1 and 3 plans). The overall trend shows that for most series, EGA increases as the number of provided plans increases from 1 to 3.
### Components/Axes
* **X-Axis (Horizontal):**
* **Label:** "# of provided human-written plans"
* **Scale/Markers:** Discrete values at `1` and `3`.
* **Y-Axis (Vertical):**
* **Label:** "EGA"
* **Scale:** Linear scale ranging from `0.0` to `1.0`, with major gridlines at intervals of 0.2 (0.0, 0.2, 0.4, 0.6, 0.8, 1.0).
* **Data Series (Legend inferred from visual markers):**
* **Blue Line with Circle Markers:** Positioned at the top of the chart.
* **Orange Line with Diamond Markers:** Positioned in the middle-upper range.
* **Pink Line with Diamond Markers:** Positioned just below the orange line.
* **Light Green Line with Square Markers:** Positioned in the middle-lower range.
* **Dark Gray/Blue Line with Plus (+) Markers:** Positioned at the bottom of the chart.
### Detailed Analysis
**Data Series Trends and Approximate Values:**
1. **Blue Line (Circle Markers):**
* **Trend:** Nearly flat, showing a very slight decrease.
* **Value at x=1:** ~0.96
* **Value at x=3:** ~0.95
2. **Orange Line (Diamond Markers):**
* **Trend:** Clear upward slope.
* **Value at x=1:** ~0.44
* **Value at x=3:** ~0.53
3. **Pink Line (Diamond Markers):**
* **Trend:** Clear upward slope, parallel to but slightly below the orange line.
* **Value at x=1:** ~0.42
* **Value at x=3:** ~0.49
4. **Light Green Line (Square Markers):**
* **Trend:** Slight upward slope.
* **Value at x=1:** ~0.35
* **Value at x=3:** ~0.38
5. **Dark Gray/Blue Line (Plus Markers):**
* **Trend:** Clear upward slope.
* **Value at x=1:** ~0.10
* **Value at x=3:** ~0.15
### Key Observations
* **Performance Hierarchy:** There is a consistent and significant performance gap between the series. The blue series performs near the ceiling (EGA ~0.95), while the dark gray series performs near the floor (EGA ~0.10-0.15).
* **Positive Correlation:** Four out of five series (Orange, Pink, Green, Dark Gray) show a positive correlation between the number of provided human-written plans and EGA. The improvement is most pronounced for the Orange and Pink series.
* **Diminishing Returns for Top Performer:** The highest-performing (Blue) series shows negligible change, suggesting it may already be at or near optimal performance with just one plan.
* **Clustering:** The Orange and Pink series are closely clustered, as are the Green and Dark Gray series at a lower tier.
### Interpretation
The chart demonstrates that providing more human-written plans (increasing from 1 to 3) generally leads to improved performance as measured by EGA for most methods or models tested. This suggests that access to multiple reference plans provides beneficial guidance.
However, the impact is not uniform. The method represented by the blue line is highly effective even with a single plan, indicating robustness or superior underlying capability. The methods in the middle (Orange, Pink) benefit significantly from additional plans, showing they can effectively leverage extra guidance. The lower-performing methods (Green, Dark Gray) also improve but remain in a lower performance bracket, suggesting fundamental limitations that additional plans alone cannot overcome.
The data implies a strategic insight: for systems already performing at a high level (Blue), investing in more human-written plans yields minimal return. For mid-tier systems, providing 3 plans instead of 1 offers a clear performance boost. For lower-tier systems, while more plans help, other improvements to the core method may be necessary for substantial gains.
</details>
(a) Planner LLM size: 4B
<details>
<summary>x71.png Details</summary>
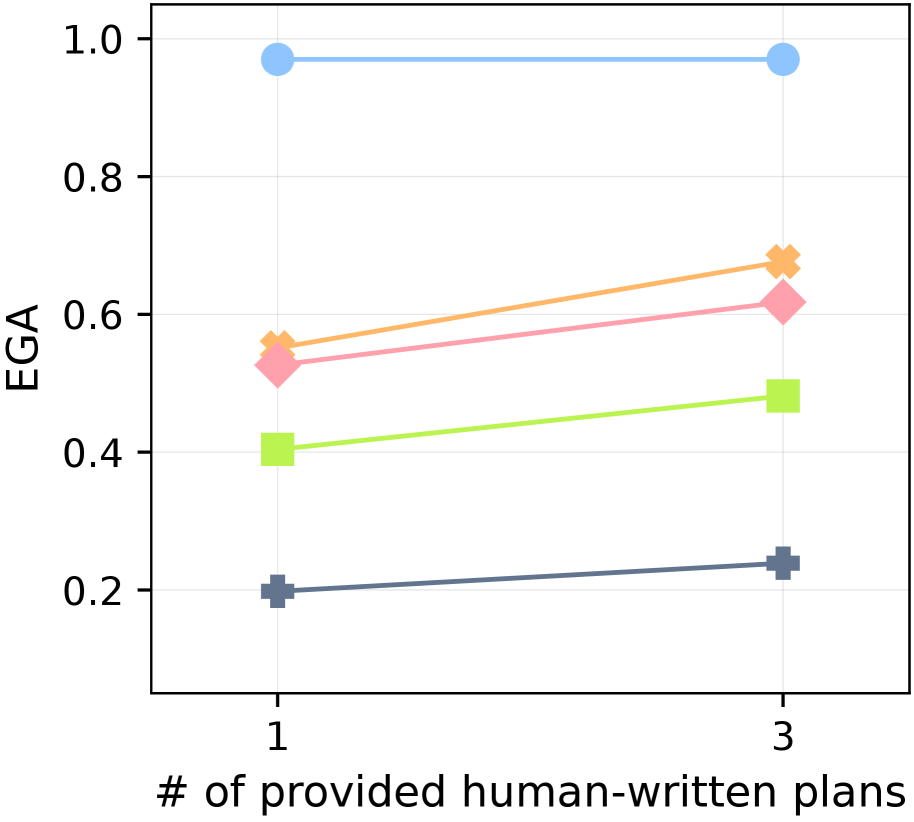
### Visual Description
## Line Chart: EGA vs. Number of Provided Human-Written Plans
### Overview
The image is a line chart plotting a metric called "EGA" against the number of provided human-written plans. The chart displays five distinct data series, each represented by a different color and marker shape, showing how the EGA metric changes when the number of plans increases from 1 to 3.
### Components/Axes
* **X-Axis (Horizontal):**
* **Label:** "# of provided human-written plans"
* **Scale:** Categorical with two discrete points: "1" and "3".
* **Y-Axis (Vertical):**
* **Label:** "EGA"
* **Scale:** Linear, ranging from 0.2 to 1.0, with major tick marks at 0.2, 0.4, 0.6, 0.8, and 1.0.
* **Data Series (Lines & Markers):** There are five distinct lines. A legend is not visible in the provided image, so series are identified by their visual properties.
* **Background:** White with light gray horizontal grid lines aligned with the y-axis ticks.
### Detailed Analysis
The chart plots data points at two x-axis values: 1 and 3. The approximate EGA values for each series are as follows:
1. **Light Blue Line (Circle Markers):**
* **Trend:** Nearly flat, showing a very slight decrease.
* **Value at x=1:** ~0.97
* **Value at x=3:** ~0.97
* **Position:** This is the highest line on the chart, positioned near the top.
2. **Orange Line ('X' Markers):**
* **Trend:** Clear upward slope.
* **Value at x=1:** ~0.55
* **Value at x=3:** ~0.67
* **Position:** Starts as the second-highest line at x=1 and remains the second-highest at x=3.
3. **Pink Line (Diamond Markers):**
* **Trend:** Clear upward slope.
* **Value at x=1:** ~0.52
* **Value at x=3:** ~0.61
* **Position:** Starts just below the orange line at x=1 and remains just below it at x=3.
4. **Light Green Line (Square Markers):**
* **Trend:** Clear upward slope.
* **Value at x=1:** ~0.40
* **Value at x=3:** ~0.48
* **Position:** This is the fourth-highest line at both data points.
5. **Gray Line (Plus '+' Markers):**
* **Trend:** Slight upward slope.
* **Value at x=1:** ~0.20
* **Value at x=3:** ~0.23
* **Position:** This is the lowest line on the chart.
### Key Observations
* **Universal Non-Decreasing Trend:** All five data series show either an increase or stability in EGA as the number of provided human-written plans increases from 1 to 3. No series shows a decrease.
* **Performance Stratification:** There is a clear and consistent hierarchy in EGA values across the series that is maintained at both data points. The blue series performs best, followed by orange, pink, green, and gray.
* **Varying Rates of Improvement:** The magnitude of improvement (slope) differs between series. The orange and pink lines show the most pronounced gains, while the blue line is essentially static and the gray line shows minimal improvement.
* **Ceiling Effect:** The top-performing (blue) series is already near the maximum possible EGA value of 1.0 at x=1, leaving little room for improvement.
### Interpretation
The data suggests a positive correlation between the quantity of human-written plans provided (increasing from 1 to 3) and the resulting EGA metric for most of the evaluated methods or models. This implies that access to more human-generated planning examples generally aids performance.
The consistent performance hierarchy indicates that the underlying methods have fundamentally different capabilities, with one (blue) operating at a near-perfect level regardless of the small increase in plan count. The varying slopes suggest that some methods (orange, pink) are more effective at leveraging additional planning data than others (gray, blue). The blue series' plateau is a classic ceiling effect, indicating its performance is already saturated. This chart would be crucial for evaluating which planning-augmented approach is most effective and how sensitive each is to the volume of provided human guidance.
</details>
(b) Planner LLM size: 7B
Figure 26: Effect of planner LLM size and initial dependency graph quality in dependency and action learning. The plots show EGA after 3,000 environment steps of dependency and action learning in MC-TextWorld, obtained by varying the planner LLM size and the amount of correct knowledge in the initial dependency graph (controlled by the number of provided human-written plans). In (a), the planner is Phi-4-mini (4B) (Microsoft et al., 2025); in (b), the planner is Qwen2.5-VL-7B (7B) (Bai et al., 2025).
We further evaluate robustness of XENON and the baselines to limited prior knowledge by measuring dependency and action learning in MC-TextWorld while (i) varying the planner LLM size and (ii) degrading the quality of the initial dependency graph. For the planner LLM, we compare a 7B model (Qwen2.5-VL-7B (Bai et al., 2025)) against a 4B model (Phi-4-mini (Microsoft et al., 2025)); for the initial graph quality, we vary the number of provided human-written plans used to initialize the graph from three (“craft iron_sword”, “mine diamond”, “craft golden_sword”) to one (“craft iron_sword”).
As shown in Figure ˜ 26, XENON remains robust across all these settings: its EGA stays near-perfect even with the smaller 4B planner and the weakest initial graph, indicating that leveraging experiences can quickly compensate for weak priors. In contrast, baselines that rely on LLM self-correction (SC) or that strongly depend on the LLM or initial graph (ADAM, DECKARD) suffer substantial drops in EGA as the planner LLM becomes smaller and the initial graph contains less correct prior knowledge. This suggests that, in our setting, algorithmic knowledge correction is more critical than scaling up the planner LLM or richer initial human-provided knowledge.
### K.12 Full results on the long-horizon tasks benchmark
In this section, we report XENON’s performance on each goal within the long-horizon tasks benchmark, detailing metrics such as the goal item, number of sub-goals, success rate (SR), and evaluation episodes.
Table ˜ 18 and 19 present XENON’s results when utilizing the dependency graph learned through 400 episodes of exploration. Conversely, Table ˜ 20 and 21 display XENON ∗ ’s performance, which leverages an oracle dependency graph.
Table 18: The results of XENON (with dependency graph learned via exploration across 400 episodes) on the Wood group, Stone group, and Iron group. SR denotes success rate.
| Group | Goal | Sub-Goal Num. | SR | Eval Episodes |
| --- | --- | --- | --- | --- |
| Wood | bowl | 4 | 92.68 | 41 |
| chest | 4 | 95.24 | 42 | |
| crafting_table | 3 | 95.83 | 48 | |
| ladder | 5 | 0.00 | 31 | |
| stick | 3 | 95.45 | 44 | |
| wooden_axe | 5 | 90.91 | 44 | |
| wooden_hoe | 5 | 95.35 | 43 | |
| wooden_pickaxe | 5 | 93.02 | 43 | |
| wooden_shovel | 5 | 93.75 | 48 | |
| wooden_sword | 5 | 95.35 | 43 | |
| Stone | charcoal | 8 | 87.50 | 40 |
| furnace | 7 | 88.10 | 42 | |
| smoker | 8 | 0.00 | 47 | |
| stone_axe | 7 | 97.78 | 45 | |
| stone_hoe | 7 | 90.70 | 43 | |
| stone_pickaxe | 7 | 95.45 | 44 | |
| stone_shovel | 7 | 89.58 | 48 | |
| stone_sword | 7 | 89.80 | 49 | |
| torch | 7 | 93.02 | 43 | |
| Iron | blast_furnace | 13 | 0.00 | 42 |
| bucket | 11 | 0.00 | 47 | |
| chain | 12 | 0.00 | 42 | |
| hopper | 12 | 0.00 | 47 | |
| iron_axe | 11 | 75.56 | 45 | |
| iron_bars | 11 | 80.43 | 46 | |
| iron_hoe | 11 | 89.13 | 46 | |
| iron_nugget | 11 | 79.55 | 44 | |
| iron_pickaxe | 11 | 77.08 | 48 | |
| iron_shovel | 11 | 75.56 | 45 | |
| iron_sword | 11 | 84.78 | 46 | |
| rail | 11 | 0.00 | 44 | |
| shears | 11 | 0.00 | 43 | |
| smithing_table | 11 | 93.75 | 48 | |
| stonecutter | 12 | 0.00 | 43 | |
| tripwire_hook | 11 | 78.43 | 51 | |
Table 19: The results of XENON (with dependency graph learned via exploration across 400 episodes) on the Gold group, Diamond group, Redstone group, and Armor group. SR denotes success rate.
| Group | Goal Item | Sub Goal Num. | SR | Eval Episodes |
| --- | --- | --- | --- | --- |
| Gold | gold_ingot | 13 | 76.92 | 52 |
| golden_axe | 14 | 72.00 | 50 | |
| golden_hoe | 14 | 66.67 | 48 | |
| golden_pickaxe | 14 | 76.00 | 50 | |
| golden_shovel | 14 | 71.74 | 46 | |
| golden_sword | 14 | 78.26 | 46 | |
| Diamond | diamond | 12 | 87.76 | 49 |
| diamond_axe | 13 | 72.55 | 51 | |
| diamond_hoe | 13 | 63.79 | 58 | |
| diamond_pickaxe | 13 | 60.71 | 56 | |
| diamond_shovel | 13 | 84.31 | 51 | |
| diamond_sword | 13 | 76.79 | 56 | |
| jukebox | 13 | 0.00 | 48 | |
| Redstone | activator_rail | 14 | 0.00 | 3 |
| compass | 13 | 0.00 | 3 | |
| dropper | 13 | 0.00 | 3 | |
| note_block | 13 | 0.00 | 4 | |
| piston | 13 | 0.00 | 12 | |
| redstone_torch | 13 | 0.00 | 19 | |
| Armor | diamond_boots | 13 | 64.29 | 42 |
| diamond_chestplate | 13 | 0.00 | 44 | |
| diamond_helmet | 13 | 67.50 | 40 | |
| diamond_leggings | 13 | 0.00 | 37 | |
| golden_boots | 14 | 69.23 | 39 | |
| golden_chestplate | 14 | 0.00 | 39 | |
| golden_helmet | 14 | 60.53 | 38 | |
| golden_leggings | 14 | 0.00 | 38 | |
| iron_boots | 11 | 94.44 | 54 | |
| iron_chestplate | 11 | 0.00 | 42 | |
| iron_helmet | 11 | 4.26 | 47 | |
| iron_leggings | 11 | 0.00 | 41 | |
| shield | 11 | 0.00 | 46 | |
Table 20: The results of XENON ∗ (with oracle dependency graph) on the Wood group, Stone group, and Iron group. SR denotes success rate.
| Group | Goal Item | Sub-Goal Num. | SR | Eval Episodes |
| --- | --- | --- | --- | --- |
| Wood | bowl | 4 | 94.55 | 55 |
| chest | 4 | 94.74 | 57 | |
| crafting_table | 3 | 94.83 | 58 | |
| ladder | 5 | 94.74 | 57 | |
| stick | 3 | 95.08 | 61 | |
| wooden_axe | 5 | 94.64 | 56 | |
| wooden_hoe | 5 | 94.83 | 58 | |
| wooden_pickaxe | 5 | 98.33 | 60 | |
| wooden_shovel | 5 | 96.49 | 57 | |
| wooden_sword | 5 | 94.83 | 58 | |
| Stone | charcoal | 8 | 92.68 | 41 |
| furnace | 7 | 90.00 | 40 | |
| smoker | 8 | 87.50 | 40 | |
| stone_axe | 7 | 95.12 | 41 | |
| stone_hoe | 7 | 94.87 | 39 | |
| stone_pickaxe | 7 | 94.87 | 39 | |
| stone_shovel | 7 | 94.87 | 39 | |
| stone_sword | 7 | 92.11 | 38 | |
| torch | 7 | 92.50 | 40 | |
| Iron | blast_furnace | 13 | 82.22 | 45 |
| bucket | 11 | 89.47 | 38 | |
| chain | 12 | 83.33 | 36 | |
| hopper | 12 | 77.78 | 36 | |
| iron_axe | 11 | 82.50 | 40 | |
| iron_bars | 11 | 85.29 | 34 | |
| iron_hoe | 11 | 75.68 | 37 | |
| iron_nugget | 11 | 84.78 | 46 | |
| iron_pickaxe | 11 | 83.33 | 42 | |
| iron_shovel | 11 | 78.38 | 37 | |
| iron_sword | 11 | 85.42 | 48 | |
| rail | 11 | 80.56 | 36 | |
| shears | 11 | 82.05 | 39 | |
| smithing_table | 11 | 83.78 | 37 | |
| stonecutter | 12 | 86.84 | 38 | |
| tripwire_hook | 11 | 91.18 | 34 | |
Table 21: The results of XENON ∗ (with oracle dependency graph) on the Gold group, Diamond group, Redstone group, and Armor group. SR denotes success rate.
| Group | Goal Item | Sub Goal Num. | SR | Eval Episodes |
| --- | --- | --- | --- | --- |
| Gold | gold_ingot | 13 | 78.38 | 37 |
| golden_axe | 14 | 65.12 | 43 | |
| golden_hoe | 14 | 70.27 | 37 | |
| golden_pickaxe | 14 | 75.00 | 36 | |
| golden_shovel | 14 | 78.38 | 37 | |
| Diamond | diamond | 12 | 71.79 | 39 |
| diamond_axe | 13 | 70.00 | 40 | |
| diamond_hoe | 13 | 85.29 | 34 | |
| diamond_pickaxe | 13 | 72.09 | 43 | |
| diamond_shovel | 13 | 76.19 | 42 | |
| diamond_sword | 13 | 80.56 | 36 | |
| jukebox | 13 | 69.77 | 43 | |
| Redstone | activator_rail | 14 | 67.39 | 46 |
| compass | 13 | 70.00 | 40 | |
| dropper | 13 | 75.00 | 40 | |
| note_block | 13 | 89.19 | 37 | |
| piston | 13 | 65.79 | 38 | |
| redstone_torch | 13 | 84.85 | 33 | |
| Armor | diamond_boots | 13 | 60.78 | 51 |
| diamond_chestplate | 13 | 20.00 | 50 | |
| diamond_helmet | 13 | 71.79 | 39 | |
| diamond_leggings | 13 | 33.33 | 39 | |
| golden_boots | 14 | 75.00 | 40 | |
| golden_chestplate | 14 | 0.00 | 36 | |
| golden_helmet | 14 | 54.05 | 37 | |
| golden_leggings | 14 | 0.00 | 38 | |
| iron_boots | 11 | 93.62 | 47 | |
| iron_chestplate | 11 | 97.50 | 40 | |
| iron_helmet | 11 | 86.36 | 44 | |
| iron_leggings | 11 | 97.50 | 40 | |
| shield | 11 | 97.62 | 42 | |
### K.13 Experiments compute resources
All experiments were conducted on an internal computing cluster equipped with RTX3090, A5000, and A6000 GPUs. We report the total aggregated compute time from running multiple parallel experiments. For the dependency learning, exploration across 400 episodes in the MineRL environment, the total compute time was 24 days. The evaluation on the long-horizon tasks benchmark in the MineRL environment required a total of 34 days of compute. Experiments within the MC-TextWorld environment for dependency learning utilized a total of 3 days of compute. We note that these values represent aggregated compute time, and the actual wall-clock time for individual experiments was significantly shorter due to parallelization.
## Appendix L The Use of Large Language Models (LLMs)
In preparing this manuscript, we used an LLM as a writing assistant to improve the text. Its role included refining grammar and phrasing, suggesting clearer sentence structures, and maintaining a consistent academic tone. All technical contributions, experimental designs, and final claims were developed by the human authors, who thoroughly reviewed and take full responsibility for the paper’s content.