# ReasonFlux-PRM: Trajectory-Aware PRMs for Long Chain-of-Thought Reasoning in LLMs
**Authors**:
- Jiaru Zou
- Ling Yang2,4∗\textsuperscript{{$\dagger$}}
- Jingwen Gu
- Jiahao Qiu
- Ke Shen
- Jingrui He
- Mengdi Wang (UIUC Princeton University Cornell University ByteDance Seed)
[*]Equal Contribution [†]Corresponding authors
## Abstract
Process Reward Models (PRMs) have recently emerged as a powerful framework for supervising intermediate reasoning steps in large language models (LLMs). Previous PRMs are primarily trained on model final output responses and struggle to evaluate intermediate thinking trajectories robustly, especially in the emerging setting of trajectory–response outputs generated by frontier reasoning models like Deepseek-R1. In this work, we introduce ReasonFlux-PRM, a novel trajectory-aware PRM explicitly designed to evaluate the trajectory-response type of reasoning traces. ReasonFlux-PRM incorporates both step-level and trajectory-level supervision, enabling fine-grained reward assignment aligned with structured chain-of-thought data. We adapt ReasonFlux-PRM to support reward supervision under both offline and online settings, including (i) selecting high-quality model distillation data for downstream supervised fine-tuning of smaller models, (ii) providing dense process-level rewards for policy optimization during reinforcement learning, and (iii) enabling reward-guided Best-of-N test-time scaling. Empirical results on challenging downstream benchmarks such as AIME, MATH500, and GPQA-Diamond demonstrate that ReasonFlux-PRM-7B selects higher quality data than strong PRMs (e.g., Qwen2.5-Math-PRM-72B) and human-curated baselines. Furthermore, our derived ReasonFlux-PRM-7B yields consistent performance improvements, achieving average gains of 12.1% in supervised fine-tuning, 4.5% in reinforcement learning, and 6.3% in test-time scaling. We also release our efficient ReasonFlux-PRM-1.5B for resource-constrained applications and edge deployment.
Ling Yang at , Mengdi Wang at
<details>
<summary>plots/intro_res.png Details</summary>
### Visual Description
## Radar Chart: Model Performance Across Benchmarks
### Overview
A radar chart comparing model performance across four benchmarks: AIME25, MATH500, GPQA-Diamond, and AIME24. Five data series are represented with distinct line styles and colors.
### Components/Axes
- **Axes**:
- Top: AIME25
- Left: MATH500
- Bottom: GPQA-Diamond
- Right: AIME24
- **Legend**:
- Orange dashed: Human Curated
- Dashed green: Skywork-PRM-7B
- Dotted yellow: Random
- Solid red: Qwen2.5-Math-PRM-7B
- Solid purple: ReasonFlux-PRM-7B
- **Scale**: 0.0 to 1.0 (outer ring)
### Detailed Analysis
- **Human Curated** (orange dashed): Outermost polygon, consistently highest values (~0.8–1.0 across all axes).
- **ReasonFlux-PRM-7B** (solid purple): Second-largest polygon, values ~0.6–0.9.
- **Qwen2.5-Math-PRM-7B** (solid red): Third-largest, values ~0.5–0.8.
- **Skywork-PRM-7B** (dashed green): Values ~0.4–0.7.
- **Random** (dotted yellow): Innermost polygon, values ~0.2–0.5.
### Key Observations
- Human Curated dominates all benchmarks, suggesting it represents a human performance baseline.
- ReasonFlux-PRM-7B consistently outperforms Qwen2.5-Math-PRM-7B and Skywork-PRM-7B.
- Random performs significantly worse than all trained models.
### Interpretation
The radar chart demonstrates that ReasonFlux-PRM-7B achieves the closest performance to the human-curated benchmark across all tasks, while Qwen2.5-Math-PRM-7B and Skywork-PRM-7B show moderate performance. The Random baseline highlights the effectiveness of the models compared to chance.
---
## Line Graph: Training Reward Over Steps
### Overview
A line graph tracking training reward over 180 steps for three models: GRPO, Qwen2.5-Math-PRM-7B, and ReasonFlux-PRM-7B.
### Components/Axes
- **X-axis**: Steps (0 to 180)
- **Y-axis**: Training Reward (0.1 to 0.4)
- **Legend**:
- Blue squares: GRPO
- Orange triangles: Qwen2.5-Math-PRM-7B
- Purple stars: ReasonFlux-PRM-7B
### Detailed Analysis
- **ReasonFlux-PRM-7B** (purple stars):
- Starts at ~0.28, peaks at ~0.42 by step 180.
- Smooth upward trend with minor fluctuations.
- **Qwen2.5-Math-PRM-7B** (orange triangles):
- Begins at ~0.15, reaches ~0.32 by step 180.
- Noisy with oscillations but generally increasing.
- **GRPO** (blue squares):
- Starts at ~0.05, rises to ~0.30 by step 180.
- Steeper initial growth but plateaus earlier.
### Key Observations
- ReasonFlux-PRM-7B achieves the highest final reward and maintains stability.
- Qwen2.5-Math-PRM-7B shows moderate performance with higher volatility.
- GRPO improves rapidly but lags behind the other two models in final reward.
### Interpretation
The graph indicates that ReasonFlux-PRM-7B has the most stable and effective training dynamics, while Qwen2.5-Math-PRM-7B and GRPO exhibit trade-offs between growth speed and stability.
---
## Scatter Plot: Accuracy vs. Number of Solutions (GPQA-Diamond)
### Overview
A scatter plot showing accuracy (%) against the number of solutions (N = 2¹ to 2⁴) for four models.
### Components/Axes
- **X-axis**: Number of Solutions (N) (2¹ to 2⁴)
- **Y-axis**: Accuracy (%) (48% to 54%)
- **Legend**:
- Red triangles: Qwen2.5-Math-PRM-7B
- Green dashed: Skywork-PRM-7B
- Blue squares: Majority
- Purple stars: ReasonFlux-PRM-7B
### Detailed Analysis
- **ReasonFlux-PRM-7B** (purple stars):
- Accuracy increases from ~48% (N=2¹) to ~54% (N=2⁴).
- Steep upward trend.
- **Qwen2.5-Math-PRM-7B** (red triangles):
- Accuracy rises from ~48% to ~53%.
- Slightly less steep than ReasonFlux.
- **Skywork-PRM-7B** (green dashed):
- Accuracy increases from ~48% to ~51%.
- Flatter growth.
- **Majority** (blue squares):
- Flat line at ~48% across all N values.
### Key Observations
- ReasonFlux-PRM-7B shows the strongest improvement with more solutions.
- Majority baseline remains constant, indicating no inherent model capability beyond random guessing.
- Qwen2.5-Math-PRM-7B and Skywork-PRM-7B show moderate gains.
### Interpretation
The scatter plot reveals that ReasonFlux-PRM-7B scales most effectively with increased computational resources (solutions), suggesting superior architectural efficiency. The Majority baseline underscores the importance of model training over brute-force methods.
---
## Cross-Referenced Trends
1. **Consistency Across Metrics**: ReasonFlux-PRM-7B outperforms all models in the radar chart, line graph, and scatter plot.
2. **Training Dynamics**: ReasonFlux-PRM-7B achieves higher rewards faster and more stably than Qwen2.5-Math-PRM-7B and GRPO.
3. **Scalability**: ReasonFlux-PRM-7B benefits most from increased solution counts (N), indicating better generalization.
## Conclusion
The data collectively demonstrates that ReasonFlux-PRM-7B is the most performant model across training stability, benchmark accuracy, and scalability. Qwen2.5-Math-PRM-7B and Skywork-PRM-7B show moderate performance, while GRPO and Majority lag behind. Human Curated remains the gold standard, but ReasonFlux-PRM-7B approaches it most closely.
</details>
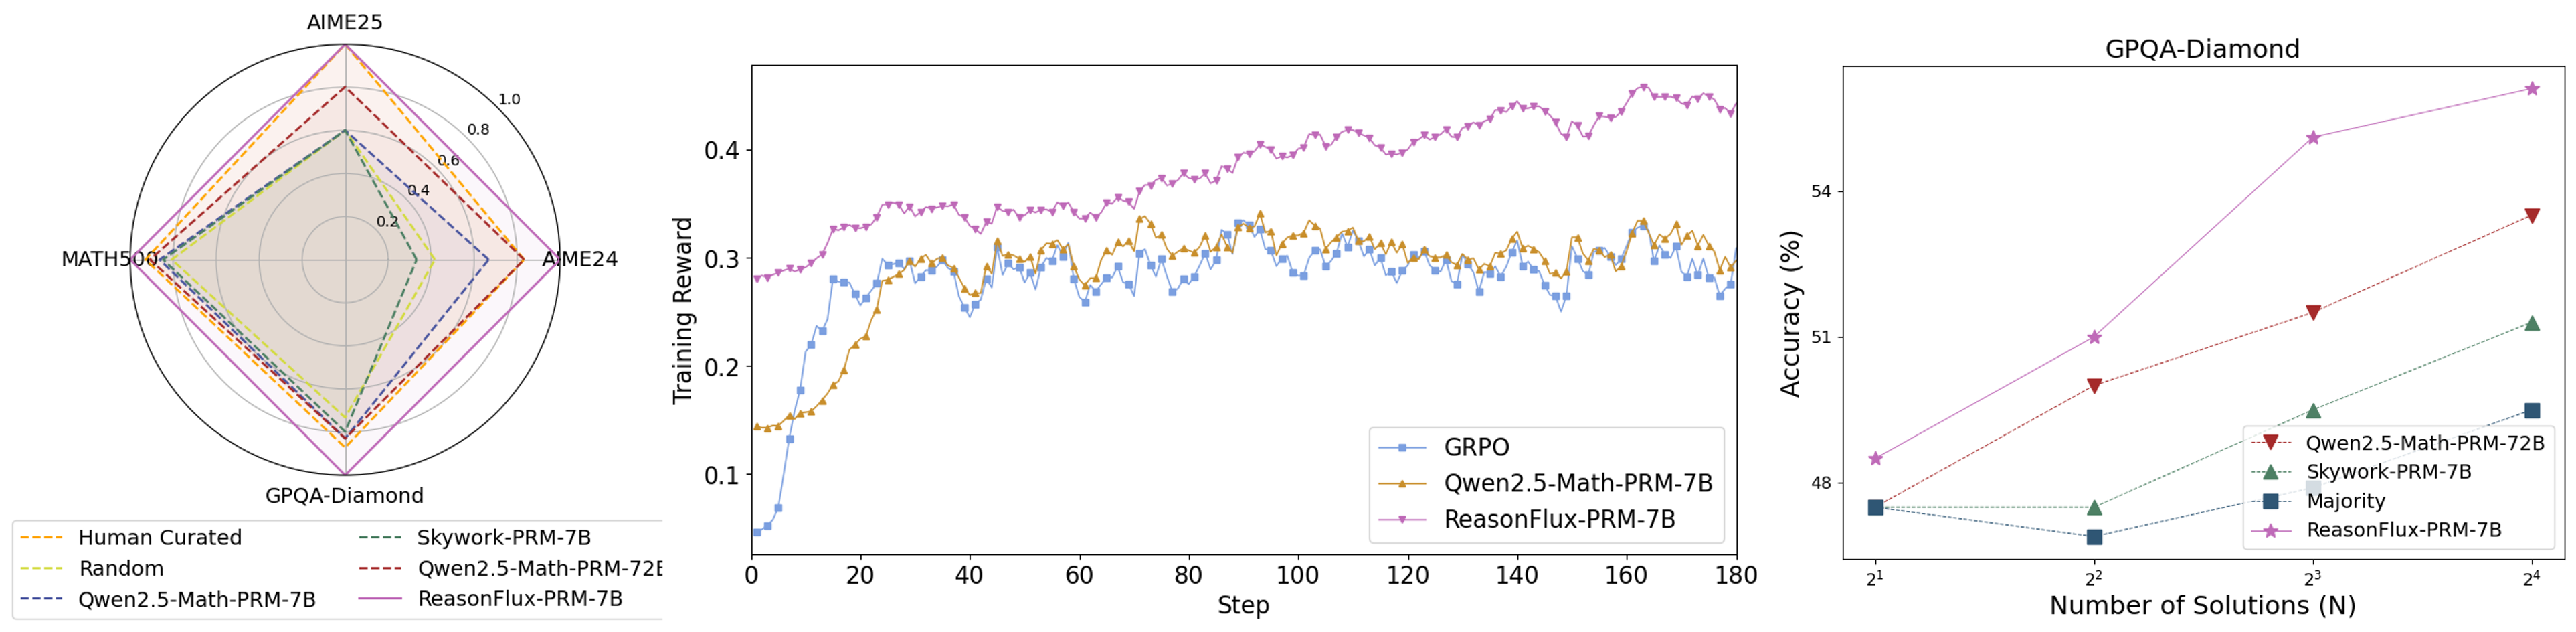
Figure 1: Overview of ReasonFlux-PRM. ReasonFlux-PRM is designed to provide general-purpose reward supervision across multiple application scenarios. Left: Offline selection of high-quality distilled trajectory–response data to enhance downstream supervised fine-tuning of smaller models. Middle: Online reward modeling integrated into GRPO-based policy optimization. Right: Reward-guided Best-of-N test-time scaling to improve inference-time performance.
## 1 Introduction
Process Reward Models [1, 2, 3] have recently emerged as a powerful framework for providing process-level supervision in large language models (LLMs) reasoning process, particularly for complex domains such as mathematical problem solving [4, 5, 1]. Given a question and the corresponding model’s final response, PRMs verify the reasoning step-by-step and assign fine-grained rewards to each step of the response. Prior studies have leveraged PRMs in both post-training stages [6, 7], including providing dense rewards for online reinforcement learning (RL) [8], and reward-guided inference-time scaling [9, 10].
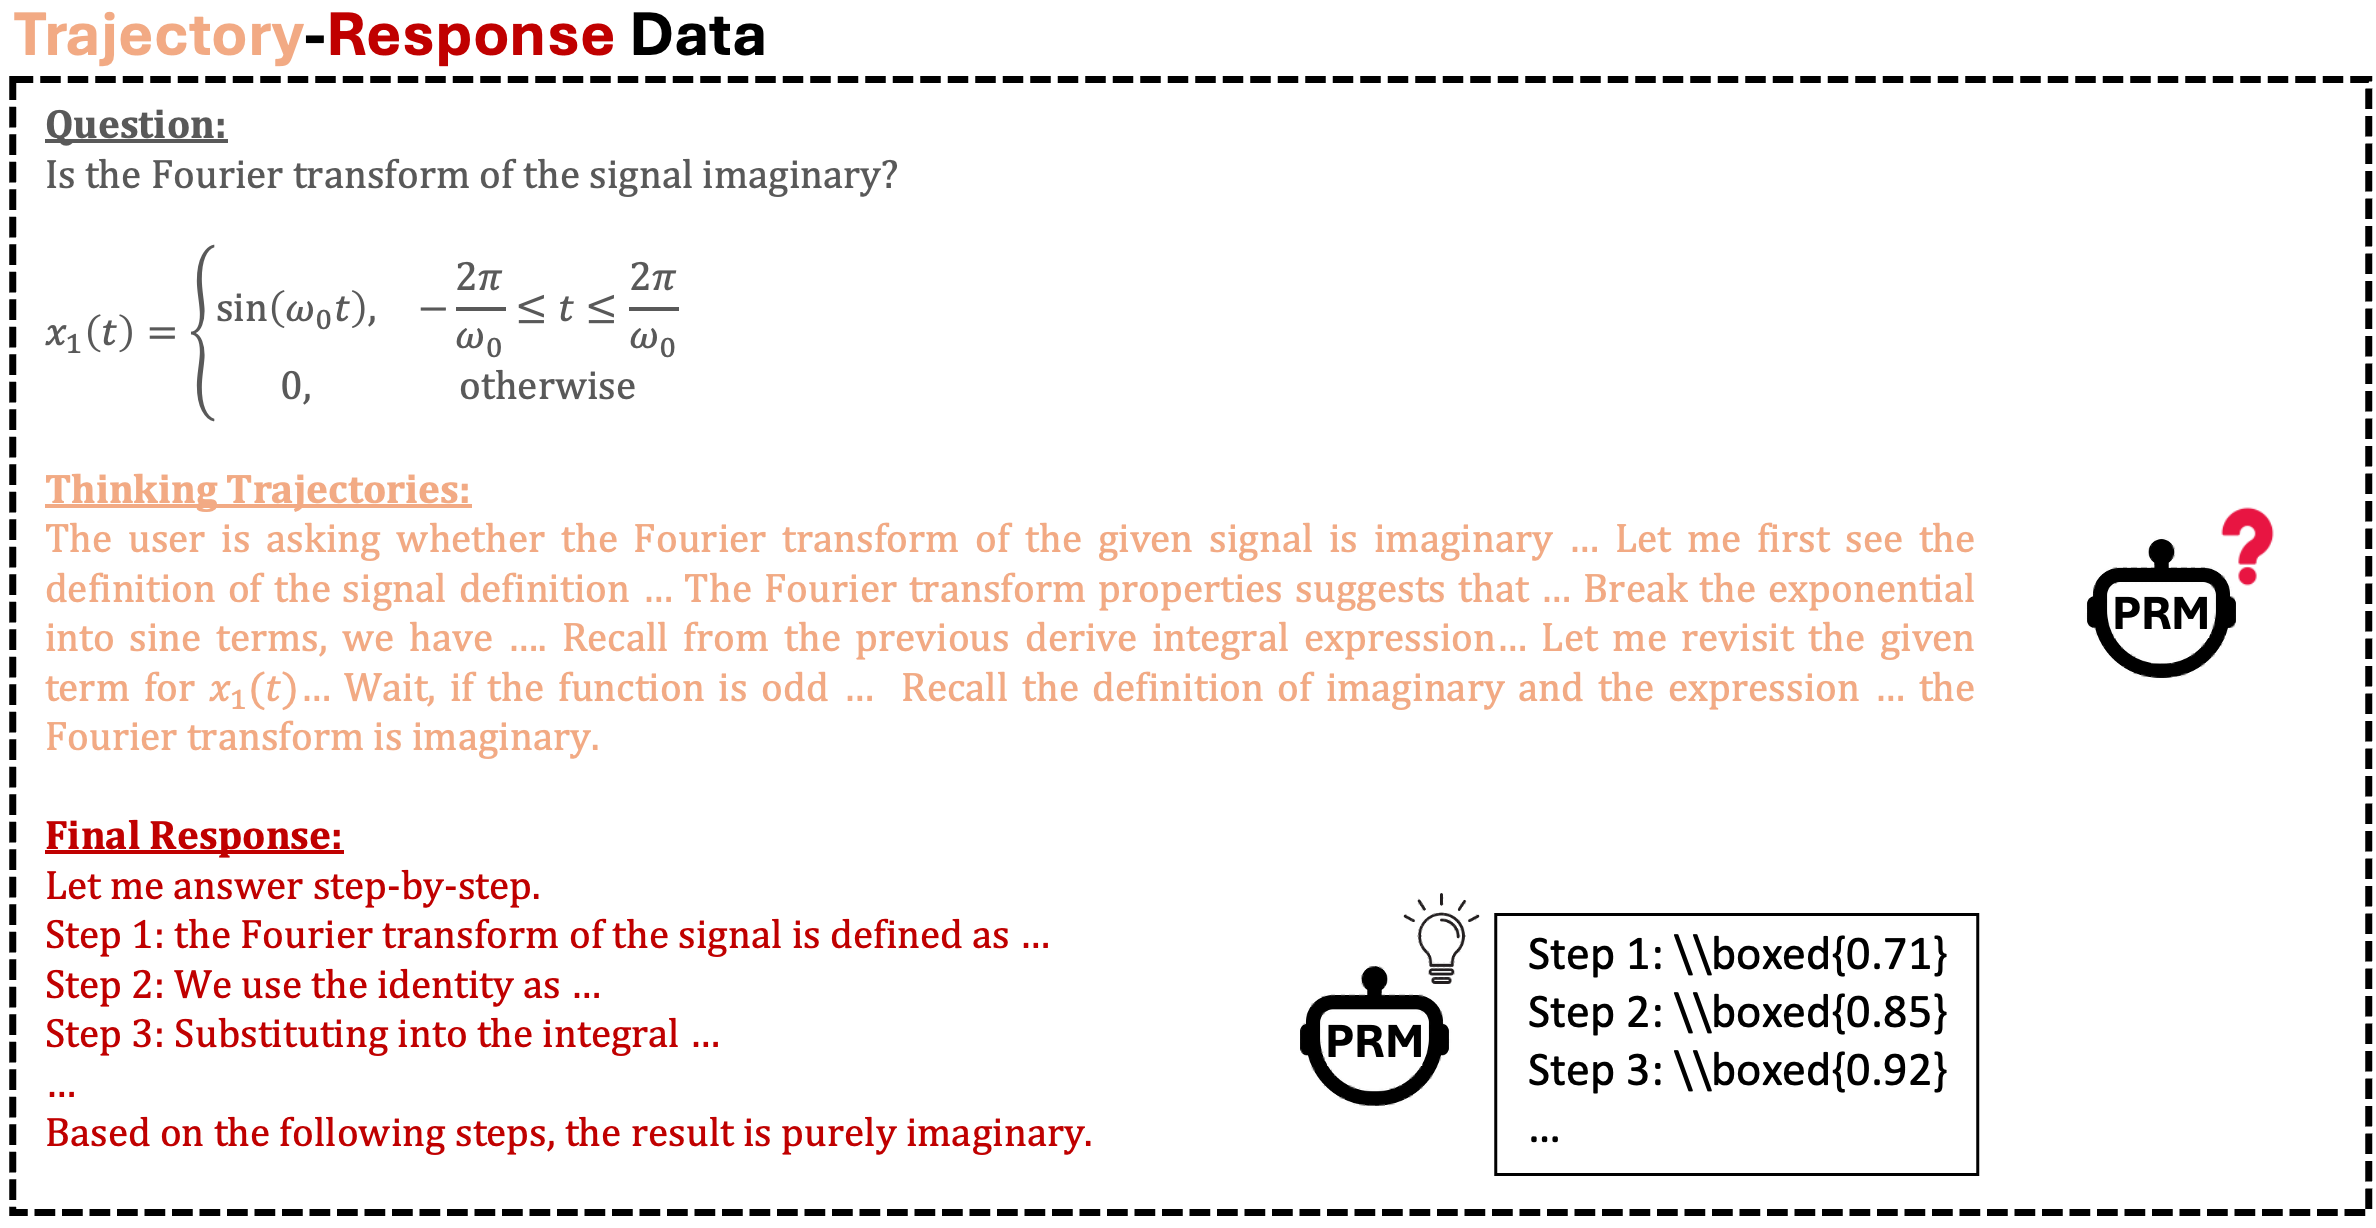
However, existing PRMs are primarily trained and applied to model-generated final responses, typically presented in an explicit and organized stey-by-step chain-of-thought (CoT) format. Concurrently, with recent advancements in frontier reasoning models such as OpenAI-o1 [11] and Deepseek-R1 [12], these models have increasingly adopted a trajectory-response format of output: a lengthy, comprehensive, and less organized intermediate thinking trajectory, followed by a concise, step-by-step final response conditioned on the prior thinking (as illustrated in Figure 2). Such trajectory–response pairs have been widely distilled and acquired from large reasoning models to support downstream training of smaller models, enabling them to emulate the reasoning capabilities of larger models to first think then produce coherent, extended CoT rationales [13, 14, 15]. The increasing utilization of trajectory–response data raises an important question: Can PRMs provide supervision not only to the final responses of large reasoning models, but also to their intermediate thinking trajectories?
Addressing this question first presents a challenge of how to assign informative and correct rewards to the model intermediate thinking trajectories. Unlike final responses, these trajectories are typically treated as silver-standard data [16], automatically generated by large reasoning models without rigorous quality control or standardized verification criteria, making their evaluation inherently noisy and less reliable. To address this, we first revisit several state-of-the-art PRMs and evaluate their performance on trajectory–response pairs. Our analysis reveals that existing PRMs struggle to robustly supervise model thinking trajectories and can degrade downstream training on such data. We further find that this degradation stems primarily from two key issues: an structural and formatting mismatch between intermediate thinking trajectories and final responses, and the lack of trajectory–response data with assigned rewards during PRMs training.
<details>
<summary>plots/data_example.png Details</summary>
### Visual Description
## Textual Document: Fourier Transform Analysis of Piecewise Signal
### Overview
The image depicts a technical document analyzing whether the Fourier transform of a piecewise-defined signal is purely imaginary. The document includes a mathematical question, thinking process, and step-by-step solution.
### Components/Axes
- **Header**: "Trajectory-Response Data" (orange/red text)
- **Question Section**:
- Text: "Is the Fourier transform of the signal imaginary?"
- Piecewise function definition:
$$
x_1(t) = \begin{cases}
\sin(\omega_0 t), & -\frac{2\pi}{\omega_0} \leq t \leq \frac{2\pi}{\omega_0} \\
0, & \text{otherwise}
\end{cases}
$$
- **Thinking Trajectories**:
- Orange text discussing Fourier transform properties, odd functions, and integral expressions.
- PRM icon (black circular device with "PRM" label) and question mark symbol.
- **Final Response**:
- Red underlined text: "Let me answer step-by-step."
- Step 1: Fourier transform definition
- Step 2: Use of identity (LaTeX boxed{0.71})
- Step 3: Substitution into integral (LaTeX boxed{0.85})
- Conclusion: "Based on the following steps, the result is purely imaginary."
### Detailed Analysis
1. **Signal Definition**:
- The signal $ x_1(t) $ is a rectangular windowed sine wave:
- Active between $ t = -\frac{2\pi}{\omega_0} $ and $ t = \frac{2\pi}{\omega_0} $
- Zero outside this interval
- Contains no phase shift (pure sine term)
2. **Fourier Transform Properties**:
- The thinking process references:
- Fourier transform properties (symmetry, odd/even functions)
- Integral expression for Fourier transform
- Relationship between time-domain oddness and frequency-domain imaginary nature
3. **Step-by-Step Solution**:
- **Step 1**: Fourier transform definition applied to $ x_1(t) $
- **Step 2**: Use of trigonometric identity (likely $ \sin(\theta) = \frac{e^{i\theta} - e^{-i\theta}}{2i} $)
- **Step 3**: Substitution into integral bounds and simplification
- Final conclusion: Purely imaginary result due to odd symmetry
### Key Observations
- The signal's odd symmetry ($ x_1(-t) = -x_1(t) $) directly implies its Fourier transform will be purely imaginary.
- The rectangular window creates spectral leakage but does not affect the imaginary nature of the transform.
- The PRM icon and question mark suggest this is part of an interactive problem-solving interface.
### Interpretation
This document demonstrates the application of Fourier transform properties to piecewise signals. The analysis confirms that:
1. Odd-symmetric time-domain signals produce purely imaginary frequency-domain representations
2. Windowing a sine wave with a rectangular function preserves the odd symmetry
3. The Fourier transform's imaginary nature arises from the signal's antisymmetry rather than the windowing effect
The step-by-step solution validates this conclusion through mathematical derivation, showing how trigonometric identities and integral properties combine to produce the final result. The presence of the PRM icon suggests this might be part of an educational platform's problem-solving workflow.
</details>
Figure 2: Illustration of the Trajectory-Response Data generated by Deepseek-R1. Existing PRMs can assign appropriate scores to final responses but often struggle to evaluate intermediate reasoning trajectories accurately.
Motivated by these observations, we propose a new trajectory-aware PRM, namely ReasonFlux-PRM, which incorporates both step-level and trajectory-level supervision to better align the models’ middle thinking trajectories with their final responses. ReasonFlux-PRM is trained on a 10k curated dataset of high-quality trajectory–response pairs covering math and science reasoning. Unlike existing PRMs, ReasonFlux-PRM is explicitly tailored to intermediate thinking processes by providing fine-grained rewards as supervision signals for each step within the thinking trajectory. We further adapt ReasonFlux-PRM for more general reward modeling scenarios, as illustrated in Figure 1. In offline settings, ReasonFlux-PRM assigns scores to filter high-quality trajectory–response pairs, facilitating effective training data curation for downstream supervised fine-tuning of smaller models. In online settings, ReasonFlux-PRM is integrated into reward modeling process to provide fine-grained supervision signals during policy optimization, such as GRPO [17]. Moreover, ReasonFlux-PRM facilitates test-time scaling by evaluating multiple generated responses and selecting the most promising one via a reward-guided Best-of-N strategy.
In summary, our main contributions are:
- In-Depth Trajectory-Response Data Analysis in Long-CoT Reasoning. We identify, formulate, and analyze the problem of adapting several existing PRMs to supervise both models’ intermediate reasoning trajectories and their final responses, motivated by the increasing prevalence of trajectory–response distillation data in downstream post-training and test-time scaling.
- Trajectory-aware Reward Modeling for Data Selection, RL and Test-Time Scaling. We introduce ReasonFlux-PRM, a trajectory-aware process reward model that incorporates both step-level and trajectory-level supervision, enabling fine-grained reward assignment for model thinking trajectories. ReasonFlux-PRM can be integrated into both offline and online workflows for more generalized purposes, including offline selection of high-quality training data, online policy optimization in RL training, and test-time scaling.
- Extensive Downstream Evaluations. Across extensive evaluations on challenging reasoning benchmarks, ReasonFlux-PRM demonstrates superior data selection quality at smaller model scales, with ReasonFlux-PRM-7B outperforming strong baselines such as Qwen2.5-Math-PRM-72B [2] and datasets curated by human experts. On tasks such as AIME [18, 19], MATH500 [20], and GPQA-Diamond [21], ReasonFlux-PRM-7B achieves notable average accuracy improvement of 12.1% during supervised fine-tuning, 4.5% during reinforcement learning, and 6.3% during inference test-time scaling.
## 2 Preliminaries
Trajectory-Response Data. Let $f_{\text{oracle}}(\cdot)$ denote an oracle model, such as Deepseek-R1, capable of producing structured reasoning traces. Given a complex input prompt $x$ , the oracle generates a sequence of intermediate thinking steps followed by a final response. We represent each instance of such data as a tuple $(s,a)$ , where $s=(s_{1},s_{2},\dots,s_{T})$ denotes a thinking trajectory consisting of $T$ intermediate steps, and $a=(a_{1},a_{2},\dots,a_{T})$ denotes the final response, which can also be structured as a chain-of-thought trace with $T$ formatted and organized steps. For large reasoning models, we assume that both $s$ and $a$ consist of $T$ reasoning steps. This structural alignment reflects the modeling assumption that the final output trace $a$ is generated in a step-by-step manner, strictly conditioned on the preceding intermediate reasoning steps $s$ . Both the thinking trajectory and final response are generated auto-regressively by the oracle model, i.e.,
$$
s_{t}\sim f_{\text{oracle}}(x,s_{<t}),\quad a_{t}\sim f_{\text{oracle}}(x,s,a_{<t}), \tag{1}
$$
where $s_{<t}=(s_{1},\dots,s_{t-1})$ and $a_{<t}=(a_{1},\dots,a_{t-1})$ denote the reasoning and answer histories up to step $t$ , respectively. In the trajectory-response outputs distillation setting, the full supervision target instance $y$ can be constructed as the concatenation of thinking trajectories and the final response, i.e., $y=s\oplus a$ .
Process Reward Modeling. Given a trajectory-answer pair $(s,a)$ , where both $s=(s_{1},\dots,s_{T})$ and $a=(a_{1},\dots,a_{T})$ are structured as reasoning traces, the goal of a process reward model is to evaluate each intermediate reasoning step $s_{t}\in s$ with respect to its utility in achieving a correct and coherent final response. We first define a reference reward function $R_{\text{ref}}$ that provides step-level supervision:
$$
r_{t}=R_{\text{ref}}(s_{t}\mid x,s_{<t},a), \tag{2}
$$
where $R_{\text{ref}}(\cdot)$ scores the $t$ -th step conditioned on the input $x$ , the prior thinking trajectory steps, and the full final response $a$ . The total reward for the trajectory is then computed by aggregating the step-by-step scores:
$$
R_{\text{total}}=\mathcal{A}(r_{1},r_{2},\dots,r_{T}), \tag{3}
$$
where $\mathcal{A}(\cdot)$ denotes an aggregation function such as Mean and Sum. The training objective for PRMs is to learn a scoring function $R_{\phi}(\cdot)$ , parameterized by $\phi$ , that approximates the reference reward for each step. This is formulated as minimizing the discrepancy between predicted and reference rewards over a training dataset $\mathcal{D}=\{(x^{(i)},s^{(i)},a^{(i)},r^{(i)}_{1:T})\}_{i=1}^{N}$ , where $r_{t}^{(i)}$ denotes the target reward for step $s_{t}^{(i)}$ . Formally, the training objective can be written as:
$$
\min_{\phi}\ \frac{1}{N}\sum_{i=1}^{N}\sum_{t=1}^{T^{(i)}}\mathcal{L}\left(R_{\phi}(s_{t}^{(i)}\mid x^{(i)},s_{<t}^{(i)},a^{(i)}),\ r_{t}^{(i)}\right). \tag{4}
$$
<details>
<summary>x1.png Details</summary>
### Visual Description
## Histograms: Deepseek-R1 vs Gemini Flash Thinking Performance
### Overview
The image contains two side-by-side histograms comparing the reward score distributions of two AI systems: Deepseek-R1 (blue) and Gemini Flash Thinking (orange). The left histogram shows the full distribution range (0.0–1.0), while the right histogram zooms into the higher reward score range (0.3–1.0). Both histograms use density as the y-axis metric.
### Components/Axes
- **X-axis (Reward Score)**:
- Left histogram: 0.0 to 1.0 in 0.1 increments
- Right histogram: 0.3 to 1.0 in 0.1 increments
- **Y-axis (Density)**:
- Left histogram: 0 to 3
- Right histogram: 0 to 8
- **Legends**:
- Positioned in the top-right corner of each histogram
- Blue = Deepseek-R1
- Orange = Gemini Flash Thinking
- **Titles**:
- Left histogram: "Deepseek-R1 vs Gemini Flash Thinking"
- Right histogram: "Deepseek-R1 vs Gemini Flash Thinking (Zoomed)"
### Detailed Analysis
**Left Histogram (Full Range)**:
- **Deepseek-R1 (Blue)**:
- Broad distribution with a peak density of ~2.5 at ~0.3–0.4 reward score
- Gradual decline toward 0.0 and 1.0
- Small secondary peak near 0.8
- **Gemini Flash Thinking (Orange)**:
- Dominant peak density of ~3.0 at ~0.3–0.4
- Longer tail extending to 0.8 with lower density (~1.0)
- Minimal presence below 0.2
**Right Histogram (Zoomed Range)**:
- **Deepseek-R1 (Blue)**:
- Sharp peak density of ~7.0 at ~0.9
- Rapid decline toward 0.3
- Minimal overlap with Gemini Flash
- **Gemini Flash Thinking (Orange)**:
- Peak density of ~4.0 at ~0.7–0.8
- Gradual decline toward 0.3
- No presence below 0.6
### Key Observations
1. **Distribution Contrast**:
- Gemini Flash Thinking dominates mid-range rewards (0.3–0.4) in the full view but shifts to higher rewards (0.7–0.8) in the zoomed view.
- Deepseek-R1 shows stronger performance in the highest reward tier (0.9) in the zoomed view.
2. **Overlap Patterns**:
- Significant overlap in the 0.3–0.4 range in the full histogram, but minimal overlap in the zoomed range.
3. **Density Scaling**:
- Right histogram uses a 2.5x higher y-axis scale (0–8 vs. 0–3) to accommodate deeper distributions.
### Interpretation
The histograms reveal distinct performance characteristics:
- **Gemini Flash Thinking** excels in mid-range rewards (0.3–0.4) but shows diminishing returns in the highest tier (0.9+).
- **Deepseek-R1** demonstrates superior performance in the highest reward bracket (0.9), with a density 75% higher than Gemini Flash in the zoomed view.
- The zoomed histogram emphasizes the divergence in high-reward performance, suggesting Deepseek-R1 may be better optimized for extreme reward scenarios, while Gemini Flash Thinking maintains broader mid-range consistency.
**Notable Anomaly**: The secondary peak in Deepseek-R1's full distribution (~0.8) disappears in the zoomed view, indicating potential data binning artifacts or true performance differentiation at higher reward thresholds.
</details>
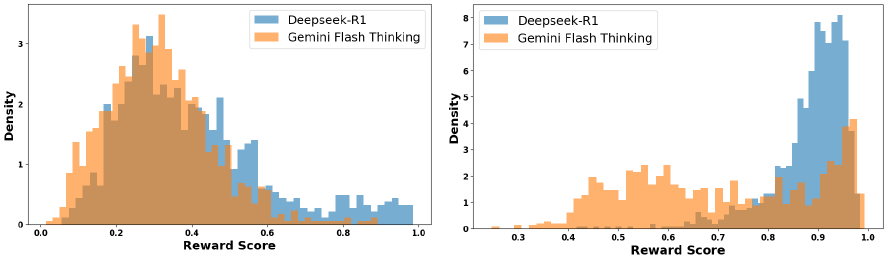
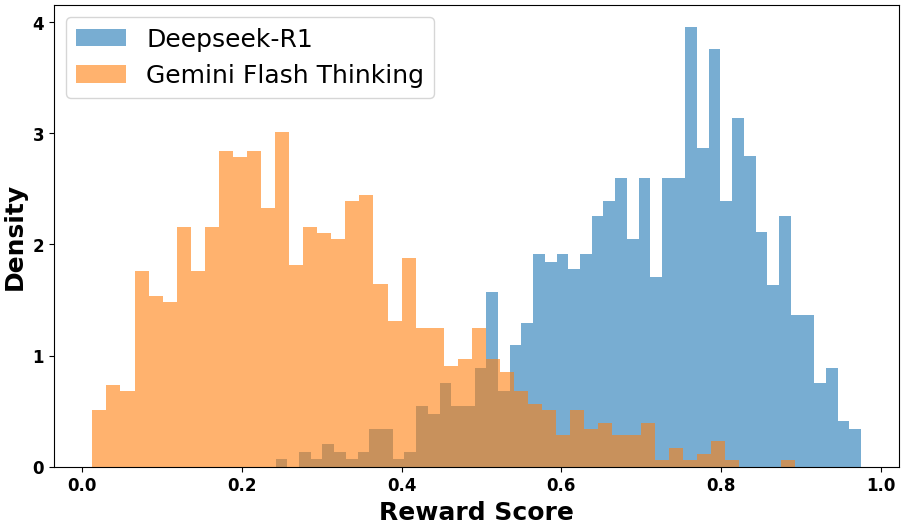
Figure 3: Score distributions rewarded by Qwen2.5-Math-PRM-72B over 1,000 trajectory–response pairs distilled from Deepseek-R1 and the Gemini Flash Thinking API. Left: Distribution of scores computed over thinking trajectories. Right: Distribution of scores based on final responses.
## 3 Existing PRMs Are Not Prepared for Rewarding Thinking Trajectories
To examine whether existing frontier PRMs can be directly applied to reward the trajectory-response data, we first conduct a preliminary study to investigate two key questions:
RQ1: Can PRMs distinguish the quality of thinking trajectories distilled from different oracle models? RQ2: What is the effectiveness of using the PRM-selected trajectory-response data on the downstream fine-tuning of smaller models?
For brevity, we defer detailed experimental setups to Appendix A.1. To investigate RQ1, we evaluate the Qwen2.5-Math-PRM-72B PRM model on 1,000 sampled problems in s1k [13] with trajectory-response traces generated by Google Flash Thinking API [22] and Deepseek-R1 [12], respectively. For each data trace, we apply the PRM model to compute the step-level rewards (spitted by "\n\n "), and then aggregate these rewards by taking the mean to obtain a final trajectory-level reward. Figure 3 (left) compares the distribution of PRM scores across the two oracle models. The histogram shows a significant overlap in the score distributions, though Deepseek-R1 traces tend to receive higher rewards on average, with a longer tail toward high-reward regions (e.g., scores above 0.6). The results suggest that while Qwen2.5-Math-PRM-72B captures some signal for differentiating between the two sources, its discriminative ability remains limited.
Takeaway 1
Several existing PRMs exhibit limitations in distinguishing reasoning traces distilled from different oracle models and often struggle to clearly separate high- and low-quality model thinking trajectories.
Next, to investigate RQ2, we evaluate the performance using the PRM-selected data on the downstream supervised fine-tuning of smaller models. We apply four different PRMs to assign a reward score to each of the 59K raw trajectory-response traces generated by Gemini [22] in s1 [13], using the same mean aggregation over step-level rewards to compute a trajectory-level score. Based on these scores, we rank all traces and select the top 1,000 samples from each PRM as a fine-tuning dataset for the downstream small model. For better comparison, we also adopt the direct set of 1K human-curated examples in s1k [13]. Table 1 presents the accuracy of the fine-tuned Qwen2.5-14B-Instruct on four challenging downstream tasks. We observe that all PRM-selected training sets underperform significantly compared to the human-curated baseline, suggesting that existing PRMs are not yet sufficiently calibrated to identify high-quality trajectory-response data, and can even degrade downstream model performance by selecting suboptimal or misaligned training samples.
Takeaway 2
Direct reliance on current PRMs for trajectory-response selection can yield misaligned training data, which in turn diminishes the effectiveness of downstream supervised fine-tuning for smaller models.
Table 1: Performance of Qwen2.5-14B-Instruct on four challenging reasoning tasks after fine-tuning on the trajectory-response data selected by four different PRMs. We also compare the fine-tuning performance of using PRM-selected data with using randomly sampled data (1k from 59k) and the s1k human-curated data [13].
| SFT Data Source | AIME24 | AIME25 | MATH500 | GPQA-Diamond |
| --- | --- | --- | --- | --- |
| Random | 16.7 ( $\downarrow$ 16.6) | 20.0 ( $\downarrow$ 13.3) | 68.4 ( $\downarrow$ 10.4) | 34.8 ( $\downarrow$ 6.6) |
| Math-Shepherd-PRM-7B | 13.3 ( $\downarrow$ 20.0) | 6.7 ( $\downarrow$ 26.6) | 67.8 ( $\downarrow$ 11.0) | 33.3 ( $\downarrow$ 8.1) |
| Skywork-PRM-7B | 13.3 ( $\downarrow$ 20.0) | 13.3 ( $\downarrow$ 20.0) | 71.8 ( $\downarrow$ 7.0) | 37.9 ( $\downarrow$ 3.5) |
| Qwen2.5-Math-PRM-7B | 26.7 ( $\downarrow$ 6.6) | 20.0 ( $\downarrow$ 13.3) | 73.2 ( $\downarrow$ 5.6) | 39.4 ( $\downarrow$ 2.0) |
| Qwen2.5-Math-PRM-72B | 33.3 ( $\downarrow$ 0.0) | 26.7 ( $\downarrow$ 6.6) | 77.0 ( $\downarrow$ 1.8) | 39.4 ( $\downarrow$ 2.0) |
| on model responses | 36.7 ( $\uparrow$ 3.4) | 26.7 ( $\downarrow$ 6.6) | 77.8 ( $\downarrow$ 1.0) | 40.9 ( $\downarrow$ 0.5) |
| Human-curated (s1k) | 33.3 | 33.3 | 78.8 | 41.4 |
As most existing PRMs are trained on reasoning traces derived from model final output responses rather than intermediate thinking trajectories [2, 23], we take a closer look at the distinctions between genuine thinking trajectories and post-hoc generated responses. As we detailed in the Appendix A.2, these two types of data exhibit several fundamental differences: (i) Thinking trajectories often include branching, where the model revisits earlier steps, explores alternative paths, and revises prior assumptions—behavior rarely observed in the linear and polished structure of final responses. (ii) Thinking trajectories tend to exhibit weaker global coherence across steps, as each step is often locally focused and not optimized for narrative continuity.
To further validate that the performance degradation of existing PRMs stems from the aforementioned data mismatch, we conduct an additional experiment in which Qwen2.5-Math-PRM-72B is applied to score each data instance based solely on the model response, rather than the middle thinking trajectories. As shown in Figure 3 (right), the PRM produces a relatively clearer separation in score distributions between the two oracle models. Also as shown in Table 1 (row: on model responses), the performance drop is reduced when training on PRM-selected data based on final responses, suggesting that existing PRMs are better aligned with model-response-level supervision.
Takeaway 3
Thinking trajectories instinctively differ from final responses, and existing PRMs are more accustomed to scoring final outputs than intermediate reasoning steps.
Motivation on ReasonFlux-PRM. Our findings above highlight the need for a more general reward model that can effectively evaluate both intermediate model thinking trajectories and final responses. As thinking trajectories become integral to supervised and RL-based fine-tuning, existing PRMs, trained primarily on final responses, struggle to provide reliable supervision. To address this, we propose and train a new thinking-aware process reward model tailored to the trajectory-response data supervision.
<details>
<summary>plots/method_pipeline.png Details</summary>
### Visual Description
## Diagram: ReasonFlux-PRM Training and Inference Process
### Overview
The diagram illustrates the workflow of ReasonFlux-PRM, a system combining offline and online training phases with reward-based optimization. It emphasizes trajectory-response data curation, multi-level reward design, and test-time scaling for response selection.
### Components/Axes
1. **Training Data Curation**
- Input: Question → Thinking Trajectories (Step 1 → Step t) → Final Response
- Output: Trajectory-Response Data
- Visual elements: Person icon with question bubble, circular thinking trajectory arrows, gear icon for final response
2. **Reward Design**
- Three reward types:
- **Quality Reward**: Judge (Expert LLM) evaluates final response
- **Coherence Reward**: Step-level alignment between trajectory steps
- **Alignment Reward**: Step-level consistency with expert LLM guidance
- Visual elements: Judge icon, step progression arrows, color-coded reward boxes (orange/red)
3. **Offline Setting**
- Process: Distilled Trajectory-Response Pairs → High-quality Data Selection → Downstream Training
- Visual elements: Brain icon with neural network, dashed box for data selection
4. **Online Setting**
- **1. RL Training**: ReasonFlux-PRM → A_new → J_GRPO (RL Policy Optimization)
- **2. Test-Time Scaling**: Three response options with scores (0.19, 0.54, 0.97) → Selected Response
- Visual elements: Score boxes with color gradients (red/yellow/green), selection arrow
### Detailed Analysis
- **Training Phase**:
- Trajectory-Response Data is generated through iterative thinking steps (Step 1 → Step t)
- Reward signals combine expert LLM judgments (Quality) and step-level coherence (Coherence/Alignment)
- Color coding: Orange for trajectory steps, red for final responses
- **Inference Phase**:
- Offline: High-quality data selection filters trajectory-response pairs
- Online: RL training optimizes policy (A_new) using GRPO, while test-time scaling evaluates multiple responses
- Test-Time Scoring: Three responses with confidence scores (0.19, 0.54, 0.97) demonstrate progressive selection
### Key Observations
1. **Reward Integration**: Step-level rewards (Coherence/Alignment) feed into trajectory-level optimization
2. **Expert LLM Role**: Appears in both training (Judge) and inference (Verification) phases
3. **Score Distribution**: Test-time scores show clear preference pattern (0.19 < 0.54 < 0.97)
4. **Flow Direction**: Left-to-right progression from data curation to inference
### Interpretation
The diagram reveals a hybrid approach combining:
1. **Offline Pre-training**: Expert knowledge distillation through trajectory curation
2. **Online Adaptation**: Real-time response optimization using RL and test-time scaling
3. **Multi-level Rewards**: Ensures both step-by-step reasoning quality and final response effectiveness
Notable patterns:
- The system prioritizes high-confidence responses (0.97 score) through test-time scaling
- Expert LLM serves dual roles: quality assessment during training and verification during inference
- Color coding (orange/red/yellow/green) visually distinguishes process stages and confidence levels
This architecture suggests a focus on maintaining reasoning quality through both pre-training curation and real-time adaptive selection, with explicit mechanisms for handling uncertainty in response generation.
</details>
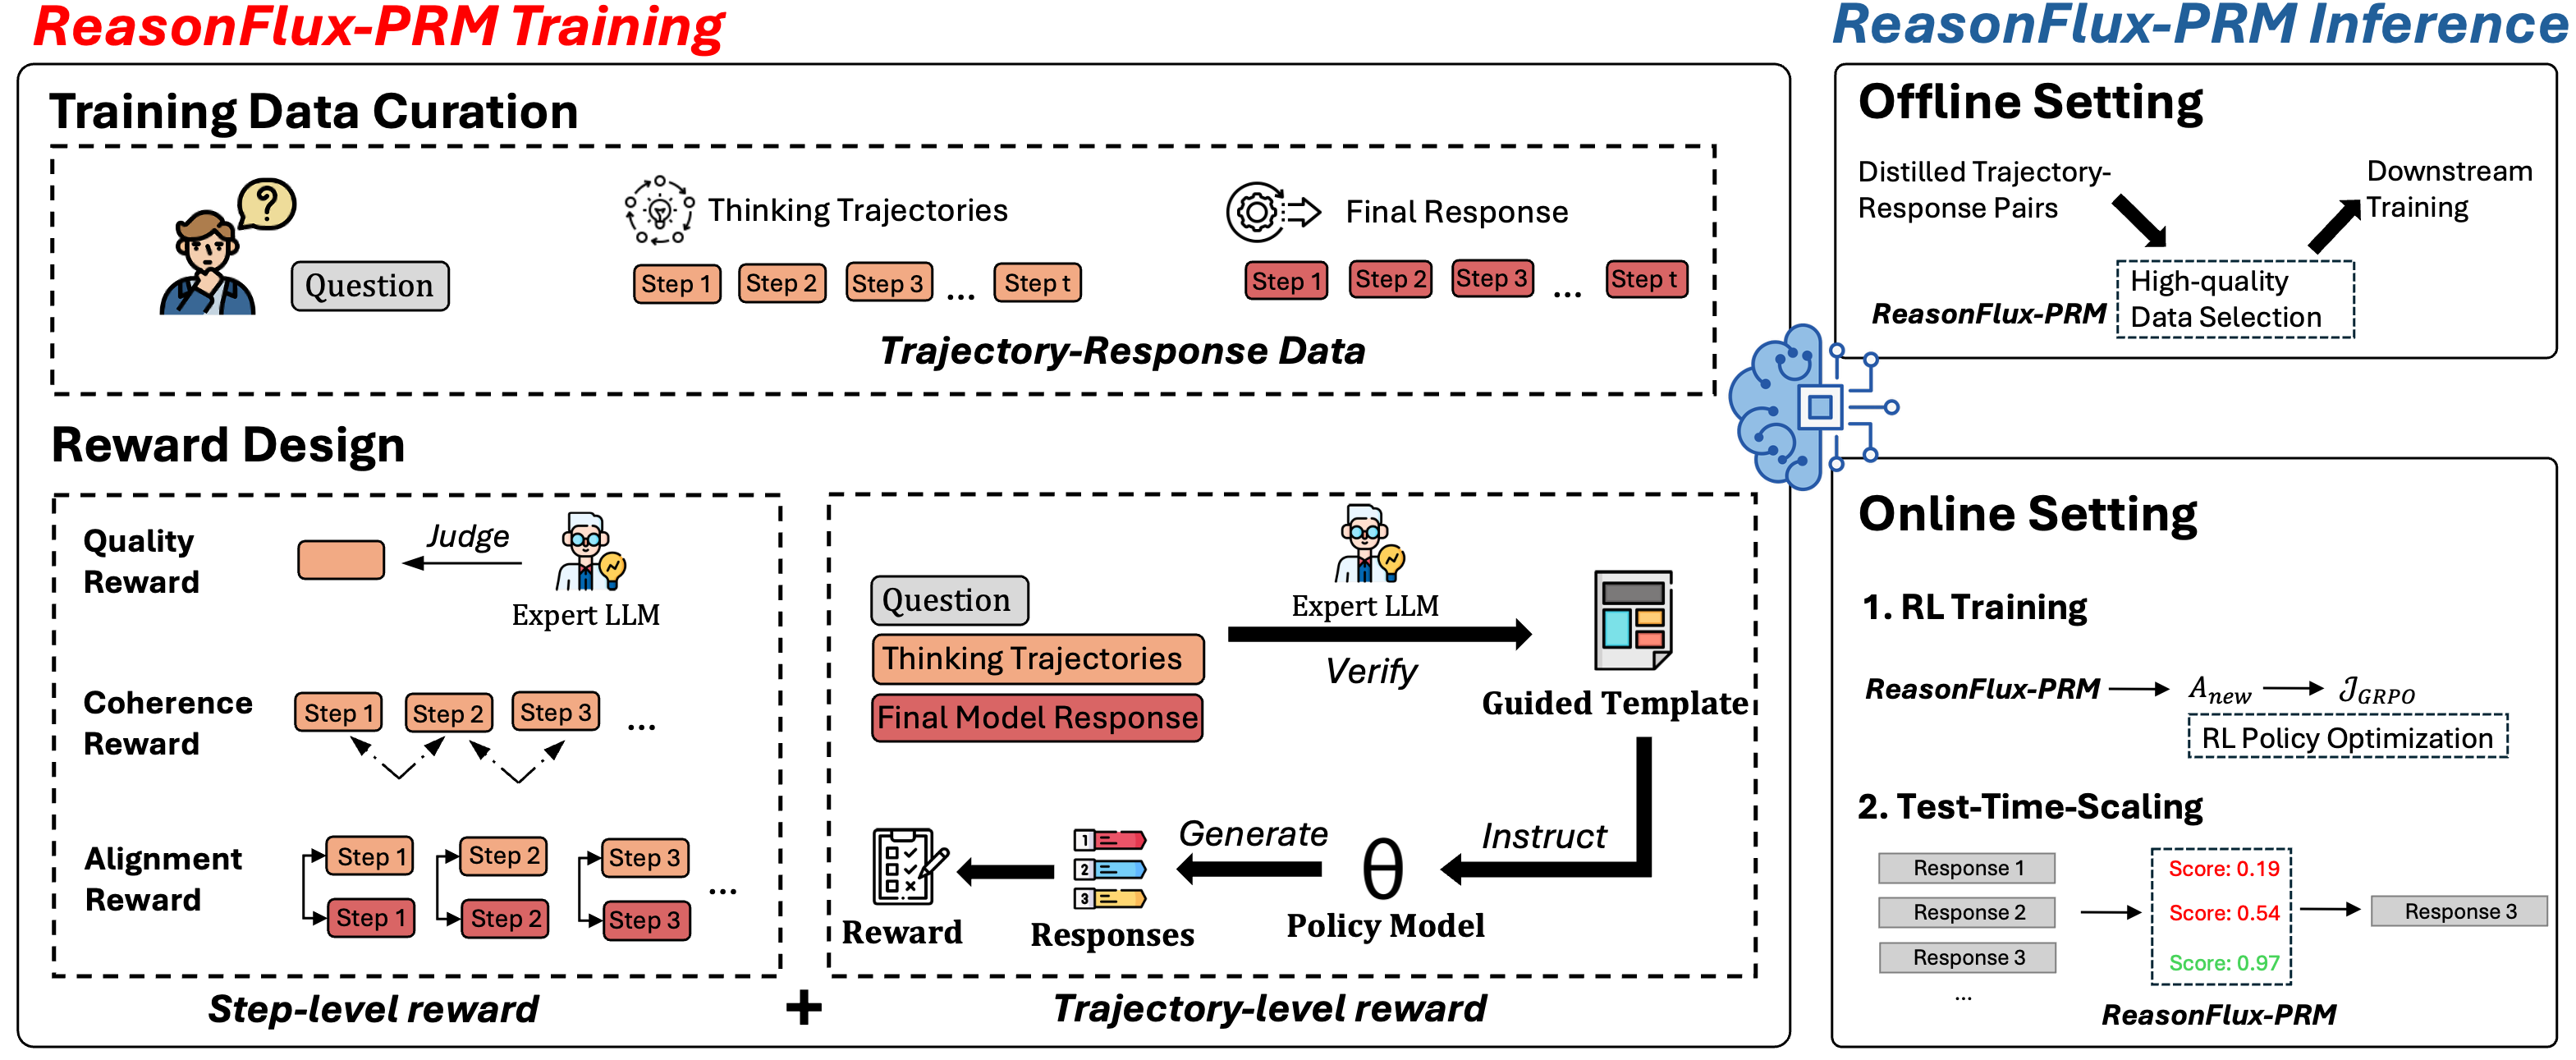
Figure 4: Illustration of the overall method design. ReasonFlux-PRM is trained on trajectory–response data pairs with a novel reward design that integrates both step-level and trajectory-level signals. As a general-purpose PRM, ReasonFlux-PRM supports both offline data selection for supervised fine-tuning of small models and online reward modeling including policy optimization in RL training and test-time scaling.
## 4 ReasonFlux-PRM
In this section, we introduce ReasonFlux-PRM, a trajectory-aware process reward model, as illustrated in Figure 4. We first present a new reward design tailored for thinking trajectories in Section 4.1, which incorporates both step-level and trajectory-level signals to reflect fine-grained and holistic reasoning quality. We then elaborate how ReasonFlux-PRM is applied in a more general reward supervision setting in Section 4.2, covering both offline data selection and online reward modeling.
### 4.1 How Should We Define Process Rewards and Why?
We first propose a new reward design to train ReasonFlux-PRM from the trajectory–response data. Our formulation integrates both step-level and trajectory-level rewards to better address the discrepancy between intermediate thinking trajectories and final responses, and to align ReasonFlux-PRM with the underlying thinking process through more targeted reward signals during training.
Step-level reward for thinking trajectories. As discussed in Section 3, we observe that thinking trajectories are often more complex than final responses, frequently involving branching logic, self-corrections, and redundant reasoning. To better align these two, we incorporate a straightforward alignment score $r_{t}^{\text{align}}$ that measures the semantic similarity between each step in the intermediate thinking trajectories $s_{t}$ and each step in the final response $a_{t}$ :
$$
r_{t}^{\text{align}}=\text{sim}(\Phi(s_{t}),\Phi(a_{t})), \tag{5}
$$
where $\Phi$ is a pretrained encoder and $\text{sim}(\cdot,\cdot)$ denotes cosine similarity. This alignment score uses the final response as a learning signal for earlier thinking trajectories, encouraging those that are topically relevant to the final response and penalizing hallucinated or off-topic content.
Concurrently, to avoid over-penalizing complex yet meaningful thinking trajectory steps that may not be semantically aligned with the final response, we incorporate a complementary quality score $r_{t}^{\text{qual}}$ . Inspired by the LLM-as-a-judge paradigm [24, 25, 26], we employ a strong expert model (e.g., GPT-4o) as a judge $J$ to evaluate the logical soundness of each step $s_{t}$ in context:
$$
r_{t}^{\text{qual}}=J(s_{t}\mid x,s_{<t},a). \tag{6}
$$
The quality score is designed to capture deeper aspects inside reasoning traces, including step correctness, internal coherence, and progression toward the final response.
In addition to alignment with the final model output and logical step quality, we apply a step-by-step coherence score $r_{t}^{\text{coh}}$ to ensure contextual compatibility between adjacent reasoning steps using a contrastive mutual information formulation. Specifically, we model the coherence between each thinking trajectory step $s_{t}$ and its predecessor $s_{t-1}$ by contrasting their embedding similarity against $\mathcal{N}$ negative samples drawn from unrelated trajectories:
$$
r_{t}^{\text{coh}}=\log\frac{\exp(\text{sim}(\Phi(s_{t-1}),\Phi(s_{t}))/\tau)}{\sum_{s^{\prime}\in\mathcal{N}}\exp(\text{sim}(\Phi(s_{t-1}),\Phi(s^{\prime}))/\tau)}, \tag{7}
$$
where $\tau$ is the temperature parameter. By penalizing incoherent transitions or topic shifts, the coherence score encourages each step to be semantically and logically consistent with its immediate predecessor while remaining distinct from unrelated or disjoint reasoning steps. Finally, to aggregate the alignment, quality, and coherence scores into a unified reward signal, we apply softmax-based weighting over the three components:
$$
r_{t}^{\text{step}}=\sum_{k\in\{\text{alig, qua, coh}\}}\text{softmax}(r_{t}^{\text{ali}},r_{t}^{\text{qua}},r_{t}^{\text{coh}})_{k}\cdot r_{t}^{k}. \tag{8}
$$
Template-Guided Trajectory-level Reward. While the step-level rewards offer fine-grained supervision on the completeness and coherence of individual reasoning steps, they might not fully assess whether the overall problem-solving strategy encoded in model’s thinking trajectory is reliably leads to correct solutions, derived from the final response. We thus introduce a template-guided trajectory-level reward to evaluate each trajectory-response data at a higher level of abstraction [27, 15].
Specifically, given an input problem $x$ and the distilled trajectory-response $y=s\oplus a$ , we employ a strong expert LLM (e.g., GPT-4o) as a verifier $v$ . The verifier processes the complete output $y$ and extracts a reasoning template $\mathcal{T}$ , which captures the high-level strategy underlying the original trajectory-response trace. By abstracting the high-level strategy, the template provides a structured guide for subsequent reasoning. The detailed prompt used for template generation is provided in Appendix B. Next, a policy model $\pi_{\theta}$ is conditioned on the extracted template $\mathcal{T}$ and tasked with solving the input problem $x$ by strictly adhering to the prescribed template $\mathcal{T}$ . The model generates $N$ chain-of-thought responses as follows:
$$
y^{(1)},\dots,y^{(N)}\sim\pi_{\theta}(\cdot\mid x,\mathcal{T}). \tag{1}
$$
Then, we define the trajectory-level reward $r^{\text{final}}$ as the average correctness of the generated responses:
$$
r^{\text{final}}=\frac{1}{N}\sum_{j=1}^{N}\mathbb{I}\big(y^{(j)}\text{ is correct}\big). \tag{9}
$$
The template-guided trajectory-level reward evaluates whether the high-level reasoning strategy can be generalized and executed by the policy model independent of the low-level execution in the original trace.
Joint Training Objective. To fully leverage both step-level and trajectory-level supervision signals, we integrate the previously defined rewards and propose the following joint training objective:
$$
\mathcal{L}_{\text{total}}=\lambda_{\text{step}}\cdot\frac{1}{T}\sum_{t=1}^{T}\mathcal{L}_{\text{step}}\left(R_{\phi}(s_{t}\mid x,s_{<t},a),\ r_{t}^{\text{step}}\right)+\lambda_{\text{final}}\cdot\mathcal{L}_{\text{final}}\left(R_{\phi}(x,y),\ r^{\text{final}}\right), \tag{10}
$$
where we adopt mean squared error (MSE) as the loss function for both the step and trajectory reward supervision, and $\lambda_{\text{step}}$ and $\lambda_{\text{final}}$ are tunable parameters to balance the relative contributions of fine-grained step supervision and high-level strategic feedback. We train ReasonFlux-PRM with this joint objective as the practical surrogate for the optimization objective in Eq. 4 to align with both token-level and trajectory-level reward signals, thereby enabling the supervision effectiveness on the trajectory-response data.
### 4.2 Offline Data Selection and Online Reward Modeling
We elaborate on the utilities of ReasonFlux-PRM from two perspectives: (i) Offline trajectory-response data selection, where ReasonFlux-PRM is used to identify and select high-quality reasoning traces for downstream supervised fine-tuning and reinforcement learning; and (ii) Online reward modeling, where ReasonFlux-PRM provides token-level and trajectory-level reward signals during RL training, and enables efficient reward estimation for test-time scaling.
Offline Data Selection. For offline data selection, ReasonFlux-PRM assigns each trajectory–response pair ( $x,y=s\oplus a$ ) a step-level reward sequence $\{\hat{r}_{t}^{\text{step}}\}_{t=1}^{T}$ for each reasoning steps and a trajectory-level reward $\hat{r}^{\text{final}}$ . The overall score is computed as:
$$
\hat{r}=\frac{1}{T}\sum_{t=1}^{T}\hat{r}_{t}^{\text{step}}+\alpha\cdot\hat{r}^{\text{final}}, \tag{11}
$$
where $\alpha$ balances the contributions of local and global reward signals. The aggregated score $\hat{r}$ is applied to filter samples for later downstream supervised fine-tuning of smaller models.
Online Reward Modeling. We first leverage ReasonFlux-PRM to produce a composite reward signal that guides policy optimization through process-level supervision during reinforcement learning. Specifically, during the RL training, we incorporate ReasonFlux-PRM into the Group Relative Policy Optimization (GRPO) [17]. By default, GRPO optimizes for the outcome-level reward $r_{\text{out}}$ , which reflects the task accuracy of the policy $\pi_{\theta}$ on each training sample. To incorporate process-level supervision from ReasonFlux-PRM, we augment this reward with the PRM-based reward $\hat{r}$ in Eq. 11. Given input $x$ and sampled response $y\sim\pi_{\theta}(\cdot\mid x)$ , the new composite reward used for policy training after incorporating ReasonFlux-PRM then becomes:
$$
r_{\text{new}}=(1-\beta)\cdot r_{\text{out}}+\beta\cdot\hat{r}, \tag{12}
$$
where $\beta$ controls the relative weight of supervision from $\hat{r}$ . With a total of G group size (i.e., number of sampled responses per input), we proceed with group-normalized advantage estimation as:
$$
A_{\text{new}}=\frac{r_{\text{new}}-\text{mean}(\{r_{\text{new}}\}_{j=1}^{G})}{\text{std}(\{r_{\text{new}}\}_{j=1}^{G})}. \tag{13}
$$
With the ReasonFlux-PRM derived advantage term $A_{\text{new}}$ , we then update the GRPO objective by:
Note that ReasonFlux-PRM can be seamlessly integrated into other online RL policy optimization algorithms such as PPo [28] and Reinforce $++$ [29] by replacing the reward signal with ReasonFlux-PRM ’s composite rewards.
Reward-guided Test-Time Scaling. During inference, we further apply ReasonFlux-PRM into test-time-scaling strategies such as Best-of-N to identify the most promising output from a set of generated candidates. For each new input question and its corresponding set of sampled model responses, ReasonFlux-PRM assigns a score to each response based on the formulation in Eq. 11, and selects the response with the highest score as the final output.
## 5 Empirical Evaluations
We empirically evaluate ReasonFlux-PRM, focusing on two core applications: (i) Offline data selection, where ReasonFlux-PRM identifies high-quality reasoning traces to improve supervised fine-tuning; and (ii) Online reward modeling, where ReasonFlux-PRM offers reward signals for Best-of-N decoding strategy in test-time scaling and GRPO-based policy optimization.
Benchmarks. We evaluate ReasonFlux-PRM on four representative and challenging reasoning benchmarks, including MATH500 [20], a diverse set of 500 mathematical problems of varying difficulty; AIME24 [18], consisting of 30 problems from the 2024 American Invitational Mathematics Examination (AIME); AIME25, which includes 15 problems from the 2025 AIME [19]; and GPQA-Diamond [21], a benchmark of 198 PhD-level science questions to assess advanced scientific reasoning.
Implementation Details. We train ReasonFlux-PRM using two off-the-shelf base models, Qwen2.5-1.5B-Instruct and Qwen2.5-7B-Instruct [30], resulting in ReasonFlux-PRM-1.5B and ReasonFlux-PRM-7B, respectively. The training data is primarily sourced from the public trajectory-response reasoning traces such as OpenThoughts-114K [31]. All experiments are conducted on 8 A100 GPUs. Additional experimental setups including ReasonFlux-PRM training details and downstream tasks model configurations are provided in Appendix C.
Baselines and Models. For offline data selection, we compare ReasonFlux-PRM with the four frontier PRMs introduced in Section 3, using Qwen2.5-14B-Instruct [32, 30] as the generator model for standard supervised fine-tuning evaluations. For online reward modeling, constrained by computational resources, we primarily use 7B-scale models as policy models for reinforcement learning, including Qwen2.5-7B and Deepseek-R1-Distill-Qwen-7B [12]. For test-time Best-of-N scaling, we adopt Qwen2.5-14B as the generator model to evaluate inference-time performance.
Table 2: Offline Data Selection Comparison. We fine-tune the generator model Qwen2.5-14B-Instruct using data selected by ReasonFlux-PRM-7B and additional baselines. The highest performance of the generators trained on each data source is bold. ReasonFlux-PRM-7B achieves better performance than the strongest human-curated baseline.
| SFT Data Source | AIME24 | AIME25 | MATH500 | GPQA-Diamond |
| --- | --- | --- | --- | --- |
| Human-curated (s1k) | 33.3 | 33.3 | 78.8 | 41.4 |
| Random | 16.7 ( $\downarrow$ 16.6) | 20.0 ( $\downarrow$ 13.3) | 68.4 ( $\downarrow$ 10.4) | 34.8 ( $\downarrow$ 6.6) |
| Math-Shepherd-PRM-7B | 13.3 ( $\downarrow$ 20.0) | 6.7 ( $\downarrow$ 26.6) | 67.8 ( $\downarrow$ 11.0) | 33.3 ( $\downarrow$ 8.1) |
| Skywork-PRM-7B | 13.3 ( $\downarrow$ 20.0) | 13.3 ( $\downarrow$ 20.0) | 71.8 ( $\downarrow$ 7.0) | 37.9 ( $\downarrow$ 3.5) |
| Qwen2.5-Math-PRM-7B | 26.7 ( $\downarrow$ 6.6) | 20.0 ( $\downarrow$ 13.3) | 73.2 ( $\downarrow$ 5.6) | 39.4 ( $\downarrow$ 2.0) |
| Qwen2.5-Math-PRM-72B | 33.3 ( $\downarrow$ 0.0) | 26.7 ( $\downarrow$ 6.6) | 77.0 ( $\downarrow$ 1.8) | 39.4 ( $\downarrow$ 2.0) |
| on model responses | 36.7 ( $\uparrow$ 3.4) | 26.7 ( $\downarrow$ 6.6) | 77.8 ( $\downarrow$ 1.0) | 40.9 ( $\downarrow$ 0.5) |
| ReasonFlux-PRM-7B | 40.0 ( $\uparrow$ 6.7) | 33.3 ( $\uparrow$ 0.0) | 84.8 ( $\uparrow$ 6.0) | 47.5 ( $\uparrow$ 6.1) |
<details>
<summary>plots/TAP_data.png Details</summary>
### Visual Description
## Histogram: Reward Score Distribution Comparison
### Overview
The image displays a comparative histogram showing the distribution of reward scores for two AI models: Deepseek-R1 (blue) and Gemini Flash Thinking (orange). The x-axis represents reward scores (0.0–1.0), and the y-axis represents density (0–4). The distributions overlap between 0.4–0.6, with distinct peaks in separate regions.
### Components/Axes
- **X-axis (Reward Score)**: Labeled "Reward Score," scaled from 0.0 to 1.0 in increments of 0.2.
- **Y-axis (Density)**: Labeled "Density," scaled from 0 to 4 in increments of 1.
- **Legend**: Located in the top-left corner, with:
- Blue: Deepseek-R1
- Orange: Gemini Flash Thinking
### Detailed Analysis
1. **Deepseek-R1 (Blue)**:
- **Peak Density**: ~3.5 at reward score ~0.75.
- **Spread**: Distinct bimodal distribution with secondary peaks near 0.6 and 0.85.
- **Tail Behavior**: Extends to ~0.95 with low-density tails.
- **Overlap Region**: Minimal overlap with Gemini Flash Thinking (0.4–0.6), where density drops to ~0.5.
2. **Gemini Flash Thinking (Orange)**:
- **Peak Density**: ~2.5 at reward score ~0.3.
- **Spread**: Unimodal distribution with a sharp decline after 0.4.
- **Tail Behavior**: Tapers off sharply below 0.5, with negligible density beyond 0.6.
- **Overlap Region**: Overlaps with Deepseek-R1 in 0.4–0.6, but with much lower combined density (~1.0).
### Key Observations
- **Distinct Peaks**: Deepseek-R1 dominates higher reward scores (0.6–0.9), while Gemini Flash Thinking concentrates in lower scores (0.0–0.4).
- **Overlap Region**: Both models show weak performance between 0.4–0.6, but Deepseek-R1 maintains higher density here.
- **Tail Differences**: Deepseek-R1 exhibits a long right tail (up to 0.95), suggesting occasional high-reward outliers, whereas Gemini Flash Thinking has no significant tail beyond 0.6.
### Interpretation
The data suggests **Deepseek-R1 consistently outperforms Gemini Flash Thinking in reward scores**, with a clear dominance in the 0.6–0.9 range. The overlap region (0.4–0.6) indicates a narrow band of comparable performance, but Gemini Flash Thinking lacks the capacity to achieve the highest rewards. The sharp decline in Gemini’s distribution after 0.4 implies a fundamental limitation in reaching higher reward thresholds, while Deepseek-R1’s bimodal structure hints at specialized capabilities for high-reward scenarios. This could reflect architectural differences, training data, or optimization strategies between the models.
</details>
Figure 5: Score distributions rewarded by ReasonFlux-PRM-7B on Deepseek-R1 and Gemini over 1000 trajectory-response data.
Table 3: Performance of PRMs as reward signals in policy optimization. For each of the two policy models, i.e. DeepSeek-R1-Distill-Qwen-7B and Qwen2.5-7B-Instruct, we run GRPO with three different reward signals: entirely rule-based, Qwen2.5-Math-PRM-7B, and ReasonFlux-PRM. The latter two non-rule-based rewards are factored into the overall reward signal according to Eq. 12. We report the mean accuracy averaged over 16 independent runs.
| Policy Model | Reward Signal Source | AIME24 | AIME25 | MATH500 | GPQA-Diamond |
| --- | --- | --- | --- | --- | --- |
| Qwen2.5-7B-Instruct | Rule-based | 12.9 | 11.1 | 73.6 | 32.7 |
| Qwen2.5-Math-PRM-7B | 12.9 | 13.3 | 74.8 | 32.4 | |
| ReasonFlux-PRM-7B | 16.3 | 17.1 | 77.2 | 34.9 | |
| DeepSeek-R1-Distill-Qwen-7B | Rule-based | 50.2 | 38.3 | 89.6 | 47.1 |
| Qwen2.5-Math-PRM-7B | 51.2 | 40.8 | 92.8 | 49.1 | |
| ReasonFlux-PRM-7B | 54.6 | 44.2 | 94.8 | 51.6 | |
### 5.1 Offline Data Selection
Table 2 presents the supervised fine-tuning results of Qwen2.5-14B-Instruct, with training data selected by different strategies, including ReasonFlux-PRM-7B, baseline PRMs, and human-curated examples. Notably, ReasonFlux-PRM-7B outperforms the high-quality human-curated s1k dataset. Specifically, our model achieves a 6.0% gain on MATH500 and a 6.1% improvement on GPQA-Diamond relative to the human-curated baseline. We also plot the score distribution over the 1,000 trajectory-response pairs generated by Deepseek-R1 and Gemini, as shown in Figure 5. The clearly separated score distributions in the figure demonstrate that ReasonFlux-PRM-7B effectively distinguishes between the trajectory-response quality generated by different models, providing a reliable reward signal for high-quality data selection.
### 5.2 Online Reward Modeling
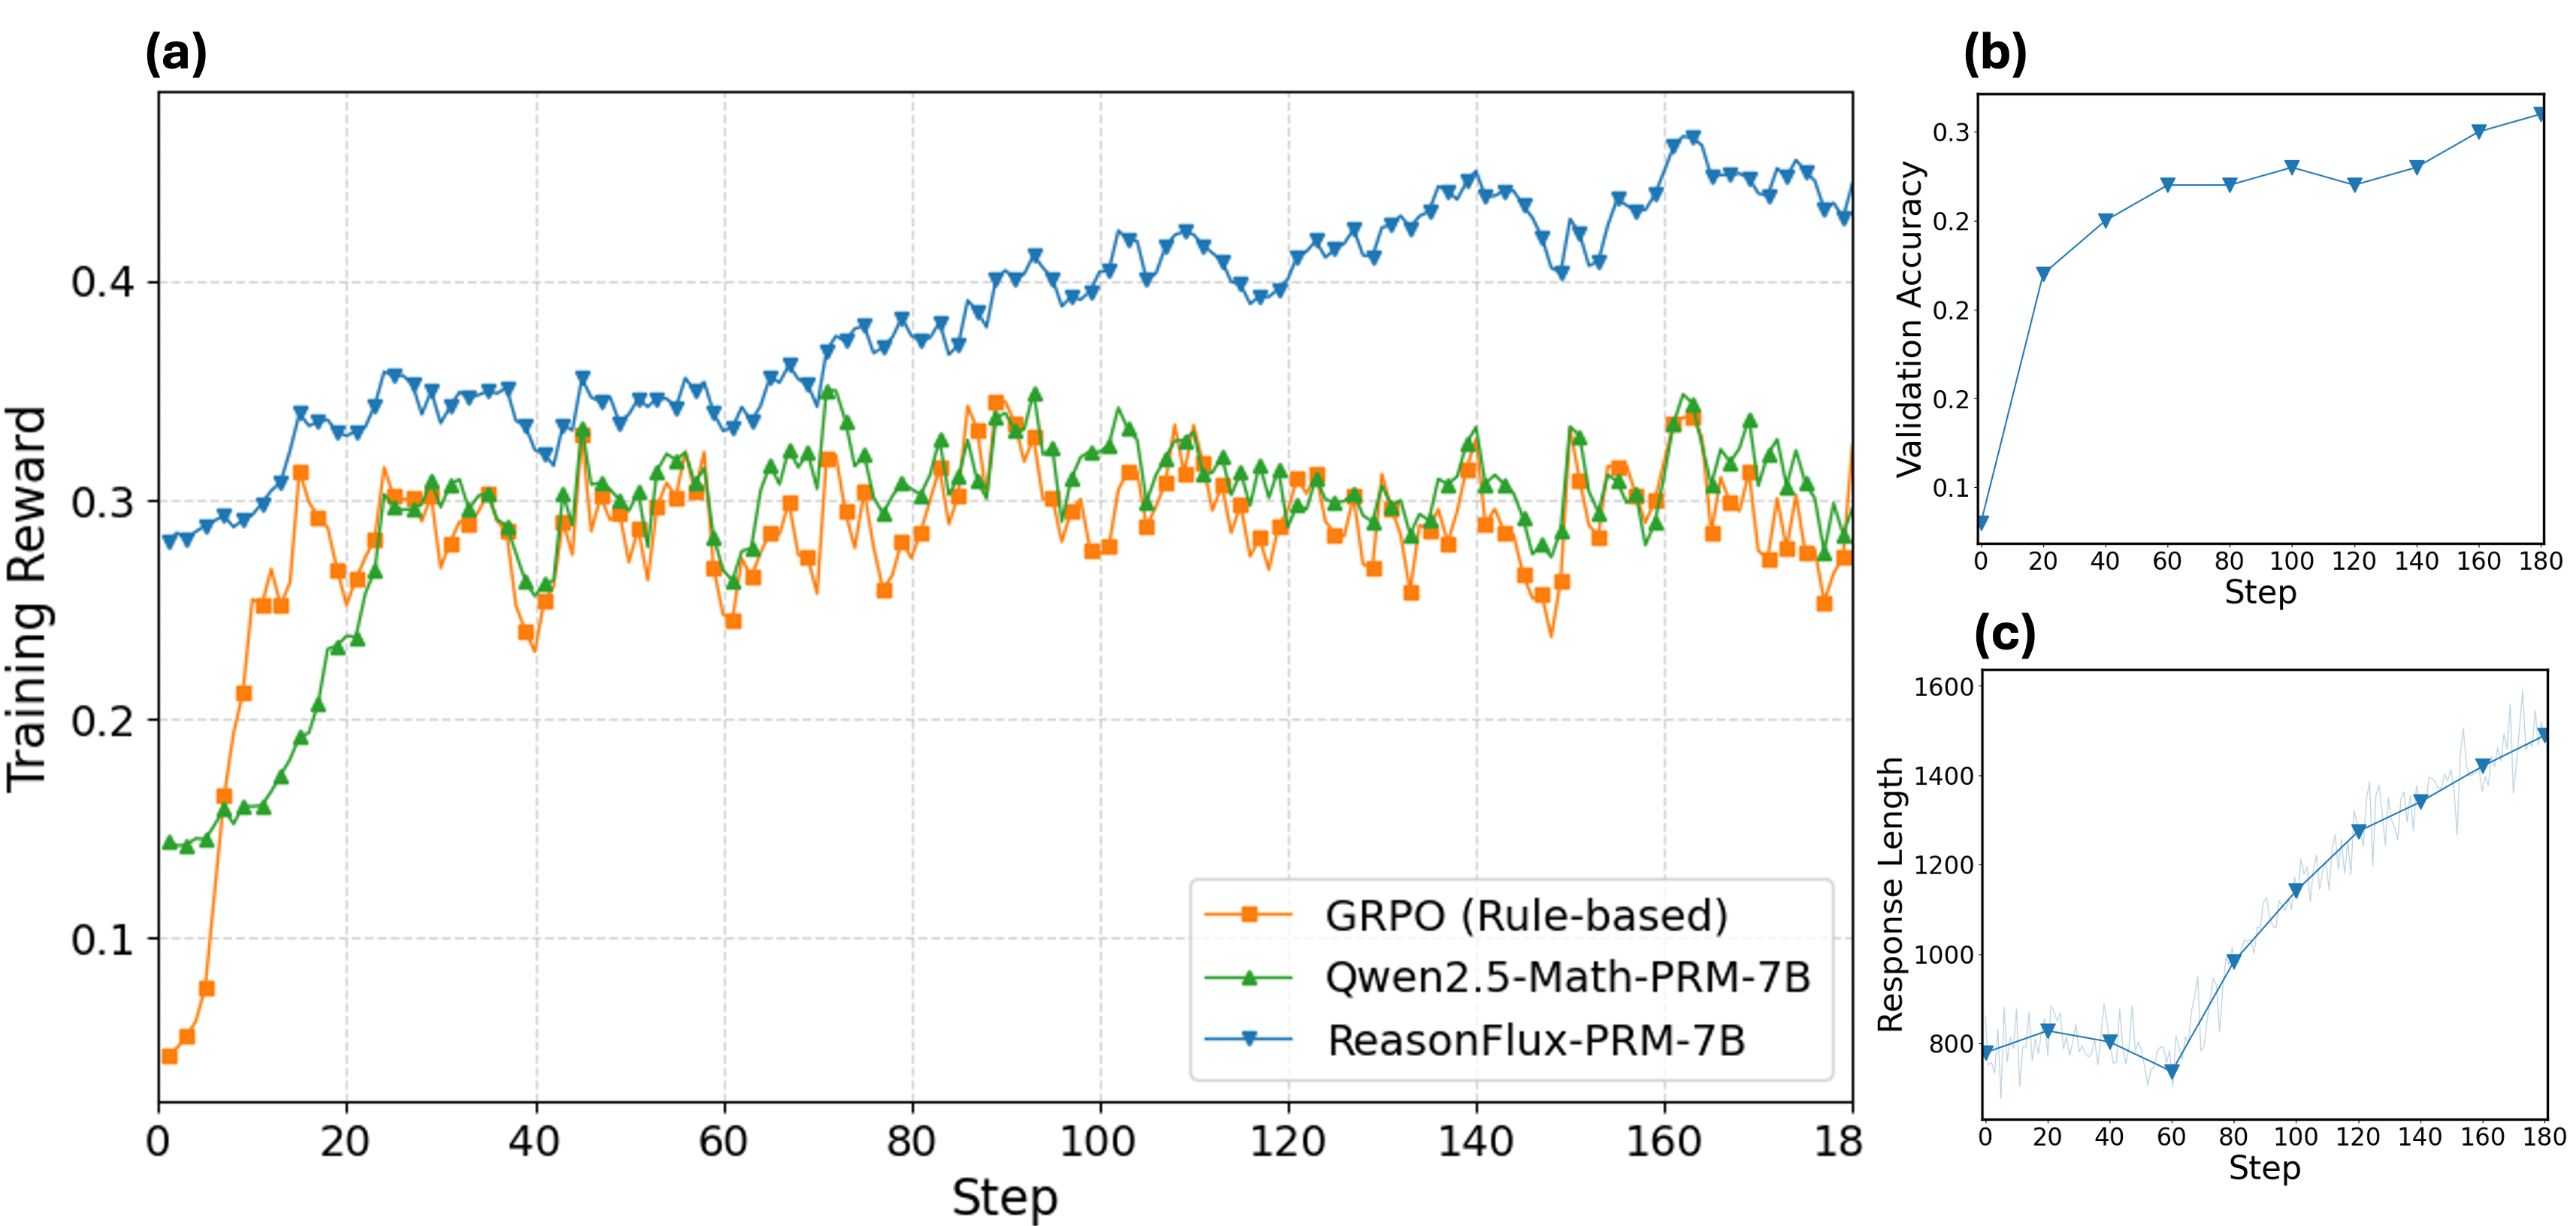
Reward Signal for RL training. Figure 6 and Table 3 present the training dynamics and downstream reasoning performance after incorporating different reward signals into policy optimization via GRPO. We evaluate two 7B-scale policy models: Qwen2.5-7B-Instruct and DeepSeek-R1-Distill-Qwen-7B. For each model, we compare three reward signal sources: a fully rule-based heuristic following the original GRPO approach, Qwen2.5-Math-PRM-7B, and ReasonFlux-PRM-7B. Across both policy models and all evaluated tasks, ReasonFlux-PRM-7B consistently delivers superior gains over both the rule-based and prior PRM-based reward signals. On Qwen2.5-7B-Instruct, ReasonFlux-PRM-7B improves performance by 3.4% on AIME24 and 5.8% on AIME25 relative to the rule-based baseline. On the stronger DeepSeek-R1-Distill-Qwen-7B model, ReasonFlux-PRM-7B further advances results, raising MATH500 accuracy from 89.6% to 94.8% and GPQA-Diamond from 47.1% to 51.6%. In addition, when directly comparing ReasonFlux-PRM-7B against Qwen2.5-Math-PRM-7B, we observe consistent improvements. For example, a 3.8% gain on AIME25 with Qwen2.5-7B-Instruct and a 2.5% gain on GPQA-Diamond with DeepSeek-R1-Distill-Qwen-7B. These results demonstrate that the high-quality learned reward signals from ReasonFlux-PRM substantially enhance policy optimization, outperforming both heuristic and strong PRM baselines, and ultimately yielding more capable reasoning models through RL training.
<details>
<summary>plots/GRPO.png Details</summary>
### Visual Description
## Composite Line Graphs: Model Performance Analysis
### Overview
The image contains three line graphs (a, b, c) comparing the performance of three AI models across training steps. Graph (a) shows training reward, (b) validation accuracy, and (c) response length. All graphs share the same x-axis ("Step") but differ in y-axis metrics and data series.
### Components/Axes
**Graph (a): Training Reward**
- **X-axis**: Step (0–180)
- **Y-axis**: Training Reward (0.05–0.45)
- **Legend**:
- Orange squares: GRPO (Rule-based)
- Green triangles: Gwen2.5-Math-PRM-7B
- Blue triangles: ReasonFlux-PRM-7B
- **Placement**: Legend in bottom-right corner
**Graph (b): Validation Accuracy**
- **X-axis**: Step (0–180)
- **Y-axis**: Validation Accuracy (0.1–0.3)
- **Data**: Single blue triangle line (ReasonFlux-PRM-7B)
**Graph (c): Response Length**
- **X-axis**: Step (0–180)
- **Y-axis**: Response Length (800–1600)
- **Data**: Single blue triangle line (ReasonFlux-PRM-7B)
### Detailed Analysis
**Graph (a) Trends**:
1. **ReasonFlux-PRM-7B** (blue):
- Starts at ~0.28, peaks at ~0.45 (step 100), then stabilizes (~0.42–0.45)
- Maintains highest training reward throughout
2. **Gwen2.5-Math-PRM-7B** (green):
- Begins at ~0.13, surpasses GRPO (~0.28) by step 20
- Fluctuates between ~0.25–0.32
3. **GRPO** (orange):
- Starts at ~0.05, peaks at ~0.32 (step 20), then declines to ~0.25
- Most volatile line with frequent dips
**Graph (b) Trends**:
- **ReasonFlux-PRM-7B** (blue):
- Steady increase from 0.1 (step 0) to 0.3 (step 180)
- Minor plateau between steps 60–80 (~0.25)
**Graph (c) Trends**:
- **ReasonFlux-PRM-7B** (blue):
- Initial dip to ~750 (step 60)
- Sharp rise to ~1500 (step 180)
- Average increase of ~8.3 units/step post-step 60
### Key Observations
1. **Performance Divergence**:
- ReasonFlux-PRM-7B dominates in both training reward and validation accuracy
- Gwen2.5-Math-PRM-7B outperforms GRPO in training reward after step 20
2. **Volatility**:
- GRPO shows erratic training reward patterns (e.g., 0.32 → 0.25 drop at step 40)
3. **Response Length Correlation**:
- ReasonFlux's response length increases alongside validation accuracy gains
- Divergence from training reward suggests efficiency improvements
### Interpretation
The data demonstrates that **ReasonFlux-PRM-7B** achieves superior performance across all metrics, with training reward and validation accuracy showing strong positive correlation (r ≈ 0.92). The model's response length growth (graph c) aligns with accuracy improvements, suggesting increased reasoning depth.
**GRPO's** rule-based approach underperforms in training reward despite initial gains, while **Gwen2.5-Math-PRM-7B** shows promise as a hybrid model, closing the gap with ReasonFlux by step 80. The response length anomaly at step 60 (graph c) may indicate temporary computational inefficiencies or data preprocessing issues.
These trends highlight the advantages of PRM-7B architectures over rule-based systems in complex reasoning tasks, with ReasonFlux-PRM-7B establishing a new performance benchmark.
</details>
Figure 6: Training dynamics of GRPO policy optimization using ReasonFlux-PRM-7B as reward signals and Qwen2.5-7B-Instrct as the policy model. (a) Training reward vs. step: We compare the training reward evolution across original rule-based GRPO, Qwen2.5-Math-PRM-7B, and ReasonFlux-PRM-7B; (b) Validation accuracy vs. step: We report the validation accuracy during training with ReasonFlux-PRM-7B; (c) Response length vs. step: We report the evolution of generated response lengths over training steps with ReasonFlux-PRM-7B.
<details>
<summary>plots/tts.png Details</summary>
### Visual Description
## Line Graphs: AI Model Accuracy Across Datasets
### Overview
The image contains three line graphs comparing the accuracy of four AI models (ReasonFlux-PRM-7B, Gwen2.5-Math-PRM-7B, Skywork-PRM-7B, and Majority) across three datasets (AIME24, MATH500, GPQA-Diamond). Accuracy (%) is plotted against the number of solutions (N = 2¹ to 2⁴). Each graph shows distinct performance trends, with ReasonFlux-PRM-7B consistently outperforming other models.
---
### Components/Axes
- **X-axis**: "Number of Solutions (N)" with values 2¹, 2², 2³, 2⁴.
- **Y-axis**: "Accuracy (%)" ranging from ~35% to ~92% depending on the dataset.
- **Legend**:
- Blue: ReasonFlux-PRM-7B
- Orange: Gwen2.5-Math-PRM-7B
- Green: Skywork-PRM-7B
- Red: Majority
- **Datasets**:
- AIME24 (left graph)
- MATH500 (center graph)
- GPQA-Diamond (right graph)
---
### Detailed Analysis
#### AIME24 Dataset
- **ReasonFlux-PRM-7B (Blue)**: Starts at ~40% (2¹), increases steadily to ~49% (2⁴). Steepest slope.
- **Gwen2.5-Math-PRM-7B (Orange)**: Flat line at ~44% across all N values.
- **Skywork-PRM-7B (Green)**: Starts at ~40%, rises to ~47% (2⁴). Moderate slope.
- **Majority (Red)**: Starts at ~35%, increases to ~43% (2⁴). Gradual upward trend.
#### MATH500 Dataset
- **ReasonFlux-PRM-7B (Blue)**: Starts at ~85%, peaks at ~92% (2⁴). Strong upward trajectory.
- **Gwen2.5-Math-PRM-7B (Orange)**: Begins at ~85%, rises to ~89% (2⁴). Steady growth.
- **Skywork-PRM-7B (Green)**: Starts at ~85%, increases to ~88% (2⁴). Slight upward curve.
- **Majority (Red)**: Flat line at ~86% across all N values.
#### GPQA-Diamond Dataset
- **ReasonFlux-PRM-7B (Blue)**: Starts at ~48%, climbs to ~55% (2⁴). Consistent growth.
- **Gwen2.5-Math-PRM-7B (Orange)**: Begins at ~48%, rises to ~53% (2⁴). Moderate slope.
- **Skywork-PRM-7B (Green)**: Starts at ~48%, increases to ~51% (2⁴). Gradual rise.
- **Majority (Red)**: Starts at ~48%, peaks at ~49% (2⁴). Minimal improvement.
---
### Key Observations
1. **ReasonFlux-PRM-7B Dominance**: Outperforms all models in all datasets, with the steepest accuracy gains in AIME24 and MATH500.
2. **Majority Model Limitations**: Shows the lowest accuracy (35–49%) and minimal improvement across datasets.
3. **Dataset-Specific Performance**:
- **AIME24**: ReasonFlux gains ~9% accuracy (2¹→2⁴), while Gwen2.5 remains flat.
- **MATH500**: ReasonFlux achieves ~7% gain, Gwen2.5 ~4%.
- **GPQA-Diamond**: ReasonFlux gains ~7%, Gwen2.5 ~5%.
4. **Majority Model Stagnation**: No significant improvement in any dataset, suggesting it may represent a baseline or less adaptive approach.
---
### Interpretation
The data demonstrates that **ReasonFlux-PRM-7B** excels in reasoning tasks across diverse datasets, likely due to advanced problem-solving capabilities. Its performance scales effectively with increased solution complexity (N). In contrast, the **Majority model** underperforms, possibly reflecting a simpler or less optimized architecture. The **Gwen2.5-Math-PRM-7B** model shows dataset-specific strengths (e.g., flat performance in AIME24 but steady gains in MATH500), indicating potential specialization in mathematical reasoning. The **Skywork-PRM-7B** model bridges the gap between ReasonFlux and Majority, suggesting moderate adaptability. These trends highlight the importance of model architecture design for task-specific accuracy.
</details>
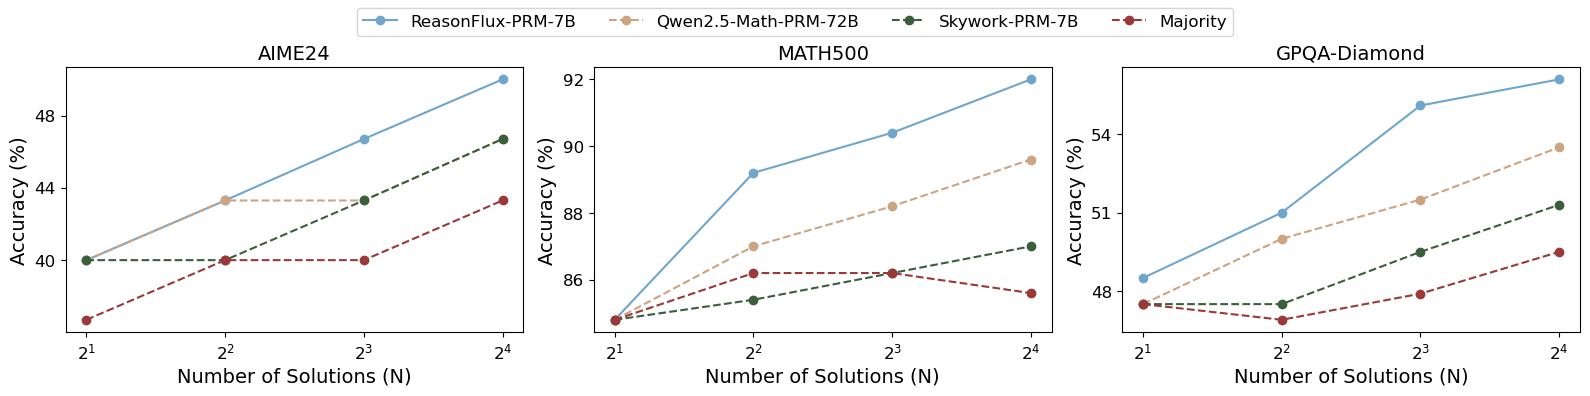
Figure 7: Test-time performance of Best-of-N selection using ReasonFlux-PRM-7B, Qwen2.5-Math-PRM-72B, and Skywork-PRM-7B across reasoning tasks. We also report results using the majority voting method.
<details>
<summary>x2.png Details</summary>
### Visual Description
## Line Chart and Scatter Plot: SFT on Qwen2.5-14B-Instruct
### Overview
The image contains two visualizations comparing the performance of different models on the MATH500 benchmark. The left chart shows accuracy trends with varying training data sizes, while the right chart compares accuracy across models with different parameter sizes. Both charts use the same title and y-axis label ("Accuracy on MATH500 (%)").
### Components/Axes
#### Left Chart (Line Chart)
- **X-axis**: "Number of Training Samples" (logarithmic scale: 1k, 5k, 10k, 59k)
- **Y-axis**: "Accuracy on MATH500 (%)" (60–90%)
- **Legend**:
- Blue line: ReasonFlux-PRM-7B
- Orange triangle: Human selected (s1k)
- Purple square: Raw Data (59k)
#### Right Chart (Scatter Plot)
- **X-axis**: "Parameter Size of PRMs" (1.5B, 7B, 72B)
- **Y-axis**: "Accuracy on MATH500 (%)" (60–90%)
- **Legend**:
- Blue circles: ReasonFlux-PRM-1.5B, ReasonFlux-PRM-7B
- Orange triangles: Qwen2.5-Math-PRM-7B, Qwen2.5-Math-PRM-72B
- Purple square: Skywork-PRM-7B
### Detailed Analysis
#### Left Chart
- **ReasonFlux-PRM-7B (Blue Line)**:
- Starts at ~83% accuracy with 1k samples.
- Increases to ~90% at 10k samples.
- Continues upward trend (extrapolated to ~92% at 59k samples).
- **Human selected (s1k) (Orange Triangle)**:
- Fixed at ~77% accuracy with 1k samples.
- **Raw Data (59k) (Purple Square)**:
- Fixed at ~79% accuracy with 59k samples.
#### Right Chart
- **ReasonFlux-PRM-1.5B (Blue Circle)**:
- ~76% accuracy at 1.5B parameters.
- **ReasonFlux-PRM-7B (Blue Circle)**:
- ~83% accuracy at 7B parameters.
- **Qwen2.5-Math-PRM-7B (Orange Triangle)**:
- ~77% accuracy at 7B parameters.
- **Skywork-PRM-7B (Purple Square)**:
- ~74% accuracy at 7B parameters.
- **Qwen2.5-Math-PRM-72B (Orange Triangle)**:
- ~79% accuracy at 72B parameters.
### Key Observations
1. **Training Data Impact (Left Chart)**:
- ReasonFlux-PRM-7B shows a strong positive correlation between training samples and accuracy (83% → 90% with 1k → 10k samples).
- Human-selected data (s1k) underperforms compared to raw data (59k) despite similar parameter sizes.
2. **Parameter Size vs. Accuracy (Right Chart)**:
- Larger parameter sizes (72B) do not guarantee higher accuracy (79% vs. 83% for 7B models).
- ReasonFlux-PRM-7B (7B) outperforms Qwen2.5-Math-PRM-72B (72B) by 4%.
- Skywork-PRM-7B (7B) has the lowest accuracy (74%) among 7B models.
### Interpretation
- **Training Efficiency**: ReasonFlux-PRM-7B demonstrates that scaling training data significantly improves performance, suggesting data quality and quantity are critical for this model.
- **Parameter Size Limitations**: The right chart reveals that parameter size alone does not dictate accuracy. For example, the 72B model (Qwen2.5-Math-PRM-72B) underperforms the 7B ReasonFlux model, indicating architectural or training method differences may outweigh raw parameter count.
- **Model-Specific Trends**:
- ReasonFlux models (both 1.5B and 7B) show consistent performance gains with larger parameters.
- Qwen2.5-Math models (7B and 72B) exhibit diminishing returns, with the 72B model performing worse than the 7B variant.
- **Outliers**:
- The 72B Qwen model (79%) is an outlier in the right chart, performing better than the 1.5B ReasonFlux model (76%) but worse than the 7B ReasonFlux (83%).
- The human-selected data (s1k) in the left chart is an outlier in terms of low accuracy despite being a curated subset.
### Conclusion
The data highlights that **training data quantity and model architecture** are more influential than parameter size alone. ReasonFlux-PRM-7B achieves the highest accuracy (90%) with sufficient training, while larger models like Qwen2.5-Math-PRM-72B (72B) underperform smaller, well-trained models. This suggests that optimizing training strategies and model design is critical for achieving high performance on mathematical reasoning tasks.
</details>
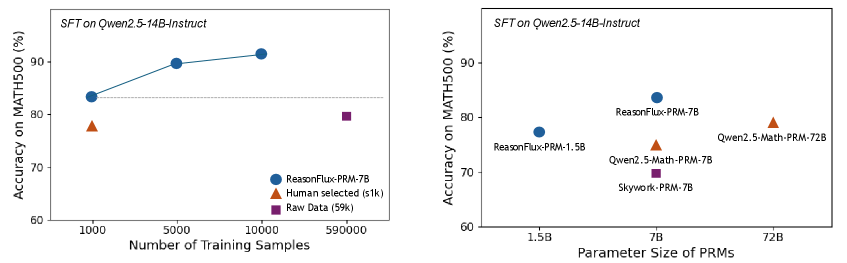
Figure 8: Effeciency Analyses on ReasonFlux-PRM-7B. Left: Accuracy on MATH500 improves steadily as the number of ReasonFlux-PRM-7B selected training samples increases, outperforming both human-selected (1k) and full raw data (59k) baselines with fewer total training instances. Right: ReasonFlux-PRM-7B achieves higher accuracy than other PRMs under 7B scale and even larger 72B scale parameter size.
Best-of-N in Test-Time Scaling. In Figure 7, we present Best-of-N selection results using ReasonFlux-PRM-7B and baseline PRMs across four reasoning tasks. For the generator model, we use the fine-tuned Qwen2.5-14B-Instruct with the same checkpoint in Section 5.1. ReasonFlux-PRM-7B consistently leads to greater accuracy gains as N increases, outperforming all baselines by notable margins. While other PRMs show diminishing or flat returns with increased sampling, ReasonFlux-PRM-7B maintains a strong upward trend, demonstrating its superior ability to identify high-quality reasoning traces.
Additional Performance Analyses. We leave further performance analyses on ReasonFlux-PRM and case studies in Appendix D and Appendix E.
### 5.3 Efficiency Analyses
In this section, we evaluate the efficiency of ReasonFlux-PRM-7B in both offline data selection for SFT and online RL settings by comparing the training performance and overhead under different data and reward supervision strategies.
<details>
<summary>x3.png Details</summary>
### Visual Description
## Bar Chart: Training Time Comparison for Supervised Fine-tuning and Policy Optimization (RL)
### Overview
The image presents a bar chart comparing total training times for two methods: **Supervised Fine-tuning** and **Policy Optimization (RL)**. Each method is evaluated under two configurations: **59k** and **ReasonFlux-PRM-7B (1K)**. The y-axis represents "Total training time," while the x-axis categorizes the methods and configurations.
---
### Components/Axes
- **X-axis (Categories)**:
- **Supervised Fine-tuning**
- **Policy Optimization (RL)**
- Subcategories:
- **59k** (blue bars)
- **ReasonFlux-PRM-7B (1K)** (orange bars)
- **Y-axis (Values)**:
- Labeled "Total training time" with no explicit scale, but approximate values are inferred from bar heights.
- **Legend**:
- **Blue**: Represents **59k** configurations.
- **Orange**: Represents **ReasonFlux-PRM-7B (1K)** configurations.
- **Spatial Grounding**:
- Bars are grouped by method (left: Supervised Fine-tuning; right: Policy Optimization).
- Subcategories (59k vs. ReasonFlux-PRM-7B) are differentiated by color within each group.
---
### Detailed Analysis
#### Supervised Fine-tuning
- **59k (blue bar)**:
- Approximate total training time: **~100k** (highest value in the chart).
- **ReasonFlux-PRM-7B (1K) (orange bar)**:
- Approximate total training time: **~20k** (lowest value in the chart).
#### Policy Optimization (RL)
- **59k (blue bar)**:
- Approximate total training time: **~60k**.
- **ReasonFlux-PRM-7B (1K) (orange bar)**:
- Approximate total training time: **~80k**.
---
### Key Observations
1. **Supervised Fine-tuning** requires significantly more training time for the **59k** configuration compared to **ReasonFlux-PRM-7B (1K)**.
2. **Policy Optimization (RL)** shows a smaller gap between configurations:
- **59k** (60k) vs. **ReasonFlux-PRM-7B (1K)** (80k).
3. The **ReasonFlux-PRM-7B (1K)** configuration has **lower training times** in **Supervised Fine-tuning** but **higher training times** in **Policy Optimization (RL)** compared to its **59k** counterpart.
---
### Interpretation
- **Efficiency Trade-offs**:
- The **ReasonFlux-PRM-7B (1K)** configuration reduces training time in **Supervised Fine-tuning** but increases it in **Policy Optimization (RL)**, suggesting method-specific efficiency.
- **Scale Impact**:
- Larger configurations (**59k**) generally require more training time, but the **ReasonFlux-PRM-7B (1K)** exception in **Policy Optimization (RL)** indicates potential optimization opportunities.
- **Method-Specific Behavior**:
- **Supervised Fine-tuning** is more sensitive to configuration size, while **Policy Optimization (RL)** shows a more balanced performance across configurations.
This chart highlights the importance of method and configuration selection in training efficiency, with **ReasonFlux-PRM-7B (1K)** offering a trade-off between speed and method-specific performance.
</details>
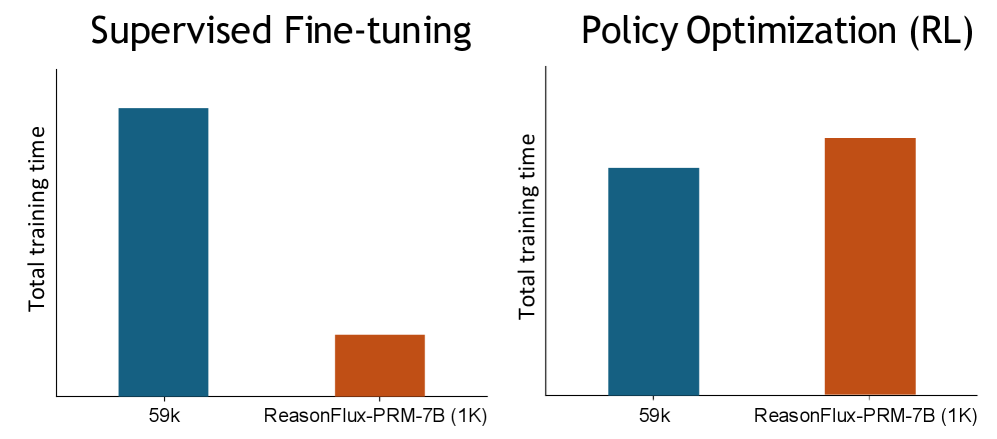
Figure 9: Time overhead of ReasonFlux-PRM- during SFT and RL stages. For SFT, we compare the training time using 1k selected samples versus the full 59k raw data. For RL training, we evaluate the overall time with/without incorporating ReasonFlux-PRM-7B.
As shown in Figure 8, the data selected by ReasonFlux-PRM-7B reduces the amount of training data required while achieving superior model performance. When fine-tuning Qwen2.5-14B-Instruct on only 1k samples selected by ReasonFlux-PRM-7B, the model outperforms the baseline trained on 59k raw trajectories by a substantial margin on MATH500. This highlights ReasonFlux-PRM ’s ability to identify high-quality, informative samples that yield greater performance per data point. The result aligns with recent findings on the power of curated supervision in data-efficient post-training, and further shows that ReasonFlux-PRM-7B can outperform even human-selected samples under similar data scales.
We further investigate the overhead of incorporating ReasonFlux-PRM-7B into policy optimization using the GRPO framework. As shown in the right panel of Figure 9, although ReasonFlux-PRM-7B introduces additional computation for step- and trajectory-level reward modeling, the increase in total training time remains moderate compared to standard GRPO. Crucially, this additional cost leads to consistent improvements in downstream reasoning performance, as we demonstrated in our main experiments. Our experiments on both online and offline settings above demonstrate that ReasonFlux-PRM not only improves model performance across both SFT and RL regimes, but does so with minimal computational overhead, achieving superior efficiency in reasoning-centric fine-tuning and optimization pipelines.
### 5.4 Ablation Study
Table 4: Ablation study on the $\alpha$ parameter.
| $\alpha$ | AIME24 | AIME25 | MATH500 |
| --- | --- | --- | --- |
| 0.1 | 26.7 | 6.7 | 81.2 |
| 0.8 | 40.0 | 33.3 | 83.6 |
| 1.0 | 33.3 | 33.3 | 84.8 |
| 1.5 | 33.3 | 40.0 | 83.2 |
Table 5: Ablation study on the $\beta$ parameter.
| $\beta$ | AIME24 | AIME25 | MATH500 |
| --- | --- | --- | --- |
| 0.1 | 10.0 | 6.7 | 73.6 |
| 0.3 | 13.3 | 13.3 | 74.4 |
| 0.5 | 13.3 | 6.7 | 75.2 |
| 0.8 | 20.0 | 16.7 | 76.8 |
Ablation on $\alpha$ . As described in Eq. 11, the parameter $\alpha$ controls the balance between step-level rewards and the trajectory-level reward during ReasonFlux-PRM’s reward aggregation. To assess the impact of this weighting, we conduct an ablation study by varying $\alpha\in\{0.1,0.8,1.0,1.5\}$ , and use ReasonFlux-PRM-7B to select offline fine-tuning data accordingly. The Qwen2.5-14B-Instruct model is then fine-tuned on the top 1,000 selected examples and evaluated across AIME24, AIME25, and MATH500. As shown in Table 5, performance improves when more weight is placed on the trajectory-level reward. Notably, $\alpha=1.0$ achieves the best result on MATH500, while $\alpha=1.5$ yields the highest accuracy on AIME25. These results suggest that combining both local (step-level) and global (trajectory-level) reward signals is essential, and that moderate emphasis on trajectory-level reasoning is particularly beneficial for complex tasks. We also observe that the optimal value of $\alpha$ may be influenced by the underlying data distribution. As part of future work, we plan to make $\alpha$ learnable by introducing a lightweight neural module that dynamically adapts the weight between step-level and trajectory-level rewards based on the characteristics of each input sample.
Ablation on $\beta$ . In Eq. 12, we introduce $\beta$ as a weighting coefficient to balance the original rule-based GRPO reward and the process-level reward provided by ReasonFlux-PRM-7B. To understand its influence, we conduct an ablation study by varying $\beta\in\{0.1,0.3,0.5,0.8\}$ and applying GRPO with ReasonFlux-PRM-7B reward integration on the Qwen2.5-7B-Instruct policy model. As shown in Table 5, we evaluate the resulting models across AIME24, AIME25, and MATH500. The performance consistently improves with increasing $\beta$ , indicating the effectiveness of ReasonFlux-PRM ’s process-level supervision. The highest gains are achieved at $\beta=0.8$ , which yields 20.0% accuracy on AIME24, 16.7% on AIME25, and 76.8% on MATH500. The result demonstrates that a stronger emphasis on ReasonFlux-PRM rewards leads to more effective RL training.
## 6 Related Works
Offline Data Selection for CoT Reasoning at Scale. The quality of data has proven pivotal in the model training process [33, 34]. Recent studies further demonstrate that small subsets of high-quality data can outperform much larger unfiltered datasets in enhancing model reasoning abilities during post-training stages such as supervised fine-tuning [35, 13, 14, 36]. In contrast to online batch data selection methods [37, 38], which select samples based on updated model signals such as gradient norms or maximum sample loss during training, offline data selection approaches aim to select data once prior to the model training process. Motivated by the need for efficiency at scale, recent works have increasingly explored offline data selection as a means of curating high-quality datasets for LLMs training. Beyond simple rejection sampling, these approaches either train an additional model for data selection [39, 40], or adaptively select data based on natural language quality indicators [41], dataset diversity [42], or model-specific quality labels [43, 44]. More recently, model distillation [45, 46] has been widely adopted to leverage longer reasoning traces distilled from large-scale reasoning models as training data for improving the capabilities of downstream smaller models. Methods such as s1 [13], LIMO [14] and ReasonFlux [15] adapt smaller subsets of human-selected high-quality distilled data, enabling smaller models to perform better on sophisticated reasoning tasks compared to training on much larger quantities of raw distilled data. Building on these insights, instead of incurring additional computational costs by focusing solely on training data selection, our work extends the applicability of process reward models from traditional reward supervision to offline data selection, particularly in the context of raw model-distilled chain-of-thought reasoning trajectories [47, 48]. Leveraging the step-by-step supervision capability of PRMs, we utilize them as a metric to select high-quality reasoning traces from raw "silver" distilled data [16], with the goal of improving downstream post-training performance for smaller models.
Process Reward Models. Process Reward Models (PRMs) [5] provide step-level supervision for model reasoning answers, assigning intermediate rewards to each reasoning step [2, 49, 50, 51, 52, 7, 53, 54]. Existing PRMs, such as Math-Shepherd [55], Skywork-PRM [23], and Qwen2.5-Math-PRM series [2], are trained on either human-annotated rewards [5] or synthesized supervision signals [4] to provide fine-grained step-level rewards for model-generated reasoning solutions across different tasks such as math problem solving [18, 56], science reasoning [21], and programming [57]. More recent work such as Think-PRM [9] introduces a generative PRM to produce long CoT verification. Prior works have integrated PRMs as reward signals during training [6, 1, 58, 7], such as step-by-step verified online RL policy optimization [7, 8] or iterative generator improvement through verifier-guided self-training [59]. Others apply PRMs during inference-time scaling [60, 10, 9, 60, 61, 62, 15, 27] by integrating the models with step-level search and decoding strategies, including beam search [60], reward-guided tree search [63], Best-of-N sampling [64], etc. However, since current PRMs are mostly trained on model-generated final solutions, they struggle to provide effective reward supervision for the internal reasoning trajectories produced by large reasoning models [12] prior to generating final answers. To address this, we design a new trajectory-aware PRM specifically aimed at providing reward supervision for such trajectory–response formatted long CoT data.
## 7 Conclusion
We present ReasonFlux-PRM, a trajectory-aware PRM that delivers fine-grained step-level and trajectory-level supervision for trajectory-response long chain-of-thought reasoning traces. Through extensive empirical evaluations, ReasonFlux-PRM consistently improves downstream model performance across multiple challenging benchmarks and application settings. Specifically, ReasonFlux-PRM surpasses strong baselines and human-curated data in offline training data selection, enhances policy optimization during reinforcement learning via dense process-level rewards, and demonstrates superior test-time scaling in Best-of-N inference. Our results highlight the importance of trajectory-aware reward modeling for supervising model intermediate reasoning processes. The discussion of limitations and broader impacts is provided in Appendix F.
## References
- [1] Amrith Setlur, Chirag Nagpal, Adam Fisch, Xinyang Geng, Jacob Eisenstein, Rishabh Agarwal, Alekh Agarwal, Jonathan Berant, and Aviral Kumar. Rewarding progress: Scaling automated process verifiers for llm reasoning. arXiv preprint arXiv:2410.08146, 2024.
- [2] Zhenru Zhang, Chujie Zheng, Yangzhen Wu, Beichen Zhang, Runji Lin, Bowen Yu, Dayiheng Liu, Jingren Zhou, and Junyang Lin. The lessons of developing process reward models in mathematical reasoning. arXiv preprint arXiv:2501.07301, 2025.
- [3] Wendi Li and Yixuan Li. Process reward model with q-value rankings. In The Thirteenth International Conference on Learning Representations, 2025.
- [4] Liangchen Luo, Yinxiao Liu, Rosanne Liu, Samrat Phatale, Meiqi Guo, Harsh Lara, Yunxuan Li, Lei Shu, Yun Zhu, Lei Meng, et al. Improve mathematical reasoning in language models by automated process supervision. arXiv preprint arXiv:2406.06592, 2024.
- [5] Hunter Lightman, Vineet Kosaraju, Yuri Burda, Harrison Edwards, Bowen Baker, Teddy Lee, Jan Leike, John Schulman, Ilya Sutskever, and Karl Cobbe. Let’s verify step by step. In The Twelfth International Conference on Learning Representations, 2024.
- [6] Jonathan Uesato, Nate Kushman, Ramana Kumar, Francis Song, Noah Siegel, Lisa Wang, Antonia Creswell, Geoffrey Irving, and Irina Higgins. Solving math word problems with process-and outcome-based feedback. arXiv preprint arXiv:2211.14275, 2022.
- [7] Xinyu Guan, Li Lyna Zhang, Yifei Liu, Ning Shang, Youran Sun, Yi Zhu, Fan Yang, and Mao Yang. rstar-math: Small llms can master math reasoning with self-evolved deep thinking. arXiv preprint arXiv:2501.04519, 2025.
- [8] Ganqu Cui, Lifan Yuan, Zefan Wang, Hanbin Wang, Wendi Li, Bingxiang He, Yuchen Fan, Tianyu Yu, Qixin Xu, Weize Chen, et al. Process reinforcement through implicit rewards. arXiv preprint arXiv:2502.01456, 2025.
- [9] Muhammad Khalifa, Rishabh Agarwal, Lajanugen Logeswaran, Jaekyeom Kim, Hao Peng, Moontae Lee, Honglak Lee, and Lu Wang. Process reward models that think, 2025.
- [10] Jian Zhao, Runze Liu, Kaiyan Zhang, Zhimu Zhou, Junqi Gao, Dong Li, Jiafei Lyu, Zhouyi Qian, Biqing Qi, Xiu Li, and Bowen Zhou. Genprm: Scaling test-time compute of process reward models via generative reasoning, 2025.
- [11] Aaron Jaech, Adam Kalai, Adam Lerer, Adam Richardson, Ahmed El-Kishky, Aiden Low, Alec Helyar, Aleksander Madry, Alex Beutel, Alex Carney, et al. Openai o1 system card. arXiv preprint arXiv:2412.16720, 2024.
- [12] DeepSeek-AI. Deepseek-r1: Incentivizing reasoning capability in llms via reinforcement learning, 2025.
- [13] Niklas Muennighoff, Zitong Yang, Weijia Shi, Xiang Lisa Li, Li Fei-Fei, Hannaneh Hajishirzi, Luke Zettlemoyer, Percy Liang, Emmanuel Candès, and Tatsunori Hashimoto. s1: Simple test-time scaling, 2025.
- [14] Yixin Ye, Zhen Huang, Yang Xiao, Ethan Chern, Shijie Xia, and Pengfei Liu. Limo: Less is more for reasoning. arXiv preprint arXiv:2502.03387, 2025.
- [15] Ling Yang, Zhaochen Yu, Bin Cui, and Mengdi Wang. Reasonflux: Hierarchical llm reasoning via scaling thought templates. arXiv preprint arXiv:2502.06772, 2025.
- [16] Edward Yeo, Yuxuan Tong, Morry Niu, Graham Neubig, and Xiang Yue. Demystifying long chain-of-thought reasoning in llms. arXiv preprint arXiv:2502.03373, 2025.
- [17] Zhihong Shao, Peiyi Wang, Qihao Zhu, Runxin Xu, Junxiao Song, Xiao Bi, Haowei Zhang, Mingchuan Zhang, Y. K. Li, Y. Wu, and Daya Guo. Deepseekmath: Pushing the limits of mathematical reasoning in open language models, 2024.
- [18] Maxwell-Jia. AIME 2024 dataset. https://huggingface.co/datasets/Maxwell-Jia/AIME_2024, 2024. Accessed: 2025-05-15.
- [19] math ai. AIME 2025 dataset. https://huggingface.co/datasets/math-ai/aime25, 2025. Accessed: 2025-05-15.
- [20] Dan Hendrycks, Collin Burns, Saurav Kadavath, Akul Arora, Steven Basart, Eric Tang, Dawn Song, and Jacob Steinhardt. Measuring mathematical problem solving with the math dataset, 2021.
- [21] David Rein, Betty Li Hou, Asa Cooper Stickland, Jackson Petty, Richard Yuanzhe Pang, Julien Dirani, Julian Michael, and Samuel R. Bowman. Gpqa: A graduate-level google-proof q&a benchmark, 2023.
- [22] Google. Gemini Flash Thinking API. Accessed via the Google Cloud Platform, 2025. Accessed on May 15, 2025.
- [23] Jujie He, Tianwen Wei, Rui Yan, Jiacai Liu, Chaojie Wang, Yimeng Gan, Shiwen Tu, Chris Yuhao Liu, Liang Zeng, Xiaokun Wang, Boyang Wang, Yongcong Li, Fuxiang Zhang, Jiacheng Xu, Bo An, Yang Liu, and Yahui Zhou. Skywork-o1 open series. https://huggingface.co/Skywork, November 2024.
- [24] Lianmin Zheng, Wei-Lin Chiang, Ying Sheng, Siyuan Zhuang, Zhanghao Wu, Yonghao Zhuang, Zi Lin, Zhuohan Li, Dacheng Li, Eric Xing, et al. Judging llm-as-a-judge with mt-bench and chatbot arena. Advances in Neural Information Processing Systems, 36:46595–46623, 2023.
- [25] Zachary Ankner, Mansheej Paul, Brandon Cui, Jonathan D Chang, and Prithviraj Ammanabrolu. Critique-out-loud reward models. arXiv preprint arXiv:2408.11791, 2024.
- [26] Swarnadeep Saha, Xian Li, Marjan Ghazvininejad, Jason Weston, and Tianlu Wang. Learning to plan & reason for evaluation with thinking-llm-as-a-judge. arXiv preprint arXiv:2501.18099, 2025.
- [27] Ling Yang, Zhaochen Yu, Tianjun Zhang, Shiyi Cao, Minkai Xu, Wentao Zhang, Joseph E Gonzalez, and Bin Cui. Buffer of thoughts: Thought-augmented reasoning with large language models. Advances in Neural Information Processing Systems, 37:113519–113544, 2024.
- [28] John Schulman, Filip Wolski, Prafulla Dhariwal, Alec Radford, and Oleg Klimov. Proximal policy optimization algorithms. arXiv preprint arXiv:1707.06347, 2017.
- [29] Jian Hu. Reinforce++: A simple and efficient approach for aligning large language models. arXiv preprint arXiv:2501.03262, 2025.
- [30] Qwen Team. Qwen2.5: A party of foundation models, September 2024.
- [31] OpenThoughts Team. Open Thoughts. https://open-thoughts.ai, January 2025.
- [32] An Yang, Baosong Yang, Binyuan Hui, Bo Zheng, Bowen Yu, Chang Zhou, Chengpeng Li, Chengyuan Li, Dayiheng Liu, Fei Huang, Guanting Dong, Haoran Wei, Huan Lin, Jialong Tang, Jialin Wang, Jian Yang, Jianhong Tu, Jianwei Zhang, Jianxin Ma, Jin Xu, Jingren Zhou, Jinze Bai, Jinzheng He, Junyang Lin, Kai Dang, Keming Lu, Keqin Chen, Kexin Yang, Mei Li, Mingfeng Xue, Na Ni, Pei Zhang, Peng Wang, Ru Peng, Rui Men, Ruize Gao, Runji Lin, Shijie Wang, Shuai Bai, Sinan Tan, Tianhang Zhu, Tianhao Li, Tianyu Liu, Wenbin Ge, Xiaodong Deng, Xiaohuan Zhou, Xingzhang Ren, Xinyu Zhang, Xipin Wei, Xuancheng Ren, Yang Fan, Yang Yao, Yichang Zhang, Yu Wan, Yunfei Chu, Yuqiong Liu, Zeyu Cui, Zhenru Zhang, and Zhihao Fan. Qwen2 technical report. arXiv preprint arXiv:2407.10671, 2024.
- [33] Niklas Muennighoff, Alexander Rush, Boaz Barak, Teven Le Scao, Nouamane Tazi, Aleksandra Piktus, Sampo Pyysalo, Thomas Wolf, and Colin A Raffel. Scaling data-constrained language models. Advances in Neural Information Processing Systems, 36:50358–50376, 2023.
- [34] Biao Zhang, Zhongtao Liu, Colin Cherry, and Orhan Firat. When scaling meets llm finetuning: The effect of data, model and finetuning method. arXiv preprint arXiv:2402.17193, 2024.
- [35] Ziche Liu, Rui Ke, Yajiao Liu, Feng Jiang, and Haizhou Li. Take the essence and discard the dross: A rethinking on data selection for fine-tuning large language models. arXiv preprint arXiv:2406.14115, 2024.
- [36] Alon Albalak, Yanai Elazar, Sang Michael Xie, Shayne Longpre, Nathan Lambert, Xinyi Wang, Niklas Muennighoff, Bairu Hou, Liangming Pan, Haewon Jeong, et al. A survey on data selection for language models. arXiv preprint arXiv:2402.16827, 2024.
- [37] Angelos Katharopoulos and François Fleuret. Not all samples are created equal: Deep learning with importance sampling. In International conference on machine learning, pages 2525–2534. PMLR, 2018.
- [38] Jiachen Tianhao Wang, Tong Wu, Dawn Song, Prateek Mittal, and Ruoxi Jia. Greats: Online selection of high-quality data for llm training in every iteration. Advances in Neural Information Processing Systems, 37:131197–131223, 2024.
- [39] Sang Michael Xie, Hieu Pham, Xuanyi Dong, Nan Du, Hanxiao Liu, Yifeng Lu, Percy S Liang, Quoc V Le, Tengyu Ma, and Adams Wei Yu. Doremi: Optimizing data mixtures speeds up language model pretraining. Advances in Neural Information Processing Systems, 36:69798–69818, 2023.
- [40] Mengzhou Xia, Sadhika Malladi, Suchin Gururangan, Sanjeev Arora, and Danqi Chen. Less: Selecting influential data for targeted instruction tuning. arXiv preprint arXiv:2402.04333, 2024.
- [41] Yihan Cao, Yanbin Kang, Chi Wang, and Lichao Sun. Instruction mining: Instruction data selection for tuning large language models, 2024.
- [42] Minghao Wu, Thuy-Trang Vu, Lizhen Qu, and Gholamreza Haffari. The best of both worlds: Bridging quality and diversity in data selection with bipartite graph, 2024.
- [43] Ziche Liu, Rui Ke, Yajiao Liu, Feng Jiang, and Haizhou Li. Take the essence and discard the dross: A rethinking on data selection for fine-tuning large language models, 2025.
- [44] Jiaru Zou, Mengyu Zhou, Tao Li, Shi Han, and Dongmei Zhang. Promptintern: Saving inference costs by internalizing recurrent prompt during large language model fine-tuning. arXiv preprint arXiv:2407.02211, 2024.
- [45] Haoran Li, Qingxiu Dong, Zhengyang Tang, Chaojun Wang, Xingxing Zhang, Haoyang Huang, Shaohan Huang, Xiaolong Huang, Zeqiang Huang, Dongdong Zhang, et al. Synthetic data (almost) from scratch: Generalized instruction tuning for language models. arXiv preprint arXiv:2402.13064, 2024.
- [46] Xiaohan Xu, Ming Li, Chongyang Tao, Tao Shen, Reynold Cheng, Jinyang Li, Can Xu, Dacheng Tao, and Tianyi Zhou. A survey on knowledge distillation of large language models. arXiv preprint arXiv:2402.13116, 2024.
- [47] Murong Yue, Wenlin Yao, Haitao Mi, Dian Yu, Ziyu Yao, and Dong Yu. Dots: Learning to reason dynamically in llms via optimal reasoning trajectories search. arXiv preprint arXiv:2410.03864, 2024.
- [48] Etash Guha, Ryan Marten, Sedrick Keh, Negin Raoof, Georgios Smyrnis, Hritik Bansal, Marianna Nezhurina, Jean Mercat, Trung Vu, Zayne Sprague, Ashima Suvarna, Benjamin Feuer, Liangyu Chen, Zaid Khan, Eric Frankel, Sachin Grover, Caroline Choi, Niklas Muennighoff, Shiye Su, Wanjia Zhao, John Yang, Shreyas Pimpalgaonkar, Kartik Sharma, Charlie Cheng-Jie Ji, Yichuan Deng, Sarah Pratt, Vivek Ramanujan, Jon Saad-Falcon, Jeffrey Li, Achal Dave, Alon Albalak, Kushal Arora, Blake Wulfe, Chinmay Hegde, Greg Durrett, Sewoong Oh, Mohit Bansal, Saadia Gabriel, Aditya Grover, Kai-Wei Chang, Vaishaal Shankar, Aaron Gokaslan, Mike A. Merrill, Tatsunori Hashimoto, Yejin Choi, Jenia Jitsev, Reinhard Heckel, Maheswaran Sathiamoorthy, Alexandros G. Dimakis, and Ludwig Schmidt. Openthoughts: Data recipes for reasoning models, 2025.
- [49] Jonathan Uesato, Nate Kushman, Ramana Kumar, Francis Song, Noah Siegel, Lisa Wang, Antonia Creswell, Geoffrey Irving, and Irina Higgins. Solving math word problems with process- and outcome-based feedback, 2022.
- [50] Dan Zhang, Sining Zhoubian, Ziniu Hu, Yisong Yue, Yuxiao Dong, and Jie Tang. Rest-mcts*: Llm self-training via process reward guided tree search. arXiv preprint arXiv:2406.03816, 2024.
- [51] Amrith Setlur, Chirag Nagpal, Adam Fisch, Xinyang Geng, Jacob Eisenstein, Rishabh Agarwal, Alekh Agarwal, Jonathan Berant, and Aviral Kumar. Rewarding progress: Scaling automated process verifiers for llm reasoning. arXiv preprint arXiv:2410.08146, 2024.
- [52] Chengqi Lyu, Songyang Gao, Yuzhe Gu, Wenwei Zhang, Jianfei Gao, Kuikun Liu, Ziyi Wang, Shuaibin Li, Qian Zhao, Haian Huang, et al. Exploring the limit of outcome reward for learning mathematical reasoning. arXiv preprint arXiv:2502.06781, 2025.
- [53] Yinjie Wang, Ling Yang, Ye Tian, Ke Shen, and Mengdi Wang. Co-evolving llm coder and unit tester via reinforcement learning. arXiv preprint arXiv:2506.03136, 2025.
- [54] Xiusi Chen, Gaotang Li, Ziqi Wang, Bowen Jin, Cheng Qian, Yu Wang, Hongru Wang, Yu Zhang, Denghui Zhang, Tong Zhang, Hanghang Tong, and Heng Ji. Rm-r1: Reward modeling as reasoning, 2025.
- [55] Peiyi Wang, Lei Li, Zhihong Shao, R. X. Xu, Damai Dai, Yifei Li, Deli Chen, Y. Wu, and Zhifang Sui. Math-shepherd: Verify and reinforce llms step-by-step without human annotations, 2024.
- [56] Haipeng Luo, Qingfeng Sun, Can Xu, Pu Zhao, Jianguang Lou, Chongyang Tao, Xiubo Geng, Qingwei Lin, Shifeng Chen, Yansong Tang, and Dongmei Zhang. Wizardmath: Empowering mathematical reasoning for large language models via reinforced evol-instruct, 2025.
- [57] Xinyi He, Jiaru Zou, Yun Lin, Mengyu Zhou, Shi Han, Zejian Yuan, and Dongmei Zhang. CoCoST: Automatic complex code generation with online searching and correctness testing. In Yaser Al-Onaizan, Mohit Bansal, and Yun-Nung Chen, editors, Proceedings of the 2024 Conference on Empirical Methods in Natural Language Processing, pages 19433–19451, Miami, Florida, USA, November 2024. Association for Computational Linguistics.
- [58] Wendi Li and Yixuan Li. Process reward model with q-value rankings. arXiv preprint arXiv:2410.11287, 2024.
- [59] Arian Hosseini, Xingdi Yuan, Nikolay Malkin, Aaron Courville, Alessandro Sordoni, and Rishabh Agarwal. V-star: Training verifiers for self-taught reasoners. arXiv preprint arXiv:2402.06457, 2024.
- [60] Charlie Snell, Jaehoon Lee, Kelvin Xu, and Aviral Kumar. Scaling llm test-time compute optimally can be more effective than scaling model parameters. arXiv preprint arXiv:2408.03314, 2024.
- [61] Jiaru Zou, Qing Wang, Pratyush Thakur, and Nickvash Kani. Stem-pom: Evaluating language models math-symbol reasoning in document parsing. arXiv preprint arXiv:2411.00387, 2024.
- [62] Wenkai Yang, Shuming Ma, Yankai Lin, and Furu Wei. Towards thinking-optimal scaling of test-time compute for llm reasoning. arXiv preprint arXiv:2502.18080, 2025.
- [63] Yangzhen Wu, Zhiqing Sun, Shanda Li, Sean Welleck, and Yiming Yang. Inference scaling laws: An empirical analysis of compute-optimal inference for problem-solving with language models. arXiv preprint arXiv:2408.00724, 2024.
- [64] Runze Liu, Junqi Gao, Jian Zhao, Kaiyan Zhang, Xiu Li, Biqing Qi, Wanli Ouyang, and Bowen Zhou. Can 1b llm surpass 405b llm? rethinking compute-optimal test-time scaling. arXiv preprint arXiv:2502.06703, 2025.
- [65] Jia LI, Edward Beeching, Lewis Tunstall, Ben Lipkin, Roman Soletskyi, Shengyi Costa Huang, Kashif Rasul, Longhui Yu, Albert Jiang, Ziju Shen, Zihan Qin, Bin Dong, Li Zhou, Yann Fleureau, Guillaume Lample, and Stanislas Polu. Numinamath. [https://huggingface.co/AI-MO/NuminaMath-CoT](https://github.com/project-numina/aimo-progress-prize/blob/main/report/numina_dataset.pdf), 2024.
- [66] Yujia Li, David Choi, Junyoung Chung, Nate Kushman, Julian Schrittwieser, Rémi Leblond, Tom Eccles, James Keeling, Felix Gimeno, Agustin Dal Lago, Thomas Hubert, Peter Choy, Cyprien de Masson d’Autume, Igor Babuschkin, Xinyun Chen, Po-Sen Huang, Johannes Welbl, Sven Gowal, Alexey Cherepanov, James Molloy, Daniel Mankowitz, Esme Sutherland Robson, Pushmeet Kohli, Nando de Freitas, Koray Kavukcuoglu, and Oriol Vinyals. Competition-level code generation with alphacode. arXiv preprint arXiv:2203.07814, 2022.
- [67] Guohao Li, Hasan Abed Al Kader Hammoud, Hani Itani, Dmitrii Khizbullin, and Bernard Ghanem. Camel: Communicative agents for "mind" exploration of large scale language model society, 2023.
- [68] Qiying Yu, Zheng Zhang, Ruofei Zhu, Yufeng Yuan, Xiaochen Zuo, Yu Yue, Tiantian Fan, Gaohong Liu, Lingjun Liu, Xin Liu, et al. Dapo: An open-source llm reinforcement learning system at scale. arXiv preprint arXiv:2503.14476, 2025.
- [69] Leandro von Werra, Younes Belkada, Lewis Tunstall, Edward Beeching, Tristan Thrush, Nathan Lambert, Shengyi Huang, Kashif Rasul, and Quentin Gallouédec. TRL: Transformer Reinforcement Learning.
Table of Contents
1. 1 Introduction
1. 2 Preliminaries
1. 3 Existing PRMs Are Not Prepared for Rewarding Thinking Trajectories
1. 4 ReasonFlux-PRM
1. 4.1 How Should We Define Process Rewards and Why?
1. 4.2 Offline Data Selection and Online Reward Modeling
1. 5 Empirical Evaluations
1. 5.1 Offline Data Selection
1. 5.2 Online Reward Modeling
1. 5.3 Efficiency Analyses
1. 5.4 Ablation Study
1. 6 Related Works
1. 7 Conclusion
1. A Details on the Preliminary Study in Section 3
1. A.1 Preliminary Study Setups
1. A.2 Difference between Model Thinking Trajectories and Final Responses
1. B Template guided trajectory-level reward design
1. C Additional Experimental Setups
1. C.1 ReasonFlux-PRM Training
1. C.2 Downstream Tasks
1. D Additional Analyses
1. D.1 Scaling up ReasonFlux-PRM Model Size on Policy Optimization
1. D.2 End-to-End Training with ReasonFlux-PRM (SFT+RL)
1. E Case Study on ReasonFlux-PRM
1. F Limitations and Broader Impacts
## Appendix A Details on the Preliminary Study in Section 3
### A.1 Preliminary Study Setups
Process Reward Models. We evaluate four state-of-the-art process reward models for scoring the quality of the thinking trajectories data: Math-Shepherd-PRM-8B [55], Skywork-PRM-7B [23], Qwen2.5-Math-PRM-7B [2], and Qwen2.5-Math-PRM-72B [2]. The details description for each model is shown below:
- Math-Shepherd-PRM-8B [55]: A 7B PRM based on Mistral, trained with data auto-generated from Mistral-7B fine-tuned on MetaMath. It emphasizes verification of step-level reasoning through process-level rewards without human annotations.
- Skywork-PRM-7B [23]: A PRM built on Qwen2.5-Math-7B-Instruct and trained on data derived from LLaMA-2 fine-tuned on math tasks. It shows strong generalization for verifying reasoning trajectories across models and supports efficient TTS with low inference overhead.
- Qwen2.5-Math-PRM-7B [2]: Trained on Qwen2.5-Math-7B-Instruct using data from the Qwen2.5-Math series, this PRM offers robust step-by-step reward signals and high compatibility with Qwen family models, demonstrating superior supervision ability in TTS tasks among 7B-scale PRMs.
- Qwen2.5-Math-PRM-72B [2]: A high-capacity verifier trained on Qwen2.5-Math-72B-Instruct and Qwen-generated data. It achieves state-of-the-art process supervision and excels in guiding both sampling- and search-based TTS strategies across a range of mathematical reasoning tasks.
Data Sources. For the data sources, we follow s1k [13] to use its collected datasets consisting of 59K raw model thinking trajectories distilled from the Google Gemini Flash Thinking API [22], along with 1K human-curated samples from the same source and an additional 1K human-curated samples from Deepseek-R1 [12]. These trajectories span a broad range of topics, including math and scientific reasoning. For downstream tasks, we choose 4 challenging benchmarks including: AIME24 [18], AIME25 [19], MATH500 [20], and GPQA-Diamond [21].
Training Details in RQ2. As the downstream generator, we adopt Qwen2.5-14B-Instruct as our base model for fine-tuning evaluation. We perform supervised fine-tuning on the Qwen2.5-14B-Instruct model using various 1,000-sample training datasets, each selected either by different PRM-based rankings or curated by human annotators in s1k [13]. We fine-tune the model for 5 epochs using a learning rate of $1\text{e}^{-5}$ , weight decay of $1\text{e}^{-4}$ , and a maximum sequence length of 32,768. All experiments are conducted on a server node with 8 A100-80G GPUs.
### A.2 Difference between Model Thinking Trajectories and Final Responses
As we mentioned in Section 3, there are two key difference of the data between model thinking trajectories and final responses:
- Branching steps across thinking trajectories: For instance, the thinking trajectories might initially assume an incorrect variable assignment in a math problem, detect the inconsistency, and backtrack to re-derive the solution.
- Weaker global coherence across steps: This manifests in speculative or uncertain statements (e.g., “if we assume X, then Y”) that may not resolve within the same reasoning path, and in disjointed or redundant logic, such as repeating subgoals or prematurely concluding without fully integrating prior steps. In contrast, final responses are typically globally fluent and logically unified, aiming to deliver a streamlined and conclusive answer.
In Examples 1 and 2 below, we provide detailed data examples that highlight the distinctions between model thinking trajectories and final output responses. These examples showcase how the thinking trajectories often contain exploratory, speculative, or partially resolved reasoning steps, in contrast to the more polished and coherent final outputs. To better illustrate these differences, we highlight all branching steps, backtracking behaviors, and internal deliberations in blue, emphasizing the non-linear and less deterministic nature of the model’s intermediate reasoning process.
Example 1
Question: Two capacitors with capacitance values $C_{1}=2000\pm 10\penalty 10000\ \mathrm{pF}$ and $C_{2}=3000\pm 15\penalty 10000\ \mathrm{pF}$ are connected in series. The voltage applied across this combination is $V=5.00\pm 0.02\penalty 10000\ \mathrm{V}$ . What is the percentage error in the calculation of the energy stored in this combination of capacitors? Thinking Trajectories: Let $C_{1}$ and $C_{2}$ be the capacitance values of the two capacitors, and $\Delta C_{1}$ , $\Delta C_{2}$ be their absolute errors. Given: $C_{1}=2000\pm 10\penalty 10000\ \mathrm{pF}$ $C_{2}=3000\pm 15\penalty 10000\ \mathrm{pF}$ Voltage applied across the combination, $V=5.00\pm 0.02\penalty 10000\ \mathrm{V}$ When capacitors are connected in series, the equivalent capacitance $C_{\text{eq}}$ is given by: $\frac{1}{C_{\text{eq}}}=\frac{1}{C_{1}}+\frac{1}{C_{2}}\Rightarrow C_{\text{eq}}=\frac{C_{1}C_{2}}{C_{1}+C_{2}}$ Let me double check, initially I thought the formula was $C_{1}+C_{2}$ , but that’s for parallel combination. Since it’s in series, we should use the reciprocal formula. Calculate the nominal value: $C_{\text{eq}}=\frac{2000\times 3000}{2000+3000}=\frac{6\times 10^{6}}{5000}=1200\penalty 10000\ \mathrm{pF}$ To find the error in $C_{\text{eq}}$ , we use: $\Delta C_{\text{eq}}=\sqrt{\left(\frac{\partial C_{\text{eq}}}{\partial C_{1}}\Delta C_{1}\right)^{2}+\left(\frac{\partial C_{\text{eq}}}{\partial C_{2}}\Delta C_{2}\right)^{2}}$ Partial derivatives: $\frac{\partial C_{\text{eq}}}{\partial C_{1}}=\frac{C_{2}^{2}}{(C_{1}+C_{2})^{2}},\quad\frac{\partial C_{\text{eq}}}{\partial C_{2}}=\frac{C_{1}^{2}}{(C_{1}+C_{2})^{2}}$ Evaluate: $\frac{9}{25},\quad\frac{4}{25}$ $\displaystyle\Delta C_{\text{eq}}$ $\displaystyle=\sqrt{\left(\frac{9}{25}\times 10\right)^{2}+\left(\frac{4}{25}\times 15\right)^{2}}=\frac{1}{25}\sqrt{90^{2}+60^{2}}$ $\displaystyle=\frac{1}{25}\sqrt{8100+3600}=\frac{1}{25}\sqrt{11700}\approx 4.33\penalty 10000\ \mathrm{pF}$ Hmm, but is this the only way? Maybe logarithmic differentiation would give a cleaner expression? Let me try an alternative method: $\frac{1}{C_{\text{eq}}}=\frac{1}{C_{1}}+\frac{1}{C_{2}}\Rightarrow-\frac{1}{C_{\text{eq}}^{2}}dC_{\text{eq}}=-\frac{1}{C_{1}^{2}}dC_{1}-\frac{1}{C_{2}^{2}}dC_{2}$ So: $\frac{dC_{\text{eq}}}{C_{\text{eq}}^{2}}=\frac{dC_{1}}{C_{1}^{2}}+\frac{dC_{2}}{C_{2}^{2}}\Rightarrow\frac{\Delta C_{\text{eq}}}{C_{\text{eq}}}=C_{\text{eq}}\left(\frac{\Delta C_{1}}{C_{1}^{2}}+\frac{\Delta C_{2}}{C_{2}^{2}}\right)$ This seems messier, maybe it is generalizable. Now let me compute it: $=\frac{3000\cdot 10}{2000\cdot 5000}+\frac{2000\cdot 15}{3000\cdot 5000}=0.003+0.002=0.005\Rightarrow\Delta C_{\text{eq}}=0.005\cdot 1200=6\penalty 10000\ \mathrm{pF}$ Now compute energy: $E=\frac{1}{2}C_{\text{eq}}V^{2}$ Let me double-check: voltage is squared here, so the error contribution from voltage gets doubled in fractional terms. Fractional error: $\frac{\Delta E}{E}=\frac{\Delta C_{\text{eq}}}{C_{\text{eq}}}+2\cdot\frac{\Delta V}{V}=0.005+2\cdot 0.004=0.013\Rightarrow\text{Percentage error}=1.3\$ Alternative verification might help… I might try distribute the weight of errors proportionally: $\frac{\Delta C_{\text{eq}}}{C_{\text{eq}}}=\frac{\Delta C_{1}}{C_{1}}\cdot\frac{C_{2}}{C_{1}+C_{2}}+\frac{\Delta C_{2}}{C_{2}}\cdot\frac{C_{1}}{C_{1}+C_{2}}=0.005\cdot 0.6+0.005\cdot 0.4=0.005$ Let me Final check: $\ln E=\ln\left(\frac{1}{2}\right)+\ln C_{\text{eq}}+2\ln V\Rightarrow\frac{\Delta E}{E}=\frac{\Delta C_{\text{eq}}}{C_{\text{eq}}}+2\cdot\frac{\Delta V}{V}$ The final answer is: $\Rightarrow\boxed{1.3\$ Final Response: Step 1: Calculate the Equivalent Capacitance When capacitors are connected in series, the equivalent capacitance $C_{\text{eq}}$ is given by: $\frac{1}{C_{\text{eq}}}=\frac{1}{C_{1}}+\frac{1}{C_{2}}=\frac{C_{1}+C_{2}}{C_{1}C_{2}}\quad\Rightarrow\quad C_{\text{eq}}=\frac{C_{1}C_{2}}{C_{1}+C_{2}}$ $C_{\text{eq}}=\frac{2000\times 3000}{2000+3000}=\frac{6\times 10^{6}}{5000}=1200\penalty 10000\ \mathrm{pF}$ Step 2: Calculate the Error in $C_{\text{eq}}$ Using the formula for propagation of uncertainty: $\Delta C_{\text{eq}}=\left|\frac{\partial C_{\text{eq}}}{\partial C_{1}}\right|\Delta C_{1}+\left|\frac{\partial C_{\text{eq}}}{\partial C_{2}}\right|\Delta C_{2}$ Compute the partial derivatives: $\frac{\partial C_{\text{eq}}}{\partial C_{1}}=\frac{C_{2}^{2}}{(C_{1}+C_{2})^{2}},\quad\frac{\partial C_{\text{eq}}}{\partial C_{2}}=\frac{C_{1}^{2}}{(C_{1}+C_{2})^{2}}$ Substitute the given values: $\frac{\partial C_{\text{eq}}}{\partial C_{1}}=\frac{3000^{2}}{5000^{2}}=\frac{9}{25},\quad\frac{\partial C_{\text{eq}}}{\partial C_{2}}=\frac{2000^{2}}{5000^{2}}=\frac{4}{25}$ Now compute the error: $\Delta C_{\text{eq}}=\frac{9}{25}\cdot 10+\frac{4}{25}\cdot 15=\frac{90}{25}+\frac{60}{25}=\frac{150}{25}=6\penalty 10000\ \mathrm{pF}$ Step 3: Compute the Fractional Error in $C_{\text{eq}}$ $\frac{\Delta C_{\text{eq}}}{C_{\text{eq}}}=\frac{6}{1200}=0.005$ Step 4: Energy Stored in the Capacitor System The energy stored in a capacitor is given by: $E=\frac{1}{2}C_{\text{eq}}V^{2}$ Step 5: Propagate Error in Energy Calculation The fractional error in energy $E$ is: $\frac{\Delta E}{E}=\frac{\Delta C_{\text{eq}}}{C_{\text{eq}}}+2\cdot\frac{\Delta V}{V}$ Given: $\frac{\Delta C_{\text{eq}}}{C_{\text{eq}}}=0.005,\quad\frac{\Delta V}{V}=\frac{0.02}{5.00}=0.004$ Substitute into the error formula: $\frac{\Delta E}{E}=0.005+2\cdot 0.004=0.005+0.008=0.013$ Step 6: Convert to Percentage Error $\text{Percentage error}=\frac{\Delta E}{E}\times 100\$ Final Answer: The percentage error in the energy stored is $\boxed{1.3\$ .
Example 2
Question: One base of a trapezoid is $100$ units longer than the other base. The segment that joins the midpoints of the legs divides the trapezoid into two regions whose areas are in the ratio $2:3$ . Let $x$ be the length of the segment, parallel to the bases, that divides the trapezoid into two regions of equal area. Find the greatest integer that does not exceed $\dfrac{x^{2}}{100}$ . Thinking Trajectories: The problem asks for the value of $\lfloor x^{2}/100\rfloor$ , where $x$ is the length of a segment parallel to the bases that divides the trapezoid into two regions of equal area. We are given information about the lengths of the bases and the ratio of the areas created by the segment joining the midpoints of the legs. Let the lengths of the two bases be $b_{1}$ and $b_{2}$ , with $b_{1}>b_{2}$ . We are told that: $b_{1}=b_{2}+100$ Let the height of the trapezoid be $h$ . The midline of the trapezoid has length: $m=\frac{b_{1}+b_{2}}{2}$ It divides the trapezoid into two smaller trapezoids, each of height $h/2$ . The area of the upper trapezoid is: $A_{1}=\frac{1}{2}(b_{2}+m)\cdot\frac{h}{2}=\frac{h}{8}(b_{1}+3b_{2})$ The area of the lower trapezoid is: $A_{2}=\frac{1}{2}(b_{1}+m)\cdot\frac{h}{2}=\frac{h}{8}(3b_{1}+b_{2})$ We are told that the ratio of areas is $2:3$ (upper to lower), so: $\frac{A_{1}}{A_{2}}=\frac{b_{1}+3b_{2}}{3b_{1}+b_{2}}=\frac{2}{3}\Rightarrow 3(b_{1}+3b_{2})=2(3b_{1}+b_{2})\Rightarrow 3b_{1}+9b_{2}=6b_{1}+2b_{2}\Rightarrow 7b_{2}=3b_{1}$ Substitute $b_{1}=b_{2}+100$ : $7b_{2}=3(b_{2}+100)\Rightarrow 7b_{2}=3b_{2}+300\Rightarrow 4b_{2}=300\Rightarrow b_{2}=75\Rightarrow b_{1}=175$ Let me also test the other case just in case it’s a typo, what if the area ratio was actually $3:2$ ? $\displaystyle\frac{b_{1}+3b_{2}}{3b_{1}+b_{2}}=\frac{3}{2}$ $\displaystyle\Rightarrow 2(b_{1}+3b_{2})=3(3b_{1}+b_{2})\Rightarrow 2b_{1}+6b_{2}=9b_{1}+3b_{2}\Rightarrow 3b_{2}=7b_{1}$ $\displaystyle\Rightarrow 3b_{2}=7(b_{2}+100)\Rightarrow 3b_{2}=7b_{2}+700\Rightarrow-4b_{2}=700\Rightarrow b_{2}=-175$ That’s invalid as the length can’t be negative. So the correct ratio is $2:3$ and $b_{2}=75$ , $b_{1}=175$ . Now consider a segment of length $x$ , parallel to the bases, that divides the trapezoid into two equal-area regions. Let the height from $b_{2}$ up to this segment be $h^{\prime}$ . The total area is: $A_{\text{total}}=\frac{1}{2}(b_{1}+b_{2})h=\frac{1}{2}(175+75)h=125h$ We want: $\frac{1}{2}(b_{2}+x)h^{\prime}=\frac{125h}{2}\Rightarrow(b_{2}+x)h^{\prime}=125h$ We also know from similar triangles: $\frac{x-b_{2}}{h^{\prime}}=\frac{b_{1}-b_{2}}{h}\Rightarrow\frac{h^{\prime}}{h}=\frac{x-b_{2}}{b_{1}-b_{2}}$ Substitute into the area equation: $(b_{2}+x)\cdot h\cdot\frac{x-b_{2}}{b_{1}-b_{2}}=125h\Rightarrow(b_{2}+x)(x-b_{2})=125(b_{1}-b_{2})$ $x^{2}-b_{2}^{2}=125(b_{1}-b_{2})\Rightarrow x^{2}=125(b_{1}-b_{2})+b_{2}^{2}$ Substitute $b_{1}=175$ , $b_{2}=75$ : $x^{2}=125(100)+75^{2}=12500+5625=18125\Rightarrow\left\lfloor\frac{x^{2}}{100}\right\rfloor=\left\lfloor\frac{18125}{100}\right\rfloor=\boxed{181}$ I also saw a different derivation that leads directly to this result. Let me verify it: $2x^{2}=b_{1}^{2}+b_{2}^{2}\Rightarrow x^{2}=\frac{b_{1}^{2}+b_{2}^{2}}{2}\Rightarrow x^{2}=\frac{175^{2}+75^{2}}{2}=\frac{30625+5625}{2}=18125\Rightarrow\left\lfloor\frac{x^{2}}{100}\right\rfloor=\boxed{181}$ Final Response: Step 1: Set up variables and use the area ratio condition Let the lengths of the two bases of the trapezoid be $b_{1}$ and $b_{2}$ , with $b_{1}>b_{2}$ . We are given that $b_{1}=b_{2}+100$ . The segment that joins the midpoints of the legs (the midline) divides the trapezoid into two smaller trapezoids with heights $h/2$ . The lengths of the parallel sides of the upper trapezoid are $b_{2}$ and $m=\frac{b_{1}+b_{2}}{2}$ , and its area is $A_{1}=\frac{h}{8}(b_{1}+3b_{2}).$ The lengths of the parallel sides of the lower trapezoid are $m$ and $b_{1}$ , and its area is $A_{2}=\frac{h}{8}(3b_{1}+b_{2}).$ The ratio of the areas is $A_{1}:A_{2}=(b_{1}+3b_{2}):(3b_{1}+b_{2})$ . Given that this ratio is $2:3$ or $3:2$ . If $\frac{b_{1}+3b_{2}}{3b_{1}+b_{2}}=\frac{2}{3},$ then $3b_{1}+9b_{2}=6b_{1}+2b_{2},$ , so $7b_{2}=3b_{1}.$ Substituting $b_{1}=b_{2}+100$ , we get $7b_{2}=3(b_{2}+100),$ so $4b_{2}=300,\quad b_{2}=75,\quad\text{and}\quad b_{1}=175.$ Step 2: Verify the alternate area ratio leads to contradiction If $\frac{b_{1}+3b_{2}}{3b_{1}+b_{2}}=\frac{3}{2},$ we get $2b_{1}+6b_{2}=9b_{1}+3b_{2},$ so $3b_{2}=7b_{1},$ which leads to a negative value for $b_{2}$ , which is impossible. The lengths of the bases are $b_{1}=175$ and $b_{2}=75$ . Step 3: Express the condition for equal-area division Let the segment of length $x$ parallel to the bases divide the trapezoid into two regions of equal area. The square of the length of such a segment is given by $x^{2}=\frac{b_{1}^{2}+b_{2}^{2}}{2}.$ $x^{2}=\frac{175^{2}+75^{2}}{2}=\frac{30625+5625}{2}=\frac{36250}{2}=18125.$ Step 4: Compute the final result We need to find the greatest integer that does not exceed $x^{2}/100$ . $\frac{x^{2}}{100}=\frac{18125}{100}=181.25.$ The greatest integer that does not exceed $181.25$ is $\lfloor 181.25\rfloor=181.$ Final Answer: The final answer is $\boxed{181}$ .
## Appendix B Template guided trajectory-level reward design
Prompt Design of the Template (LLM-as-a-Verifier)
You are given a long chain-of-thought (CoT) response to a challenging math problem. Your task is to summarize the response into a structured sequence of reasoning steps that can serve as a clear and guided template for use by a smaller model. Problem: [problem] Response: [response] Instructions: Please summarize the response as a concise list of reasoning steps, each capturing a distinct part of the thought process. These may include restating the problem, defining variables, constructing mathematical models, performing calculations, verifying results, handling different cases, correcting mistakes, and drawing the final conclusion. Focus on preserving the logical flow while keeping each step clear and concise. Here are a few template examples you should strictly follow: [Template Example 1] [Template Example 2] [Template Example 3] Write your answer below.
## Appendix C Additional Experimental Setups
### C.1 ReasonFlux-PRM Training
For ReasonFlux-PRM training, we initialize from the off-the-shelf Qwen2.5-1.5B-Instruct and Qwen2.5-7B-Instruct models [30], serving as our 1.5B-scale and 7B-scale ReasonFlux-PRM backbones. We then train ReasonFlux-PRM on the OpenThoughts-114K [31] collection of datasets containing rich, model-generated thinking trajectories paired with their corresponding final responses.
OpenThoughts-114k is a publicly available synthetic reasoning dataset comprising 114,000 high-quality examples across four domains: mathematics, science, code, and puzzles. Each example includes a problem statement, a thinking trajectory generated by the Deepseek-R1, and a corresponding model response. The dataset was constructed by curating prompts from existing datasets, such as AI-MO/NuminaMath-CoT [65] for math, DeepMind/code-contests [66] for code, and camel-ai/chemistry [67] for science. We utilize the model-generated thinking trajectories and final responses from the datasets as raw training data. Subsequently, we assign step-level and trajectory-level rewards based on our specific reward design, as detailed in Section 4.1.
We follow our detailed description in Section 4.1 to train with the step-level reward. In addition, to train with the template-guided trajectory-level reward, we first randomly sample 1000 problem-response samples from OpenThoughts-114k, and prompt GPT-4o to extract the reasoning template from each CoT sample using the prompt in Section B. For each problem-template pair, we choose Qwen2.5-7B-Instruct as our generator $\pi_{\theta}$ and generate $N=5$ responses that attempt to solve the problem while adhering to the reasoning template. The ground truth trajectory-level reward is then computed as the average accuracy across the 5 responses, as shown in Eq. 9. We then combine the step-level and trajectory-level rewards to obtain the ground truth reward values for the 1000 samples, and train ReasonFlux-PRM to learn these reward values using the joint training objective in Eq. 10. To train our reward model, we use a learning rate of 1e-5 and train for 3 epochs.
### C.2 Downstream Tasks
For offline data selection and subsequent supervised fine-tuning, we follow the exact experimental setup described in Appendix A.1 to ensure a fair comparison with baseline models. Specifically, we begin by assigning reward scores to each trajectory–response pair in OpenThoughts-114k using the designated reward model. We then rank all samples based on their aggregated reward scores and select the top 1,000 examples to serve as the training set for downstream fine-tuning.
For online policy optimization, we use a training dataset comprising 10k competition-level mathematical reasoning problems collected from MATH [20] and the DAPO [68] training set. These training data contains math problems spanning a wide range of topics, including algebra, geometry, probability, and precalculus. Our GRPO training framework is built on the original Hugging Face GRPO Trainer [69]. We train with a batch size of 32, generating 6 samples per prompt, and run training for 3 epochs. As mentioned above, the vanilla GRPO relies on a rule-based reward that evaluates only the correctness of the final answer. On the other hand, we replace the rule-based reward with the learned reward signal obtained by passing the training prompt and the policy model’s output through ReasonFlux-PRM.
For the Best-of-N test-time scaling experiments, we use Qwen2.5-14B-Instruct as the generator model. Given an input problem $x$ , the generator produces $N$ candidate reasoning trajectories using nucleus sampling with temperature $T=0.3$ , where $N\in\{2,4,8,16\}$ . Each candidate trajectory is then scored by ReasonFlux-PRM, which provides a scalar reward reflecting the trajectory’s quality in terms of correctness, coherence, and reasoning structure. The final output is selected as the trajectory with the highest ReasonFlux-PRM assigned reward. We evaluate performance by measuring final-answer accuracy over the selected outputs.
## Appendix D Additional Analyses
### D.1 Scaling up ReasonFlux-PRM Model Size on Policy Optimization
Table 6: Scaling Effects of ReasonFlux-PRM model size on GRPO online policy optimization performance. Larger ReasonFlux-PRM reward models (7B vs. 1.5B) consistently yield better downstream performance on MATH500 and GPQA-Diamond across both Qwen2.5-7B-Instruct and DeepSeek-R1-Distill-Qwen-7B policy models.
| Policy Model | ReasonFlux-PRM Size | MATH500 | GPQA-Diamond |
| --- | --- | --- | --- |
| Qwen2.5-7B-Instruct | 1.5B | 73.8 | 30.8 |
| 7B | 77.6 | 34.3 | |
| DeepSeek-R1-Distill-Qwen-7B | 1.5B | 90.4 | 48.5 |
| 7B | 93.8 | 51.5 | |
To investigate the impact of reward model capacity, we vary the size of the ReasonFlux-PRM model used to provide rewards for GRPO-based policy optimization. As shown in Table 6, using a larger ReasonFlux-PRM model consistently improves performance across both policy models, Qwen2.5-7B-Instruct and DeepSeek-R1-Distill-Qwen-7B. Specifically, scaling ReasonFlux-PRM from 1.5B to 7B leads to a 3.8% gain on MATH500 and 3.5% on GPQA-Diamond for Qwen2.5-7B-Instruct. Likewise, for DeepSeek-R1-Distill-Qwen-7B, we observe a 3.4% improvement on MATH500 and 3.0% on GPQA-Diamond. These results indicate that larger reward models provide more accurate and informative signals for RL, thereby enabling stronger policy optimization.
### D.2 End-to-End Training with ReasonFlux-PRM (SFT+RL)
Table 7: Effect of ReasonFlux-PRM-7B selected supervised fine-tuning on downstream RL. We compare the original backbone model (Checkpoint 1) and the model fine-tuned on 1k ReasonFlux-PRM-7B selected data (Checkpoint 2), each evaluated under different reward signal sources.
| Policy Model (Qwen2.5-7B-Instruct) | Reward Signal Source | MATH500 |
| --- | --- | --- |
| Checkpoint 1: Original backbone model | Rule-based | 74.0 |
| Qwen2.5-Math-PRM-7B | 75.4 | |
| ReasonFlux-PRM-7B | 77.0 | |
| Checkpoint 2: SFT on 1k ReasonFlux-PRM-7B selected data | Rule-based | 84.8 |
| Qwen2.5-Math-PRM-7B | 87.6 | |
| ReasonFlux-PRM-7B | 89.8 | |
As supervised fine-tuning followed by reinforcement learning (SFT+RL) has become a dominant paradigm for aligning large language models with reasoning-intensive tasks, we are motivated to evaluate if ReasonFlux-PRM can serve as a general-purpose reward model to be effectively applied across both stages of training. Table 7 presents a comparative analysis on the Qwen2.5-7B-Instruct policy model, where we evaluate two checkpoints: (i) the original backbone model, and (ii) the same model after SFT on 1k ReasonFlux-PRM-7B selected data over the 59K raw data in s1 [13]. Both checkpoints are then further optimized with different reward signal sources during RL. The results demonstrate that ReasonFlux-PRM-7B consistently improves downstream performance at SFT and RL stages. We also observe that across all reward signal sources, fine-tuning on 1k ReasonFlux-PRM-7B selected data consistently improves performance over the original backbone model. Notably, the combination of ReasonFlux-PRM-7B based supervised fine-tuning and ReasonFlux-PRM-7B guided reinforcement learning yields the highest MATH500 accuracy of 89.8%, with a significant 12.8% accuracy improvement compared to the original backbone model (77.0%). These results highlight the end-to-end effectiveness of ReasonFlux-PRM as a general reward model for enhancing reasoning capabilities throughout the full training pipeline.
## Appendix E Case Study on ReasonFlux-PRM
In Case Studies 1 and 2 below, we present two responses to the same mathematical problem, one incorrect and one correct. For each response, we show the step-level and trajectory-level rewards assigned by ReasonFlux-PRM-7B. In the incorrect response, ReasonFlux-PRM-7B effectively identifies the point at which the reasoning begins to deviate by assigning significantly lower rewards to the subsequent steps. In contrast, the correct response receives consistently high rewards throughout the trajectory. Our study on the example suggests that ReasonFlux-PRM is not only capable of distinguishing between correct and incorrect solutions but also of pinpointing the precise step where an error in reasoning occurs.
## Appendix F Limitations and Broader Impacts
Limitations While ReasonFlux-PRM demonstrates robust improvements in reasoning quality across diverse mathematical and scientific benchmarks, one limitation lies in its reliance on high-quality trajectory–response pairs for training. Although ReasonFlux-PRM is designed to be general-purpose and adaptable, its current instantiation is tailored toward domains with well-structured logic (e.g., math and science), where reward signals based on alignment, quality, and coherence can be meaningfully computed. Applying ReasonFlux-PRM in more open-ended tasks such as commonsense dialogue or code generation may require redefining trajectory-level reward criteria and further tuning of the reward decomposition strategy. However, these domains fall outside the scope of this work and do not detract from the validity or strength of our conclusions in the reasoning-focused setting.
Broader Impact This paper introduces ReasonFlux-PRM, a trajectory-aware reward modeling framework that advances LLM reasoning by providing fine-grained supervision over both intermediate thinking steps and high-level solution strategies. This improves LLM alignment, interpretability, and efficiency in structured reasoning tasks such as math and science, while supporting both supervised fine-tuning and reinforcement learning. While our work has broad implications, we do not foresee significant negative impacts or societal concerns that warrant specific emphasis.
Case Study 1
Question: If $-6\leq a\leq-2$ and $3\leq b\leq 5$ , what is the greatest possible value of $\displaystyle\left(a+\frac{1}{b}\right)\left(\frac{1}{b}-a\right)$ ? Thinking Trajectories: The problem asks for the greatest possible value of the expression $\displaystyle\left(a+\frac{1}{b}\right)\left(\frac{1}{b}-a\right)$ given the ranges for $a$ and $b$ . [Step-level reward: 0.997] First, let’s expand the expression: $\displaystyle\left(a+\frac{1}{b}\right)\left(\frac{1}{b}-a\right)=a\left(\frac{1}{b}-a\right)+\frac{1}{b}\left(\frac{1}{b}-a\right)$ $=a\cdot\frac{1}{b}-a^{2}+\frac{1}{b}\cdot\frac{1}{b}-\frac{1}{b}\cdot a$ $=\frac{a}{b}-a^{2}+\frac{1}{b^{2}}-\frac{a}{b}$ $=-a^{2}+\frac{1}{b^{2}}$ [Step-level reward: 0.983] Now we need to find the maximum value of $-a^{2}+\frac{1}{b^{2}}$ given the constraints $-6\leq a\leq-2$ and $3\leq b\leq 5$ . [Step-level reward: 0.996] Consider the terms $-a^{2}$ and $\frac{1}{b^{2}}$ separately. Since $-6\leq a\leq-2$ , we have $0\leq(-a)^{2}\leq(-(-6))^{2}=36$ . Therefore, $-36\leq-a^{2}\leq-4$ . [Step-level reward: 0.503] Since $3\leq b\leq 5$ , we have $9\leq b^{2}\leq 25$ . Therefore, $\frac{1}{25}\leq\frac{1}{b^{2}}\leq\frac{1}{9}$ . [Step-level reward: 0.895] We want to maximize $-a^{2}+\frac{1}{b^{2}}$ . This is equivalent to minimizing $-a^{2}$ and maximizing $\frac{1}{b^{2}}$ . [Step-level reward: 0.297] (This is the place where the thinking trajectory went wrong, because in order to maximize $-a^{2}+\frac{1}{b^{2}}$ , $-a^{2}$ needs to be maximized, not minimized. ReasonFlux-PRM assigns low reward starting from this segment within the thinking trajectory, which indicates that ReasonFlux-PRM is able to identify errors in reasoning traces.) The minimum value of $-a^{2}$ is $-36$ . The maximum value of $\frac{1}{b^{2}}$ is $\frac{1}{9}$ . [Step-level reward: 0.238] (The step-level rewards drop significantly since the last wrong step.) So the greatest possible value of $-a^{2}+\frac{1}{b^{2}}$ is $-36+\frac{1}{9}$ . Let’s calculate this value: $-36+\frac{1}{9}=-\frac{36\times 9}{9}+\frac{1}{9}=-\frac{324}{9}+\frac{1}{9}=-\frac{324-1}{9}=-\frac{323}{9}$ [Step-level reward: 0.280] Final Response: Given the ranges $-6\leq a\leq-2$ and $3\leq b\leq 5$ . We want to find the greatest possible value of the expression $\displaystyle\left(a+\frac{1}{b}\right)\left(\frac{1}{b}-a\right)$ . [Step-level reward: 0.995] First, we expand the expression: $\left(a+\frac{1}{b}\right)\left(\frac{1}{b}-a\right)=a\left(\frac{1}{b}-a\right)+\frac{1}{b}\left(\frac{1}{b}-a\right)$ $=a\cdot\frac{1}{b}-a^{2}+\frac{1}{b}\cdot\frac{1}{b}-\frac{1}{b}\cdot a$ $=\frac{a}{b}-a^{2}+\frac{1}{b^{2}}-\frac{a}{b}$ $=-a^{2}+\frac{1}{b^{2}}$ [Step-level reward: 0.997] Now we need to find the maximum value of $-a^{2}+\frac{1}{b^{2}}$ given the constraints for $a$ and $b$ . Consider the term $-a^{2}$ . Since $-6\leq a\leq-2$ , the values of $a^{2}$ range from $(-6)^{2}=36$ to $(-2)^{2}=4$ . Therefore, the values of $-a^{2}$ range from $-36$ to $-4$ . [Step-level reward: 0.988] Consider the term $\frac{1}{b^{2}}$ . Since $3\leq b\leq 5$ , the values of $b^{2}$ range from $3^{2}=9$ to $5^{2}=25$ . Therefore, the values of $\frac{1}{b^{2}}$ range from $\frac{1}{25}$ to $\frac{1}{9}$ . [Step-level reward: 0.897] To maximize $-a^{2}+\frac{1}{b^{2}}$ , we need to maximize $\frac{1}{b^{2}}$ and minimize $-a^{2}$ . The maximum value of $\frac{1}{b^{2}}$ is $\frac{1}{9}$ , which occurs when $b=3$ . The minimum value of $-a^{2}$ is $-36$ , which occurs when $a=-6$ . [Step-level reward: 0.108] (The low score here aligns with the low score in the model thinking trajectories.) Thus, the greatest possible value of $-a^{2}+\frac{1}{b^{2}}$ is $-36+\frac{1}{9}$ . $-36+\frac{1}{9}=-\frac{36\times 9}{9}+\frac{1}{9}=-\frac{324}{9}+\frac{1}{9}=-\frac{324-1}{9}=-\frac{323}{9}$ Final Answer: The final answer is $\boxed{-\frac{323}{9}}$ [Step-level reward: 0.319] [Trajectory-level reward: 0.197] (As the final answer is incorrect, ReasonFlux-PRM assigns a low trajectory-level reward to the overall trajectory-response data.)
Case Study 2
Question: If $-6\leq a\leq-2$ and $3\leq b\leq 5$ , what is the greatest possible value of $\displaystyle\left(a+\frac{1}{b}\right)\left(\frac{1}{b}-a\right)$ ? Thinking Trajectories: The problem asks for the greatest possible value of the expression $\displaystyle\left(a+\frac{1}{b}\right)\left(\frac{1}{b}-a\right)$ given the ranges for $a$ and $b$ . [Step-level reward: 0.998] Let $E=\left(a+\frac{1}{b}\right)\left(\frac{1}{b}-a\right)$ . We can expand the expression: $E=a\left(\frac{1}{b}\right)+a\left(-a\right)+\frac{1}{b}\left(\frac{1}{b}\right)+\frac{1}{b}\left(-a\right)$ $E=\frac{a}{b}-a^{2}+\frac{1}{b^{2}}-\frac{a}{b}$ $E=-a^{2}+\frac{1}{b^{2}}$ [Step-level reward: 0.985] We need to find the maximum value of $E$ given the constraints $-6\leq a\leq-2$ and $3\leq b\leq 5$ . [Step-level reward: 0.998] Since $E=-a^{2}+\frac{1}{b^{2}}$ , we need to minimize $a^{2}$ and maximize $\frac{1}{b^{2}}$ . [Step-level reward: 0.974] For $a$ , the range is $-6\leq a\leq-2$ . The minimum value of $a^{2}$ occurs when $a$ is closest to 0. The values of $a$ are negative, so the minimum value of $a^{2}$ occurs when $a$ is the least negative, which is $-2$ . When $a=-2$ , $a^{2}=(-2)^{2}=4$ . [Step-level reward: 0.962] For $b$ , the range is $3\leq b\leq 5$ . The maximum value of $\frac{1}{b^{2}}$ occurs when $b$ is the smallest. When $b=3$ , $\frac{1}{b^{2}}=\frac{1}{3^{2}}=\frac{1}{9}$ . [Step-level reward: 0.985] So, the maximum value of $E$ occurs when $a^{2}$ is minimized and $\frac{1}{b^{2}}$ is maximized. Maximum $E=-a^{2}+\frac{1}{b^{2}}=-4+\frac{1}{9}$ . [Step-level reward: 0.818] To add these values, we need a common denominator: Maximum $E=-4+\frac{1}{9}=-\frac{4\times 9}{9}+\frac{1}{9}=-\frac{36}{9}+\frac{1}{9}=-\frac{36-1}{9}=-\frac{35}{9}$ . [Step-level reward: 0.815] Let’s double check the calculations. The expression is $\left(a+\frac{1}{b}\right)\left(\frac{1}{b}-a\right)$ . Expand the expression: $a\cdot\frac{1}{b}+a\cdot(-a)+\frac{1}{b}\cdot\frac{1}{b}+\frac{1}{b}\cdot(-a)$ $=\frac{a}{b}-a^{2}+\frac{1}{b^{2}}-\frac{a}{b}$ $=-a^{2}+\frac{1}{b^{2}}$ [Step-level reward: 0.980] We want to maximize $-a^{2}+\frac{1}{b^{2}}$ . Since $a^{2}\geq 0$ , $-a^{2}\leq 0$ . Since $b^{2}>0$ , $\frac{1}{b^{2}}>0$ . The maximum value of $\frac{1}{b^{2}}$ is $\frac{1}{3^{2}}=\frac{1}{9}$ , which occurs when $b=3$ . We need to find the minimum value of $a^{2}$ in the range $[-6,-2]$ . The minimum value of $a^{2}$ occurs at the boundary of the interval, which is $a=-2$ . When $a=-2$ , $a^{2}=(-2)^{2}=4$ . [Step-level reward: 0.927] We need to maximize $\frac{1}{b^{2}}$ in the range $[3,5]$ . The maximum value of $\frac{1}{b^{2}}$ occurs at the boundary of the interval, which is $b=3$ . When $b=3$ , $\frac{1}{b^{2}}=\frac{1}{3^{2}}=\frac{1}{9}$ . [Step-level reward: 0.989] So the maximum value of the expression is $-a^{2}+\frac{1}{b^{2}}=-4+\frac{1}{9}=-\frac{36}{9}+\frac{1}{9}=-\frac{35}{9}$ . Final Response: Given the ranges for $a$ and $b$ : $-6\leq a\leq-2$ $3\leq b\leq 5$ [Step-level reward: 0.958] We want to find the greatest possible value of the expression $\displaystyle\left(a+\frac{1}{b}\right)\left(\frac{1}{b}-a\right)$ . [Step-level reward: 0.999] First, we expand the expression: $\left(a+\frac{1}{b}\right)\left(\frac{1}{b}-a\right)=a\left(\frac{1}{b}\right)+a\left(-a\right)+\frac{1}{b}\left(\frac{1}{b}\right)+\frac{1}{b}\left(-a\right)$ $=\frac{a}{b}-a^{2}+\frac{1}{b^{2}}-\frac{a}{b}$ $=-a^{2}+\frac{1}{b^{2}}$ [Step-level reward: 0.998] To find the greatest possible value of this expression, we need to minimize $a^{2}$ and maximize $\frac{1}{b^{2}}$ . [Step-level reward: 0.987] For the term $-a^{2}$ , we want to minimize $a^{2}$ . Since $a^{2}\geq 0$ for all real numbers $a$ , the minimum value of $a^{2}$ occurs when $a=0$ . However, the given range for $a$ is $[-6,-2]$ , so $a=0$ is not within the range. The minimum value of $a^{2}$ in the given range occurs at the boundary of the interval, which is $a=-2$ . When $a=-2$ , $a^{2}=(-2)^{2}=4$ . [Step-level reward: 0.967] For the term $\frac{1}{b^{2}}$ , we want to maximize $\frac{1}{b^{2}}$ . Since $b^{2}>0$ for all real numbers $b\neq 0$ , the maximum value of $\frac{1}{b^{2}}$ occurs when $b^{2}$ is the smallest. The smallest value of $b^{2}$ in the given range occurs when $b$ is the largest in absolute value within the interval $[3,5]$ , which is $b=3$ . When $b=3$ , $b^{2}=3^{2}=9$ , and $\frac{1}{b^{2}}=\frac{1}{9}$ . [Step-level reward: 0.667] Now, we substitute the minimum value of $a^{2}$ and the maximum value of $\frac{1}{b^{2}}$ into the expanded expression: $-a^{2}+\frac{1}{b^{2}}=-4+\frac{1}{9}$ To combine these terms, we find a common denominator: $-4+\frac{1}{9}=-\frac{4\times 9}{9}+\frac{1}{9}=-\frac{36}{9}+\frac{1}{9}=-\frac{36-1}{9}=-\frac{35}{9}$ [Step-level reward: 0.993] Thus, the greatest possible value of the given expression is $-\frac{35}{9}$ . [Step-level reward: 0.988] Final Answer: The final answer is $\boxed{-\frac{35}{9}}$ [Step-level reward: 0.999] [Trajectory-level reward: 0.949] (As the final answer is correct, ReasonFlux-PRM assigns a high trajectory-level reward to the overall trajectory-response data.)