# \sysName: Guiding the Creation of Multi-agent Workflows with Design Space Visualization as a Thinking Scaffold
**Authors**: \authororcidPan Hao0009-0006-4473-, \authororcidDongyeop Kang0000-0002-9021-, Nicholas Hinds, and\authororcidQianwen Wang0000-0002-1825-
\onlineid
1729 \vgtccategory Research \vgtcpapertype Applications \authorfooter Pan Hao, Dongyeop Kang, Nicholas Hinds, and Qianwen Wang are with the University of Minnesota, Twin Cities, MN, USA. E-mail: {pan00342, dongyeop, hinds084, qianwen}@umn.edu
Abstract
Multi-agent workflows have become an effective strategy for tackling complicated tasks by decomposing them into multiple sub-tasks and assigning them to specialized agents. However, designing optimal workflows remains challenging due to the vast and intricate design space. Current practices rely heavily on the intuition and expertise of practitioners, often resulting in design fixation or an unstructured, time-consuming exploration of trial-and-error. To address these challenges, this work introduces \sysName, an interactive visualization tool to facilitate the creation of multi-agent workflow through i) a structured visual exploration of the design space and ii) in-situ guidance informed by established design patterns. Based on formative studies and literature review, \sysName organizes the workflow design process into three hierarchical levels (\ie, task planning, agent assignment, and agent optimization), ranging from abstract to concrete. This structured visual exploration enables users to seamlessly move from high-level planning to detailed design decisions and implementations, while comparing alternative solutions across multiple performance metrics. Additionally, drawing from established workflow design patterns, \sysName provides context-aware, in-situ suggestions at each level as users navigate the design space, enhancing the workflow creation process with practical guidance. Use cases and user studies demonstrate the usability and effectiveness of \sysName, while also yielding valuable insights into how practitioners explore design spaces and leverage guidance during workflow development.
keywords: LLM workflows, Multi-agent Workflows, design space, hierarchical visualization
\teaser
<details>
<summary>x1.png Details</summary>
### Visual Description
## Diagram: Workflows for Generating a Data-driven Visual Storytelling
### Overview
This diagram illustrates workflows for generating data-driven visual storytelling, encompassing design space overview, topic selection, and workflow execution. It depicts a system involving agents, LLM calls, and different workflow structures (sequential, parallel, reflection). The diagram is segmented into four main areas: A1 (Design Space Overview), A2 (Axis Definitions), B1-B3 (Topic Selection & Workflow), and C1-C3 (Workflow Structures & Tool Use).
### Components/Axes
* **A1: Design Space Overview:** Shows four flows (Flow 1, Flow 2, Flow 3, Flow 4) with varying numbers of subtasks and agents.
* **A2: Axis Definitions:** Defines the X-axis as "# subtask" and the Y-axis as "# agents". Includes a "D" label (likely representing data) and "RF" label (likely representing refinement).
* **B1: Topic Selector:** A box labeled "Topic Selector" with the description "proposes candidate story topics based on the given dataset". It branches into "Visualize Distribution" and "Visualize Correlation".
* **B2: Lead with Curiosity:** A box detailing the task description: "propose candidate story topics based on the given dataset". It shows agent roles: "Persona Scientist", "Persona Journalist", "Aggregation", "Selector". It also indicates "2 + 1 = 3 LLM calls".
* **B3: Subtask Visualization:** A series of bars representing "# subtask" with associated agent counts.
* **C1: Workflow Structures:** Illustrates "Sequential", "Parallel", and "Reflection" workflows.
* **C2: Workflow Details:** Shows the number of LLM calls for each workflow type (1 LLM call for Visualize Distribution and Correlation, 2 LLM calls for Insight Integration). Includes "Redundant" and "Supervision" elements.
* **C3: Tool Use:** Lists "Prompting" and "Data Retrieval" as tools.
### Detailed Analysis or Content Details
**A1: Design Space Overview**
* **Flow 1:** 2 subtasks, 1-2 agents. The visualization shows two distinct configurations: 2-1a and 2-1b.
* **Flow 2:** 2 subtasks, 2-2 agents.
* **Flow 3:** 3 subtasks, 3-1, 3-2, 3-2a, 3-2b, 3-2c agents.
* **Flow 4:** 4 subtasks, 4-1, 4-2 agents.
**A2: Axis Definitions**
* X-axis: "# subtask" - Scale is not explicitly defined, but ranges from 1 to 4.
* Y-axis: "# agents" - Scale is not explicitly defined, but ranges from 1 to 2.
**B2: Lead with Curiosity**
* Agent Roles:
* Persona Scientist: "more logical and scientific"
* Persona Journalist: "more emotion-evoking and engaging"
* Aggregation
* Selector: "Select a topic from two agents"
* LLM Calls: 2 + 1 = 3 LLM calls
**C2: Workflow Details**
* Visualize Distribution: Single Agent, 1 LLM call.
* Visualize Correlation: Single Agent, 1 LLM call.
* Insight Integration: 2 LLM calls.
* Redundant: A workflow involving multiple steps and feedback loops.
* Supervision: A workflow involving human oversight.
### Key Observations
* The diagram emphasizes the iterative nature of data storytelling, with workflows incorporating reflection and redundancy.
* The "Lead with Curiosity" section highlights the use of different personas to generate diverse story topics.
* The design space overview (A1) suggests a trade-off between the number of subtasks and the number of agents involved.
* The workflow structures (C1) demonstrate different approaches to processing information, ranging from sequential to parallel and reflective.
### Interpretation
The diagram presents a framework for automating the generation of data-driven visual stories. It suggests a system where a "Topic Selector" agent leverages LLMs to propose story ideas based on a given dataset. These ideas are then refined through workflows that can be structured sequentially, in parallel, or reflectively. The inclusion of "Redundant" and "Supervision" elements indicates a focus on ensuring the quality and accuracy of the generated stories. The design space overview (A1) implies that the optimal workflow configuration depends on the complexity of the task (number of subtasks) and the resources available (number of agents). The use of different personas ("Scientist" and "Journalist") suggests an attempt to balance analytical rigor with narrative appeal. The diagram highlights the potential of AI to assist in the creative process of data storytelling, while also acknowledging the importance of human oversight and refinement. The diagram is a high-level conceptual model, and lacks specific data or quantitative metrics beyond the number of LLM calls and the agent/subtask counts.
</details>
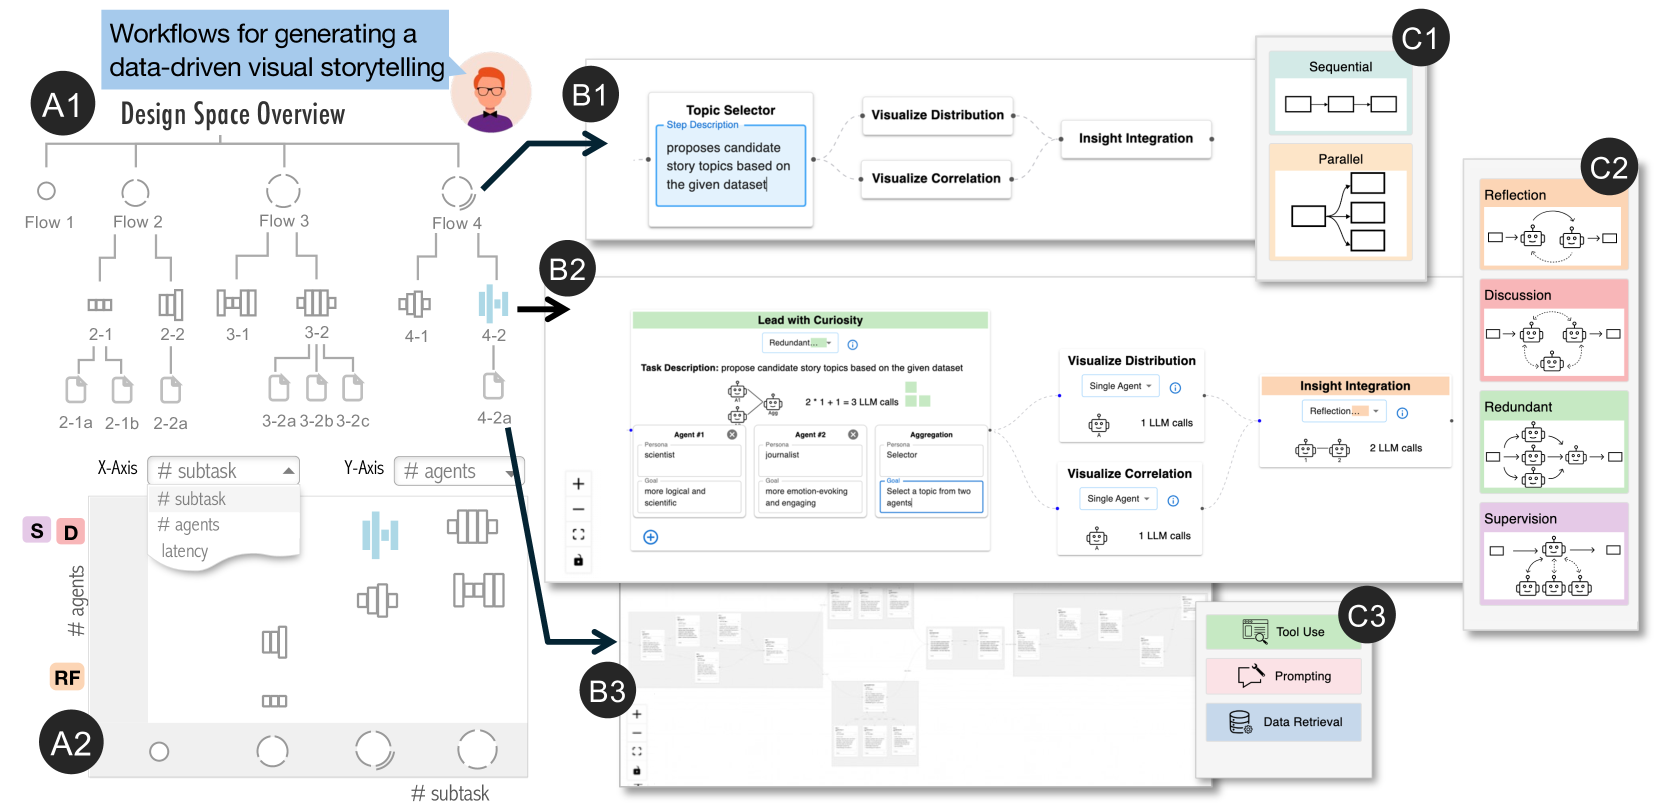
\sysName facilitates the creation of multi-agent workflows through structured, guided visual exploration of the design space. This is achieved by coordinating a hierarchical tree view (A1) and a scatter plot (A2), both of which use a novel glyph design to represent each workflow’s computational cost and level of abstraction. Users can select a workflow for detailed inspection in the Canvas View (B1-B3), which supports semantic zooming that reveals more abstract representations greater detail within more abstract representations depending on the zoom level. Additionally, in-situ suggestions based on well-established design patterns are provided to guide users as they navigate the design space (C1-C3).
Introduction
Recently, multi-agent workflows have emerged as a promising solution for complex tasks by decomposing them into subtasks, each handled by specialized LLM agents that collaboratively reason and execute tasks [5, 4]. These multi-agent workflows have demonstrated remarkable capabilities across various applications, such as software development, societal simulation, and even scientific discovery [19, 38]. Notably, Google’s AI co-scientist [17], a multi-agent LLM workflow system for scientific discovery, successfully uncovered a novel gene transfer mechanism, reproducing unpublished experimental findings [39].
However, designing effective multi-agent workflows remains a considerable challenge due to the vast design space. AI researchers and practitioners must balance critical trade-offs between performance, latency, and computational cost [18, 57]. Despite recent advancements in automatic task decomposition and agent collaboration (e.g., Manus AI [13]), the over-reliance on LLMs for workflow generation not only compromises transparency and controllability but also often results in suboptimal solutions [9]. Rather than relying on fully automated methods, AI researchers and practitioners typically draw on their own intuition and domain expertise, leveraging well-established human problem-solving strategies [57, 18].
Current studies predominantly focus on implementation support, helping users (\ie, AI researchers and practitioners) translate existing workflow ideas into executable systems, but offer limited assistance for the exploratory design processes [52, 24]. However, people’s problem-solving approaches are heavily influenced by the available tools, which makes certain actions more accessible while rendering others difficult or impractical [20]. In the context of multi-agent workflows, the affordances of existing tools have similarly shaped common practices in ways that discourage broad exploration. Users often begin with a rough idea of the workflow and move directly to implementation, a process that tends to bypass divergent thinking and leads to several limitations: First, early commitment to a specific workflow structure can restrict exploration of alternative solutions that might perform better within the broader design space. This contradicts the widely accepted divergence-before-convergence principle [8], leading to fixation on suboptimal designs. Second, by starting with complete implementations, users skip over abstraction layers in the design space. When performance issues arise, they tend to make superficial adjustments (e.g., tweaking agent prompts) rather than revisiting fundamental design decisions (e.g., task decomposition strategies) where greater improvements could be made.
Recent studies attempted to address this gap by introducing design patterns specifically tailored to multi-agent workflows. Design patterns represent reusable, adaptable solutions proven effective across various contexts. For example, Liu et al.. [57] identified 18 agent design patterns (e.g., self-reflection, voting) through an extensive review of 57 multi-agent studies. Grunde-McLaughlin et al.. [18] summarized five architecture workflow building blocks (\ie, sequential, branching, redundant, dynamic, communicative) by borrowing lessons about task decomposition and validation from crowdsourcing. Even though these studies provide valuable guidance, these patterns remain disconnected from practical tools and environments, requiring AI researchers and practitioners to actively seek out, efficiently learn, and manually apply them during the design process.
To address these challenges, we propose \sysName, an interactive visualization tool to facilitate AI researchers and practitioners in creating effective multi-agent workflows ( \sysName: Guiding the Creation of Multi-agent Workflows with Design Space Visualization as a Thinking Scaffold). \sysName not only provides an intuitive visual interface for building workflows, but, more importantly, actively scaffolds users’ design thinking by explicitly visualizing the design space and providing in-situ design guidance. Based on formative studies and literature review, \sysName organizes the workflow design process into three levels (\ie, task planning, agent assignment, and agent optimization), progressing from abstract concepts to concrete implementation. A structured visual exploration of the design space is enabled through the coordination of a hierarchical tree view and a scatter plot. Within this coordinated visualization, we introduce a novel glyph design that encodes both the abstraction level and computational cost of each solution. Users can select any solution for closer inspection in the Canvas View, where it is visualized as a node-link diagram with semantic zooming to reveal increasing detail as users zoom in. Additionally, drawing from established workflow design patterns, \sysName provides contextually relevant in-situ suggestions at each level as users navigate the design space, illustrating current practice to the workflow creation process. Evaluations showed that \sysName enabled users to create workflows more efficiently, explore a wider range of design alternatives, and produce higher-quality outputs compared to the baseline system.
Main contributions of this paper include:
- A structured characterization and visualization of the design space for multi-agent workflows, augmented with in-situ suggestions of relevant design patterns.
- \sysName
, an interactive visualization tool that guides users in designing and creating multi-agent workflows.
- Case studies and user studies demonstrating the effectiveness and usability of the proposed approach, along with insights into how users leverage guidance to explore and refine workflow designs.
1 Related Work
1.1 Creating Multi-agent Workflows
Existing research on multi-agent workflow creation can be categorized into three main areas: workflow authoring frameworks, empirical design guidelines, and automated generation methods.
Workflow authoring frameworks provide programming libraries or visualization tools for simplifying multi-agent workflow creation. Programming frameworks, such as LangGraph [24] and AutoGen [52], offer APIs that allow users to efficiently define agent roles and manage inter-agent communication. To make workflow creation more accessible to non-programmers, no-code platforms, such as Rivet [3], Vellum [1], and AutoGen Studio [11], offer visual interfaces for designing and testing complex workflows. Users can define agents as compact cards and construct workflows using a drag-and-drop interface. Additionally, interactive tools, like AI Chains and Prompt Chainer [53], streamline the process of chaining prompts via interactive visualizations. However, these studies primarily assist in implementing workflows that users have already conceptualized and still heavily rely on user expertise for workflow design (e.g., task planning and orchestrating communication among agents).
To mitigate the complexity in designing workflows, recent studies have derived design patterns and guidelines from systematic investigation of existing workflow implementations [57, 18, 19, 62]. For example, Liu et al. [57] identified 18 design patterns (e.g., self-reflection, voting, Role-based cooperation) across various scenarios. Grunde-McLaughlin et al. [18] summarized and tested five workflow building blocks (\ie, sequential, branching, redundant, dynamic, communicative) by drawing inspiration from crowdsourcing methodologies and study designs. Meanwhile, industry guidelines from major technology companies have increasingly emerged, outlining common practices used in the community, such as group chat, debate, and reflection [33, 32, 5].
Automated methods offer another research direction, focusing on reducing user workload by automatically generating optimized workflow designs. One prevalent approach involves introducing a “supervisor” agent that decomposes tasks and orchestrates agent collaboration. For instance, ADAS [22] employs a meta-agent to generate and refine reusable code snippets, assembling them into complete workflows. Another approach models the search for suitable workflows as an optimization problem that can be solved computationally [63, 59, 62]. For example, GPTSwarm [63] formulates multi-agent workflow construction as an optimization over computational graphs, with agents as nodes and communication channels as edges. While these methods simplify the task orchestration, they often sacrifice transparency, reliability, and controllability, which are crucial in critical or high-stakes scenarios.
As a result, existing studies tend to fall into two extremes, either fully relying on a user’s own knowledge or entirely automating the workflow creation. Our proposed method aims to strike a balance by embedding design space exploration and empirical design guidance directly into the workflow-building environment.
1.2 Visualizing Design Space
A design space encompasses the conceptual realm of possible solutions for a given problem and serves as a fundamental framework for structured exploration in various design processes, including machine learning architecture design [49, 56], creative writing [43], and image generation [7, 15]. Effective visualization of design spaces helps users navigate and interpret the numerous solutions by clearly representing their dimensions and abstraction levels.
Dimensions represent key parameters that define and distinguish various possible solutions within a design space, and can be used to effectively categorize different design choices. For example, Luminate [43] visualizes the design space of creative writing via dimensions such as genres, personality, story tone. Similarly, PromptMagician [15] and Promptify [7] structure the design space of text-to-image generation by incorporating object- and style-related dimensions. Various visualization techniques, including scatter plots [43, 7], tree diagrams [44, 50], and parallel coordinates [56], have been employed to represent these dimensions and organize various solutions.
Levels of abstraction further facilitate design space navigation by hierarchically structuring solutions from high-level concepts to fine-grained specifics. Different visualization techniques are often employed to effectively represent each abstraction layer. For example, ATMSeer [49] visualizes the design space of machine learning models through three hierarchical levels (\ie, algorithm type, hyper-partition, and hyper-parameter) using histogram, bar chart, and scatter plot, respectively. Meanwhile, studies have used focus + context technique to allow users to view both an abstract overview and detailed information simultaneously [56, 50]. DNN Genealogy [50] dynamically displaying solutions as either text labels or glyphs based on the calculated degree of interest. Semantic zooming is another technique for navigating hierarchical design spaces, dynamically adapting visual representations based on zoom level. For example, when visualizing the design space of LLM prompts, abstract level (zoomed out) represents solutions as simple points, whereas detailed level(zoomed in) reveals full text outputs or generated images [43, 15, 7].
Our work builds upon these prior visualization methods, uniquely adapting them to scaffold user cognition and provide in-situ support during multi-agent workflow design.
2 Designing \sysName
2.1 Understanding Design Challenges
To identify the current challenges in designing multi-agent workflows, we conducted a formative study involving four AI researchers (E1-E4) with extensive experience in multi-agent systems. These participants represent our target user base of AI researchers and practitioners who design, development, and evaluate multi-agent workflows for solving complex tasks. Participants were recruited through personal networks and snowball sampling. All participants had led at least one major project about multi-agent LLM systems. One expert is the author of this paper while others are not. Each session consisted of a 45-60 minute semi-structured interview conducted over Zoom. Participants were asked to talk about their current practice in multi-agent workflows. They also reflected on the difficulties in constructing multi-agent workflows, and the limitations of the current tools. With consent from the participants, the interviews were recorded, transcribed, and thematically analyzed. We identified four key challenges:
1. Vast Design Space. All participants emphasized designing a multi-agent workflow involves navigating a vast and complex design space. Designers must make decisions across several dimensions: how to decompose a task, whether a task should be handled by a single agent or multiple agents, how agents should communicate, and how to configure individual agent behavior. Despite their experience, participants relied heavily on intuition, past examples, and human problem-solving analogies. For complex tasks, they noted that relying on “supervisor” agents for orchestration was often insufficient, and human oversight remained critical. The vast size and high complexity of design space made exploration difficult without structured support.
1. Unstructured Trial-and-error Exploration. Workflow design often follows an ad hoc trial-and-error process. Participants described iterating on ideas after failures, often tweaking small elements (e.g., prompts), mid-level elements (e.g., conversation rounds), or larger architectural components (e.g., switching from hierarchical to sequential designs). However, without a structured framework, this process was time-consuming, frustrating, and frequently unguided.
1. Design Fixation. Practitioners reported that they often begin by implementing a single workflow first and then iterating to refine it. Due to the complexity of implementing and fine-tuning a workflow, practitioners are often hesitant to explore alternatives. Most of their exploration were reactive in response to failures, rather than proactively seeking better designs. Once a runnable version of the workflow is achieved, further modifications were usually incremental, leading to premature convergence and missed opportunities for better-performing designs.
1. Navigating Trade-offs between Performance Metrics. Navigating multi-agent workflows often requires balancing conflicting priorities, such as computational cost, response latency, creativity, and accuracy. These trade-offs are subjective and context-dependent, such as generating fast forward videos for research papers (E1) and writing politics essays (E2), involving multiple design considerations. For example, E3 commented that “latency was the biggest concern” in one previous project, driving all design decisions. At the same time, it is challenging to account for different metrics simultaneously during the design phase. Some considerations (e.g., practical costs) often become apparent only after implementation, at which point practitioners may be reluctant to make major changes.
<details>
<summary>x2.png Details</summary>
### Visual Description
\n
## Diagram: Multi-Stage Agent System Workflow
### Overview
The image depicts a diagram illustrating a three-stage workflow for an agent system: Task Planning, Agent Assignment, and Agent Optimization. Each stage is represented by a shaded area with associated icons and flow arrows indicating the process. The diagram highlights the progression of tasks from initial planning to agent allocation and subsequent optimization.
### Components/Axes
The diagram is divided into three main sections, labeled from top to bottom:
1. **Task Planning:** Represented by a light gray area with several unfilled circles.
2. **Agent Assignment:** Represented by a medium gray area with several unfilled circles and a single orange-filled circle.
3. **Agent Optimization:** Represented by a dark gray area with several unfilled circles and a dashed orange circle highlighting a subset of agents.
Arrows connect the stages, indicating the flow of tasks and agents. Within each stage, there are smaller rectangular boxes containing icons representing specific steps or components.
### Detailed Analysis or Content Details
**Task Planning:**
- Contains approximately 10 unfilled circles, representing tasks.
- An arrow originates from a circle in this section and connects to the Agent Assignment stage.
- A smaller diagram to the right of this section shows a process flow:
- "step 1" is represented by a rectangle.
- "step 2a" and "step 2b" are represented by rectangles branching from "step 1".
- "step 3" is represented by a rectangle branching from "step 2a".
**Agent Assignment:**
- Contains approximately 15 unfilled circles and one orange-filled circle, representing agents.
- An arrow originates from the Task Planning stage and connects to a human icon, then to the Agent Assignment stage.
- A smaller diagram to the right of this section shows a series of four agent icons:
- Each agent icon has a smiling face.
- The icons are arranged in a 2x2 grid.
- Arrows connect the icons, suggesting interaction or communication.
**Agent Optimization:**
- Contains approximately 20 unfilled circles and a dashed orange circle encompassing a subset of agents.
- An arrow originates from the Agent Assignment stage and connects to a human icon, then to the Agent Optimization stage.
- A smaller diagram to the right of this section shows a series of four agent icons:
- Each agent icon has a wrench and a database symbol.
- The icons are arranged in a 2x2 grid.
- Arrows connect the icons, suggesting interaction or communication.
### Key Observations
- The orange-filled circle in the Agent Assignment stage and the dashed orange circle in the Agent Optimization stage highlight specific agents or a subset of agents undergoing focused attention.
- The flow arrows indicate a sequential process: tasks are planned, agents are assigned, and then agents are optimized.
- The smaller diagrams within each stage provide a more detailed view of the processes occurring within that stage.
- The icons used are consistent within each stage, suggesting a standardized workflow.
### Interpretation
The diagram illustrates a system for managing agents to perform tasks. The three stages represent a logical progression: first, tasks are planned; second, agents are assigned to those tasks; and third, the performance of those agents is optimized. The use of icons suggests that each stage involves specific tools or processes. The highlighting of certain agents suggests that the system may prioritize or focus on specific agents based on their performance or the complexity of the tasks they are assigned. The diagram implies a closed-loop system where optimization feedback informs future task planning and agent assignment. The human icons suggest human oversight or intervention at key points in the process. The diagram is a high-level overview and does not provide specific details about the algorithms or techniques used in each stage. It is a conceptual representation of a workflow rather than a detailed technical specification.
</details>
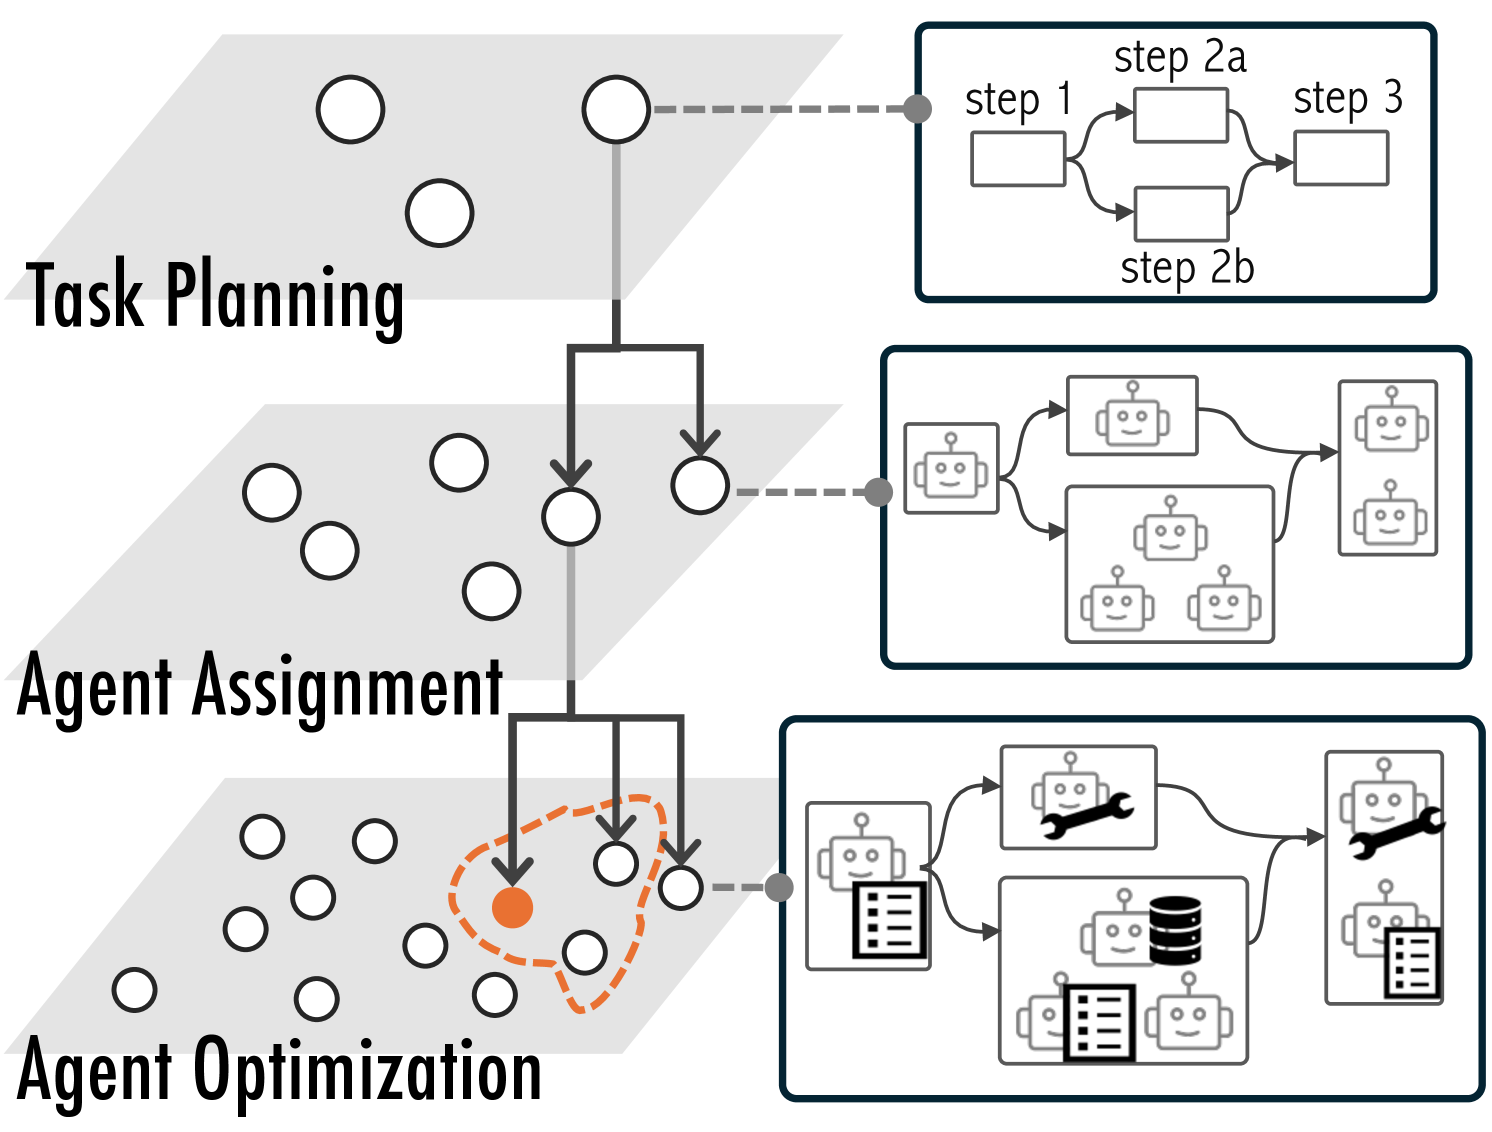
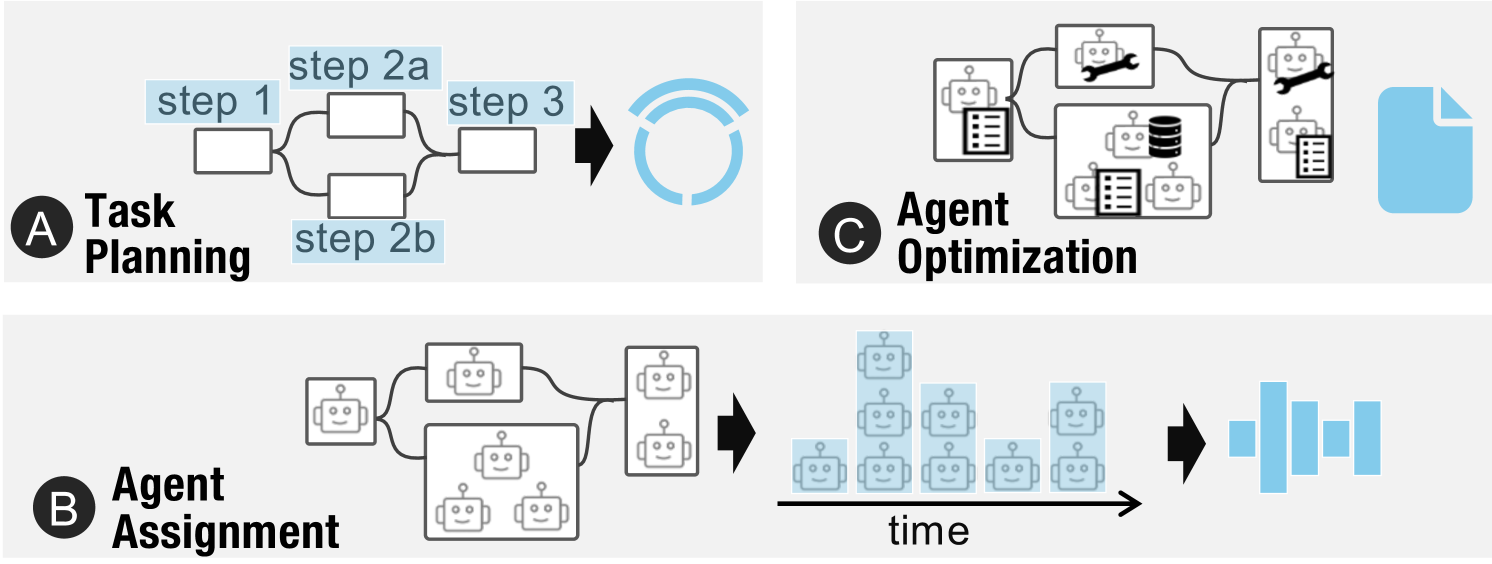
Figure 1: The design space of multi-agent workflows can be conceptualized across three hierarchical levels. Current frameworks primarily operate at the most granular level, which often leads to design fixation (the orange dot) rather than encourage exploration of the full solution space.
Table 1: Design Patterns for Multi-Agent Workflows supported in \sysName.
{tabu}
p0.05cm| p2.4cmp5.2cmp6.0cm p1.9cm
Pattern Definition Example References
Level-1 Sequential
<details>
<summary>x3.png Details</summary>
### Visual Description
\n
## Diagram: Simple Sequential Process
### Overview
The image depicts a simple, linear diagram illustrating a sequential process. It consists of three rectangular boxes connected by arrows, indicating a flow from left to right. There are no labels or data points present within the diagram.
### Components/Axes
The diagram consists of:
* **Three Rectangular Boxes:** These represent stages or steps in a process.
* **Two Arrows:** These indicate the direction of flow between the boxes, moving from left to right.
* **No Axis:** There are no axes present in this diagram.
* **No Legend:** There is no legend.
### Detailed Analysis or Content Details
The diagram shows a process with three distinct stages. The first stage is on the left, the second in the center, and the third on the right. The arrows clearly indicate a sequential flow, suggesting that the process moves linearly from the first stage to the second, and then from the second to the third. There is no quantitative data or specific information about the content of each stage.
### Key Observations
The diagram is extremely simple and lacks any specific details. It only conveys the concept of a sequential process with three steps. The absence of labels or data makes it impossible to determine the nature of the process or the activities performed in each stage.
### Interpretation
The diagram represents a basic workflow or process. It suggests a linear progression through three stages. Without further context, it's impossible to determine the specific meaning or application of this process. It could represent anything from a simple task list to a complex manufacturing process. The diagram's simplicity suggests it's intended to convey a high-level overview rather than detailed information. The diagram is a visual metaphor for a sequence of events. It is a very abstract representation and requires additional information to be meaningful.
</details>
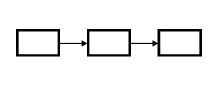
The task can be decomposed into a sequence of steps, which are executed sequentially and completed in an orderly progression. Debugging visualizations via first interpreting code, identifying issues, and then writing code [54]. [54] [5] [2] [55] [41]
Parallel
<details>
<summary>x4.png Details</summary>
### Visual Description
\n
## Diagram: Simple Flowchart
### Overview
The image depicts a simple flowchart illustrating a one-to-many relationship. A single rectangular box on the left is connected by dashed arrows to three rectangular boxes arranged vertically on the right. The diagram lacks any labels or numerical data.
### Components/Axes
The diagram consists of four rectangular boxes and three dashed arrows. There are no axes, legends, or scales present.
### Detailed Analysis or Content Details
* **Box 1 (Left):** A single rectangular box positioned on the left side of the image.
* **Boxes 2-4 (Right):** Three rectangular boxes arranged vertically, aligned to the right of the first box.
* **Arrows:** Three dashed arrows originate from the left box and point towards each of the three boxes on the right. The arrows are roughly parallel and spaced vertically. The arrows are dashed, indicating a potentially less direct or less frequent relationship.
### Key Observations
The diagram illustrates a divergence or branching process. A single input or process leads to multiple outputs or outcomes. The dashed lines suggest a non-deterministic or probabilistic relationship.
### Interpretation
This diagram represents a simple one-to-many relationship. It could represent a variety of processes, such as:
* A single input generating multiple outputs.
* A single decision leading to multiple possible paths.
* A single source distributing information to multiple destinations.
Without further context or labels, the specific meaning of the diagram remains ambiguous. The dashed lines suggest that the relationship between the initial box and the subsequent boxes is not necessarily direct or guaranteed. It could represent a probabilistic or conditional relationship. The diagram is a very basic representation of a branching process and lacks any quantitative information.
</details>
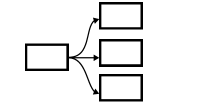
The task can be divided into multiple subtasks that can be parallelized for potential speedup. When generating a travel plan, ideating various vacation activities simultaneously [53]. [54] [5] [40] [55] [41]
Level-2 Reflection
<details>
<summary>x5.png Details</summary>
### Visual Description
\n
## Diagram: Iterative Process with Robots
### Overview
The image depicts a diagram illustrating an iterative process involving two robotic entities. Input enters the first robot, which processes it and passes it to the second robot. The second robot outputs a result, and there is feedback between the two robots, suggesting a loop or iterative refinement.
### Components/Axes
The diagram consists of the following components:
* **Input:** A square on the left side, representing the initial input.
* **Robot 1:** A robotic figure with a smiling face and a circular head. It has an input arrow pointing towards it and an output arrow pointing to Robot 2.
* **Robot 2:** A robotic figure identical to Robot 1, receiving input from Robot 1 and producing an output.
* **Output:** A square on the right side, representing the final output.
* **Feedback Loop (Solid Arrow):** A curved arrow originating from the output of Robot 2 and pointing back to Robot 1.
* **Feedback Loop (Dotted Arrow):** A curved dotted arrow originating from the output of Robot 2 and pointing back to Robot 1.
### Detailed Analysis or Content Details
The diagram shows a sequential process:
1. An unspecified input enters Robot 1.
2. Robot 1 processes the input and passes it to Robot 2.
3. Robot 2 processes the input from Robot 1 and generates an output.
4. The output of Robot 2 is fed back to Robot 1 via a solid curved arrow.
5. The output of Robot 2 is also fed back to Robot 1 via a dotted curved arrow.
The presence of both a solid and dotted feedback loop suggests different types of feedback or levels of influence. The dotted line may represent a weaker or less direct feedback mechanism.
### Key Observations
The diagram emphasizes an iterative process where the output is continuously refined through feedback. The use of robots suggests automation or a system where the process is carried out by machines. The two robots could represent different stages or aspects of the process.
### Interpretation
This diagram likely represents a machine learning or control system. Robot 1 could be a feature extractor, and Robot 2 could be a classifier. The feedback loop represents the error signal used to adjust the parameters of the system. The solid line could represent the primary feedback signal, while the dotted line could represent a secondary or less important feedback signal. The iterative nature of the process suggests that the system is learning or adapting over time. The diagram highlights the importance of feedback in achieving desired outcomes in automated systems. The simplicity of the diagram suggests a high-level conceptual overview rather than a detailed technical specification.
</details>
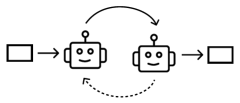
One agent generates and refines a response while another evaluates it, repeating the process until a predefined criterion (quality or number of iterations) is met. Often used to improve accuracy. One agent generates code, which a reviewer then assesses for quality and returns feedback for adjustment [52]. [5] [42] [33] [57] [42] [63] [22] [46] [60]
Redundant
<details>
<summary>x6.png Details</summary>
### Visual Description
\n
## Diagram: Circular Robotic Process Flow
### Overview
The image depicts a diagram illustrating a circular process flow involving robotic units. The diagram shows four robotic units arranged in a roughly square configuration, with input and output elements connected to the process. Arrows indicate the direction of flow between the units and the input/output.
### Components/Axes
The diagram consists of the following components:
* **Robotic Units:** Four identical robotic units, each represented as a square with a smiling face and a circular connector on top.
* **Input:** A square shape on the left side of the diagram, representing the input to the process.
* **Output:** A square shape on the right side of the diagram, representing the output of the process.
* **Arrows:** Curved arrows indicating the flow of the process between the input, robotic units, and output.
### Detailed Analysis or Content Details
The process flow can be described as follows:
1. Input enters the process and is directed to the top-center robotic unit.
2. The top-center unit passes the process to the right-center unit.
3. The right-center unit passes the process to the bottom-right unit, which outputs the result.
4. The bottom-right unit sends the process to the bottom-left unit.
5. The bottom-left unit sends the process to the top-left unit.
6. The top-left unit sends the process back to the top-center unit, completing the cycle.
There are no numerical values or scales present in the diagram. The diagram is purely illustrative of a process flow.
### Key Observations
The diagram highlights a closed-loop process where the output of one robotic unit becomes the input for another, creating a continuous cycle. The input and output are distinct from the robotic units, suggesting they serve as entry and exit points for the process.
### Interpretation
The diagram likely represents an automated process or workflow where robotic units perform a series of tasks in a cyclical manner. The continuous loop suggests a self-sustaining or iterative process. The input and output elements indicate that the process transforms data or materials from an initial state to a final state. The smiling faces on the robots could indicate a positive or efficient process. The diagram does not provide information about the specific tasks performed by the robots or the nature of the input and output. It is a high-level representation of a process flow, focusing on the relationships between the components rather than the details of the process itself. The diagram could be used to illustrate concepts such as automation, continuous improvement, or feedback loops.
</details>
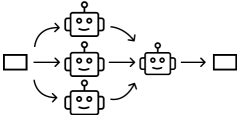
Multiple agents simultaneously respond to the same input while adopting different personas or perspectives, generating diverse outputs. Often used to improve robustness or creativity. Four agents in roles of physics, chemistry, biology, and general science experts attempt to solve graduate-level questions in science individually, then their answers are aggregated [22]. [27] [5] [18] [36] [22]
Supervision
<details>
<summary>x7.png Details</summary>
### Visual Description
\n
## Diagram: Robotic Process Flow
### Overview
The image depicts a diagram illustrating a process flow involving robotic entities. A single input is processed by a central robot, which then distributes the output to three subordinate robots. There are also feedback loops from the subordinate robots to the central robot. The diagram is a simplified representation of a system, likely related to automation or distributed processing.
### Components/Axes
The diagram consists of the following components:
* **Input:** A rectangle on the left side, representing the initial input to the system.
* **Central Robot:** A larger robot icon in the center, with a circular element on top.
* **Subordinate Robots:** Three smaller robot icons positioned below the central robot.
* **Output:** A rectangle on the right side, representing the final output of the system.
* **Arrows:** Solid and dashed arrows indicating the direction of data or process flow.
There are no explicit axes or scales in this diagram.
### Detailed Analysis or Content Details
The diagram shows the following process flow:
1. An input (rectangle on the left) is fed into the central robot.
2. The central robot processes the input and produces an output (rectangle on the right).
3. The central robot also distributes the processed information to three subordinate robots.
4. Each subordinate robot provides feedback to the central robot via dashed arrows.
The arrows indicate the following:
* **Solid Arrows:** Represent a direct, primary flow of information or processing.
* **Dashed Arrows:** Represent a feedback or secondary flow of information.
There are no numerical values or specific data points present in the diagram.
### Key Observations
The diagram highlights a hierarchical structure with a central processing unit (the central robot) and multiple subordinate units (the three robots below). The feedback loops suggest a closed-loop system where the central robot adjusts its processing based on the output of the subordinate robots. The diagram is conceptual and does not provide quantitative data.
### Interpretation
The diagram likely represents a system where a central entity receives input, processes it, and distributes the results to multiple workers. The feedback loops suggest a learning or adaptive system where the central entity refines its process based on the performance of the workers. This could be a model for:
* **Distributed Computing:** The central robot could be a master node, and the subordinate robots could be worker nodes.
* **Robotics Control System:** The central robot could be a controller, and the subordinate robots could be actuators.
* **Machine Learning:** The central robot could be a model, and the subordinate robots could be components evaluating the model's performance.
* **Business Process Automation:** The central robot could be a workflow engine, and the subordinate robots could be individual tasks.
The simplicity of the diagram suggests a high-level overview of the system, focusing on the relationships between the components rather than the specific details of the processing. The lack of quantitative data limits the ability to perform a more detailed analysis.
</details>
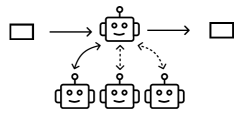
A hierarchical structure where a central agent dynamically decides which worker agents to act based on the input. Often used for complicated tasks that require diverse expertise and careful quality control. A supervisor agent directs user inquiries to specialized agents based on intent—such as technical support, refund and return processing, or handling complaints [4]. [5] [26] [33] [4] [46] [57] [19] [2] [4] [58] [53] Discussion
<details>
<summary>x8.png Details</summary>
### Visual Description
\n
## Diagram: Robotic Process Flow
### Overview
The image depicts a diagram illustrating a cyclical process involving three robotic units. The process begins with an input, passes through the robots in a specific order, and ends with an output. The robots appear to be interconnected via a feedback loop.
### Components/Axes
The diagram consists of the following components:
* **Input:** A square located on the left side of the diagram.
* **Robots:** Three stylized robotic units, each with a smiling face and circular "eyes".
* **Output:** A square located on the right side of the diagram.
* **Arrows:** Solid arrows indicating the primary flow of the process.
* **Dotted Arrows:** Dotted arrows indicating a feedback loop between the robots.
### Detailed Analysis or Content Details
The process flow can be described as follows:
1. An input (square) is directed to the first robot (top-left).
2. The first robot processes the input and passes it to the second robot (top-right).
3. The second robot processes the input and passes it to the output (square).
4. The output then feeds back to the third robot (bottom-center).
5. The third robot passes the input to the first robot, completing the cycle.
The dotted arrows indicate a feedback loop:
* The first robot sends information to the third robot.
* The second robot sends information to the third robot.
* The third robot sends information to the first robot.
There are no numerical values or scales present in the diagram.
### Key Observations
The diagram highlights a closed-loop system where the output of the process influences subsequent iterations. The robots are arranged in a triangular configuration, suggesting a balanced or iterative process. The smiling faces on the robots imply a positive or efficient operation.
### Interpretation
The diagram likely represents an automated process or workflow. The robots symbolize automated units or modules performing specific tasks. The feedback loop suggests a continuous improvement or self-regulating mechanism. The process could be a manufacturing line, a data processing pipeline, or any other system where iterative refinement is crucial. The lack of specific details suggests the diagram is a conceptual representation rather than a detailed technical specification. The diagram emphasizes the cyclical nature of the process and the interconnectedness of the robotic units. It suggests a system designed for continuous operation and adaptation.
</details>
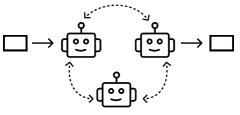
A group of agents engage in a conversation, where they take turns speaking in a round-robin, random manner, or simultaneously. Often used to increase creativity for open-ended tasks. Three agents in roles of news author, critic, and psychologist take turns to generate their response based on the conversation to evaluate open-ended question answers [10]. [46] [10] [29] [12] [33] [19] [57]
Level-3 Single Agent
<details>
<summary>x9.png Details</summary>
### Visual Description
\n
## Diagram: Process Flow with Robot
### Overview
The image depicts a simple process flow diagram featuring a robot as the central processing unit. The diagram shows an input, a processing stage represented by the robot, and an output. Additionally, there are dotted lines extending downwards from the robot, suggesting byproducts or secondary outputs. The diagram is schematic and lacks quantitative data.
### Components/Axes
The diagram consists of the following components:
* **Input:** A square box positioned on the left side of the diagram.
* **Robot:** A square box with a face (eyes and a smile) and an antenna on top, positioned in the center.
* **Output:** A square box positioned on the right side of the diagram.
* **Arrows:** Solid arrows indicating the flow of the process from input to robot to output.
* **Dotted Lines:** Dotted lines extending downwards from the robot, suggesting secondary outputs or byproducts.
There are no axes or legends present in the image.
### Detailed Analysis or Content Details
The diagram illustrates a process where an input enters a processing stage represented by a robot, and an output is generated. The robot appears to be the core component transforming the input into the output. The dotted lines suggest that the robot also produces additional outputs or byproducts during the process.
The input is represented by a square box on the left. An arrow points from this box to the robot.
The robot is represented by a square box with a face. An arrow points from the robot to the output.
The output is represented by a square box on the right.
The dotted lines originate from the bottom of the robot and extend downwards. The pattern of the dotted lines is irregular.
### Key Observations
The diagram is highly symbolic and does not contain any numerical data. The robot is the central element, suggesting automation or a mechanical process. The dotted lines indicate that the process is not entirely clean and may generate waste or byproducts. The simplicity of the diagram suggests a high-level overview of a process rather than a detailed technical specification.
### Interpretation
The diagram likely represents a simplified model of a manufacturing or processing system. The robot symbolizes an automated process that takes an input, transforms it, and produces an output. The dotted lines could represent waste, errors, or other byproducts of the process. The diagram emphasizes the role of automation in transforming inputs into outputs, while also acknowledging the potential for unintended consequences or byproducts. The diagram is a conceptual illustration and does not provide specific details about the process or the robot's functionality. It is a visual metaphor for a transformation process. The lack of specific labels or data suggests the diagram is intended for a general audience and is not meant to be a precise technical representation.
</details>
The basic building block of multi-agent workflows, a single LLM enhanced with augmentations such as data retrieval, tools, prompting, and memory. A single agent augmented with Web search tool queries for question-answering [35]. A basic module with diverse augmentations to enhance individual ability and versatility. [26] [5] [22] [52] [57] [19] [2] [28] [46] [35]
2.2 Design Space of Multi-agent Workflows
To address these challenges, \sysName summarizes and visualizes the design space of multi-agent workflows, offering users a structured overview of various possible solutions. This subsection introduces the three key components of this design space: design dimensions, reusable design patterns, hierarchical abstraction levels, grounded in both user study and recent literature. While these components are not exhaustive and are likely to evolve with ongoing research, they provide a strong foundation for demonstrating the usefulness of visualizing design space and integrating established design patterns.
2.2.1 Design Dimensions
Dimensions are key factors that define and distinguish various workflows within the design space, such as the running time, the number of agents, and the rate of hallucination. Certain key dimensions are common across various tasks, while others are specific to particular applications. For example, dimensions such as accuracy and computational efficiency are universally relevant to most tasks, as practitioners generally seek to optimize them regardless of application. In contrast, specialized dimensions like the degree of dynamic updating are important for specific contexts. Our formative study revealed that while experts (E1-E4) unanimously rejected fully automated workflow generation, they sometimes incorporated components with dynamic updating capabilities (e.g., agents that select subsequent agents based on output analysis) in particular scenarios where adaptability was essential. Dimensions can also be highly granular, addressing specific characteristics like output length, formatting elements (e.g., bullet points), or the presence of certain keywords. They can influence design choices across the design process, such as reducing the number of agents to lower computational costs. Since these design dimensions can be very task-specific, there is not an exclusive list of all possible dimensions.
2.2.2 Design Patterns
Design patterns are reusable, generalizable strategies for structuring workflows that emerge from repeated adaptation across numerous existing implementations. A design patterns is often associated with optimizing specific performance dimensions, e.g., reflection based design pattern can improve accuracy.
Even though existing surveys provided valuable insights about workflow design, they either focus on one aspect of the design process (e.g., task planning [18]) or overlook the high-level abstraction within the design space and focus on implementation details [19]. Therefore, we extended existing workflow surveys [57, 18, 19] and analyzed 43 multi-agent systems drawn from papers, blog posts, framework documentation, via keyword-based searches (e.g., “multi-agent”, “LLM workflows”, “agent orchestration”). Using axial coding, we grouped recurring structures into design patterns. While terminology varies across sources (e.g., “Group Chat” vs “Discussion”), we adopted the most commonly used terms in our dataset for consistency. A full summary of these patterns is provided in subsection 2.1. Although our collection does not capture every possible structure (e.g., dynamic prompt-based feedback [22]), it provides a robust foundation that effectively demonstrates the value of visualizing the design space and integrating established patterns into workflow creation processes. The detailed analysis process is included in the project web page.
2.2.3 Hierarchical Abstraction Levels
We model the design space as three levels of abstraction (Fig. 1). This approach follows the established practices in design-related fields that employ layered abstractions to manage complexity and structure the design process [34, 48]. To construct each abstraction layer, we employ axial coding to organize the design patterns documented in our literature review, alongside the important design decisions and challenges identified through our formative study. This coding process groups related concepts into three hierarchical levels that progressively address the workflow development complexity.
- The first level, Task Planning, serves as the strategic foundation where complex tasks are systematically decomposed into discrete, manageable sub-tasks.
- The second level, Agent Assignment, builds directly upon the task decomposition by assigning appropriate agents to each sub-task. Some tasks may require a single agent, while others may necessitate collaboration between multiple agents with complementary roles.
- The third level, Agent Optimization, provides granular control mechanisms, allowing users to fine-tune individual agents through prompt engineering, tool integration, or access to external datasets, to precisely shape their behavior and response characteristics.
These hierarchical levels reflect a natural design progression, from abstract strategy to detailed implementation, and form the structural backbone of the visual exploration offered by \sysName
<details>
<summary>x10.png Details</summary>
### Visual Description
\n
## Diagram: FlowForge Task Breakdown & LLM Interaction
### Overview
This diagram illustrates the workflow of a task within the FlowForge system, focusing on a peer-review process powered by Large Language Models (LLMs). The diagram is segmented into several areas: a task description at the top, a design space overview (B1), latency charts (B2), a detailed process flow (C1 & C2), and a message log with agent interactions (bottom). The diagram highlights the use of multiple LLM calls throughout the process.
### Components/Axes
* **Top Bar:** "FlowForge", "Task Description: Conduct a comprehensive and systematic review of a given research paper that emulates standard peer-review practices. Multiple, distinct...", "SUBMIT TASK", "Example Input (Optional)"
* **B1 - Design Space Overview:** Four flows labeled "Flow 1", "Flow 2", "Flow 3", "Flow 4". Each flow is represented by a series of vertical bars with numerical labels below (2-1, 2-2 for Flow 1, etc.).
* **B2 - Latency Charts:** Two bar charts.
* X-axis: "# agents" (ranging from 1 to 6)
* Y-axis: "Latency" (units not specified, but visually ranging from 0 to approximately 10)
* Two data series represented by different colored bars: "S" and "D".
* **C1 - Evaluate Results/Structure Check/Method Assessment:** A process flow diagram with boxes representing stages: "Initial review", "Structure check", "Method assessment", "Evaluate results", "Draft review". Each stage indicates the number of LLM calls used.
* **C2 - Discussion/Redundant/Supervision:** A process flow diagram with boxes representing stages: "Discussion", "Redundant", "Supervision".
* **Bottom Section - Message Log:** Displays messages from different agents (Agent A, Agent B, Agent C, Agent D, Agent E, Agent F, Agent G, Agent H, Agent I) and a "Dashboard" output.
* **Footer:** "Time Used: 30.27s", "Looks Good, Continue", "Try Another One", "c3" (bottom right corner).
### Detailed Analysis or Content Details
**B1 - Design Space Overview:**
* Flow 1: Bars at 2-1 and 2-2.
* Flow 2: Bars at 2-1 and 2-2.
* Flow 3: Bars at 3-1 and 3-2.
* Flow 4: Bars at 4-1 and 4-2.
**B2 - Latency Charts:**
* **Series "S":**
* 1 agent: ~1.5 latency
* 2 agents: ~2.5 latency
* 3 agents: ~3.5 latency
* 4 agents: ~4.5 latency
* 5 agents: ~5.5 latency
* 6 agents: ~6.5 latency
* Trend: Linearly increasing latency with the number of agents.
* **Series "D":**
* 1 agent: ~0.5 latency
* 2 agents: ~1.5 latency
* 3 agents: ~2.5 latency
* 4 agents: ~3.5 latency
* 5 agents: ~4.5 latency
* 6 agents: ~5.5 latency
* Trend: Linearly increasing latency with the number of agents.
**C1 - Evaluate Results/Structure Check/Method Assessment:**
* Initial review: 6 LLM calls.
* Structure check: +2 + 1 = 13 LLM Calls. Agent A, Agent B, Agent C, Agent D, Agent E, Agent F, Agent G.
* Method assessment: 6 LLM calls.
* Evaluate results: 6 LLM calls.
* Draft review: 6 LLM calls.
**C2 - Discussion/Redundant/Supervision:**
* Discussion: A group of 6 agents engage in a conversation.
* Redundant: A process that appears to be a check for redundancy.
* Supervision: A final oversight stage.
**Bottom Section - Message Log:**
* Agent A: "The prompt contributes to the clarity of the arguments made in the research paper and the overall structure of the data collection."
* Agent B: "To ensure the task is completed with the required rigor and attention to detail, it is essential to assess the overall structure of the research paper and its arguments."
* Agent C: "The structure check is essential for ensuring that all aspects of the research paper are logically sound."
* Agent D: "The method assessment is essential for ensuring that all aspects of the research paper are logically sound."
* Agent E: "The evaluate results stage is essential for ensuring that all aspects of the research paper are logically sound."
* Agent F: "The draft review stage is essential for ensuring that all aspects of the research paper are logically sound."
* Agent G: "The draft review stage is essential for ensuring that all aspects of the research paper are logically sound."
* Agent H: "The draft review stage is essential for ensuring that all aspects of the research paper are logically sound."
* Agent I: "The draft review stage is essential for ensuring that all aspects of the research paper are logically sound."
* Dashboard: "With Summary"
### Key Observations
* The latency increases linearly with the number of agents involved.
* Each stage of the review process utilizes a consistent number of LLM calls (6, except for Structure Check).
* The message log shows a repetitive response from Agents D through I, indicating a potential issue with the LLM's output or a loop in the process.
* The "Looks Good, Continue" button suggests a positive evaluation of the current state.
### Interpretation
The diagram demonstrates a workflow for automated peer review using LLMs. The system breaks down the review process into distinct stages (Initial Review, Structure Check, Method Assessment, Evaluation, Draft Review), each leveraging LLM calls to analyze the research paper. The latency charts suggest a trade-off between the number of agents involved and the time taken for the review. The repetitive responses from multiple agents in the message log are a significant anomaly, potentially indicating a problem with the LLM's reasoning or a flaw in the prompt design. The overall design appears to be iterative, with the "Looks Good, Continue" button allowing for progression through the workflow. The "Design Space Overview" (B1) suggests exploration of different flow configurations, potentially optimizing the review process. The diagram highlights the potential of LLMs to automate aspects of peer review, but also underscores the importance of careful monitoring and refinement to address issues like repetitive outputs and ensure the quality of the review.
</details>
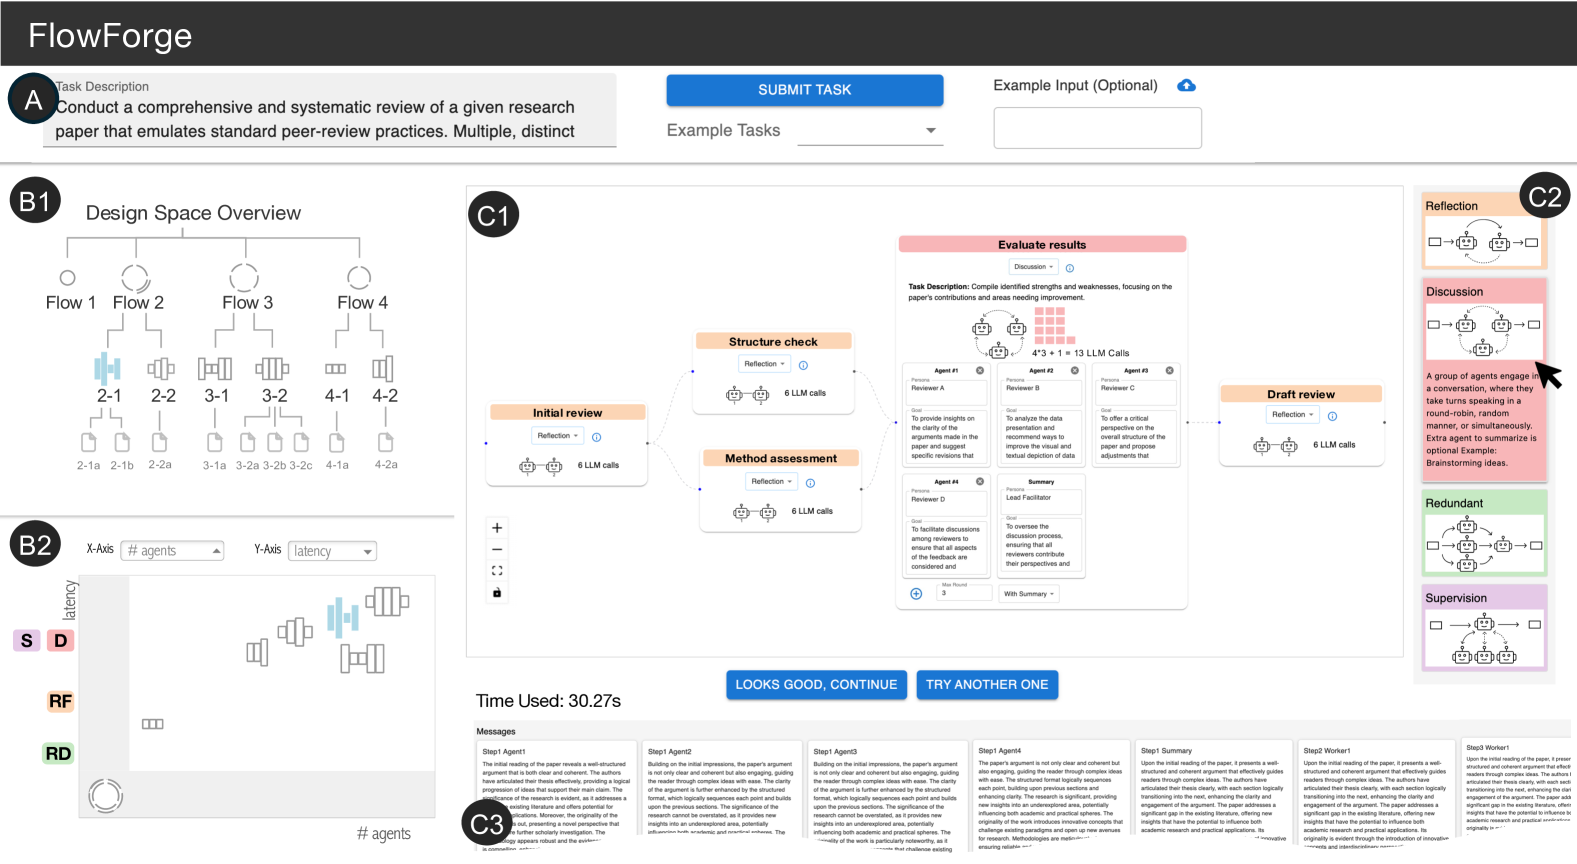
Figure 2: Interface Overview. Users start by entering a task description (A). \sysName supports workflow creation through two main views: the Design Space View, with a hierarchical tree (B1) and a scatter plot (B2), and the Canvas View, which shows workflow details (C1), in-situ design suggestions (C2), and execution results (C3).
2.3 Design Goals
\sysName
is developed with the following design goals in mind, informed directly by the challenges uncovered in our formative study:
1. Step-by-step guidance from abstract to concrete. \sysName supports a top-down design process by structuring the workflow creation experience, guiding users from high-level task decomposition to granular agent optimization. This helps users navigate the complexity of the design space and mitigates unstructured exploration (C.1 , C.2 ).
1. Support for divergent and convergent thinking. The system encourages users to explore multiple workflow alternatives early in the design process before committing to a final solution. This prevents them from design fixation and promotes more deliberate decision-making (C.3 ).
1. In-situ guidance for best practices. As users explore the design space, \sysName provides context-aware design pattern suggestions drawn from validated design patterns. These suggestions surfaced at appropriate abstraction levels, assisting users without disrupting their flow (C.1 C.2 ).
1. Parallel exploration across multiple dimensions. Users can evaluate and compare different workflows across key performance dimensions (e.g., latency, accuracy, cost) as well as task-specific dimensions (e.g., format constraints), enabling a more holistic understanding of trade-offs and priorities (C.4 ).
3 System
\sysName
is an interactive visualization system that supports the design and exploration of multi-agent workflows. As shown in Fig. 2, users begin by entering a task description (A), after which \sysName generates and visualizes candidate workflows. The interface is composed of two main components: the Design Space View, which displays the levels and dimensions via a hierarchical tree (B1) and a scatter plot (B2); and the Canvas View, which presents the detailed structure of a selected workflow (C1), along with in-situ design suggestions (C2) and execution results (C3).
3.1 Design Space View: Visualizing Abstraction Levels
The hierarchical tree (Fig. 2.B1) captures three levels of abstraction in workflow design. This tree dynamically updates as users navigate the space, guiding them through the progressive stages of workflow design: task planning, agent assignment, and agent optimization (DG.1.). This structure encourages both depth-first exploration (\ie, jump directly to concrete implementation) and breath-first exploration (\ie, comparing options before committing), as the latter is often overlooked in current practices (DG.2.). For instance, at the task planning level, users may compare task decompositions with three vs. four subtasks. At the agent assignment level, they can explore collaboration strategies, such as having two agents co-work on a subtask versus one completing it and another reviewing the output.
To represent workflows across these levels, we introduce a set of visual glyph nodes (Fig. 3). These glyph nodes encode the computational efficiency, a universally relevant dimension in workflow design (Sect. 2.2.1) that can be estimated before execution.
- Level 1 (Task Planning): Glyphs use the number of arcs to indicate the number of subtasks. Stacked arcs represent parallel subtasks, and node size reflects the number of sequential steps.
- Level 2 (Agent Assignment): Glyphs consist of bars, where each bar represents a pseudo-time step of the workflow running process, and its height indicates the number of concurrent agent calls.
- Level 3 (Agent Optimization): As this level does not introduce structural changes, glyphs are rendered as file icons, denoting a fully runnable workflow.
These glyphs provide a quick, visual summary of each workflow, helping users efficiently compare alternatives without delving into detailed specifications. While we experimented with encoding additional dimensions into the glyphs, we found that increasing complexity introduced unnecessary cognitive burdens.
<details>
<summary>x11.png Details</summary>
### Visual Description
\n
## Diagram: Multi-Agent System Workflow
### Overview
The image presents a diagram illustrating a multi-agent system workflow, broken down into four sequential stages: Task Planning, Agent Assignment, Agent Optimization, and a final output stage represented by a blue upward-pointing arrow. Each stage is visually represented with icons and flow indicators.
### Components/Axes
The diagram is divided into four quadrants labeled A, B, C, and the final output.
* **A: Task Planning:** Depicts a process flow with labeled steps: "step 1", "step 2a", "step 2b", and "step 3". A circular arrow indicates a feedback loop from "step 3" back to "step 1".
* **B: Agent Assignment:** Shows a series of agent icons (depicted as head-and-shoulder silhouettes within rectangular boxes) connected in a linear sequence. An arrow labeled "time" points to the right, indicating a temporal progression. The output of this stage is a bar graph with varying bar heights.
* **C: Agent Optimization:** Illustrates a series of agent icons (similar to B) with tool icons (wrench, screwdriver, etc.) associated with them. These agents are connected by lines, suggesting interactions or dependencies.
* **Output:** A blue upward-pointing arrow, indicating a final result or completion of the process.
### Detailed Analysis or Content Details
* **Task Planning (A):** The process begins with "step 1". It then branches into "step 2a" and "step 2b", which converge into "step 3". "Step 3" then loops back to "step 1", indicating an iterative process.
* **Agent Assignment (B):** There are approximately 8 agent icons shown in the initial sequence. The bar graph output consists of approximately 6 bars of varying heights. The first bar is the shortest, and the bars generally increase in height before decreasing again. The bar heights are roughly: 0.5, 1.0, 1.5, 2.0, 1.5, 1.0 (relative units).
* **Agent Optimization (C):** Approximately 6 agent icons are shown, each associated with a tool icon. The connections between agents suggest a network or collaborative effort.
* **Output:** The blue arrow signifies the completion of the workflow.
### Key Observations
* The workflow is sequential, with each stage building upon the previous one.
* The Task Planning stage involves iteration, as indicated by the feedback loop.
* The Agent Assignment stage results in a dynamic output represented by the bar graph, suggesting varying levels of performance or resource allocation.
* The Agent Optimization stage focuses on enhancing the capabilities of individual agents.
### Interpretation
This diagram illustrates a typical workflow for a multi-agent system. The system begins with planning the tasks (A), then assigns agents to those tasks (B), optimizes the agents' performance (C), and finally produces a result (output). The iterative nature of the Task Planning stage suggests a dynamic and adaptable system. The bar graph in the Agent Assignment stage likely represents the performance or efficiency of the agents over time, with the varying bar heights indicating fluctuations in their output. The Agent Optimization stage is crucial for ensuring that the agents are well-equipped to handle their assigned tasks. The overall system appears to be designed for complex problem-solving, where tasks are broken down into smaller steps, assigned to specialized agents, and continuously optimized for better results. The diagram doesn't provide specific data or numerical values beyond the relative bar heights, but it effectively conveys the overall process flow and key components of a multi-agent system.
</details>
Figure 3: Glyphs. (A) At Level 1 (task planning), arcs represent subtasks and node size for sequential count. (B) At Level 2 (agent assignment), bars show agent calls over pseudo-time steps. (C) At Level 3 (agent optimization), workflows are denoted as file icons, as no new structural information is added and the workflow is fully runnable.
3.2 Design Space View: Visualizing Design Dimensions
Although the hierarchical tree organizes workflows by abstraction level, it offers limited visibility into design dimensions (e.g., number of agents, number of subtasks, number of LLM calls, running time). To address this, \sysName includes a configurable scatter plot (Fig. 2.B2) that enables comparison of workflows across key dimensions (DG.4.). In this scatter plot, users can assign different dimensions to the x- and y-axes. We provide a list of predefined dimensions based on feedback from formative studies, while allowing users to add customized dimensions (e.g., user rating for the workflow outputs) via manually annotating the workflow outputs. Workflows with undefined values on a selected axis are displayed in gray margin areas. For example, in \sysName: Guiding the Creation of Multi-agent Workflows with Design Space Visualization as a Thinking Scaffold. A2, workflows at Level 1 (task planning) do not include information about the number of agents (y-axis), and are put in the bottom gray area of the scatter plot. The scatter plot only displays workflows at the current level or one level above the selected node in the tree. This selective display is informed by the user feedback we received during the iterative design process, as showing all workflows across three abstraction levels can be cognitively overwhelming.
We chose a scatter plot because it provides a clear overview of the design space, making it easier to identify regions that are heavily explored (\ie, clusters) versus those that remain underexplored (\ie, spatial gaps). For example, Fig. 2 shows that the current exploration has exclusively focused on workflows that have multiple agents, as evidenced by the glyph nodes clustered in the upper-right corner. This insight may prompt users to consider exploring workflows with fewer subtasks or simpler configurations that have been overlooked (DG.2.).
We have explored alternative designs such as tables, parallel coordinates, and connected scatter plots. Although tables and parallel coordinates can display more than two dimensions simultaneously, users often struggle to interpret and compare more than two dimensions effectively [49]. During the iterative design process, we also experimented explicitly connecting related workflows across levels in the scatter plot. However, the additional edges in the scatter plot were unnecessary in most cases, since the children node typically share some dimension values as their parent nodes and their hierarchical relation can be easily recognized based on the alignment of the glyph nodes, e.g., same x position in the \sysName: Guiding the Creation of Multi-agent Workflows with Design Space Visualization as a Thinking Scaffold.A2.
<details>
<summary>x12.png Details</summary>
### Visual Description
\n
## Diagram: Workflow for AI-Driven Video Script Creation
### Overview
This diagram illustrates a workflow for creating video scripts using AI, specifically focusing on task planning, agent optimization, and agent assignment. It appears to be a process for generating video content based on research topics, utilizing Large Language Models (LLMs) like GPT-4. The diagram is segmented into four main sections labeled A, B1, B2, and C, with a central "Lead with Curiosity" block.
### Components/Axes
The diagram consists of several key components:
* **A: Task Planning:** Outlines the initial step of "Lead with Curiosity," detailing the step description, duration, and visual elements.
* **B1: Agent Assignment:** Focuses on the evaluator role and responsibilities.
* **B2: Agent Assignment:** Focuses on the optimizer role and responsibilities.
* **C: Agent Optimization:** Depicts the interaction between an "Optimizer" and an "Evaluator" agent, both powered by LLMs.
* **Central Block:** "Lead with Curiosity" - serves as the core task description.
* **Icons:** Represent LLM calls and agent interactions.
* **Text Blocks:** Provide detailed descriptions of roles, prompts, and goals.
### Detailed Analysis or Content Details
**A: Task Planning**
* **Step Description:** "Open with a compelling question related to the research topic, drawing viewers in. Visual: Text animation of the question over an intriguing background. Duration: 3"
* **Reflection:** A dropdown menu labeled "Reflection" is present.
**B1: Agent Assignment (Evaluator)**
* **Evaluator Persona:** "You are the evaluator, responsible for assessing the quality of each video script."
* **Max Round:** 3
**B2: Agent Assignment (Optimizer)**
* **Optimizer Goal:** "Iteratively improve each script, focusing on delivering a unique and engaging narrative while maintaining accessibility and ensuring precise timing."
* **3\*2 = 6 LLM Calls** is displayed.
**C: Agent Optimization**
* **Step 1: Optimizer**
* **LLM Model:** GPT-4
* **System Prompt:** "You are the optimizer, tasked with refining scripts based on feedback."
* **Tools:** A section labeled "Tools" is present.
* **Step 1: Evaluator**
* **LLM Model:** GPT-4
* **System Prompt:** "You are the evaluator, responsible for assessing the quality of each video script. The step description is Open with a compelling question related to the research topic, drawing viewers in."
* **Tools:** A section labeled "Tools" is present.
**Central Block: Lead with Curiosity**
* **Task Description:** "Open with a compelling question related to the research topic, drawing viewers in. Visual: Text animation of the question over an intriguing background. Duration: 3 seconds."
* **Reflection:** A dropdown menu labeled "Reflection" is present.
* **Icon:** A graphic depicting two interconnected circles with the number "6" inside, representing 6 LLM calls.
### Key Observations
* The workflow emphasizes iterative refinement through the Optimizer and Evaluator agents.
* GPT-4 is consistently used as the LLM for both roles.
* The process is designed to create engaging video scripts that start with a compelling question.
* The "Lead with Curiosity" concept is central to the entire workflow.
* The process involves 6 LLM calls in total.
* The maximum number of rounds for agent assignment is 3.
### Interpretation
This diagram outlines a structured approach to video script generation leveraging the capabilities of LLMs. The workflow is designed to ensure the scripts are not only informative but also captivating, starting with a thought-provoking question. The use of separate Optimizer and Evaluator agents suggests a quality control loop, where the optimizer refines the script based on the evaluator's feedback. The limited number of LLM calls (6) and max rounds (3) indicate a focused and efficient process. The emphasis on "accessibility" and "precise timing" in the Optimizer's goal suggests a concern for creating videos that are both understandable and well-paced. The diagram represents a practical application of AI in content creation, specifically targeting video scripts that aim to engage viewers from the outset. The "Reflection" dropdowns suggest a mechanism for logging or reviewing the process, potentially for further optimization or analysis. The diagram is a high-level overview and doesn't detail the specific feedback mechanisms between the agents.
</details>
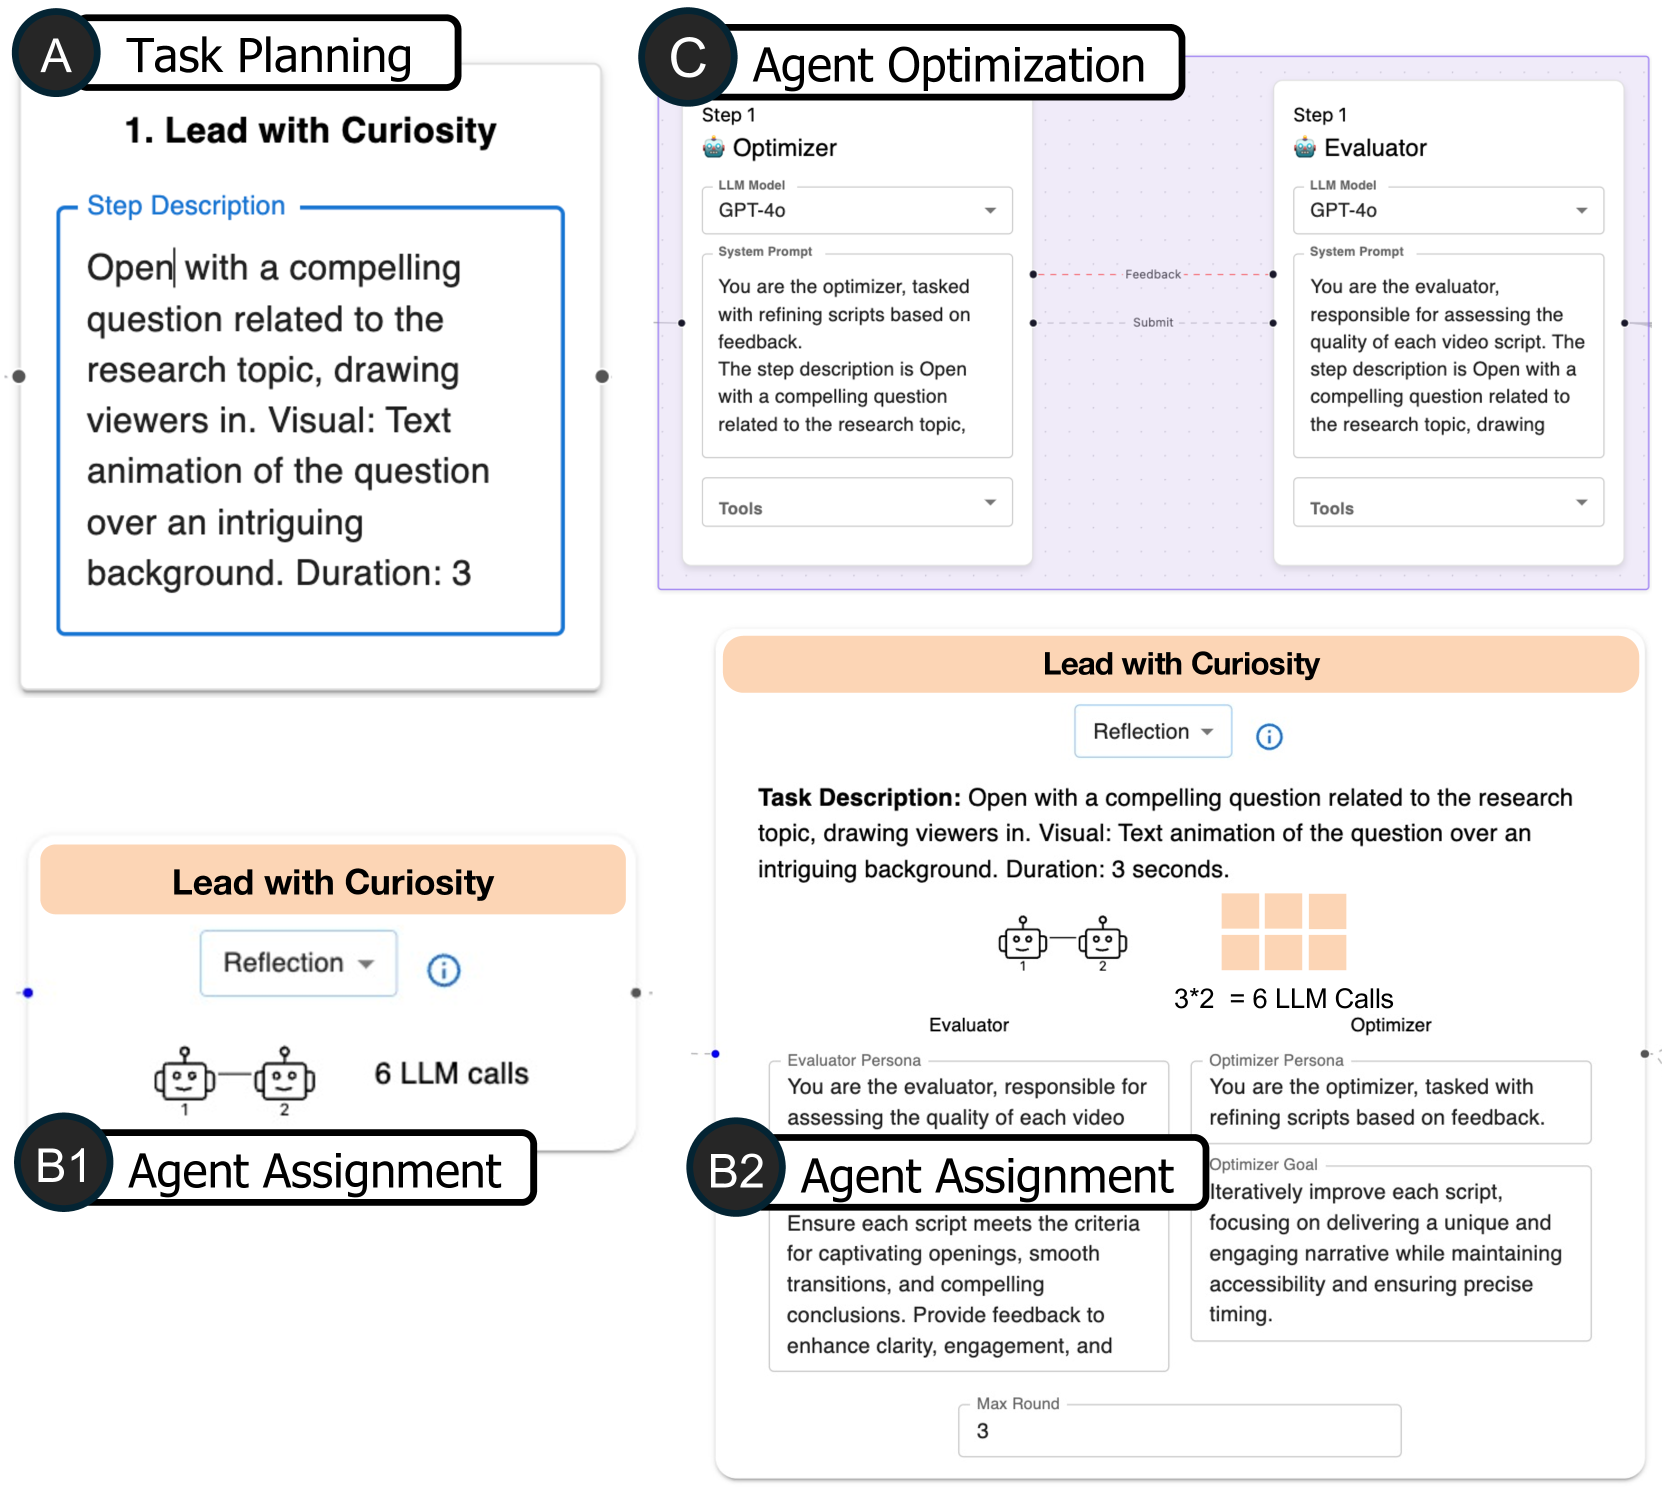
Figure 4: In the Canvas View, the visual representation of each node adapts based on the abstraction level.
3.3 Canvas View: Editing Individual Workflows
Workflows selected from the design space are displayed in the Canvas View, as interactive node-link diagrams. Users can navigate between abstraction levels (DG.1.), using the “Looks Good, Continue” and “Try Another One” buttons in the Canvas View. The former advances the current workflow to a more concrete level (e.g., from task planning to agent assignment), while the latter prompts alternative solutions at the same level (e.g., a different way to decompose the task). To prevent potential confusion between the tree representation of the design space and the node-link diagram of an individual workflow, different visualizations are used: circular nodes and step-wise edges for the tree and rectangular nodes with curved edges for the workflow. Node styles of the workflow adapt according to the abstraction level selected in the left-side Design Space View:
- Level 1 (Task Planning): Nodes represent subtasks with editable text descriptions. Edges denote dependencies and execution order of subtasks, with the flow progressing from left to right. Users can modify task structure, text, and dependencies.
- Level 2 (Agent Assignment): Nodes correspond to agent groups assigned to subtasks. When zoomed out (B1), nodes show summary information, \ie, the subtask name, the associated collaboration pattern, and the estimated number of LLM calls. Zooming in (B2) reveals detailed configurations, such as agent roles, collaboration patterns (e.g., reflection, supervision) (subsection 2.1), and pattern-specific parameters (e.g., number of agents in redundancy or discussion rounds).
- Level 3 (Agent Optimization): Nodes represent individual agents, and agents working on the same subtask are grouped within the same purple rectangle. Users can configure agents using common patterns, including prompt engineering, tool usage, and retrieval augmentation.
3.4 Design Cards: In-situ Guidance via Design Patterns
To support in-situ design thinking, \sysName surfaces relevant design patterns on the right side of the Canvas View. Each pattern is presented as a card with its name, visual representation, and expandable details (Fig. 2.C2). When users hover over a pattern card, all corresponding nodes adopting the pattern are highlighted.
Since different design patterns tend to prioritize different performance dimensions, we also annotate the scatter plot axes with relevant patterns when one of these dimensions is used as an axis. For example, as shown in Fig. 2.B2, when latency is selected as the y-axis, patterns such as Redundancy, Reflection, and Discussion, are recommended and marked along the axis to aid interpretation: Redundancy at the bottom (minimal latency), Reflection mid-range (moderate latency), and Discussion near the top (high latency due to multi-round interactions).
3.5 Workflow and Suggestion Generation
The generation approach employs a straightforward, prompt-based methodology using GPT-4o [37], as existing methods are either not open-source or limited to specific tasks [21]. This prompt-based approach proves sufficient for demonstrating the effectiveness of \sysName. While we acknowledged that the generation can be further improved with more advanced approaches (e.g., reinforcement learning), novel methods for automatic workflow generation and recommendation is beyond the scope of this study.
Specifically, \sysName generates workflows and design patterns following the three levels of abstraction:
- Level 1 (Task Planning): \sysName prompts GPT-4o to generate diverse decompositions of a given task while maintaining a unified format. Each generated subtask is formatted to include a label, task description, output format, and a pointer to the next step. The prompt encourages variation in complexity (number of subtasks), structure (sequential or parallel), and perspective (distinct focus for each plan). Users can customize the decomposition by editing, adding, or deleting subtasks via node modifications, and reorder them by reconnecting edges in the Canvas View.
- Level 2 (Agent Assignment): GPT-4o is prompted to rank a given list of design patterns for each subtask and provide explanations of its recommendation. For each subtask, the prompt combines its context (task name and description) with the full list of design patterns (names, definitions, and brief examples). Based on this information, GPT-4o heuristically evaluates the subtask’s characteristics and suggests suitable patterns, e.g., Redundant for multifaceted analysis. The combination of design patterns is randomized to mitigate the position bias of LLM [61]. Users can view the description and estimated computational cost of the suggested patterns, modify the design pattern for each subtask (e.g., change from Discussion to Reflection), and customize its corresponding parameters (e.g., number of agents).
- Level 3 (Agent Optimization): GPT-4o is prompted to generate configuration details of each agent, including persona, goals, input and output format, based on the subtask’s input and output, the selected design pattern, as well as available tools and external databases. Multiple agents within one pattern are encouraged to embody distinct perspectives that align with real-world roles. Users may refine prompt content, the underlying LLM, the tool usage, and the external database of a specific agent.
Full implementation details are available in the project website.
3.6 Implementation
\sysName
is implemented in JavaScript using React for building the user interface, D3 [6] for rendering custom data-driven visualizations, and ReactFlow [16] for managing and displaying the individual multi-agent workflows as interactive node-link diagrams. We use LangGraph [24] to store and execute the generated workflows. \sysName maintains its own internal data structure and uses a separate converter to translate this structure into compatible LangGraph files. This modular design allows \sysName to be easily adapted to other workflow frameworks by modifying the converter to support other formats. The source code, online demo, and documentation of \sysName are available at https://visual-intelligence-umn.github.io/FlowForge.
4 Case Studies
To demonstrate the utility of \sysName in real-world scenarios, we present two example use cases of \sysName, developed in collaboration with LLM researchers (Section. 2.1).
<details>
<summary>x13.png Details</summary>
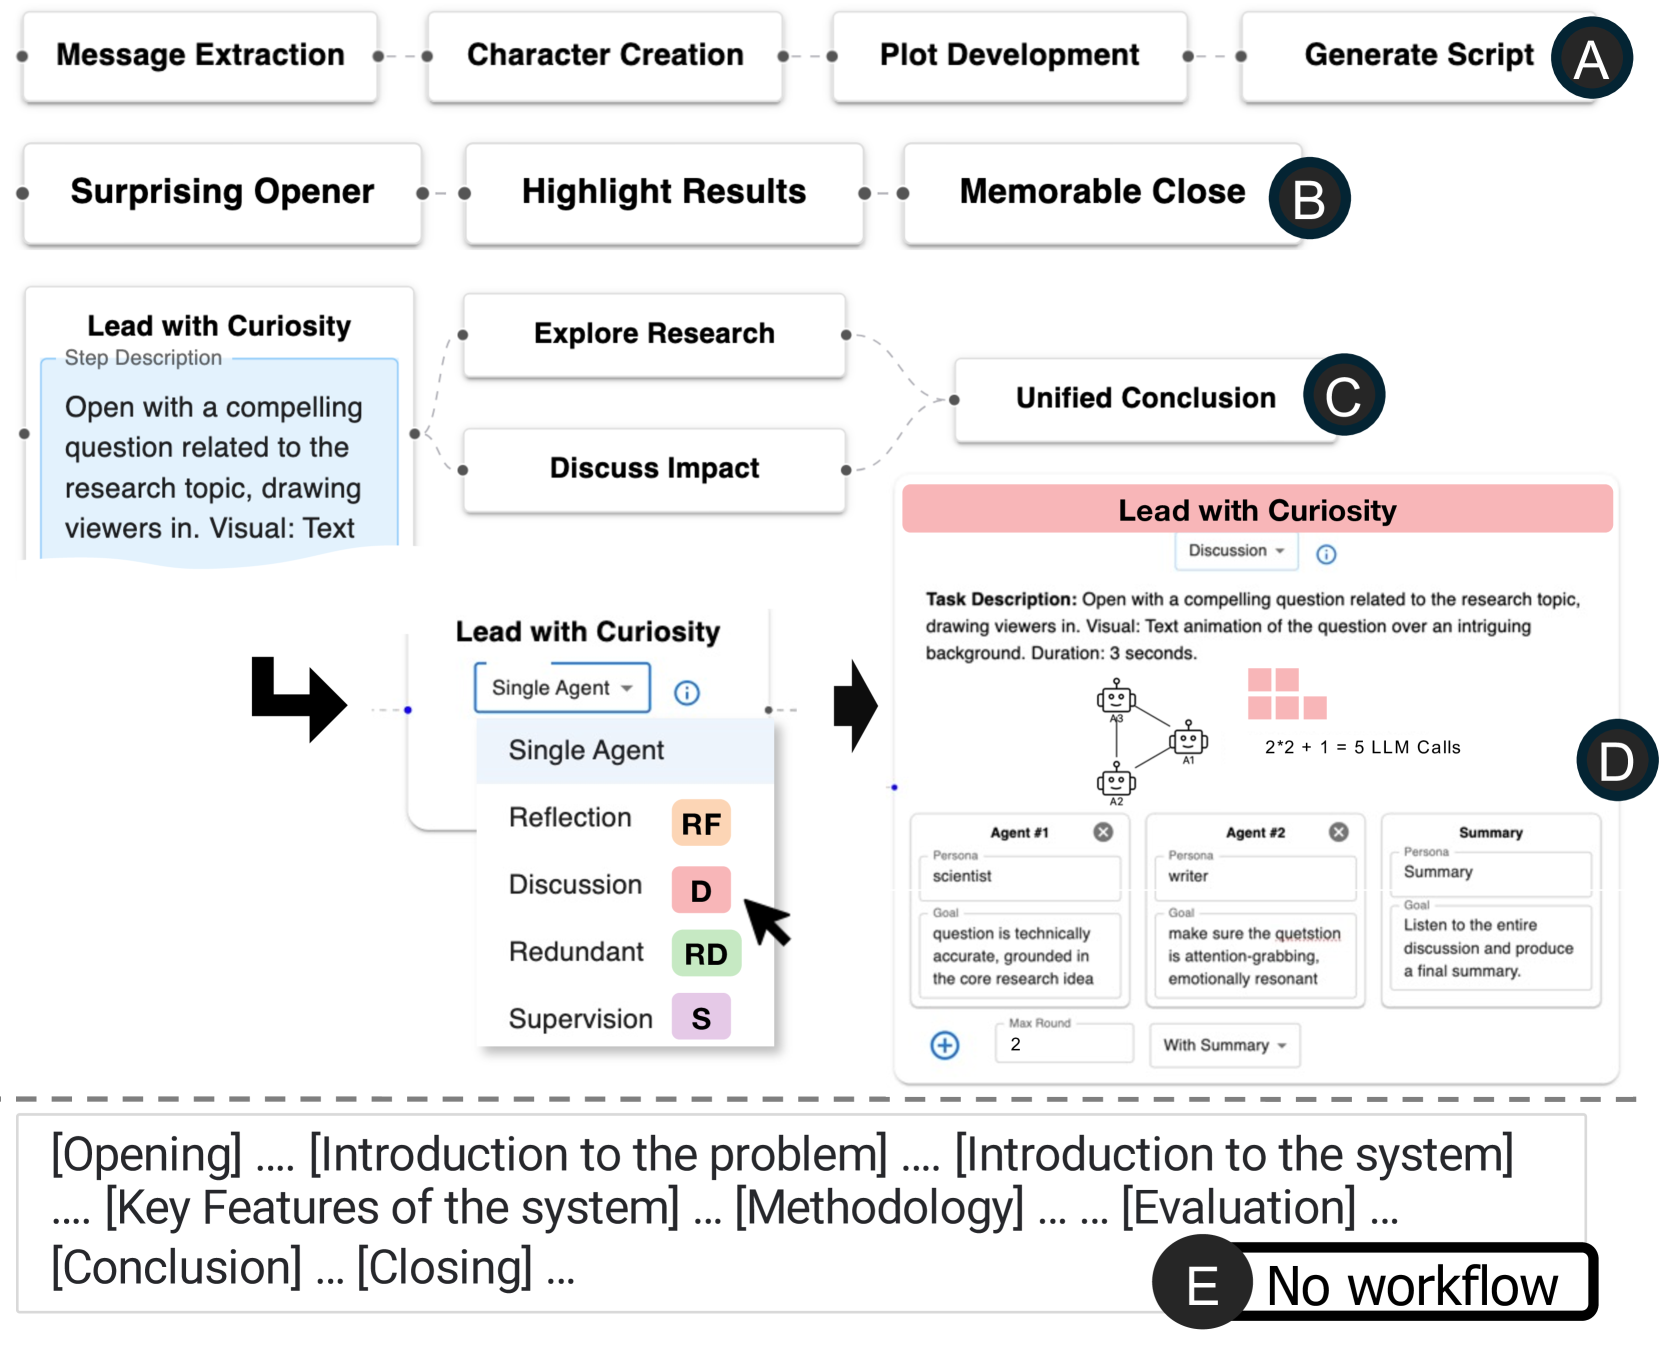
### Visual Description
\n
## Diagram: Script Generation Workflow
### Overview
This diagram illustrates a workflow for generating a script, starting from message extraction and culminating in a unified conclusion. It details a process involving multiple stages, agent interactions, and feedback loops. The diagram is segmented into several key areas: a linear script generation process (A), a refinement loop (B), a conclusion stage (C), a multi-agent discussion interface (D), and a failure state (E).
### Components/Axes
The diagram consists of several interconnected components:
* **Linear Workflow (A):** Message Extraction -> Character Creation -> Plot Development -> Generate Script
* **Refinement Loop (B):** Surprising Opener -> Highlight Results -> Memorable Close
* **Conclusion (C):** Explore Research -> Discuss Impact -> Unified Conclusion
* **Multi-Agent Discussion (D):** A user interface for a discussion between two agents (Scientist and Writer) with a summarization agent.
* **Failure State (E):** "No workflow" indicated by a red box.
* **Agent Roles:** Reflection (RF), Discussion (D), Redundant (RD), Supervision (S)
* **Text Blocks:** Step Description, Task Description, and a list of document sections: "[Opening] ... [Introduction to the problem] ... [Introduction to the system] ... [Key Features of the system] ... [Methodology] ... [Evaluation] ... [Conclusion] ... [Closing] ..."
### Detailed Analysis or Content Details
**A - Script Generation:** This is a linear sequence of steps.
* Message Extraction
* Character Creation
* Plot Development
* Generate Script
**B - Refinement Loop:** This loop focuses on improving the script's impact.
* Surprising Opener
* Highlight Results
* Memorable Close
**C - Conclusion:** This stage involves research and impact assessment.
* Explore Research
* Discuss Impact
* Unified Conclusion
**D - Multi-Agent Discussion:** This section details a discussion interface.
* **Title:** Lead with Curiosity - Discussion
* **Task Description:** "Open with a compelling question related to the research topic, drawing viewers in. Visual: Text animation of the question over an intriguing background. Duration: 3 seconds."
* **Agent Configuration:**
* **Agent #1:** Persona: Scientist; Goal: "make sure the question is technically accurate, grounded in the core research idea"; Max Round: 2
* **Agent #2:** Persona: Writer; Goal: "make sure the question is attention-grabbing, emotionally resonant"
* **Summary Agent:** Persona: Summary; Goal: "Listen to the entire discussion and produce a final summary."
* **LLM Calls:** 2 + 2 + 1 = 5 LLM Calls
**E - Failure State:** A red box labeled "No workflow".
**Agent Roles:**
* Reflection (RF) - Associated with a dark purple arrow.
* Discussion (D) - Associated with a light purple arrow.
* Redundant (RD) - Associated with a pink arrow.
* Supervision (S) - Associated with a teal arrow.
**Document Sections:** The text at the bottom lists potential sections for a document: "[Opening] ... [Introduction to the problem] ... [Introduction to the system] ... [Key Features of the system] ... [Methodology] ... [Evaluation] ... [Conclusion] ... [Closing] ..."
### Key Observations
* The workflow emphasizes iterative refinement through the loop (B).
* The multi-agent discussion (D) suggests a collaborative approach to script generation.
* The failure state (E) indicates a potential outcome if the workflow is not successful.
* The agent roles (RF, D, RD, S) suggest different types of feedback and oversight.
* The LLM call count (5) provides a quantitative measure of the computational cost.
### Interpretation
The diagram depicts a sophisticated script generation process that leverages both linear progression and iterative refinement. The inclusion of a multi-agent discussion interface highlights the importance of diverse perspectives and collaborative problem-solving. The agent roles suggest a system designed for quality control and ensuring both technical accuracy and emotional resonance. The "No workflow" state indicates a potential point of failure, suggesting the process isn't guaranteed to succeed. The listed document sections suggest the script is intended to be part of a larger technical or research presentation. The diagram suggests a workflow designed to create engaging and informative scripts, likely for video or presentation purposes, by combining automated generation with human-in-the-loop feedback and refinement. The use of LLM calls indicates a reliance on large language models for various stages of the process.
</details>
Figure 5: Case Study 1: Fast-Forward Video Planning. (A-D) \sysName helps users create multiple creative ways of generating the transcript of fast-forward videos for a research paper. (E) In contrast, directly prompting GPT-4o often produces transcripts with conventional structures and exceeds the 25-second constraints. Detailed text responses are omitted due to space constraints.
4.1 Fast-Forward Video Generation for Research Papers
In this use case, a user wants to create a multi-agent workflow for generating ideas for a 25-second fast-forward video that advertises a research paper. This case demonstrates \sysName ’s ability to improve diversity and creativity of workflow designs.
After submitting a task description, \sysName generates five different task planning options with varying lengths. While these workflows follow a similar structure comprising a beginning, an optional middle section, and an ending, they differ in how each subtask is defined and executed. For example, some workflows begin with an intriguing question (Fig. 5.C), while others open with a surprising research finding (Fig. 5.B). One particularly creative workflow introduces a storytelling element to engage the audience (Fig. 5.A). It begins with a “message extraction” step to identify the paper’s core contribution, followed by three narrative-oriented subtasks: character creation, plot development, and script preparation. Ultimately, the user selects a workflow that incorporates a parallel structure in the middle section (Fig. 5.C). This design enables two alternative narrative paths: one that explains the research method and another that emphasizes the broader impact of the work. The workflow can then evaluate the outputs of both paths and select the more compelling version for the final fast-forward video.
With the task planning finalized, the user proceeds to the agent assignment level. Most subtasks are assigned to single agents, likely because they are simple and well-defined. However, for crafting the video’s opening, where creativity is key, the user wants to encourage a more dynamic and collaborative process. To inform this decision, the user configures the scatter plot to display “Creativity” along the y-axis. As revealed in the scatter plot, certain design patterns, such as Discussion and Redundancy, are associated with higher creativity scores. Based on this, the user replaces the single-agent setup with a Discussion pattern, enabling multiple agents to brainstorm and refine the opening collaboratively (Fig. 5.D). In the final stage, the user enters the agent optimization level and fine-tunes the prompts for each agent to better control the expected outputs. The workflow is then executed within \sysName, where both the runtime and outputs are automatically recorded. Users can rate the results, iterate by modifying agent prompts, and compare different versions in the scatter plot across different dimensions.
Comparison with a one-pass LLM. While a single GPT-4o prompt can generate a video script, it typically defaults to conventional structures (e.g., introduction, method, conclusion), and often fails to respect format constraints such as time limits. In our test, even with clear instructions for a 25-second limit, GPT-4o generated long-form outputs mimicking full paper summaries with five or more sections (Fig. 5.E). In contrast, \sysName empowers users to explore varied narrative structures (Fig. 5.A-C), experiment with different decompositions, and fine-tune agent behaviors, offering greater control, diversity, and creativity in workflows generation.
4.2 Data Storytelling from a Dataset
In this case study, a user creates a workflow to generate visualizations and produce data-driven storytelling based on a given dataset. We use a Movies dataset [45] as the input to evaluate the outputs of different workflow configurations. This case demonstrates \sysName ’s ability to compare different workflows and their generated outputs.
<details>
<summary>x14.png Details</summary>
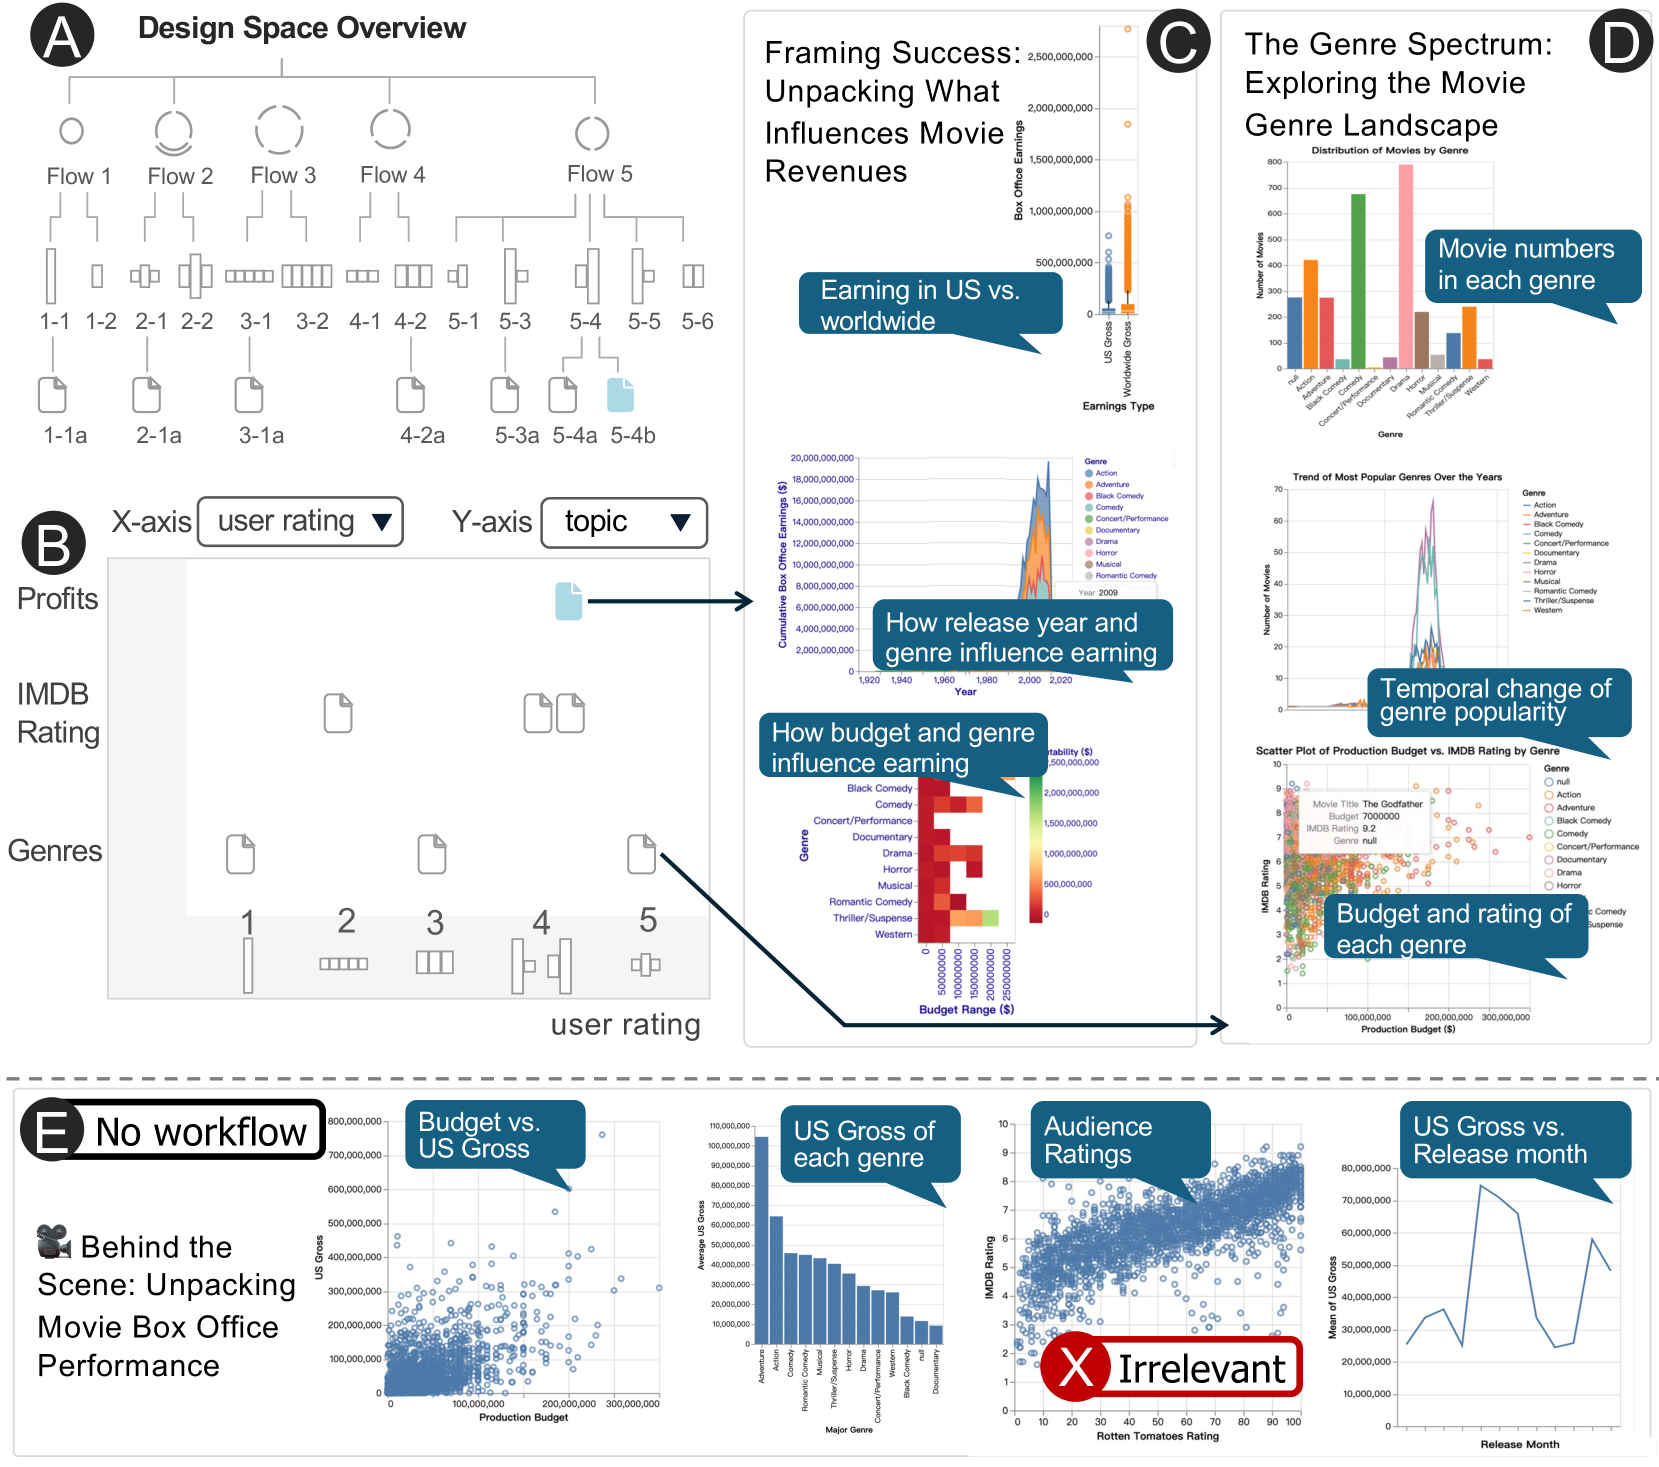
### Visual Description
## Complex Data Visualization: Movie Revenue & Genre Analysis
### Overview
This image presents a multifaceted data visualization exploring the relationship between movie genre, budget, user rating, and revenue, primarily focusing on US vs. worldwide earnings. It combines several chart types – scatter plots, bar charts, flow diagrams, and distribution plots – to provide a comprehensive overview of these factors. The visualization is segmented into four main areas (A, B, C, and D) and a footer containing source information.
### Components/Axes
* **A: Design Space Overview:** A flow diagram with 5 flows (Flow 1 to Flow 5) and 6 stages (1-1 to 5-6). Each stage is represented by a box with varying internal structures.
* **B: Profits vs. IMDB Rating:** A scatter plot with "X-axis: user rating" and "Y-axis: topic". The plot displays data points representing movies, colored by genre. A horizontal line indicates a "No workflow" threshold.
* **C: The Genre Spectrum: Genre Landscape:** Contains multiple sub-charts:
* Distribution of movies by genre. X-axis: Genre. Y-axis: Number of Movies.
* Trend of most popular genres over the years. X-axis: Years. Y-axis: Number of Movies.
* Temporal change of genre popularity.
* Scatter plot of Production Budget vs. IMDB Rating by Genre. X-axis: Budget. Y-axis: IMDB Rating.
* **D: Framing Success: Unpacking What Influences Movie Revenues:** Contains multiple sub-charts:
* Earning in US vs. worldwide. X-axis: Earnings Type (US Gross vs. Worldwide Gross). Y-axis: Revenue (0 to 2,500,000,000).
* How release year and genre influence earning. X-axis: Year (0 to 2020). Y-axis: Revenue (0 to 2,500,000,000).
* How budget and genre influence earning. X-axis: Budget (0 to 100,000,000). Y-axis: Revenue (0 to 2,500,000,000).
* US gross of each genre. X-axis: Genre. Y-axis: US Gross (0 to 1,000,000,000).
* Worldwide gross of each genre. X-axis: Genre. Y-axis: Worldwide Gross (0 to 1,000,000,000).
* Average IMDB rating by genre. X-axis: Genre. Y-axis: Average IMDB Rating (0 to 8).
* **Legend:** Located in the bottom-right corner, associating colors with genres: Black Comedy, Concert/Performance, Crime, Documentary, Drama, Horror, Musical, Mystery, Romance, Sci-Fi, Thriller/Suspense.
* **Footer:** "Source: Box Office Mojo, Perspective: Data Visualization"
### Detailed Analysis or Content Details
**A: Design Space Overview**
The flow diagram shows a progression through stages. The internal structure of the boxes varies, suggesting different types of processes or data representations at each stage. The connections between stages are indicated by arrows.
**B: Profits vs. IMDB Rating**
The scatter plot shows a generally positive correlation between user rating and profits, but with significant scatter.
* **Black Comedy:** Approximately 5 data points, ranging from user rating of 3 to 7, and profits from 0 to 4.
* **Crime:** Approximately 8 data points, ranging from user rating of 2 to 8, and profits from 0 to 5.
* **Drama:** Approximately 10 data points, ranging from user rating of 2 to 8, and profits from 0 to 6.
* **Horror:** Approximately 6 data points, ranging from user rating of 3 to 7, and profits from 0 to 5.
* **Musical:** Approximately 3 data points, ranging from user rating of 4 to 6, and profits from 1 to 3.
* **Romance:** Approximately 7 data points, ranging from user rating of 3 to 7, and profits from 0 to 5.
* **Sci-Fi:** Approximately 8 data points, ranging from user rating of 3 to 8, and profits from 0 to 6.
* **Thriller/Suspense:** Approximately 9 data points, ranging from user rating of 3 to 8, and profits from 0 to 6.
The "No workflow" line appears to be around a profit level of 2.
**C: The Genre Spectrum: Genre Landscape**
* **Distribution of movies by genre:** Drama has the highest number of movies, followed by Thriller/Suspense and Sci-Fi.
* **Trend of most popular genres over the years:** The trend shows fluctuations in genre popularity over time, with Drama consistently being a popular genre.
* **Temporal change of genre popularity:** This plot shows the rise and fall of different genres over time.
* **Scatter plot of Production Budget vs. IMDB Rating by Genre:** There's a weak positive correlation between budget and IMDB rating.
**D: Framing Success: Unpacking What Influences Movie Revenues**
* **Earning in US vs. worldwide:** Worldwide gross is generally higher than US gross. The approximate values are: US Gross ~ 800,000,000, Worldwide Gross ~ 1,500,000,000.
* **How release year and genre influence earning:** Revenue generally increases with release year, but there are variations based on genre.
* **How budget and genre influence earning:** Higher budgets generally correlate with higher revenue, but the relationship varies by genre.
* **US gross of each genre:** Drama and Sci-Fi have the highest US gross.
* **Worldwide gross of each genre:** Drama and Sci-Fi have the highest worldwide gross.
* **Average IMDB rating by genre:** Romance and Musical have the highest average IMDB rating.
### Key Observations
* Drama consistently appears as a dominant genre across multiple charts (number of movies, revenue).
* There's a general positive correlation between budget and revenue, but it's not a strong relationship.
* Worldwide gross is consistently higher than US gross, indicating the importance of international markets.
* The scatter plot in section B suggests that higher user ratings generally correlate with higher profits, but there are many outliers.
* The "No workflow" line in section B suggests a threshold for profitability.
### Interpretation
This visualization aims to provide a holistic understanding of the factors influencing movie revenue. The data suggests that genre plays a significant role, with Drama being a consistently successful genre. Budget and user ratings also contribute to revenue, but their relationships are more complex and influenced by genre. The comparison between US and worldwide gross highlights the importance of international markets for maximizing revenue. The Design Space Overview (A) suggests a workflow or process for analyzing these factors, but the specific details of this process are not fully clear from the image. The visualization is a powerful tool for understanding the dynamics of the movie industry and identifying potential strategies for success. The multiple charts allow for a nuanced understanding of the data, revealing both general trends and specific outliers. The inclusion of genre as a key variable throughout the visualization emphasizes its importance in shaping movie performance.
</details>
Figure 6: Case Study 2: Visualization Generation. (A–B) \sysName enables users to explore and compare different workflows for generating data-driven visual stories from a given dataset. (C–D) Example outputs from these workflows. (E) Directly prompting GPT-4o generates visualizations irrelevant to the data story topic. Due to space constraints, detailed text narration for each visualization is not included.
As shown in Fig. 6.A, the user explores a variety of task planning and agent configurations. One specific task planning option, Flow 5, is explored more extensively, indicated by its five child nodes in the hierarchical tree view. This workflow contains only two subtasks (represented by two arcs in the glyph), which the user favors due to lower latency. At the agent assignment level, the user evaluates multiple alternatives and selects only a subset to refine further at the agent optimization level, which is reflected by the fact that only certain glyphs have child nodes in the hierarchical tree. When the workflow has fewer subtasks, the user tends to prefer configurations with more agents per step (indicated by higher bars), such as choosing Flow 1-1 over 1-2 in Fig. 6.A. Conversely, for workflows with more subtasks, the user tends to favor configurations with fewer agents per step (indicated by shorter bars), such as selecting Flow 3-1 over 3-2.
To arrange and compare different workflows, the user configures the x- and y-axes of the scatter plot (Fig. 6 B). These axes can represent system-level metrics such as runtime and token usage, or custom metrics defined by the user, such as subjective ratings of output quality or the topic of the generated storytelling.
As shown in Fig. 6 B, the workflow outputs vary in both topic and quality. Glyphs at Level 2 (agent assignment) appear in the bottom gray area of the scatter plot, as they lack the topic attribute required for comparison. Their horizontal positions reflect the average user rating of each workflow. Interestingly, in this experiment, neither increasing the number of steps nor adding more agents consistently led to better storytelling outcomes. Fig. 6.C–D present example outputs from two selected workflows, illustrating the variability in topic focus.
Comparing with one-pass LLM. When prompting a single LLM (GPT-4o), the model often failed to strictly follow instructions: create visualizations centered on a specific topic with a coherent narrative. For example, in our experiments, GPT-4o generated a data-driven story titled “Behind the Scene: Unpacking Movie Box Office Performance”. However, the outputs included unrelated visualizations that were not aligned with the intended focus, such as a scatter plot comparing Rotten Tomatoes Rating against IMDB Rating for each movie (Fig. 6.E). In contrast, \sysName supports focused, modular task decomposition, enabling users to guide narrative flow, specify visualization goals, and experiment with structure, all of which contribute to higher coherence and alignment with user intent.
5 User Studies
To evaluate how \sysName supports the design experience of creating multi-agent workflows, we conducted an observational study comparing it against LangGraph Studio [25], a widely-used state-of-the-art interface for creating multi-agent workflows.
5.1 Study Design
Participants. We recruited nine participants (seven male, two female; seven aged 18–24, two aged 25–34) via email list and personal contact. All participants have prior knowledge about multi-agent LLM workflows but had no prior exposure to this project. Each study session lasted approximately one hour, and participants received a $10 Amazon gift card as compensation. The study was approved by the Institutional Review Board, and all participants signed an informed consent form.
Baseline. For the baseline condition, we used LangGraph Studio (Fig. 7), a visual programming tool for building and executing multi-agent workflows. While highly expressive and widely adapted, LangGraph Studio does not provide structured design scaffolding or exploratory support, which are key features of \sysName.
<details>
<summary>x15.png Details</summary>
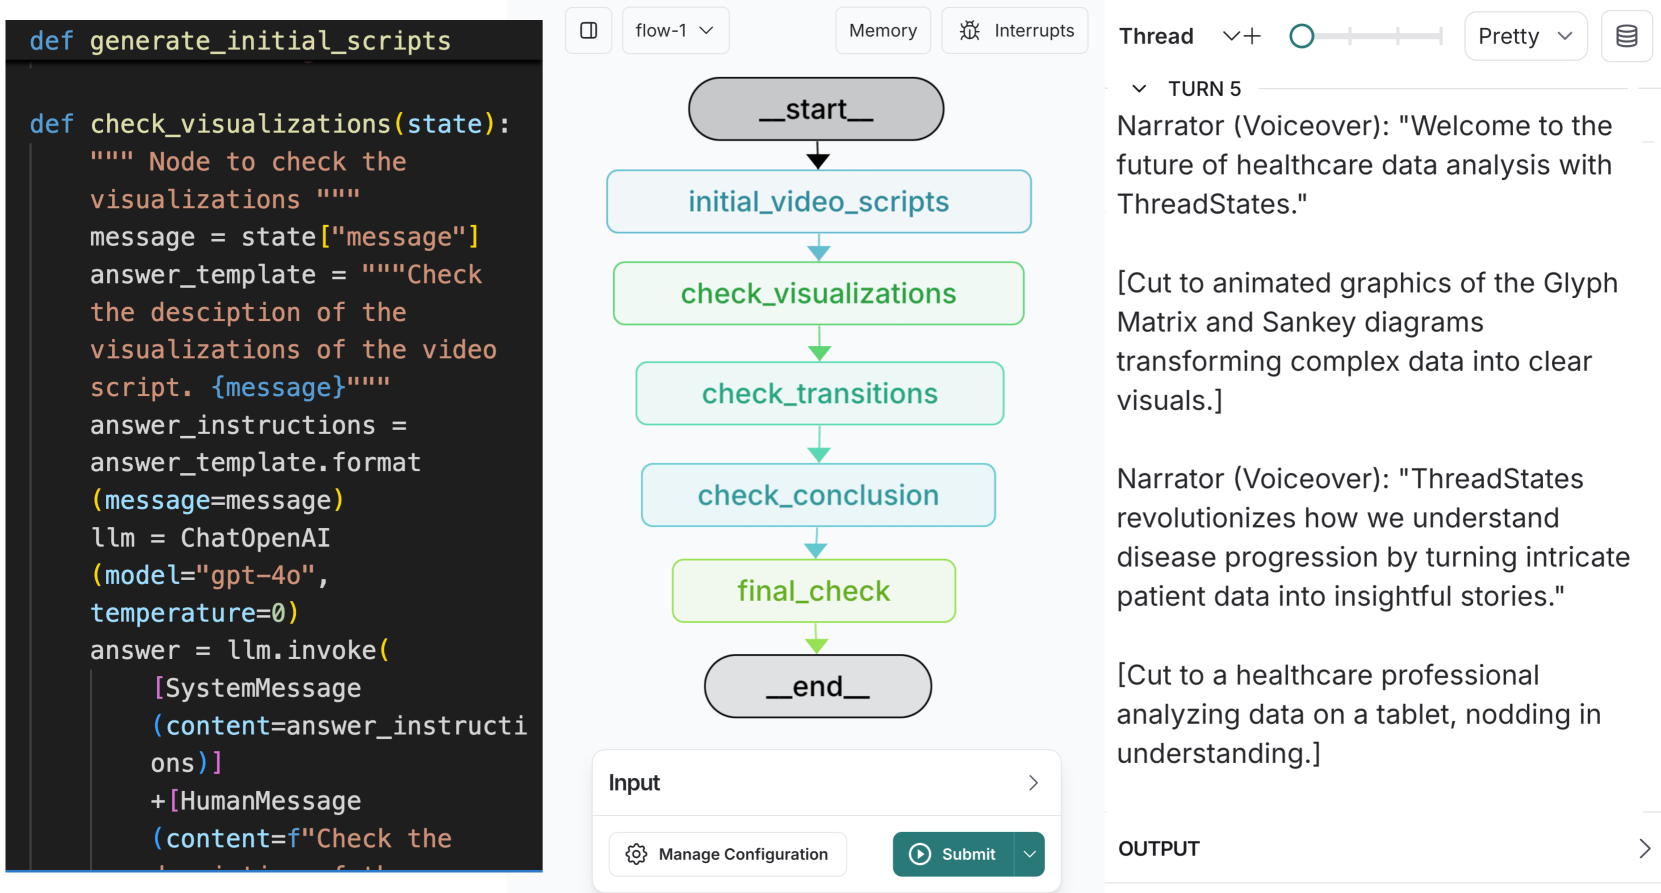
### Visual Description
\n
## Diagram: Flowchart of Video Script Generation and Visualization Check
### Overview
This image depicts a flowchart illustrating the process of generating initial video scripts, checking visualizations within those scripts, and finalizing the script. The flowchart uses rounded rectangles to represent process steps and arrows to indicate the flow of execution. The right side of the image shows a transcript of a voiceover narration associated with the process.
### Components/Axes
The diagram consists of the following components:
* **Start Node:** Labeled "_start_"
* **Process Nodes:**
* "initial_video_scripts"
* "check_visualizations"
* "check_transitions"
* "check_conclusion"
* "final_check"
* "_end_"
* **Input Node:** Labeled "Input"
* **Arrows:** Indicate the flow direction between nodes.
* **Right Panel:** Contains a transcript of "TURN 5" with "Narrator (Voiceover)" and associated scene descriptions.
* **Top Bar:** Contains controls for "flow-1", "Memory", "Interrupts", "Thread", "+", "O", and "Pretty".
* **Bottom Bar:** Contains "Manage Configuration" and "Submit" buttons.
### Detailed Analysis or Content Details
The flowchart demonstrates a linear process:
1. The process begins at "_start_".
2. It proceeds to "initial_video_scripts".
3. Next, it moves to "check_visualizations".
4. Then to "check_transitions".
5. Followed by "check_conclusion".
6. Then to "final_check".
7. Finally, it ends at "_end_".
The "check_visualizations" node is associated with the following Python code snippet:
```python
def check_visualizations(state):
""" Node to check the visualizations """
message = state["message"]
answer_template = """Check the description of the visualizations of the video script. {message}"""
answer_instructions = answer_template.format(message=message)
llm = OpenAI(model="gpt-4o", temperature=0)
answer = llm.invoke([SystemMessage(content=answer_instructions) + HumanMessage(content=f"Check the {message}")])
```
The right panel displays the following narration:
* **TURN 5**
* **Narrator (Voiceover):** "Welcome to the future of healthcare data analysis with ThreadStates."
* "[Cut to animated graphics of the Glyph Matrix and Sankey diagrams transforming complex data into clear visuals.]"
* **Narrator (Voiceover):** "ThreadStates revolutionizes how we understand disease progression by turning intricate patient data into insightful stories."
* "[Cut to a healthcare professional analyzing data on a tablet, nodding in understanding.]"
* **OUTPUT**
### Key Observations
The flowchart clearly outlines a sequential process for video script creation and quality control, specifically focusing on the visualization aspect. The Python code snippet suggests the use of OpenAI's GPT-4o model to evaluate the descriptions of the visualizations. The narration highlights the application of ThreadStates in healthcare data analysis.
### Interpretation
The diagram illustrates a workflow designed to ensure the quality and relevance of visualizations within a video script. The integration of an LLM (GPT-4o) suggests an automated approach to evaluating whether the visualizations effectively communicate the intended message. The narration emphasizes the value proposition of ThreadStates – transforming complex healthcare data into understandable insights. The flowchart and narration are likely components of a larger system for automated video content generation or quality assurance. The use of "TURN 5" suggests this is part of a larger sequence of script iterations or revisions. The "Input" node implies that the process is triggered by some external input, likely a draft script or a request for visualization review.
</details>
Figure 7: User Study Baseline. We use LangGraph Studio as the baseline system in the user study.
<details>
<summary>x16.png Details</summary>
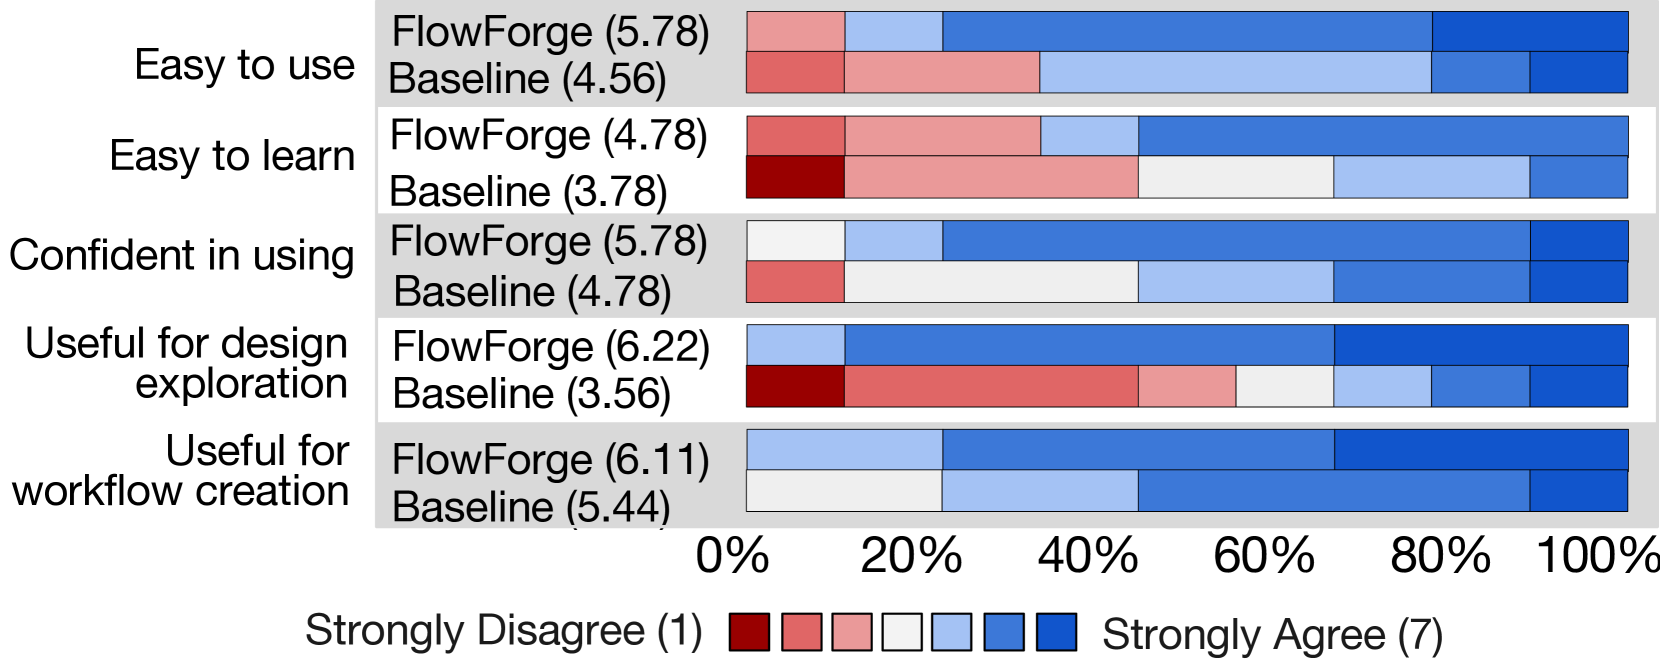
### Visual Description
\n
## Stacked Bar Chart: User Feedback Comparison - FlowForge vs. Baseline
### Overview
This is a stacked horizontal bar chart comparing user feedback on FlowForge and a Baseline system across five different aspects: ease of use, ease to learn, confidence in using, usefulness for design exploration, and usefulness for workflow creation. The chart displays the percentage of respondents who selected each level of agreement on a 7-point Likert scale, ranging from "Strongly Disagree" (1) to "Strongly Agree" (7). Average scores are provided in parentheses next to each system name.
### Components/Axes
* **Y-axis:** Lists the five evaluation criteria: "Easy to use", "Easy to learn", "Confident in using", "Useful for design exploration", and "Useful for workflow creation".
* **X-axis:** Represents the percentage of respondents, ranging from 0% to 100%.
* **Legend (bottom-center):** Maps colors to the Likert scale responses:
* Red: Strongly Disagree (1)
* Light Red: Disagree (2)
* White: Neutral (4)
* Light Blue: Agree (5)
* Blue: Strongly Agree (7)
* **Data Series:** Two data series are presented: "FlowForge" and "Baseline". Average scores are displayed next to each series name.
* FlowForge Average Scores: 5.78, 4.78, 5.78, 6.22, 6.11
* Baseline Average Scores: 4.56, 3.78, 4.78, 3.56, 5.44
### Detailed Analysis
Here's a breakdown of the data for each criterion, analyzing both FlowForge and Baseline:
1. **Easy to Use:**
* FlowForge: Approximately 10% Strongly Disagree, 10% Disagree, 30% Neutral, 30% Agree, 20% Strongly Agree.
* Baseline: Approximately 20% Strongly Disagree, 20% Disagree, 30% Neutral, 20% Agree, 10% Strongly Agree.
2. **Easy to Learn:**
* FlowForge: Approximately 10% Strongly Disagree, 10% Disagree, 30% Neutral, 30% Agree, 20% Strongly Agree.
* Baseline: Approximately 20% Strongly Disagree, 20% Disagree, 30% Neutral, 20% Agree, 10% Strongly Agree.
3. **Confident in Using:**
* FlowForge: Approximately 10% Strongly Disagree, 10% Disagree, 30% Neutral, 30% Agree, 20% Strongly Agree.
* Baseline: Approximately 20% Strongly Disagree, 20% Disagree, 30% Neutral, 20% Agree, 10% Strongly Agree.
4. **Useful for Design Exploration:**
* FlowForge: Approximately 10% Strongly Disagree, 10% Disagree, 20% Neutral, 30% Agree, 30% Strongly Agree.
* Baseline: Approximately 30% Strongly Disagree, 20% Disagree, 20% Neutral, 20% Agree, 10% Strongly Agree.
5. **Useful for Workflow Creation:**
* FlowForge: Approximately 0% Strongly Disagree, 10% Disagree, 20% Neutral, 30% Agree, 40% Strongly Agree.
* Baseline: Approximately 10% Strongly Disagree, 20% Disagree, 20% Neutral, 30% Agree, 20% Strongly Agree.
### Key Observations
* FlowForge consistently receives higher ratings than the Baseline across all five criteria.
* The largest difference in perception is regarding "Useful for Workflow Creation," where FlowForge has a significantly higher percentage of "Strongly Agree" responses (40%) compared to the Baseline (20%).
* The Baseline consistently has a higher percentage of "Strongly Disagree" responses than FlowForge, particularly for "Useful for Design Exploration" (30%).
* The "Neutral" response (white) is consistently around 20-30% for both systems, indicating a substantial portion of users who neither strongly agree nor disagree.
### Interpretation
The data strongly suggests that users perceive FlowForge as superior to the Baseline system in terms of usability, learnability, confidence, and usefulness for both design exploration and workflow creation. The higher average scores for FlowForge corroborate this observation. The significant difference in "Useful for Workflow Creation" suggests that FlowForge excels in facilitating the development of automated processes. The relatively high percentage of neutral responses indicates that there is room for improvement in both systems to move users towards stronger positive or negative opinions. The Baseline system appears to have more detractors (Strongly Disagree) than FlowForge, indicating potential areas for critical improvement. This data could be used to justify further investment in FlowForge development and to identify specific areas where the Baseline system needs to be addressed.
</details>
Figure 8: User Ratings. Comparison of \sysName and the baseline system based on post-study questionnaire responses. Participants rated each item on a 7-point Likert scale ranging from strongly disagree (1) to strongly agree (7). Numbers in parentheses indicate the average rating.
Task & Study Procedure. In both conditions (\sysName vs. baseline), participants created workflows for the same task: generating scripts for a 25-second fast-forward video that introduces a research paper. Prior to the study, participants received comprehensive orientation including task explanation, example papers for workflow evaluation, and detailed prompting specifications describing the desired outputs. During the study, participants completed both conditions in randomized order to control for potential learning effects. Targeted tutorials and demonstrations for the corresponding system are provided before beginning each condition. In both conditions, participants constructed workflows from scratch without any default templates, with explicit encouragement to create and compare multiple workflows. The session of a condition ended when participants expressed satisfaction with their results or upon reaching the 25-minute time limit, whichever occurred first. Participants were instructed to think aloud throughout the sessions and can ask questions freely at any time. After two conditions, participants completed a usability questionnaire and a post-study interview.
Data Analysis. We analyzed (i) the workflows created by participants, including the time participants spent creating them and their overall quality; (ii) self-reported usability ratings for both systems; and (iii) participants’ think-aloud protocols, interactions during the study, and qualitative feedback from post-study interviews.
5.2 Quantitative Results
Our quantitative evaluations demonstrated that \sysName outperformed the baseline system, delivering improvements in both user experience and workflow creation efficiency.
First, \sysName led to improved user experience in creating LLM workflows. Fig. 8 presents participants’ subjective ratings comparing \sysName and the baseline across five dimensions related to usability and utility. Overall, \sysName was rated more favorably. Participants found it easier to use, with a higher proportion agreeing or strongly agreeing that they would not require technical support to operate the system. They also reported greater confidence when using \sysName, as well as stronger agreement on its usefulness for both exploring alternative workflows and executing them.
<details>
<summary>x17.png Details</summary>
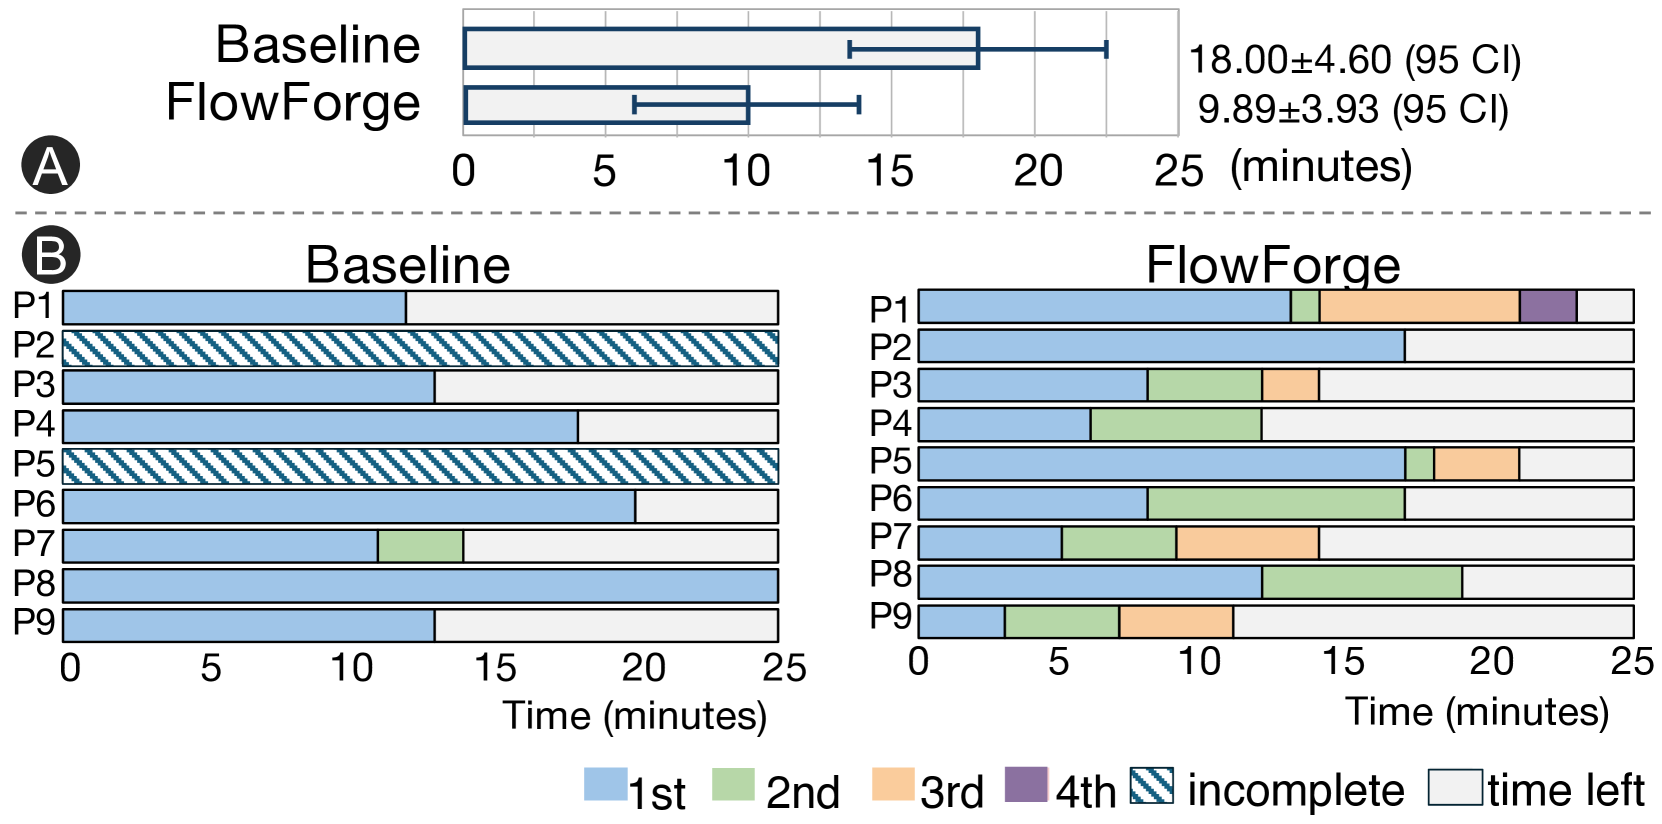
### Visual Description
\n
## Gantt Chart: Baseline vs. FlowForge Task Completion Times
### Overview
The image presents a comparison of task completion times between a "Baseline" method and a "FlowForge" method. It consists of a summary bar chart (A) showing average completion times with confidence intervals, and a detailed Gantt chart (B) illustrating the completion times for nine individual tasks (P1-P9) under each method.
### Components/Axes
* **X-axis (both charts):** Time in minutes, ranging from 0 to 25.
* **Y-axis (Gantt chart):** Task identifier (P1 to P9).
* **Summary Chart:** Two horizontal bars representing Baseline and FlowForge, with error bars indicating 95% confidence intervals.
* **Gantt Chart Legend:**
* 1st (Light Blue)
* 2nd (Medium Blue)
* 3rd (Yellow)
* 4th (Light Green)
* Incomplete (Orange)
* Time Left (White)
* **Labels:** "Baseline", "FlowForge", "Time (minutes)", "P1" through "P9".
* **Summary Data:** "18.0±4.60 (95 CI)" for Baseline, "9.89±3.93 (95 CI)" for FlowForge.
### Detailed Analysis or Content Details
**Summary Chart (A):**
* Baseline: The bar extends from approximately 10 minutes to 23 minutes, with a mean of 18.0 minutes and a 95% confidence interval of ±4.60 minutes.
* FlowForge: The bar extends from approximately 5 minutes to 15 minutes, with a mean of 9.89 minutes and a 95% confidence interval of ±3.93 minutes.
**Gantt Chart (B) - Baseline:**
* P1: Completed in approximately 5 minutes (1st stage - Light Blue).
* P2: Completed in approximately 10 minutes (1st stage - Light Blue).
* P3: Completed in approximately 15 minutes (1st stage - Light Blue).
* P4: Completed in approximately 18 minutes (1st and 2nd stage - Light and Medium Blue).
* P5: Completed in approximately 20 minutes (1st and 2nd stage - Light and Medium Blue).
* P6: Completed in approximately 22 minutes (1st, 2nd and 3rd stage - Light, Medium and Yellow Blue).
* P7: Completed in approximately 23 minutes (1st, 2nd and 3rd stage - Light, Medium and Yellow Blue).
* P8: Completed in approximately 24 minutes (1st, 2nd and 3rd stage - Light, Medium and Yellow Blue).
* P9: Completed in approximately 25 minutes (1st, 2nd, 3rd and 4th stage - Light, Medium, Yellow and Light Green).
**Gantt Chart (B) - FlowForge:**
* P1: Completed in approximately 2 minutes (1st stage - Light Blue).
* P2: Completed in approximately 3 minutes (1st stage - Light Blue).
* P3: Completed in approximately 4 minutes (1st stage - Light Blue).
* P4: Completed in approximately 5 minutes (1st stage - Light Blue).
* P5: Completed in approximately 6 minutes (1st stage - Light Blue).
* P6: Completed in approximately 7 minutes (1st stage - Light Blue).
* P7: Completed in approximately 8 minutes (1st stage - Light Blue).
* P8: Completed in approximately 10 minutes (1st and 2nd stage - Light and Medium Blue).
* P9: Completed in approximately 22 minutes (1st, 2nd, 3rd, 4th and incomplete stage - Light, Medium, Yellow, Light Green and Orange).
### Key Observations
* FlowForge consistently demonstrates faster task completion times compared to the Baseline method.
* The confidence intervals for both methods overlap, but the FlowForge interval is significantly smaller, suggesting more consistent performance.
* In the Baseline method, tasks generally require multiple stages (1st, 2nd, 3rd, 4th) to complete, while FlowForge tasks are often completed within the 1st or 2nd stage.
* Task P9 in FlowForge is the only one marked as "incomplete" (orange), and also has a significant amount of "time left" (white).
### Interpretation
The data strongly suggests that FlowForge is a more efficient method for completing these tasks than the Baseline method. The lower average completion time and smaller confidence interval indicate both faster speed and greater consistency. The Gantt chart visually reinforces this, showing that FlowForge tasks progress through stages more quickly. The incomplete status of P9 under FlowForge could indicate a specific issue with that task or a limitation of the method in certain scenarios. The use of multiple stages in the Baseline method suggests a more complex or iterative process, while FlowForge appears to streamline the workflow. The difference in completion times is substantial, suggesting a significant improvement in efficiency with FlowForge. The confidence intervals, while overlapping, still point to a clear advantage for FlowForge.
</details>
Figure 9: Workflow Creation Time and Quantity. (A) Users spent less time creating their first runnable workflow in \sysName compared to the baseline. Error bars indicate 95% confidence intervals (CI). (B) Users created more workflows in \sysName compared with the baseline.
Second, \sysName enabled more efficient workflow creation with more diverse designs. Fig. 9 presents participants’ workflow creation time. Participants spent on average 9.89 (95% CI: 5.96-13.82) minutes to create and run the first workflow in \sysName, and 18.0 (95% CI: 13.40-22.60) minutes in the baseline. Student’s t-test showed a significant difference between their completion time for the first workflow (t =-8.1, p =.003). Most (8/9) of the participants were able to create and explore more than one workflow in \sysName after the initial try, while some participants (2) failed to create a workflow in the baseline. For participants who did not finish, 25 minutes (maximum allowed time per session) was used as their estimated completion time.
To evaluate workflow diversity, we conducted a manual analysis of workflows created by participants across both conditions. While workflows created in both conditions contained a similar number of subtasks (baseline: 3.43, \sysName: 3.89), \sysName produced more parallel subtasks (3) than the baseline (1). Participants also created more diverse agent communications using \sysName. Using \sysName, participants implemented a variety of agent communication patterns (7 reflection, 5 supervision, 7 redundancy, 8 discussion, out of 35 total instances). In contrast, baseline workflows exclusively employed single-agent across all 22 instances.
5.3 Observations and Feedback
Based on the think-aloud comments and interviews, we reported how participants approached workflow creation across the two conditions.
Across both conditions, participants prioritized creating an initial functional workflow before exploring alternatives. Participants appreciated the guidance provided at each level. They noted that while Levels 2 and 3 of the design guidance were more “technically oriented”, Level 1 introduced innovative concepts that were accessible and valuable even without specialized AI knowledge.
Participants demonstrated iterative workflow design behaviors in both conditions, yet their approaches differed substantially. In the baseline condition, participants typically constructed workflows with only one or two sequential subtasks. When refining these workflows, they focused exclusively on prompt refinement for individual agents while maintaining the original workflow structure unchanged. When using \sysName, participants exhibited broader explorations. Most participants (8/9) explored different task planning (level 1) to generate alternative workflows and compare workflows based on key dimensions such as output quality and latency. Two participants made strategic modifications when encountering performance issues. Informed by the design cards at level 3, P5 improved output quality by incorporating detailed domain expertise into agent personas. Through analysis of latency of different design patterns in the Design Space View, P9 transitioned from the Discussion pattern to Redundant and restructured task planning to enable parallel subtask execution, successfully reducing execution time while preserving output quality.
6 Discussion
6.1 Design Implications.
We reflect on the design implications of \sysName by connecting it with previous visualization tools developed for AI research.
Design Space Visualization. This work presents an initial exploration of using design space visualization to support the navigation and construction of complex multi-agent workflows. Although visualization of the design space has been shown as an effective approach in AI applications such as deep neural network design [50], automated machine learning [49], and neural architecture search [56], it has not yet been applied to the emerging context of multi-agent LLM workflows. This new context presents unique opportunities. Compared to traditional AI development, which often requires deep technical expertise to understand the design space, LLM workflows significantly lower the barrier to entry, allowing a broader range of end users to design AI-driven systems. As this shift moves design tools from expert-centric to end-user-facing contexts, visualization must evolve to offer greater clarity and interpretability.
Thinking Scaffold for both LLMs and humans. While \sysName is designed for building multi-agent workflows, we observed that human users also benefit from the thinking scaffold it provides, particularly in open-ended and creative tasks (e.g., creatively crafting fast-forward videos using character and plot elements in Section 4.1). By explicitly visualizing workflows, users engage in cognitive externalization that aligns with extended mind theory, where cognitive processes are distributed across both internal mental representations and external artifacts, making it easier to brainstorm effectively with LLMs.
This approach represents a different perspective from traditional visualization for AI interpretability, which has focused on visualizing low-level computational processes (e.g., neuron activations) [23, 30, 31]. The emerging of LLMs has enabled new interpretability opportunities by exporting reasoning in workflows and agent interactions [54]. Interactive visualizations of these reasoning processes can thus serve as accessible collaborative interfaces moving beyond expert-only tools.
6.2 Limitations and Future Directions.
First, \sysName does not cover the full spectrum of workflow designs and application scenarios. Regarding workflow architecture, \sysName focuses on workflows with static or conditional communication protocols but does not support dynamic architecture modifications during execution. For example, the system cannot support workflows that undergo real-time architecture revision based on human-in-the-loop interventions [47] or agent feedback [22]. Regarding application scenarios, \sysName is specifically designed for structured problem-solving tasks rather than world simulation applications [51, 19], which may require fundamentally different architectural considerations and interaction patterns.
Second, in \sysName, we used straightforward prompting techniques for task decomposition and design pattern recommendation, as the primary focus of this study is to demonstrate the benefits of visualizing and interacting with the design space during workflow exploration. We acknowledge that the quality of generated workflows would be further improved with more advanced methods, such as using reinforcement learning to optimize the workflow design.
Finally, in spite of the intuitiveness and effectiveness, the three-level abstraction of design space is not the only viable scaffold and can be further enhanced. For example, Liu et al.. [57] proposed a decision tree that covers key decisions for designing multi-agent LLM systems. Compared to these alternatives, our method aims to strike a balance between expressiveness (\ie, enabling diverse workflow constructions) and conciseness (\ie, avoiding excessive complexity). There are several promising directions for further enhancing this abstraction. Each level may benefit from further decomposition into sublevels that capture more nuanced design choices. For example, the task planning level may involve sub-levels such as failure handling mechanism. Meanwhile, additional support can be provided to capture the inter-level dependencies and facilitate design iterations across abstraction levels [14], such as revisiting task planning decisions based on agent optimization.
7 Conclusion
This study presents \sysName, an interactive visualization tool that supports the creation of multi-agent LLM workflows by organizing the levels and dimensions of the design space, visualizing the design space and the various solutions within it, and integrating in-situ guidance from well-established design patterns in design exploration. Our evaluation demonstrated that \sysName improved user experience, increased workflow creation efficiency, and enhanced the diversity of created workflows. This work highlights the potential of design space visualization as a thinking scaffold for both LLMs and human designers in complex LLM system development.
References
- [1] Cellum. Purpose-Built GUI and SDK for AI Development. https://www.vellum.ai/.
- [2] CrewAI: Build AI agent teams that work together to tackle complex tasks. https://docs.crewai.com/introduction.
- [3] Rivet. The Open-Source Visual AI Programming Environment. https://rivet.ironcladapp.com/.
- [4] Amazon. Multi-Agent Orchestrator framework. https://awslabs.github.io/multi-agent-orchestrator/.
- [5] Anthropic. Building Effective Agents. https://www.anthropic.com/research/building-effective-agents, 2024.
- [6] M. Bostock, V. Ogievetsky, and J. Heer. D3 Data-Driven Documents. IEEE Transactions on Visualization and Computer Graphics, 17(12):2301–2309, 2011. doi: 10 . 1109/TVCG . 2011 . 185
- [7] S. Brade, B. Wang, M. Sousa, S. Oore, and T. Grossman. Promptify: Text-to-Image Generation through Interactive Prompt Exploration with Large Language Models. In Proceedings of the 36th Annual ACM Symposium on User Interface Software and Technology, UIST ’23, article no. 96, 14 pages. ACM, New York, 2023. doi: 10 . 1145/3586183 . 3606725
- [8] B. Buxton. Sketching user experiences: getting the design right and the right design. Morgan Kaufmann, San Francisco, 2010. doi: 10 . 1016/B978-0-12-374037-3 . X5043-3
- [9] M. Cemri, M. Z. Pan, S. Yang, L. A. Agrawal, B. Chopra, R. Tiwari, K. Keutzer, A. Parameswaran, D. Klein, K. Ramchandran, M. Zaharia, J. E. Gonzalez, and I. Stoica. Why Do Multi-Agent LLM Systems Fail?, 2025. doi: 10 . 48550/arXiv . 2503 . 13657
- [10] C.-M. Chan, W. Chen, Y. Su, J. Yu, W. Xue, S. Zhang, J. Fu, and Z. Liu. ChatEval: Towards Better LLM-based Evaluators through Multi-Agent Debate, 2023. doi: 10 . 48550/arXiv . 2308 . 07201
- [11] V. Dibia, J. Chen, G. Bansal, S. Syed, A. Fourney, E. Zhu, C. Wang, and S. Amershi. AUTOGEN STUDIO: A No-Code Developer Tool for Building and Debugging Multi-Agent Systems. In D. I. Hernandez Farias, T. Hope, and M. Li, eds., Proceedings of the 2024 Conference on Empirical Methods in Natural Language Processing: System Demonstrations, pp. 72–79. Association for Computational Linguistics, Miami, 2024. doi: 10 . 18653/v1/2024 . emnlp-demo . 8
- [12] Y. Du, S. Li, A. Torralba, J. B. Tenenbaum, and I. Mordatch. Improving Factuality and Reasoning in Language Models through Multiagent Debate. In Proceedings of the 41st International Conference on Machine Learning, ICML’24, article no. 467, 31 pages. JMLR.org, 2024. doi: 10 . 5555/3692070 . 3692537
- [13] B. Effect. Manus AI: A General AI Agent. https://manus.im/. Accessed: 2025-03-18.
- [14] W. Epperson, G. Bansal, V. C. Dibia, A. Fourney, J. Gerrits, E. Zhu, and S. Amershi. Interactive debugging and steering of multi-agent ai systems. In Proceedings of the 2025 CHI Conference on Human Factors in Computing Systems, pp. 1–15, 2025.
- [15] Y. Feng, X. Wang, K. K. Wong, S. Wang, Y. Lu, M. Zhu, B. Wang, and W. Chen. PromptMagician: Interactive Prompt Engineering for Text-to-Image Creation . IEEE Transactions on Visualization and Computer Graphics, 30(01):295–305, 2024. doi: 10 . 1109/TVCG . 2023 . 3327168
- [16] W. GmbH. React Flow: A library for building node-based UIs. https://reactflow.dev/, 2024. Accessed: 2025-03-26.
- [17] J. Gottweis, W.-H. Weng, A. Daryin, T. Tu, A. Palepu, P. Sirkovic, A. Myaskovsky, F. Weissenberger, K. Rong, R. Tanno, et al. Towards an AI co-scientist, 2025. doi: 10 . 48550/arXiv . 2502 . 18864
- [18] M. Grunde-McLaughlin, M. S. Lam, R. Krishna, D. S. Weld, and J. Heer. Designing LLM Chains by Adapting Techniques from Crowdsourcing Workflows. ACM Transactions on Computer-Human Interaction, 32(3), article no. 27, 57 pages, 2025. doi: 10 . 1145/3716134
- [19] T. Guo, X. Chen, Y. Wang, R. Chang, S. Pei, N. V. Chawla, O. Wiest, and X. Zhang. Large Language Model based Multi-Agents: A Survey of Progress and Challenges, 2024. doi: 10 . 48550/arXiv . 2402 . 01680
- [20] M. Heidegger. The Question Concerning Technology, and Other Essays. Harper & Row, New York, 1977.
- [21] S. Hong, M. Zhuge, J. Chen, X. Zheng, Y. Cheng, J. Wang, C. Zhang, Z. Wang, S. K. S. Yau, Z. Lin, L. Zhou, C. Ran, L. Xiao, C. Wu, and J. Schmidhuber. MetaGPT: Meta Programming for A Multi-Agent Collaborative Framework. In The Twelfth International Conference on Learning Representations, 2024. doi: 10 . 48550/arXiv . 2308 . 00352
- [22] S. Hu, C. Lu, and J. Clune. Automated Design of Agentic Systems, 2024. doi: 10 . 48550/arXiv . 2408 . 08435
- [23] Z. Jin, Y. Wang, Q. Wang, Y. Ming, T. Ma, and H. Qu. GNNLens: A visual analytics approach for prediction error diagnosis of graph neural networks. IEEE Transactions on Visualization and Computer Graphics, 29(6):3024–3038, 2022. doi: 10 . 1109/TVCG . 2022 . 3148107
- [24] LangChain. LangGraph. Building language agents as graphs.
- [25] LangChain. LangGraph Studio: The first agent IDE. https://blog.langchain.dev/langgraph-studio-the-first-agent-ide/.
- [26] LangChain. Multi-agent Systems. https://langchain-ai.github.io/langgraph/concepts/multi_agent/.
- [27] LangChain. Multi-agent Workflows. https://langchain-ai.github.io/langgraph/tutorials/workflows/.
- [28] G. Li, H. A. Al Kader Hammoud, H. Itani, D. Khizbullin, and B. Ghanem. CAMEL: Communicative Agents for "Mind" Exploration of Large Language Model Society. In Proceedings of the 37th International Conference on Neural Information Processing Systems, NIPS ’23, article no. 2264, 18 pages. Curran Associates Inc., Red Hook, 2023. doi: 10 . 5555/3666122 . 3668386
- [29] T. Liang, Z. He, W. Jiao, X. Wang, Y. Wang, R. Wang, Y. Yang, S. Shi, and Z. Tu. Encouraging Divergent Thinking in Large Language Models through Multi-Agent Debate. In Y. Al-Onaizan, M. Bansal, and Y.-N. Chen, eds., Proceedings of the 2024 Conference on Empirical Methods in Natural Language Processing, pp. 17889–17904. Association for Computational Linguistics, Miami, Florida, USA, 2024. doi: 10 . 18653/v1/2024 . emnlp-main . 992
- [30] M. Liu, J. Shi, Z. Li, C. Li, J. Zhu, and S. Liu. Towards better analysis of deep convolutional neural networks. IEEE Transactions on Visualization and Computer Graphics, 23(1):91–100, 2016. doi: 10 . 1109/TVCG . 2016 . 2598831
- [31] Y. Lu, C. Chen, Y. Chen, K. Huang, M. Zitnik, and Q. Wang. Gnn 101: Visual learning of graph neural networks in your web browser. arXiv preprint arXiv:2411.17849, 2024. doi: 10 . 48550/arXiv . 2411 . 17849
- [32] Microsoft AutoGen. Conversation Patterns. https://microsoft.github.io/autogen/0.2/docs/tutorial/conversation-patterns/.
- [33] Microsoft AutoGen. Multi-Agent Design Patteamrns. https://microsoft.github.io/autogen/stable/user-guide/core-user-guide/design-patterns/intro.html.
- [34] T. Munzner. A nested model for visualization design and validation. IEEE Transactions on Visualization and Computer Graphics, 15(6):921–928, 2009.
- [35] R. Nakano, J. Hilton, S. Balaji, J. Wu, L. Ouyang, C. Kim, C. Hesse, S. Jain, V. Kosaraju, W. Saunders, X. Jiang, K. Cobbe, T. Eloundou, G. Krueger, K. Button, M. Knight, B. Chess, and J. Schulman. WebGPT: Browser-assisted question-answering with human feedback, 2022. doi: 10 . 48550/arXiv . 2112 . 09332
- [36] B. Niu, Y. Song, K. Lian, Y. Shen, Y. Yao, K. Zhang, and T. Liu. Flow: Modularized Agentic Workflow Automation, 2025. doi: 10 . 48550/arXiv . 2501 . 07834
- [37] OpenAI. GPT-4o System Card, 2024. doi: 10 . 48550/arXiv . 2410 . 21276
- [38] J. S. Park, J. O’Brien, C. J. Cai, M. R. Morris, P. Liang, and M. S. Bernstein. Generative Agents: Interactive Simulacra of Human Behavior. In Proceedings of the 36th Annual ACM Symposium on User Interface Software and Technology, UIST ’23, article no. 2, 22 pages. ACM, New York, 2023. doi: 10 . 1145/3586183 . 3606763
- [39] J. R. Penadés, J. Gottweis, L. He, J. B. Patkowski, A. Shurick, W.-H. Weng, T. Tu, A. Palepu, A. Myaskovsky, A. Pawlosky, N. Vivek, K. Alan, and T. R. D. Costa. AI mirrors experimental science to uncover a novel mechanism of gene transfer crucial to bacterial evolution. bioRxiv, pp. 2025–02, 2025. doi: 10 . 1101/2025 . 02 . 19 . 639094
- [40] A. Prasad, A. Koller, M. Hartmann, P. Clark, A. Sabharwal, M. Bansal, and T. Khot. ADaPT: As-Needed Decomposition and Planning with Language Models. In K. Duh, H. Gomez, and S. Bethard, eds., Findings of the Association for Computational Linguistics: NAACL 2024, pp. 4226–4252. Association for Computational Linguistics, Mexico City, 2024. doi: 10 . 18653/v1/2024 . findings-naacl . 264
- [41] C. Qian, W. Liu, H. Liu, N. Chen, Y. Dang, J. Li, C. Yang, W. Chen, Y. Su, X. Cong, J. Xu, D. Li, Z. Liu, and M. Sun. ChatDev: Communicative Agents for Software Development. In L.-W. Ku, A. Martins, and V. Srikumar, eds., Proceedings of the 62nd Annual Meeting of the Association for Computational Linguistics (Volume 1: Long Papers), pp. 15174–15186. Association for Computational Linguistics, Bangkok, Thailand, 2024. doi: 10 . 18653/v1/2024 . acl-long . 810
- [42] N. Shinn, F. Cassano, E. Berman, A. Gopinath, K. Narasimhan, and S. Yao. Reflexion: Language Agents with Verbal Reinforcement Learning, 2023. doi: 10 . 48550/arXiv . 2303 . 11366
- [43] S. Suh, M. Chen, B. Min, T. J.-J. Li, and H. Xia. Luminate: Structured Generation and Exploration of Design Space with Large Language Models for Human-AI Co-Creation. In Proceedings of the 2024 CHI Conference on Human Factors in Computing Systems, CHI ’24, article no. 644, 26 pages. ACM, New York, 2024. doi: 10 . 1145/3613904 . 3642400
- [44] S. Suh, B. Min, S. Palani, and H. Xia. Sensecape: Enabling Multilevel Exploration and Sensemaking with Large Language Models. In Proceedings of the 36th Annual ACM Symposium on User Interface Software and Technology, UIST ’23, article no. 1, 18 pages. ACM, New York, 2023. doi: 10 . 1145/3586183 . 3606756
- [45] Vega-Lite. Movies dataset. https://vega.github.io/vega-lite/data/movies.json, 2017.
- [46] C. Wang, Q. Wu, and the AG2 Community. AG2: Open-Source AgentOS for AI Agents. https://docs.ag2.ai/, 2024. Available at https://docs.ag2.ai/.
- [47] L. Wang, C. Ma, X. Feng, Z. Zhang, H. Yang, J. Zhang, Z. Chen, J. Tang, X. Chen, Y. Lin, W. X. Zhao, Z. Wei, and J. Wen. A survey on large language model based autonomous agents. Frontiers of Computer Science, 18(6), 2024. doi: 10 . 1007/s11704-024-40231-1
- [48] Q. Wang, K. Huang, P. Chandak, M. Zitnik, and N. Gehlenborg. Extending the nested model for user-centric xai: A design study on gnn-based drug repurposing. IEEE Transactions on Visualization and Computer Graphics, 29(1):1266–1276, 2022. doi: 10 . 1109/TVCG . 2022 . 3209435
- [49] Q. Wang, Y. Ming, Z. Jin, Q. Shen, D. Liu, M. J. Smith, K. Veeramachaneni, and H. Qu. ATMSeer: Increasing Transparency and Controllability in Automated Machine Learning. In Proceedings of the 2019 CHI Conference on Human Factors in Computing Systems, CHI ’19, 12 pages, p. 1–12. ACM, New York, 2019. doi: 10 . 1145/3290605 . 3300911
- [50] Q. Wang, J. Yuan, S. Chen, H. Su, H. Qu, and S. Liu. Visual Genealogy of Deep Neural Networks. IEEE Transactions on Visualization and Computer Graphics, 26(11):3340–3352, 2020. doi: 10 . 1109/TVCG . 2019 . 2921323
- [51] Z. Wang, S. Cai, G. Chen, A. Liu, X. Ma, Y. Liang, and T. CraftJarvis. Describe, Explain, Plan and Select: Interactive Planning with Large Language Models Enables Open-World Multi-Task Agents. In Proceedings of the 37th International Conference on Neural Information Processing Systems, NIPS ’23, article no. 1480, 37 pages. Curran Associates Inc., Red Hook, 2023.
- [52] Q. Wu, G. Bansal, J. Zhang, Y. Wu, B. Li, E. Zhu, L. Jiang, X. Zhang, S. Zhang, J. Liu, et al. AutoGen: Enabling next-gen llm applications via multi-agent conversation. arXiv preprint arXiv:2308.08155, 2023. doi: 10 . 48550/arXiv . 2308 . 08155
- [53] T. Wu, E. Jiang, A. Donsbach, J. Gray, A. Molina, M. Terry, and C. J. Cai. PromptChainer: Chaining Large Language Model Prompts through Visual Programming. In Extended Abstracts of the 2022 CHI Conference on Human Factors in Computing Systems, CHI EA ’22, article no. 359, 10 pages. ACM, New York, 2022. doi: 10 . 1145/3491101 . 3519729
- [54] T. Wu, M. Terry, and C. J. Cai. AI Chains: Transparent and Controllable Human-AI Interaction by Chaining Large Language Model Prompts. In Proceedings of the 2022 CHI Conference on Human Factors in Computing Systems, CHI ’22, article no. 385, 22 pages. ACM, New York, 2022. doi: 10 . 1145/3491102 . 3517582
- [55] T. Wu, H. Zhu, M. Albayrak, A. Axon, A. Bertsch, W. Deng, Z. Ding, B. Guo, S. Gururaja, T.-S. Kuo, J. T. Liang, R. Liu, I. Mandal, J. Milbauer, X. Ni, N. Padmanabhan, S. Ramkumar, A. Sudjianto, J. Taylor, Y.-J. Tseng, P. Vaidos, Z. Wu, W. Wu, and C. Yang. LLMs as Workers in Human-Computational Algorithms? Replicating Crowdsourcing Pipelines with LLMs. In Proceedings of the Extended Abstracts of the CHI Conference on Human Factors in Computing Systems, CHI EA ’25, article no. 684, 10 pages. ACM, New York, 2025. doi: 10 . 1145/3706599 . 3706690
- [56] J. Yuan, M. Liu, F. Tian, and S. Liu. Visual Analysis of Neural Architecture Spaces for Summarizing Design Principles. IEEE Transactions on Visualization and Computer Graphics, 29(1):288–298, 2023. doi: 10 . 1109/TVCG . 2022 . 3209404
- [57] L. Yue, L. Sin Kit, L. Qinghua, Z. Liming, Z. Dehai, X. Xiwei, H. Stefan, and W. Jon. Agent Design Pattern Catalogue: A Collection of Architectural Patterns for Foundation Model based Agents. arXiv preprint arXiv: 2405.10467, 2024. doi: 10 . 48550/arXiv . 2405 . 10467
- [58] J. Zhang and I. Arawjo. ChainBuddy: An AI-assisted Agent System for Helping Users Set up LLM Pipelines. In Adjunct Proceedings of the 37th Annual ACM Symposium on User Interface Software and Technology, UIST Adjunct ’24, article no. 48, 3 pages. ACM, New York, 2024. doi: 10 . 1145/3672539 . 3686763
- [59] J. Zhang, J. Xiang, Z. Yu, F. Teng, X.-H. Chen, J. Chen, M. Zhuge, X. Cheng, S. Hong, J. Wang, B. Zheng, B. Liu, Y. Luo, and C. Wu. AFlow: Automating Agentic Workflow Generation. In The Thirteenth International Conference on Learning Representations, 2025. doi: 10 . 48550/arXiv . 2410 . 10762
- [60] S. Zhang, J. Zhang, J. Liu, L. Song, C. Wang, R. Krishna, and Q. Wu. Offline Training of Language Model Agents with Functions as Learnable Weights. In Proceedings of the 41st International Conference on Machine Learning, ICML’24, article no. 2496, 21 pages. JMLR.org, 2024.
- [61] L. Zheng, W.-L. Chiang, Y. Sheng, S. Zhuang, Z. Wu, Y. Zhuang, Z. Lin, Z. Li, D. Li, E. Xing, et al. Judging LLM-as-a-Judge with MT-Bench and chatbot arena. Advances in Neural Information Processing Systems, 36:46595–46623, 2023.
- [62] H. Zhou, X. Wan, R. Sun, H. Palangi, S. Iqbal, I. Vulić, A. Korhonen, and S. Ö. Arık. Multi-Agent Design: Optimizing Agents with Better Prompts and Topologies. arXiv preprint arXiv:2502.02533, 2025. doi: 10 . 48550/arXiv . 2502 . 02533
- [63] M. Zhuge, W. Wang, L. Kirsch, F. Faccio, D. Khizbullin, and J. Schmidhuber. GPTSwarm: Language Agents as Optimizable Graphs. In R. Salakhutdinov, Z. Kolter, K. Heller, A. Weller, N. Oliver, J. Scarlett, and F. Berkenkamp, eds., Proceedings of the 41st International Conference on Machine Learning, vol. 235 of Proceedings of Machine Learning Research, pp. 62743–62767. PMLR, 2024. doi: 10 . 48550/arXiv . 2402 . 16823