# PRACtical: Subarray-Level Counter Update and Bank-Level Recovery Isolation for Efficient PRAC Rowhammer Mitigation
**Authors**: Ravan Nazaraliyev Saber Ganjisaffar Nurlan Nazaraliyev Nael Abu-Ghazaleh
> University of California, Riversidernaza005, sganj003, nnaza008, naelag@ucr.edu
Abstract.
As DRAM density continues to scale, the Rowhammer vulnerability increases in severity due to heightened charge leakage, which lowers the activation threshold required to induce bit flips. To mitigate this risk, industry-standard solutions have shifted from memory controller-based row activation counters, which require large SRAM storage with significant area and power overheads, to in-DRAM row activation counters. The DDR5 JEDEC standard incorporates a modified DRAM architecture featuring per-row activation counters (PRAC) and an Alert Back-Off (ABO) signal that notifies the memory controller (MC) to trigger mitigation mechanisms. However, PRAC introduces a performance overheads by incrementing counters during the precharge operation, adding an additional delay to the precharge phase. Furthermore, when the ABO signal is triggered upon a row reaching the Alert threshold, RFM ab indiscriminately stalls all memory requests at the memory channel level, even when only a single bank is being accessed heavily, leading to unnecessary performance degradation. In this work, we propose PRACtical, an optimized approach to improving the performance of existing PRAC+ABO mechanisms while maintaining security guarantees. To reduce counter update latency, we introduce a centralized increment circuit, allowing the memory controller to proceed with subsequent activations to other subarrays without suffering the increment delays. To minimize unnecessary memory stalls and make the system resilient against memory performance attacks based on channel stalling upon Alert, we enhance RFM ab with bank-level granularity, enabling the memory controller to selectively stall only the affected banks rather than the entire memory channel. This is achieved by introducing a register in the DRAM that shows the banks under attack upon an Alert signal. Our proposed techniques improve the performance over state of the art opportunistic PRAC and ABO, by 8% (20% max). Additionally, PRACtical saves an average of 19% energy relative to PRAC+ABO. PRACtical is resilient to performance attacks, showing less than 6% slowdown on an aggressive performance attack, while providing the same security as PRAC+ABO.
DRAM, Rowhammer, PRAC, ABO
1. Introduction
Rowhammer (Cojocar et al., 2019; de Ridder et al., 2021; Mutlu and Kim, 2019; Kim et al., 2014a) is a well-known serious vulnerability affecting DRAM: repeated access to one or more target rows can induce bit flips in adjacent rows. The bit flips occur due to charge leakage from repeated activations of a DRAM row, which can accelerate charge leakage in nearby memory cells, causing their state to change. When a row is activated a sufficient number of times within a single refresh interval, it may corrupt the contents of nearby rows. The estimated minimum number of such activations that could induce a bit flip is referred to as the Rowhammer Threshold, denoted by $N_{\mathrm{RH}}$ . As DRAM technology has scaled to smaller feature sizes, $N_{\mathrm{RH}}$ has significantly decreased—from approximately 140K activations in earlier DDR3 devices to as low as 4.8K in LPDDR4 modules (Kim et al., 2014a, 2020); it is expected to drop further in future generations. Concerningly, the significant drop in $N_{\mathrm{RH}}$ leads to a noticeable increase in the frequency of DRAM bit flips (Loughlin et al., 2021). Accordingly, mitigation strategies must continuously evolve to remain effective against increasingly demanding and sophisticated threat conditions.
DRAM plays a critical role in determining the performance of memory-intensive workloads, leading to the well known memory wall (Wulf and McKee, 1995; Gholami et al., 2024; Ghose et al., 2019). As Rowhammer threats continue to increase with memory scaling, the proposed mitigations have come at a substantial cost to DRAM performance. JEDEC (JEDEC, 2024a) has recently introduced a new standard mitigation mechanism for the Rowhammer vulnerability in DDR5 memory devices. This mechanism incorporates two key components: Per-Row Activation Counters (PRAC) (JEDEC, 2024b) and Alert Back-Off (ABO) protocol. PRAC, inspired by the Panopticon framework (Bennett et al., 2021), implements an in-DRAM architectural enhancement where each row is extended to store an activation counter. When the number of activations to a row exceeds a predefined Alert threshold, the mechanism should trigger mitigation for that row and its neighboring rows. This mechanism enables localized, row-level tracking without incurring the area and power overhead associated with external SRAM-based counters (Qureshi, [n. d.]; Saxena and Qureshi, 2024). The ABO protocol (JEDEC, 2024b) complements PRAC by providing a signaling mechanism through which the DRAM device can notify the memory controller (MC) when a critical activation threshold is crossed. The MC sends all-bank RFM (RFM ab) triggering targeted refresh operations, thereby preventing potential bit flips. While the PRAC+ABO framework marks a significant improvement in integrated, hardware-supported Rowhammer mitigations under reduced thresholds (Canpolat et al., 2025; Qureshi and Qazi, 2024; Woo et al., 2025), it also introduces several critical limitations that compromise both performance and scalability, particularly in high-performance or multi-threaded environments.
<details>
<summary>x1.png Details</summary>
### Visual Description
## Diagram: DRAM Timing Sequences - Unsafe Baseline vs. Practical Approaches
### Overview
The image presents a comparative diagram illustrating DRAM timing sequences for an "Unsafe Baseline" and two "Practical" approaches: "PRAC+ABO" and "Practical (this work)". The diagram focuses on the timing of ACT (Activate), RAS (Row Address Strobe), and PRE (Precharge) commands across two memory banks (A and B) or subarrays. The diagram is split into two main sections (a) and (b), representing different scenarios.
### Components/Axes
* **Horizontal Axis:** Represents time, with increasing time moving from left to right. The scale is not explicitly defined but durations are indicated in nanoseconds (ns).
* **Vertical Axis:** Represents memory banks or subarrays. In (a), it shows Subarray A and Subarray B. In (b), it shows Bank A and Bank B.
* **Command Blocks:** Rectangular blocks labeled "ACT", "RAS", and "PRE" represent the timing of these DRAM commands. The blocks are color-coded: ACT (green), RAS (red), PRE (orange).
* **Arrows:** Arrows indicate the duration of commands and the timing relationships between them.
* **Labels:**
* "Subarray A", "Subarray B"
* "Bank A", "Bank B"
* "ACT", "RAS", "PRE"
* "Pre-Recovery"
* "RFM" (Redundant Fault Management)
* "ABO" (Address Bank Optimization)
* "Unsafe Baseline"
* "PRAC+ABO"
* "Practical (this work)"
* "15ns", "180ns", "350ns", "10ns"
### Detailed Analysis / Content Details
**Section (a) - Unsafe Baseline:**
* **Subarray A:** ACT, RAS, PRE sequence.
* **Subarray B:** ACT, RAS, PRE sequence, with a 15ns delay indicated after RAS.
* The timing between ACT and RAS is very short, and the PRE command follows closely after RAS.
**Section (b) - PRAC+ABO and Practical (this work):**
* **PRAC+ABO (Top):**
* Bank A: ACT, RAS, PRE sequence.
* Bank B: ACT, RAS, ABO sequence.
* A 180ns duration is indicated for the PRE command in Bank A.
* ABO is shown to occur after RAS in Bank B.
* RFM is shown to occur after PRE in Bank A.
* **Practical (this work) (Bottom):**
* Bank A: ACT, RAS, PRE sequence.
* Bank B: ACT, RAS, ABO sequence.
* A 180ns duration is indicated for the PRE command in Bank A.
* ABO is shown to occur after RAS in Bank B.
* RFM is shown to occur after PRE in Bank A.
* A 10ns delay is indicated after RAS in Bank B.
* A 350ns duration is indicated for the RFM command.
### Key Observations
* The "Unsafe Baseline" (a) has the shortest timing between commands, potentially leading to timing violations.
* Both "Practical" approaches (PRAC+ABO and Practical) introduce delays and additional steps (ABO, RFM) to improve reliability.
* The "PRAC+ABO" approach has a 180ns PRE command duration in Bank A, while the "Practical" approach has a 350ns RFM duration.
* The "Practical" approach introduces a 10ns delay after RAS in Bank B.
* The diagram highlights the trade-off between performance (shorter timings) and reliability (longer timings with additional steps).
### Interpretation
The diagram demonstrates the evolution of DRAM timing strategies to address reliability concerns. The "Unsafe Baseline" represents a potentially faster but less reliable approach, while the "Practical" approaches prioritize reliability by introducing delays and redundancy management (RFM). The inclusion of Address Bank Optimization (ABO) in "PRAC+ABO" suggests an attempt to mitigate the performance impact of the added delays. The differences in timing durations (180ns vs. 350ns) and the 10ns delay in the "Practical" approach indicate different optimization strategies for managing redundancy and ensuring data integrity. The diagram suggests that the "Practical (this work)" approach is a refinement of the "PRAC+ABO" approach, potentially offering a better balance between performance and reliability. The diagram is a visual representation of a technical problem and the proposed solutions, likely within the context of DRAM design or memory controller development.
</details>
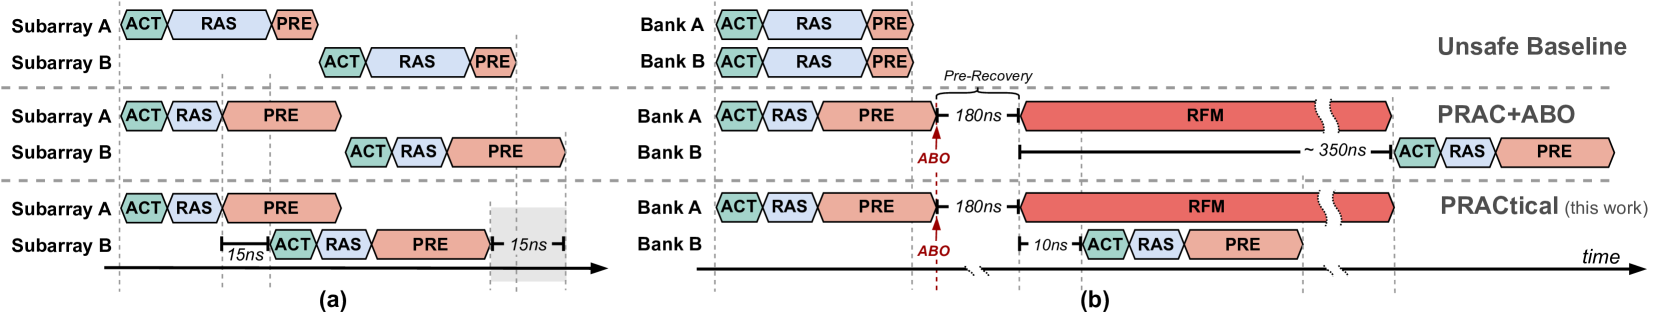
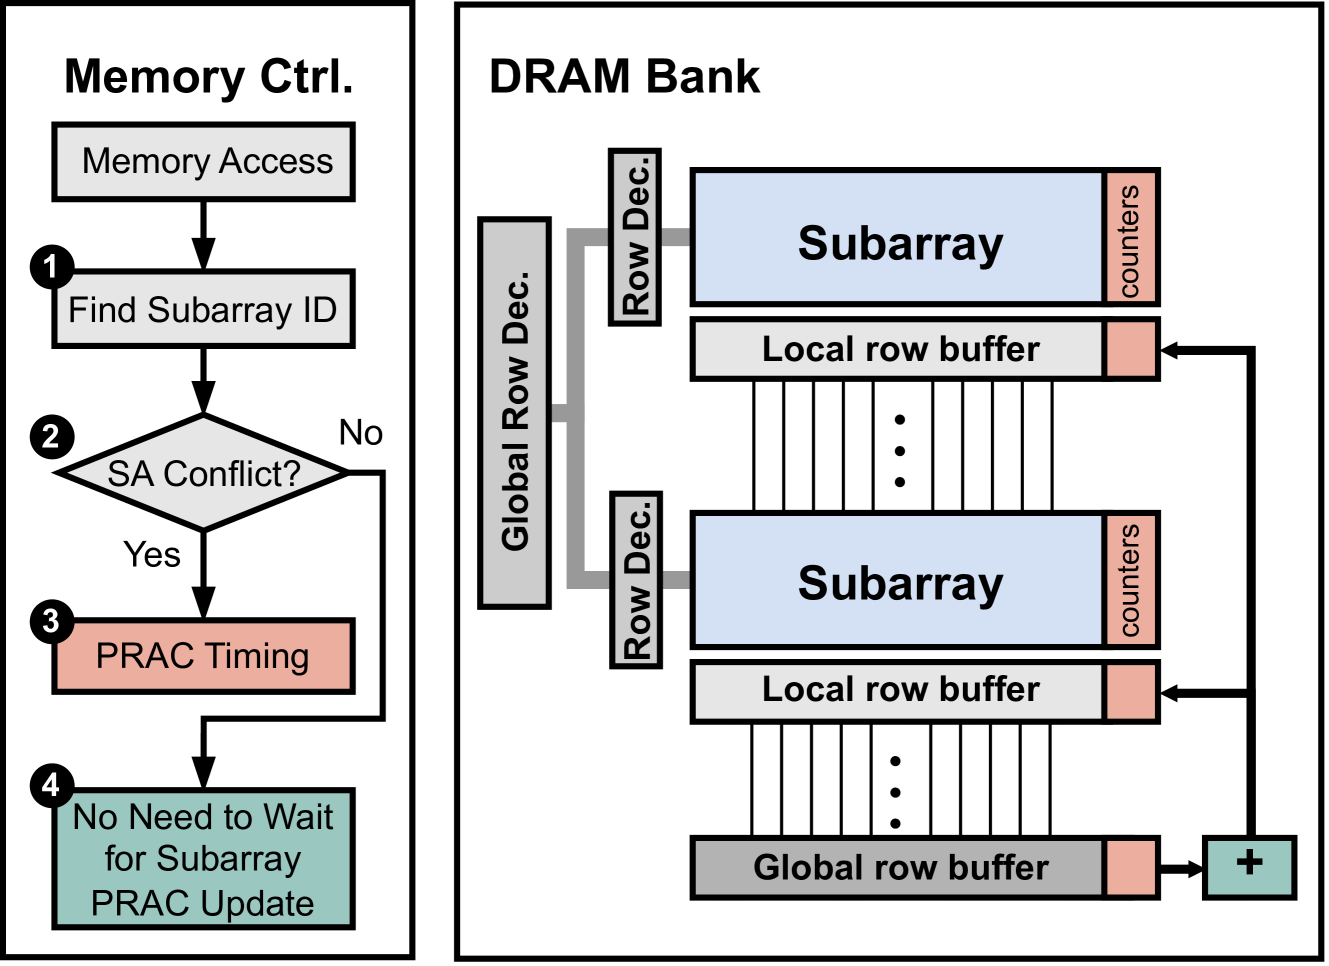
Figure 1. Comparison of baseline DRAM (top), PRAC+ABO (middle), and the proposed design (bottom). PRAC+ABO introduces (a) access latency from counter update overhead and (b) all-bank stalls due to coarse-grained RFM recovery. The proposed mechanism mitigates both by enabling subarray-level PRAC updates and bank-level mitigation. The gray regions illustrate the performance improvements enabled by the proposed approach. Register read operation takes 10ns in PRACtical in part (b).
\Description
First, the integration of PRAC requires architectural modifications that impact critical DRAM timing parameters (Hassan et al., 2024; JEDEC, 2024a). Specifically, the logic responsible for updating the per-row counters introduces an additional latency of around 5 ns to the row cycle time ( $t_{\mathrm{RC}}$ ). Even more significantly, the precharge timing ( $t_{\mathrm{RP}}$ ) is extended from 15 ns to 36 ns to accommodate the read-modify-write (RMW) operations needed for per-row counter updates. These modifications directly affect memory access latency and throughput, especially in workloads with high row buffer conflicts, as illustrated in Figure 1 (a) (Baseline vs. PRAC+ABO).
Second, after ABO is signalled to MC from DRAM, MC sends RFM ab command to DRAM for recovery. This command operates at the memory channel granularity. Therefore, the memory controller must conservatively stall all requests across the entire channel, even if only a single bank is affected, as illustrated in the middle row of Figure 1 (b). Since all banks undergo recovery, even in the absence of an actively hammered (hot) row, the mechanism opportunistically refreshes potential victim rows to preemptively mitigate future attacks. Our analysis reveals that this opportunistic strategy results in a threefold increase in recovery refreshes, underscoring the inefficiency and potential redundancy of these additional operations. We further observe that, across a set of memory-intensive benchmarks, on average, only 1.16 out of 64 banks need recovery at any given time (See § 3.2). Consequently, the remaining banks are unnecessarily stalled, leading to avoidable performance degradation. This coarse-grained design limits memory-level parallelism, degrading performance and responsiveness in scenarios where finer-grained mitigation would suffice.
While the PRAC+ABO mechanism represents meaningful progress toward an in-DRAM Rowhammer mitigation, it introduces two key performance-related drawbacks: (1) increased memory access latency due to counter update overhead, and (2) channel-wide stalls caused by the coarse granularity of RFM ab. These challenges do not undermine the mechanism’s ability to prevent Rowhammer bit flips, but they do limit its efficiency and suitability for performance-sensitive systems. As such, there is a pressing need for a more fine-grained, low-overhead mitigation framework that minimizes latency and preserves DRAM throughput while maintaining effective protection. To address the performance and energy limitations of the existing PRAC+ABO framework, we propose PRACtical — a minimal and efficient redesign that improves both responsiveness and scalability of PRAC+ABO. This new design introduces two key enhancements. First, it leverages subarray-level increment logic to decouple counter updates from global precharge timing, allowing subsequent activations to proceed in other subarrays without incurring the additional latency associated with PRAC’s read-modify-write operations. While prior works have explored and leveraged subarray-level parallelism to enhance memory performance and efficiency (Kim et al., 2012; Hassan et al., 2024), the introduction of the PRAC standard imposes new constraints that limit such parallelism. In this work, we demonstrate that with modest modifications to the DRAM circuitry, it is possible to restore a degree of subarray parallelism by overlapping the activation of a new row with the counter update of the previously accessed row. This significantly reduces access delay and enables known subarray-level parallelism for per-row counter updates. Second, PRACtical provides a new RFM command called RFM_MASK that eliminates stalling every bank once ABO is signalled from DRAM to MC, thereby ensuring that only the affected banks are stalled in response to a threshold violation. This fine-grained control minimizes unnecessary interference with unrelated memory traffic and improves overall system throughput. PRACtical makes small modifications to the memory controller and DRAM.
Together, these enhancements enable precise, low-latency and low-energy Rowhammer mitigation with minimal disruption to normal DRAM operations, as demonstrated in the bottom row of Figure 1 (a) and (b). Our performance evaluation, detailed in Section 6, utilizing DRAM simulation with Ramulator (Luo et al., 2023b), demonstrates that PRACtical achieves mean performance improvement of 8% over opportunistic PRAC+ABO for high-performance and memory-intensive applications while maintaining the security guarantees of PRAC+ABO-based mitigations (Canpolat et al., 2025; Woo et al., 2025; Qureshi and Qazi, 2024). In summary, the key contributions of this paper are:
- We identify two major performance bottlenecks in the PRAC+ABO mechanism: precharge-induced latency caused by PRAC updates, and coarse-grained channel-wide stalling due to RFM ab.
- We propose a centralized increment circuit that enables subarray-level parallelism, minimizing the counter update overhead during precharge.
- We introduce a bank-level recovery scheme that minimizes unnecessary stalls by isolating mitigation to the affected bank.
- We integrate these two mechanisms into PRACtical, a low-overhead Rowhammer mitigation framework that improves performance while preserving the security guarantees of PRAC+ABO.
- We evaluate PRACtical using Ramulator, showing lower performance overheads compared to PRAC+ABO with minimal hardware modifications.
2. Background
<details>
<summary>x2.png Details</summary>
### Visual Description
\n
## Diagram: DRAM Module Architecture
### Overview
The image presents a hierarchical block diagram illustrating the architecture of a Dynamic Random Access Memory (DRAM) module. It details the organization from the Memory Controller down to the individual DRAM cell, highlighting key components like DRAM Ranks, Chips, Subarrays, PRAC (Per-row Access Counter), and the DRAM cell itself. The diagram is divided into three main sections: a high-level module view, a DRAM Bank view, and a detailed subarray/cell view.
### Components/Axes
The diagram features the following components:
* **Memory Controller:** Top-left corner.
* **I/O Circuitry:** Adjacent to the Memory Controller.
* **DRAM Module:** Encompassing the entire upper section.
* **DRAM Rank:** Within the DRAM Module, containing multiple Chips.
* **Chip:** Individual memory chips within a Rank.
* **DRAM Bank:** Upper-right section, detailing the internal organization of a DRAM Rank.
* **Global Decoder:** Connects the DRAM Bank to the DRAM Rank.
* **Row Dec:** Row Decoder within the DRAM Bank.
* **Subarray:** Multiple subarrays within a DRAM Bank.
* **Local Row Buffer:** Associated with each Subarray.
* **Global Row Buffer:** Connects the subarrays.
* **PRAC (Per-row Access Counter):** Adjacent to the Subarrays.
* **Subarray (Detailed):** Bottom-left section, showing the arrangement of cells.
* **Bitline:** Vertical lines connecting cells within the Subarray.
* **Wordline:** Horizontal lines selecting rows of cells.
* **Row:** Represents a row of cells.
* **DRAM Cell:** Bottom-right section, showing the transistor and capacitor structure.
* **Transistor:** Component of the DRAM cell.
* **Capacitor:** Component of the DRAM cell.
The diagram uses arrows to indicate data flow and connections between components.
### Detailed Analysis or Content Details
**DRAM Module Level:**
* The DRAM Module contains multiple DRAM Ranks.
* Each DRAM Rank contains multiple Chips.
* The I/O Circuitry connects the Memory Controller to the DRAM Ranks.
**DRAM Bank Level:**
* The DRAM Bank consists of multiple Subarrays.
* Each Subarray has a Local Row Buffer.
* A Global Row Buffer connects the Subarrays.
* The Global Decoder connects the DRAM Bank to the DRAM Rank.
* PRAC is positioned adjacent to the Subarrays.
**Subarray Level:**
* The Subarray is organized as a grid of DRAM Cells.
* Bitlines run vertically, and Wordlines run horizontally.
* The Row Decoder selects the Wordline for a specific Row.
* The Local Row Buffer is connected to the rows of the Subarray.
**DRAM Cell Level:**
* The DRAM Cell consists of a Transistor and a Capacitor.
* The Capacitor stores the data bit.
* The Transistor acts as a switch to access the Capacitor.
* The Wordline controls the Transistor.
* The Bitline reads/writes data to the Capacitor.
### Key Observations
* The diagram illustrates a hierarchical structure, with increasing levels of detail as you move from the Module to the Cell.
* The PRAC is a key component for managing access to rows within the Subarray.
* The Local Row Buffer acts as a cache for frequently accessed rows.
* The DRAM cell is a simple but effective storage element.
* The diagram emphasizes the parallel access capabilities of DRAM through the use of multiple Subarrays.
### Interpretation
The diagram demonstrates the complex organization required to implement a DRAM module. The hierarchical structure allows for efficient access to large amounts of data. The PRAC and Local Row Buffers are crucial for optimizing performance by reducing access latency. The diagram highlights the fundamental building block of DRAM – the DRAM cell – and its simple yet effective design. The arrangement of subarrays and the use of bitlines and wordlines enable parallel access to data, which is essential for high-bandwidth memory systems. The diagram suggests a focus on optimizing row access patterns, as evidenced by the prominence of the PRAC and Local Row Buffers. The overall architecture is designed to balance capacity, speed, and power consumption. The diagram is a simplified representation, and real-world DRAM modules are significantly more complex, but it provides a valuable overview of the key components and their relationships.
</details>
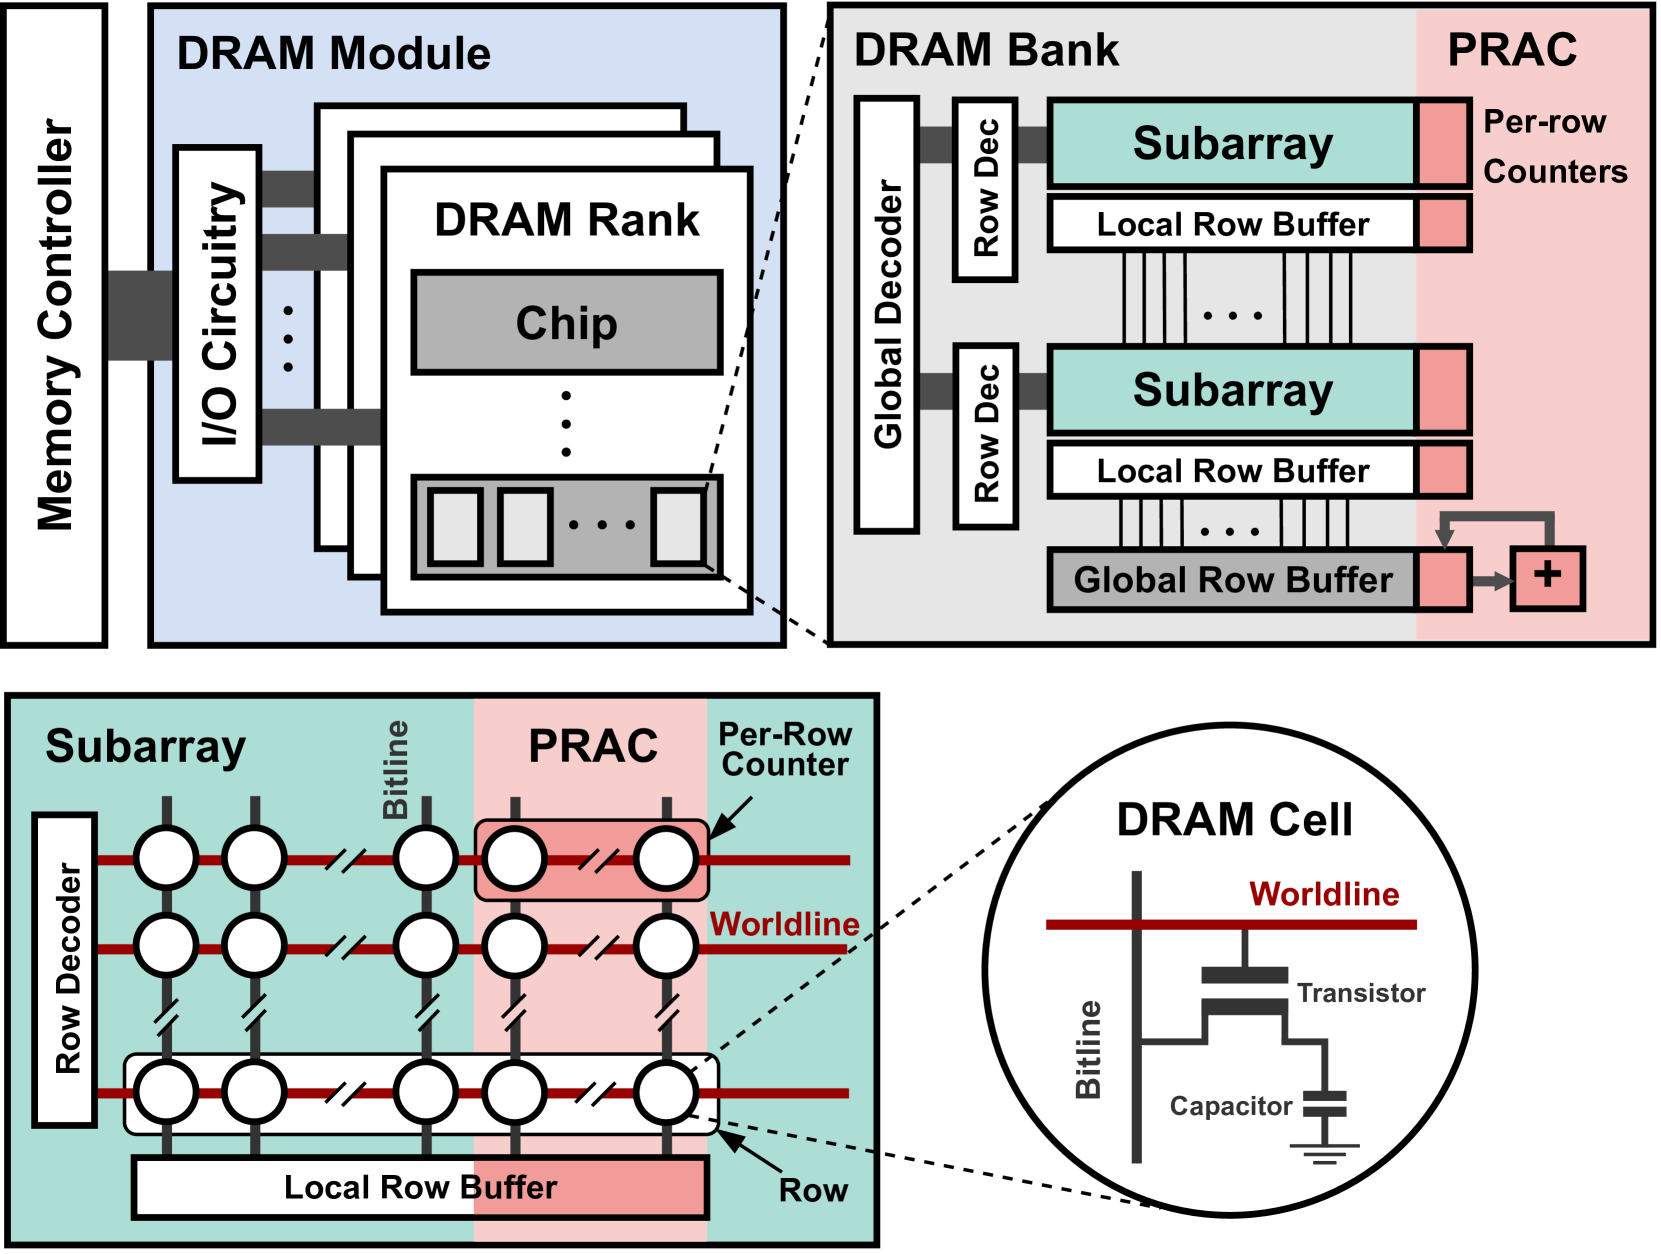
Figure 2. DRAM Organization and Per-Row Activation Counter (PRAC) extension.
In this section, we provide an overview of key background topics, including DRAM architecture, the Rowhammer vulnerability, and existing mitigation strategies. We also describe the PRAC+ABO mechanism introduced in the DDR5 standard, which forms the basis for our proposed performance enhancements.
2.1. DRAM Architecture and Parameters
Modern DRAM is organized hierarchically into ranks, banks, subarrays, rows, and columns, as illustrated in Figure 2. At the top of this hierarchy, the memory controller communicates with DRAM modules via a dedicated memory channel. Each module is composed of one or more ranks, which share access to the memory channel in a time-multiplexed fashion. A rank comprises several DRAM chips, and each chip contains multiple banks. Within each bank are numerous subarrays, forming the fundamental building blocks of memory storage. Each subarray is implemented as a two-dimensional array of cells, accessed via rows (wordlines) and columns (bitlines). A single DRAM cell includes a capacitor, which holds a bit of data as an electric charge, and an access transistor that enables read and write operations. Each subarray contains its own local row buffer, which temporarily holds the contents of an activated row. Only one subarray at a time can forward its data to the global row buffer shared across the bank, enabling read and write operations to proceed. To access data, the memory controller issues an Activate (ACT) command, which opens a specific row by transferring its contents into the row buffer. Subsequent read or write operations are performed on this open row, resulting in a low-latency row hit. If a different row within the same bank must be accessed, the current row must first be closed using a Precharge (PRE) command, which restores the contents of the row buffer to the array and resets the bitlines.
DRAM access behavior is governed by a set of well-defined timing parameters specified by the JEDEC standard (JEDEC, 2024a), as summarized in Table 1. We use DDR5-3200AN timings. For example, the Row Access Strobe (RAS) latency defines the minimum delay between an ACT and a subsequent PRE command within the same bank. Additionally, to maintain data integrity, DRAM cells require periodic refreshing within a retention window denoted as $t_{\mathrm{REFW}}$ , typically 32ms. To amortize the cost of refresh, DRAM divides its cells into 8192 refresh groups, and a Refresh (REF) command is issued every $t_{\mathrm{REFI}}$ = 3900ns to refresh one group at a time.
| $t_{RAS}$ | Minimum time a row must be kept open | 32ns | 16ns |
| --- | --- | --- | --- |
| $t_{RP}$ | Time to precharge an open row | 15ns | 36ns |
| $t_{RC}$ | Time between successive ACTs to a bank | 47ns | 52ns |
| $t_{RTP}$ | Minimum time for a PRE after a RD to the same bank | 7.5ns | 5ns |
| $t_{WR}$ | minimum time for a PRE after a WR to the same bank | 30ns | 10ns |
Table 1. DRAM Timing Standards
2.2. Read Disturbance Attacks
Modern DRAM is increasingly vulnerable to read disturbance effects, where the act of accessing one memory row can inadvertently influence the integrity of data stored in nearby rows. This phenomenon arises from the shrinking physical dimensions of DRAM cells and the reduced noise margins between them. As manufacturing processes continue to scale, the isolation between adjacent rows weakens, making DRAM cells more susceptible to charge leakage and electromagnetic coupling.
The most prominent example of a read disturbance attack is Rowhammer (Kim et al., 2014a), where an attacker repeatedly activates (i.e., opens) a single DRAM row, known as the aggressor row, within a refresh interval. If the number of activations exceeds a certain threshold, electrical interference can induce bit flips in adjacent victim rows. Since its discovery, Rowhammer has been shown to compromise system security in various ways, including enabling privilege escalation (Seaborn and Dullien, 2015), breaking isolation between virtual machines (Razavi et al., 2016), and subverting browser-based sandboxes (Gruss et al., 2016).
Beyond Rowhammer, newer variants continue to expose the fragility of DRAM. RowPress (Luo et al., 2023a) demonstrates that simply holding a row open for an extended duration—without repeated activations—can cause similar disturbance effects in neighboring rows. This shows that both temporal access frequency and row residency time can lead to data corruption, expanding the threat model beyond traditional Rowhammer.
The security implications of these attacks are severe. Bit flips in sensitive memory structures such as page tables, kernel space, or encryption keys can be exploited to gain arbitrary code execution, bypass memory isolation, or compromise confidentiality (Frigo et al., 2020; Gruss et al., 2018; Razavi et al., 2016; Gruss et al., 2016). To mitigate read disturbance attacks, a wide range of defenses have been proposed. These typically follow a two-phase approach: (1) Detecting aggressor rows, using techniques such as memory controller-based row activation counters (Kim et al., 2021), probabilistic sampling (Son et al., 2017; Kim et al., 2014a), or in-DRAM tracking (Jaleel et al., 2024b; Qureshi et al., 2024); and (2) Applying preventive measures, such as Target Row Refresh (TRR) (Marazzi et al., 2022; Frigo et al., 2020), domain-aware memory allocation (Saxena et al., 2024b), or row remapping (Saxena et al., 2024a). While many of these defenses are effective at reducing bit flips, they often incur significant performance overheads and hardware complexity, especially when mitigation is applied conservatively to avoid false negatives. As DRAM continues to scale and disturbance thresholds fall, there is a growing need for efficient, low-latency, and fine-grained mitigation mechanisms that preserve performance without compromising reliability or security.
2.3. PRAC and ABO in Modern DRAM Standards
To address the growing threat of Rowhammer attacks, recent JEDEC standards have introduced two complementary in-DRAM mitigation mechanisms: Per-Row Activation Counter (PRAC) and Alert Back-Off (ABO). These mechanisms aim to detect and mitigate malicious or excessive row activations efficiently, while remaining scalable for high-density DRAM systems.
2.3.1. PRAC
This feature is designed to mitigate Rowhammer attacks with minimal area and power overhead by embedding activation tracking directly within the DRAM array. Specifically, PRAC extends each DRAM row with a dedicated activation counter. Every time a row is precharged, its corresponding counter is incremented by the increment logic in the global row buffer shared between all subarrays within a bank, as illustrated in Figure 2. This increment operation is performed during the precharge phase and is implemented as a read-modify-write (RMW) sequence at the bank level. When a precharge command (PRE) is issued, the DRAM bank reads the activation counter of the recently accessed row, updates its value, and writes it back before deactivating the wordline. This sequence introduces additional latency to the precharge operation, requiring DRAM timing parameters to be extended to accommodate the counter update overhead. While PRAC enables fine-grained tracking of row activations without relying on external memory controller storage, its bank-wide RMW implementation creates performance bottlenecks by delaying subsequent accesses to other non-conflicting subarrays until the counter update completes, as illustrated in top and middle rows of the Figure 1 (a). The performance impact of this overhead is analyzed in detail in Section 3.
2.3.2. ABO
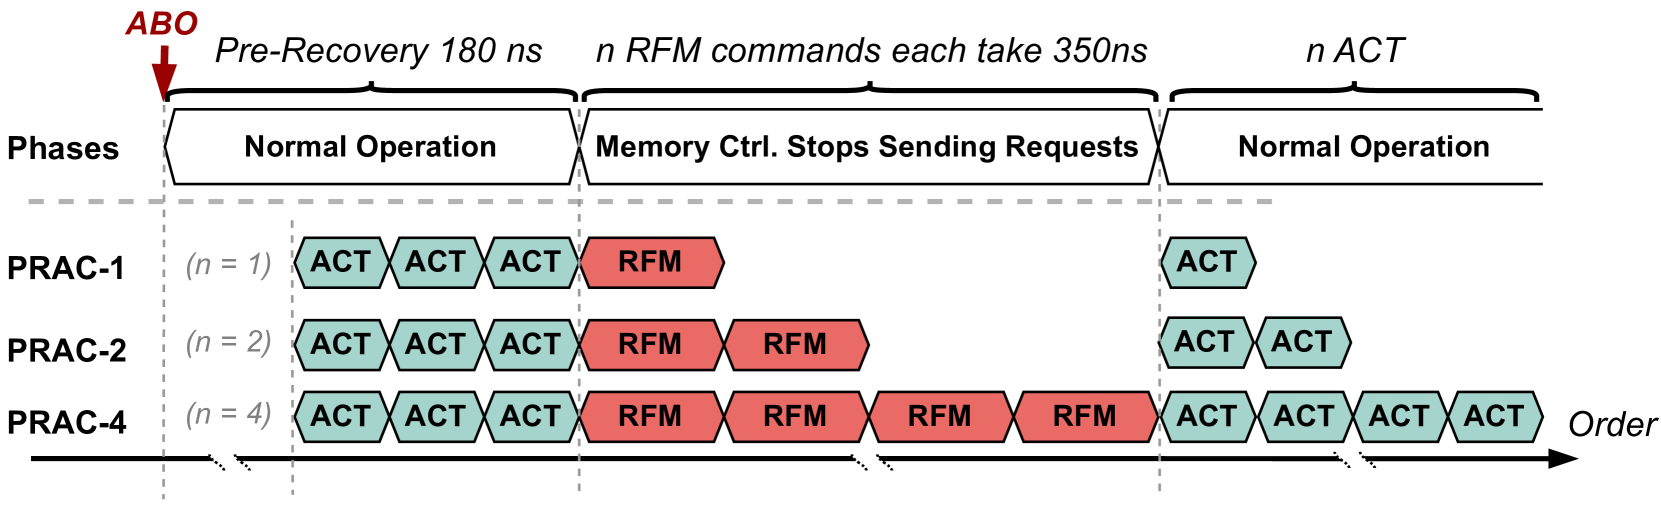
This mechanism complements PRAC by providing a signaling interface between the DRAM device and the memory controller. When a PRAC counter in any bank reaches a pre-defined threshold, the corresponding bank sends an ABO signal to notify the memory controller that mitigation is needed. Upon receiving the ABO signal, the memory controller initiates a pre-recovery phase lasting 180ns, during which it continues to serve memory requests normally as shown in Figure 3. After this window, the controller issues an RFM ab command to trigger targeted mitigation. Each RFM ab command incurs a latency of 350ns and applies to all banks in the channel (typically 64 banks). During this period, the memory controller stalls requests to the channel while the banks perform recovery operations, such as refreshing victim rows, as shown in the middle row of Figure 1 (b). If multiple banks reach the threshold in close succession, the memory controller may need to issue multiple RFM commands, each separated by a recovery window. This can amplify the performance impact, especially under aggressive access patterns that frequently trigger mitigation events.
To prevent back-to-back ABO signals, the protocol requires a minimum number of ACT commands between two consecutive alerts. In Figure 3, this value is denoted by $n$ . It also corresponds to the number of required RFM operations, as each RFM can service only a limited number of victim rows per invocation. After all RFM commands are completed, one additional ACT is permitted. The allowed values for $n$ are 1, 2, or 4, as illustrated by PRAC-1, PRAC-2, and PRAC-4 in Figure 3, as well as in Figures in Sections 3 and 6. Consequently, the minimum and maximum ABO intervals range from 350ns to 1500ns, each preceded by a fixed 180ns pre-recovery window.
<details>
<summary>x3.png Details</summary>
### Visual Description
\n
## Diagram: Memory Controller Operation Phases
### Overview
The diagram illustrates the phases of operation for a memory controller following an ABO (Abort) event, showing how the number of parallel requests (PRAC-1, PRAC-2, PRAC-4) affects the recovery process. The diagram depicts a timeline divided into phases: Normal Operation, Memory Controller Stops Sending Requests, and a return to Normal Operation. It highlights the execution of ACT (Active) and RFM (Refresh) commands during these phases.
### Components/Axes
* **Vertical Axis:** "Phases" - labeled with "Normal Operation" and "Memory Ctrl. Stops Sending Requests".
* **Horizontal Axis:** "Order" - representing the sequence of commands over time.
* **PRAC-1:** Represents the case with n=1 parallel requests.
* **PRAC-2:** Represents the case with n=2 parallel requests.
* **PRAC-4:** Represents the case with n=4 parallel requests.
* **ACT:** Green rectangles representing Active commands.
* **RFM:** Red rectangles representing Refresh commands.
* **ABO:** Red downward pointing triangle indicating the abort event.
* **Time Annotations:** "Pre-Recovery 180 ns", "n RFM commands each take 350ns", "n ACT".
### Detailed Analysis
The diagram shows three scenarios (PRAC-1, PRAC-2, PRAC-4) illustrating the impact of the number of parallel requests on the recovery process after an ABO event.
* **PRAC-1 (n=1):**
* Before ABO: Three ACT commands are executed.
* After ABO: One RFM command is executed.
* Return to Normal: One ACT command is executed.
* **PRAC-2 (n=2):**
* Before ABO: Three ACT commands are executed.
* After ABO: Two RFM commands are executed.
* Return to Normal: Two ACT commands are executed.
* **PRAC-4 (n=4):**
* Before ABO: Three ACT commands are executed.
* After ABO: Four RFM commands are executed.
* Return to Normal: Four ACT commands are executed.
The diagram indicates that the pre-recovery phase takes 180 ns. Each RFM command takes 350 ns. The number of RFM commands executed during the "Memory Ctrl. Stops Sending Requests" phase corresponds to the value of 'n' for each PRAC scenario. The time taken for the ACT commands is denoted as 'n ACT', but no specific duration is provided.
### Key Observations
* The number of RFM commands executed during the recovery phase directly correlates with the number of parallel requests (n).
* The diagram visually demonstrates that a higher number of parallel requests (PRAC-4) requires more RFM commands to be executed during the recovery phase compared to lower numbers of parallel requests (PRAC-1, PRAC-2).
* The diagram does not provide specific timing information for the ACT commands, only indicating that 'n' ACT commands are executed.
### Interpretation
The diagram illustrates a memory controller's response to an abort event, specifically focusing on the refresh operations needed to restore data integrity. The number of RFM commands executed is directly proportional to the number of active requests at the time of the abort. This suggests that the memory controller needs to refresh the data associated with each outstanding request to ensure consistency after an error. The diagram highlights a trade-off: increasing the number of parallel requests can improve performance during normal operation, but it also increases the recovery time after an abort event due to the need for more refresh operations. The diagram is a simplified model, and doesn't account for potential variations in RFM command execution time or other factors that could influence recovery performance. The diagram is a visual aid for understanding the relationship between parallel requests, abort events, and memory refresh operations in a memory controller.
</details>
Figure 3. Alert-back-off (ABO) overview
2.4. Mitigations Based On PRAC+ABO
Several recent works build on the PRAC+ABO framework to strengthen its security guarantees and reduce its performance overheads. In this paper, we focus on three representative designs—Chronus (Canpolat et al., 2025), QPRAC (Woo et al., 2025), and MOAT (Qureshi and Qazi, 2024) —which propose distinct approaches to improving the effectiveness and efficiency of in-DRAM RowHammer mitigation.
Chronus (Canpolat et al., 2025) introduces architectural modifications to decouple PRAC counter updates from the critical path of DRAM access. By relocating per-row counters to a dedicated metadata subarray, Chronus reduces the serialization overhead associated with precharge operations. It also proposes enhancements to the ABO protocol by holding the alert signal until all mitigations are complete, ensuring stronger coordination between DRAM and the memory controller.
QPARC (Woo et al., 2025) revisits PRAC’s security model as originally proposed in the Panopticon framework (Bennett et al., 2021), and identifies two new attack vectors that exploit timing gaps in counter updates. To address this, it introduces a priority-based queue that tracks frequently accessed rows and schedules them for mitigation through ABO. This queuing mechanism enables timely and targeted mitigation while preserving compatibility with the existing PRAC+ABO interface.
MOAT (Qureshi and Qazi, 2024) focuses on simplifying mitigation logic by replacing queue-based designs with a tracking mechanism. It uses two SRAM registers to monitor one hot row at a time, applying proactive refreshes below a configurable threshold and issuing ABO signals when the threshold is exceeded. While MOAT reduces hardware complexity, it may face limitations under workloads with multiple simultaneous hot rows.
3. PRAC+ABO Limitations and Motivation
While PRAC+ABO provides a low-cost, JEDEC-standardized approach for in-DRAM Rowhammer mitigation, it introduces significant performance bottlenecks and security risks due to its coarse-grained design. This section presents a detailed analysis of the overheads introduced by PRAC updates and ABO-triggered channel-wide stalls. We also show how these issues can be exploited by adversaries to launch memory performance attacks. All insights are derived from cycle-accurate simulations, as described in Section 5.
3.1. Impact of PRAC Updates on DRAM Latency
PRAC extends each DRAM row with an activation counter that is incremented during the Precharge (PRE) command using a read-modify-write (RMW) operation, as illustrated in Figure 2. This update is performed at the bank level, using logic typically located near the global row buffer. As a result, when a PRE command is issued, the DRAM must first read, modify, and write back the counter value associated with the activated row before deactivating the wordline and returning to an idle state. This serialization delays subsequent memory operations, even when they target non-conflicting subarrays. To accommodate this RMW sequence, DRAM timing parameters are modified. Specifically, the precharge latency increases from 15ns to 36ns, and the activation-to-activation interval ( $t_{RC}$ ) increases from 47ns to 52ns. Interestingly, the row active time ( $t_{RAS}$ ) is reduced from 32ns to 16ns, partially offsetting the impact. Nevertheless, the increase in $t_{RC}$ introduces a minimum 5ns delay between successive row activations — particularly impactful in workloads with high row buffer conflicts.
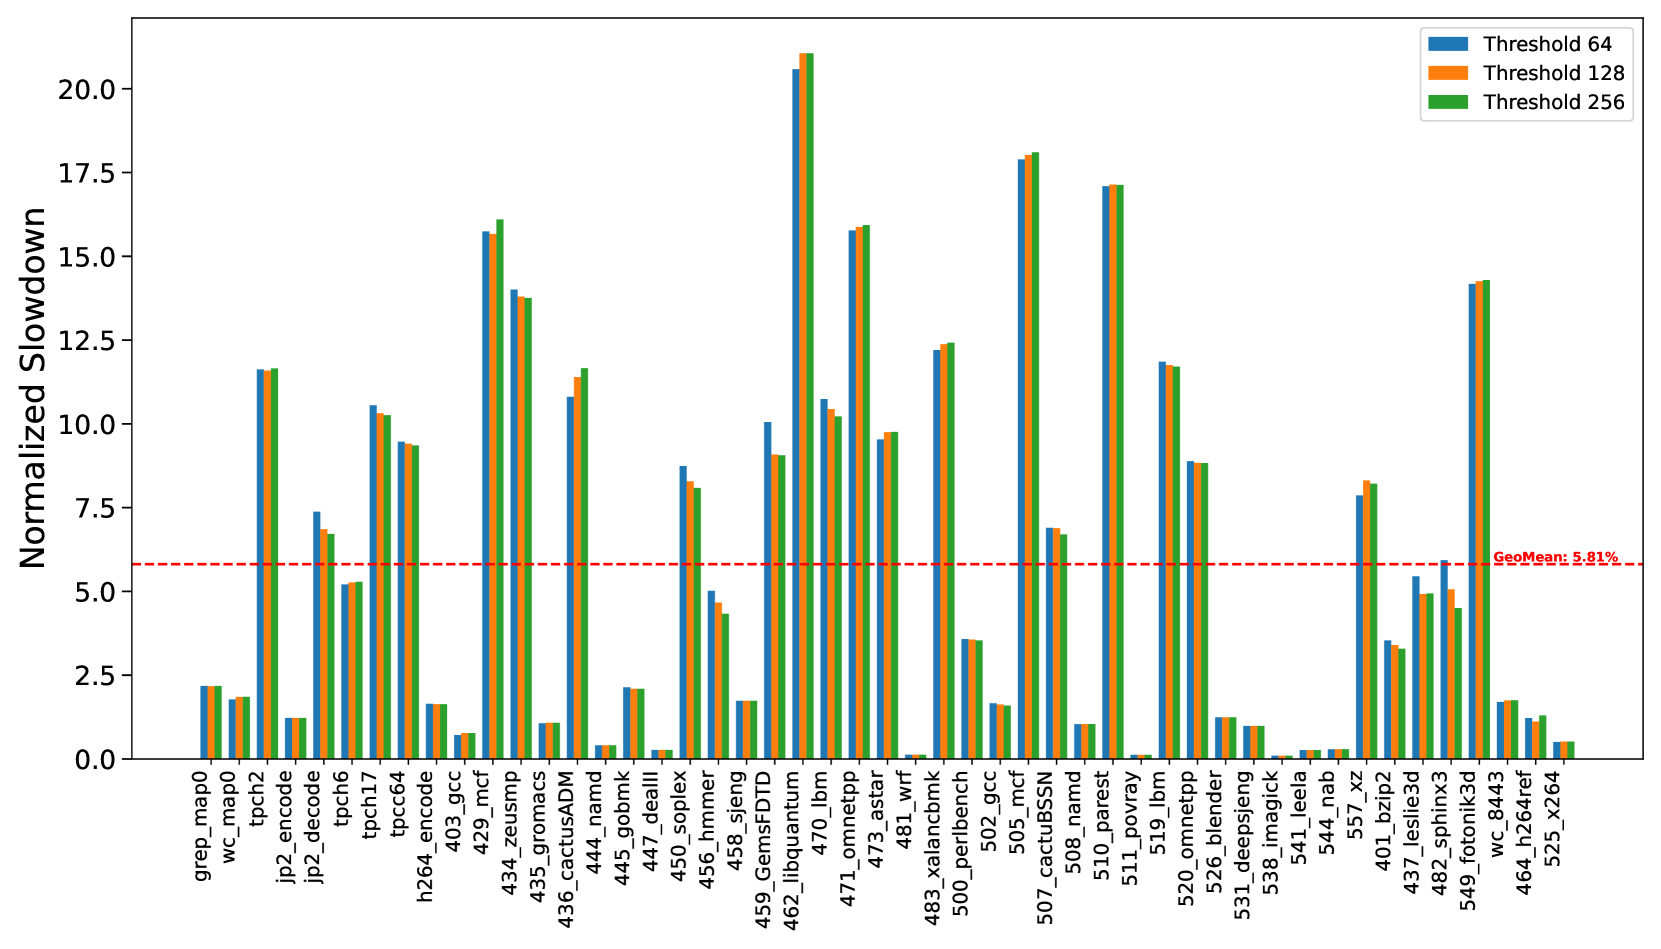
To quantify this impact, we evaluated a set of memory-intensive workloads under two timing configurations: (1) a baseline DRAM configuration using standard DDR5 timings, and (2) a PRAC-enabled configuration with updated timings, as specified in Table 1. The results, shown in Figure 4, indicate that workloads experience an average slowdown of 6%, with a maximum of close to 20% for 462.libquantum. These slowdowns are primarily attributed to increased latency introduced by PRAC counter updates, particularly in scenarios involving frequent row activations within the same bank. Although the row access time increases by only 10% (from 47ns to 52ns), the observed system-level performance overhead can reach up to 20%. This discrepancy arises because rows are not always precharged immediately after access. In many cases, a row remains open for extended durations due to row buffer policy, reducing the impact of a longer row access time. However, the increased precharge latency, nearly a 100% increase in the PRE timing, becomes the dominant contributor to performance degradation, especially when frequent rows are not immediately precharged.
We also evaluated multiple Alert thresholds (64, 128, and 256) and observed only minor variations in slowdown across these configurations. This suggests that the performance degradation is largely due to static timing overheads from PRAC’s counter update logic, rather than the dynamic triggering of ABO or mitigation procedures. As expected, applications with low row conflict rates, such as 447_dealII and 444_namd, exhibited significantly less performance impact.
Observation 1: The updated DDR5 timings introduce performance overhead, slowing down benign workloads by geometric mean of 6%.
<details>
<summary>x4.png Details</summary>
### Visual Description
\n
## Bar Chart: Normalized Slowdown for Different Benchmarks
### Overview
This image presents a bar chart comparing the normalized slowdown of various benchmarks under different threshold settings (64, 128, and 256). The x-axis lists the benchmarks, and the y-axis represents the normalized slowdown. A horizontal dashed red line indicates a geometric mean slowdown of 5.81%.
### Components/Axes
* **X-axis:** Benchmark names (grep, map0, wc, tpch2, jp2\_encode, jp2\_decode, tpch6, tpch16, h264\_encode, tpcc64, 403\_gcc, 434\_zeusmp, 435\_gromacs, 436\_cactusADM, 444\_namd, 445\_gobmk, 446\_dealII, 456\_sheng, 458\_hmmer, 459\_GemsFDTD, 462\_libquantum, 470\_lbm, 471\_omnetpp, 473\_astar, 481\_wrf, 483\_xalancbmk, 500\_perlbench, 502\_gcc, 505\_mcf, 507\_cactusSSN, 508\_namd, 510\_povray, 511\_lbm, 520\_omnetpp, 526\_blender, 531\_deepspnj, 538\_imagick, 541\_leelab, 557\_xz, 401\_lesstif, 437\_sphinx3d, 549\_fotronik3d, 464\_radioss, 525\_x264).
* **Y-axis:** Normalized Slowdown (scale from 0 to 20+, labeled in increments of 2.5).
* **Legend:** Located at the top-right of the chart.
* Blue: Threshold 64
* Orange: Threshold 128
* Yellow: Threshold 256
* **Horizontal Line:** Dashed red line at y = 5.81, labeled "Geomean: 5.81%".
### Detailed Analysis
The chart displays three bars for each benchmark, representing the normalized slowdown at each threshold.
* **grep:** Threshold 64: ~1.2, Threshold 128: ~1.2, Threshold 256: ~1.2
* **map0:** Threshold 64: ~1.5, Threshold 128: ~1.5, Threshold 256: ~1.5
* **wc:** Threshold 64: ~1.5, Threshold 128: ~1.5, Threshold 256: ~1.5
* **tpch2:** Threshold 64: ~2.0, Threshold 128: ~2.0, Threshold 256: ~2.0
* **jp2\_encode:** Threshold 64: ~2.5, Threshold 128: ~2.5, Threshold 256: ~2.5
* **jp2\_decode:** Threshold 64: ~3.0, Threshold 128: ~3.0, Threshold 256: ~3.0
* **tpch6:** Threshold 64: ~3.5, Threshold 128: ~3.5, Threshold 256: ~3.5
* **tpch16:** Threshold 64: ~4.0, Threshold 128: ~4.0, Threshold 256: ~4.0
* **h264\_encode:** Threshold 64: ~4.5, Threshold 128: ~4.5, Threshold 256: ~4.5
* **tpcc64:** Threshold 64: ~15.0, Threshold 128: ~15.0, Threshold 256: ~15.0
* **403\_gcc:** Threshold 64: ~16.0, Threshold 128: ~16.0, Threshold 256: ~16.0
* **434\_zeusmp:** Threshold 64: ~16.0, Threshold 128: ~16.0, Threshold 256: ~16.0
* **435\_gromacs:** Threshold 64: ~15.0, Threshold 128: ~15.0, Threshold 256: ~15.0
* **436\_cactusADM:** Threshold 64: ~15.0, Threshold 128: ~15.0, Threshold 256: ~15.0
* **444\_namd:** Threshold 64: ~15.0, Threshold 128: ~15.0, Threshold 256: ~15.0
* **445\_gobmk:** Threshold 64: ~15.0, Threshold 128: ~15.0, Threshold 256: ~15.0
* **446\_dealII:** Threshold 64: ~15.0, Threshold 128: ~15.0, Threshold 256: ~15.0
* **456\_sheng:** Threshold 64: ~15.0, Threshold 128: ~15.0, Threshold 256: ~15.0
* **458\_hmmer:** Threshold 64: ~15.0, Threshold 128: ~15.0, Threshold 256: ~15.0
* **459\_GemsFDTD:** Threshold 64: ~15.0, Threshold 128: ~15.0, Threshold 256: ~15.0
* **462\_libquantum:** Threshold 64: ~15.0, Threshold 128: ~15.0, Threshold 256: ~15.0
* **470\_lbm:** Threshold 64: ~15.0, Threshold 128: ~15.0, Threshold 256: ~15.0
* **471\_omnetpp:** Threshold 64: ~15.0, Threshold 128: ~15.0, Threshold 256: ~15.0
* **473\_astar:** Threshold 64: ~15.0, Threshold 128: ~15.0, Threshold 256: ~15.0
* **481\_wrf:** Threshold 64: ~15.0, Threshold 128: ~15.0, Threshold 256: ~15.0
* **483\_xalancbmk:** Threshold 64: ~15.0, Threshold 128: ~15.0, Threshold 256: ~15.0
* **500\_perlbench:** Threshold 64: ~16.0, Threshold 128: ~16.0, Threshold 256: ~16.0
* **502\_gcc:** Threshold 64: ~16.0, Threshold 128: ~16.0, Threshold 256: ~16.0
* **505\_mcf:** Threshold 64: ~16.0, Threshold 128: ~16.0, Threshold 256: ~16.0
* **507\_cactusSSN:** Threshold 64: ~17.0, Threshold 128: ~17.0, Threshold 256: ~17.0
* **508\_namd:** Threshold 64: ~17.0, Threshold 128: ~17.0, Threshold 256: ~17.0
* **510\_povray:** Threshold 64: ~17.0, Threshold 128: ~17.0, Threshold 256: ~17.0
* **511\_lbm:** Threshold 64: ~17.0, Threshold 128: ~17.0, Threshold 256: ~17.0
* **520\_omnetpp:** Threshold 64: ~17.0, Threshold 128: ~17.0, Threshold 256: ~17.0
* **526\_blender:** Threshold 64: ~17.0, Threshold 128: ~17.0, Threshold 256: ~17.0
* **531\_deepspnj:** Threshold 64: ~17.0, Threshold 128: ~17.0, Threshold 256: ~17.0
* **538\_imagick:** Threshold 64: ~17.0, Threshold 128: ~17.0, Threshold 256: ~17.0
* **541\_leelab:** Threshold 64: ~17.0, Threshold 128: ~17.0, Threshold 256: ~17.0
* **557\_xz:** Threshold 64: ~17.0, Threshold 128: ~17.0, Threshold 256: ~17.0
* **401\_lesstif:** Threshold 64: ~5.0, Threshold 128: ~5.0, Threshold 256: ~5.0
* **437\_sphinx3d:** Threshold 64: ~5.0, Threshold 128: ~5.0, Threshold 256: ~5.0
* **549\_fotronik3d:** Threshold 64: ~5.0, Threshold 128: ~5.0, Threshold 256: ~5.0
* **464\_radioss:** Threshold 64: ~5.0, Threshold 128: ~5.0, Threshold 256: ~5.0
* **525\_x264:** Threshold 64: ~5.0, Threshold 128: ~5.0, Threshold 256: ~5.0
### Key Observations
* The normalized slowdown is relatively consistent across the three thresholds for most benchmarks.
* Benchmarks `tpcc64`, `403_gcc`, `434_zeusmp`, `435_gromacs`, `436_cactusADM`, `444_namd`, `445_gobmk`, `446_dealII`, `456_sheng`, `458_hmmer`, `459_GemsFDTD`, `462_libquantum`, `470_lbm`, `471_omnetpp`, `473_astar`, `481_wrf`, `483_xalancbmk`, `500_perlbench`, `502_gcc`, `505_mcf` exhibit significantly higher slowdowns (around 15-17) compared to others.
* Benchmarks `grep`, `map0`, `wc`, `tpch2`, `jp2_encode`, `jp2_decode`, `tpch6`, `tpch16`, `h264_encode` show relatively low slowdowns (below 5).
* Benchmarks `401_lesstif`, `437_sphinx3d`, `549_fotronik3d`, `464_radioss`, `525_x264` show slowdowns around the geometric mean (5).
### Interpretation
The chart demonstrates the impact of different threshold settings on the performance of various benchmarks. The consistent slowdown across thresholds for most benchmarks suggests that the threshold setting does not significantly affect their performance. However, the substantial slowdown observed for certain benchmarks (e.g., `tpcc64`) indicates that these benchmarks are particularly sensitive to the threshold. The geometric mean line provides a baseline for comparison, highlighting benchmarks that perform significantly above or below average. The data suggests that optimizing the threshold for these specific benchmarks might yield performance improvements, while for others, the threshold has minimal impact. The large variation in slowdowns across benchmarks indicates that the performance impact of the threshold is highly workload-dependent.
</details>
Figure 4. Percentage slow-down due to the increase in the latency of PRE command.
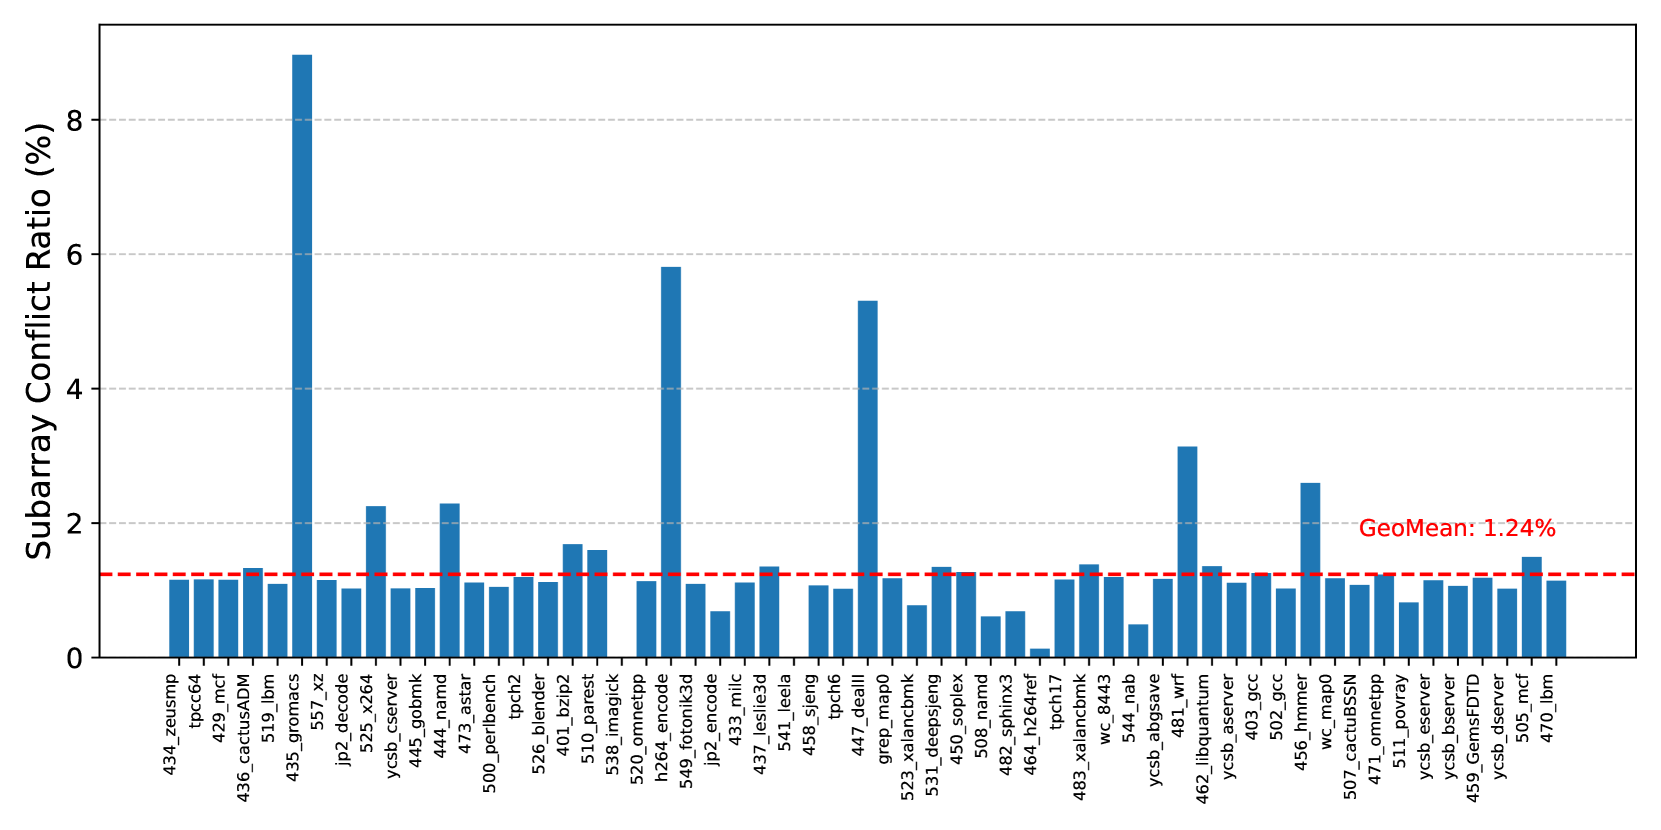
PRACtical proposes reducing the performance overhead of PRAC by performing counter updates within the local row buffers of individual subarrays. Modern DRAM architectures commonly adopt a density-optimized open-bitline structure (Keeth et al., 2007; Itoh, 2001; Chang et al., 2016; Luo et al., 2020), which places sense amplifiers on both sides of a subarray and allows adjacent subarrays to share these amplifiers. As a result, when a subarray is performing a counter update, the memory controller must delay not only accesses to that subarray but also to its neighboring subarrays. To evaluate the practical impact of this constraint, we measure the percentage of subarray conflicts relative to total row buffer conflicts. Assuming a configuration with 256 subarrays per bank, Figure 5 presents the ratio of subarray conflicts, including those involving adjacent subarrays, to total row buffer conflicts. The results demonstrate that subarray conflicts are relatively rare, accounting for only 1.24% on average across a diverse set of workloads. This observation indicates that enabling PRAC updates at the subarray level can enhance performance by permitting concurrent accesses to subarrays that are not involved in counter updates.
<details>
<summary>x5.png Details</summary>
### Visual Description
## Bar Chart: Subarray Conflict Ratio
### Overview
The image presents a bar chart displaying the Subarray Conflict Ratio (%) for a series of identifiers. The chart appears to be comparing the conflict ratio across different systems or components, with a horizontal line indicating the geometric mean.
### Components/Axes
* **Y-axis:** "Subarray Conflict Ratio (%)", ranging from 0 to 8, with increments of 1.
* **X-axis:** A series of identifiers, including: 434\_zeusmcp, 429\_n4, 436\_cactusADM, 519\_lbm, 535\_gromacs, 557\_xz, jp2\_d5e\_x2e, ycsb\_server, 442\_gromk, 471\_tensor, 500\_perbench2, tcdb, 526\_ble\_p2, 401\_pzip2, 516\_imagepk, 520\_omnetpp, 524\_fotonik3d, 549\_leslie3d, 433\_milc, 541\_sheng, 523\_greg\_detail, 447\_tcdb, 531\_x26\_napld, 508\_namd, 464\_h264rx, 482\_sphinx3, 464\_tpcnh7, 483\_xalanc\_843, wc\_8443, ycsb\_abgsve, 544\_lbm, 462\_libquantum, 456\_gcc, 405\_nm\_mpego, 507\_tz\_mpego, 474\_cactusSN, 511\_omnetpp, ycsb\_server, 459\_GemsFDTD, 505\_mcf, 470\_lbm.
* **Horizontal Line:** A dashed orange line labeled "GeoMean: 1.24%". This line represents the geometric mean of the Subarray Conflict Ratio.
### Detailed Analysis
The chart consists of 35 bars, each representing the Subarray Conflict Ratio for a specific identifier. The bars vary significantly in height.
Here's a breakdown of approximate values, reading from left to right:
* 434\_zeusmcp: ~0.8%
* 429\_n4: ~1.2%
* 436\_cactusADM: ~1.6%
* 519\_lbm: ~0.4%
* 535\_gromacs: ~1.0%
* 557\_xz: ~0.6%
* jp2\_d5e\_x2e: ~0.2%
* ycsb\_server: ~0.4%
* 442\_gromk: ~0.8%
* 471\_tensor: ~0.6%
* 500\_perbench2: ~0.4%
* tcdb: ~0.2%
* 526\_ble\_p2: ~0.4%
* 401\_pzip2: ~0.2%
* 516\_imagepk: ~0.6%
* 520\_omnetpp: ~0.8%
* 524\_fotonik3d: ~5.6% (Highest value)
* 549\_leslie3d: ~0.4%
* 433\_milc: ~0.2%
* 541\_sheng: ~0.4%
* 523\_greg\_detail: ~0.2%
* 447\_tcdb: ~0.2%
* 531\_x26\_napld: ~0.2%
* 508\_namd: ~0.4%
* 464\_h264rx: ~0.2%
* 482\_sphinx3: ~0.4%
* 464\_tpcnh7: ~0.2%
* 483\_xalanc\_843: ~0.2%
* wc\_8443: ~0.2%
* ycsb\_abgsve: ~0.4%
* 544\_lbm: ~0.2%
* 462\_libquantum: ~0.4%
* 456\_gcc: ~0.2%
* 405\_nm\_mpego: ~0.2%
* 507\_tz\_mpego: ~0.2%
* 474\_cactusSN: ~0.4%
* 511\_omnetpp: ~0.2%
* ycsb\_server: ~0.4%
* 459\_GemsFDTD: ~0.2%
* 505\_mcf: ~0.2%
* 470\_lbm: ~0.2%
### Key Observations
* The identifier "524\_fotonik3d" has a significantly higher Subarray Conflict Ratio (approximately 5.6%) compared to all other identifiers. This is a clear outlier.
* Most identifiers have a Subarray Conflict Ratio below 1%.
* The geometric mean (1.24%) is relatively low, suggesting that, overall, the Subarray Conflict Ratio is generally low across these identifiers.
* There is a wide range of conflict ratios, indicating varying levels of conflict across the different systems/components.
### Interpretation
The chart demonstrates the distribution of Subarray Conflict Ratios across a set of identifiers. The high conflict ratio observed for "524\_fotonik3d" warrants further investigation. It could indicate a specific issue with that system or component, such as inefficient memory access patterns or contention for shared resources. The geometric mean provides a useful benchmark for assessing the overall performance and identifying potential areas for optimization. The wide variation in conflict ratios suggests that some systems are more prone to conflicts than others, and targeted improvements could be made to reduce these conflicts. The data suggests that the majority of the systems have low conflict ratios, but the outlier highlights a potential problem area. Further analysis would be needed to understand the root cause of the high conflict ratio for "524\_fotonik3d" and determine if similar issues exist in other systems.
</details>
Figure 5. Ratio(%) of Subarray conflicts.
3.2. Inefficiency of Channel-Wide Stall of RFM ab
The ABO mechanism notifies the memory controller when a row’s activation count crosses the threshold. After the 180ns pre-recovery period, the controller issues an RFM ab command, triggering a 350ns stall across the entire memory channel even if only a small subset of banks require mitigation.
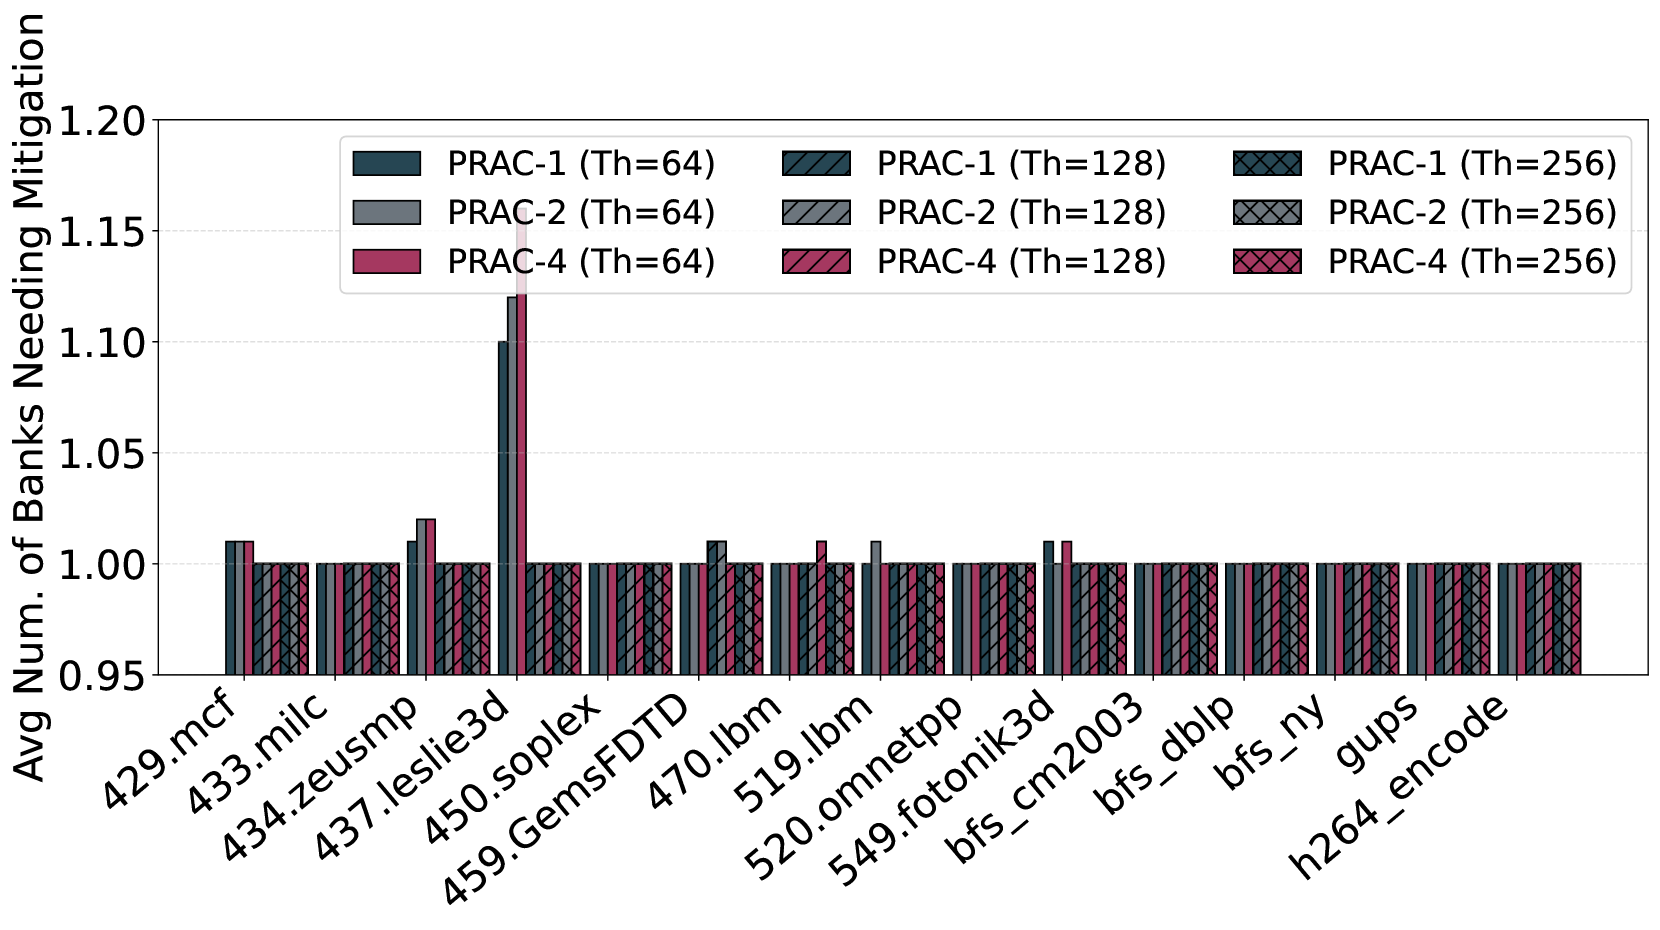
This coarse-grained stall mechanism is overly conservative. Across a wide range of benign workloads, our measurements show that, on average, only 1.16 out of 64 banks require mitigation when an ABO signal is raised (Figure 7) and maximum of 4 banks need mitigation across all recovery periods (Figure 8). As a result, over 90% of the banks are unnecessarily stalled during each recovery phase, significantly reducing memory-level parallelism and penalizing threads accessing unaffected banks.
Although a bank may not require recovery, i.e., it does not contain any hot rows, the issuance of the RFM ab command blocks memory accesses to all banks within the channel. To utilize this otherwise idle period, prior works (Qureshi and Qazi, 2024; Canpolat et al., 2025; Woo et al., 2025) adopt opportunistic mitigation strategies. These strategies proactively refresh potential victim rows whose counters are likely to reach the critical threshold in the near future. Specifically, upon issuance of RFM ab, each bank refreshes rows adjacent to the row with the highest activation count (i.e., the most likely aggressor), thereby ensuring that banks do not remain idle and reducing the need for issuing additional RFM ab commands in the future.
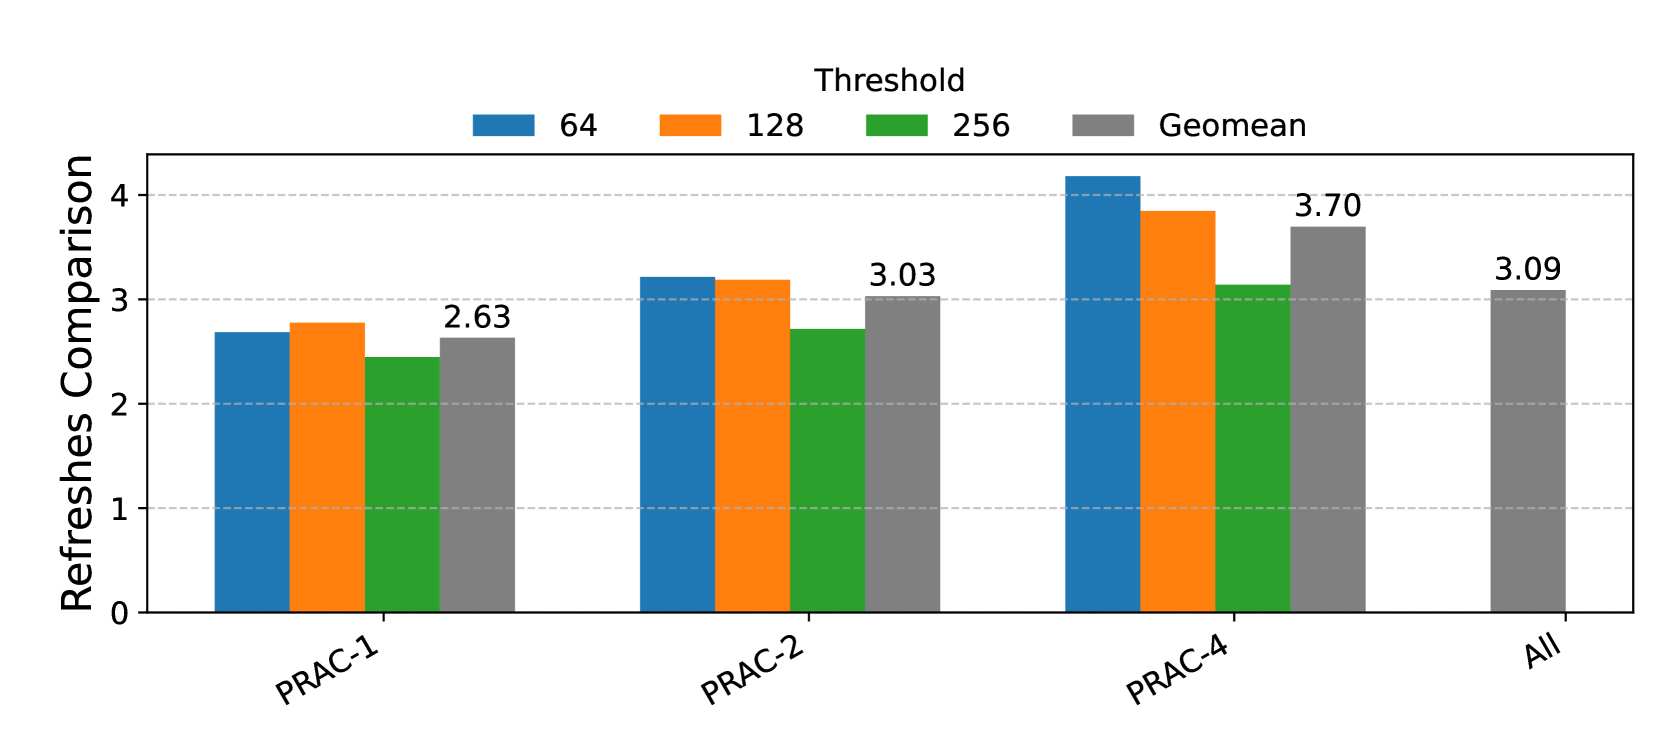
However, this approach introduces inefficiencies. Not all of the refreshes performed are strictly necessary, leading to redundant operations. To quantify this overhead, we compare the number of total RFM refreshes that are strictly required to those actually performed under opportunistic mitigation. As shown in Figure 6, the results, aggregated as the geometric mean across multiple PRAC variants (PRAC-1, PRAC-2, PRAC-4) and thresholds (64, 128, 256), demonstrate that opportunistic mitigation incurs more than a 3× increase in RFM refreshes. This analysis underscores a significant trade-off: while opportunistic mitigation reduces idle bank time and preempts future violations, it comes at the cost of approximately 70% higher RFM -related energy consumption in DRAM.
<details>
<summary>x6.png Details</summary>
### Visual Description
\n
## Bar Chart: Refreshes Comparison
### Overview
The image presents a bar chart comparing "Refreshes" across four different categories: PRAC-1, PRAC-2, PRAC-4, and "All". The chart displays data for four different thresholds: 64, 128, 256, and the geometric mean (Geomean). The y-axis represents the value of "Refreshes Comparison", ranging from 0 to 4.
### Components/Axes
* **Y-axis:** "Refreshes Comparison" (Scale: 0 to 4, increments of 1)
* **X-axis:** Categories: PRAC-1, PRAC-2, PRAC-4, All
* **Legend:** Located at the top-right of the chart.
* Blue: Threshold 64
* Orange: Threshold 128
* Green: Threshold 256
* Gray: Geomean
### Detailed Analysis
The chart consists of four groups of bars, one for each category on the x-axis. Each group contains four bars, representing the four thresholds.
* **PRAC-1:**
* Threshold 64: Approximately 2.80
* Threshold 128: Approximately 2.40
* Threshold 256: Approximately 1.00
* Geomean: 2.63
* **PRAC-2:**
* Threshold 64: Approximately 3.10
* Threshold 128: Approximately 3.20
* Threshold 256: Approximately 1.00
* Geomean: 3.03
* **PRAC-4:**
* Threshold 64: Approximately 4.20
* Threshold 128: Approximately 3.80
* Threshold 256: Approximately 1.00
* Geomean: 3.70
* **All:**
* Threshold 64: Approximately 3.00
* Threshold 128: Approximately 3.00
* Threshold 256: Approximately 1.00
* Geomean: 3.09
The bars for Threshold 256 are consistently low (around 1.00) across all categories. The Geomean values are generally higher than the Threshold 256 bars, but lower than the Threshold 64 and 128 bars.
### Key Observations
* PRAC-4 consistently shows the highest values for Thresholds 64 and 128.
* Threshold 256 consistently shows the lowest values across all categories.
* The Geomean values are relatively stable across the categories, hovering around 3.0.
* The difference between the Threshold 64/128 bars and the Geomean bar is most pronounced in PRAC-4.
### Interpretation
The chart demonstrates the impact of different thresholds on the number of refreshes. The consistently low values for the 256 threshold suggest that this threshold is rarely triggered, or that refreshes are not needed at this level. The higher values for the 64 and 128 thresholds indicate that these thresholds are more frequently met, leading to more refreshes.
The Geomean provides a central tendency measure, indicating the typical number of refreshes across all thresholds. The fact that the Geomean is lower than the 64 and 128 thresholds suggests that the lower thresholds are driving the overall refresh rate.
The significant difference between the thresholds and the Geomean in PRAC-4 suggests that this category is particularly sensitive to the lower thresholds, and that reducing the refresh rate at these thresholds could have a substantial impact on overall performance. The "All" category provides a baseline for comparison, showing that the overall refresh rate is similar to that of PRAC-2.
</details>
Figure 6. Comparison of number of RFM refreshes for opportunistic mitigation for PRAC-1, 2, and 4 and thresholds of 64, 128, and 256.
Observation 2: In benign workloads, fewer than 10% of banks require mitigation during an ABO-triggered recovery period, while opportunistic mitigation performs 3x more recovery refreshes than needed.
<details>
<summary>x7.png Details</summary>
### Visual Description
## Bar Chart: Average Number of Banks Needing Mitigation
### Overview
This bar chart compares the average number of banks needing mitigation across different applications (listed on the x-axis) for different PRAC configurations (PRAC-1, PRAC-2, PRAC-4) and thread counts (Th=64, Th=128, Th=256). The y-axis represents the average number of banks needing mitigation. Each application has three bars representing the different PRAC/thread configurations.
### Components/Axes
* **X-axis:** Application names: 429.mcf, 433.milc, 434.zeusmp, 437.leslie3d, 450.soplex, 459.GemsFDTD, 470.lbm, 519.lbm, 520.omnetpp, 549.fotonik3d, bfs\_cm2003, bfs\_dlbp, bfs\_ny, gups, h264\_encode.
* **Y-axis:** "Avg Num. of Banks Needing Mitigation", ranging from approximately 0.95 to 1.20.
* **Legend:** Located at the top of the chart, horizontally aligned.
* PRAC-1 (Th=64) - Dark Blue
* PRAC-2 (Th=64) - Gray
* PRAC-4 (Th=64) - Pink
* PRAC-1 (Th=128) - Medium Blue
* PRAC-2 (Th=128) - Light Gray
* PRAC-4 (Th=128) - Light Pink
* PRAC-1 (Th=256) - Dark Cyan
* PRAC-2 (Th=256) - Light Cyan
* PRAC-4 (Th=256) - Purple
### Detailed Analysis
The chart consists of 15 applications, each with three bars representing different PRAC and thread configurations. The bars represent the average number of banks needing mitigation.
Here's a breakdown of the approximate values for each application and configuration:
* **429.mcf:**
* PRAC-1 (Th=64): ~1.01
* PRAC-2 (Th=64): ~1.01
* PRAC-4 (Th=64): ~1.01
* PRAC-1 (Th=128): ~1.01
* PRAC-2 (Th=128): ~1.01
* PRAC-4 (Th=128): ~1.01
* PRAC-1 (Th=256): ~1.01
* PRAC-2 (Th=256): ~1.01
* PRAC-4 (Th=256): ~1.01
* **433.milc:**
* PRAC-1 (Th=64): ~1.02
* PRAC-2 (Th=64): ~1.02
* PRAC-4 (Th=64): ~1.02
* PRAC-1 (Th=128): ~1.02
* PRAC-2 (Th=128): ~1.02
* PRAC-4 (Th=128): ~1.02
* PRAC-1 (Th=256): ~1.02
* PRAC-2 (Th=256): ~1.02
* PRAC-4 (Th=256): ~1.02
* **434.zeusmp:**
* PRAC-1 (Th=64): ~1.03
* PRAC-2 (Th=64): ~1.03
* PRAC-4 (Th=64): ~1.03
* PRAC-1 (Th=128): ~1.03
* PRAC-2 (Th=128): ~1.03
* PRAC-4 (Th=128): ~1.03
* PRAC-1 (Th=256): ~1.03
* PRAC-2 (Th=256): ~1.03
* PRAC-4 (Th=256): ~1.03
* **437.leslie3d:**
* PRAC-1 (Th=64): ~1.04
* PRAC-2 (Th=64): ~1.04
* PRAC-4 (Th=64): ~1.04
* PRAC-1 (Th=128): ~1.04
* PRAC-2 (Th=128): ~1.04
* PRAC-4 (Th=128): ~1.04
* PRAC-1 (Th=256): ~1.04
* PRAC-2 (Th=256): ~1.04
* PRAC-4 (Th=256): ~1.04
* **450.soplex:**
* PRAC-1 (Th=64): ~1.01
* PRAC-2 (Th=64): ~1.01
* PRAC-4 (Th=64): ~1.01
* PRAC-1 (Th=128): ~1.01
* PRAC-2 (Th=128): ~1.01
* PRAC-4 (Th=128): ~1.01
* PRAC-1 (Th=256): ~1.01
* PRAC-2 (Th=256): ~1.01
* PRAC-4 (Th=256): ~1.01
* **459.GemsFDTD:**
* PRAC-1 (Th=64): ~1.02
* PRAC-2 (Th=64): ~1.02
* PRAC-4 (Th=64): ~1.02
* PRAC-1 (Th=128): ~1.02
* PRAC-2 (Th=128): ~1.02
* PRAC-4 (Th=128): ~1.02
* PRAC-1 (Th=256): ~1.02
* PRAC-2 (Th=256): ~1.02
* PRAC-4 (Th=256): ~1.02
* **470.lbm:**
* PRAC-1 (Th=64): ~1.01
* PRAC-2 (Th=64): ~1.01
* PRAC-4 (Th=64): ~1.01
* PRAC-1 (Th=128): ~1.01
* PRAC-2 (Th=128): ~1.01
* PRAC-4 (Th=128): ~1.01
* PRAC-1 (Th=256): ~1.01
* PRAC-2 (Th=256): ~1.01
* PRAC-4 (Th=256): ~1.01
* **519.lbm:**
* PRAC-1 (Th=64): ~1.01
* PRAC-2 (Th=64): ~1.01
* PRAC-4 (Th=64): ~1.01
* PRAC-1 (Th=128): ~1.01
* PRAC-2 (Th=128): ~1.01
* PRAC-4 (Th=128): ~1.01
* PRAC-1 (Th=256): ~1.01
* PRAC-2 (Th=256): ~1.01
* PRAC-4 (Th=256): ~1.01
* **520.omnetpp:**
* PRAC-1 (Th=64): ~1.01
* PRAC-2 (Th=64): ~1.01
* PRAC-4 (Th=64): ~1.01
* PRAC-1 (Th=128): ~1.01
* PRAC-2 (Th=128): ~1.01
* PRAC-4 (Th=128): ~1.01
* PRAC-1 (Th=256): ~1.01
* PRAC-2 (Th=256): ~1.01
* PRAC-4 (Th=256): ~1.01
* **549.fotonik3d:**
* PRAC-1 (Th=64): ~1.01
* PRAC-2 (Th=64): ~1.01
* PRAC-4 (Th=64): ~1.01
* PRAC-1 (Th=128): ~1.01
* PRAC-2 (Th=128): ~1.01
* PRAC-4 (Th=128): ~1.01
* PRAC-1 (Th=256): ~1.01
* PRAC-2 (Th=256): ~1.01
* PRAC-4 (Th=256): ~1.01
* **bfs\_cm2003:**
* PRAC-1 (Th=64): ~1.01
* PRAC-2 (Th=64): ~1.01
* PRAC-4 (Th=64): ~1.01
* PRAC-1 (Th=128): ~1.01
* PRAC-2 (Th=128): ~1.01
* PRAC-4 (Th=128): ~1.01
* PRAC-1 (Th=256): ~1.01
* PRAC-2 (Th=256): ~1.01
* PRAC-4 (Th=256): ~1.01
* **bfs\_dlbp:**
* PRAC-1 (Th=64): ~1.01
* PRAC-2 (Th=64): ~1.01
* PRAC-4 (Th=64): ~1.01
* PRAC-1 (Th=128): ~1.01
* PRAC-2 (Th=128): ~1.01
* PRAC-4 (Th=128): ~1.01
* PRAC-1 (Th=256): ~1.01
* PRAC-2 (Th=256): ~1.01
* PRAC-4 (Th=256): ~1.01
* **bfs\_ny:**
* PRAC-1 (Th=64): ~1.01
* PRAC-2 (Th=64): ~1.01
* PRAC-4 (Th=64): ~1.01
* PRAC-1 (Th=128): ~1.01
* PRAC-2 (Th=128): ~1.01
* PRAC-4 (Th=128): ~1.01
* PRAC-1 (Th=256): ~1.01
* PRAC-2 (Th=256): ~1.01
* PRAC-4 (Th=256): ~1.01
* **gups:**
* PRAC-1 (Th=64): ~1.01
* PRAC-2 (Th=64): ~1.01
* PRAC-4 (Th=64): ~1.01
* PRAC-1 (Th=128): ~1.01
* PRAC-2 (Th=128): ~1.01
* PRAC-4 (Th=128): ~1.01
* PRAC-1 (Th=256): ~1.01
* PRAC-2 (Th=256): ~1.01
* PRAC-4 (Th=256): ~1.01
* **h264\_encode:**
* PRAC-1 (Th=64): ~1.01
* PRAC-2 (Th=64): ~1.01
* PRAC-4 (Th=64): ~1.01
* PRAC-1 (Th=128): ~1.01
* PRAC-2 (Th=128): ~1.01
* PRAC-4 (Th=128): ~1.01
* PRAC-1 (Th=256): ~1.01
* PRAC-2 (Th=256): ~1.01
* PRAC-4 (Th=256): ~1.01
### Key Observations
The average number of banks needing mitigation is consistently around 1.01 for most applications and PRAC/thread configurations. There is very little variation across the different configurations. The values are all very close to 1.0, suggesting that the mitigation needs are relatively stable across these parameters.
### Interpretation
The data suggests that the PRAC configuration and thread count (within the tested range of 64, 128, and 256) have a minimal impact on the average number of banks needing mitigation for these applications. The consistently low values (around 1.01) indicate that the mitigation requirements are generally low. This could imply that the applications are well-suited to the PRAC architecture, or that the mitigation techniques employed are effective regardless of the specific configuration. The lack of significant variation suggests that optimizing PRAC or thread count for mitigation purposes may not yield substantial benefits for these workloads. The data does not provide information on *why* mitigation is needed, or the nature of the mitigation itself. Further investigation would be needed to understand the underlying causes of mitigation requirements and the effectiveness of different mitigation strategies.
</details>
Figure 7. Average number of banks that need mitigation on an ABO signal for benign workloads 429.mcf 433.milc 434.zeusmp 437.leslie3d 450.soplex 459.GemsFDTD 470.lbm 519.lbm 520.omnetpp 549.fotonik3d bfs_cm2003 bfs_dblp bfs_ny gups h264_encode $0 0$ $1$ $2$ $3$ $4$ Max Num. of Banks Needing Mitigation PRAC-1 PRAC-2 PRAC-4
Figure 8. Maximum number of banks that need mitigation on an ABO signal for benign workloads.
3.3. Exploiting ABO: Performance Attacks
The coarse-grained nature of the ABO protocol introduces a new form of unfairness in DRAM systems, making them susceptible to performance slowdown attacks. Because the ABO signal triggers channel-wide stalls without identifying the specific bank responsible for the excessive activation, a malicious actor can exploit this limitation to repeatedly disrupt system-level memory access.
In particular, an attacker can intentionally issue frequent row activations to a single bank to induce an ABO event. Since the memory controller stalls the entire memory channel upon receiving an alert, without visibility into which bank requires mitigation, benign workloads distributed across other banks also suffer from the resulting stall. This lack of spatial granularity makes it extremely difficult to attribute the cause of the alert or to selectively suppress malicious access patterns, rendering existing defenses ineffective against such attacks. MOAT (Qureshi and Qazi, 2024) proposed the Torrent-of-Staggered-ALERT (TSA) attack, a performance degradation strategy that carefully coordinates ALERTs across multiple DRAM banks. In this attack, each bank repeatedly activates a small set of rows (e.g., rows A, B, C, D, E) to trigger an ALERT. Crucially, banks issue ACTs in a staggered fashion: a bank only initiates activation once all targeted rows in the previous bank have caused ALERTs and entered the mitigation phase. This serialized activation ensures that when one bank is under mitigation, other banks are forced to stall, as there are no eligible rows to activate without interference. This deliberate serialization of ALERTs forms a torrent of staggered mitigation events, significantly throttling memory concurrency. The attack was shown to reduce system throughput by 24% with four banks and up to 52% with 17 banks, aligning with the tFAW constraint.
BreakHammer (Canpolat et al., 2024a) introduces a score-based mitigation framework that assigns a score to each hardware thread based on its contribution to Rowhammer mitigation events. This approach is particularly effective when mitigation logic is implemented within the MC, where score attribution can be performed at finer spatial granularity, such as individual banks or row activations. However, performance degradation attacks may evade detection under BreakHammer when mitigations are signaled via coarse-grained mechanisms such as the Alert Back-Off (ABO) signal.
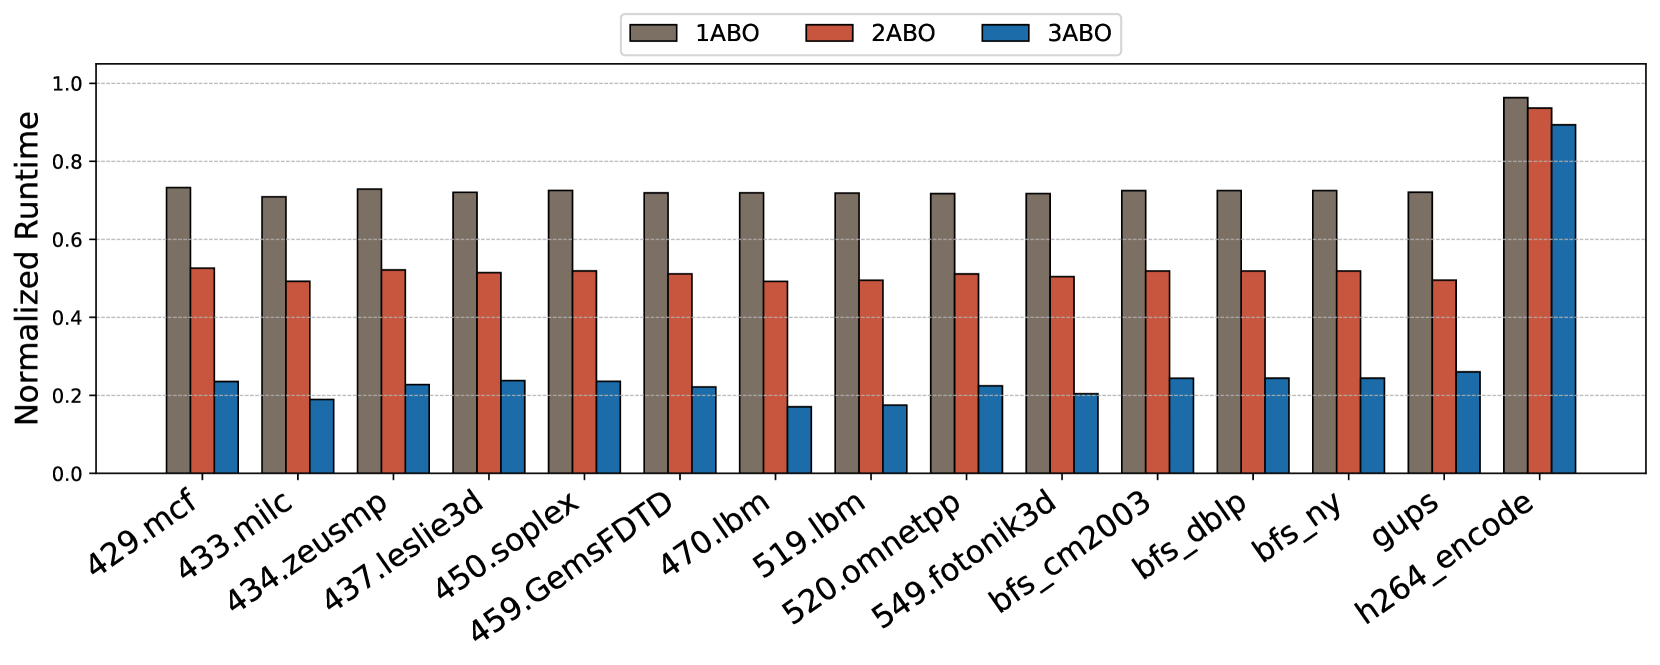
A broader class of memory performance degradation attacks exploits the observation that Rowhammer mitigations, such as recovery operations, are triggered more frequently at lower thresholds. As the mitigation frequency increases, overall system performance degrades significantly. To evaluate the performance cost associated with frequent mitigation, we study the impact of varying thresholds— 64, 32, and 16 as considered in prior works (Woo et al., 2025; Canpolat et al., 2025). Assuming a refresh interval (tREFI) of 3900 ns and a refresh operation latency (REF) of 410 ns, approximately 67 row activations can be issued within one tREFI interval. We consider a closed-row memory policy where each activated row is closed after access. For a realistic scenario, an attacker can alternate between two rows to issue repeated activations. Under a threshold of 64, this behavior can typically trigger one Alert per tREFI. For thresholds of 32 and 16, the number of ALERTs increases proportionally, allowing an attacker to induce two to three (or even four) ALERTs within the same interval. Based on this analysis, we evaluate performance degradation under scenarios involving one, two, and three ALERTs per tREFI duration to quantify the impact of aggressive mitigation triggering. As shown in Figure 9, even a single ABO event per interval results in a 20–30% slowdown for most applications. With three alerts per interval, performance degradation exceeds 80% in several cases. Interestingly, workloads such as h264_encode exhibit resilience due to their lower sensitivity to DRAM stalls, but most others are highly vulnerable. These results demonstrate that the lack of bank-level precision in ABO signaling can be exploited by attackers to inflict disproportionate slowdowns on benign threads, emphasizing the need for spatially-aware mitigation mechanisms.
Observation 3: Coarse-grained ABO signaling enables attackers to trigger repeated channel-wide stalls, leading to excessive performance loss.
<details>
<summary>x8.png Details</summary>
### Visual Description
## Bar Chart: Normalized Runtime Comparison
### Overview
This bar chart compares the normalized runtime of three different configurations (1ABO, 2ABO, and 3ABO) across a series of applications/benchmarks. The y-axis represents the normalized runtime, ranging from 0.0 to 1.0, while the x-axis lists the names of the applications. Each application has three bars representing the runtime for each configuration.
### Components/Axes
* **X-axis:** Application/Benchmark Names: 429.mcf, 433.milc, 434.zeusmp, 437.leslie3d, 450.soplex, 459.GemsFDTD, 470.lbm, 519.lbm, 520.omnetpp, 549.fotonik3d, bfs\_cm2003, bfs\_dlbp, bfs\_ny, gups, h264\_encode.
* **Y-axis:** Normalized Runtime (Scale: 0.0 to 1.0)
* **Legend:**
* 1ABO (Red)
* 2ABO (Blue)
* 3ABO (Gray)
### Detailed Analysis
The chart consists of 15 applications, each with three bars representing the normalized runtime for 1ABO, 2ABO, and 3ABO configurations. I will analyze each application individually, noting approximate values.
* **429.mcf:** 1ABO ≈ 0.72, 2ABO ≈ 0.22, 3ABO ≈ 0.18
* **433.milc:** 1ABO ≈ 0.68, 2ABO ≈ 0.20, 3ABO ≈ 0.16
* **434.zeusmp:** 1ABO ≈ 0.64, 2ABO ≈ 0.24, 3ABO ≈ 0.20
* **437.leslie3d:** 1ABO ≈ 0.56, 2ABO ≈ 0.28, 3ABO ≈ 0.24
* **450.soplex:** 1ABO ≈ 0.52, 2ABO ≈ 0.26, 3ABO ≈ 0.22
* **459.GemsFDTD:** 1ABO ≈ 0.50, 2ABO ≈ 0.24, 3ABO ≈ 0.20
* **470.lbm:** 1ABO ≈ 0.48, 2ABO ≈ 0.22, 3ABO ≈ 0.18
* **519.lbm:** 1ABO ≈ 0.44, 2ABO ≈ 0.20, 3ABO ≈ 0.16
* **520.omnetpp:** 1ABO ≈ 0.40, 2ABO ≈ 0.18, 3ABO ≈ 0.14
* **549.fotonik3d:** 1ABO ≈ 0.36, 2ABO ≈ 0.16, 3ABO ≈ 0.12
* **bfs\_cm2003:** 1ABO ≈ 0.32, 2ABO ≈ 0.14, 3ABO ≈ 0.10
* **bfs\_dlbp:** 1ABO ≈ 0.28, 2ABO ≈ 0.12, 3ABO ≈ 0.08
* **bfs\_ny:** 1ABO ≈ 0.24, 2ABO ≈ 0.10, 3ABO ≈ 0.06
* **gups:** 1ABO ≈ 0.96, 2ABO ≈ 0.24, 3ABO ≈ 0.20
* **h264\_encode:** 1ABO ≈ 0.92, 2ABO ≈ 0.22, 3ABO ≈ 0.18
**Trends:**
* For most applications, 1ABO consistently exhibits the highest normalized runtime, followed by 2ABO, and then 3ABO.
* The difference in runtime between 1ABO and the other configurations is more pronounced for some applications (e.g., gups, h264\_encode) than others.
* The runtime for 2ABO and 3ABO are relatively close for many applications.
### Key Observations
* The application "gups" shows a significantly higher normalized runtime for 1ABO (approximately 0.96) compared to 2ABO (0.24) and 3ABO (0.20). This suggests that 1ABO performs substantially worse on this particular benchmark.
* Similarly, "h264\_encode" also shows a large difference, with 1ABO at approximately 0.92.
* For applications like "bfs\_dlbp" and "bfs\_ny", the runtime differences between the configurations are smaller.
### Interpretation
The chart demonstrates the performance impact of different configurations (1ABO, 2ABO, 3ABO) on a variety of applications. The normalized runtime indicates the relative execution time, with higher values representing longer runtimes.
The consistent dominance of 1ABO in terms of runtime suggests that this configuration may be less optimized for these benchmarks compared to 2ABO and 3ABO. The large differences observed in "gups" and "h264\_encode" indicate that 1ABO is particularly inefficient for these specific workloads.
The relatively similar performance of 2ABO and 3ABO across most applications suggests that the changes between these configurations have a less significant impact on runtime. This could be due to the optimizations already present in 2ABO being sufficient, or that the specific changes in 3ABO do not translate to substantial performance gains for these benchmarks.
Further investigation would be needed to understand the underlying reasons for these performance differences. This could involve profiling the applications under each configuration to identify bottlenecks and areas for optimization. The chart provides a valuable starting point for identifying which applications benefit most from switching to 2ABO or 3ABO.
</details>
Figure 9. Percentage slowdown of benign applications when there is a 1, 2 and 3 ABO alerts happening in each tREFI
4. PRACtical Design and Implementation
To overcome the limitations of PRAC+ABO, we introduce PRACtical—an enhanced version that builds upon the original framework. PRACtical extends the underlying mechanisms to significantly reduce performance overheads while maintaining the robust security guarantees offered by state-of-the-art Rowhammer mitigation techniques. This section presents an overview of the design and implementation of PRACtical.
4.1. Overview and Design Goals
The core design principle of PRACtical is to minimize the performance overheads inherent in the original PRAC+ABO mechanism. Specifically, the design aims to achieve the following two objectives:
1. Reduce PRAC update latency through subarray-level decoupling. Enable subarray-level counter updates to allow overlapping the counter update time of a row with activation of the next row when rows are non-conflicting at subarray-level, eliminating the 21ns counter update delay.
1. Minimize unnecessary memory stalls with fine-grained recovery command. Refine RFM ab to operate at bank-level granularity, allowing the memory controller to stall only the affected banks instead of the entire channel.
4.2. Hardware Modifications
PRACtical introduces minimal hardware modifications to enable fine-grained, low-latency RowHammer mitigation by enhancing the PRAC+ABO feature.
First, to support subarray-level PRAC updates, the traditional bank-level increment logic, typically located near the global row buffer, is replaced with a centralized increment circuit that is connected to local row buffers in subarrays through a different bus (8-wire bus for 8-bit counters). This design allows counter updates without delaying the subsequent memory accesses to the memory bank that do not conflict at the subarray level. Correspondingly, the memory controller is extended with subarray mapping logic and an address decoder capable of identifying the target subarray for each memory request.
Second, to enable fine-grained bank-level recovery stalling, the DRAM chip is modified to include a new control register called the Bank Alert (BA) register. This register contains one bit per bank, where each bit indicates whether a given bank has any rows with an activation number higher than the Alert threshold. The contents of the BA register are communicated to the memory controller and serve as a mask, allowing the controller to selectively stall only the requests to the banks under mitigation while continuing to issue commands to unaffected banks.
4.3. PRACtical Mechanism
PRACtical introduces two core mechanisms to reduce the performance overheads associated with the PRAC+ABO framework while maintaining its security guarantees against RowHammer attacks.
4.3.1. Subarray-Level PRAC Updates
<details>
<summary>x9.png Details</summary>
### Visual Description
\n
## Diagram: DRAM Bank Operation with PRAC Timing
### Overview
The image is a diagram illustrating the operation of a DRAM bank, specifically focusing on how the memory controller handles subarray conflicts and PRAC (Precharge Access) timing. The diagram is split into two main sections: "Memory Ctrl." (Memory Controller) on the left and "DRAM Bank" on the right. It depicts a flow chart within the memory controller and the internal structure of the DRAM bank, showing how they interact.
### Components/Axes
The diagram consists of the following components:
* **Memory Ctrl. (Memory Controller):** Contains blocks representing "Memory Access", "Find Subarray ID", "SA Conflict?", "PRAC Timing", and "No Need to Wait for Subarray PRAC Update".
* **DRAM Bank:** Contains "Global Row Dec.", "Row Dec.", "Subarray" (repeated twice), "Local row buffer" (repeated twice), "Global row buffer", and "counters" (repeated twice).
* **Flow Arrows:** Indicate the direction of data flow and decision-making.
* **Numbered Steps:** 1, 2, 3, and 4 mark the sequence of operations.
### Detailed Analysis or Content Details
The diagram illustrates the following process:
1. **Memory Access:** The process begins with a memory access request.
2. **Find Subarray ID:** The memory controller identifies the subarray associated with the access.
3. **SA Conflict?:** A decision is made whether there is a subarray (SA) conflict.
* **Yes:** If a conflict exists, the process proceeds to "PRAC Timing".
* **No:** If no conflict exists, the process proceeds to "No Need to Wait for Subarray PRAC Update".
4. **PRAC Timing:** This block represents the timing required for precharge access, likely to resolve the subarray conflict.
5. **No Need to Wait for Subarray PRAC Update:** This indicates that the operation can proceed without waiting for a PRAC update, as there was no conflict.
Within the DRAM Bank section:
* **Global Row Dec.:** Drives the "Row Dec." signals.
* **Row Dec.:** Selects specific rows within the subarrays.
* **Subarray:** Contains a "Local row buffer" and a series of dotted lines representing data storage.
* **Local row buffer:** Stores data from the selected subarray rows.
* **counters:** Connected to the subarrays, likely for addressing or timing purposes.
* **Global row buffer:** A larger buffer connected to both subarrays.
* The DRAM Bank contains two subarrays stacked vertically.
* The "counters" are positioned to the right of each subarray.
* The "Global row buffer" is positioned below the second subarray.
* A "+" symbol is present at the bottom-right of the DRAM Bank section, likely indicating a summation or combination of data.
### Key Observations
* The diagram highlights the importance of managing subarray conflicts in DRAM operation.
* The PRAC timing mechanism is presented as a solution to resolve these conflicts.
* The DRAM bank structure shows a hierarchical arrangement with global and local row buffers.
* The diagram focuses on the control flow and data path within the DRAM system.
### Interpretation
The diagram demonstrates a simplified model of how a memory controller manages access to a DRAM bank, specifically addressing the issue of subarray conflicts. The PRAC timing mechanism is presented as a critical step in resolving these conflicts, ensuring data integrity and efficient memory access. The hierarchical structure of the DRAM bank, with global and local row buffers, suggests a strategy for optimizing data storage and retrieval. The diagram implies that the memory controller actively monitors for subarray conflicts and adjusts the timing accordingly to maintain system performance. The "+" symbol at the bottom right suggests that the data from the two subarrays may be combined or processed in some way. This diagram is a high-level overview and does not delve into the specific details of the PRAC timing algorithm or the data processing performed by the "+" symbol. It serves as a conceptual illustration of the key components and interactions within a DRAM system.
</details>
Figure 10. PRACtical adds subarray-level PRAC increment logic to enable independent counter updates and avoid bank-wide stalls across all subarrays.
This mechanism improves subarray-level parallelism by enabling PRAC counter updates at the subarray level, rather than enforcing bank-wide delays. In the original PRAC design, counter updates introduce additional latency, particularly during precharge operations, because the increment logic is shared at the bank level. This design forces all subarrays within the bank to stall while the update completes. PRACtical addresses this limitation by introducing a centralized PRAC increment logic that connects to the local row buffers of all subarrays, as illustrated in Figure 10.
Upon receiving a memory access request, the memory controller computes the subarray identifier (Subarray ID) for the target row 1. If the new request targets the same subarray or nearby subarray that is currently undergoing a PRAC update (i.e. subarray conflict) 2, the controller applies the required timing constraints to ensure that the update completes before issuing a new activation 3. In contrast, if the access targets a different non-conflicting subarray, the controller can proceed with the activation command immediately, without waiting for the PRAC update to finish 4. In this case, counter value of the precharged row is forwarded to the increment unit and the entire row is transferred from the global to the local row buffer. This precharge operation takes 15 ns to complete. After this delay, the increment circuit updates the counter and transmits the new value to the corresponding local row buffer via a dedicated counter data bus. This approach allows subarrays to operate independently, preventing unrelated memory accesses from being delayed by PRAC updates in other subarrays, as illustrated in Figure 11. As a result, PRACtical reduces access latency, particularly in workloads that exhibit diverse subarray access patterns.
<details>
<summary>x10.png Details</summary>
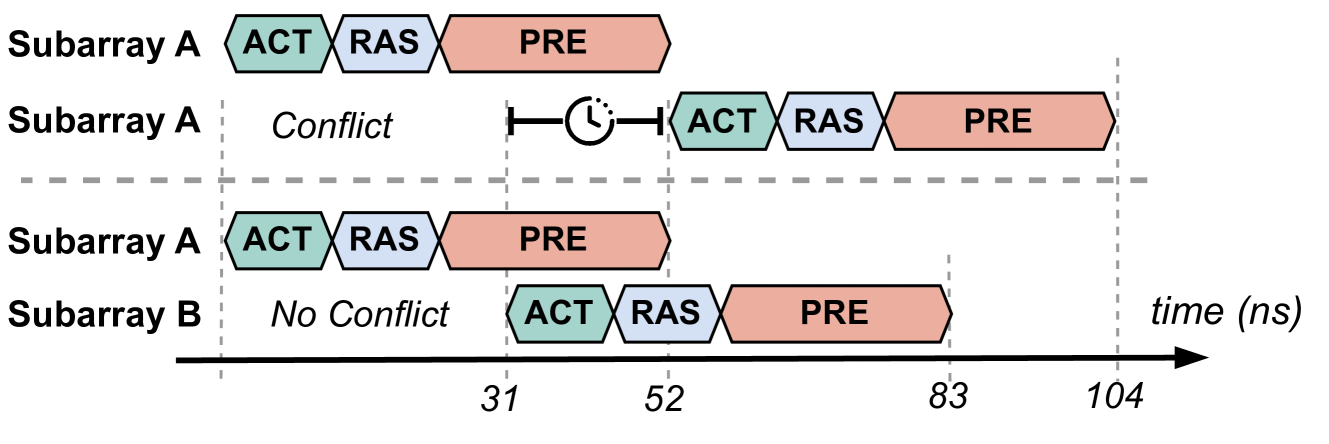
### Visual Description
\n
## Diagram: Memory Subarray Timing Conflict
### Overview
The image is a timing diagram illustrating a potential conflict between memory subarray accesses. It depicts the timing of ACT (Activate), RAS (Row Address Strobe), and PRE (Precharge) commands for two subarrays, A and B, over time. The diagram highlights a conflict scenario in the upper portion and a non-conflict scenario in the lower portion. The time axis is measured in nanoseconds (ns).
### Components/Axes
* **Y-axis:** Represents the subarrays, labeled "Subarray A" and "Subarray B".
* **X-axis:** Represents time, labeled "time (ns)", with markers at 31, 52, 83, and 104 ns.
* **Command Blocks:** Rectangular blocks represent the duration of each command:
* ACT (Activate) - Teal
* RAS (Row Address Strobe) - White
* PRE (Precharge) - Red/Brown
* **Labels:**
* "Conflict" - Indicates a timing conflict in the upper subarray A.
* "No Conflict" - Indicates no timing conflict in the lower subarray B.
* **Circular Arrow:** A circular arrow with opposing ends indicates the timing conflict.
### Detailed Analysis
The diagram shows the timing of ACT, RAS, and PRE commands for Subarray A in two scenarios, and Subarray B in one scenario.
**Subarray A (Conflict):**
* ACT starts at approximately 0 ns and ends around 15 ns.
* RAS starts at approximately 15 ns and ends around 31 ns.
* PRE starts at approximately 31 ns and ends around 52 ns.
* A second ACT starts at approximately 52 ns and ends around 67 ns.
* A second RAS starts at approximately 67 ns and ends around 83 ns.
* A second PRE starts at approximately 83 ns and ends around 104 ns.
**Subarray A (No Conflict):**
* ACT starts at approximately 0 ns and ends around 15 ns.
* RAS starts at approximately 15 ns and ends around 31 ns.
* PRE starts at approximately 31 ns and ends around 52 ns.
**Subarray B (No Conflict):**
* ACT starts at approximately 31 ns and ends around 46 ns.
* RAS starts at approximately 46 ns and ends around 62 ns.
* PRE starts at approximately 62 ns and ends around 83 ns.
The conflict is visually represented by the overlapping PRE command of the first cycle of Subarray A with the ACT command of the second cycle.
### Key Observations
* The conflict occurs when the PRE command of the first access overlaps with the ACT command of the subsequent access in Subarray A.
* Subarray B demonstrates a timing sequence that avoids this conflict.
* The diagram clearly illustrates the importance of timing in memory access to prevent conflicts.
### Interpretation
The diagram demonstrates a potential timing conflict in memory subarray access. The conflict arises when a precharge operation (PRE) for one row overlaps with an activate operation (ACT) for another row within the same subarray. This conflict can lead to data corruption or incorrect memory operation. The lower portion of the diagram shows how staggering the timing of accesses in Subarray B avoids the conflict. This suggests that careful scheduling of memory operations is crucial for maintaining data integrity and system stability. The diagram is a simplified representation of a complex process, likely used to illustrate a specific timing issue in memory controller design or analysis. The use of distinct colors for each command (ACT, RAS, PRE) aids in visualizing the timing relationships and identifying potential conflicts. The diagram is a clear and concise way to communicate a critical timing constraint in memory systems.
</details>
Figure 11. Illustration of conflicting (top row) and non-conflicting (bottom row) memory accesses across subarrays, demonstrating how PRACtical uses parallelism by avoiding unnecessary delay.
4.3.2. Bank-Level Stall for Recovery
<details>
<summary>x11.png Details</summary>
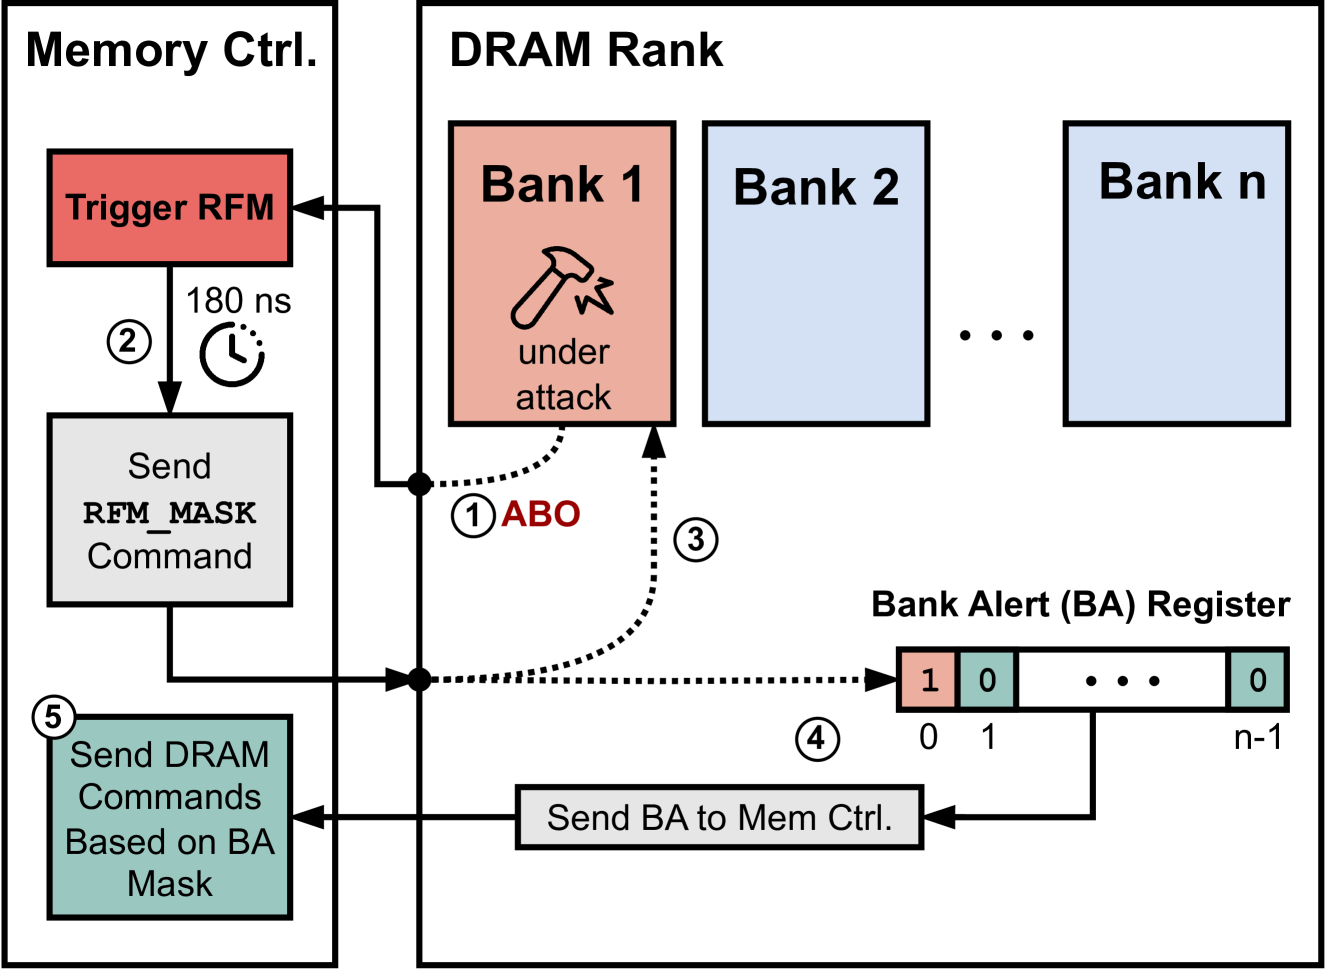
### Visual Description
\n
## Diagram: DRAM Rank Security Mechanism
### Overview
This diagram illustrates a security mechanism for DRAM (Dynamic Random Access Memory) ranks, specifically addressing a "Rowhammer" attack scenario. It depicts the interaction between a Memory Controller and a DRAM Rank, highlighting how a Bank Alert (BA) register is used to mask commands during an attack. The diagram shows a sequence of events triggered by a Rowhammer attack on a specific bank within the DRAM rank.
### Components/Axes
The diagram consists of three main sections:
1. **Memory Ctrl.** (Memory Controller): Located on the left side, this section represents the control logic.
2. **DRAM Rank:** Occupies the central portion, showing multiple banks within the DRAM.
3. **Bank Alert (BA) Register:** Positioned at the bottom, this register stores alert flags for each bank.
Key labels and annotations:
* "Memory Ctrl."
* "DRAM Rank"
* "Bank 1", "Bank 2", "Bank n"
* "under attack" (within Bank 1)
* "Bank Alert (BA) Register"
* "Trigger RFM"
* "180 ns" (with a clock icon)
* "Send RFM_MASK Command"
* "Send BA to Mem Ctrl."
* "Send DRAM Commands Based on BA Mask"
* "ABO" (Alert Bank Output)
* Numbered arrows (1-5) indicating the sequence of events.
* Binary values "0" and "1" within the BA Register, representing bank alert status.
### Detailed Analysis / Content Details
The diagram illustrates a five-step process:
1. **ABO (Alert Bank Output):** When Bank 1 is "under attack", it generates an ABO signal (represented by a dotted arrow).
2. **Trigger RFM:** The Memory Controller receives the ABO signal and triggers an RFM (Rowhammer Fault Mechanism) detection process, with a delay of approximately 180 nanoseconds.
3. **Send RFM_MASK Command:** After the delay, the Memory Controller sends an RFM_MASK command to the DRAM Rank.
4. **Send BA to Mem Ctrl.:** The DRAM Rank sends the Bank Alert (BA) information to the Memory Controller. The BA Register shows that Bank 1 is flagged with a "1", indicating an alert, while all other banks (up to 'n') are flagged with "0", indicating no alert. The register contains 'n' bits, one for each bank.
5. **Send DRAM Commands Based on BA Mask:** The Memory Controller uses the BA mask to selectively send DRAM commands. Commands to the alerted bank (Bank 1) are likely masked or modified to prevent the Rowhammer attack from succeeding.
The dotted lines represent signal flow, while solid lines represent command/data flow. The diagram shows a clear separation between the control logic (Memory Controller) and the memory itself (DRAM Rank).
### Key Observations
* The diagram focuses on a single bank ("Bank 1") being targeted by a Rowhammer attack.
* The BA Register is crucial for identifying and isolating the affected bank.
* The 180 ns delay suggests a timing window for RFM detection.
* The use of a mask implies that the Memory Controller can selectively disable or modify commands to the affected bank.
* The diagram does not specify the exact mechanism for detecting the Rowhammer attack (RFM).
### Interpretation
This diagram demonstrates a hardware-level mitigation strategy for Rowhammer attacks. The core idea is to detect when a bank is being subjected to a potentially harmful sequence of operations (Rowhammer) and then use a Bank Alert mechanism to prevent further damage. The Memory Controller acts as the central authority, receiving alerts from the DRAM Rank and then adjusting its command schedule accordingly.
The BA Register provides a simple but effective way to track the status of each bank. The 180 ns delay likely represents the time required to detect the attack and prepare the RFM_MASK command. The diagram suggests that the system is designed to be proactive, attempting to prevent the attack from succeeding rather than simply reacting to it after it has occurred.
The diagram does not provide details on the specific algorithms or thresholds used for RFM detection, nor does it specify how the RFM_MASK command is implemented. However, it clearly illustrates the overall architecture and flow of the security mechanism. The use of "Bank n" suggests the system is scalable to handle DRAM ranks with a variable number of banks.
</details>
Figure 12. Bank-Level Recovery Stall in PRACtical Using the Bank Alert (BA) Register and RFM_MASK.
PRACtical addresses the limitation of coarse-grained mitigation in the original PRAC+ABO framework by introducing bank-level recovery stall, enabling the memory controller to restrict mitigation only to the affected banks rather than stalling the entire memory channel. This selective mitigation is made possible through the use of a BA register, which functions as a mask to identify and isolate banks requiring Rowhammer mitigation as illuatrated in Figure 12.
When the PRAC counter of a bank exceeds the Alert threshold, the DRAM device sends the ABO signal to the memory controller 1. Upon receiving this signal, the memory controller enters a pre-recovery window, lasting 180 nanoseconds, during which it continues to process memory requests as normal 2. After this window, the controller issues RFM ab command to the DRAM to initiate recovery. PRACtical repurposes this command into a new command, termed RFM_MASK (Masked Refresh Management), which performs two key functions; it initiates recovery and functions as a register read command. First, the RFM_MASK command triggers the in-DRAM recovery mechanism for the affected bank 3. Second, it returns the contents of the BA register to the memory controller, indicating which banks are currently under mitigation 4. The BA register is reset once it is read. After its reset, a bank can set the corresponding bit in the register. The controller uses this information as a bitmask to manage access granularity during recovery. For any new memory request, the memory controller checks whether the target bank is marked as active in the BA register. If the request targets an unaffected bank, the controller proceeds to issue the command without delay. However, if the request targets a bank under recovery, the controller stalls the request until the mitigation phase completes 5.
Figure 13 illustrates how PRACtical leverages bank-level recovery stall to improve memory parallelism during RFM refreshes. In this example, Bank 1 exceeds the Alert threshold and triggers an ABO signal, initiating a short pre-recovery phase followed by the recovery phase. The banks modify their own bits in the register. Bank 1 will set its bit to 1. Upon receiving the RFM_MASK command the DRAM sends the contents of the BA register (0b1001) to the MC, which encodes the mitigation status of all banks. The BA mask in this case indicates that Bank 1 is under mitigation. As a result, the memory controller selectively stalls requests to Bank 1 while continuing to issue accesses to unaffected Banks 2 and 3. This fine-grained handling contrasts with the baseline PRAC+ABO design, where all banks would be stalled upon any ABO event. PRACtical thus reduces unnecessary interference and improves memory-level concurrency during mitigation.
<details>
<summary>x12.png Details</summary>
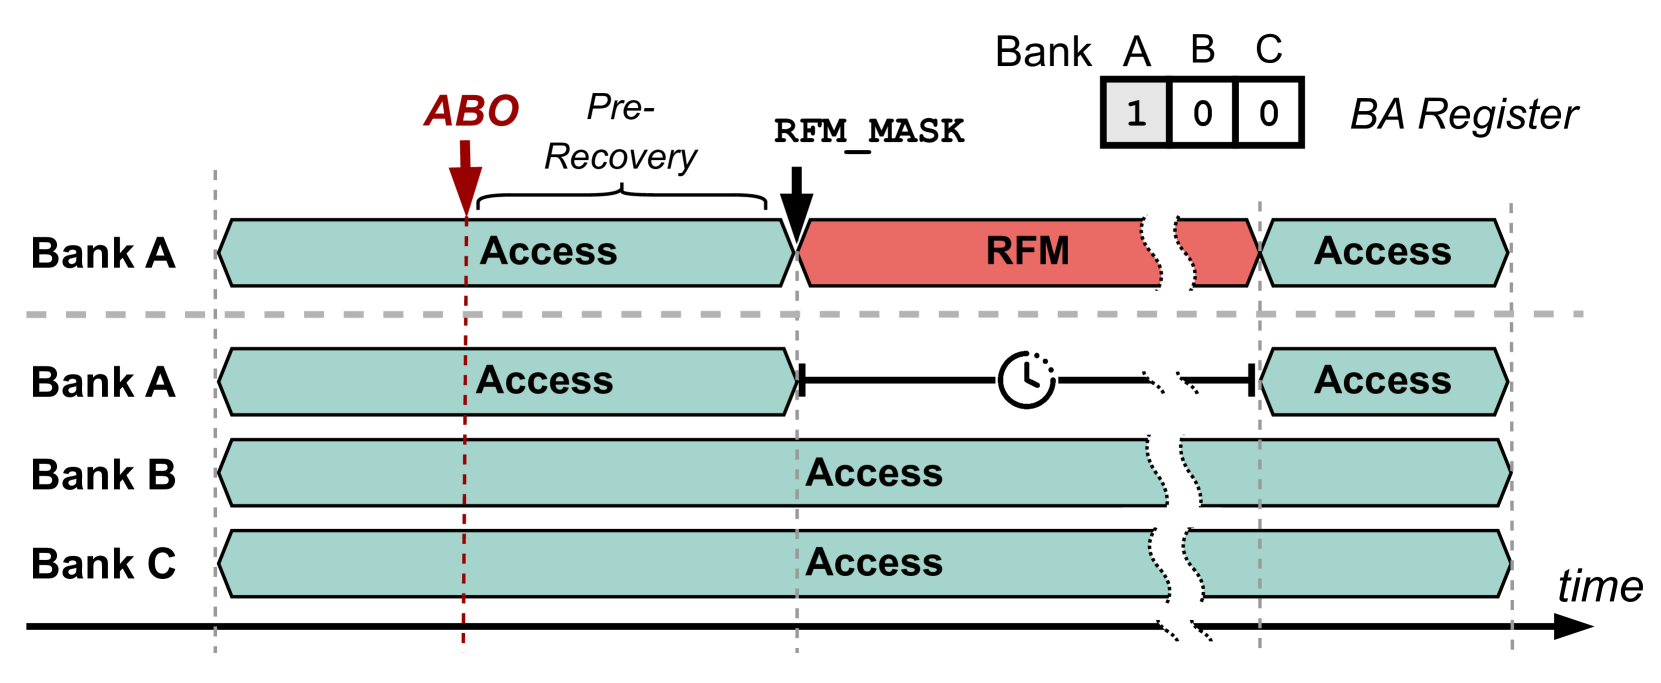
### Visual Description
\n
## Diagram: Memory Bank Access Timing with RFM Mask
### Overview
This diagram illustrates the timing of access operations to multiple memory banks (A, B, and C) in relation to a Recovery Failure Mask (RFM) operation. The diagram uses a timeline to show the sequence of "Access" and "RFM" operations, and includes a "BA Register" indicating the bank activation status. The diagram appears to be explaining a process for handling memory recovery failures.
### Components/Axes
* **Banks:** A, B, and C are the memory banks being accessed.
* **Time:** The horizontal axis represents time, flowing from left to right.
* **BA Register:** A small table in the top-right corner showing the activation status of each bank (1 = active, 0 = inactive). The banks are labeled A, B, and C.
* **ABO:** An arrow labeled "ABO" pointing downwards, indicating a trigger or signal.
* **Pre-Recovery:** Text label indicating a phase before recovery.
* **RFM_MASK:** Text label indicating the application of a Recovery Failure Mask.
* **RFM:** A red block representing the Recovery Failure Mask operation.
* **Access:** A teal block representing a memory access operation.
* **Clock Icon:** A circular arrow with a clock face inside, indicating a delay or timing element.
### Detailed Analysis or Content Details
The diagram shows the following sequence of events:
1. **Initial State:** All banks (A, B, and C) are initially in an "Access" state. The BA Register shows Bank A is active (1), while Banks B and C are inactive (0).
2. **ABO Trigger:** An "ABO" signal is received, initiating a pre-recovery phase.
3. **Bank A RFM:** Bank A experiences an RFM operation (represented by the red block). This occurs after the "ABO" signal and is indicated by the "RFM_MASK" label.
4. **Bank A Delay:** After the RFM operation on Bank A, there is a delay indicated by the clock icon.
5. **Bank A Access Resumption:** Following the delay, Bank A resumes "Access" operations.
6. **Bank B & C Access:** Banks B and C continue "Access" operations throughout the sequence.
The BA Register remains unchanged throughout the sequence, with Bank A active and Banks B and C inactive.
### Key Observations
* The RFM operation only affects Bank A.
* There is a noticeable delay after the RFM operation on Bank A before access can resume.
* Banks B and C are not directly impacted by the RFM operation.
* The diagram focuses on the timing and sequence of events rather than specific data values.
### Interpretation
This diagram likely illustrates a fault tolerance or error recovery mechanism in a memory system. The "ABO" signal could represent a detected error condition. The "RFM" operation is a corrective action applied specifically to Bank A, potentially to mask a faulty memory location or refresh data. The delay after the RFM operation suggests a stabilization period or a time required for the mask to take effect. The BA Register indicates that the bank activation status remains consistent throughout the process, suggesting that the RFM operation doesn't involve deactivating or re-activating the bank.
The diagram demonstrates a system's ability to isolate and recover from errors in a specific memory bank without disrupting operations in other banks. The use of a mask suggests a targeted approach to error handling, rather than a complete system reset. The diagram is a high-level illustration of the process and does not provide details about the specific error detection or masking mechanisms.
</details>
Figure 13. In this example, Bank 1 triggers ABO and enters recovery. Based on the BA mask, accesses to Banks 1 are stalled, while Banks 2 and 3 remain accessible.
5. Experimental Methodology
We utilize a cycle-accurate, open-source memory simulator, Ramulator 2.0 (Luo et al., 2023b; SAFARI Research Group, 2021). Our evaluation is on the existing PRAC+ABO framework and our proposed solution, PRACtical. We use the provided PRAC+ABO with RFM in Ramulator2.0. Furthermore, we evaluate Chronus (Canpolat et al., 2025) with PRACtical and compare the performance.
Table 2. Simulator Configurations
| CPU | 4-core, 4.2 GHz, 128-entry instruction window |
| --- | --- |
| Last-Level Cache | 2MB per core, total 8MB (16-way set-associative) |
| Memory Controller | 32-entry read/write queues |
| Scheduling: FR-FCFS + Cap of 4 | |
| Address mapping: MOP | |
| Main Memory | DDR5 DRAM, 1 channel, 2 ranks, 8 bank groups, |
| 4 banks/group, 64K rows/bank | |
System configuration is presented in table 2. We use a pool of traces from SPEC CPU2006 (spe, 2006), SPEC CPU2017 (spe, 2017), TPC (Transaction Processing Performance Council, 2025), MediaBench (Fritts et al., 2009) and YCSB (Cooper et al., 2010). The category of each trace is determined based on row buffer conflict per kilo instructions (RBMPKI). The traces are divided into High (H: $≥$ 10 RBMPKI), Medium (M: 2–10 RBMPKI), and Low (L: $<$ 2 RBMPKI) memory usage, as shown in Table 3. For evaluation, we use 4 different traces to form groups of HHHH, MMMM, LLLL, HHMM, MMLL, and LLHH as mixed workloads, represented in Table 4. For evaluation, we use 10 workloads from each group and run 100M instructions for simulation. Our simulation configuration aligns with previous wroks (Olgun et al., 2024; Canpolat et al., 2025; Woo et al., 2025).
<details>
<summary>x13.png Details</summary>
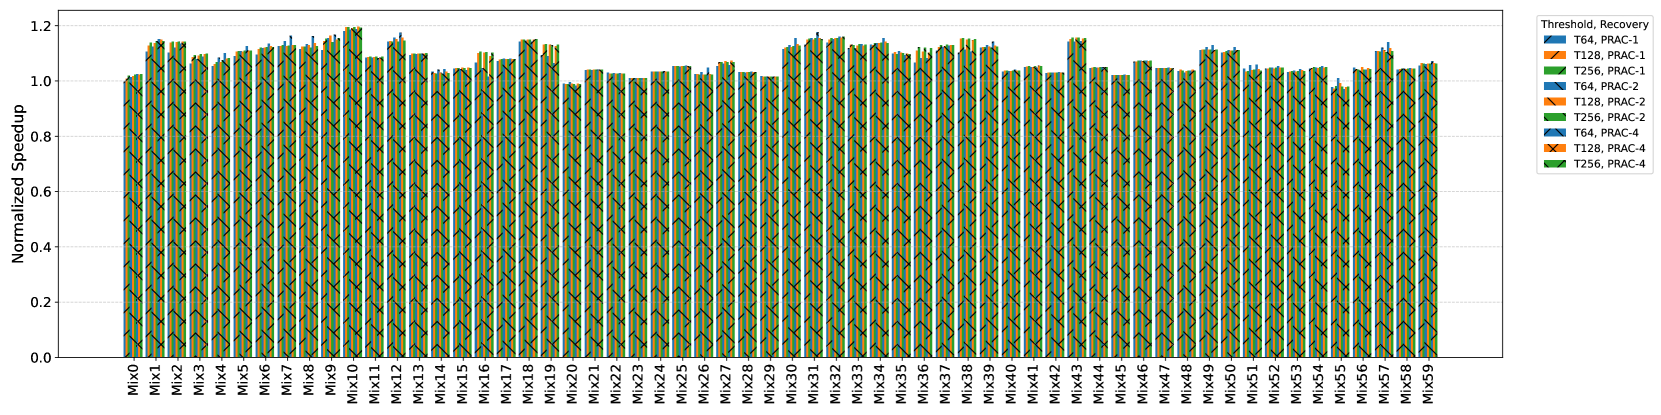
### Visual Description
\n
## Line Chart: Normalized Speedup vs. Mix
### Overview
The image presents a line chart illustrating the normalized speedup achieved across a series of mixes (Mix 0 to Mix 59). The chart compares the performance of different threshold/recovery configurations: T64, T128, and T256, each with PRAC-2, PRAC-3, and PRAC-4 settings. The y-axis represents the normalized speedup, ranging from 0.0 to 1.2, while the x-axis represents the mix number.
### Components/Axes
* **X-axis:** Mix (Mix 0 to Mix 59). The mixes are evenly spaced along the horizontal axis.
* **Y-axis:** Normalized Speedup (ranging from 0.0 to 1.2).
* **Legend:** Located in the top-right corner, the legend identifies the different lines by their threshold and recovery settings:
* T64, PRAC-3 (Blue)
* T128, PRAC-3 (Orange)
* T256, PRAC-3 (Green)
* T64, PRAC-2 (Light Blue)
* T128, PRAC-2 (Red)
* T256, PRAC-2 (Dark Green)
* T64, PRAC-4 (Gray)
* T128, PRAC-4 (Magenta)
* T256, PRAC-4 (Black)
### Detailed Analysis
The chart displays a repeating pattern of speedup fluctuations across the mixes. Each set of three lines (T64, T128, T256) for a given PRAC setting (2, 3, or 4) exhibits a similar oscillating behavior.
Here's a breakdown of the approximate speedup values for each configuration, noting the repeating pattern:
* **T64, PRAC-3 (Blue):** The line oscillates between approximately 0.05 and 1.15. The trend is generally flat, with consistent oscillations.
* **T128, PRAC-3 (Orange):** Similar to the blue line, it oscillates between approximately 0.05 and 1.15, with a flat trend.
* **T256, PRAC-3 (Green):** Oscillates between approximately 0.05 and 1.15, with a flat trend.
* **T64, PRAC-2 (Light Blue):** Oscillates between approximately 0.05 and 1.15, with a flat trend.
* **T128, PRAC-2 (Red):** Oscillates between approximately 0.05 and 1.15, with a flat trend.
* **T256, PRAC-2 (Dark Green):** Oscillates between approximately 0.05 and 1.15, with a flat trend.
* **T64, PRAC-4 (Gray):** Oscillates between approximately 0.05 and 1.15, with a flat trend.
* **T128, PRAC-4 (Magenta):** Oscillates between approximately 0.05 and 1.15, with a flat trend.
* **T256, PRAC-4 (Black):** Oscillates between approximately 0.05 and 1.15, with a flat trend.
The speedup values appear to peak around Mix 1, Mix 7, Mix 13, Mix 19, Mix 25, Mix 31, Mix 37, Mix 43, Mix 49, and Mix 55. The speedup values reach their minimum around Mix 0, Mix 6, Mix 12, Mix 18, Mix 24, Mix 30, Mix 36, Mix 42, Mix 48, and Mix 54.
### Key Observations
* All configurations exhibit a similar oscillating pattern, suggesting that the mix number significantly influences the speedup.
* There is minimal difference in speedup between the different threshold/recovery configurations. The lines are closely clustered together.
* The speedup generally remains between 0.05 and 1.15 across all mixes and configurations.
* The repeating pattern suggests a cyclical dependency between the mix and the speedup.
### Interpretation
The data suggests that the choice of threshold/recovery configuration (T64, T128, T256 with PRAC-2, PRAC-3, PRAC-4) has a limited impact on the normalized speedup. The primary driver of speedup variation appears to be the mix number itself, indicating a cyclical pattern in the workload or data distribution. The consistent oscillations across all configurations suggest that the underlying system is responding to a repeating characteristic of the mixes.
The fact that the speedup fluctuates between 0.05 and 1.15 indicates that the system's performance is significantly affected by the mix, but it doesn't fall to zero or reach exceptionally high values. This could imply that the system is relatively stable but susceptible to performance variations based on the input mix.
Further investigation is needed to understand the nature of the mixes and why they cause this cyclical speedup pattern. Analyzing the characteristics of the mixes (e.g., data size, complexity, access patterns) could reveal the underlying cause of the observed behavior.
</details>
Figure 14. Performance evaluation of PRACtical using normalized speedup over PRAC+ABO
| High (H) | 429.mcf, 433.milc, 434.zeusmp, 450.soplex, 459.GemsFDTD, 462.libquantum, 470.lbm, 482.sphinx3, 483.xalancbmk, 510.parest, 519.lbm, 549.fotonik3d, gups, 520.omnetpp |
| --- | --- |
| Medium (M) | 436.cactusADM, 473.astar, 507.cactuBSSN, 557.xz, jp2_decode, jp2_encode, tpcc64, tpch17, tpch2, wc_8443, wc_map0, ycsb_aserver, ycsb_bserver, ycsb_cserver, ycsb_eserver |
| Low (L) | 401.bzip2, 403.gcc, 435.gromacs, 444.namd, 445.gobmk, 447.dealII, 456.hmmer, 458.sjeng, 481.wrf, 500.perlbench, 502.gcc, 508.namd, 511.povray, 523.xalancbmk, 526.blender, 538.imagick, 541.leela, 544.nab, grep_map0, tpch6, ycsb_abgsave |
Table 3. Grouping of Benchmarks by Memory Usage
| HHHH | Mix0 to 9 |
| --- | --- |
| MMMM | Mix10 to 19 |
| LLLL | Mix20 to 29 |
| HHMM | Mix30 to 39 |
| MMLL | Mix40 to 49 |
| LLHH | Mix50 to 59 |
Table 4. Mapping of Workload Types to Mixed Types
6. Evaluation
In this section we evaluate the performance improvements and compare results against similar state-of-the-art works. First, PRACtical is compared against standard PRAC with an Alert Back-Off signal to show performance benefit over standard JEDEC specifications. Then, we evaluate PRACtical’s effectiveness on one PRAC+ABO-based solution, QPRAC. We also show how resilient PRACtical is to chain attacks 3.3.
6.1. Performance and Energy Evaluation
<details>
<summary>x14.png Details</summary>
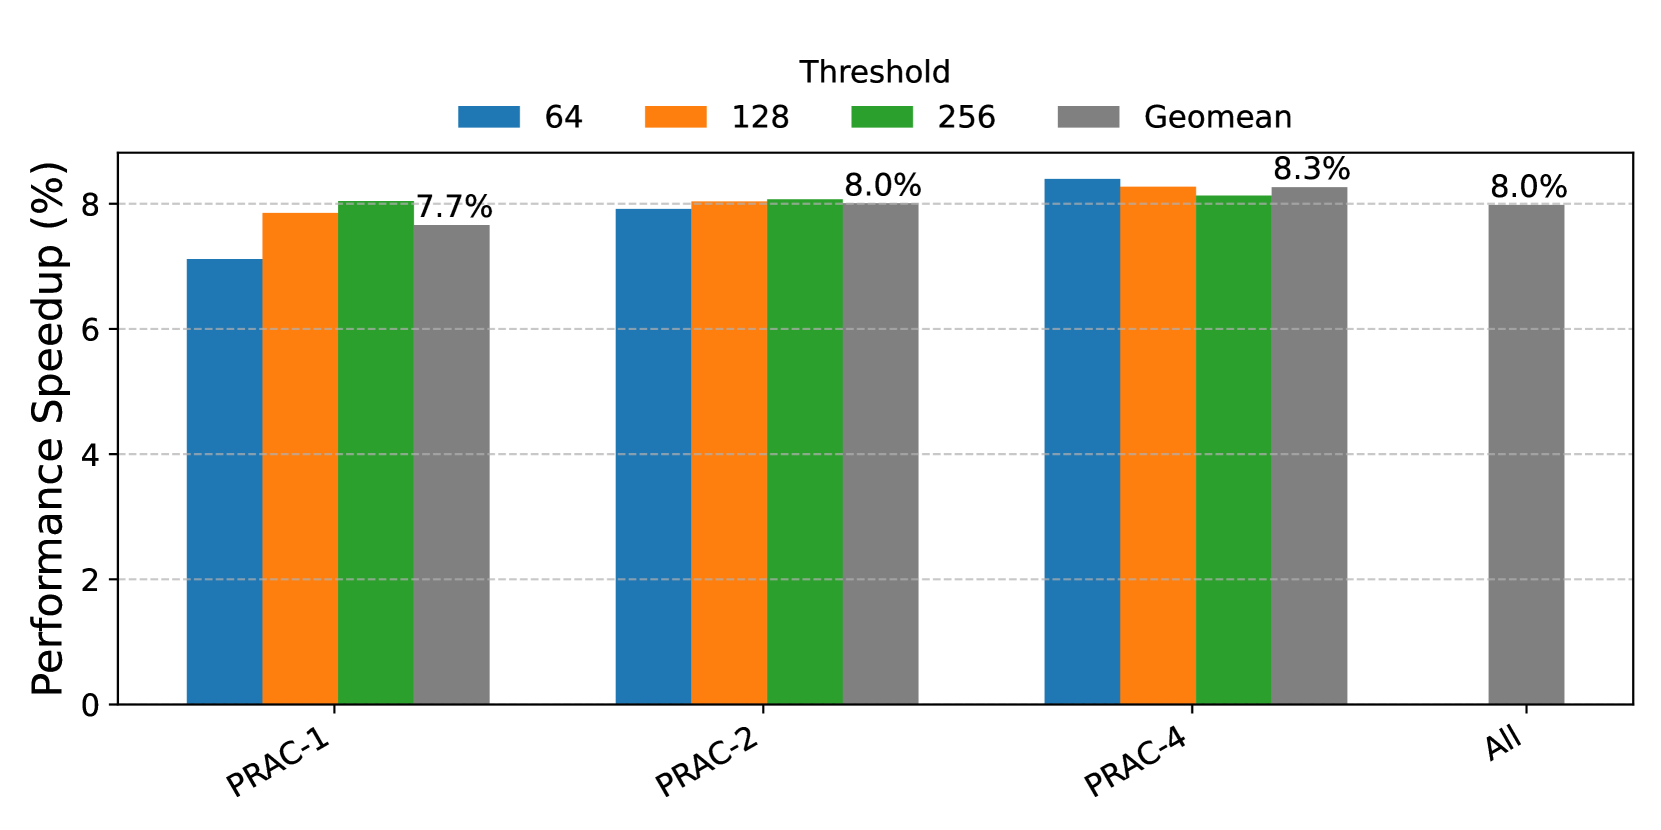
### Visual Description
\n
## Bar Chart: Performance Speedup by Threshold and Workload
### Overview
This bar chart displays the performance speedup (in percentage) achieved for different workloads (PRAC-1, PRAC-2, PRAC-4, and All) using varying thresholds (64, 128, 256, and Geomean). The y-axis represents the performance speedup percentage, while the x-axis represents the workload. Each workload has four bars corresponding to the different thresholds.
### Components/Axes
* **X-axis:** Workload - labeled with "PRAC-1", "PRAC-2", "PRAC-4", and "All".
* **Y-axis:** Performance Speedup (%) - ranging from 0% to 8.5%.
* **Legend:** Located at the top-right of the chart, identifying the thresholds:
* Blue: 64
* Orange: 128
* Green: 256
* Gray: Geomean
### Detailed Analysis
The chart consists of 16 data points (4 workloads x 4 thresholds). Here's a breakdown of the speedup percentages for each combination:
* **PRAC-1:**
* Threshold 64: Approximately 6.9%
* Threshold 128: Approximately 7.7%
* Threshold 256: Approximately 7.7%
* Geomean: Approximately 7.7%
* **PRAC-2:**
* Threshold 64: Approximately 7.9%
* Threshold 128: Approximately 8.0%
* Threshold 256: Approximately 8.0%
* Geomean: Approximately 8.0%
* **PRAC-4:**
* Threshold 64: Approximately 8.2%
* Threshold 128: Approximately 8.3%
* Threshold 256: Approximately 8.3%
* Geomean: Approximately 8.3%
* **All:**
* Threshold 64: Approximately 7.8%
* Threshold 128: Approximately 8.0%
* Threshold 256: Approximately 8.0%
* Geomean: Approximately 8.0%
For each workload, the speedup generally increases as the threshold increases from 64 to 128, and then plateaus or shows minimal increase from 128 to 256. The Geomean speedup is generally consistent with the 128 and 256 thresholds.
### Key Observations
* PRAC-4 consistently shows the highest speedup across all thresholds.
* The difference in speedup between thresholds 64 and 128 is more pronounced than the difference between 128 and 256.
* The Geomean speedup is very close to the speedup achieved with thresholds of 128 and 256, suggesting these thresholds provide a good balance.
* The speedup for "All" is generally lower than for the individual PRAC workloads.
### Interpretation
The data suggests that increasing the threshold initially improves performance speedup, but the gains diminish beyond a certain point (around a threshold of 128). This could be due to the trade-off between reducing false positives (by increasing the threshold) and potentially missing true positives. The Geomean threshold appears to be a good compromise, providing a speedup comparable to the higher thresholds. The higher speedup observed for PRAC-4 indicates that this workload benefits the most from the threshold adjustments. The lower speedup for "All" suggests that the optimal threshold may vary depending on the specific workload, and a single threshold may not be optimal for all scenarios. The chart demonstrates the impact of threshold selection on performance speedup for different workloads, highlighting the importance of choosing an appropriate threshold based on the specific application and performance goals.
</details>
Figure 15. Performance Comparison of PRACtical and opportunistic PRAC+ABO for recoveries of 1, 2, and 4 and thresholds of 64, 128, and 256
PRACtical vs. PRAC+ABO. The performance evaluation results comparing PRACtical with the standard (opportunistic) PRAC+ABO framework are presented in Figure 14 and geometric mean results are shown in Figure 15. The evaluation includes both PRACtical and PRAC across configurations with n=1,2, and 4 RFM s as PRAC-1, PRAC-2, and PRAC-4, respectively, with Alert thresholds of 64, 128, and 256. We use a suite of mixed workloads composed of traces with high, medium, and low memory usage characteristics. The results demonstrate that PRACtical outperforms the baseline PRAC+ABO framework. Along the mixes, high and medium memory intensity combinations showcase more speedup (up to 20%). Mean values show that PRACtical provides 7-9% better performance. This performance improvement benefits mostly from subarray-level PRAC updates. The overhead was 6% on average. Hence, PRACtical has 2-3% performance improvement due to bank-level recovery stalling. Although this performance improvement might seem very low, the critical target of this optimization is to eliminate energy inefficiency.
Energy Comparison. In this evaluation, we compare the energy consumption of PRACtical and PRAC+ABO with opportunistic mitigation. Figure 16 depicts the difference in the energy consumption due to extra RFM refreshes of opportunistic mitigation. The results align with our expectations; while the opportunistic mode of PRAC+ABO improves performance by preemptively refreshing rows before they become hot, it also introduces a large number of unnecessary refreshes, significantly increasing energy consumption. On average, across all evaluated recovery and threshold configurations, opportunistic PRAC+ABO consumes 19% more energy compared to PRACtical. Across different configurations of recoveries (1,2, and 4) and thresholds, the values slightly vary. The biggest difference happens with PRAC-4 (rec=4), and the threshold 64, which aligns with the observation of the most unnecessary RFM refreshes in sec 3. These findings underscore a fundamental trade-off: while opportunistic mitigation strategies can minimize performance degradation by anticipating high-activation rows early, this comes at the cost of substantially increased energy usage, reducing the overall efficiency of the memory system.
<details>
<summary>x15.png Details</summary>
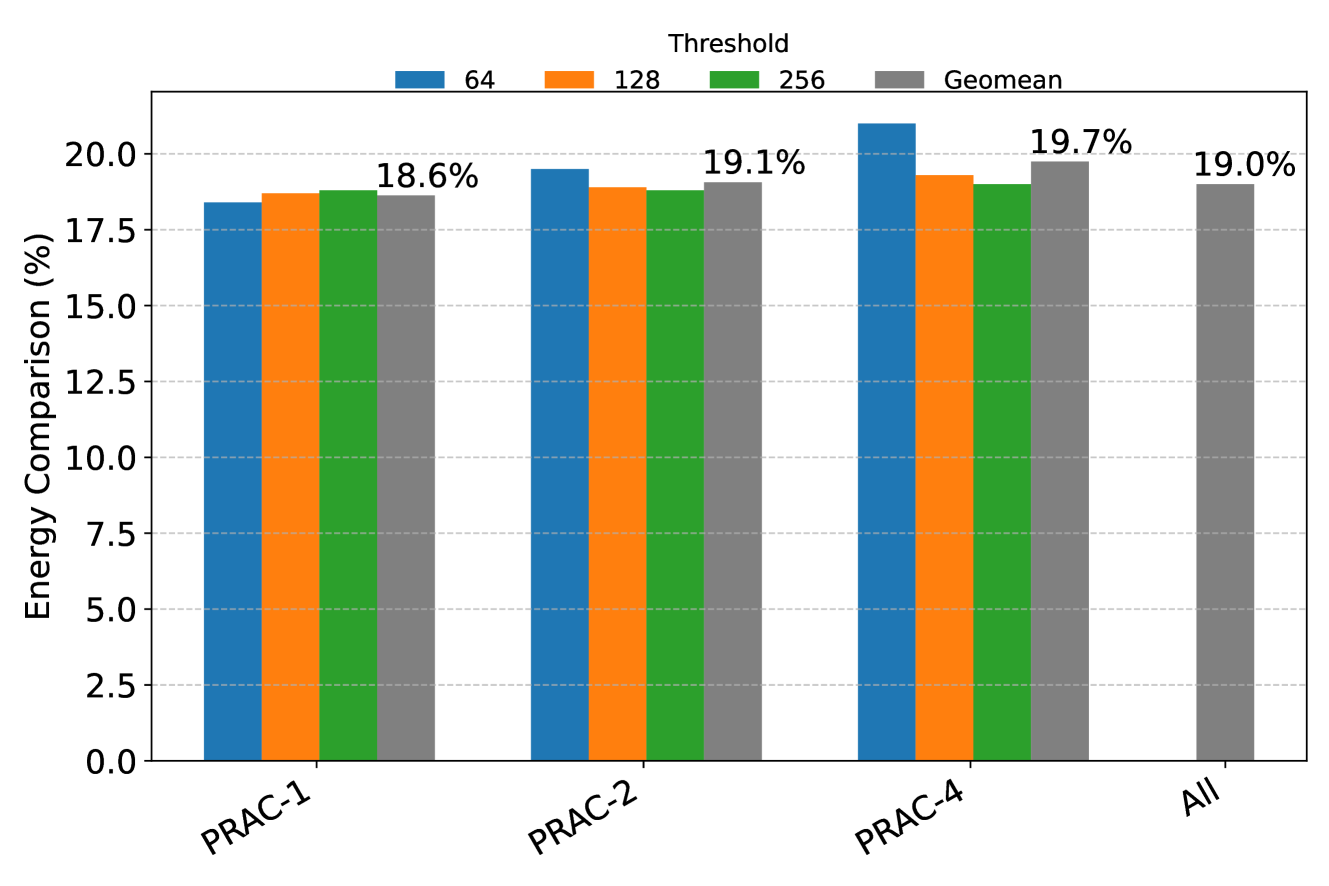
### Visual Description
\n
## Bar Chart: Energy Comparison (%) by Threshold and PRAC
### Overview
This bar chart compares energy comparison percentages across different PRAC (PRAC-1, PRAC-2, PRAC-4, and All) for various thresholds (64, 128, 256, and Geomean). The y-axis represents the energy comparison in percentage, while the x-axis represents the PRAC categories. Each PRAC category has four bars representing the energy comparison for each threshold.
### Components/Axes
* **X-axis:** PRAC (PRAC-1, PRAC-2, PRAC-4, All)
* **Y-axis:** Energy Comparison (%) - Scale ranges from 0.0 to 20.0, with tick marks every 2.5%.
* **Legend:** Located at the top-right corner, indicating the color-coding for each threshold:
* Blue: 64
* Orange: 128
* Green: 256
* Gray: Geomean
### Detailed Analysis
The chart consists of four groups of bars, one for each PRAC category. Within each group, there are four bars representing the energy comparison for thresholds 64, 128, 256, and Geomean.
**PRAC-1:**
* 64: Approximately 16.5%
* 128: Approximately 17.5%
* 256: Approximately 18.2%
* Geomean: 18.6%
**PRAC-2:**
* 64: Approximately 16.5%
* 128: Approximately 17.8%
* 256: Approximately 18.5%
* Geomean: 19.1%
**PRAC-4:**
* 64: Approximately 18.5%
* 128: Approximately 18.8%
* 256: Approximately 19.0%
* Geomean: 19.7%
**All:**
* 64: Approximately 16.5%
* 128: Approximately 17.8%
* 256: Approximately 18.5%
* Geomean: 19.7%
**Trends:**
* For each PRAC category, the energy comparison percentage generally increases as the threshold increases from 64 to 256, and is highest for the Geomean.
* PRAC-4 and "All" show the highest energy comparison percentages overall.
* The difference between the thresholds within each PRAC category is relatively small.
### Key Observations
* The Geomean consistently yields the highest energy comparison percentage across all PRAC categories.
* PRAC-4 and "All" have similar energy comparison percentages for all thresholds.
* PRAC-1 has the lowest energy comparison percentages across all thresholds.
* The energy comparison percentage for threshold 64 is consistently the lowest across all PRAC categories.
### Interpretation
The data suggests that using a Geomean threshold results in the highest energy comparison percentage, indicating a more efficient energy utilization or a more accurate measurement. PRAC-4 and the combined "All" PRACs demonstrate the highest energy comparison, potentially indicating that these PRACs are more optimized for energy efficiency or have a larger impact on overall energy comparison. The consistent trend of increasing energy comparison with higher thresholds suggests that higher thresholds may be more effective in capturing energy-related improvements. The relatively small differences between thresholds within each PRAC category suggest that the choice of threshold may not have a drastic impact on energy comparison, but the Geomean consistently provides the best results. The lower values for PRAC-1 suggest it may be less optimized or have different characteristics compared to the other PRACs.
</details>
Figure 16. Energy Comparison of PRACtical and PRAC for recoveries of 1, 2, and 4 and thresholds of 64, 128, and 256
PRACtical vs Baseline architecture. In this evaluation, we assess the performance of PRACtical in comparison to a baseline architecture, where the baseline represents a DRAM system without any Rowhammer mitigation mechanisms. As illustrated in Figure 17, PRACtical achieves performance levels nearly identical to the baseline. The only observable performance degradation is a minor slowdown of approximately 1%, which occurs under the configuration with a recovery count of 1 or 2 RFM s and a threshold of 64. This minimal overhead demonstrates that PRACtical introduces negligible performance penalties, effectively maintaining baseline performance even in the presence of Rowhammer protection.
<details>
<summary>x16.png Details</summary>
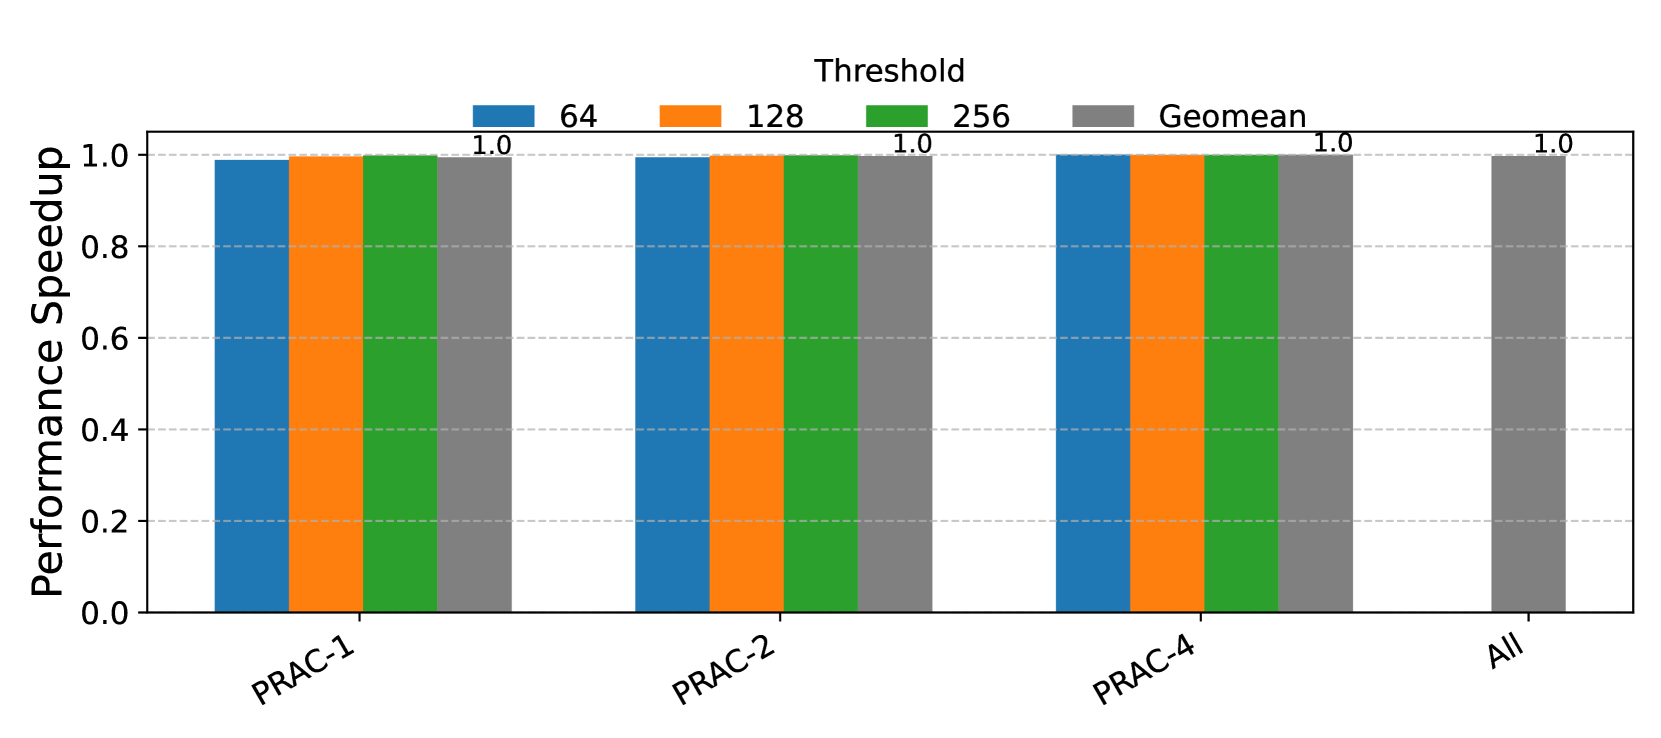
### Visual Description
\n
## Bar Chart: Performance Speedup vs. Threshold
### Overview
The image presents a bar chart comparing the performance speedup achieved for different PRAC configurations (PRAC-1, PRAC-2, PRAC-4, and All) across varying thresholds (64, 128, 256, and Geomean). The y-axis represents performance speedup, while the x-axis represents the PRAC configuration. Each PRAC configuration has four bars corresponding to the different thresholds.
### Components/Axes
* **X-axis:** PRAC Configurations - PRAC-1, PRAC-2, PRAC-4, All. The labels are positioned along the bottom of the chart, slightly rotated.
* **Y-axis:** Performance Speedup. The scale ranges from 0.0 to 1.0, with tick marks at 0.2 intervals. The label is positioned on the left side of the chart, vertically.
* **Legend:** Located at the top of the chart, horizontally centered. It maps colors to thresholds:
* Blue: 64
* Orange: 128
* Green: 256
* Gray/Black: Geomean
* **Title:** "Threshold" is centered above the bars.
### Detailed Analysis
The chart consists of 16 bars, grouped by PRAC configuration. Each group has four bars representing the speedup at thresholds 64, 128, 256, and Geomean.
* **PRAC-1:**
* Threshold 64 (Blue): Approximately 0.95 speedup.
* Threshold 128 (Orange): Approximately 0.95 speedup.
* Threshold 256 (Green): 1.0 speedup.
* Geomean (Gray): 1.0 speedup.
* **PRAC-2:**
* Threshold 64 (Blue): Approximately 0.95 speedup.
* Threshold 128 (Orange): Approximately 0.95 speedup.
* Threshold 256 (Green): 1.0 speedup.
* Geomean (Gray): 1.0 speedup.
* **PRAC-4:**
* Threshold 64 (Blue): Approximately 0.95 speedup.
* Threshold 128 (Orange): Approximately 0.95 speedup.
* Threshold 256 (Green): 1.0 speedup.
* Geomean (Gray): 1.0 speedup.
* **All:**
* Threshold 64 (Blue): Approximately 0.95 speedup.
* Threshold 128 (Orange): Approximately 0.95 speedup.
* Threshold 256 (Green): 1.0 speedup.
* Geomean (Gray): 1.0 speedup.
All bars for the Geomean threshold are at 1.0 speedup. The bars for thresholds 64 and 128 are consistently around 0.95 for all PRAC configurations. The bars for threshold 256 are at 1.0 speedup for all PRAC configurations.
### Key Observations
* The Geomean threshold consistently achieves a speedup of 1.0 across all PRAC configurations.
* Thresholds 64 and 128 yield a speedup of approximately 0.95 across all PRAC configurations.
* Threshold 256 yields a speedup of 1.0 across all PRAC configurations.
* There is no significant difference in performance speedup between the different PRAC configurations for any of the thresholds.
### Interpretation
The data suggests that increasing the threshold to 256 or using the Geomean threshold results in optimal performance (speedup of 1.0) for all PRAC configurations. Lower thresholds (64 and 128) provide a slightly lower speedup (approximately 0.95). The consistent performance across different PRAC configurations indicates that the threshold setting is the dominant factor influencing speedup, rather than the specific PRAC configuration itself. The Geomean threshold effectively represents the optimal balance across all configurations, resulting in the highest observed speedup. The lack of variation between PRAC configurations suggests that the benefits of different PRAC approaches are realized at higher thresholds.
</details>
Figure 17. Performance Comparison of PRACtical and Baseline architecture for recoveries of 1, 2, and 4 and thresholds of 64, 128, and 256. Baseline architecture refers to no mitigation.
Non-opportunistic PRAC+ABO vs PRACtical. We have shown that opportunistic mitigation has a wide energy-performance trade-off. In order to save performance, PRAC+ABO can be non-opportunistic, meaning that upon recovery (during RFM ab), only the banks, that have rows with activation count equal to greater than Alert threshold, are undergoing recovery procedure. As expected, the banks that have all rows with counters less than Alert threshold will stay idle during this period, downgrading the performance. However, this method ensures only necessary number of refresh operations are performed, saving the energy. The results are shown in Figure 15. Our evaluation considers thresholds of 64, 128, and 256, with a configuration of 1, 2, and 4 RFM s per recovery. Across all combinations of recovery mechanisms (denoted as RFM s) and thresholds, we observe an average performance improvement of approximately 20%. The lowest performance gain, around 10%, occurs when the threshold is set to 256 and only one RFM recovery is employed. In contrast, the highest performance improvement is observed under the configuration with a threshold of 64 and one RFM recovery, where performance improves by more than 50%.
<details>
<summary>x17.png Details</summary>
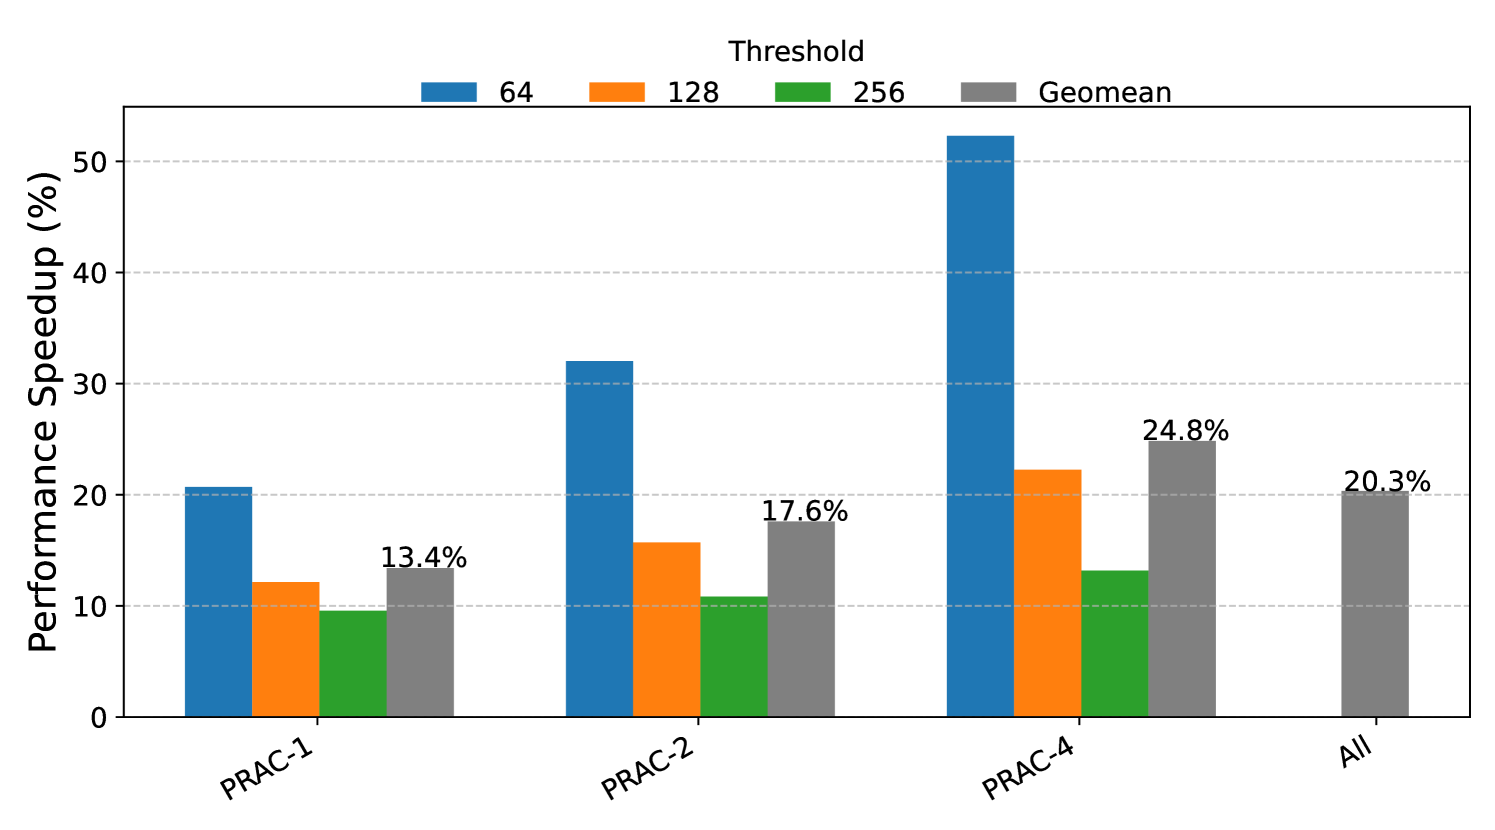
### Visual Description
\n
## Bar Chart: Performance Speedup vs. Threshold
### Overview
This bar chart illustrates the performance speedup (in percentage) achieved for different workloads (PRAC-1, PRAC-2, PRAC-4, and All) using varying thresholds (64, 128, 256) and the geometric mean. The y-axis represents the performance speedup in percentage, while the x-axis represents the workload.
### Components/Axes
* **X-axis:** Workload - PRAC-1, PRAC-2, PRAC-4, All
* **Y-axis:** Performance Speedup (%) - Scale ranges from 0 to 55, with increments of 10.
* **Legend:** Located at the top-center of the chart.
* 64 (Blue)
* 128 (Orange)
* 256 (Gray)
* Geomean (Dark Gray)
### Detailed Analysis
The chart consists of grouped bar plots for each workload, representing the performance speedup for each threshold and the geometric mean.
**PRAC-1:**
* Threshold 64 (Blue): Approximately 19%.
* Threshold 128 (Orange): Approximately 11%.
* Threshold 256 (Gray): Approximately 13.4%.
* Geomean (Dark Gray): Approximately 13.4%.
**PRAC-2:**
* Threshold 64 (Blue): Approximately 32%.
* Threshold 128 (Orange): Approximately 15%.
* Threshold 256 (Gray): Approximately 17.6%.
* Geomean (Dark Gray): Approximately 17.6%.
**PRAC-4:**
* Threshold 64 (Blue): Approximately 52%.
* Threshold 128 (Orange): Approximately 22%.
* Threshold 256 (Gray): Approximately 24.8%.
* Geomean (Dark Gray): Approximately 24.8%.
**All:**
* Threshold 64 (Blue): Approximately 28%.
* Threshold 128 (Orange): Approximately 18%.
* Threshold 256 (Gray): Approximately 20.3%.
* Geomean (Dark Gray): Approximately 20.3%.
### Key Observations
* For all workloads, the threshold of 64 generally yields the highest performance speedup.
* The performance speedup decreases as the threshold increases from 64 to 128 and 256.
* The Geomean values are consistent with the threshold 256 values.
* PRAC-4 shows the most significant speedup, particularly with a threshold of 64.
* PRAC-1 shows the least speedup across all thresholds.
### Interpretation
The data suggests that a lower threshold (64) generally leads to better performance speedup across all workloads. This could be due to the increased granularity of data processing at lower thresholds, allowing for more efficient optimization. The geometric mean provides a consolidated view of performance, aligning with the results obtained at a threshold of 256. The varying speedup across different workloads (PRAC-1, PRAC-2, PRAC-4, and All) indicates that the optimal threshold might be workload-dependent. PRAC-4, exhibiting the highest speedup, may benefit more from the lower threshold due to its specific characteristics. The consistent trend of decreasing speedup with increasing thresholds suggests a trade-off between threshold granularity and computational cost. The "All" workload represents an average across all workloads, and its performance is generally lower than the best-performing individual workload (PRAC-4).
</details>
Figure 18. Performance Comparison of PRACtical and non-opportunistic PRAC for recoveries of 1, 2, and 4 and thresholds of 64, 128, and 256
Chronus equipped with PRACtical vs. PRAC. Chronus (Canpolat et al., 2025) optimizes the counter update mechanism in DRAM by relocating per-row activation counters to a dedicated, independent subarray. While this design introduces additional energy overhead, since each row activation results in two separate row accesses (one for the target row and one for the corresponding counter row) and occupies valuable DRAM space, it effectively eliminates the performance penalty typically incurred by in-place counter updates.
In this evaluation, we integrate the PRACtical bank stalling mechanism and subarray-level PRAC update into the Chronus architecture and compare the combined approach against the Chronus with an opportunistic PRAC+ABO framework. As shown in Figure 19, the hybrid Chronus+PRACtical implementation achieves the same performance as the base implementation with PRAC+ABO. These results demonstrate that simple and energy efficient PRACtical can indeed have the same result as expensive and inefficient base design. Note that even though the PRACtical has a small PRAC overhead due to subarray conflicts, this is negligible in complete design. Also note that the Chronus has more energy difference due to double row activation, which incurs an additional 19.07% energy consumption for each row access. We can conclude that PRACtical can achieve same (even better at lower thresholds) performance with very low energy consumption.
<details>
<summary>x18.png Details</summary>
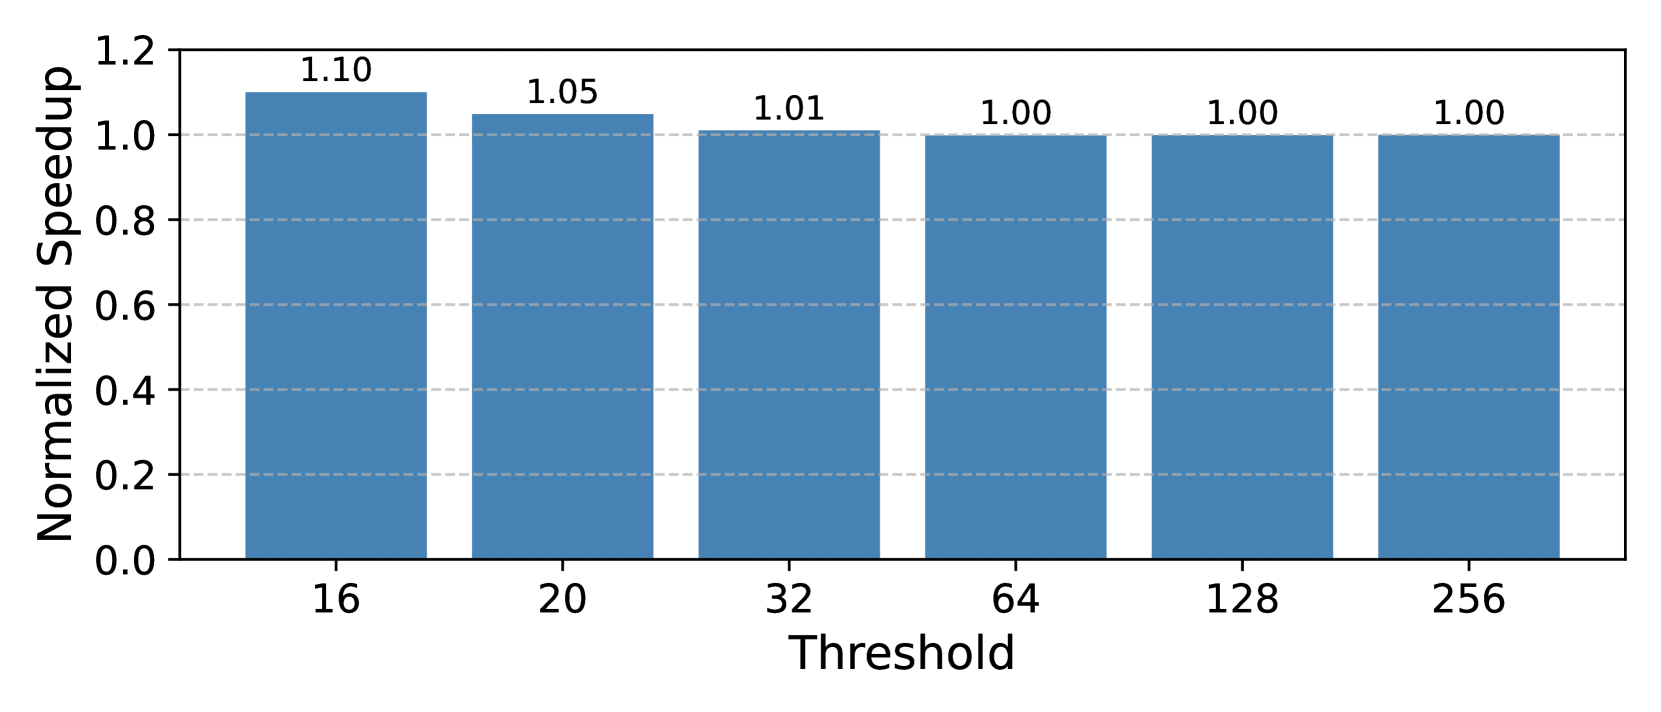
### Visual Description
\n
## Bar Chart: Normalized Speedup vs. Threshold
### Overview
This image presents a bar chart illustrating the relationship between a "Threshold" value and a "Normalized Speedup". The chart displays how the normalized speedup changes as the threshold is varied.
### Components/Axes
* **X-axis:** "Threshold" with markers at 16, 20, 32, 64, 128, and 256.
* **Y-axis:** "Normalized Speedup" with a scale ranging from 0.0 to 1.2, with increments of 0.2.
* **Bars:** Six bars representing the normalized speedup for each threshold value. All bars are the same color (light blue).
* **Labels:** Each bar is labeled with its corresponding normalized speedup value.
### Detailed Analysis
The chart shows the following data points:
* **Threshold = 16:** Normalized Speedup = 1.10
* **Threshold = 20:** Normalized Speedup = 1.05
* **Threshold = 32:** Normalized Speedup = 1.01
* **Threshold = 64:** Normalized Speedup = 1.00
* **Threshold = 128:** Normalized Speedup = 1.00
* **Threshold = 256:** Normalized Speedup = 1.00
The bars visually demonstrate a decreasing trend in normalized speedup as the threshold increases. The speedup decreases rapidly from a threshold of 16 to 32, and then plateaus at 1.00 for thresholds of 64, 128, and 256.
### Key Observations
* The highest normalized speedup (1.10) is achieved at the lowest threshold (16).
* The normalized speedup approaches 1.0 as the threshold increases, indicating diminishing returns or no additional speedup beyond a certain threshold.
* There is a significant drop in speedup between thresholds 16 and 20, and a smaller drop between 20 and 32.
* The speedup stabilizes at 1.0 for thresholds 64 and above.
### Interpretation
The data suggests that there is an optimal threshold value for maximizing speedup. Below a certain threshold, increasing the threshold yields a significant improvement in speedup. However, beyond a threshold of approximately 32, further increases in the threshold do not result in any additional speedup. This could indicate that the benefits of a more aggressive threshold are offset by other factors, such as increased computational cost or reduced accuracy. The normalized speedup of 1.0 at higher thresholds suggests that the process performs at a baseline level without any additional optimization. This chart is likely demonstrating the impact of a parameter (the threshold) on the performance of an algorithm or system. The data implies that a threshold value of 32 or higher provides no additional performance benefit.
</details>
Figure 19. Normalized performance of Chronus implemented with PRACtical over PRAC+ABO.
6.2. Hardware Overhead and Complexity Analysis
In this section, we discuss the practicality perspective of the proposed solution, PRACtical. Specifically, we discuss the practicality of PRACtical in two aspects: changes to JEDEC standards and the area overhead of changes.
Changes to JEDEC Standards: PRACtical requires several architectural modifications to both the DRAM device and the memory controller (MC) interface. The most critical modification is to decouple the increment circuit from the global circuit and connect it to the subarray’s local row buffers. Another required modification stems from the fact that MCs typically lack knowledge of the subarray mapping within each DRAM bank. However, this can be addressed with a dedicated register in DRAM that holds subarray mapping information. Then, at boot time, the MC can read these registers and store the corresponding mapping functions in its internal registers for use during execution. Additionally, another hardware extension involves introducing a single register that maintains one bit per bank to track whether the bank needs mitigation. For a 64-bank channel, this mechanism requires only a 64-bit register, making it a low-overhead enhancement.
Area Overhead of Increment Circuit: PRACtical introduces two critical modifications to the DRAM architecture: (1) an increment unit and its control path integrated into local row buffers, and (2) an n-bit register to represent the bank mask in an n-bank DIMM. In our evaluation setup, the DIMM consists of 64 banks, which requires an 8-byte (64-bit) register to track bank-level status. The first modification decouples the increment logic from the global row buffer and shares it across local row buffers. Since the counter update overlaps with the activation of the next row, it must be routed to the correct subarray. To enable this, we need to have an additional global row address decoder that maps addresses to subarray IDs and row addresses within subarrays, along with an additional comparator in each subarray to resolve subarray ID matches. This ensures that counter updates can be independently delivered, even when the comparator is concurrently needed for the next precharge operation. We evaluate the area overhead of this modification using CACTI (Balasubramonian et al., 2017) and Synopsys Design Compiler (Synopsys Inc., 2023), and find it to be only 0.03%, making it negligible.
6.3. Security Evaluation
Resilience against Memory Slowdown Attacks. In Section 3.3, we stated that the current PRAC+ABO design is vulnerable to MOAT’s Torrent-of-Staggered-Alerts attack (Qureshi and Qazi, 2024), which exploit the channel-wide stalling behavior of the ABO protocol. Besides, an attacker can trigger an Alert on a single bank to stall the entire memory channel frequently to cause performance attacks. PRACtical mitigates this vulnerability by restricting the Alert-induced stall to only the affected bank. As a result, the effectiveness of performance attack is significantly diminished, as it relies on a single bank being capable of blocking the entire channel.
<details>
<summary>x19.png Details</summary>
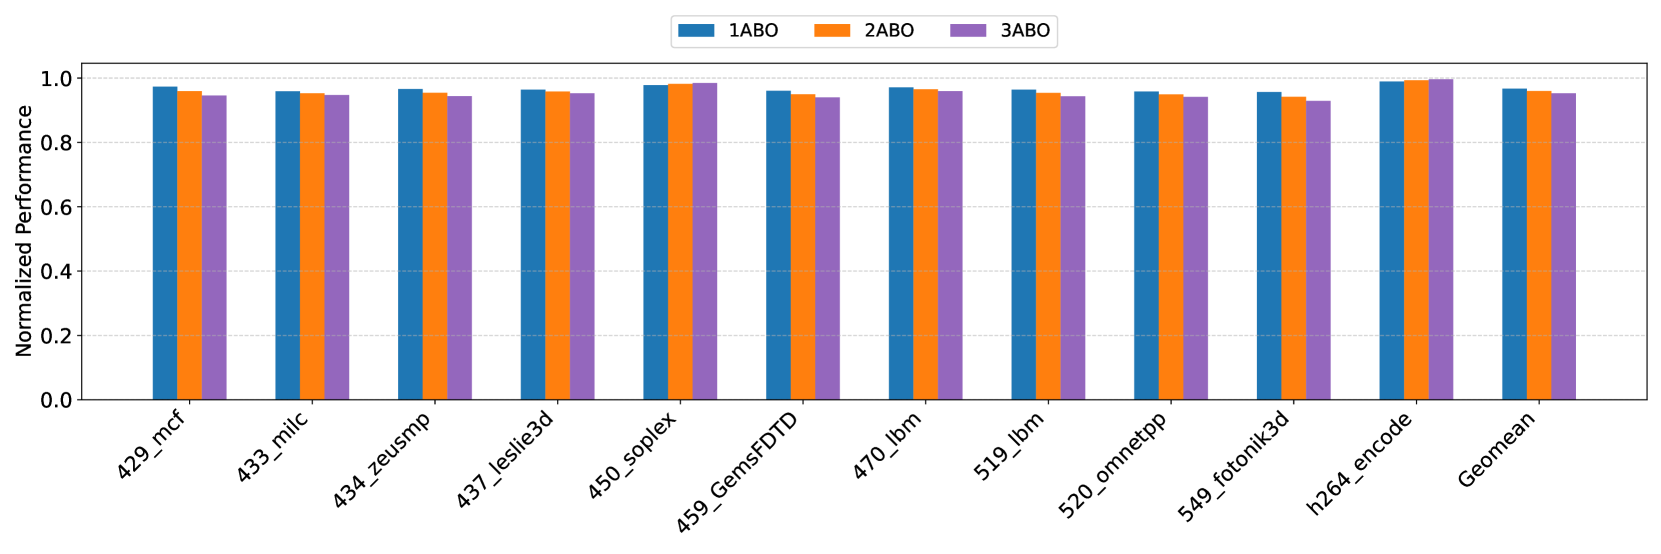
### Visual Description
## Bar Chart: Normalized Performance Comparison
### Overview
This image presents a bar chart comparing the normalized performance of three different configurations (1ABO, 2ABO, and 3ABO) across ten different datasets/benchmarks, plus a "Geomean" average. The y-axis represents normalized performance, ranging from 0.0 to 1.0, while the x-axis lists the dataset names.
### Components/Axes
* **X-axis:** Dataset/Benchmark names: 429_mcf, 433_milc, 434_zeusmp, 437_leslie3d, 450_soplex, 459_GemsFDTD, 470_lbm, 519_lbm, 520_omnetpp, 549_fotonik3d, h264_encode, Geomean.
* **Y-axis:** Normalized Performance (scale from 0.0 to 1.0).
* **Legend:** Located at the top-center of the chart, indicating the color-coding for each configuration:
* 1ABO (Blue)
* 2ABO (Orange)
* 3ABO (Purple)
### Detailed Analysis
The chart consists of grouped bar plots for each dataset. Each group contains three bars, one for each ABO configuration.
* **429_mcf:**
* 1ABO: Approximately 0.98
* 2ABO: Approximately 0.96
* 3ABO: Approximately 0.95
* **433_milc:**
* 1ABO: Approximately 0.97
* 2ABO: Approximately 0.95
* 3ABO: Approximately 0.94
* **434_zeusmp:**
* 1ABO: Approximately 0.97
* 2ABO: Approximately 0.95
* 3ABO: Approximately 0.94
* **437_leslie3d:**
* 1ABO: Approximately 0.97
* 2ABO: Approximately 0.95
* 3ABO: Approximately 0.94
* **450_soplex:**
* 1ABO: Approximately 0.97
* 2ABO: Approximately 0.95
* 3ABO: Approximately 0.94
* **459_GemsFDTD:**
* 1ABO: Approximately 0.97
* 2ABO: Approximately 0.95
* 3ABO: Approximately 0.94
* **470_lbm:**
* 1ABO: Approximately 0.97
* 2ABO: Approximately 0.95
* 3ABO: Approximately 0.94
* **519_lbm:**
* 1ABO: Approximately 0.97
* 2ABO: Approximately 0.95
* 3ABO: Approximately 0.94
* **520_omnetpp:**
* 1ABO: Approximately 0.97
* 2ABO: Approximately 0.95
* 3ABO: Approximately 0.94
* **549_fotonik3d:**
* 1ABO: Approximately 0.97
* 2ABO: Approximately 0.95
* 3ABO: Approximately 0.94
* **h264_encode:**
* 1ABO: Approximately 0.97
* 2ABO: Approximately 0.95
* 3ABO: Approximately 0.94
* **Geomean:**
* 1ABO: Approximately 0.97
* 2ABO: Approximately 0.95
* 3ABO: Approximately 0.94
**Trends:**
For all datasets and the Geomean, the 1ABO configuration consistently exhibits the highest normalized performance, followed by 2ABO, and then 3ABO. The performance difference between the configurations is relatively small, but consistent.
### Key Observations
* The performance differences between the three ABO configurations are minimal across all datasets.
* 1ABO consistently outperforms 2ABO and 3ABO.
* The Geomean performance values closely mirror the performance observed in individual datasets.
### Interpretation
The chart demonstrates that the 1ABO configuration generally achieves the best normalized performance across the tested datasets. The consistent, albeit small, performance advantage of 1ABO suggests that the specific configuration has a positive impact on performance. The relatively small differences between the configurations indicate that the performance is robust and not highly sensitive to the ABO setting. The Geomean values confirm the overall trend observed in the individual datasets. This data could be used to inform decisions about which ABO configuration to use in a production environment, with 1ABO being the preferred choice based on these results. The consistent performance across datasets suggests that the observed trend is not specific to any particular workload.
</details>
Figure 20. Normalized performance of PRACtical for each single benign benchmark when there is a performance attack.
To evaluate PRACtical’s robustness, we repeated the performance attack experiments on a PRACtical-enabled system. The results, shown in Figure 20, use the motivation set—consisting of high memory-intensity, single-trace workloads. Under PRAC+ABO, the attack-induced slowdowns reached over 80%, severely degrading the performance of benign workloads. In contrast, PRACtical demonstrates strong resilience to such memory-based performance attacks. The system experiences an average (geometric mean) slowdown of less than 6%. This is primarily due to the attacker operating on the same banks accessed by these benchmarks. The most slowdown happens when attacker can induce 3 ABO stalls per tREFI s. Even in these cases, the maximum observed slowdown remains below 6%, which is considered a tolerable level for secure memory systems.
Security of PRACtical: While PRAC+ABO alone does not constitute a complete security solution on its own. Any secure Rowhammer mitigation framework built upon PRAC+ABO must use a policy to ensure that any DRAM bank exceeding the activation threshold is properly mitigated. From this perspective, PRACtical is designed to preserve this baseline security requirement while delivering improved performance and energy efficiency. PRACtical targets optimizations in two key components of the PRAC+ABO framework: the per-row activation counter (PRAC) and the Alert-back-off signaling mechanism. PRACtical counter updates are committed in parallel with subarray accesses by leveraging a centralized increment circuitry, in conjunction with a memory controller that maintains subarray mappings. PRACtical provides memory with an alert signal to notify MC to stall requests at the bank level. Since we change channel-level blocking to bank-level blocking, we discuss the following potential security issue.
Since PRACtical allows access to non-mitigated banks, this potentially provides an attacker with an opportunity during the recovery for a period to send more activations to a target bank that is close to the Alert threshold. As an example, assume bank A sets its bit in RFM_MASK and sends alert and bank B is in normal operation of serving requests with its highest activation count close to the threshold, $T-1$ . While the mitigation of bank A is performed, an attacker can send up to $N_{\texttt{ACT}}=\frac{t_{\text{{RFM\_MASK}}}}{t_{\text{RC}}}$ ACT s to bank B. $N_{ACT}$ is at most 6 since the RFM duration is 350ns and tRC is 52ns. Therefore, bank B will have rows with at most $T+5$ activation counts. PRACtical decreases the Alert threshold by this maximum value (5 in our system) to account for the worst-case scenario. If during recovery, the counter of a row in a bank reaches threshold, it sets the bit and sends the Alert signal. Once this recovery period is finished, in the next recovery, this bank also performs necessary mitigation. Since PRACtical uses a safe threshold, it guarantees the same security as the PRAC+ABO guarantees. In general, PRACtical does not need to lower the threshold. It can keep the ALERT threshold same, and have a second threshold that sets bank bits to 1 in BA register. Once there is row counter reaching the second threshold, its corresponding bank bit is set to 1. Once a row counter reaches the Alert threshold, an alert is sent to MC. For simplicity, we lower the threshold to lower and safe level.
7. Related Work
This paper first eagerly analyzes the efficiency of the existing JEDEC PRAC+ABO using a diverse set of benchmarks and secondly proposes a new solution called PRACtical to improve the performance of memory operations while keeping the same security guarantees provided by PRAC+ABO standards. PRACtical is a transparent hardware solution and can be deeply related to other works, such as counter-tracking mechanisms, hardware and software mitigations, and so on.
Counter-tracking mechanism. The concept of using activation counters was introduced and patented around by many works (Bains and Halbert, 2016; Kim et al., 2014b; Seyedzadeh et al., 2016, 2018; Lee et al., 2019; Kang et al., 2020; Qureshi et al., 2022; Woo et al., 2023). Later works (Park et al., 2020; Marazzi et al., 2022; Kim et al., 2022; Jaleel et al., 2024a) proposed secure in-DRAM tracking mechanisms to tackle energy and performance issues. Graphene (Park et al., 2020) designs lightweight RowHammer protection to identify the frequent inputs of incoming stream achieving near-zero performance-energy overhead. Mithril (Kim et al., 2022) is the first to propose DRAM-memory controller cooperative mitigation using in-DRAM tracking. Aamer Jaleel et al. (Jaleel et al., 2024a) proposes to manage trackers with probabilistic management policies like request-stream sampling and random evictions. PROTRR (Marazzi et al., 2022) uses frequent item counting to track aggressor rows in DRAM.
DRAM Performance Mechanisms. Subarray-level parallelism has been investigated in several prior studies. Kim et al. (Kim et al., 2012) proposed subarray-level parallel memory access mechanisms to improve memory bandwidth and performance. Hassan et al. (Hassan et al., 2024) introduced a self-managing DRAM architecture that leverages the independence of subarrays to enable autonomous management within DRAM devices. Our approach is to eliminate the obscurity for subarray parallelism due to the increment circuit design in PRAC. Specifically, we propose modification of the circuit to enable overlapping only the counter update phase rather than the entire precharge phase with the subsequent activation, thereby minimizing performance overhead. Additionally, Chang et al. (Chang et al., 2014) explored subarray-level refresh operations, while HiRa (Yağlikçi et al., 2022) presents methods to reduce refresh latency by concurrently refreshing two rows connected to distinct charge restoration circuitries. BreakHammer (Canpolat et al., 2024a) removes the performance overhead of Rowhammer attacks by identifying and throttling hardware threats that frequently triggter preventive actions.
Slowdown Attacks. Due to the impact of DRAM on performance, the research community has long explored threats that exploit shared memory subsystems to degrade performance, often in the form of Denial-of-Service (DoS) attacks (Mutlu, 2007). While recent Rowhammer mitigation mechanisms aim to enhance system reliability, they can inadvertently introduce substantial performance overheads, particularly when relying on aggressive repair strategies such as frequent refreshes (Bhati et al., 2015; Mukundan et al., 2013) or row remapping (Saxena et al., 2024a). Different works (Nazaraliyev et al., 2025; Woo and Nair, 2025; Canpolat et al., 2024b) describe ways to exploit RH mitigation for performance and side channel attacks.
8. Conclusion
In this paper, we tackle the performance and energy overhead inherent in PRAC+ABO. We propose PRACtical, a novel PRAC+ABO enhancement featuring a two-level optimization that enables subarray-level counter updates and allows DRAM banks to mitigate RowHammer independently without stalling. PRACtical introduces minimal hardware changes—namely, centralized increment circuit connected to subarray and a single global register, called bank-alert register, where each bit indicates whether a specific bank needs a mitigation — enabling the memory controller to continue serving requests to unaffected banks. Our evaluations show that PRACtical improves performance by a geomean of 8% and saves energy by an average of 20% over PRAC+ABO. Its performance is same as the baseline - no mitigation architecture and energy consumption is minimal. Overall, PRACtical provides an efficient and practical enhancement to PRAC+ABO, balancing performance and security with low hardware overhead.
References
- (1)
- spe (2006) 2006. Standard Performance Evaluation Corporation (SPEC) CPU2006 Benchmark Suite. http://www.spec.org/cpu2006/. Accessed: 2025-04-10.
- spe (2017) 2017. Standard Performance Evaluation Corporation (SPEC) CPU2017 Benchmark Suite. http://www.spec.org/cpu2017. Accessed: 2025-04-10.
- Aweke et al. (2016) Zelalem Birhanu Aweke, Salessawi Ferede Yitbarek, Rui Qiao, Reetuparna Das, Matthew Hicks, Yossi Oren, and Todd Austin. 2016. ANVIL: Software-based protection against next-generation rowhammer attacks. ACM SIGPLAN Notices 51, 4 (2016), 743–755.
- Bains and Halbert (2016) Kuljit S Bains and John B Halbert. 2016. Distributed row hammer tracking. US Patent 9,299,400.
- Balasubramonian et al. (2017) Rajeev Balasubramonian, Andrew B Kahng, Naveen Muralimanohar, Ali Shafiee, and Vaishnav Srinivas. 2017. CACTI 7: New tools for interconnect exploration in innovative off-chip memories. ACM Transactions on Architecture and Code Optimization (TACO) 14, 2 (2017), 1–25.
- Bennett et al. (2021) Tanj Bennett, Stefan Saroiu, Alec Wolman, and Lucian Cojocar. 2021. Panopticon: A complete in-dram rowhammer mitigation. In Workshop on DRAM Security (DRAMSec), Vol. 22. 110.
- Bhati et al. (2015) Ishwar Bhati, Zeshan Chishti, Shih-Lien Lu, and Bruce Jacob. 2015. Flexible auto-refresh: Enabling scalable and energy-efficient DRAM refresh reductions. In Proceedings of the 42nd Annual International Symposium on Computer Architecture. 235–246.
- Canpolat et al. (2024a) Oğuzhan Canpolat, A Giray Yağlıkçı, Ataberk Olgun, Ismail Emir Yuksel, Yahya Can Tuğrul, Konstantinos Kanellopoulos, Oğuz Ergin, and Onur Mutlu. 2024a. Breakhammer: Enhancing rowhammer mitigations by carefully throttling suspect threads. In 2024 57th IEEE/ACM International Symposium on Microarchitecture (MICRO). IEEE, 915–934.
- Canpolat et al. (2025) Oğuzhan Canpolat, A Giray Yağlıkçı, Geraldo F Oliveira, Ataberk Olgun, Nisa Bostancı, İsmail Emir Yüksel, Haocong Luo, Oğuz Ergin, and Onur Mutlu. 2025. Chronus: Understanding and Securing the Cutting-Edge Industry Solutions to DRAM Read Disturbance. arXiv preprint arXiv:2502.12650 (2025).
- Canpolat et al. (2024b) Oğuzhan Canpolat, A Giray Yağlıkçı, Geraldo F Oliveira, Ataberk Olgun, Oğuz Ergin, and Onur Mutlu. 2024b. Understanding the security benefits and overheads of emerging industry solutions to dram read disturbance. arXiv preprint arXiv:2406.19094 (2024).
- Chang et al. (2016) Kevin K Chang, Prashant J Nair, Donghyuk Lee, Saugata Ghose, Moinuddin K Qureshi, and Onur Mutlu. 2016. Low-cost inter-linked subarrays (LISA): Enabling fast inter-subarray data movement in DRAM. In 2016 IEEE International Symposium on High Performance Computer Architecture (HPCA). IEEE, 568–580.
- Chang et al. (2014) Kevin Kai-Wei Chang, Donghyuk Lee, Zeshan Chishti, Alaa R. Alameldeen, Chris Wilkerson, Yoongu Kim, and Onur Mutlu. 2014. Improving DRAM performance by parallelizing refreshes with accesses. In 2014 IEEE 20th International Symposium on High Performance Computer Architecture (HPCA). 356–367. https://doi.org/10.1109/HPCA.2014.6835946
- Cojocar et al. (2019) Lucian Cojocar, Kaveh Razavi, Cristiano Giuffrida, and Herbert Bos. 2019. Exploiting correcting codes: On the effectiveness of ecc memory against rowhammer attacks. In 2019 IEEE Symposium on Security and Privacy (SP). IEEE, 55–71.
- Cooper et al. (2010) Brian F Cooper, Adam Silberstein, Erwin Tam, Raghu Ramakrishnan, and Russell Sears. 2010. Benchmarking cloud serving systems with YCSB. In Proceedings of the 1st ACM symposium on Cloud computing. 143–154.
- de Ridder et al. (2021) Finn de Ridder, Pietro Frigo, Emanuele Vannacci, Herbert Bos, Cristiano Giuffrida, and Kaveh Razavi. 2021. $\{$ SMASH $\}$ : Synchronized many-sided rowhammer attacks from $\{$ JavaScript $\}$ . In 30th USENIX Security Symposium (USENIX Security 21). 1001–1018.
- Frigo et al. (2020) Pietro Frigo, Emanuele Vannacc, Hasan Hassan, Victor Van Der Veen, Onur Mutlu, Cristiano Giuffrida, Herbert Bos, and Kaveh Razavi. 2020. TRRespass: Exploiting the many sides of target row refresh. In 2020 IEEE Symposium on Security and Privacy (SP). IEEE, 747–762.
- Fritts et al. (2009) Jason E Fritts, Frederick W Steiling, Joseph A Tucek, and Wayne Wolf. 2009. MediaBench II video: Expediting the next generation of video systems research. Microprocessors and Microsystems 33, 4 (2009), 301–318.
- Gholami et al. (2024) Amir Gholami, Zhewei Yao, Sehoon Kim, Coleman Hooper, Michael W. Mahoney, and Kurt Keutzer. 2024. AI and Memory Wall. IEEE Micro 44, 3 (2024), 33–39. https://doi.org/10.1109/MM.2024.3373763
- Ghose et al. (2019) Saugata Ghose, Tianshi Li, Nastaran Hajinazar, Damla Senol Cali, and Onur Mutlu. 2019. Demystifying complex workload-dram interactions: An experimental study. Proceedings of the ACM on Measurement and Analysis of Computing Systems 3, 3 (2019), 1–50.
- Gruss et al. (2018) Daniel Gruss, Moritz Lipp, Michael Schwarz, Daniel Genkin, Jonas Juffinger, Sioli O’Connell, Wolfgang Schoechl, and Yuval Yarom. 2018. Another flip in the wall of rowhammer defenses. In 2018 IEEE Symposium on Security and Privacy (SP). IEEE, 245–261.
- Gruss et al. (2016) Daniel Gruss, Clémentine Maurice, and Stefan Mangard. 2016. Rowhammer. js: A remote software-induced fault attack in javascript. In Detection of Intrusions and Malware, and Vulnerability Assessment: 13th International Conference, DIMVA 2016, San Sebastián, Spain, July 7-8, 2016, Proceedings 13. Springer, 300–321.
- Hassan et al. (2022) Hasan Hassan, Ataberk Olgun, A Giray Yaglikci, Haocong Luo, and Onur Mutlu. 2022. A case for self-managing dram chips: Improving performance, efficiency, reliability, and security via autonomous in-dram maintenance operations. arXiv (2022), 2207–13358.
- Hassan et al. (2024) Hasan Hassan, Ataberk Olgun, A Giray Yağlıkçı, Haocong Luo, Onur Mutlu, and ETH Zurich. 2024. Self-Managing DRAM: A Low-Cost Framework for Enabling Autonomous and Efficient DRAM Maintenance Operations. In 2024 57th IEEE/ACM International Symposium on Microarchitecture (MICRO). IEEE, 949–965.
- Itoh (2001) Kiyoo Itoh. 2001. VLSI Memory Chip Design. Springer.
- Jaleel et al. (2024a) Aamer Jaleel, Stephen W Keckler, and Gururaj Saileshwar. 2024a. Probabilistic tracker management policies for low-cost and scalable rowhammer mitigation. arXiv preprint arXiv:2404.16256 (2024).
- Jaleel et al. (2024b) Aamer Jaleel, Gururaj Saileshwar, Stephen W Keckler, and Moinuddin Qureshi. 2024b. Pride: Achieving secure rowhammer mitigation with low-cost in-dram trackers. In 2024 ACM/IEEE 51st Annual International Symposium on Computer Architecture (ISCA). IEEE, 1157–1172.
- JEDEC (2020) JEDEC. 2020. JESD79-5: DDR5 SDRAM Standard.
- JEDEC (2024a) JEDEC. 2024a. JEDEC Updates JESD79-5C DDR5 SDRAM Standard: Elevating Performance and Security for Next-Gen Technologies. https://www.jedec.org/news/pressreleases/jedec-updates-jesd79-5cddr5-sdram-standard-elevating-performance-and-security Accessed: 2025-03-31.
- JEDEC (2024b) JEDEC. 2024b. JESD79-5C: DDR5 SDRAM Standard.
- Kang et al. (2020) Ingab Kang, Eojin Lee, and Jung Ho Ahn. 2020. CAT-TWO: Counter-based adaptive tree, time window optimized for DRAM row-hammer prevention. IEEE Access 8 (2020), 17366–17377.
- Keeth et al. (2007) Brent Keeth, R. Jacob Baker, Scott Benton, and Brian Johnson. 2007. DRAM Circuit Design: Fundamental and High-Speed Topics (2nd ed.). Wiley-IEEE Press.
- Kim et al. (2014b) Dae-Hyun Kim, Prashant J Nair, and Moinuddin K Qureshi. 2014b. Architectural support for mitigating row hammering in DRAM memories. IEEE Computer Architecture Letters 14, 1 (2014), 9–12.
- Kim et al. (2020) Jeremie S Kim, Minesh Patel, A Giray Yağlıkçı, Hasan Hassan, Roknoddin Azizi, Lois Orosa, and Onur Mutlu. 2020. Revisiting rowhammer: An experimental analysis of modern dram devices and mitigation techniques. In 2020 ACM/IEEE 47th Annual International Symposium on Computer Architecture (ISCA). IEEE, 638–651.
- Kim et al. (2021) Kwangrae Kim, Jeonghyun Woo, Junsu Kim, and Ki-Seok Chung. 2021. Hammerfilter: Robust protection and low hardware overhead method for rowhammer. In 2021 IEEE 39th International Conference on Computer Design (ICCD). IEEE, 212–219.
- Kim et al. (2022) Michael Jaemin Kim, Jaehyun Park, Yeonhong Park, Wanju Doh, Namhoon Kim, Tae Jun Ham, Jae W Lee, and Jung Ho Ahn. 2022. Mithril: Cooperative row hammer protection on commodity dram leveraging managed refresh. In 2022 IEEE International Symposium on High-Performance Computer Architecture (HPCA). IEEE, 1156–1169.
- Kim et al. (2014a) Yoongu Kim, Ross Daly, Jeremie Kim, Chris Fallin, Ji Hye Lee, Donghyuk Lee, Chris Wilkerson, Konrad Lai, and Onur Mutlu. 2014a. Flipping bits in memory without accessing them: An experimental study of DRAM disturbance errors. ACM SIGARCH Computer Architecture News 42, 3 (2014), 361–372.
- Kim et al. (2012) Yoongu Kim, Vivek Seshadri, Donghyuk Lee, Jamie Liu, and Onur Mutlu. 2012. A case for exploiting subarray-level parallelism (SALP) in DRAM. ACM SIGARCH Computer Architecture News 40, 3 (2012), 368–379.
- Konoth et al. (2018) Radhesh Krishnan Konoth, Marco Oliverio, Andrei Tatar, Dennis Andriesse, Herbert Bos, Cristiano Giuffrida, and Kaveh Razavi. 2018. $\{$ ZebRAM $\}$ : Comprehensive and compatible software protection against rowhammer attacks. In 13th USENIX Symposium on Operating Systems Design and Implementation (OSDI 18). 697–710.
- Lee et al. (2019) Eojin Lee, Ingab Kang, Sukhan Lee, G Edward Suh, and Jung Ho Ahn. 2019. TWiCe: Preventing row-hammering by exploiting time window counters. In Proceedings of the 46th International Symposium on Computer Architecture. 385–396.
- Loughlin et al. (2021) Kevin Loughlin, Stefan Saroiu, Alec Wolman, and Baris Kasikci. 2021. Stop! hammer time: rethinking our approach to rowhammer mitigations. In Proceedings of the Workshop on Hot Topics in Operating Systems. 88–95.
- Luo et al. (2023a) Haocong Luo, Ataberk Olgun, Abdullah Giray Yağlıkçı, Yahya Can Tuğrul, Steve Rhyner, Meryem Banu Cavlak, Joël Lindegger, Mohammad Sadrosadati, and Onur Mutlu. 2023a. Rowpress: Amplifying read disturbance in modern dram chips. In Proceedings of the 50th Annual International Symposium on Computer Architecture. 1–18.
- Luo et al. (2020) Haocong Luo, Taha Shahroodi, Hasan Hassan, Minesh Patel, A Giray Yağlıkçı, Lois Orosa, Jisung Park, and Onur Mutlu. 2020. CLR-DRAM: A low-cost DRAM architecture enabling dynamic capacity-latency trade-off. In 2020 ACM/IEEE 47th Annual International Symposium on Computer Architecture (ISCA). IEEE, 666–679.
- Luo et al. (2023b) Haocong Luo, Yahya Can Tuğrul, F Nisa Bostancı, Ataberk Olgun, A Giray Yağlıkçı, and Onur Mutlu. 2023b. Ramulator 2.0: A modern, modular, and extensible dram simulator. IEEE Computer Architecture Letters 23, 1 (2023), 112–116.
- Marazzi et al. (2022) Michele Marazzi, Patrick Jattke, Flavien Solt, and Kaveh Razavi. 2022. Protrr: Principled yet optimal in-dram target row refresh. In 2022 IEEE Symposium on Security and Privacy (SP). IEEE, 735–753.
- Misra and Gries (1982) Jayadev Misra and David Gries. 1982. Finding repeated elements. Science of computer programming 2, 2 (1982), 143–152.
- Mukundan et al. (2013) Janani Mukundan, Hillery Hunter, Kyu-hyoun Kim, Jeffrey Stuecheli, and José F Martínez. 2013. Understanding and mitigating refresh overheads in high-density DDR4 DRAM systems. ACM SIGARCH Computer Architecture News 41, 3 (2013), 48–59.
- Mutlu and Kim (2019) Onur Mutlu and Jeremie S Kim. 2019. Rowhammer: A retrospective. IEEE Transactions on Computer-Aided Design of Integrated Circuits and Systems 39, 8 (2019), 1555–1571.
- Mutlu (2007) Thomas Moscibroda Onur Mutlu. 2007. Memory performance attacks: Denial of memory service in multi-core systems. In USENIX security.
- Nazaraliyev et al. (2025) Ravan Nazaraliyev, Yicheng Zhang, Sankha Baran Dutta, Andres Marquez, Kevin Barker, and Nael Abu-Ghazaleh. 2025. Not so Refreshing: Attacking GPUs using RFM Rowhammer Mitigation. In 34th USENIX Security Symposium (USENIX Security 25).
- Olgun et al. (2024) Ataberk Olgun, Yahya Can Tugrul, Nisa Bostanci, Ismail Emir Yuksel, Haocong Luo, Steve Rhyner, Abdullah Giray Yaglikci, Geraldo F Oliveira, and Onur Mutlu. 2024. $\{$ ABACuS $\}$ : $\{$ All-Bank $\}$ Activation Counters for Scalable and Low Overhead $\{$ RowHammer $\}$ Mitigation. In 33rd USENIX Security Symposium (USENIX Security 24). 1579–1596.
- Park et al. (2020) Yeonhong Park, Woosuk Kwon, Eojin Lee, Tae Jun Ham, Jung Ho Ahn, and Jae W Lee. 2020. Graphene: Strong yet lightweight row hammer protection. In 2020 53rd Annual IEEE/ACM International Symposium on Microarchitecture (MICRO). IEEE, 1–13.
- Qureshi ([n. d.]) Moinuddin Qureshi. [n. d.]. AutoRFM: Scaling Low-Cost In-DRAM Trackers to Ultra-Low Rowhammer Thresholds. ([n. d.]).
- Qureshi and Qazi (2024) Moinuddin Qureshi and Salman Qazi. 2024. Moat: Securely mitigating rowhammer with per-row activation counters. arXiv preprint arXiv:2407.09995 (2024).
- Qureshi et al. (2024) Moinuddin Qureshi, Salman Qazi, and Aamer Jaleel. 2024. MINT: Securely mitigating rowhammer with a minimalist in-dram tracker. In 2024 57th IEEE/ACM International Symposium on Microarchitecture (MICRO). IEEE, 899–914.
- Qureshi et al. (2022) Moinuddin Qureshi, Aditya Rohan, Gururaj Saileshwar, and Prashant J Nair. 2022. Hydra: enabling low-overhead mitigation of row-hammer at ultra-low thresholds via hybrid tracking. In Proceedings of the 49th Annual International Symposium on Computer Architecture. 699–710.
- Razavi et al. (2016) Kaveh Razavi, Ben Gras, Erik Bosman, Bart Preneel, Cristiano Giuffrida, and Herbert Bos. 2016. Flip feng shui: Hammering a needle in the software stack. In 25th USENIX Security Symposium (USENIX Security 16). 1–18.
- SAFARI Research Group (2021) SAFARI Research Group. 2021. Ramulator V2.0. https://github.com/CMU-SAFARI/ramulator2.
- Saileshwar et al. (2022) Gururaj Saileshwar, Bolin Wang, Moinuddin Qureshi, and Prashant J Nair. 2022. Randomized row-swap: mitigating row hammer by breaking spatial correlation between aggressor and victim rows. In Proceedings of the 27th ACM International Conference on Architectural Support for Programming Languages and Operating Systems. 1056–1069.
- Saxena et al. (2024a) Anish Saxena, Saurav Mathur, and Moinuddin Qureshi. 2024a. Rubix: Reducing the overhead of secure rowhammer mitigations via randomized line-to-row mapping. In Proceedings of the 29th ACM International Conference on Architectural Support for Programming Languages and Operating Systems, Volume 2. 1014–1028.
- Saxena and Qureshi (2024) Anish Saxena and Moinuddin Qureshi. 2024. Start: Scalable tracking for any rowhammer threshold. In 2024 IEEE International Symposium on High-Performance Computer Architecture (HPCA). IEEE, 578–592.
- Saxena et al. (2022) Anish Saxena, Gururaj Saileshwar, Prashant J Nair, and Moinuddin Qureshi. 2022. Aqua: Scalable rowhammer mitigation by quarantining aggressor rows at runtime. In 2022 55th IEEE/ACM International Symposium on Microarchitecture (MICRO). IEEE, 108–123.
- Saxena et al. (2024b) Anish Saxena, Walter Wang, and Alexandros Daglis. 2024b. Preventing Rowhammer Exploits via Low-Cost Domain-Aware Memory Allocation. arXiv preprint arXiv:2409.15463 (2024).
- Schroeder et al. (2009a) Bianca Schroeder, Eduardo Pinheiro, and Wolf-Dietrich Weber. 2009a. DRAM errors in the wild: a large-scale field study. SIGMETRICS Perform. Eval. Rev. 37, 1 (June 2009), 193–204. https://doi.org/10.1145/2492101.1555372
- Schroeder et al. (2009b) Bianca Schroeder, Eduardo Pinheiro, and Wolf-Dietrich Weber. 2009b. DRAM errors in the wild: a large-scale field study. In Proceedings of the Eleventh International Joint Conference on Measurement and Modeling of Computer Systems (Seattle, WA, USA) (SIGMETRICS ’09). Association for Computing Machinery, New York, NY, USA, 193–204. https://doi.org/10.1145/1555349.1555372
- Seaborn and Dullien (2015) Mark Seaborn and Thomas Dullien. 2015. Exploiting the DRAM rowhammer bug to gain kernel privileges. Black Hat 15, 71 (2015), 2.
- Seyedzadeh et al. (2016) Seyed Mohammad Seyedzadeh, Alex K Jones, and Rami Melhem. 2016. Counter-based tree structure for row hammering mitigation in DRAM. IEEE Computer Architecture Letters 16, 1 (2016), 18–21.
- Seyedzadeh et al. (2018) Seyed Mohammad Seyedzadeh, Alex K Jones, and Rami Melhem. 2018. Mitigating wordline crosstalk using adaptive trees of counters. In 2018 ACM/IEEE 45th Annual International Symposium on Computer Architecture (ISCA). IEEE, 612–623.
- Son et al. (2017) Mungyu Son, Hyunsun Park, Junwhan Ahn, and Sungjoo Yoo. 2017. Making DRAM stronger against row hammering. In Proceedings of the 54th Annual Design Automation Conference 2017. 1–6.
- Synopsys Inc. (2023) Synopsys Inc. 2023. Synopsys Design Compiler User Guide. Synopsys Inc. https://www.synopsys.com/ Version Y-2023.03.
- Transaction Processing Performance Council (2025) Transaction Processing Performance Council. 2025. TPC Benchmarks. http://www.tpc.org/. Accessed: 2025-04-10.
- Woo et al. (2025) Jeonghyun Woo, Chris S Lin, Prashant J Nair, Aamer Jaleel, and Gururaj Saileshwar. 2025. Qprac: Towards secure and practical prac-based rowhammer mitigation using priority queues. arXiv preprint arXiv:2501.18861 (2025).
- Woo and Nair (2025) Jeonghyun Woo and Prashant J Nair. 2025. Dapper: A performance-attack-resilient tracker for rowhammer defense. arXiv preprint arXiv:2501.18857 (2025).
- Woo et al. (2023) Jeonghyun Woo, Gururaj Saileshwar, and Prashant J Nair. 2023. Scalable and secure row-swap: Efficient and safe row hammer mitigation in memory systems. In 2023 IEEE International Symposium on High-Performance Computer Architecture (HPCA). IEEE, 374–389.
- Wulf and McKee (1995) Wm A Wulf and Sally A McKee. 1995. Hitting the memory wall: Implications of the obvious. ACM SIGARCH computer architecture news 23, 1 (1995), 20–24.
- Yağlikçi et al. (2021) A Giray Yağlikçi, Minesh Patel, Jeremie S Kim, Roknoddin Azizi, Ataberk Olgun, Lois Orosa, Hasan Hassan, Jisung Park, Konstantinos Kanellopoulos, Taha Shahroodi, et al. 2021. Blockhammer: Preventing rowhammer at low cost by blacklisting rapidly-accessed dram rows. In 2021 IEEE International Symposium on High-Performance Computer Architecture (HPCA). IEEE, 345–358.
- Yağlikçi et al. (2022) A. Giray Yağlikçi, Ataberk Olgun, Minesh Patel, Haocong Luo, Hasan Hassan, Lois Orosa, Oğuz Ergin, and Onur Mutlu. 2022. HiRA: Hidden Row Activation for Reducing Refresh Latency of Off-the-Shelf DRAM Chips. In 2022 55th IEEE/ACM International Symposium on Microarchitecture (MICRO). 815–834. https://doi.org/10.1109/MICRO56248.2022.00062