# GM-PRM: A Generative Multimodal Process Reward Model for Multimodal Mathematical Reasoning
> Corresponding author.
## Abstract
Multimodal Large Language Models (MLLMs) demonstrate remarkable capabilities but often struggle with complex, multi-step mathematical reasoning, where minor errors in visual perception or logical deduction can lead to complete failure. While Process Reward Models (PRMs) offer step-by-step supervision, existing multimodal PRMs are limited to being binary verifiers that can identify but not correct errors, offering little explanatory power. To address these deficiencies, we introduce the Generative Multimodal Process Reward Model (GM-PRM), a novel paradigm that transforms the PRM from a passive judge into an active reasoning collaborator. Instead of a simple scalar score, GM-PRM provides a fine-grained, interpretable analysis of each reasoning step, evaluating its step intent, visual alignment, and logical soundness. More critically, GM-PRM is trained to generate a corrected version of the first erroneous step it identifies. This unique corrective capability enables our new test-time inference strategy, Refined Best-of-N (Refined-BoN). This framework actively enhances solution quality by using the PRM’s generated correction to guide the policy model toward a more promising reasoning trajectory, thereby improving the diversity and correctness of the solution pool. We demonstrate that GM-PRM achieves state-of-the-art results on multiple multimodal math benchmarks, significantly boosting policy model performance with remarkable data efficiency, requiring only a 20K-sample training dataset. Our code will be released upon acceptance.
## 1 Introduction
The advent of Multimodal Large Language Models (MLLMs) has marked a significant milestone in artificial intelligence, demonstrating remarkable capabilities in integrating and understanding visual and textual information (Caffagni et al. 2024; Yan et al. 2024c; Yan and Lee 2024; Huo et al. 2024; Zheng et al. 2024b). While these models excel at general-purpose tasks such as image captioning and visual question answering, they often falter when confronted with complex, multi-step reasoning challenges, particularly within specialized domains like mathematics (Wang et al. 2024; Yan et al. 2024a, 2025a; Ahn et al. 2024). Solving multimodal mathematical problems requires not only accurate perception of visual elements (e.g., geometric figures, function graphs) but also a rigorous, step-by-step logical deduction process (Shi et al. 2024; Zhuang et al. 2025; Yan et al. 2025b). Minor errors in either image interpretation or logical inference can cascade, leading to entirely incorrect final answers.
<details>
<summary>figures/comparison.png Details</summary>
### Visual Description
## Diagram: Comparison of Reward Model Architectures
### Overview
The image presents a comparative architectural diagram illustrating three distinct approaches to training reward models for AI systems, specifically in the context of multimodal mathematical reasoning. The diagram progresses from a basic Outcome Reward Model (ORM) to a standard Process Reward Model (PRM), and finally to the proposed "GM-PRM" (Generative Multimodal Process Reward Model), which introduces correction mechanisms.
### Components/Axes
The diagram is divided into three horizontal panels, each representing a different model architecture:
* **Panel (a): Outcome Reward Model (ORM)**
* **Input:** "Question" (represented by a chalkboard icon with $E=mc^2$).
* **Process:** "Answer" (green box).
* **Output:** Robot icon labeled "ORM".
* **Feedback:** Orange dashed arrow labeled "Reward" pointing from ORM to "Answer".
* **Annotation:** "ONLY Reward Final Ans" (red text, top-right).
* **Panel (b): Multimodal Process Reward Model (PRM)**
* **Input:** "Multimodal Math Qns" (represented by icons showing $\sqrt{4(x+y)}$ and $\pi \int \sqrt{x} \sum$).
* **Process:** A sequence of steps: "Step 1" (green), "Step 2" (green), "..." (ellipsis), "Step T" (green), "Answer" (green).
* **Output:** Robot icon labeled "PRM".
* **Feedback:** Multiple orange dashed arrows labeled "Reward" pointing from PRM to each individual step.
* **Annotations:** "Limited Explainability" and "No Correction Mechanism" (red text, top-right).
* **Panel (c): GM-PRM (Ours)**
* **Input:** "Multimodal Math Qns" (same as panel b).
* **Process:** A sequence of steps: "Step 1" (green), "Step 2" (purple, labeled "1st incorrect step"), "..." (ellipsis), "Step T" (green), "Answer" (green).
* **Transition:** An arrow labeled "After Correction" connects "Step 2" to "Step T".
* **Output:** Robot icon labeled "GM-PRM".
* **Feedback:** Orange dashed arrows from GM-PRM to steps; a purple dashed arrow from GM-PRM to "Step 2".
* **Annotations:** "Refined BoN" (Best-of-N) near the output arrow.
* **Footer (Bottom):** A dashed purple box labeled "Analysis & Judgement" containing three sub-components: "Step Intent", "Image Alignment", and "Reasoning Logic". A separate box to the right labeled "Refined & Corrected Version".
### Detailed Analysis
* **Panel (a) - ORM:** The flow is linear and singular. The model only evaluates the final output. The annotation "ONLY Reward Final Ans" confirms that intermediate reasoning steps are ignored.
* **Panel (b) - PRM:** The flow is granular. The model evaluates each step individually. However, the annotations "Limited Explainability" and "No Correction Mechanism" indicate that while the model can identify a bad step, it cannot rectify the reasoning path.
* **Panel (c) - GM-PRM:** This architecture introduces a branching or corrective logic.
* **Visual Indicator:** "Step 2" is highlighted in purple, indicating it is the "1st incorrect step."
* **Correction Flow:** The diagram shows a path "After Correction" that bypasses or modifies the sequence following the incorrect step.
* **Feedback Loop:** The purple dashed arrow from the GM-PRM robot back to "Step 2" suggests the model actively identifies and targets the error for correction.
* **Supporting Components:** The footer indicates that the GM-PRM relies on "Analysis & Judgement" (Step Intent, Image Alignment, Reasoning Logic) to produce a "Refined & Corrected Version."
### Key Observations
* **Evolution of Feedback:** The feedback mechanism evolves from a single point (ORM) to multiple points (PRM) to targeted, corrective feedback (GM-PRM).
* **Color Coding:** Green boxes represent standard/correct steps, while the purple box in panel (c) specifically denotes an error ("1st incorrect step").
* **Multimodal Integration:** The inclusion of "Image Alignment" in the footer of panel (c) suggests that the GM-PRM architecture is specifically designed to handle multimodal inputs (e.g., math problems involving images or complex notation) more effectively than the previous models.
### Interpretation
The diagram demonstrates a progression in AI reasoning evaluation.
1. **ORM** is depicted as insufficient for complex tasks because it treats the reasoning process as a "black box," only caring about the final result.
2. **PRM** improves upon this by evaluating intermediate steps, but the diagram highlights a critical failure mode: it lacks the ability to fix errors once they occur ("No Correction Mechanism").
3. **GM-PRM** is presented as the superior solution. It not only evaluates steps but actively performs "Analysis & Judgement" (using Step Intent, Image Alignment, and Reasoning Logic) to identify the "1st incorrect step" and apply a correction. This implies that GM-PRM is capable of iterative self-correction, leading to a "Refined & Corrected Version" of the reasoning path, which likely results in higher accuracy for complex multimodal mathematical problems.
</details>
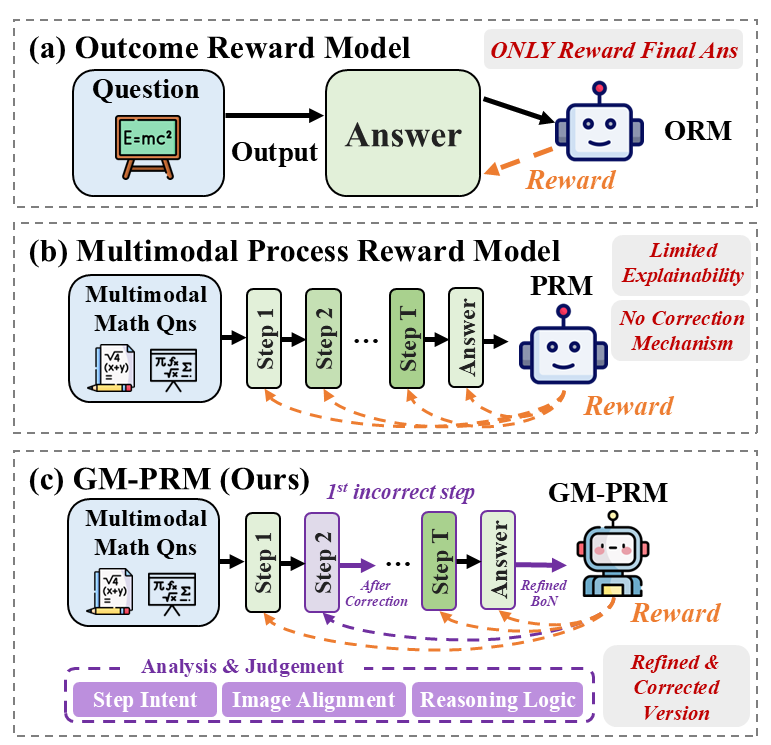
Figure 1: Comparison among ORM (a), PRM (b), and our proposed GM-PRM (c) for multimodal math reasoning.
To mitigate these reasoning deficiencies, Process Reward Models (PRMs) have emerged as a promising paradigm (Gao et al. 2024; Zhong et al. 2025). Unlike outcome-based models that only reward correct final answers (shown in Figure 1 (a)), PRMs provide fine-grained supervision by evaluating the correctness of each intermediate step in a reasoning chain (Zheng et al. 2024a; Lambert et al. 2024; Yan et al. 2024b), as shown in Figure 1 (b). This approach has proven effective in the language domain (Zeng et al. 2025; Yuan et al. 2024; Zhang et al. 2025a). However, extending PRMs to the multimodal context presents unique challenges (Miao et al. 2025; Du et al. 2025; Li et al. 2025b; Cao et al. 2025). Existing multimodal PRMs often function as binary classifiers, assigning a simple correct/incorrect label to each step, which offers limited explanatory power. Furthermore, they typically possess the ability to identify errors but lack the mechanism to correct them, leaving the reasoning process fundamentally broken. This limitation constrains their utility, especially within mechanisms like Best-of-N (BoN) sampling, which remain passive selection processes over a static set of potentially flawed solutions.
In this work, we introduce a novel G enerative M ultimodal P rocess R eward M odel (GM-PRM) to address these limitations, as illustrated in Figure 1 (c). Our model transcends the role of a simple verifier and acts as an active reasoning collaborator. Instead of merely outputting a scalar score, our GM-PRM leverages its generative capabilities to produce a detailed, interpretable analysis for each reasoning step. This analysis deconstructs the step into three critical aspects: its fundamental step intent, the correctness of its image alignment, and the soundness of its reasoning logic. More importantly, our model is trained not only to identify errors but also to generate a refined, corrected version of the first incorrect step it encounters.
This unique corrective capability enables us to propose a new test-time inference strategy: the Refined Best-of-N (Refined-BoN) process. This dynamic framework moves beyond passive selection by actively enhancing the quality of candidate solutions. When our GM-PRM identifies a flawed step within a generated solution, it intervenes by providing a corrected step, which is then used to guide the policy model in generating a new, more promising reasoning trajectory. This iterative refinement process significantly improves the diversity and correctness of the solution pool, leading to a substantial boost in the policy model’s problem-solving performance. Furthermore, we demonstrate that this powerful capability can be achieved with remarkable data efficiency, requiring a significantly smaller training dataset than previous approaches. Our primary contributions are as follows:
- We develop a generative multimodal PRM called GM-PRM that provides fine-grained, interpretable feedback for mathematical reasoning. It analyzes each step’s purpose, image alignment, and logical validity, moving beyond simple binary classification to offer deeper insight into the model’s thought process.
- We introduce a novel Refined-BoN framework that leverages the PRM’s generative power to actively correct errors at test time. It enhances the policy model’s ability to find correct solutions by iteratively improving flawed reasoning paths.
- We demonstrate the effectiveness and data efficiency of GM-PRM, achieving state-of-the-art results on multiple multimodal math benchmarks. Our approach requires only a 20K sample dataset, highlighting the quality of data curation and the power of generative supervision strategy.
## 2 Related Work
#### Process Reward Models (PRMs)
PRMs have been proposed to evaluate the fine-grained step level for model reasoning. During the implementation process, annotating and obtaining a high-quality training dataset incurs a high cost. PRM800K (Lightman et al. 2023) is the first process supervision dataset completely annotated by humans. To mitigate annotation costs, Math-Shepherd (Wang et al. 2023) proposes Monte Carlo (MC) estimation, while OmegaPRM (Luo et al. 2024) leverages Monte Carlo Tree Search (MCTS) to automatically evaluate each reasoning step, both utilizing the generation capabilities of Large Language Models (LLMs). Subsequent research has enhanced the effectiveness of PRMs through various methods, including VersaPRM (Zeng et al. 2025), Implicit PRM (Yuan et al. 2024), OpenPRM (Zhang et al. 2025a), PQM (Li and Li 2024), PAV (Setlur et al. 2024), and others. In addition, GenRM (Zhao et al. 2025) utilizes the generation ability of reward models to analyze each reasoning step and obtain the score of each step by taking the probability of the special evaluation token. Furthermore, GenPRM (Zhao et al. 2025), ThinkPRM (Khalifa et al. 2025), R-PRM (She et al. 2025) extend the method of using model generation analysis to evaluate steps to PRMs. There are also many studies on benchmarks of PRMs such as ProcessBench (Zheng et al. 2024a), PRMBench (Song et al. 2025), and Socratic-PRMBench (Li et al. 2025a).
#### Multimodal PRMs
After achieving certain results and progress in the research of language modality in PRMs, research on PRMs has also begun to shift towards multimodal tasks. M-STAR (Liu et al. 2024a) proposes and implements multimodal PRM on multimodal problems. URSA (Luo et al. 2025) constructs a dataset by inserting errors and utilizes it to train a multimodal PRM. VisualPRM (Wang et al. 2025b) not only uses MC estimation to construct a multimodal VisualPRM400K training dataset, but also proposes a benchmark for multimodal PRMs called VisualProcessBench, which is entirely annotated by humans. Athena-PRM (Wang et al. 2025a) proposes using prediction consistency between strong and weak completers to enhance the quality of automatically annotated data based on MC estimation and improving multimodal PRM by ORM initialization and negative data up-sampling. Moreover, PRM-BAS (Hu et al. 2025), MM-PRM (Du et al. 2025) and DreamPRM (Cao et al. 2025) also improve the capability of multimodal PRMs. Although several studies have explored multimodal PRMs, applying them to multimodal tasks effectively remains certain challenges, such as insufficient interpretability of the labels assigned to each reasoning step and the inability to correct identified erroneous steps. In our work, we introduce a generative multimodal PRM, GM-PRM to solve the above problems.
<details>
<summary>figures/Case.png Details</summary>
### Visual Description
## Educational Diagram: Geometry Problem Correction
### Overview
The image is a comparative analysis of a geometry problem solution. It displays a coordinate geometry question involving the translation of a triangle, followed by an "Original Solution" (which contains an error) and a "Refined Solution" (which corrects the error). The image serves as an example of correcting reasoning logic by grounding it in visual data.
### Components/Axes
* **Coordinate Grid (Top Left):**
* **X-axis:** Ranges from 0 to 10.
* **Y-axis:** Ranges from 0 to 8.
* **Triangle ABC:**
* Vertex B is located at (0, 1).
* Vertex C is located at (4, 2).
* Vertex A is located at (3, 4).
* **Textual Sections:**
* **Question (Textual Part):** The problem statement.
* **Original Solution:** Contains an incorrect step marked with a red 'X'.
* **GM-PRM: Analysis & Judgement:** A meta-analysis box critiquing the original solution.
* **Refined Solution:** Contains the corrected steps marked with green checkmarks.
### Detailed Analysis
#### 1. Question (Textual Part)
"As shown in the diagram, triangle ABC is first translated 4 units to the right and then 3 units upward. The position of vertex A after the translation, represented as a coordinate pair, is ( ).
A. (5, 4); B. (8, 5); C. (7, 7); D. No correct answer"
#### 2. Original Solution (Bottom Left)
* **Step 1:** "To solve this problem, we need to understand the concept of translation in geometry. Translation means moving a figure without rotating or changing its size. It involves adding a fixed amount (in this case, 4 units horizontally and 3 units vertically) to each coordinate of the vertices." (Marked with a green checkmark).
* **Step 2:** "Let's analyze the coordinates of vertex A before the translations: Vertex A is at the origin, so its initial coordinates are (0, 0)." (Marked with a red 'X').
* **GM-PRM: Analysis & Judgement:**
* "Step intent analysis: This step identifies the initial coordinates of vertex A before any translation occurs."
* "Image alignment analysis: The image shows vertex A located at the point (3, 4), not (0, 0)."
* "Reasoning logic analysis: ..."
#### 3. Refined Solution (Bottom Right)
* **Step 2:** "Let's analyze the coordinates of vertex A before the translations: Vertex A is initially at the point (3, 4) according to the image." (Marked with a green checkmark).
* **Step 3:** "Apply the first translation (4 units to the right):
- To translate a point (x, y) 4 units to the right, we add 4 to the x-coordinate. Therefore, (3 + 4, 4) = (7, 4)." (Marked with a green checkmark).
* **Step 6:** "Final answer: C" (Marked with a green checkmark).
### Key Observations
* **Visual Grounding Error:** The "Original Solution" failed because it ignored the visual evidence provided by the grid, incorrectly assuming the vertex was at the origin (0,0).
* **Correct Coordinates:** The grid clearly shows Vertex A at (3, 4).
* **Translation Logic:** The problem requires adding 4 to the x-coordinate (3+4=7) and 3 to the y-coordinate (4+3=7), resulting in the final coordinate (7, 7), which corresponds to option C.
### Interpretation
This image demonstrates the importance of **multimodal grounding** in problem-solving. The "Original Solution" represents a failure in reasoning where the system relied on a generic assumption (that a shape starts at the origin) rather than extracting the specific data from the provided visual diagram. The "Refined Solution" demonstrates the correct workflow:
1. **Extract:** Identify the specific coordinates from the visual grid (A = 3, 4).
2. **Apply:** Perform the mathematical operation (translation) on the extracted data.
3. **Verify:** Select the correct option based on the calculated result.
The inclusion of the "GM-PRM: Analysis & Judgement" box suggests this is an educational or diagnostic tool designed to train or evaluate AI models on their ability to reconcile visual data with textual logic.
</details>
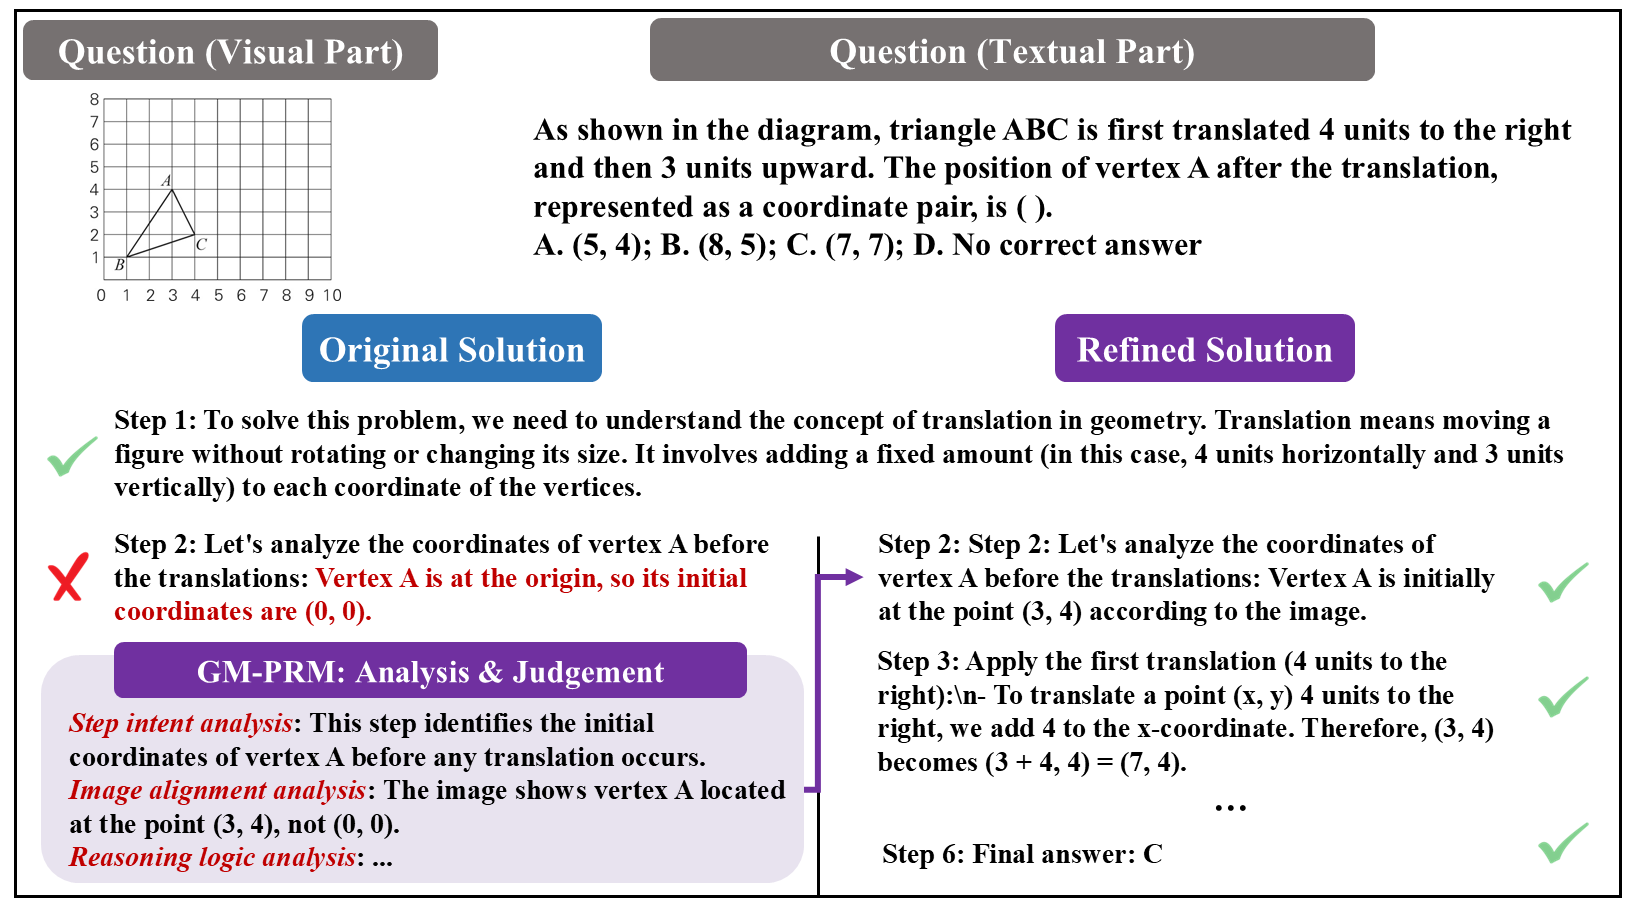
Figure 2: The illustration of a representative example before and after applying GM-PRM. In particular, GM-PRM first judges the steps of the original solution generated by the policy model. Subsequently, GM-PRM finds that the second step is incorrect and refines the second step to generate the correct version. The correct steps are input to the policy model to generate the refined solution, and finally the correct answer is obtained.
## 3 Methodology
In this section, we first describe how to utilize PRMs and generative PRMs combined with the BoN method to improve the performance of policy models for mathematical problems in Section 3.1. Then, we introduce our process to implement multimodal generative PRM, including data construction and model training in Section 3.2. Finally, we propose a novel Refined-BoN framework for PRMs to enhance its performance beyond traditional BoN method in Section 3.3.
### 3.1 PRMs for Mathematical Problem
In this section, we present the implementation methods of PRM and GM-PRM, and provide formal explanations of their usage through mathematical notation.
#### Problem and Reasoning Steps Generation
Let $Q$ denote a mathematical problem. Firstly, an LLM $π$ is involved in solving the mathematical problem $Q$ . To facilitate reasoning, the problem is combined with a prompt $P$ , which includes specific instructions guiding the generation of a step-by-step reasoning process and a final answer. This composite input is then fed into the LLM. When generating a response, $π$ generates a sequence of reasoning steps, denoted as $R=\{r_1,r_2,…,r_T\}$ , where $T$ represents the total number of reasoning steps to the given mathematical problem. The above process can be explained as follows:
$$
R=π(Q\parallel P), \tag{1}
$$
where $\parallel$ denotes the concatenation of the problem $Q$ and the prompt $P$ , and $π(·)$ represents the inference of LLM.
#### PRM
A single instance in a training dataset $D$ to train a PRM comprises three components: (1) a problem statement, (2) a generated response consisting of multiple inference steps, and (3) a corresponding set of binary labels, each taking a value of either 0 or 1, indicating whether the associated reasoning step is incorrect or correct, respectively.
During training, the PRM is optimized using cross-entropy loss and supervised to align its predictions with the ground-truth labels. After being trained, the PRM model is capable of processing new reasoning steps generated by the LLM in response to a given mathematical problem, which means that the PRM is able to assign a scalar score to each individual reasoning step, reflecting the model’s confidence in the correctness of each step:
$$
f_PRM:(Q,R)↦(s_1,s_2,\dots,s_T), \tag{2}
$$
where $f_PRM:(·)$ represents the inference of PRM, $s_i∈[0,1]$ denotes the confidence score assigned to the $i$ -th reasoning step $r_i$ , and $T$ denotes the number of reasoning steps.
For generative PRM, the binary labels in the training dataset are replaced with textual analyses and judgments, each formulated as a textual choice such as “incorrect” or “correct”. During inference, generative PRM also generates textual critiques and judgments for each step.
#### GM-PRM
By extending generative PRMs from the textual modality to a multimodal setting, we introduce GM-PRM. In this setting, mathematical problems are represented using both textual and visual information. The input to the policy model comprises the image of the problem, its textual description and task-specific instructions, which are processed jointly to generate reasoning steps. Similarly, during both training and inference, it is essential to provide GM-PRM with inputs from both visual and textual modalities, enabling it to perform cross-modal analysis when assigning correctness labels to each reasoning step:
$$
f_{GM-PRM}:(Q,I,R)↦(c_1,j_1,\dots,c_T,j_T), \tag{3}
$$
where $f_{GM-PRM}:(·)$ represents the inference of GM-PRM, $I$ denotes the image of the mathematical problem, $c_i$ denotes the critique of the $i$ -th reasoning step $r_i$ , and $j_i$ denotes the textual judgment assigned to the $i$ -th reasoning step $r_i$ .
### 3.2 Data Construction
In this section, we present our methodology employed to construct the training data for GM-PRM. The process consists of three key stages: (1) the selection of appropriate types and quantities of question data from the VisualPRM400K dataset (Wang et al. 2025b); (2) the generation of textual analysis and judgment data using GPT-4o; and (3) the filtering of the generated data through MC estimation and LLM-as-a-judge techniques to ensure quality and reliability.
#### Data Selection
VisualPRM400K is a large-scale dataset containing approximately 400,000 multimodal process supervision samples. In our work, we select plane geometry- and function-related problems from VisualPRM400K to construct a specialized subset and supplement it with corresponding textual analysis for training GM-PRM. This targeted subset with textual critiques supports the effective training of GM-PRM, yielding strong performance on geometric and function-based mathematical reasoning tasks.
#### Generation of Analysis and Judgment
To obtain textual analyses and judgments, we employ GPT-4o to critique each reasoning step from 4 key aspects: step intent, image alignment, reasoning logic, and step refinement.
The aspect of step intent indicates identifying the purpose of each reasoning step. This initial analysis establishes a foundation that allows GM-PRM to interpret and evaluate each reasoning step in context more effectively. Furthermore, this level of understanding facilitates subsequent error detection and correction tasks, thereby enhancing the overall effectiveness of GM-PRM.
The second aspect is image alignment. When MLLMs are used for inference in solving multimodal problems, MLLMs often make errors in image alignment, such as misidentifying parallel relationships or incorrectly annotating angles, which leads to flawed solutions. To address this, we employ GPT-4o to produce textual analysis and judgments in image alignment for inference steps, to form the dataset for training GM-PRM.
Reasoning logic is an indispensable presence in the step-by-step problem-solving process of MLLMs. However, the occurrences of logical inconsistencies and errors, such as miscalculations and incorrect inferences significantly impact the correctness of the reasoning steps and the final answers. Therefore, it is crucial for GM-PRM to be capable of identifying such logical flaws and making accurate judgments regarding the validity of the reasoning logic for each step. In our work, we employ GPT-4o to generate textual analysis and judgments of each step in reasoning logic to form the training dataset. The above process can be formulated as follows:
$$
F:(Q,I,R\parallel P)↦\{SI_i,IA_i,RL_i,FJ_i\}_i=1^t, \tag{4}
$$
where $F:(·)$ represents the inference of GPT-4o, $SI_i$ denotes the textual analysis of step intent for the $i$ -th reasoning step, $t$ denotes the number of the first incorrect step or the last step, $1≤slant t≤slant T$ , $IA_i=\{IAC_i,IAJ_i\}$ denotes the analysis which contains critique $IAC_i$ and judgment $IAJ_i$ in image alignment of the $i$ -th reasoning step, $RL_i=\{RLC_i,RLJ_i\}$ denotes the analysis which contains critique $RLC_i$ and judgment $RLJ_i$ in image alignment of the $i$ -th reasoning step, $FJ_i$ denotes the final judgment of the $i$ -th reasoning step.
Building on aforementioned three aspects, we further aim for GM-PRM to correct the first identified erroneous step. The above information enables GM-PRM to generate corrected reasoning steps that are logically coherent, visually accurate, and semantically aligned with the original step intent. The resulting corrected steps can then be used to construct more diverse and accurate inference solutions and ultimately produce more reliable final answers. In our work, we employ GPT-4o to generate a corrected version of the first identified error step in a reasoning process if the first error step is detected to exist by GPT-4o:
$$
F:(Q,I,R\parallel P)↦\begin{cases}RS,&if incorrect step exists,\\
∅,&otherwise.\end{cases} \tag{5}
$$
where $RS$ denotes refined step of the first error step in a reasoning process.
In summary, we design a structured prompt for GPT-4o to generate comprehensive analysis data across four dimensions based on the provided problems, associated images, and step-by-step solutions:
$$
F:(Q,I,R\parallel P)↦D, \tag{6}
$$
where $D$ denotes the generated training dataset:
$$
D=\{(\{SI_i^k,IA_i^k,RL_i^k,FJ_i^k\}_i=1^t,RS^k)\}_k=1^K, \tag{7}
$$
where $k∈\{1,2,\dots,K\}$ represents the $k$ -th sample in the dataset, and $K$ denotes the number of the training instances.
#### Data Filtering
The process of constructing training data using GPT-4o can be regarded as an implementation of LLM-as-a-judge methodology. Inspired by the combination of LLM-as-a-judge and MC estimation techniques (Zhang et al. 2025b), we employ the MC estimation technique proposed by Math-Shepherd (Wang et al. 2023) to effectively filter and curate the generated data.
Monte Carlo estimation is a strategy for automated annotation that leverages LLMs or MLLMs to generate multiple subsequent solutions for each step. When applying MC estimation to evaluate a step $r_i$ , we use an LLM or an MLLM as a ‘completer’ to finalize multiple subsequent reasoning processes from this step:
$$
f_comleter↦\{(r_i+1^j,\dots,r_L_{j}^j,a^j)\}_j=1^m, \tag{8}
$$
where $a^j$ is the final answer of the $j$ -th finalized solution and $L_j$ is the total number of steps.
Within MC estimation, one type of evaluation method is commonly applied: hard estimation. In hard estimation, a step $r_i$ is deemed correct if at least one subsequent solution reaches the correct final answer $a^*$ ; otherwise, it is considered incorrect:
$$
l_i^HE=\begin{cases}1,&∃ a_j,a_j=a^*,\\
0,&otherwise.\end{cases} \tag{9}
$$
In our data construction process, we employ hard estimation to label the correctness of individual reasoning steps. By integrating LLM-as-a-judge technique and MC estimation, we compare the labels acquired by MC estimation and judgments generated by GPT-4o. Data samples that receive consistent evaluations from both methods are selected as our final training dataset. By integrating these two methods, we aim to further enhance the reliability and quality of the training data, ensuring better performance of GM-PRM.
### 3.3 Refined-BoN Process
When applying Test-time Scaling (TTS) for LLMs and MLLMs, a widely adopted method is Best-of-N (BoN) approach. In the BoN process, a policy model is employed to generate N candidate solutions, which are then evaluated by reward models or self-consistency to select the optimal solution. However, during the BoN process, policy models are under identical prompting conditions when generating multiple solutions, which leads to the problem that the solutions often lack diversity and may exhibit limited correctness. In our work, we propose a novel Refined-BoN framework utilizing TTS techniques to enhance the diversity and accuracy of generated solutions, thereby improving the reasoning capabilities of policy models.
#### Refined-BoN Method
As shown in Figure 2, in Refined-BoN process, we first employ an MLLM as the policy model to generate $N/2$ initial solutions to a multimodal problem, and then these solutions are evaluated step-by-step by GM-PRM. For the subsequent $N/2$ solutions, the policy model generates them under varying conditions, informed by the evaluation of the preceding $N/2$ solutions: If GM-PRM identifies an incorrect reasoning step within a solution, it stops evaluating and refines the first erroneous step by generating a corrected version. This corrected step, along with all previously validated correct steps, is then input back into the policy model to continue the solution generation process. Conversely, if GM-PRM determines that all steps in a particular solution are correct, we employ the policy model to generate a new solution using the same prompt. Through this regeneration mechanism, we obtain the additional $N/2$ solutions. Subsequently, we employ GM-PRM to evaluate the subsequent $N/2$ solutions.
#### Solution Selection
After applying the Refined-BoN process, we obtain $N$ solutions for each problem, each accompanied by step-level correctness judgments. Moreover, we divide all the solutions into two categories: one where GM-PRM judges that it contains incorrect steps, and the other where GM-PRM judges that all its steps are correct. Furthermore, we take the probability of GM-PRM generating the associated “Correct” and “Incorrect” tokens as the score of each step.
Among the $N$ generated solutions, if there exist solutions in which all reasoning steps are judged correct, we calculate the average of the scores of all steps in these solutions as the overall score of the solution, and select the solution with the highest average score as the optimal solution.
For N solutions to a problem, if GM-PRM determines that all $N$ solutions contain incorrect steps, we calculate the average score of all steps in a solution as the overall score of the solution, and select the solution with the highest overall score as the final answer.
## 4 Experiments
| MiniCPM-V2.6-8B + GM-PRM (Ours) Improvements | 44.3 51.0 +6.7 | 16.0 18.1 +2.1 | 18.9 24.4 +5.5 | 22.6 25.7 +3.1 | 38.6 51.0 +12.4 | 28.1 34.0 +5.9 |
| --- | --- | --- | --- | --- | --- | --- |
| Llama-3.2-11B-Vision | 44.5 | 14.3 | 16.5 | 28.4 | 46.1 | 30.0 |
| + GM-PRM (Ours) | 49.5 | 18.2 | 18.8 | 32.7 | 53.4 | 34.5 |
| Improvements | +5.0 | +3.9 | +2.3 | +4.3 | +7.3 | +4.5 |
| Qwen2.5-VL-7B | 63.2 | 25.1 | 32.8 | 35.0 | 60.6 | 43.3 |
| + GM-PRM (Ours) | 65.0 | 28.2 | 37.4 | 39.2 | 69.0 | 47.8 |
| Improvements | +1.8 | +3.1 | +4.6 | +4.2 | +8.4 | +4.5 |
| InternVL3-8B | 50.6 | 20.3 | 25.0 | 27.0 | 50.9 | 34.8 |
| + GM-PRM (Ours) | 55.7 | 22.2 | 31.7 | 33.4 | 59.2 | 40.4 |
| Improvements | +5.1 | +1.9 | +6.7 | +6.4 | +8.3 | +5.6 |
| InternVL3-38B | 68.3 | 34.9 | 37.8 | 40.1 | 66.4 | 49.5 |
| + GM-PRM (Ours) | 69.9 | 37.0 | 39.1 | 43.1 | 72.9 | 52.4 |
| Improvements | +1.6 | +2.1 | +1.3 | +3.0 | +6.5 | +2.9 |
| InternVL3-78B | 68.0 | 34.6 | 36.0 | 38.1 | 65.7 | 48.5 |
| + GM-PRM (Ours) | 70.7 | 37.1 | 40.6 | 39.9 | 72.2 | 52.1 |
| Improvements | +2.7 | +2.5 | +4.6 | +1.8 | +6.5 | +3.6 |
Table 1: Percentage accuracy scores (%) of multiple MLLMs across five datasets. For each MLLM, the first row shows the baseline, the second shows the final result with GM-PRM, and the third shows the improvement. Only positive improvements are underlined. The best results are highlighted in bold. All values are reported after rounding to three decimal places.
In this section, we introduce our experimental setup to assess GM-PRM under the Refined-BoN process on five multimodal mathematical benchmarks in Section 4.1. In addition, we present the results of our experiments and three conclusions analyzed from the results in Section 4.2. Finally, we show the ablation studies in Section 4.3.
### 4.1 Experimental Setup
#### Benchmarks.
We evaluate GM-PRM across five datasets, including MathVista (Lu et al. 2023), MathVision (Wang et al. 2024), MathVerse (Zhang et al. 2024), DynaMath (Zou et al. 2024) and WeMath (Qiao et al. 2024). The datasets contain diverse problem types, such as plane geometry, functions, puzzle tests, etc. We use Vision-Only subset of MathVerse dataset and Plane-Geometry subset of DynaMath.
#### Settings.
We employ GM-PRM as the critic model for Refined-BoN evaluation and set N to 8 by default. For MLLMs, we select six models as the policy models to generate step-by-step reasoning processes. When reasoning, we set the temperature of the policy models to 0.7 and top-p to 0.9. For comparison, we use the average accuracy of N sets of answers generated by policy models as baselines.
#### Training Details.
To train GM-PRM, we use Qwen2.5-VL-7B-Instruct as our base model and perform supervised fine-tuning (SFT) with all parameters trainable except for the frozen Vision Transformer (ViT) encoder. During the training process, we utilize bfloat16 mixed-precision and DeepSpeed with zero3 technology and set the training consists of 2 epochs. For batch size, the batch size on each training device is set to 2, and through gradient accumulation, the effective batch size is extended to 16. Moreover, we use two A800 GPUs to train GM-PRM, and the AdamW optimizer is used with an initial learning rate of $1× 10^-5$ . The learning rate schedule involves a linear warm-up with the warm-up ratio equal to 0.05 followed by linear decay.
### 4.2 Main Results
As shown in Table 1, integrating GM-PRM with the Refined-BoN process consistently improves performance across five benchmark datasets for six different MLLMs. On average, our method yields notable accuracy gains, with improvements of +5.9 for MiniCPM-V2.6-8B, +4.5 for Llama-3.2-11B-Vision, +4.5 for Qwen2.5-VL-7B, and +5.6 for InternVL3-8B.
A closer look at dataset-level results reveals that the improvements are not uniform. The WeMath benchmark shows the most significant enhancement, with MiniCPM-V2.6-8B improving by +12.4 points, highlighting the ability of our method to strengthen mathematical reasoning on challenging problems. Similarly, MathVerse and DynaMath exhibit consistent gains of +4.5–6.7 points across multiple models, suggesting that our approach particularly benefits datasets requiring complex symbolic manipulation and multi-step reasoning. In contrast, MathVision improvements are more modest (+1.9–3.9), indicating that the visual reasoning component may already be relatively strong in baseline models.
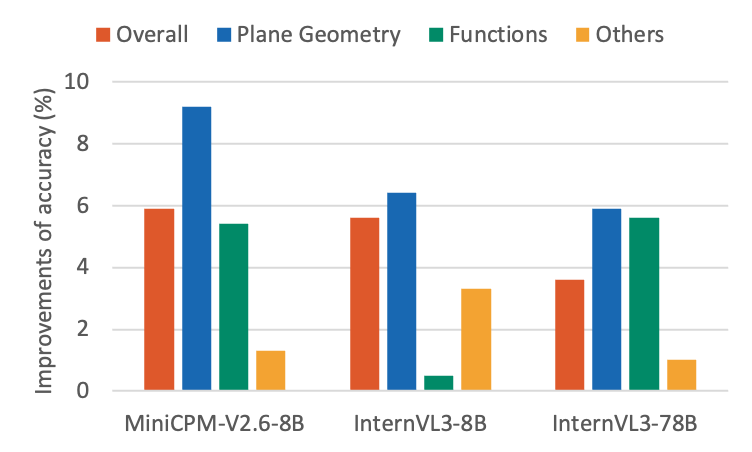
GM-PRM combined with the Refined-BoN process demonstrates strong generalization across diverse multimodal mathematical problems, with particularly remarkable gains in plane geometry tasks. As illustrated in Figure 3, even after excluding plane geometry and function problems, policy models still achieve notable improvements across the datasets. This indicates that although GM-PRM is primarily trained on a dataset composed of plane geometry and function problems, it generalizes effectively to other types of multimodal mathematical problems. Moreover, as shown by the averaged results in Figure 3, the improvements achieved by GM-PRM with Refined-BoN on plane geometry problems consistently exceed those on the overall dataset, function problems, and other categories, underscoring the exceptional effectiveness of our method in tackling plane geometry tasks.
<details>
<summary>figures/Question_types.png Details</summary>
### Visual Description
## Bar Chart: Improvements of Accuracy (%) by Model
### Overview
The image is a grouped bar chart illustrating the "Improvements of accuracy (%)" for three different AI models: MiniCPM-V2.6-8B, InternVL3-8B, and InternVL3-78B. The chart breaks down these improvements into four distinct categories: Overall, Plane Geometry, Functions, and Others.
### Components/Axes
* **Y-Axis:** Labeled "Improvements of accuracy (%)". The scale ranges from 0 to 10, with horizontal grid lines marking increments of 2.
* **X-Axis:** Categorical, displaying the three models being compared:
* MiniCPM-V2.6-8B
* InternVL3-8B
* InternVL3-78B
* **Legend:** Positioned at the top of the chart, identifying the data series by color:
* **Red/Orange:** Overall
* **Blue:** Plane Geometry
* **Green:** Functions
* **Yellow/Gold:** Others
### Detailed Analysis
The following values are approximate based on visual estimation against the Y-axis grid lines:
| Model | Overall (Red) | Plane Geometry (Blue) | Functions (Green) | Others (Yellow) |
| :--- | :--- | :--- | :--- | :--- |
| **MiniCPM-V2.6-8B** | ~5.9% | ~9.2% | ~5.4% | ~1.3% |
| **InternVL3-8B** | ~5.6% | ~6.4% | ~0.5% | ~3.3% |
| **InternVL3-78B** | ~3.6% | ~5.9% | ~5.6% | ~1.0% |
### Key Observations
* **Plane Geometry Strength:** "Plane Geometry" consistently shows the highest or near-highest improvement across all three models, suggesting these models are particularly effective at geometric reasoning tasks.
* **Functions Anomaly:** There is a significant performance disparity in the "Functions" category. While MiniCPM-V2.6-8B and InternVL3-78B show strong improvements (~5.4% and ~5.6% respectively), InternVL3-8B shows a negligible improvement of ~0.5%.
* **Model Scaling:** The largest model, InternVL3-78B, does not demonstrate the highest "Overall" improvement. In fact, it shows the lowest "Overall" improvement (~3.6%) compared to the two 8B models (~5.6%–5.9%).
* **"Others" Category:** This category consistently yields low improvement scores across all models, generally remaining below 3.5%.
### Interpretation
The data suggests that model size (parameter count) is not the primary driver for accuracy improvements in these specific domains. The 8B models are outperforming the 78B model in the "Overall" metric, which implies that the smaller models may be more specialized or better optimized for the specific test set used.
The most notable anomaly is the "Functions" category for the InternVL3-8B model. The near-zero improvement suggests a potential regression, a lack of training data in that specific domain, or a failure in the model's ability to generalize for functional reasoning tasks compared to its peers. Conversely, the high performance of all models in "Plane Geometry" indicates that this is a shared strength across the tested architectures.
</details>
Figure 3: Improvements of the average percentage accuracy (%) of multiple MLLMs across different question types in MathVista, MathVision and MathVerse datasets.
The Refined-BoN process yields disproportionately larger gains for models with lower baseline performance. As shown in Table 1, InternVL3-38B starts with the highest initial average accuracy among all policy models (49.5%) and achieves a modest improvement of +2.9 points (+5.9%). In contrast, Qwen2.5-VL-7B, which has the highest baseline accuracy (43.3%) among models with fewer than 12 billion parameters, improves by +4.5 points (+10.4%), surpassing the relative gains of InternVL3-38B. Notably, MiniCPM-V-2.6-8B demonstrates the most significant relative improvement, achieving +5.9 points (+21.0%), despite its lower initial score. These results suggest that models with weaker baseline performance benefit more from the refinement mechanism of GM-PRM with Refined-BoN, likely because the process effectively corrects errors in reasoning steps, leaving greater room for improvement.
<details>
<summary>figures/MiniCPM-BoN.png Details</summary>
### Visual Description
## Line Chart: Accuracy vs. # Solutions per Problem
### Overview
The image is a line chart illustrating the performance comparison between two methods, "GM-PRM" and "Self-Consistency," across varying numbers of solutions generated per problem. The chart demonstrates how accuracy scales as the number of solutions increases from 1 to 8.
### Components/Axes
* **Y-Axis:** Labeled "Accuracy (%)". The scale ranges from 38 to 53, with horizontal grid lines at intervals of 5 units (38, 43, 48, 53).
* **X-Axis:** Labeled "# Solutions per Problem". The axis displays discrete data points at 1, 4, 6, and 8.
* **Legend:** Located in the bottom-right quadrant of the chart area.
* **Blue line with circular markers:** Labeled "GM-PRM".
* **Orange line with circular markers:** Labeled "Self-Consistency".
### Detailed Analysis
**Trend Verification:**
Both data series exhibit a positive correlation, where accuracy increases as the number of solutions per problem increases. The "GM-PRM" series (blue) demonstrates a steeper, more consistent upward slope compared to the "Self-Consistency" series (orange), which begins to flatten as the number of solutions increases.
**Data Extraction (Approximate Values):**
| # Solutions per Problem | GM-PRM (Blue) | Self-Consistency (Orange) |
| :--- | :--- | :--- |
| **1** | ~38.5% | ~38.5% |
| **4** | ~45.8% | ~43.5% |
| **6** | ~47.5% | ~45.5% |
| **8** | ~51.2% | ~46.0% |
* **At 1 Solution:** Both methods start at the same baseline accuracy of approximately 38.5%.
* **At 4 Solutions:** GM-PRM rises to ~45.8%, while Self-Consistency rises to ~43.5%.
* **At 6 Solutions:** GM-PRM reaches ~47.5%, while Self-Consistency reaches ~45.5%.
* **At 8 Solutions:** GM-PRM continues to climb to ~51.2%, whereas Self-Consistency shows a significant plateau, reaching only ~46.0%.
### Key Observations
* **Divergence:** While both methods perform identically at the baseline (1 solution), they diverge significantly as the number of solutions increases.
* **Performance Gap:** The gap between the two methods widens as the number of solutions increases. At 4 solutions, the gap is ~2.3%. By 8 solutions, the gap expands to ~5.2%.
* **Diminishing Returns:** The Self-Consistency method exhibits clear signs of diminishing returns, with the slope of the line becoming nearly horizontal between 6 and 8 solutions. In contrast, the GM-PRM method maintains a more robust upward trajectory.
### Interpretation
The data demonstrates that GM-PRM is significantly more effective than Self-Consistency at leveraging additional generated solutions to improve overall accuracy.
The "Self-Consistency" method appears to hit a performance ceiling relatively early, suggesting that simply generating more solutions does not yield proportional gains in accuracy for this method. Conversely, the "GM-PRM" method continues to extract value from the additional solutions, indicating it is a more scalable approach for tasks requiring high accuracy. This suggests that GM-PRM likely employs a more sophisticated mechanism for evaluating or selecting the correct solution from a larger candidate pool than the standard Self-Consistency approach.
</details>
(a) MiniCPM-V-2.6-8B
<details>
<summary>figures/QwenVL-BoN.png Details</summary>
### Visual Description
## Line Chart: Accuracy vs. Number of Solutions per Problem
### Overview
This image is a line chart comparing the performance of two distinct methods, "GM-PRM" and "Self-Consistency," across varying numbers of solutions per problem. The chart demonstrates that increasing the number of solutions per problem leads to higher accuracy for both methods, with the GM-PRM method consistently outperforming the Self-Consistency method as the number of solutions increases.
### Components/Axes
* **Y-Axis:** Labeled "Accuracy (%)". The scale ranges from 60 to 70, with horizontal grid lines marked at intervals of 2 (60, 62, 64, 66, 68, 70).
* **X-Axis:** Labeled "# Solutions per Problem". The axis displays discrete data points at 1, 4, 6, and 8.
* **Legend:** Located in the bottom-right quadrant of the chart area.
* **GM-PRM:** Represented by a blue line with blue circular markers.
* **Self-Consistency:** Represented by an orange line with orange circular markers.
### Detailed Analysis
**Trend Verification:** Both data series exhibit a positive, upward-sloping trend as the number of solutions per problem increases from 1 to 8. The rate of increase is steepest between 1 and 4 solutions for both methods.
**Data Extraction (Approximate Values):**
| # Solutions per Problem | GM-PRM (Blue) | Self-Consistency (Orange) |
| :--- | :--- | :--- |
| **1** | ~60.5% | ~60.5% |
| **4** | ~66.1% | ~64.3% |
| **6** | ~67.8% | ~65.6% |
| **8** | ~69.0% | ~66.5% |
*Note: Values are estimated based on the visual position of the markers relative to the grid lines.*
### Key Observations
* **Convergence at Baseline:** At the lowest setting (1 solution per problem), both methods yield identical accuracy results (~60.5%).
* **Performance Gap:** As the number of solutions increases beyond 1, the two methods diverge. GM-PRM consistently maintains a higher accuracy than Self-Consistency.
* **Widening Margin:** The performance gap between the two methods increases as the number of solutions increases. At 4 solutions, the gap is approximately 1.8 percentage points; by 8 solutions, the gap widens to approximately 2.5 percentage points.
* **Diminishing Returns:** Both curves show a slight flattening trend between 6 and 8 solutions, suggesting that adding more solutions provides diminishing marginal gains in accuracy.
### Interpretation
The data suggests that while both methods benefit from generating multiple solutions per problem, the GM-PRM method is more effective at leveraging those additional solutions to improve accuracy.
The convergence at 1 solution indicates that the underlying base model or initial reasoning capability is identical for both methods; the performance difference is entirely attributable to the post-processing or selection mechanism (GM-PRM vs. Self-Consistency) applied when multiple solutions are available. The widening gap indicates that GM-PRM is more robust or efficient at filtering or aggregating these multiple solutions than the standard Self-Consistency approach.
</details>
(b) Qwen2.5-VL-7B
<details>
<summary>figures/InternVL3-78B-BoN.png Details</summary>
### Visual Description
## Line Chart: Accuracy vs. # Solutions per Problem
### Overview
This image is a line chart comparing the performance of two methods, "GM-PRM" and "Self-Consistency," across varying numbers of solutions per problem. The chart demonstrates how accuracy changes as the number of solutions increases from 1 to 8.
### Components/Axes
* **X-Axis:** Labeled "# Solutions per Problem". The scale is non-linear, with discrete data points at 1, 4, 6, and 8.
* **Y-Axis:** Labeled "Accuracy (%)". The scale ranges from 65 to 73, with major grid lines at intervals of 2 (65, 67, 69, 71, 73).
* **Legend:** Located in the bottom-right quadrant of the chart area.
* **Blue Line (with circular markers):** Represents "GM-PRM".
* **Orange Line (with circular markers):** Represents "Self-Consistency".
### Detailed Analysis
The chart plots two data series. Below are the approximate values for each data point, estimated based on the grid lines.
**Trend Verification:**
* **GM-PRM (Blue Line):** The line slopes upward sharply between 1 and 4 solutions, then continues to slope upward at a more gradual rate between 4, 6, and 8 solutions.
* **Self-Consistency (Orange Line):** The line slopes upward between 1 and 4 solutions, shows a very slight increase between 4 and 6, and appears to plateau (remain flat) between 6 and 8 solutions.
**Data Points (Approximate Values):**
| # Solutions | GM-PRM (Blue) | Self-Consistency (Orange) |
| :--- | :--- | :--- |
| **1** | ~65.7% | ~65.7% |
| **4** | ~70.9% | ~67.7% |
| **6** | ~71.4% | ~68.1% |
| **8** | ~72.2% | ~68.1% |
*Note: Values are visual estimates based on the provided grid. There is an uncertainty of approximately ±0.2% due to the resolution of the chart.*
### Key Observations
* **Starting Point:** Both methods begin at the same accuracy level (~65.7%) when only 1 solution per problem is provided.
* **Divergence:** The two methods diverge significantly after the first data point. GM-PRM achieves a higher accuracy than Self-Consistency at every point beyond 1 solution.
* **Performance Ceiling:** The Self-Consistency method exhibits diminishing returns, with the accuracy curve flattening out completely between 6 and 8 solutions.
* **Scalability:** GM-PRM continues to show a positive trend in accuracy as the number of solutions increases to 8, suggesting it scales better with more computational effort than Self-Consistency.
### Interpretation
The data suggests that **GM-PRM is a more effective method** than Self-Consistency for tasks where multiple solutions per problem can be generated.
While both methods perform identically at the baseline (1 solution), GM-PRM leverages additional solutions more efficiently. The "Self-Consistency" method appears to hit a performance ceiling around 6 solutions, where adding more solutions yields negligible accuracy gains. In contrast, the GM-PRM method maintains a positive trajectory, indicating that it is better at filtering or aggregating information from a larger pool of solutions to improve final accuracy. This implies that if computational resources allow for generating 8 solutions, GM-PRM provides a distinct performance advantage over Self-Consistency.
</details>
(c) InternVL3-78B
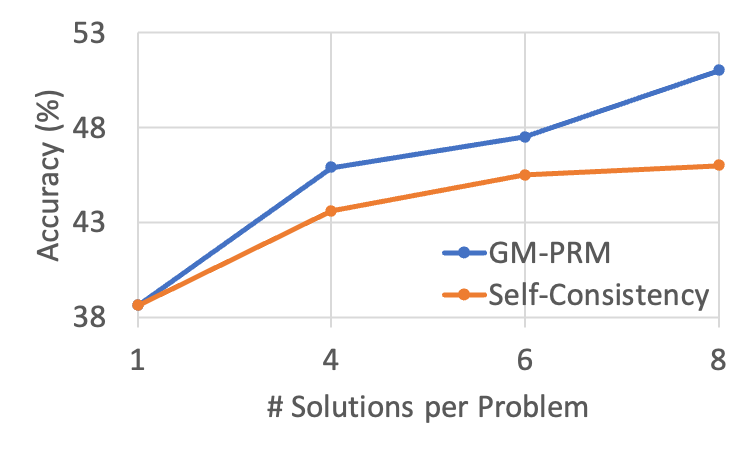
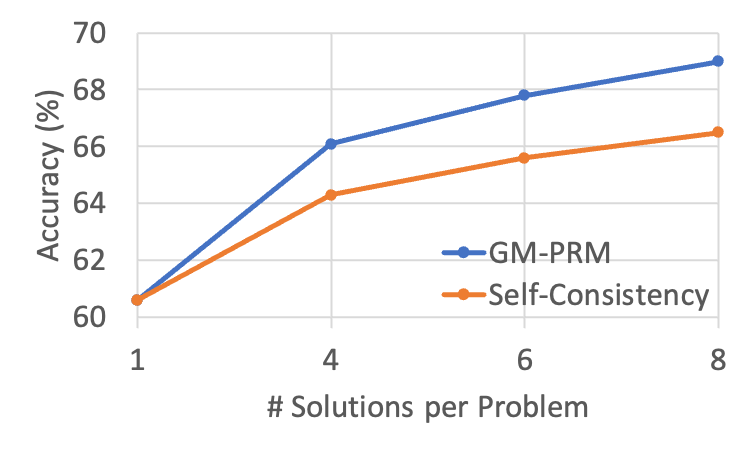
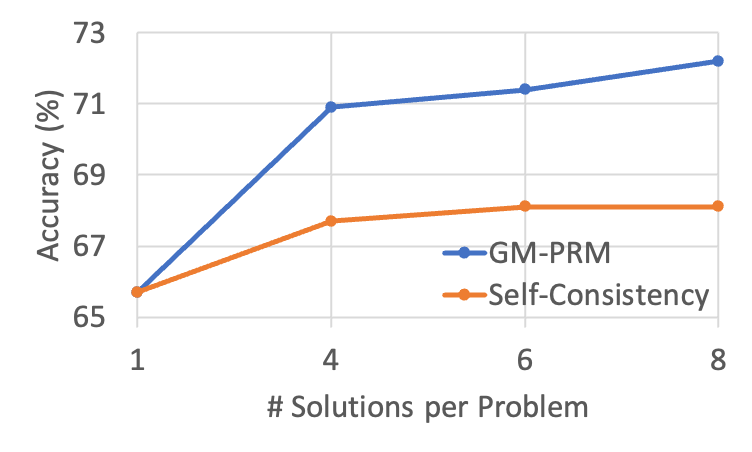
Figure 4: The results of changing the value of N in the Refined-BoN process on the WeMath across different policies. As N increases, the effectiveness of GM-PRM in enhancing accuracy improves and surpasses that of Self-Consistency.
### 4.3 Hyperparameter & Ablation Study
#### Number of solution samples N in Refined BoN.
Following Test-time Scaling technique, we vary the number of N in the Refined-BoN process to evaluate the performance of GM-PRM in comparison to the Self-Consistency baseline.
Figure 4 depicts WeMath accuracy as the number of sampled solutions per problem ( $N$ ) increases from 1 to 8. Across all three backbones—MiniCPM‑V‑2.6‑8B, Qwen2.5‑VL‑7B, and InternVL3‑78B—both GM-PRM and the Self‑Consistency (SC) baseline benefit from a larger sampling budget, yet GM-PRM exhibits a noticeably steeper growth curve.
Under the widely adopted Best‑of‑8 setting, GM-PRM delivers gains of 4.9 and 3.5 over SC on MiniCPM‑V‑2.6‑8B and Qwen2.5‑VL‑7B, respectively. Even for the 78B‑parameter InternVL3, GM-PRM maintains a substantial 4.1 margin. These results indicate that the proposed refinement strategy not only scales to larger models but also converts additional candidate solutions into accuracy more effectively than Self‑Consistency, thereby underscoring the robustness and versatility of GM-PRM.
Furthermore, for MiniCPM-V-2.6-8B, GM-PRM surpasses the self-consistency baseline by 2.1, 2.2, and 4.9 points under the Best-of-4, Best-of-6, and Best-of-8 settings, respectively, indicating a steadily increasing performance gap between GM-PRM and self-consistency as N increases.
#### Methods for aggregating step scores.
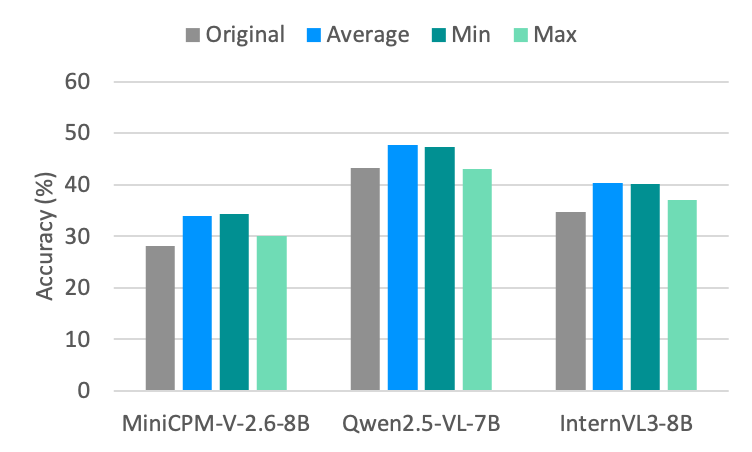
For PRMs, the method used to aggregate step scores into an overall solution score plays a critical role. In this part, we compare several different aggregation strategies, including averaging step scores, selecting the maximum step score, and selecting the minimum step score. Since step-by-step solutions that contain steps judged incorrect are often not evaluated or scored for all steps, this experiment focuses exclusively on solutions where all steps are judged correct.
<details>
<summary>figures/Aggregation.png Details</summary>
### Visual Description
## Grouped Bar Chart: Model Accuracy Comparison
### Overview
This image displays a grouped bar chart comparing the accuracy percentages of three specific AI models: **MiniCPM-V-2.6-8B**, **Qwen2.5-VL-7B**, and **InternVL3-8B**. The chart evaluates each model across four distinct metrics: "Original," "Average," "Min," and "Max."
### Components/Axes
* **Y-Axis (Vertical):** Labeled "Accuracy (%)". The scale ranges from 0 to 60, with grid lines at 10-unit intervals (0, 10, 20, 30, 40, 50, 60).
* **X-Axis (Horizontal):** Categorical axis listing the three models:
* MiniCPM-V-2.6-8B
* Qwen2.5-VL-7B
* InternVL3-8B
* **Legend:** Positioned at the top center of the chart.
* **Grey:** Original
* **Blue:** Average
* **Dark Teal:** Min
* **Light Teal:** Max
### Detailed Analysis
The chart groups four bars for each model, corresponding to the legend. Below are the approximate values for each model based on visual estimation against the Y-axis grid lines:
**1. MiniCPM-V-2.6-8B (Left Group)**
* **Original (Grey):** ~28%
* **Average (Blue):** ~34%
* **Min (Dark Teal):** ~34.5%
* **Max (Light Teal):** ~30%
**2. Qwen2.5-VL-7B (Center Group)**
* **Original (Grey):** ~43%
* **Average (Blue):** ~48%
* **Min (Dark Teal):** ~47.5%
* **Max (Light Teal):** ~43%
**3. InternVL3-8B (Right Group)**
* **Original (Grey):** ~35%
* **Average (Blue):** ~40%
* **Min (Dark Teal):** ~40%
* **Max (Light Teal):** ~37%
### Key Observations
* **Performance Leader:** The **Qwen2.5-VL-7B** model consistently demonstrates the highest accuracy across all four metrics compared to the other two models.
* **Counter-Intuitive Labeling:** In all three model groups, the bar labeled **"Min" (Dark Teal)** is visually higher than the bar labeled **"Max" (Light Teal)**. This contradicts standard statistical definitions where a maximum value should be greater than or equal to a minimum value.
* **Metric Hierarchy:** For all models, the "Original" metric is consistently the lowest value. The "Average" metric is consistently the highest or tied for the highest value.
### Interpretation
* **Data Anomaly:** The inversion of the "Min" and "Max" labels suggests either a labeling error in the chart's legend or that the terms "Min" and "Max" refer to specific, non-standard subsets of data (e.g., perhaps "Min" refers to a specific prompt category that performed unexpectedly well, or the labels were swapped during chart generation).
* **Model Efficacy:** The data demonstrates that the "Average" metric provides the most optimistic view of model performance, while the "Original" metric represents the baseline performance, which is consistently lower.
* **Comparative Standing:** Qwen2.5-VL-7B is the clear superior model in this dataset, maintaining a significant lead (approximately 5-15 percentage points) over MiniCPM-V-2.6-8B and InternVL3-8B across all metrics.
</details>
Figure 5: Average percentage accuracy (%) of MLLMs via different aggregation methods across five datasets.
The results are illustrated in the Figure 5. Across all policy models and datasets, we find that both averaging the step scores and selecting the minimum score significantly outperform the strategy of selecting the maximum score. This suggests that either the average or the minimum score provides a more accurate reflection of the overall quality of a solution than the maximum score. Between the minimum and average aggregation methods, we observe that averaging performs slightly better. This improvement may stem from the fact that the average score takes into account all problem-solving steps, providing a more comprehensive evaluation, whereas the minimum score reflects only the step with the lowest score and thus offers a less holistic assessment.
#### Refined-BoN vs. BoN.
The Refined-BoN process aims to enhance the diversity of N candidate solutions by refining the steps judged incorrect and integrating the refined steps with the steps judged correct into the prompt for the policy models. In this part, we use the Pass@k metric to evaluate the diversity and accuracy of policy models in generating multiple solutions to the given problems.
The results are summarized in the Table 2. Overall, the Refined-BoN process improves Pass@8 scores compared to the standard BoN process across multiple policy models and five benchmark datasets. Specifically, it increases the average Pass@8 values of MiniCPM-V-2.6-8B, Llama-3.2-11B-Vision, and InternVL3-8B by 0.9, 1.3, and 0.9 points, respectively, across the five datasets, demonstrating the effectiveness of the Refined-BoN approach in enhancing the diversity and correctness of the generated solutions.
| MiniCPM-V-2.6-8B Llama-3.2-11B-Vision InternVL3-8B | 62.5 62.7 65.3 | 63.4 64.0 66.2 | +0.9 +1.3 +0.9 |
| --- | --- | --- | --- |
Table 2: Average percentage Pass@8 scores of BoN and Refined-BoN across five datasets for different models.
## 5 Conclusion
In this work, we introduced GM-PRM, a novel paradigm that transforms the reward model from a passive judge into an active reasoning collaborator for multimodal mathematics. By providing fine-grained, interpretable analysis and, more critically, generating corrections for erroneous steps, GM-PRM moves beyond simple binary verification. This unique corrective capability powers our Refined Best-of-N (Refined-BoN) framework, which actively improves flawed reasoning trajectories at test time. Our experiments demonstrate that this approach achieves state-of-the-art results on multiple benchmarks, significantly boosting policy model performance with remarkable data efficiency. The consistent gains across diverse models and problem types underscore the robustness and generalizability of our method. This shift from passive error detection to generative, collaborative correction represents a crucial advance in multimodal reasoning.
*
## References
- Ahn et al. (2024) Ahn, J.; Verma, R.; Lou, R.; Liu, D.; Zhang, R.; and Yin, W. 2024. Large language models for mathematical reasoning: Progresses and challenges. arXiv preprint arXiv:2402.00157.
- Bai et al. (2023) Bai, J.; Bai, S.; Chu, Y.; Cui, Z.; Dang, K.; Deng, X.; Fan, Y.; Ge, W.; Han, Y.; Huang, F.; Hui, B.; Ji, L.; Li, M.; Lin, J.; Lin, R.; Liu, D.; Liu, G.; Lu, C.; Lu, K.; Ma, J.; Men, R.; Ren, X.; Ren, X.; et al. 2023. Qwen Technical Report. arXiv:2309.16609.
- Bai et al. (2025) Bai, S.; Chen, K.; Liu, X.; Wang, J.; Ge, W.; Song, S.; Dang, K.; Wang, P.; Wang, S.; Tang, J.; Zhong, H.; Zhu, Y.; Yang, M.; Li, Z.; Wan, J.; Wang, P.; Ding, W.; Fu, Z.; Xu, Y.; Ye, J.; Zhang, X.; Xie, T.; et al. 2025. Qwen2.5-VL Technical Report. arXiv:2502.13923.
- Caffagni et al. (2024) Caffagni, D.; Cocchi, F.; Barsellotti, L.; Moratelli, N.; Sarto, S.; Baraldi, L.; Cornia, M.; and Cucchiara, R. 2024. The revolution of multimodal large language models: a survey. arXiv preprint arXiv:2402.12451.
- Cao et al. (2025) Cao, Q.; Wang, R.; Zhang, R.; Somayajula, S. A.; and Xie, P. 2025. DreamPRM: Domain-Reweighted Process Reward Model for Multimodal Reasoning. arXiv preprint arXiv:2505.20241.
- Chen et al. (2024) Chen, Z.; Wu, J.; Wang, W.; Su, W.; Chen, G.; Xing, S.; Zhong, M.; Zhang, Q.; Zhu, X.; Lu, L.; Li, B.; Luo, P.; Lu, T.; Qiao, Y.; and Dai, J. 2024. InternVL: Scaling up Vision Foundation Models and Aligning for Generic Visual-Linguistic Tasks. arXiv:2312.14238.
- Du et al. (2025) Du, L.; Meng, F.; Liu, Z.; Zhou, Z.; Luo, P.; Zhang, Q.; and Shao, W. 2025. MM-PRM: Enhancing Multimodal Mathematical Reasoning with Scalable Step-Level Supervision. arXiv preprint arXiv:2505.13427.
- Gao et al. (2024) Gao, J.; Xu, S.; Ye, W.; Liu, W.; He, C.; Fu, W.; Mei, Z.; Wang, G.; and Wu, Y. 2024. On designing effective rl reward at training time for llm reasoning. arXiv preprint arXiv:2410.15115.
- Grattafiori et al. (2024) Grattafiori, A.; Dubey, A.; Jauhri, A.; Pandey, A.; Kadian, A.; Al-Dahle, A.; Letman, A.; Mathur, A.; Schelten, A.; Vaughan, A.; Yang, A.; Fan, A.; Goyal, A.; Hartshorn, A.; Yang, A.; Mitra, A.; Sravankumar, A.; Korenev, A.; et al. 2024. The Llama 3 Herd of Models. arXiv:2407.21783.
- Hu et al. (2025) Hu, P.; Zhang, Z.; Chang, Q.; Liu, S.; Ma, J.; Du, J.; Zhang, J.; Liu, Q.; Gao, J.; Ma, F.; et al. 2025. PRM-BAS: Enhancing Multimodal Reasoning through PRM-guided Beam Annealing Search. arXiv preprint arXiv:2504.10222.
- Huo et al. (2024) Huo, J.; Yan, Y.; Hu, B.; Yue, Y.; and Hu, X. 2024. Mmneuron: Discovering neuron-level domain-specific interpretation in multimodal large language model. arXiv preprint arXiv:2406.11193.
- Khalifa et al. (2025) Khalifa, M.; Agarwal, R.; Logeswaran, L.; Kim, J.; Peng, H.; Lee, M.; Lee, H.; and Wang, L. 2025. Process Reward Models That Think. arXiv:2504.16828.
- Lambert et al. (2024) Lambert, N.; Pyatkin, V.; Morrison, J.; Miranda, L.; Lin, B. Y.; Chandu, K.; Dziri, N.; Kumar, S.; Zick, T.; Choi, Y.; et al. 2024. Rewardbench: Evaluating reward models for language modeling. arXiv preprint arXiv:2403.13787.
- Li et al. (2024) Li, Q.; Chen, Z.; Wang, W.; Wang, W.; Ye, S.; Jin, Z.; Chen, G.; He, Y.; Gao, Z.; Cui, E.; Yu, J.; Tian, H.; Zhou, J.; Xu, C.; Wang, B.; Wei, X.; Li, W.; Zhang, W.; Zhang, B.; Cai, P.; Wen, L.; et al. 2024. OmniCorpus: A Unified Multimodal Corpus of 10 Billion-Level Images Interleaved with Text. arXiv:2406.08418.
- Li and Li (2024) Li, W.; and Li, Y. 2024. Process reward model with q-value rankings. arXiv preprint arXiv:2410.11287.
- Li et al. (2025a) Li, X.; Yu, H.; Zhang, X.; Huang, Z.; He, S.; Liu, K.; Zhao, J.; Huang, F.; and Li, Y. 2025a. Socratic-PRMBench: Benchmarking Process Reward Models with Systematic Reasoning Patterns. arXiv preprint arXiv:2505.23474.
- Li et al. (2025b) Li, Z.; Wen, X.; Lou, J.; Ji, Y.; Lu, Y.; Han, X.; Zhang, D.; and Sun, L. 2025b. The devil is in the details: Tackling unimodal spurious correlations for generalizable multimodal reward models. arXiv preprint arXiv:2503.03122.
- Lightman et al. (2023) Lightman, H.; Kosaraju, V.; Burda, Y.; Edwards, H.; Baker, B.; Lee, T.; Leike, J.; Schulman, J.; Sutskever, I.; and Cobbe, K. 2023. Let’s verify step by step. In The Twelfth International Conference on Learning Representations.
- Liu et al. (2024a) Liu, W.; Li, J.; Zhang, X.; Zhou, F.; Cheng, Y.; and He, J. 2024a. Diving into Self-Evolving Training for Multimodal Reasoning. arXiv:2412.17451.
- Liu et al. (2024b) Liu, Y.; Cao, Y.; Gao, Z.; Wang, W.; Chen, Z.; Wang, W.; Tian, H.; Lu, L.; Zhu, X.; Lu, T.; Qiao, Y.; and Dai, J. 2024b. MMInstruct: a high-quality multi-modal instruction tuning dataset with extensive diversity. Science China Information Sciences, 67(12).
- Liu et al. (2023) Liu, Z.; He, Y.; Wang, W.; Wang, W.; Wang, Y.; Chen, S.; Zhang, Q.; Lai, Z.; Yang, Y.; Li, Q.; Yu, J.; Li, K.; Chen, Z.; Yang, X.; Zhu, X.; Wang, Y.; Wang, L.; Luo, P.; Dai, J.; and Qiao, Y. 2023. InternGPT: Solving Vision-Centric Tasks by Interacting with ChatGPT Beyond Language. arXiv:2305.05662.
- Lu et al. (2023) Lu, P.; Bansal, H.; Xia, T.; Liu, J.; Li, C.; Hajishirzi, H.; Cheng, H.; Chang, K.-W.; Galley, M.; and Gao, J. 2023. Mathvista: Evaluating mathematical reasoning of foundation models in visual contexts. arXiv preprint arXiv:2310.02255.
- Luo et al. (2024) Luo, L.; Liu, Y.; Liu, R.; Phatale, S.; Guo, M.; Lara, H.; Li, Y.; Shu, L.; Zhu, Y.; Meng, L.; Sun, J.; and Rastogi, A. 2024. Improve Mathematical Reasoning in Language Models by Automated Process Supervision. arXiv:2406.06592.
- Luo et al. (2025) Luo, R.; Zheng, Z.; Wang, Y.; Ni, X.; Lin, Z.; Jiang, S.; Yu, Y.; Shi, C.; Chu, R.; Zeng, J.; and Yang, Y. 2025. URSA: Understanding and Verifying Chain-of-thought Reasoning in Multimodal Mathematics. arXiv:2501.04686.
- Miao et al. (2025) Miao, B.; Wu, Y.; Gao, M.; Yu, Q.; Bu, W.; Zhang, W.; Li, Y.; Tang, S.; Chua, T.-S.; and Li, J. 2025. Boosting Virtual Agent Learning and Reasoning: A Step-Wise, Multi-Dimensional, and Generalist Reward Model with Benchmark. arXiv preprint arXiv:2503.18665.
- Qiao et al. (2024) Qiao, R.; Tan, Q.; Dong, G.; Wu, M.; Sun, C.; Song, X.; GongQue, Z.; Lei, S.; Wei, Z.; Zhang, M.; et al. 2024. We-math: Does your large multimodal model achieve human-like mathematical reasoning? arXiv preprint arXiv:2407.01284.
- Setlur et al. (2024) Setlur, A.; Nagpal, C.; Fisch, A.; Geng, X.; Eisenstein, J.; Agarwal, R.; Agarwal, A.; Berant, J.; and Kumar, A. 2024. Rewarding progress: Scaling automated process verifiers for llm reasoning. arXiv preprint arXiv:2410.08146.
- She et al. (2025) She, S.; Liu, J.; Liu, Y.; Chen, J.; Huang, X.; and Huang, S. 2025. R-PRM: Reasoning-Driven Process Reward Modeling. arXiv:2503.21295.
- Shi et al. (2024) Shi, W.; Hu, Z.; Bin, Y.; Liu, J.; Yang, Y.; Ng, S.-K.; Bing, L.; and Lee, R. K.-W. 2024. Math-llava: Bootstrapping mathematical reasoning for multimodal large language models. arXiv preprint arXiv:2406.17294.
- Song et al. (2025) Song, M.; Su, Z.; Qu, X.; Zhou, J.; and Cheng, Y. 2025. PRMBench: A fine-grained and challenging benchmark for process-level reward models. arXiv preprint arXiv:2501.03124.
- Tian et al. (2024) Tian, C.; Zhu, X.; Xiong, Y.; Wang, W.; Chen, Z.; Wang, W.; Chen, Y.; Lu, L.; Lu, T.; Zhou, J.; Li, H.; Qiao, Y.; and Dai, J. 2024. MM-Interleaved: Interleaved Image-Text Generative Modeling via Multi-modal Feature Synchronizer. arXiv:2401.10208.
- Touvron et al. (2023a) Touvron, H.; Lavril, T.; Izacard, G.; Martinet, X.; Lachaux, M.-A.; Lacroix, T.; Rozière, B.; Goyal, N.; Hambro, E.; Azhar, F.; Rodriguez, A.; Joulin, A.; Grave, E.; and Lample, G. 2023a. LLaMA: Open and Efficient Foundation Language Models. arXiv:2302.13971.
- Touvron et al. (2023b) Touvron, H.; Martin, L.; Stone, K.; Albert, P.; Almahairi, A.; Babaei, Y.; Bashlykov, N.; Batra, S.; Bhargava, P.; Bhosale, S.; Bikel, D.; Blecher, L.; Ferrer, C. C.; Chen, M.; Cucurull, G.; Esiobu, D.; Fernandes, J.; Fu, J.; et al. 2023b. Llama 2: Open Foundation and Fine-Tuned Chat Models. arXiv:2307.09288.
- Wang et al. (2024) Wang, K.; Pan, J.; Shi, W.; Lu, Z.; Ren, H.; Zhou, A.; Zhan, M.; and Li, H. 2024. Measuring multimodal mathematical reasoning with math-vision dataset. Advances in Neural Information Processing Systems, 37: 95095–95169.
- Wang et al. (2023) Wang, P.; Li, L.; Shao, Z.; Xu, R.; Dai, D.; Li, Y.; Chen, D.; Wu, Y.; and Sui, Z. 2023. Math-shepherd: Verify and reinforce llms step-by-step without human annotations. CoRR, abs/2312.08935.
- Wang et al. (2025a) Wang, S.; Liu, Z.; Wei, J.; Yin, X.; Li, D.; and Barsoum, E. 2025a. Athena: Enhancing Multimodal Reasoning with Data-efficient Process Reward Models. arXiv:2506.09532.
- Wang et al. (2025b) Wang, W.; Gao, Z.; Chen, L.; Chen, Z.; Zhu, J.; Zhao, X.; Liu, Y.; Cao, Y.; Ye, S.; Zhu, X.; et al. 2025b. Visualprm: An effective process reward model for multimodal reasoning. arXiv preprint arXiv:2503.10291.
- Yan and Lee (2024) Yan, Y.; and Lee, J. 2024. Georeasoner: Reasoning on geospatially grounded context for natural language understanding. In Proceedings of the 33rd ACM international conference on information and knowledge management, 4163–4167.
- Yan et al. (2024a) Yan, Y.; Su, J.; He, J.; Fu, F.; Zheng, X.; Lyu, Y.; Wang, K.; Wang, S.; Wen, Q.; and Hu, X. 2024a. A survey of mathematical reasoning in the era of multimodal large language model: Benchmark, method & challenges. arXiv preprint arXiv:2412.11936.
- Yan et al. (2024b) Yan, Y.; Wang, S.; Huo, J.; Li, H.; Li, B.; Su, J.; Gao, X.; Zhang, Y.-F.; Xu, T.; Chu, Z.; et al. 2024b. Errorradar: Benchmarking complex mathematical reasoning of multimodal large language models via error detection. arXiv preprint arXiv:2410.04509.
- Yan et al. (2025a) Yan, Y.; Wang, S.; Huo, J.; Ye, J.; Chu, Z.; Hu, X.; Yu, P. S.; Gomes, C.; Selman, B.; and Wen, Q. 2025a. Position: Multimodal large language models can significantly advance scientific reasoning. arXiv preprint arXiv:2502.02871.
- Yan et al. (2025b) Yan, Y.; Wang, S.; Huo, J.; Yu, P. S.; Hu, X.; and Wen, Q. 2025b. Mathagent: Leveraging a mixture-of-math-agent framework for real-world multimodal mathematical error detection. arXiv preprint arXiv:2503.18132.
- Yan et al. (2024c) Yan, Y.; Wen, H.; Zhong, S.; Chen, W.; Chen, H.; Wen, Q.; Zimmermann, R.; and Liang, Y. 2024c. Urbanclip: Learning text-enhanced urban region profiling with contrastive language-image pretraining from the web. In Proceedings of the ACM Web Conference 2024, 4006–4017.
- Yao et al. (2024) Yao, Y.; Yu, T.; Zhang, A.; Wang, C.; Cui, J.; Zhu, H.; Cai, T.; Li, H.; Zhao, W.; He, Z.; Chen, Q.; Zhou, H.; Zou, Z.; Zhang, H.; Hu, S.; Zheng, Z.; Zhou, J.; Cai, J.; Han, X.; Zeng, G.; Li, D.; Liu, Z.; and Sun, M. 2024. MiniCPM-V: A GPT-4V Level MLLM on Your Phone. arXiv:2408.01800.
- Yuan et al. (2024) Yuan, L.; Li, W.; Chen, H.; Cui, G.; Ding, N.; Zhang, K.; Zhou, B.; Liu, Z.; and Peng, H. 2024. Free process rewards without process labels. arXiv preprint arXiv:2412.01981.
- Zeng et al. (2025) Zeng, T.; Zhang, S.; Wu, S.; Classen, C.; Chae, D.; Ewer, E.; Lee, M.; Kim, H.; Kang, W.; Kunde, J.; et al. 2025. Versaprm: Multi-domain process reward model via synthetic reasoning data. arXiv preprint arXiv:2502.06737.
- Zhang et al. (2025a) Zhang, K.; Zhang, J.; Li, H.; Zhu, X.; Hua, E.; Lv, X.; Ding, N.; Qi, B.; and Zhou, B. 2025a. Openprm: Building open-domain process-based reward models with preference trees. In The Thirteenth International Conference on Learning Representations.
- Zhang et al. (2024) Zhang, R.; Jiang, D.; Zhang, Y.; Lin, H.; Guo, Z.; Qiu, P.; Zhou, A.; Lu, P.; Chang, K.-W.; Qiao, Y.; et al. 2024. Mathverse: Does your multi-modal llm truly see the diagrams in visual math problems? In European Conference on Computer Vision, 169–186. Springer.
- Zhang et al. (2025b) Zhang, Z.; Zheng, C.; Wu, Y.; Zhang, B.; Lin, R.; Yu, B.; Liu, D.; Zhou, J.; and Lin, J. 2025b. The Lessons of Developing Process Reward Models in Mathematical Reasoning. arXiv:2501.07301.
- Zhao et al. (2025) Zhao, J.; Liu, R.; Zhang, K.; Zhou, Z.; Gao, J.; Li, D.; Lyu, J.; Qian, Z.; Qi, B.; Li, X.; and Zhou, B. 2025. GenPRM: Scaling Test-Time Compute of Process Reward Models via Generative Reasoning. arXiv:2504.00891.
- Zheng et al. (2024a) Zheng, C.; Zhang, Z.; Zhang, B.; Lin, R.; Lu, K.; Yu, B.; Liu, D.; Zhou, J.; and Lin, J. 2024a. Processbench: Identifying process errors in mathematical reasoning. arXiv preprint arXiv:2412.06559.
- Zheng et al. (2024b) Zheng, K.; Chen, J.; Yan, Y.; Zou, X.; and Hu, X. 2024b. Reefknot: A comprehensive benchmark for relation hallucination evaluation, analysis and mitigation in multimodal large language models. arXiv preprint arXiv:2408.09429.
- Zhong et al. (2025) Zhong, J.; Shen, W.; Li, Y.; Gao, S.; Lu, H.; Chen, Y.; Zhang, Y.; Zhou, W.; Gu, J.; and Zou, L. 2025. A comprehensive survey of reward models: Taxonomy, applications, challenges, and future. arXiv preprint arXiv:2504.12328.
- Zhu et al. (2023) Zhu, W.; Hessel, J.; Awadalla, A.; Gadre, S. Y.; Dodge, J.; Fang, A.; Yu, Y.; Schmidt, L.; Wang, W. Y.; and Choi, Y. 2023. Multimodal C4: An Open, Billion-scale Corpus of Images Interleaved with Text. arXiv:2304.06939.
- Zhuang et al. (2025) Zhuang, W.; Huang, X.; Zhang, X.; and Zeng, J. 2025. Math-puma: Progressive upward multimodal alignment to enhance mathematical reasoning. In Proceedings of the AAAI Conference on Artificial Intelligence, volume 39, 26183–26191.
- Zou et al. (2024) Zou, C.; Guo, X.; Yang, R.; Zhang, J.; Hu, B.; and Zhang, H. 2024. Dynamath: A dynamic visual benchmark for evaluating mathematical reasoning robustness of vision language models. arXiv preprint arXiv:2411.00836.
## Appendix A Appendix
### A.1 More Related Work
#### Multimodal Large Language Models (MLLMs)
The advancement of artificial intelligence has advanced the development of Multimodal Large Language Models (MLLMs). MLLMs extend the capabilities of language-centric models by integrating multiple sensory inputs, primarily visual and auditory, with text. Unlike traditional Large Language Models (LLMs) which process solely textual data, MLLMs are designed to perceive and reason across modalities such as vision and language, thereby achieving the fusion and interaction of multimodal information. The development of MLLMs has been driven by extensive efforts, including enhancements across model structure and data curation. In terms of model structure, multiple studies (Bai et al. 2025; Liu et al. 2023; Yao et al. 2024) achieve notable performance through a method that utilizing connectors to align the embeddings of vision from Vision Foundation Models (VFMs) (Chen et al. 2024) with the latent space of LLMs (Bai et al. 2023; Touvron et al. 2023a, b). Alternatively, another line of research (Grattafiori et al. 2024; Tian et al. 2024) enhances pre-trained LLMs by adding supplementary layers to integrate visual features, which reduces the number of visual tokens but incurs additional training costs. Regarding dataset curation, recent research has achieved substantial advancements. Specifically, MultimodalC4 (Zhu et al. 2023) extends C4 corpus containing only text with images and constructs a corpus that supports pre-training for MLLMs. Furthermore, OmniCorpus (Li et al. 2024) delivers a large-scale yet noisy multimodal dataset suitable for pre-training, and MMInstruct (Liu et al. 2024b) presents an open-source collection of high-quality data designed for instruction tuning. The majority of research efforts have been concentrated on the training processes of MLLMs, leaving significant room for exploration in Test-Time Scaling (TTS) technique. In our work, we investigate the potential of enhancing the performance of MLLMs by incorporating Process Reward Model (PRM) into the TTS framework.
### A.2 Benchmark
We provide more details about the Refined-BoN test benchmarks in Table 3:
| DynaMath | Plane Geometry | 770 |
| --- | --- | --- |
| MathVerse | Vision-Only | 788 |
| MathVista | Testmini | 1000 |
| WeMath | Testmini | 1740 |
| MathVision | Full | 3040 |
Table 3: More details about the Refined-BoN test benchmarks.
### A.3 Dataset
To ensure a balanced distribution of process labels, we carefully construct the training dataset. The final dataset used to train GM-PRM contains 19,614 samples in total, comprising 9,061 solutions that contain incorrect steps—as jointly identified by GPT-4o and Monte Carlo (MC) estimation—and 10,553 solutions in which all steps are judged to be correct.
### A.4 Prompt
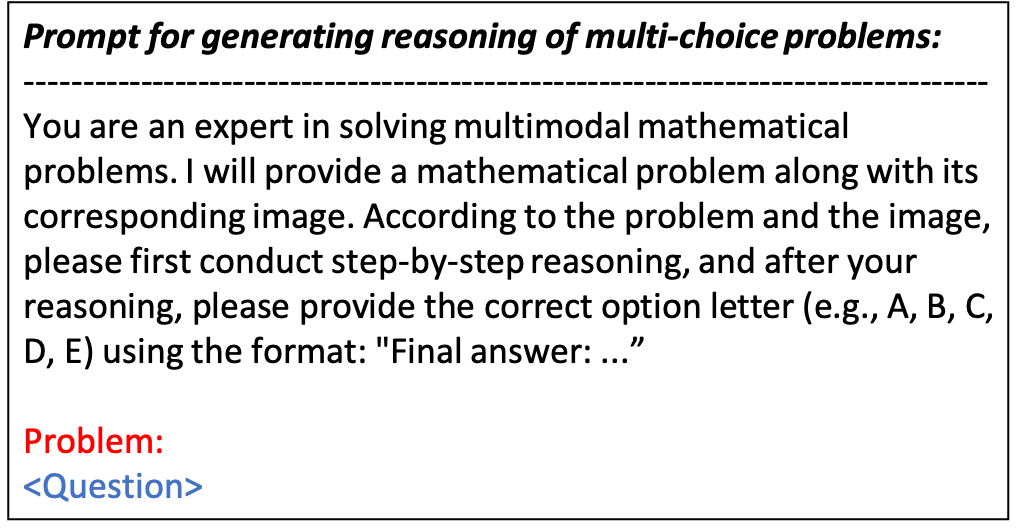
In this section, we introduce the prompts used to construct the training dataset and generate the reasoning processes and final answers. The prompt we guide the policy models to generate reasoning processes and final answers of multi-choice problems is represented in Figure 6.
<details>
<summary>figures/Prompt_multi_choice.png Details</summary>
### Visual Description
## Textual Template: Prompt for Multimodal Mathematical Reasoning
### Overview
The image displays a structured text prompt designed to instruct an AI model on how to process and solve multimodal mathematical problems. It establishes a persona for the AI, defines the input expectations, mandates a specific reasoning process, and dictates the final output format.
### Components
The text is organized into three distinct sections:
1. **Header:** A title defining the purpose of the prompt.
2. **Separator:** A dashed horizontal line acting as a visual break.
3. **Instructional Body:** The core instructions for the AI model.
4. **Placeholder:** A specific field for the input problem.
### Content Details
The following is the exact transcription of the text contained within the image:
**Header:**
> Prompt for generating reasoning of multi-choice problems:
**Separator:**
> --------------------------------------------------
**Instructional Body:**
> You are an expert in solving multimodal mathematical problems. I will provide a mathematical problem along with its corresponding image. According to the problem and the image, please first conduct step-by-step reasoning, and after your reasoning, please provide the correct option letter (e.g., A, B, C, D, E) using the format: "Final answer: ..."
**Placeholder:**
> Problem:
> <Question>
### Key Observations
* **Chain-of-Thought (CoT) Enforcement:** The prompt explicitly mandates "step-by-step reasoning" before the final answer. This is a standard technique to improve the accuracy of LLMs on complex reasoning tasks.
* **Multimodal Requirement:** The prompt acknowledges that the input will consist of both text ("mathematical problem") and visual data ("corresponding image").
* **Strict Output Formatting:** The prompt requires a specific string format ("Final answer: ...") for the conclusion. This is likely intended to facilitate automated parsing or grading of the model's output.
* **Persona Adoption:** By starting with "You are an expert in solving multimodal mathematical problems," the prompt utilizes role-prompting to prime the model for higher-quality, domain-specific performance.
### Interpretation
This text serves as a **system prompt** or **instructional template** for an AI agent. Its primary purpose is to standardize the interaction between a user and an AI model when dealing with math-based benchmarks or exams.
By forcing the model to articulate its reasoning steps before providing the final answer, the prompt aims to:
1. **Reduce Hallucinations:** By forcing the model to "show its work," it is less likely to guess randomly.
2. **Enable Debugging:** If the model gets the answer wrong, a human evaluator can look at the "step-by-step reasoning" to identify exactly where the logic failed.
3. **Automate Evaluation:** The requirement for the "Final answer: ..." format allows for programmatic extraction of the result, making it easy to score the model's performance against a dataset of correct answers.
</details>
Figure 6: Prompt for policy models to generate reasoning and final answers of multi-choice problem.
The prompt we guide the policy models to generate reasoning processes and final answers of free-form problems is represented in Figure 7.
<details>
<summary>figures/Prompt_free_form.png Details</summary>
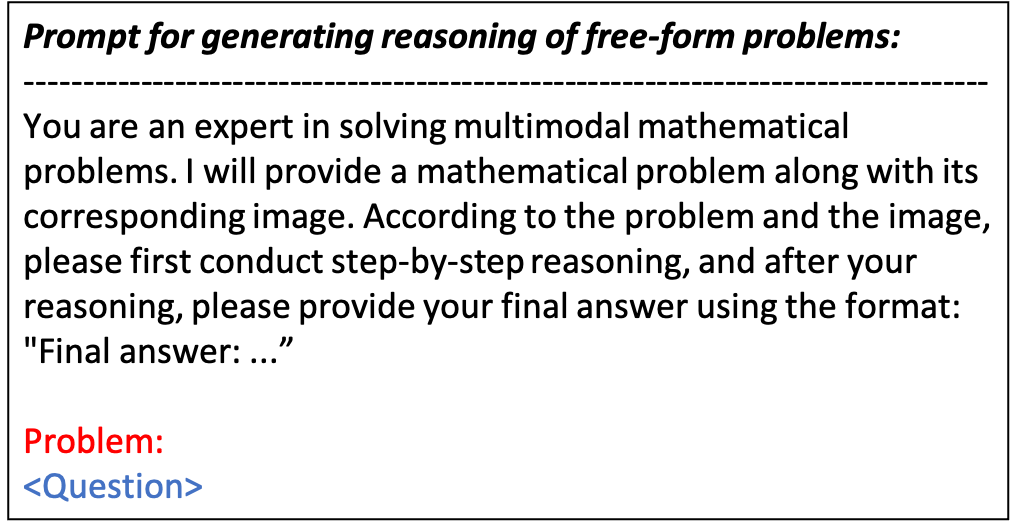
### Visual Description
## Textual Document: Prompt Template for Multimodal Mathematical Problem Solving
### Overview
The image displays a structured text prompt designed to instruct an AI model on how to process and solve multimodal mathematical problems. The document acts as a template, establishing a persona for the AI, defining the required workflow (reasoning before answering), and specifying the output format.
### Components/Sections
The document is organized into three distinct vertical sections:
1. **Header:** A bolded title defining the purpose of the prompt.
2. **Instructional Body:** The core directive for the AI model.
3. **Input Placeholder:** A specific area designated for the user to input the problem.
### Content Details
**1. Header (Top)**
* **Text:** "Prompt for generating reasoning of free-form problems:"
* **Formatting:** Bold, left-aligned.
**2. Separator**
* A dashed line spans the width of the text block, separating the header from the body.
**3. Instructional Body (Center)**
* **Text:** "You are an expert in solving multimodal mathematical problems. I will provide a mathematical problem along with its corresponding image. According to the problem and the image, please first conduct step-by-step reasoning, and after your reasoning, please provide your final answer using the format: \"Final answer: ...\""
* **Key Directives:**
* **Persona:** "Expert in solving multimodal mathematical problems."
* **Input Expectation:** A mathematical problem + an image.
* **Process:** "First conduct step-by-step reasoning."
* **Output Constraint:** Must use the specific format "Final answer: ..."
**4. Input Placeholder (Bottom)**
* **Text:** "Problem:" (colored in red)
* **Text:** "<Question>" (colored in blue, enclosed in angle brackets)
### Key Observations
* **Chain-of-Thought Enforcement:** The prompt explicitly mandates a "step-by-step reasoning" process. This is a standard technique in Large Language Model (LLM) prompting to improve accuracy in complex reasoning tasks by forcing the model to decompose the problem before committing to a final answer.
* **Multimodal Context:** The prompt explicitly acknowledges the "multimodal" nature of the task, requiring the model to synthesize information from both the provided text and the image.
* **Color Coding:** The use of red for "Problem:" and blue for "<Question>" suggests this is likely a template used in a coding environment or a structured prompt interface where placeholders are visually distinct from the instructions.
### Interpretation
This document serves as a "System Prompt" or "Instructional Template." Its primary function is to constrain the behavior of an AI model to ensure high-quality, verifiable outputs.
By requiring the model to act as an "expert" and explicitly demanding "step-by-step reasoning," the prompt aims to mitigate common AI failure modes, such as jumping to conclusions or making calculation errors. The requirement for a specific output format ("Final answer: ...") is designed to facilitate automated parsing or grading of the AI's response, making it highly suitable for benchmarking, automated testing, or educational platforms where the reasoning process is as important as the final result.
</details>
Figure 7: Prompt for policy models to generate reasoning and final answers of free-form problem.
The prompt we use to employ GPT-4o to generate the training dataset is shown in Figure 8.
<details>
<summary>figures/Prompt.png Details</summary>
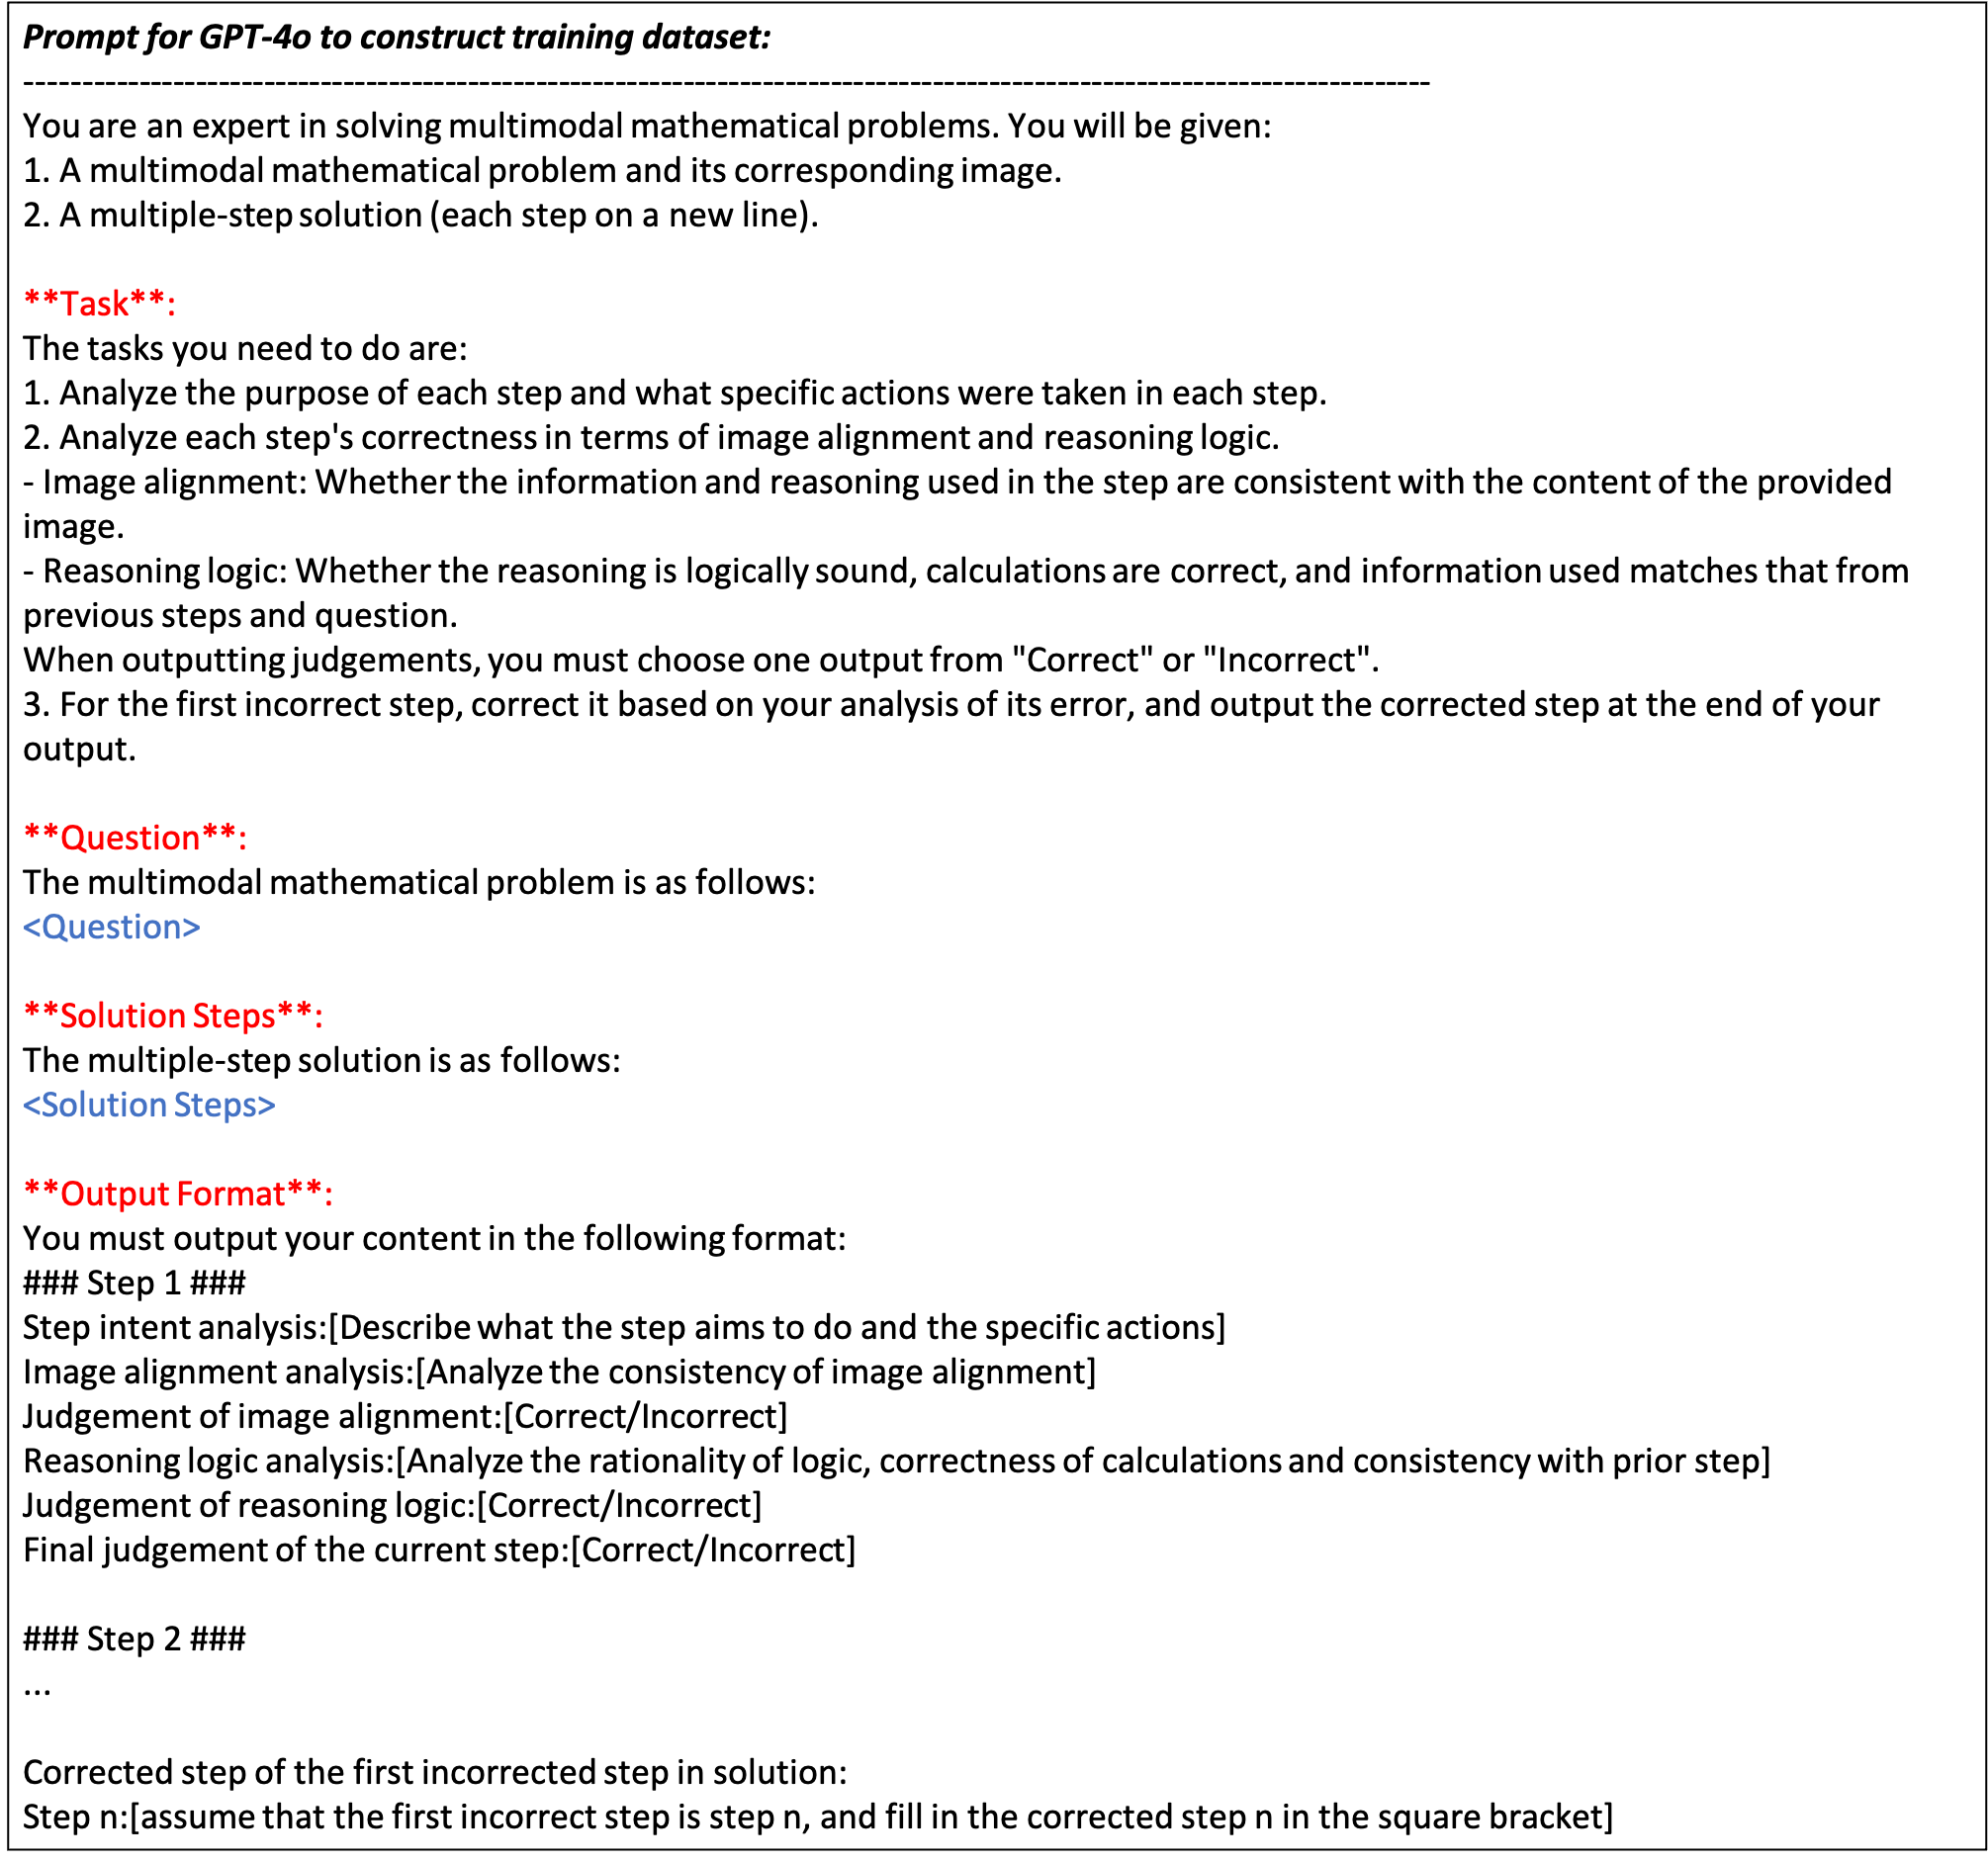
### Visual Description
## Text Document: Prompt Template for GPT-4o Training Dataset Construction
### Overview
The image displays a structured prompt template designed to instruct GPT-4o to act as an expert evaluator for multimodal mathematical problems. The document outlines a specific workflow for analyzing, verifying, and correcting multi-step mathematical solutions that rely on visual data.
### Content Details
The document is organized into five distinct sections:
**1. Header**
* "Prompt for GPT-4o to construct training dataset:"
**2. Role and Input Definition**
* **Role:** "You are an expert in solving multimodal mathematical problems."
* **Inputs:**
1. A multimodal mathematical problem and its corresponding image.
2. A multiple-step solution (each step on a new line).
**3. Task Instructions**
* **Task 1:** Analyze the purpose and specific actions of each step.
* **Task 2:** Analyze correctness based on two criteria:
* **Image alignment:** Consistency between information/reasoning and the provided image.
* **Reasoning logic:** Soundness of logic, correctness of calculations, and consistency with previous steps.
* *Constraint:* Judgements must be binary ("Correct" or "Incorrect").
* **Task 3:** For the first incorrect step, provide a correction.
**4. Placeholders**
* `**Question**`: The multimodal mathematical problem is as follows: `<Question>`
* `**Solution Steps**`: The multiple-step solution is as follows: `<Solution Steps>`
**5. Output Format**
The prompt mandates a strict Markdown structure for the output:
* `### Step 1 ###`
* `Step intent analysis:[Describe what the step aims to do and the specific actions]`
* `Image alignment analysis:[Analyze the consistency of image alignment]`
* `Judgement of image alignment:[Correct/Incorrect]`
* `Reasoning logic analysis:[Analyze the rationality of logic, correctness of calculations and consistency with prior step]`
* `Judgement of reasoning logic:[Correct/Incorrect]`
* `Final judgement of the current step:[Correct/Incorrect]`
* `### Step 2 ###`
* `...`
* `Corrected step of the first incorrect step in solution:`
* `Step n:[assume that the first incorrect step is step n, and fill in the corrected step n in the square bracket]`
### Key Observations
* **Granularity:** The prompt forces the AI to separate "Image alignment" from "Reasoning logic." This is a critical distinction for multimodal models, as a model might perform correct math on incorrect visual data (hallucination) or incorrect math on correct visual data.
* **Strict Schema:** The use of specific headers (`### Step 1 ###`) and bracketed placeholders (`[...]`) ensures the output is machine-readable and consistent, which is essential for building a training dataset.
* **Error Correction:** The prompt specifically requires the AI to identify the *first* incorrect step and provide a correction, which is a common technique for generating high-quality synthetic data for model fine-tuning.
### Interpretation
This document serves as a "meta-prompt" or a system instruction for an AI-driven data generation pipeline.
* **Purpose:** It is designed to create a dataset of "reasoning traces" where an AI evaluates another AI's work. By forcing the model to justify its "Correct/Incorrect" labels, the user can filter for high-quality reasoning chains.
* **Peircean Investigative Perspective:** The prompt treats the solution as a hypothesis that must be tested against two distinct "signs": the visual evidence (the image) and the logical evidence (the mathematical steps). The "Final judgement" acts as the conclusion of this investigation.
* **Utility:** This structure is highly effective for Reinforcement Learning from AI Feedback (RLAIF). It forces the model to slow down and decompose the problem, reducing the likelihood of "lazy" or "hallucinated" evaluations. The requirement to correct the first error ensures that the dataset contains not just critiques, but also ground-truth corrections.
</details>
Figure 8: Prompt for GPT-4o to construct training dataset.
### A.5 More Cases
We collect 2 more cases of GM-PRM and the Refined-BoN process illustrated in Figure 9 and 10.
<details>
<summary>figures/More_Cases_1.png Details</summary>
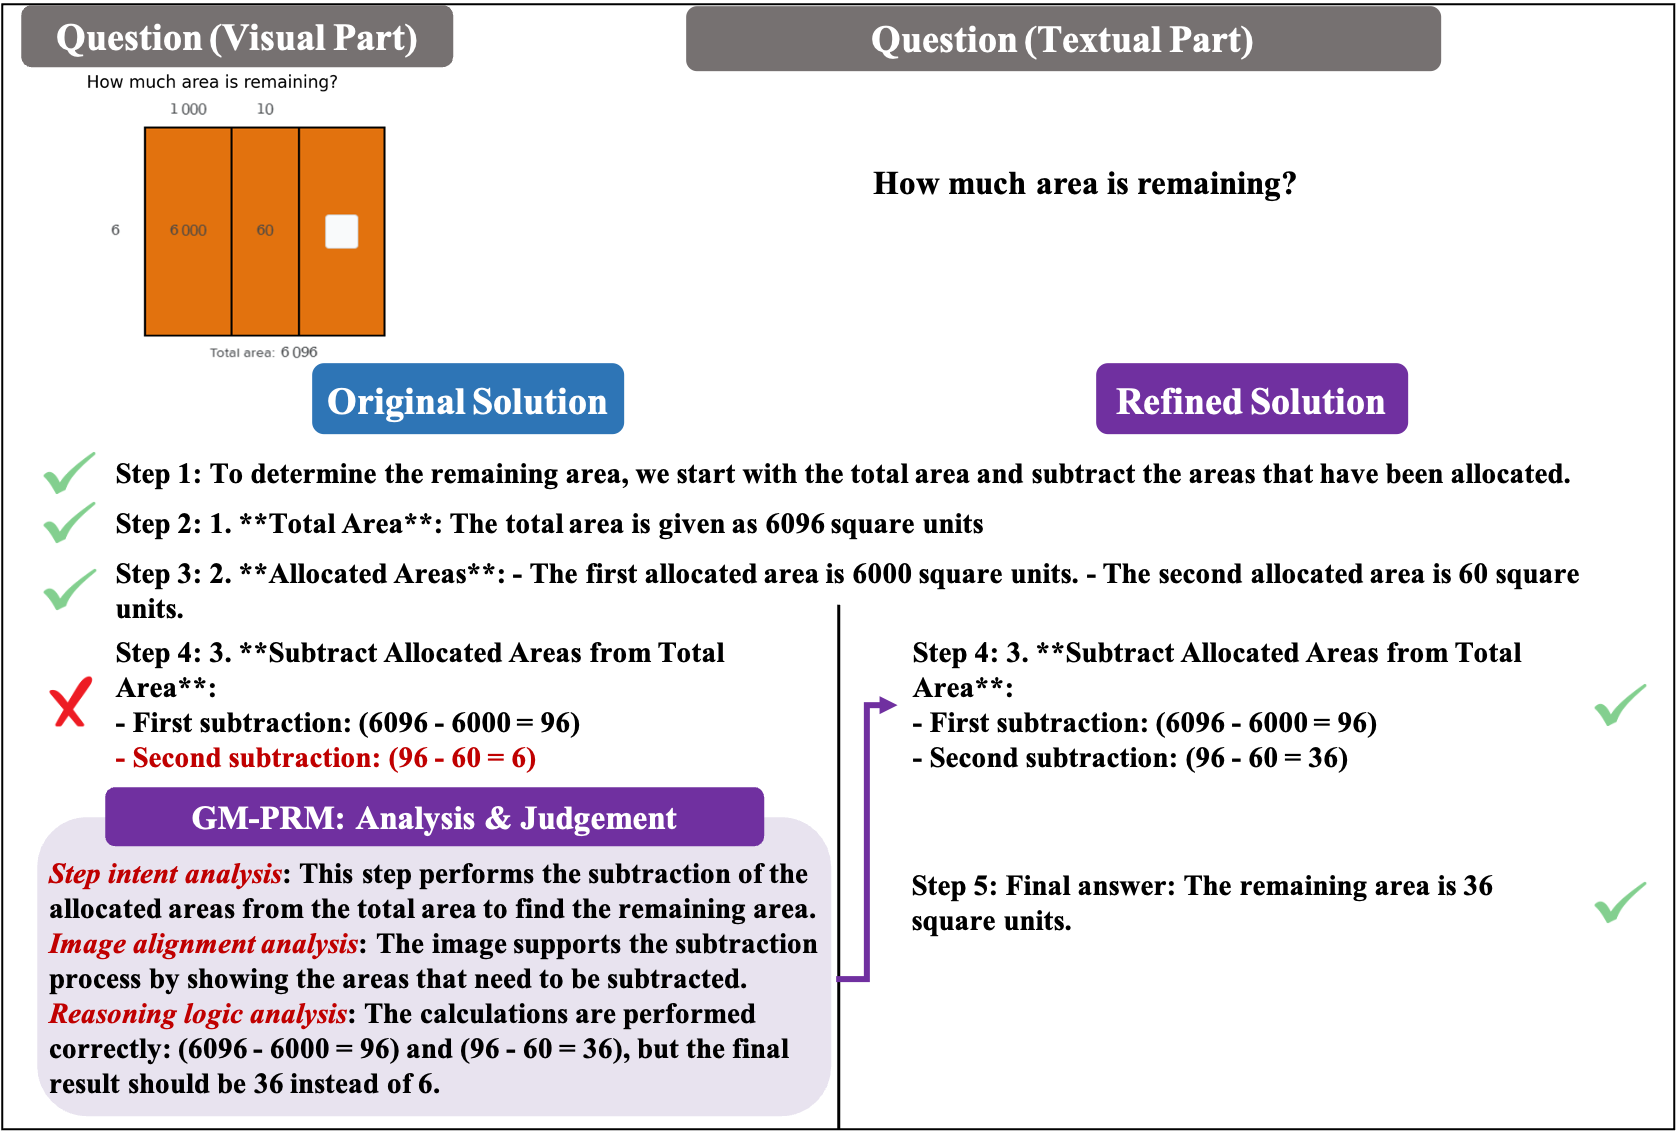
### Visual Description
## Diagram/Analysis: Mathematical Problem Correction
### Overview
The image displays a structured educational or AI-generated artifact consisting of a mathematical word problem, an initial incorrect solution, a corrected "refined" solution, and a meta-analysis section (GM-PRM) that evaluates the reasoning process. The content demonstrates a self-correction workflow where an arithmetic error is identified and rectified.
### Components
* **Question Section (Top):**
* **Visual Part:** A diagram of a rectangle divided into three segments.
* **Textual Part:** The question "How much area is remaining?"
* **Original Solution (Left-Center):** A blue-headed block containing steps 1 through 4, marked with green checkmarks for correct steps and a red 'X' for the incorrect calculation.
* **Refined Solution (Right-Center):** A purple-headed block containing the corrected steps 4 and 5, marked with green checkmarks.
* **GM-PRM: Analysis & Judgement (Bottom-Left):** A purple-headed block providing a qualitative assessment of the reasoning logic.
### Detailed Analysis
#### 1. Question (Visual Part)
* **Diagram:** A large rectangle representing a total area of 6096.
* **Segments:**
* **Left Segment:** Labeled with width "1000" at the top and area "6000" inside. The height is labeled as "6" on the left edge.
* **Middle Segment:** Labeled with width "10" at the top and area "60" inside.
* **Right Segment:** A small white square representing the "remaining area."
* **Total Area:** Labeled at the bottom as "Total area: 6096".
#### 2. Original Solution (Blue Header)
* **Step 1:** "To determine the remaining area, we start with the total area and subtract the areas that have been allocated."
* **Step 2:** "**Total Area**: The total area is given as 6096 square units"
* **Step 3:** "**Allocated Areas**: - The first allocated area is 6000 square units. - The second allocated area is 60 square units."
* **Step 4:** "**Subtract Allocated Areas from Total Area**: - First subtraction: (6096 - 6000 = 96) - Second subtraction: (96 - 60 = 6)"
* *Note:* This step is marked with a red 'X', indicating an error.
#### 3. Refined Solution (Purple Header)
* **Step 4:** "**Subtract Allocated Areas from Total Area**: - First subtraction: (6096 - 6000 = 96) - Second subtraction: (96 - 60 = 36)"
* **Step 5:** "Final answer: The remaining area is 36 square units."
* *Note:* This section is marked with a green checkmark.
#### 4. GM-PRM: Analysis & Judgement (Purple Header)
* **Step intent analysis:** "This step performs the subtraction of the allocated areas from the total area to find the remaining area."
* **Image alignment analysis:** "The image supports the subtraction process by showing the areas that need to be subtracted."
* **Reasoning logic analysis:** "The calculations are performed correctly: (6096 - 6000 = 96) and (96 - 60 = 36), but the final result should be 36 instead of 6."
### Key Observations
* **Arithmetic Error:** The "Original Solution" incorrectly calculated 96 - 60 as 6, likely a transcription or subtraction error where the tens digit was ignored.
* **Visual Consistency:** The diagram is mathematically consistent with the problem statement:
* Left block: 1000 (width) * 6 (height) = 6000.
* Middle block: 10 (width) * 6 (height) = 60.
* Total area: 6096.
* Remaining area: 6096 - 6000 - 60 = 36.
* **Correction Mechanism:** The document serves as a template for "Chain of Thought" reasoning, where an initial output is generated, evaluated by a secondary process (GM-PRM), and then corrected.
### Interpretation
This image is a diagnostic tool or a training sample for AI models. It demonstrates the "Self-Correction" or "Refinement" loop. The "GM-PRM" (likely standing for a model-based reasoning monitor) acts as an auditor. It identifies that while the *intent* and *alignment* of the original solution were correct, the *arithmetic execution* was flawed. The document effectively visualizes the transition from a flawed logical path to a verified, correct conclusion.
</details>
Figure 9: The illustration of a representative example before and after applying GM-PRM. In particular, GM-PRM first judges the steps of the original solution generated by the policy model. Subsequently, GM-PRM finds that the forth step is incorrect regarding reasoning logic and refines the forth step to generate the correct version. The correct steps are input to the policy model to generate the refined solution, and finally the correct answer is obtained.
<details>
<summary>figures/More_Cases_2.png Details</summary>
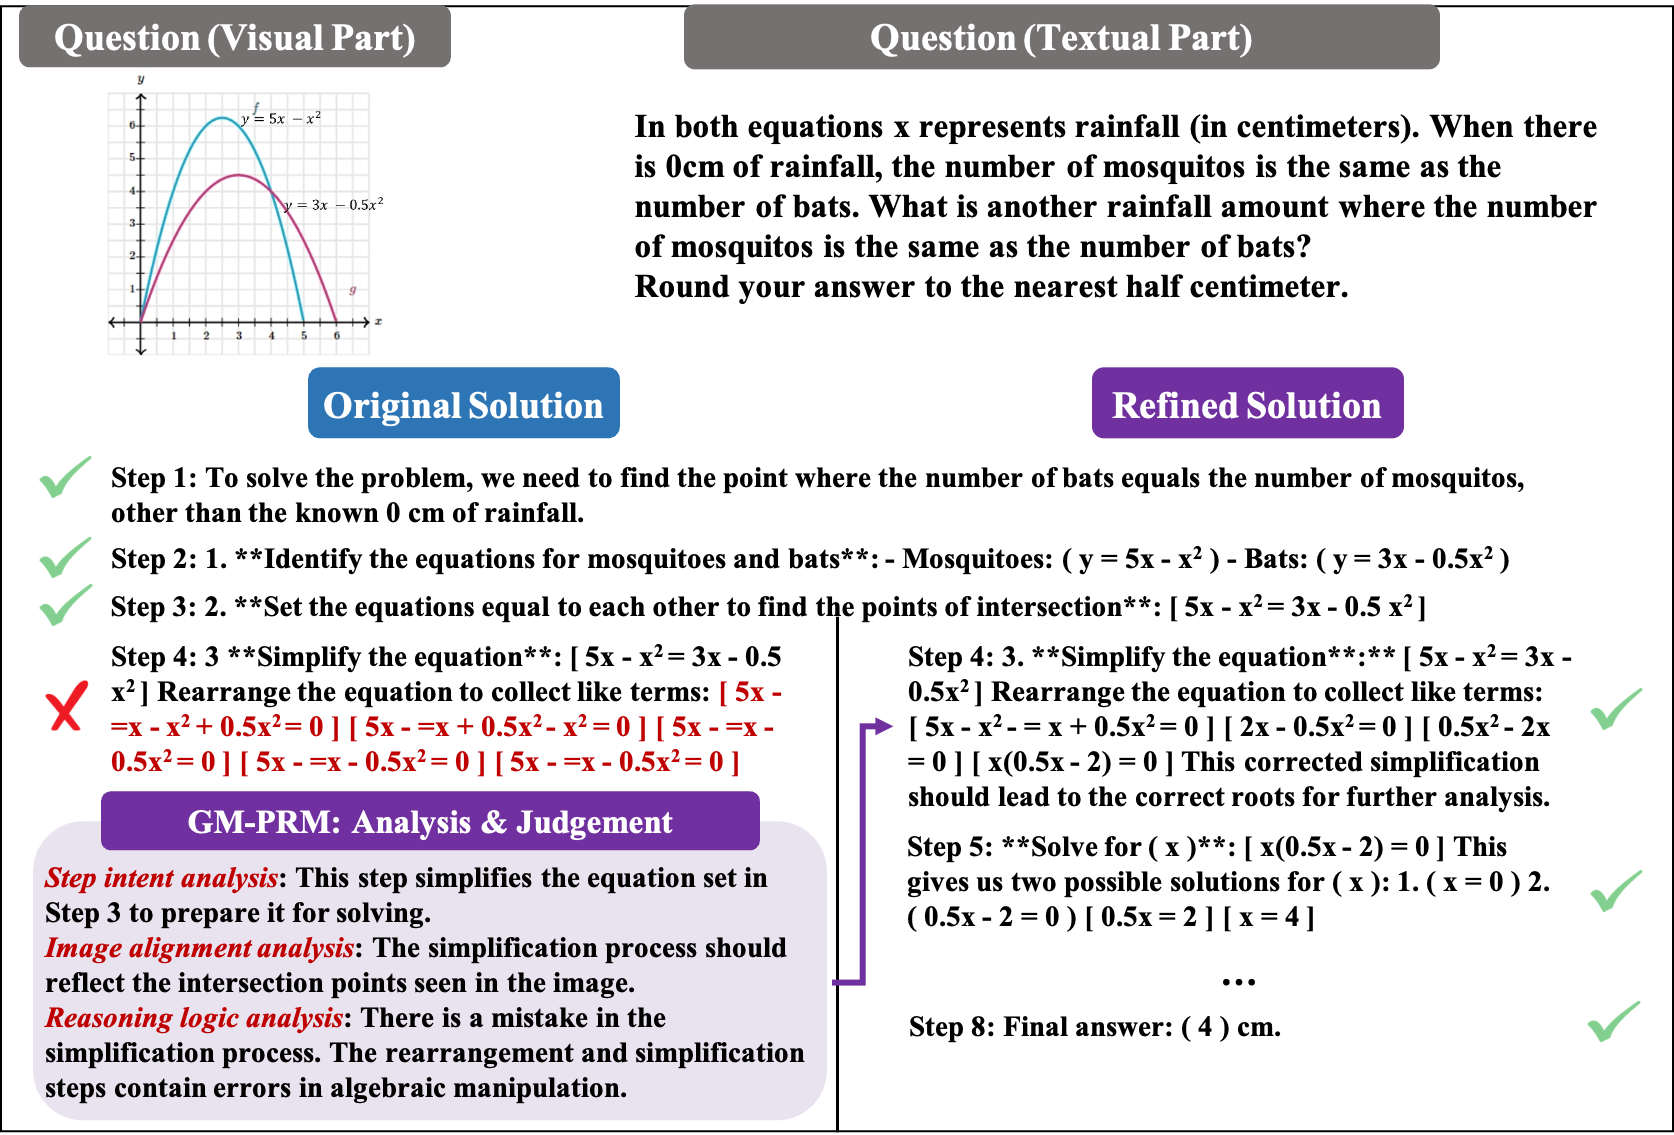
### Visual Description
## [Diagram/Text Analysis]: Mathematical Problem Solving and Error Correction
### Overview
The image is a composite educational graphic designed to teach algebraic problem-solving. It presents a word problem involving two quadratic equations, a graphical representation of these equations, an incorrect attempt at solving the problem ("Original Solution"), a corrected version ("Refined Solution"), and a meta-analysis box ("GM-PRM: Analysis & Judgement") that critiques the logic of the original attempt.
### Components/Axes
**1. Graph (Top Left)**
* **Axes:** A Cartesian coordinate system.
* **X-axis:** Labeled "x", representing rainfall in centimeters. Scale ranges from 0 to 6.
* **Y-axis:** Labeled "y", representing population count. Scale ranges from 0 to 6.
* **Curves:**
* **Blue Curve:** Labeled "$y = 5x - x^2$". This parabola opens downward, starting at $(0,0)$, peaking at approximately $(2.5, 6.25)$, and intersecting the x-axis at $x=5$.
* **Magenta Curve:** Labeled "$y = 3x - 0.5x^2$". This parabola opens downward, starting at $(0,0)$, peaking at approximately $(3, 4.5)$, and intersecting the x-axis at $x=6$.
* **Intersection Points:** The curves intersect at $(0,0)$ and $(4,4)$.
**2. Textual Question (Top Right)**
* **Content:** "In both equations x represents rainfall (in centimeters). When there is 0cm of rainfall, the number of mosquitos is the same as the number of bats. What is another rainfall amount where the number of mosquitos is the same as the number of bats? Round your answer to the nearest half centimeter."
**3. Original Solution (Middle Left)**
* **Status:** Marked with a red 'X'.
* **Content:**
* Step 1: "To solve the problem, we need to find the point where the number of bats equals the number of mosquitoes, other than the known 0 cm of rainfall."
* Step 2: "1. **Identify the equations for mosquitoes and bats**: - Mosquitoes: ( y = 5x - x²) - Bats: ( y = 3x - 0.5x² )"
* Step 3: "2. **Set the equations equal to each other to find the points of intersection**: [ 5x - x² = 3x - 0.5 x² ]"
* Step 4: "3 **Simplify the equation**: [ 5x - x² = 3x - 0.5 x² ] Rearrange the equation to collect like terms: [ 5x - = x - x² + 0.5x² = 0 ] [ 5x - = x + 0.5x² - x² = 0 ] [ 5x - = x - 0.5x² = 0 ] [ 5x - = x - 0.5x² = 0 ] [ 5x - = x - 0.5x² = 0 ]"
**4. Refined Solution (Middle Right)**
* **Status:** Marked with green checkmarks.
* **Content:**
* Step 4: "3. **Simplify the equation**: [ 5x - x² = 3x - 0.5x² ] Rearrange the equation to collect like terms: [ 5x - x² - = x + 0.5x² = 0 ] [ 2x - 0.5x² = 0 ] [ 0.5x² - 2x = 0 ] [ x(0.5x - 2) = 0 ] This corrected simplification should lead to the correct roots for further analysis."
* Step 5: "**Solve for ( x )**: [ x(0.5x - 2) = 0 ] This gives us two possible solutions for ( x ): 1. ( x = 0 ) 2. ( 0.5x - 2 = 0 ) [ 0.5x = 2 ] [ x = 4 ]"
* Step 8: "Final answer: ( 4 ) cm."
**5. GM-PRM: Analysis & Judgement (Bottom Left)**
* **Content:**
* "Step intent analysis: This step simplifies the equation set in Step 3 to prepare it for solving."
* "Image alignment analysis: The simplification process should reflect the intersection points seen in the image."
* "Reasoning logic analysis: There is a mistake in the simplification process. The rearrangement and simplification steps contain errors in algebraic manipulation."
### Detailed Analysis
* **Algebraic Logic:** The problem requires finding the intersection of two parabolas. This is achieved by setting the equations equal: $5x - x^2 = 3x - 0.5x^2$.
* **Simplification:**
* Subtracting $(3x - 0.5x^2)$ from both sides yields: $2x - 0.5x^2 = 0$.
* Factoring out $x$ yields: $x(2 - 0.5x) = 0$.
* The roots are $x = 0$ and $2 - 0.5x = 0 \rightarrow 0.5x = 2 \rightarrow x = 4$.
* **Visual Verification:** The graph shows the blue and magenta lines crossing at the origin $(0,0)$ and again at $x=4$ on the horizontal axis. The height at $x=4$ for both equations is $y = 5(4) - 4^2 = 20 - 16 = 4$, and $y = 3(4) - 0.5(4^2) = 12 - 8 = 4$. The visual data matches the algebraic result.
### Key Observations
* **Error Identification:** The "Original Solution" fails due to garbled algebraic manipulation and incorrect sign handling during the rearrangement of terms.
* **Pedagogical Structure:** The image uses a "Critique-Correction" format. It highlights the error, provides a meta-analysis of *why* it is an error (GM-PRM box), and then provides the correct path.
* **Consistency:** The graph, the refined algebraic steps, and the final answer are all consistent with each other.
### Interpretation
This image is a diagnostic tool for mathematical reasoning. It demonstrates that solving for the intersection of two functions is equivalent to finding the roots of the difference between those functions. The inclusion of the "GM-PRM" (likely "Generative Model - Process Reasoning Module") box suggests this is an output from an AI system designed to self-correct or provide transparent reasoning. The "Original Solution" serves as a negative example, illustrating how algebraic errors (specifically in collecting like terms) lead to incorrect or nonsensical results, while the "Refined Solution" demonstrates the correct procedural flow.
</details>
Figure 10: The illustration of a representative example before and after applying GM-PRM. In particular, GM-PRM first judges the steps of the original solution generated by the policy model. Subsequently, GM-PRM finds that the forth step is incorrect regarding reasoning logic and refines the forth step to generate the correct version. The correct steps are input to the policy model to generate the refined solution, and finally the correct answer is obtained.