# G2RPO-A: Guided Group Relative Policy Optimization with Adaptive Guidance
> Equal Contribution.
Abstract
Reinforcement Learning with Verifiable Rewards (RLVR) has markedly enhanced the reasoning abilities of large language models (LLMs). Its success, however, largely depends on strong base models with rich world knowledge, yielding only modest improvements for small-size language models (SLMs). To address this limitation, we investigate Guided GRPO, which injects ground-truth reasoning steps into roll-out trajectories to compensate for SLMs’ inherent weaknesses. Through a comprehensive study of various guidance configurations, we find that naively adding guidance delivers limited gains. These insights motivate G 2 RPO-A, an adaptive algorithm that automatically adjusts guidance strength in response to the model’s evolving training dynamics. Experiments on mathematical reasoning and code-generation benchmarks confirm that G 2 RPO-A substantially outperforms vanilla GRPO. Our code and models are available at https://github.com/T-Lab-CUHKSZ/G2RPO-A.
1 Introduction
Recent advancements in reasoning-centric large language models (LLMs), exemplified by DeepSeek-R1 Guo et al. (2025), OpenAI-o1 Jaech et al. (2024), and Qwen3 Yang et al. (2025a), have significantly expanded the performance boundaries of LLMs, showcasing the immense potential of reasoning-enhanced models. Building upon robust base models with comprehensive world knowledge, these reasoning-focused LLMs have achieved breakthrough progress in complex domains such as mathematics Guan et al. (2025), coding Souza et al. (2025); HUANG et al. (2025), and other grounding tasks (Li et al., 2025b; Wei et al., 2025). At the core of this success lies Reinforcement Learning with Verifiable Rewards (RLVR) (Shao et al., 2024; Chu et al., 2025; Liu et al., 2025). This innovative approach, which employs reinforcement learning techniques in LLMs using rule-based outcome rewards, has garnered significant attention in the AI community. RLVR has demonstrated remarkable improvement in generalization across a wide spectrum of downstream tasks (Jia et al., 2025; Wu et al., 2025), positioning it as a pivotal advancement in the field of artificial intelligence.
As the de-facto algorithm, Group Relative Policy Optimization (GRPO) (Shao et al., 2024) improves upon Proximal Policy Optimization (PPO) (Schulman et al., 2017) by removing the need for a critic model through inner-group response comparison, thereby speeding up the training.
<details>
<summary>x1.png Details</summary>
### Visual Description
## Line Chart: Training Dynamics of Simple Prompt Guidance
### Overview
This image presents a line chart illustrating the training dynamics of two methods: "With simple guidance" and "Original GRPO". The chart plots "Accuracy reward" against "Global step", showing how the performance of each method changes over the course of training.
### Components/Axes
* **Title:** "The training dynamics of simple prompt guidance" (positioned at the top-center)
* **X-axis:** "Global step" (ranging from -2 to 34, with markers at every 2 steps)
* **Y-axis:** "Accuracy reward" (ranging from 0.45 to 0.60, with markers at every 0.05)
* **Legend:** Located in the bottom-right corner, identifying the two data series:
* "With simple guidance" - represented by a light blue line.
* "Original GRPO" - represented by a red line.
### Detailed Analysis
**"With simple guidance" (Light Blue Line):**
The light blue line initially slopes downward from approximately 0.55 at Global step 0 to a minimum of approximately 0.48 at Global step 10. It then fluctuates, increasing to around 0.51 at Global step 22, decreasing to approximately 0.48 at Global step 26, and finally rising sharply to approximately 0.59 at Global step 34.
* Global step 0: Accuracy reward ≈ 0.55
* Global step 2: Accuracy reward ≈ 0.54
* Global step 4: Accuracy reward ≈ 0.52
* Global step 6: Accuracy reward ≈ 0.50
* Global step 8: Accuracy reward ≈ 0.49
* Global step 10: Accuracy reward ≈ 0.48
* Global step 12: Accuracy reward ≈ 0.49
* Global step 14: Accuracy reward ≈ 0.49
* Global step 16: Accuracy reward ≈ 0.48
* Global step 18: Accuracy reward ≈ 0.48
* Global step 20: Accuracy reward ≈ 0.48
* Global step 22: Accuracy reward ≈ 0.51
* Global step 24: Accuracy reward ≈ 0.49
* Global step 26: Accuracy reward ≈ 0.48
* Global step 28: Accuracy reward ≈ 0.52
* Global step 30: Accuracy reward ≈ 0.56
* Global step 32: Accuracy reward ≈ 0.58
* Global step 34: Accuracy reward ≈ 0.59
**"Original GRPO" (Red Line):**
The red line starts at approximately 0.57 at Global step 0, then decreases to approximately 0.53 at Global step 2, continues to decrease to a minimum of approximately 0.47 at Global step 10. It then increases to approximately 0.49 at Global step 14, decreases to approximately 0.47 at Global step 20, and rises sharply to approximately 0.58 at Global step 30, and finally to approximately 0.58 at Global step 34.
* Global step 0: Accuracy reward ≈ 0.57
* Global step 2: Accuracy reward ≈ 0.53
* Global step 4: Accuracy reward ≈ 0.51
* Global step 6: Accuracy reward ≈ 0.49
* Global step 8: Accuracy reward ≈ 0.48
* Global step 10: Accuracy reward ≈ 0.47
* Global step 12: Accuracy reward ≈ 0.48
* Global step 14: Accuracy reward ≈ 0.49
* Global step 16: Accuracy reward ≈ 0.48
* Global step 18: Accuracy reward ≈ 0.47
* Global step 20: Accuracy reward ≈ 0.47
* Global step 22: Accuracy reward ≈ 0.48
* Global step 24: Accuracy reward ≈ 0.48
* Global step 26: Accuracy reward ≈ 0.49
* Global step 28: Accuracy reward ≈ 0.52
* Global step 30: Accuracy reward ≈ 0.58
* Global step 32: Accuracy reward ≈ 0.58
* Global step 34: Accuracy reward ≈ 0.58
### Key Observations
* Both methods exhibit a decrease in accuracy reward during the initial training phase (Global steps 0-10).
* "With simple guidance" shows a more pronounced increase in accuracy reward towards the end of the training process (Global steps 28-34) compared to "Original GRPO".
* "Original GRPO" starts with a higher accuracy reward than "With simple guidance" but converges to a similar level at the end of the training.
* The "With simple guidance" method appears to be more volatile, with larger fluctuations in accuracy reward throughout the training process.
### Interpretation
The chart demonstrates the training dynamics of two different prompt guidance methods. Both methods initially experience a decrease in performance, likely due to the model adjusting to the training data. However, "With simple guidance" ultimately achieves comparable performance to "Original GRPO", and exhibits a more significant improvement in the later stages of training. This suggests that while "Original GRPO" may have a better starting point, "With simple guidance" can catch up and potentially surpass it with continued training. The fluctuations observed in "With simple guidance" could indicate a more sensitive training process, potentially requiring more careful tuning of hyperparameters. The sharp increase in both lines near Global step 30 suggests a point of convergence or a significant learning event during training.
</details>
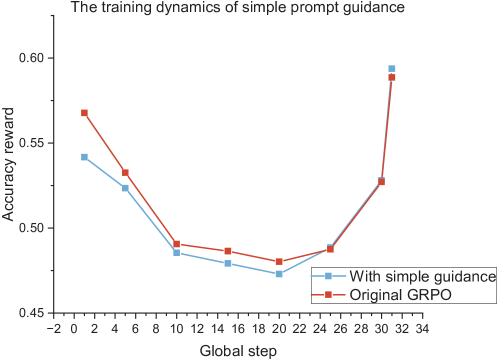
Figure 1: Naive guidance does not help. Using Qwen2.5-Math-7B as the base model, we train it on the s1K-1.1 dataset for a single epoch with a simple, fixed-length guidance (naive guidance). The naive guidance method shows a temporary increase in the accuracy reward during the early training stages, but it quickly becomes indistinguishable from the vanilla GRPO curve.
<details>
<summary>x2.png Details</summary>
### Visual Description
\n
## Textual Document: Mathematical Problem & Solution Guidance
### Overview
The image presents a mathematical problem statement alongside guidance for solving it, visually framed with cartoon illustrations. The problem involves a sequence of positive numbers (a_n), their sum (b_n), and their product (c_n), with a specific recursive relationship. The guidance breaks down the problem step-by-step, explaining the relationships between the sequences and the goal of finding a term in the sequence (a_n) closest to 2013.
### Components/Axes
There are no axes or charts in this image. The components are:
1. **Problem Statement:** A block of text defining the sequence and the problem to solve.
2. **Guidance:** A block of text providing step-by-step reasoning and explanation.
3. **Illustrations:** Cartoon images of a man with a question mark, an older man providing guidance, and robots.
### Detailed Analysis or Content Details
**Problem Statement (Left Side):**
"For the sequence of positive numbers: (a_n), the sum of the first n terms is b_n, and the product of the first n terms of the sequence (b_n) is c_n, and it is given that b_n + 2c_n = 1 (n ∈ Z+). Find the number in the sequence (a_n) that is closest to 2013."
**Guidance (Center):**
"Guidance
Alright, let’s try to tackle this problem step by step. So, we have a sequence of positive numbers (a_n). The sum of the first n terms is b_n. Then, the product of the first n terms of the sequence b_n is c_n. So, c_n = b_1 * b_2 * … * b_n. And for each n, b_n + 2c_n = 1. Interesting. So, for each n, both b_n and c_n are involved in this equation. Since (a_n) are positive, all the b_n will be positive as well, and hence c_n is also positive."
**LLMs continue response (Right Side):**
"Hmm, okay. Let me parse this again. The sum of the first n terms of (a_n) is b_n. Then, the product of the first n terms of b_n is c_n. So, c_n = b_1 * b_2 * … * b_n. And for each n, b_n + 2c_n = 1. Interesting. So, for each n, both b_n and c_n are involved in this equation. Since (a_n) are positive, all the b_n will be positive as well, and hence c_n is also positive."
### Key Observations
The problem statement defines a recursive relationship between three sequences (a_n, b_n, c_n). The guidance focuses on establishing the positive nature of the terms in the sequences, which is a crucial observation for solving the problem. The LLM response repeats the same reasoning as the guidance.
### Interpretation
The image presents a mathematical problem and a starting point for its solution. The core of the problem lies in the recursive relationship b_n + 2c_n = 1, which constrains the values of b_n and c_n. The guidance correctly identifies that all terms in the sequences must be positive. This information is essential for further analysis and finding the value of a_n closest to 2013. The repetition of the reasoning by the LLM suggests a confirmation or reiteration of the initial steps in the problem-solving process. The image is designed to be part of a learning or problem-solving context, likely within a mathematics education setting. The cartoon illustrations are intended to make the problem more approachable and engaging.
</details>
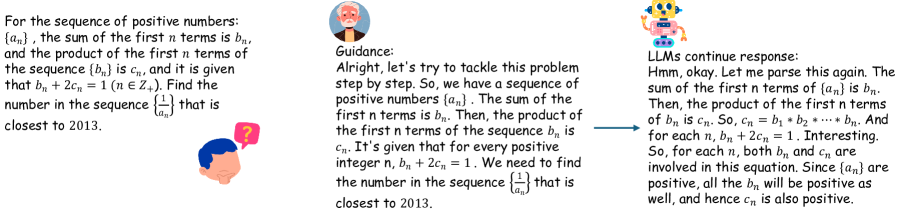
Figure 2: Illustration of roll-outs with guidance. An example of using high-quality thinking trajectories to guide models.
Capacity of small-size LLMs limit the performance gains of GRPO.
Despite GRPO’s success with large-scale LLMs, its effectiveness is significantly constrained when applied to smaller LLMs. Recent research (Ye et al., 2025; Muennighoff et al., 2025a) reveals that GRPO’s performance gains highly depend on the base model’s capacity Bae et al. (2025); Xu et al. (2025); Zhuang et al. (2025). Consequently, small-scale LLMs (SLMs) show limited improvement under GRPO (Table 3, 8), exposing a critical scalability challenge in enhancing reasoning capabilities across diverse model sizes. To address this challenge, researchers have explored various approaches: distillation Guo et al. (2025), multi-stage training Xu et al. (2025) prior to RLVR, and selective sample filtering Xiong et al. (2025); Shi et al. (2025). However, these methods precede RLVR or suffer performance degradation in complex problems (Table 7). Consequently, optimizing the RLVR process for efficient learning in SLMs remains an open challenge, representing a critical frontier in AI research.
Adaptive guidance as a solution.
We propose incorporating guidance into the roll-out process to facilitate the generation of high-quality, reward-worthy candidates (Figure 2). However, our initial findings revealed that the implementation of simple fixed-length guidance to the prompts (naive guidance) failed to improve overall performance (Figure 1). Through a comprehensive analysis of the guidance mechanism—varying both the proportion of guided roll-outs within GRPO batches and the guidance length over training epochs—we obtained two key findings: (1) Code-generation tasks benefit from a higher guidance ratio than mathematical reasoning tasks, and smaller models likewise require more guidance than larger ones. (2) The optimal guidance length evolves throughout training and is highly context-dependent, rendering simple, predefined schedules ineffective. In response, we introduce the Guided Group Relative Policy Optimization with Adaptive Guidance (G 2 RPO-A) algorithm. This innovative approach dynamically adjusts guidance length based on the model’s real-time learning state, offering a sophisticated solution to the challenges of enhancing small-size LLMs’ performance in RLVR processes. The key contributions of this paper are summarized as follows:
- We enhance GRPO for small-scale LLMs by injecting guidance into the rollout thinking trajectories and conduct a systematic analysis of the effects of key guidance configurations, specifically focusing on the guidance ratio and guidance length.
- Our study also examines the importance of hard training samples. We find that integrating these samples into the dataset using a curriculum learning approach, and aided by the guidance mechanism, significantly boosts the training efficiency of our method for SLMs.
- Drawing on these findings, we introduce G 2 RPO-A, an adaptive algorithm that automatically adjusts guidance length in response to the evolving training state. Our experimental results demonstrate the effectiveness of the proposed G 2 RPO-A algorithm.
- We evaluate our method on mathematical reasoning and coding tasks with several models–including the Qwen3 series, DeepSeek-Math-7B-Base, and DeepSeek-Coder-6.7B-Base–and observe substantial performance gains over both vanilla GRPO and simple guided baselines.
2 Related Works
<details>
<summary>x3.png Details</summary>
### Visual Description
## Diagram: Guided Generation Process with SLM
### Overview
The image depicts a diagram illustrating a guided generation process utilizing a system labeled "SLM" (likely a Scaled Language Model). The process involves multiple "Completions" generated from a single query, a "ground truth," and a "thinking trajectory." These completions are then guided, resulting in "k guided completions" and "unguided completions." The diagram highlights the iterative nature of the process, with the SLM being used to decide guidance strength and generate current responses.
### Components/Axes
The diagram consists of the following key components:
* **Input:**
* "One query" (light blue arrow)
* "A ground truth" (light blue arrow)
* "A thinking trajectory" (light blue arrow)
* **SLM (Scaled Language Model):** Represented by a 3D cube. Two instances are present.
* **Completions:** Represented as rows labeled "Completion 1" through "Completion n".
* **Generations:** Represented as columns labeled "Generations".
* **Guidance:** A purple banner at the top.
* **k guided completions:** A purple banner on the right.
* **unguided completions:** A purple banner on the right.
* **Output:**
* "Decide the guidance strength" (light blue arrow)
* "Generate the current responses" (light blue arrow)
* **Data Points within Completions:** Each completion contains multiple data points labeled "O<sub>ij</sub>" and "P<sub>ij</sub>", where 'i' represents the completion number and 'j' represents the generation number.
### Detailed Analysis or Content Details
The diagram shows a matrix-like structure representing the generation process.
* **Input to SLM:** A single query, a ground truth, and a thinking trajectory are fed into the first SLM.
* **Completions:** The SLM generates 'n' completions. Each completion has multiple generations.
* **Data Points:** Within each completion (i), there are multiple generations (j). Each generation consists of two data points:
* O<sub>ij</sub>: The first data point in generation 'j' of completion 'i'.
* P<sub>ij</sub>: The second data point in generation 'j' of completion 'i'.
* **Guidance and Unguided Completions:** The diagram indicates that some completions are "k guided completions" and others are "unguided completions." The exact value of 'k' is not specified.
* **Iterative Process:** The "k guided completions" and "unguided completions" are then fed back into a second SLM, which decides the guidance strength and generates the current responses.
* **Matrix Structure:** The completions are arranged in rows (Completion 1 to Completion n), and the generations are arranged in columns. The data points O<sub>ij</sub> and P<sub>ij</sub> are positioned within this matrix.
### Key Observations
* The diagram emphasizes the iterative nature of the generation process, with feedback loops involving the SLM.
* The distinction between "guided" and "unguided" completions suggests a mechanism for controlling the generation process based on some criteria.
* The use of subscripts (ij) for the data points indicates a structured relationship between completions and generations.
* The diagram does not provide specific numerical values for the data points or the number of completions (n) or guided completions (k).
### Interpretation
This diagram illustrates a sophisticated generation process likely used in large language models. The SLM acts as a central controller, receiving input (query, ground truth, trajectory) and generating multiple completions. The "guidance" mechanism allows for steering the generation process, potentially towards more accurate or relevant outputs. The feedback loop ensures that the SLM can adapt its guidance strategy based on the results of previous generations. The "ground truth" and "thinking trajectory" suggest a reinforcement learning or similar approach where the model is trained to align its generations with desired outcomes. The diagram highlights the complexity of modern language models and the importance of controlling the generation process to achieve desired results. The use of O<sub>ij</sub> and P<sub>ij</sub> suggests that each generation produces two outputs, potentially representing different aspects of the generated text (e.g., object and predicate). The diagram is conceptual and does not provide quantitative data, but it effectively conveys the overall architecture and flow of the guided generation process.
</details>
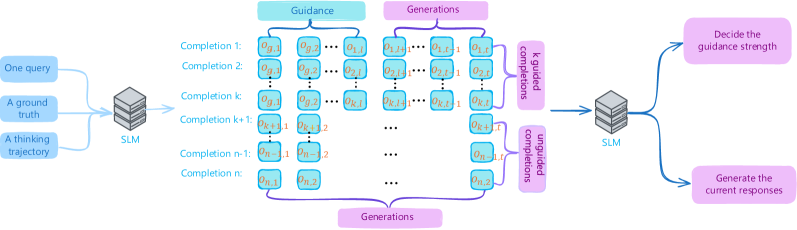
Figure 3: Overview of G 2 RPO-A. Each step we split roll-outs into a guided set and an unguided set. We then compare the current rewards with those from the previous steps; the resulting ratio determines the future guidance length.
The introduction of chain-of-thought (CoT) prompting has markedly improved LLM performance on complex reasoning tasks (Wei et al., 2022; Kojima et al., 2022). Complementing this advance, Reinforcement Learning with Verifiable Rewards (RLVR) has emerged as a powerful training paradigm for reasoning-centric language models Yue et al. (2025); Lee et al. (2024). The de-facto RLVR algorithm, Group Relative Policy Optimization (GRPO) (Guo et al., 2025) delivers strong gains on various benchmarks while remaining training-efficient because it dispenses with the need for a separate critic network Wen et al. (2025); Shao et al. (2024). Recent efforts to improve GRPO have explored several directions. Some approaches focus on refining the core GRPO objective, either by pruning candidate completions Lin et al. (2025) or by removing normalization biases Liu et al. (2025). Separately, another studies aim to enhance the training signal and stability. DAPO Yu et al. (2025), for instance, introduces dense, step-wise advantage signals and decouples the actor-critic training to mitigate reward sparsity.
However, adapting GRPO–style algorithms to small-scale LLMs remains challenging due to the sparse-reward problem Lu et al. (2024); Nguyen et al. (2024); Dang and Ngo (2025). Recent studies have therefore focused on improved reward estimation Cui et al. (2025). TreeRPO Yang et al. (2025b) uses a tree-structured sampling procedure to approximate step-wise expected rewards, and Hint-GRPO Huang et al. (2025) applies several reward-shaping techniques. Other lines of research investigate knowledge distillation (Guo et al., 2025), multi-stage pre-training before RLVR Xu et al. (2025), and selective sample filtering Xiong et al. (2025); Shi et al. (2025). In our experiments, however, these filtering or sampling strategies are performed either only before RLVR or do not improve performance on more complex tasks. In this paper, we introduce a guidance mechanism that injects ground-truth reasoning steps directly into the model’s roll-out trajectories during RL training. Because the guidance is provided online, the proposed method can still learn effectively from difficult examples while mitigating the sparse-reward issue.
The role of guidance in GRPO-style training remains underexplored. Two concurrent studies have addressed related questions (Nath et al., 2025; Park et al., 2025), but both simply append guidance tokens to the input prompt, offering neither a systematic analysis of guidance configurations nor a mechanism that adapts to the changing training state of the model. We show that naive guidance often fails to improve performance because it yields low expected advantage. To remedy this, we provide a comprehensive examination of how guidance length, ratio, and scheduling affect learning, and we introduce G 2 RPO-A, an adaptive strategy that dynamically adjusts guidance strength throughout training.
3 Preliminary
Group Relative Policy Optimization (GRPO).
Given a prompt, GRPO Shao et al. (2024) samples $G$ completions and computes their rewards $\{r_{i}\}_{i=1}^{G}$ . Define the $t^{\text{th}}$ token of the $i^{\text{th}}$ completion as $o_{i,t}$ . GRPO then assigns a advantage, $\hat{A}_{i,t}$ to it. The optimization objective is defined as:
$$
\begin{split}\mathcal{L}_{\text{GRPO}}(\theta)=-\frac{1}{\sum_{i=1}^{G}|o_{i}|}\sum_{i=1}^{G}\sum_{t=1}^{|o_{i}|}\biggl{[}\min\biggl{(}w_{i,t}\hat{A}_{i,t},\text{clip}\left(w_{i,t},1-\epsilon,1+\epsilon\right)\hat{A}_{i,t}\biggr{)}-\beta\mathcal{D}_{\text{KL}}(\pi_{\theta}\|\pi_{\text{ref}})\biggr{]},\end{split} \tag{1}
$$
where the importance weight $w_{i,t}$ is given by
$$
w_{i,t}=\frac{\pi_{\theta}(o_{i,t}\mid q,o_{i,<t})}{[\pi_{\theta_{\text{old}}}(o_{i,t}\mid q,o_{i,<t})]}. \tag{2}
$$
The clipping threshold $\epsilon$ controls update magnitude, $[\,·\,]_{\text{old}}$ indicates policy at last step, $\beta$ is the influence of KL divergence $\mathcal{D}_{\text{KL}}$ , whose detailed definition can be found in the section Detailed equations in Appendix.
Limitations of GRPO for small-size LLMs.
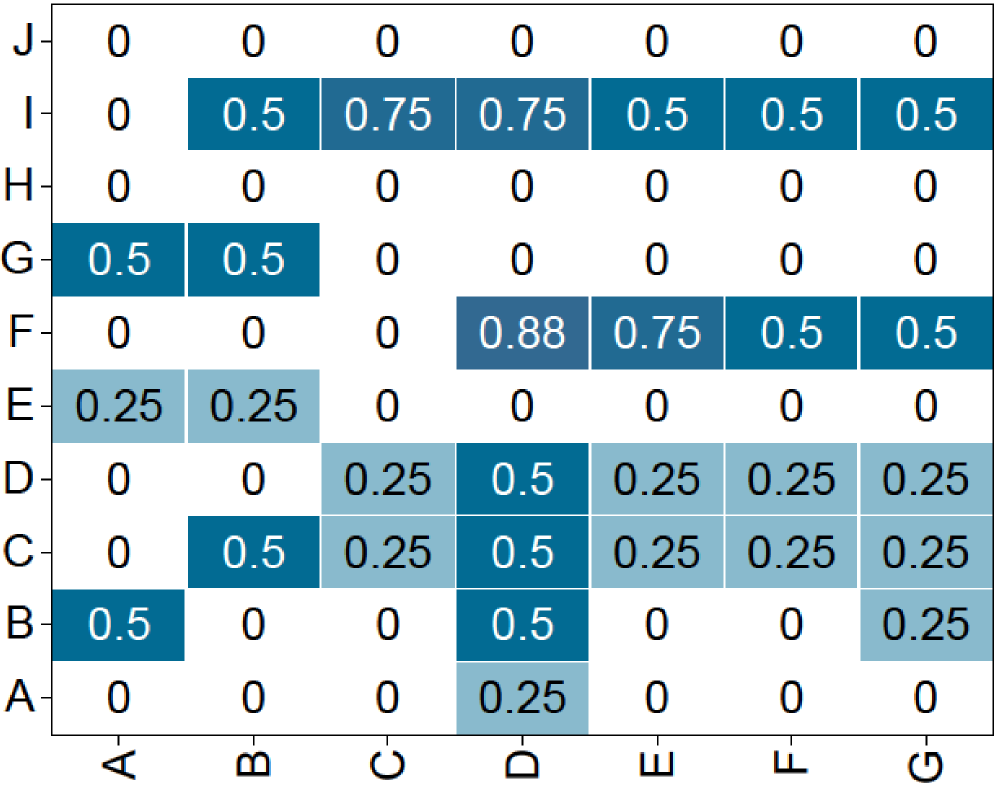
Despite the success of GRPO in large language models (LLMs), small-size LLMs (SLMs) face significant challenges when confronted with complex problems requiring long chains of thought Zhang et al. (2025). Due to their inherently limited capacity, SLMs struggle to generate high-quality, reward-worthy candidates for such tasks Li et al. (2025a); Zheng et al. (2025). As shown in Figure 4(a), where Qwen3-1.7B is implemented on a code task and it fails to generate correct answers for most queries. This limitation substantially reduces the probability of sampling high-reward candidates, resulting in advantage signals vanishing (Figure 5(b)), thereby constraining the potential performance gains achievable through GRPO in SLMs.
4 Methodology
To address the limitations of GRPO on SLMs, we propose incorporating guidance mechanisms into the thinking trajectories, thereby facilitating the sampling of high-quality candidates. We then conduct a comprehensive investigation into various design choices for guidance strategies. Finally, we introduce the G 2 RPO-A algorithm, which integrates our empirical observations and significantly reduces the need for extensive hyperparameter tuning.
4.1 Guided GRPO as a Solution
The Guided GRPO can be formulated as:
| | | $\displaystyle\mathcal{L}_{\text{guided}}(\theta)=\mathbb{E}_{(q,a)\sim\mathcal{D},\{g_{i}\}_{i=1}^{G}\sim\mathcal{G},\{o_{i}\}_{i=1}^{G}\sim\pi_{\text{ref}}(·|q,g_{i})}$ | |
| --- | --- | --- | --- |
where $w_{g,i,t}$ and $w_{o,i,t}$ denote the token-level weighting coefficient of guidance $g_{i}$ and the model outputs $o_{i}$ , respectively. As shown in Figure 4(b), this guidance enables SLMs to generate higher-reward candidates, potentially overcoming their inherent limitations.
Naive Guided GRPO fails to boost the final performance.
Despite increasing expected rewards (Figure 4(b)), we found that
simply adding guidance to thinking trajectories of all candidates doesn’t enhance final performance and suffers from low advantage.
As shown in Figure 5(a) and 5(b), we train Qwen-3-1.7B-Base on a math dataset sourced from math 220k dataset Wang et al. (2024), and find that: (1) Guided GRPO’s accuracy reward curve almost matches original GRPO. (2) Guided GRPO suffers from low advantage standard deviation, hindering the optimization of the models. As a result, further investigation is needed to leverage Guided GRPO’s higher rewards while ensuring effective training, as the naive approach fails to utilize its potential benefits.
<details>
<summary>x4.png Details</summary>
### Visual Description
## Heatmap: Correlation Matrix
### Overview
The image presents a heatmap representing a correlation matrix. The matrix displays the correlation coefficients between seven variables (A through G) across ten dimensions (A through J). The color intensity indicates the strength and direction of the correlation, with darker shades of blue representing stronger positive correlations and lighter shades representing weaker correlations or negative correlations. The values are numerical, ranging from 0 to 0.88.
### Components/Axes
* **X-axis:** Represents the variables, labeled A, B, C, D, E, F, and G.
* **Y-axis:** Represents the dimensions, labeled A, B, C, D, E, F, G, H, I, and J.
* **Color Scale:** The color scale is implicit, with darker blue indicating higher correlation and lighter blue/white indicating lower correlation. No explicit legend is provided, but the color gradient is clear.
* **Cells:** Each cell in the matrix represents the correlation coefficient between the corresponding variable (column) and dimension (row).
### Detailed Analysis
The matrix is 10x7. Here's a breakdown of the values, row by row:
* **Row A:** 0, 0, 0, 0.25, 0, 0, 0
* **Row B:** 0.5, 0.5, 0, 0.5, 0, 0, 0.25
* **Row C:** 0, 0.5, 0.25, 0.5, 0.25, 0.25, 0.25
* **Row D:** 0, 0, 0.25, 0.5, 0.25, 0.25, 0.25
* **Row E:** 0.25, 0.25, 0, 0, 0, 0, 0
* **Row F:** 0, 0, 0, 0.88, 0.75, 0.5, 0.5
* **Row G:** 0.5, 0.5, 0, 0, 0, 0, 0
* **Row H:** 0, 0, 0, 0, 0, 0, 0
* **Row I:** 0, 0.5, 0.75, 0.75, 0.5, 0.5, 0.5
* **Row J:** 0, 0, 0, 0, 0, 0, 0
**Trends:**
* **Variable F and Dimension D:** Exhibit the strongest positive correlation (0.88).
* **Variable F and Dimension E:** Show a strong positive correlation (0.75).
* **Variable I and Dimensions B, C, D, E, F, G:** Show moderate positive correlations (0.5 - 0.75).
* **Variable B and Dimension A:** Show a moderate positive correlation (0.5).
* **Variable G and Dimension A:** Show a moderate positive correlation (0.5).
* Many correlations are zero, indicating no linear relationship between the variables and dimensions.
### Key Observations
* The highest correlation value is 0.88, suggesting a strong linear relationship between Variable F and Dimension D.
* Dimension A appears to have limited correlation with most variables, except for B and G.
* Dimension H and J have zero correlation with all variables.
* The matrix is not symmetric, indicating that the correlation is not necessarily reciprocal.
### Interpretation
This correlation matrix likely represents the relationships between different features or variables within a dataset. The strong correlation between Variable F and Dimension D suggests that these two elements are closely related and tend to change together. The zero correlations indicate that some variables are independent of each other. The asymmetry of the matrix suggests that the relationship between variables is not always bidirectional.
The data suggests that Variable F is a strong predictor of Dimension D, and vice versa. The moderate correlations observed in Row I suggest that Dimension I is somewhat related to several variables, but not as strongly as F and D. The lack of correlation for Dimensions H and J might indicate that these dimensions are not relevant to the variables being analyzed, or that the relationship is non-linear.
Further investigation would be needed to understand the context of these variables and dimensions and to determine the practical implications of these correlations. For example, if these variables represent financial indicators, the correlations could be used to identify investment opportunities or to assess risk.
</details>
(a) GRPO
<details>
<summary>x5.png Details</summary>
### Visual Description
\n
## Data Table: Correlation Matrix
### Overview
The image presents a data table representing a correlation matrix. The table displays the correlation coefficients between seven variables labeled A through G, and seven variables labeled A through G. The values range from 0 to 1, indicating the strength and direction of the linear relationship between each pair of variables.
### Components/Axes
* **Rows:** Represented by variables A, B, C, D, E, F, G.
* **Columns:** Represented by variables A, B, C, D, E, F, G.
* **Cells:** Contain the correlation coefficients between the corresponding row and column variables.
* **Values:** Numerical values ranging from 0 to 1, representing correlation coefficients.
### Detailed Analysis or Content Details
The table can be reconstructed as follows:
| | A | B | C | D | E | F | G |
| :---- | :---- | :---- | :---- | :---- | :---- | :---- | :---- |
| **A** | 1 | 1 | 1 | 1 | 0.75 | 0.5 | 1 |
| **B** | 1 | 0.5 | 0.5 | 0.5 | 0.5 | 0.5 | 1 |
| **C** | 1 | 0.5 | 0.5 | 0.5 | 0.5 | 0.5 | 0.5 |
| **D** | 1 | 0.25 | 0.5 | 0 | 0 | 0 | 0 |
| **E** | 0 | 0 | 0.5 | 0.5 | 0.5 | 0.5 | 0.5 |
| **F** | 0.25 | 0.25 | 0.25 | 0.74 | 0.49 | 0.49 | 0.49 |
| **G** | 0.98 | 0.73 | 0.96 | 0.96 | 0.46 | 0.46 | 0.5 |
**Specific Observations:**
* **Row A:** Shows strong positive correlations with variables A, B, C, D, and G (values of 1 or close to 1). Moderate correlation with E (0.75) and a weaker correlation with F (0.5).
* **Row B:** Shows a strong correlation with A and G (value of 1). Moderate correlation with C, D, E, and F (value of 0.5).
* **Row C:** Shows a strong correlation with A, B, and C (value of 1). Moderate correlation with D, E, F, and G (value of 0.5).
* **Row D:** Shows a strong correlation with A and C (value of 1). Moderate correlation with B (value of 0.25). No correlation with E, F, and G (value of 0).
* **Row E:** Shows no correlation with A, B, and D (value of 0). Moderate correlation with C, F, and G (value of 0.5).
* **Row F:** Shows weak correlations across all variables, ranging from 0.25 to 0.74.
* **Row G:** Shows strong positive correlations with A, C, and D (values close to 1). Moderate correlation with B (0.73) and weaker correlations with E and F (0.46).
### Key Observations
* Variables A, B, and C exhibit very high correlations with each other, suggesting they are likely measuring similar underlying phenomena.
* Variable D appears to be strongly related to A and C, but largely independent of E, F, and G.
* Variable F shows the weakest and most inconsistent correlations, suggesting it may be less related to the other variables.
* Variable G is strongly correlated with A, C, and D, but has a moderate correlation with B and weaker correlations with E and F.
### Interpretation
This correlation matrix suggests a complex interplay between the seven variables. The strong correlations between A, B, and C indicate a shared underlying factor or process. The relatively independent behavior of D and F suggests they represent distinct aspects of the system being studied. The moderate correlations involving G suggest it is influenced by multiple factors.
The matrix provides a quantitative measure of the linear relationships between the variables, which can be used to inform further analysis, such as dimensionality reduction or regression modeling. The presence of both strong and weak correlations highlights the need for a nuanced understanding of the relationships between these variables. The matrix does not imply causation, only association. Further investigation would be needed to determine the underlying mechanisms driving these correlations.
</details>
(b) Guided GRPO
Figure 4: Reward of Guided GRPO. We fine-tuned Qwen3-1.7B on coding tasks, using 10 roll-outs and generating 280 candidates per batch. The candidates’ rewards form a 20x14 matrix. We then applied 2x2 average pooling, reducing it to a 10x7 matrix for clearer visualization. The results demonstrate that when configured with an optimal guidance ratio, G 2 RPO-A enables the model to sample candidates that yield a significantly denser reward signal.
| MATH500 $\ell=50$ $\ell=100$ | $\alpha=\frac{5}{6}$ $66.80$ $65.20$ | $\alpha=\frac{3}{6}$ $66.00$ $63.00$ | $\alpha=\frac{1}{6}$ $67.20$ $66.20$ | $\alpha=1$ $65.10$ $64.70$ |
| --- | --- | --- | --- | --- |
| $\ell=200$ | $57.60$ | $52.40$ | $62.00$ | $59.30$ |
| $\ell=500$ | $57.80$ | $62.00$ | $68.20$ | $55.80$ |
| $\ell=0$ | 62.00 | | | |
Table 1: Empirical study on guidance length $\ell$ and guidance ratio $\alpha$ . We use the Qwen2.5-Math-7B as the backbone.
4.2 Optimizing Guided GRPO Design
In this section, we thoroughly examine optimal design choices for Guided GRPO, focusing on guidance ratio of GRPO candidate groups and adjusting guidance strength at different training stages. These investigations aim to maximize the effectiveness of the Guided GRPO and overcome the limitations observed in the naive implementation.
Inner-Group Varied Guidance Ratio.
The insufficiency of naive guidance suggests that a more nuanced approach is required. We begin by investigating the impact of the guidance ratio $\alpha$ . In each GRPO group of size $G$ , we steer only an $\alpha$ -fraction of the candidates. Let $g_{i}$ denote the guidance for the $i$ -th candidate (ordered arbitrarily), we have:
$$
|g_{i}|=0\quad(i>\alpha G),\qquad|g_{i}|=l\quad(i\leq\alpha G). \tag{3}
$$
That is, the first $\alpha G$ candidates have guidance, while the remaining $(1-\alpha)G$ candidates evolve freely. We conduct experiments on the Qwen2.5-Math-7B model Yang et al. (2024) with a roll-out number $n=6$ , training for one epoch on the s1k-1.1 dataset Muennighoff et al. (2025b). We set $\alpha∈\{1/6,...,1\}$ and $l∈\{50,100,...,500\}$ tokens, with all accuracies reported on the Math 500 benchmark. The results in Table 1 show that:
- Partial inner-group guidance improves model performance. In most settings, Guided GRPO with guidance provided to only a subset of candidates outperforms the vanilla GRPO, confirming the usefulness of the guidance mechanism.
- For Qwen2.5-Math-7B on the Math500 benchmark, the lowest guidance ratio $\alpha$ combined with a longest guidance window $\ell$ yields the best results. This suggests that Qwen2.5-Math-7B benefits from infrequent but heavyweight guidance.
In summary, selective guidance–directing only few candidates by a long guidance–strikes the best balance between exploration and control, thereby improving model performance. Moreover, the optimal guidance ratio varies with both the task domain and model capacity. As Table 8, 9 shows, smaller models and coding tasks benefit from stronger intervention, whereas larger models and math tasks achieve better results with lighter guidance.
<details>
<summary>x6.png Details</summary>
### Visual Description
\n
## Line Chart: Accuracy Reward vs. Global Step
### Overview
This image presents a line chart comparing the accuracy reward of three different algorithms – Vanilla GRPO, Naive Guided GRPO, and G²RPO-A – over a series of global steps. The chart visualizes the performance of each algorithm as it progresses, allowing for a comparison of their learning curves.
### Components/Axes
* **X-axis:** "Global step" ranging from 0 to 140, with tick marks at intervals of 20.
* **Y-axis:** "Accuracy reward" ranging from 0.0 to 0.5, with tick marks at intervals of 0.1.
* **Legend:** Located in the top-left corner, identifying the three data series:
* Vanilla GRPO (Light Blue)
* Naive Guided GRPO (Green)
* G²RPO-A (Dark Blue)
### Detailed Analysis
The chart displays three lines representing the accuracy reward for each algorithm over the global steps.
* **Vanilla GRPO (Light Blue):** The line starts at approximately 0.08 at step 0. It generally slopes upward, reaching a peak of around 0.36 at step 90. After step 90, the line declines, ending at approximately 0.05 at step 140. There are some fluctuations, with a dip around step 40 to approximately 0.16.
* **Naive Guided GRPO (Green):** This line begins at approximately 0.11 at step 0. It exhibits a more pronounced upward trend than Vanilla GRPO, peaking at around 0.42 at step 100. Following the peak, the line declines sharply, reaching approximately 0.03 at step 140.
* **G²RPO-A (Dark Blue):** The line starts at approximately 0.09 at step 0. It shows a steady increase, reaching a peak of around 0.38 at step 60, then fluctuates between 0.30 and 0.40 until step 100. After step 100, the line declines, ending at approximately 0.10 at step 140.
### Key Observations
* Naive Guided GRPO consistently outperforms Vanilla GRPO and G²RPO-A for the majority of the global steps, achieving the highest accuracy reward.
* All three algorithms exhibit a similar trend: an initial increase in accuracy reward followed by a decline after reaching a peak.
* The decline in accuracy reward is most pronounced for Naive Guided GRPO, suggesting potential overfitting or instability.
* G²RPO-A demonstrates a more stable performance compared to the other two algorithms, with less fluctuation after the initial increase.
### Interpretation
The data suggests that Naive Guided GRPO is the most effective algorithm for improving accuracy reward in the initial stages of training. However, its performance deteriorates significantly after reaching a peak, indicating a potential issue with generalization or long-term stability. Vanilla GRPO and G²RPO-A exhibit more moderate performance, with G²RPO-A showing greater stability. The decline in accuracy reward for all algorithms after a certain point could be attributed to factors such as diminishing returns, overfitting, or the exploration of less rewarding states. The chart highlights the trade-off between initial performance and long-term stability in these algorithms. Further investigation is needed to understand the reasons behind the decline in accuracy reward and to explore strategies for improving the generalization capabilities of Naive Guided GRPO.
</details>
(a) Accuracy Reward
<details>
<summary>x7.png Details</summary>
### Visual Description
## Line Chart: Advantage σ vs. Global Step
### Overview
This image presents a line chart comparing the "Advantage σ" metric across three different algorithms – Naive Guided GRPO, Vanilla GRPO, and G²RPO-A – as a function of the "Global step". The chart visualizes the performance of each algorithm over 140 global steps. A shaded region around each line indicates some measure of variance or confidence interval.
### Components/Axes
* **X-axis:** "Global step", ranging from 0 to 140.
* **Y-axis:** "Advantage σ", ranging from 0.1 to 0.8.
* **Legend:** Located in the top-left corner, identifying the three data series:
* Naive Guided GRPO (Green line)
* Vanilla GRPO (Blue line)
* G²RPO-A (Dark Blue line)
* **Shaded Regions:** Light blue shaded areas around each line, representing a confidence interval or standard deviation.
### Detailed Analysis
Let's analyze each line individually, noting trends and approximate data points.
* **Naive Guided GRPO (Green):** This line starts at approximately 0.15 at Global step 0, increases to a peak of around 0.35 at Global step 20, then gradually declines to approximately 0.25 at Global step 140. The line exhibits significant fluctuations throughout the entire range.
* **Vanilla GRPO (Blue):** This line begins at approximately 0.55 at Global step 0, increases to a peak of around 0.65 at Global step 10, then decreases to a low of approximately 0.4 at Global step 80. It then recovers to around 0.62 at Global step 140. This line also shows fluctuations, but generally remains higher than the Naive Guided GRPO line.
* **G²RPO-A (Dark Blue):** This line starts at approximately 0.58 at Global step 0, increases to a peak of around 0.73 at Global step 60, then decreases to approximately 0.68 at Global step 140. The shaded region around this line is relatively narrow, suggesting lower variance compared to the other two algorithms.
Here's a more detailed breakdown of approximate values at specific Global steps:
| Global Step | Naive Guided GRPO (σ) | Vanilla GRPO (σ) | G²RPO-A (σ) |
|-------------|------------------------|-------------------|-------------|
| 0 | 0.15 | 0.55 | 0.58 |
| 20 | 0.35 | 0.63 | 0.68 |
| 40 | 0.32 | 0.60 | 0.70 |
| 60 | 0.28 | 0.45 | 0.73 |
| 80 | 0.25 | 0.40 | 0.65 |
| 100 | 0.24 | 0.50 | 0.66 |
| 120 | 0.24 | 0.60 | 0.68 |
| 140 | 0.25 | 0.62 | 0.68 |
### Key Observations
* G²RPO-A consistently demonstrates the highest "Advantage σ" throughout the observed global steps, indicating superior performance compared to the other two algorithms.
* Vanilla GRPO initially performs well but experiences a significant drop in "Advantage σ" around Global step 60-80 before recovering.
* Naive Guided GRPO consistently exhibits the lowest "Advantage σ" and the most significant fluctuations, suggesting it is the least stable and effective algorithm.
* The shaded regions indicate that G²RPO-A has the lowest variance in its performance, while Naive Guided GRPO has the highest.
### Interpretation
The chart suggests that G²RPO-A is the most robust and effective algorithm for maximizing "Advantage σ" over the observed global steps. The consistent high performance and low variance of G²RPO-A indicate its reliability and stability. Vanilla GRPO shows promise but is susceptible to performance dips, while Naive Guided GRPO consistently underperforms and exhibits high instability.
The "Advantage σ" metric likely represents a measure of the algorithm's success in achieving a desired outcome or solving a specific problem. The "Global step" likely refers to the iteration or time step in the algorithm's execution. The shaded regions around the lines suggest that the reported "Advantage σ" values are not deterministic and may vary due to factors such as randomness or data variations.
The initial increase in "Advantage σ" for all algorithms likely represents a period of rapid learning or improvement. The subsequent fluctuations and declines may indicate convergence towards a local optimum or the influence of challenging data points. The recovery of Vanilla GRPO after Global step 80 suggests its ability to adapt and overcome obstacles.
</details>
(b) Advantage $\sigma$
Figure 5: Pitfalls of naive Guided GRPO. We trained Qwen3-1.7B-Base on a curriculum-ordered subset of Math-220K Wang et al. (2024): problems are presented from easy to hard. Because the curriculum continually increases task difficulty, the accuracy reward does not plateau at a high level–an expected outcome of the CL schedule. This training dynamic indicates that the advantage standard deviation is extremely low under the naive guidance condition, a situation that negatively impacts training efficiency for SLMs.
| $\ell=50$ , $\alpha=0.8333$ $\ell=100$ , $\alpha=0.1667$ $\ell=200$ , $\alpha=0.8333$ | 63.80 60.60 66.60 | 58.40 62.00 54.20 | 57.60 66.20 58.40 |
| --- | --- | --- | --- |
| $\ell=200$ , $\alpha=0.1667$ | 61.20 | 64.20 | 59.60 |
| $\ell=500$ , $\alpha=0.1667$ | 59.60 | 69.80 | 62.40 |
| $\ell=0$ | 62.00 | | |
Table 2: Performance of Guided GRPO under different guidance-length adjustment policies. We train Qwen2.5-Math-7B and evaluate it on the MATH 500 benchmark. For each guidance-length schedule, we report the results obtained with the guidance ratio that achieves the highest score in Table 1.
| Base Model Qwen3-0.6B-Base Minerva | $\alpha$ 0.75 11.43 | Benchmark MATH500 9.57 | Base 40.18 10.40 | GRPO 54.26 12.29 | SFT 50.53 | G 2 RPO-A 51.77 | |
| --- | --- | --- | --- | --- | --- | --- | --- |
| gpqa | 25.49 | 24.51 | 25.49 | 30.39 | | | |
| Qwen3-1.7B-Base | 0.25 | MATH500 | 50.96 | 63.74 | 62.11 | 67.21 | |
| Minerva | 13.84 | 16.19 | 18.89 | 15.10 | | | |
| gpqa | 27.45 | 29.41 | 24.51 | 32.35 | | | |
| Qwen3-8B-Base | 0.14 | MATH500 | 71.32 | 79.49 | 80.29 | 82.08 | |
| Minerva | 33.24 | 37.51 | 36.60 | 36.42 | | | |
| gpqa | 43.17 | 44.13 | 42.85 | 49.72 | | | |
Table 3: Performance of G 2 RPO-A on Math Tasks. We report accuracy (%) on various benchmarks. Models are trained for 5 epochs, and guidance ratios are selected based on the best settings obtained from Table 9.
| Qwen3-0.6B Minerva gpqa | 0.75 12.32 24.51 | MATH500 20.59 25.45 | 76.20 21.57 26.43 | 85.37 | 87.15 |
| --- | --- | --- | --- | --- | --- |
| AIME24 | 10.00 | 6.67 | 10.00 | | |
| AIME25 | 13.33 | 20.00 | 23.33 | | |
| Qwen3-1.7B | 0.25 | MATH500 | 92.71 | 94.52 | 91.69 |
| Minerva | 33.16 | 35.38 | 38.26 | | |
| gpqa | 48.23 | 51.68 | 55.27 | | |
| AIME24 | 46.67 | 56.67 | 63.33 | | |
| AIME25 | 36.67 | 50.00 | 53.33 | | |
Table 4: Performance of G 2 RPO-A on Math Tasks. The experiment settings are the same with Table 3. However, we use extra benchmarks like AIME24 and AIME25 here due to the stronger model performances.
Time Varied Guidance Length.
Apart from the guidance ratio, Table 1 shows that performance also depends on the guidance length $\ell$ . To investigate this further, we evaluate guided GRPO by varying the guidance length during training under three strategies. Those are:
$$
\displaystyle\text{Concave decay:}\quad\ell_{t} \displaystyle=\ell_{0}\Bigl{(}1-\tfrac{t}{T}\Bigr{)}^{\beta}\, \displaystyle\text{Linear decay:}\quad\ell_{t} \displaystyle=\ell_{0}\Bigl{(}1-\tfrac{t}{T}\Bigr{)}\, \displaystyle\text{Stepwise decay:}\quad\ell_{t} \displaystyle=\ell_{0}\,\gamma^{\lfloor t/s\rfloor}\,, \tag{4}
$$
where $T$ is the total training steps, and $\ell_{0}$ is the initial guidance length. The parameter $\beta∈(1,∞]$ controls the concavity, and $\gamma∈(0,1)$ sets the decay rate, and $s$ specifies the decay interval.
We use the same experiment setting as in Table 1, and choose the guidance ratio that performs the best. The results are reported in Table 2. The results indicate that (1) model quality is highly sensitive to the chosen guidance length $\ell_{t}$ , and (2) no single schedule consistently outperforms the others. This highlights the need for more effective methods of controlling guidance length.
4.3 G 2 RPO-A: Sampling Difficulty Motivated Adaptive Guidance
In this section, we propose an adaptive algorithm that automatically selects the guidance strength $\ell$ at every optimization step. Our approach is inspired by recent work on data filtering and sampling (Bae et al., 2025; Xiong et al., 2025; Shi et al., 2025) , which removes examples that yield uniformly low or uniformly high rewards. Such “uninformative” samples–being either too easy or too hard–contribute little to learning and can even destabilize training. The pseudo-code can be found in Appendix.
Guidance length adjustment.
Our key idea is to control the difficulty of training samples by dynamically adjusting the guidance length, taking into account the ongoing training states. At each training step $k$ , the guidance $\ell_{k+1}$ is determined by the following equation:
$$
\ell_{k+1}=\ell_{k}\cdot\frac{\text{min}(\mathcal{T},k)r_{k}}{\sum_{\tau=1}^{\text{min}(\mathcal{T},k)}r_{k-\tau}}, \tag{5}
$$
where $r_{k}$ is the average reward of the $k$ -th training step, $\mathcal{T}$ is a hyperparameter that controls the number of history steps we considered, and we found that setting $\mathcal{T}=2$ is already sufficient for noticeably improving Guided GRPO performance (Table 10, 11).
Equation 5 implies the following dynamics:
- When recent rewards rise, $\ell_{k}$ is reduced, making the next batch of examples harder.
- When recent rewards fall, $\ell_{k}$ is increased, making the next batch easier.
Thus, the training difficulty is automatically and continuously adjusted to match the model’s current competence.
| Base Model Qwen3-0.6B | Guidance Ratio 0.75 | Benchmark-humaneval | Base Perf. 32.32 | GRPO 38.89 | SFT 40.33 | G 2 RPO-A 44.96 | |
| --- | --- | --- | --- | --- | --- | --- | --- |
| Live Code bench | 17.07 | 22.22 | 13.58 | 23.14 | | | |
| Qwen3-1.7B | 1 | humaneval | 46.08 | 67.65 | 63.34 | 75.93 | |
| Live Code bench | 34.31 | 53.14 | 56.33 | 51.96 | | | |
| Qwen3-8B | 0.57 | humaneval | 64.36 | 81.48 | 77.42 | 80.33 | |
| Live Code bench | 60.58 | 77.12 | 63.82 | 79.71 | | | |
Table 5: Performance of G 2 RPO-A on Code Tasks. We report accuracy (%) on various benchmarks. Models are trained for 5 epochs, and guidance ratios are selected based on the best settings obtained from Table 8.
Curriculum learning for further improvements.
Equation 5 shows that the adaptive guidance-length controller updates $\ell$ by comparing the current reward with rewards from previous steps. When consecutive batches differ markedly in difficulty, these reward variations no longer reflect the model’s true learning progress, which in turn degrades G 2 RPO-A ’s performance.
| Qwen3-1.7-Base | Random GRPO | CL G 2 RPO-A | GRPO | G 2 RPO-A |
| --- | --- | --- | --- | --- |
| MATH500 | 53.81 | 57.67 | 52.05 | 58.94 |
| Minarva | 12.41 | 15.12 | 14.98 | 16.69 |
| gpqa | 24.79 | 23.53 | 27.45 | 25.49 |
| Qwen3-0.6B-Base | | | | |
| Math 500 | 43.25 | 50.72 | 48.16 | 53.59 |
| Minarva | 11.04 | 11.21 | 9.66 | 10.08 |
| gpqa | 23.1 | 25.49 | 24.51 | 32.35 |
Table 6: Comparison of training with random order and curriculum learning (CL) order across different models and benchmarks.
| Remove Replace Original | 76.74 88.37 86.05 | 71.11 75.56 77.77 | 50.00 54.00 60.00 | 35.00 37.00 43.00 | 24.00 18.00 28.00 |
| --- | --- | --- | --- | --- | --- |
Table 7: Performance of GRPO with different sample-filtering methods. We train Qwen3-1.7B model using G 2 RPO-A, with $\alpha=0.25$ . In the Remove setting all hard samples are excluded from the original dataset, whereas in the Replace setting each hard sample is substituted with a sample of moderate difficulty.
To eliminate this mismatch, we embed a curriculum-learning (CL) strategy Parashar et al. (2025); Shi et al. (2025); Zhou et al. (2025). Concretely, we sort the samples by difficulty. Using math task as an example, we rank examples by source, yielding five ascending difficulty tiers: cn_contest, aops_forum, amc_aime, olympiads, and olympiads_ref. We also tested ADARFT Shi et al. (2025), which orders samples by success rate, but its buckets proved uninformative in our cases—most questions were either trivial or impossible (see Appendix Figure 6)—so it failed to separate difficulty levels effectively. Table 6 shows that both the performance of vanilla GRPO and G 2 RPO-A boosted by CL.
Compare G 2 RPO-A to sample-filtering methods.
Earlier work argues that policy-gradient training benefits most from mid-level queries. Bae et al. (2025) keep only moderate-difficulty batches via an online filter, and Reinforce-Rej Xiong et al. (2025) discards both the easiest and hardest examples to preserve batch quality. Our experiments show that this exclusion is counter-productive: removing hard problems deprives the model of vital learning signals and lowers accuracy on challenging tasks. Table 7 confirms that either dropping hard items or substituting them with moderate ones reduces Level 4 and 5 test accuracy. G 2 RPO-A avoids this pitfall by retaining tough examples and attaching adaptive guidance to them, thus exploiting the full difficulty spectrum without sacrificing performance.
5 Experiments
| humaneval LCB Qwen3-0.6B | 68.52 28.43 $\alpha=0$ | 59.88 19.61 $\alpha=\frac{1}{4}$ | 64.81 23.53 $\alpha=\frac{2}{4}$ | 72.22 30.39 $\alpha=\frac{3}{4}$ | 70.81 35.72 $\alpha=1$ |
| --- | --- | --- | --- | --- | --- |
| humaneval | 41.98 | 32.10 | 27.72 | 38.89 | 49.38 |
| LCB | 12.75 | 11.76 | 9.80 | 18.63 | 12.75 |
Table 8: Ablation studies on guidance ratio $\alpha$ for Code Tasks. The group size is set to 12. The initial guidance length for G 2 RPO-A is set to 3072. The LCB indicates Live Code Bench.
| MATH500 Minerva gpqa | 52.05 14.98 27.45 | 58.71 16.69 25.49 | 53.09 16.25 30.39 | 55.53 18.21 25.49 | 45.95 16.11 22.55 |
| --- | --- | --- | --- | --- | --- |
| Qwen3-0.6B-Base | | | | | |
| MATH500 | 48.16 | 49.59 | 50.94 | 53.50 | 38.42 |
| Minerva | 9.66 | 9.10 | 8.96 | 10.08 | 15.69 |
| gpqa | 24.51 | 19.61 | 31.37 | 32.35 | 25.49 |
Table 9: Ablation studies on guidance ratio $\alpha$ for Math Tasks. The group size is set to 12. The initial guidance length for G 2 RPO-A is set to 3072.
| Qwen3-1.7B-Base | GRPO 3072 | Fixed Guidance 2048 | RDP 1024 | G 2 RPO-A | | |
| --- | --- | --- | --- | --- | --- | --- |
| MATH500 | 52.05 | 51.28 | 60.52 | 46.78 | 51.02 | 58.71 |
| Minerva | 14.98 | 14.40 | 17.16 | 12.22 | 17.99 | 22.46 |
| gpqa | 27.45 | 25.00 | 24.51 | 23.53 | 22.13 | 25.49 |
| Qwen3-0.6B-Base | | | | | | |
| MATH500 | 48.16 | 55.80 | 54.17 | 52.69 | 55.97 | 53.50 |
| Minerva | 9.66 | 13.27 | 15.26 | 11.78 | 14.32 | 15.69 |
| gpqa | 24.51 | 24.00 | 21.57 | 22.55 | 26.00 | 32.35 |
Table 10: Guidance-length ablation on Math Tasks. Each run uses the optimal guidance ratio reported in Table 9. The initial guidance budget for G 2 RPO-A is fixed at 3,072 tokens. RDP refers to the rule-based decay policy.
5.1 Experiment Settings
In this section, we outline the experiment settings we used, and more details about dataset filtering methods and evaluation on more models can be found in Appendix.
Datasets and models.
We conduct experiments on math and code tasks. In detail,
- Mathematical reasoning tasks. We construct a clean subset of the Open-R1 math-220k corpus Wang et al. (2024). Problems are kept only if their solution trajectories are (i) complete, (ii) factually correct, and (iii) syntactically parsable.
- Code generation. For programming experiments we adopt the Verifiable-Coding-Problems-Python benchmark from Open-R1. For every problem we automatically generate a chain-of-thought with QWQ-32B-preview Team (2024). These traces are later used as guidance by our proposed G 2 RPO-A training procedure.
We use Qwen3 series Yang et al. (2025a) for both tasks. Results of DeepSeek-Math-7B-Base Shao et al. (2024) for math and DeepSeek-Coder-6.7B-Base Guo et al. (2024) for code also included in Appendix. Unless specifically mentioned, CL is used for all experiments for fair comparison, and we also conducted ablation studies in Table 6.
Evaluation protocol.
We assess our models mainly on three public mathematical–reasoning benchmarks— Math500 Hendrycks et al. (2021), Minerva-Math Lewkowycz et al. (2022), and GPQA Rein et al. (2024). For the mathematical training of Qwen3-1.7B and Qwen3-0.6B, AIME24 Li et al. (2024) and AIME25 benchmarks are also used. And for code tasks, we use two benchmarks: humaneval Chen et al. (2021) and Live Code Bench Jain et al. (2024). Decoding hyper-parameters are fixed to: temperature $=0.6$ , $\mathrm{top}\text{-}p=0.95$ , and $\mathrm{top}\text{-}k=20$ . Unless otherwise noted, we generate with a batch size of $128$ and permit a token budget between $1{,}024$ and $25{,}000$ , based on each model’s context window.
Training details.
Our G 2 RPO-A algorithm is implemented on top of the fully open-source Open-R1 framework Face (2025). We use the following hyper-parameters: (i) number of roll-outs per sample set to $12$ for 0.6B and 1.7B backbones, and $7$ for 7B and 8B backbones; (ii) initial learning rate $1× 10^{-6}$ , decayed with a cosine schedule and a warm-up ratio of $0.1$ ; (iii) a training set of $1{,}000$ problems for $5$ epochs. Note that for ablation experiments, only 1 epoch is implemented in our training. (iv) All models are trained on 8 A100 GPUs.
5.2 Numerical Results
Superior performance of G 2 RPO-A.
As reported in Table 3, 4, and 5, (i) our proposed G 2 RPO-A markedly surpasses vanilla GRPO on nearly every benchmark, and (ii) all RL-based methods outperform both the frozen base checkpoints and their SFT variants, mirroring trends previously observed in the literature.
Effect of the guidance ratio $\boldsymbol{\alpha}$ .
Table 8, 9 show that (1) larger models benefit from weaker guidance—e.g., Qwen3-1.7B peaks at $\alpha{=}0.25/0.5$ on Math, whereas the smaller Qwen3-0.6B prefers $\alpha{=}0.75$ ; (2) Code tasks consistently require a higher guidance ratio than Math.
Ablation on guidance–length schedules.
Table 10, 11 contrast our adaptive scheme (G 2 RPO-A) with (i) fixed guidance and (ii) a rule-based decay policy (RDP). (1) G 2 RPO-A achieves the best score on almost every model–benchmark pair, confirming the benefit of on-the-fly adjustment. (2) For fixed guidance, the optimal value varies across both tasks and model sizes, with no clear global pattern, underscoring the need for an adaptive mechanism such as G 2 RPO-A.
| | GRPO | Fixed Guidance | RDP | G 2 RPO-A | | |
| --- | --- | --- | --- | --- | --- | --- |
| 3072 | 2048 | 1024 | | | | |
| Qwen3-1.7B | | | | | | |
| humaneval | 68.52 | 58.64 | 58.02 | 60.49 | 69.29 | 70.81 |
| LCB | 23.53 | 29.41 | 28.43 | 31.37 | 26.47 | 35.72 |
| Qwen3-0.6B | | | | | | |
| humaneval | 38.89 | 43.93 | 36.54 | 38.40 | 42.27 | 49.38 |
| LCB | 12.75 | 13.73 | 10.78 | 9.80 | 11.67 | 12.75 |
Table 11: Guidance-length ablation on Code Tasks. Each run uses the optimal guidance ratio reported in Table 8. The initial guidance budget for G 2 RPO-A is fixed at 3,072 tokens. RDP refers to the rule-based decay policy.
6 Conclusion and Future Work
We introduce a method that injects ground-truth guidance into the thinking trajectories produced during GRPO roll-outs, thereby improving the performance of small-scale LLMs. After an extensive study of guidance configurations, we observe that the guidance ratio is significant in guidance mechanism and the optimal guidance length is context-dependent and, based on this, we develop G 2 RPO-A, an auto-tuned approach. Experiments on mathematical reasoning and code generation demonstrate that G 2 RPO-A consistently boosts accuracy. In future work, we plan to evaluate G 2 RPO-A across a broader range of tasks and model architectures, which we believe will further benefit the community.
References
- Bae et al. [2025] Sanghwan Bae, Jiwoo Hong, Min Young Lee, Hanbyul Kim, JeongYeon Nam, and Donghyun Kwak. Online difficulty filtering for reasoning oriented reinforcement learning, 2025. URL https://arxiv.org/abs/2504.03380.
- Chen et al. [2021] Mark Chen, Jerry Tworek, Heewoo Jun, Qiming Yuan, Henrique Ponde de Oliveira Pinto, Jared Kaplan, Harri Edwards, Yuri Burda, Nicholas Joseph, Greg Brockman, Alex Ray, Raul Puri, Gretchen Krueger, Michael Petrov, Heidy Khlaaf, Girish Sastry, Pamela Mishkin, Brooke Chan, Scott Gray, Nick Ryder, Mikhail Pavlov, Alethea Power, Lukasz Kaiser, Mohammad Bavarian, Clemens Winter, Philippe Tillet, Felipe Petroski Such, Dave Cummings, Matthias Plappert, Fotios Chantzis, Elizabeth Barnes, Ariel Herbert-Voss, William Hebgen Guss, Alex Nichol, Alex Paino, Nikolas Tezak, Jie Tang, Igor Babuschkin, Suchir Balaji, Shantanu Jain, William Saunders, Christopher Hesse, Andrew N. Carr, Jan Leike, Josh Achiam, Vedant Misra, Evan Morikawa, Alec Radford, Matthew Knight, Miles Brundage, Mira Murati, Katie Mayer, Peter Welinder, Bob McGrew, Dario Amodei, Sam McCandlish, Ilya Sutskever, and Wojciech Zaremba. Evaluating large language models trained on code, 2021. URL https://arxiv.org/abs/2107.03374.
- Chu et al. [2025] Tianzhe Chu, Yuexiang Zhai, Jihan Yang, Shengbang Tong, Saining Xie, Sergey Levine, and Yi Ma. SFT memorizes, RL generalizes: A comparative study of foundation model post-training. In The Second Conference on Parsimony and Learning (Recent Spotlight Track), 2025. URL https://openreview.net/forum?id=d3E3LWmTar.
- Cui et al. [2025] Ganqu Cui, Lifan Yuan, Zefan Wang, Hanbin Wang, Wendi Li, Bingxiang He, Yuchen Fan, Tianyu Yu, Qixin Xu, Weize Chen, et al. Process reinforcement through implicit rewards. CoRR, 2025.
- Dang and Ngo [2025] Quy-Anh Dang and Chris Ngo. Reinforcement learning for reasoning in small llms: What works and what doesn’t, 2025. URL https://arxiv.org/abs/2503.16219.
- Face [2025] Hugging Face. Open r1: A fully open reproduction of deepseek-r1, January 2025. URL https://github.com/huggingface/open-r1.
- Guan et al. [2025] Xinyu Guan, Li Lyna Zhang, Yifei Liu, Ning Shang, Youran Sun, Yi Zhu, Fan Yang, and Mao Yang. rstar-math: Small LLMs can master math reasoning with self-evolved deep thinking. In Forty-second International Conference on Machine Learning, 2025. URL https://openreview.net/forum?id=5zwF1GizFa.
- Guo et al. [2024] Daya Guo, Qihao Zhu, Dejian Yang, Zhenda Xie, Kai Dong, Wentao Zhang, Guanting Chen, Xiao Bi, Y Wu, YK Li, et al. Deepseek-coder: When the large language model meets programming-the rise of code intelligence. CoRR, 2024.
- Guo et al. [2025] Daya Guo, Dejian Yang, Haowei Zhang, Junxiao Song, Ruoyu Zhang, Runxin Xu, Qihao Zhu, Shirong Ma, Peiyi Wang, Xiao Bi, et al. Deepseek-r1: Incentivizing reasoning capability in llms via reinforcement learning. arXiv preprint arXiv:2501.12948, 2025.
- Hendrycks et al. [2021] Dan Hendrycks, Collin Burns, Saurav Kadavath, Akul Arora, Steven Basart, Eric Tang, Dawn Song, and Jacob Steinhardt. Measuring mathematical problem solving with the MATH dataset. In Thirty-fifth Conference on Neural Information Processing Systems Datasets and Benchmarks Track, 2021. URL https://openreview.net/forum?id=7Bywt2mQsCe.
- HUANG et al. [2025] Dong HUANG, Guangtao Zeng, Jianbo Dai, Meng Luo, Han Weng, Yuhao QING, Heming Cui, Zhijiang Guo, and Jie Zhang. Efficoder: Enhancing code generation in large language models through efficiency-aware fine-tuning. In Forty-second International Conference on Machine Learning, 2025. URL https://openreview.net/forum?id=8bgaOg1TlZ.
- Huang et al. [2025] Qihan Huang, Weilong Dai, Jinlong Liu, Wanggui He, Hao Jiang, Mingli Song, Jingyuan Chen, Chang Yao, and Jie Song. Boosting mllm reasoning with text-debiased hint-grpo, 2025. URL https://arxiv.org/abs/2503.23905.
- Jaech et al. [2024] Aaron Jaech, Adam Kalai, Adam Lerer, Adam Richardson, Ahmed El-Kishky, Aiden Low, Alec Helyar, Aleksander Madry, Alex Beutel, Alex Carney, et al. Openai o1 system card. CoRR, 2024.
- Jain et al. [2024] Naman Jain, King Han, Alex Gu, Wen-Ding Li, Fanjia Yan, Tianjun Zhang, Sida Wang, Armando Solar-Lezama, Koushik Sen, and Ion Stoica. Livecodebench: Holistic and contamination free evaluation of large language models for code. CoRR, 2024.
- Jia et al. [2025] Ruipeng Jia, Yunyi Yang, Yongbo Gai, Kai Luo, Shihao Huang, Jianhe Lin, Xiaoxi Jiang, and Guanjun Jiang. Writing-zero: Bridge the gap between non-verifiable tasks and verifiable rewards, 2025. URL https://arxiv.org/abs/2506.00103.
- Kojima et al. [2022] Takeshi Kojima, Shixiang Shane Gu, Machel Reid, Yutaka Matsuo, and Yusuke Iwasawa. Large language models are zero-shot reasoners. Advances in neural information processing systems, 35:22199–22213, 2022.
- Lee et al. [2024] Jung Hyun Lee, June Yong Yang, Byeongho Heo, Dongyoon Han, and Kang Min Yoo. Token-supervised value models for enhancing mathematical reasoning capabilities of large language models. CoRR, 2024.
- Lewkowycz et al. [2022] Aitor Lewkowycz, Anders Johan Andreassen, David Dohan, Ethan Dyer, Henryk Michalewski, Vinay Venkatesh Ramasesh, Ambrose Slone, Cem Anil, Imanol Schlag, Theo Gutman-Solo, Yuhuai Wu, Behnam Neyshabur, Guy Gur-Ari, and Vedant Misra. Solving quantitative reasoning problems with language models. In Alice H. Oh, Alekh Agarwal, Danielle Belgrave, and Kyunghyun Cho, editors, Advances in Neural Information Processing Systems, 2022. URL https://openreview.net/forum?id=IFXTZERXdM7.
- Li et al. [2025a] Chen Li, Nazhou Liu, and Kai Yang. Adaptive group policy optimization: Towards stable training and token-efficient reasoning. arXiv preprint arXiv:2503.15952, 2025a.
- Li et al. [2024] Jia Li, Edward Beeching, Lewis Tunstall, Ben Lipkin, Roman Soletskyi, Shengyi Huang, Kashif Rasul, Longhui Yu, Albert Q Jiang, Ziju Shen, et al. Numinamath: The largest public dataset in ai4maths with 860k pairs of competition math problems and solutions, 2024.
- Li et al. [2025b] Xuefeng Li, Haoyang Zou, and Pengfei Liu. Torl: Scaling tool-integrated rl. arXiv preprint arXiv:2503.23383, 2025b.
- Lin et al. [2025] Zhihang Lin, Mingbao Lin, Yuan Xie, and Rongrong Ji. Cppo: Accelerating the training of group relative policy optimization-based reasoning models, 2025. URL https://arxiv.org/abs/2503.22342.
- Liu et al. [2025] Zichen Liu, Changyu Chen, Wenjun Li, Penghui Qi, Tianyu Pang, Chao Du, Wee Sun Lee, and Min Lin. Understanding r1-zero-like training: A critical perspective, 2025. URL https://arxiv.org/abs/2503.20783.
- Lu et al. [2024] Zhenyan Lu, Xiang Li, Dongqi Cai, Rongjie Yi, Fangming Liu, Xiwen Zhang, Nicholas D Lane, and Mengwei Xu. Small language models: Survey, measurements, and insights. CoRR, 2024.
- Muennighoff et al. [2025a] Niklas Muennighoff, Zitong Yang, Weijia Shi, Xiang Lisa Li, Li Fei-Fei, Hannaneh Hajishirzi, Luke Zettlemoyer, Percy Liang, Emmanuel Candes, and Tatsunori Hashimoto. s1: Simple test-time scaling. In Workshop on Reasoning and Planning for Large Language Models, 2025a. URL https://openreview.net/forum?id=LdH0vrgAHm.
- Muennighoff et al. [2025b] Niklas Muennighoff, Zitong Yang, Weijia Shi, Xiang Lisa Li, Li Fei-Fei, Hannaneh Hajishirzi, Luke Zettlemoyer, Percy Liang, Emmanuel Candès, and Tatsunori Hashimoto. s1: Simple test-time scaling, 2025b. URL https://arxiv.org/abs/2501.19393.
- Nath et al. [2025] Vaskar Nath, Elaine Lau, Anisha Gunjal, Manasi Sharma, Nikhil Baharte, and Sean Hendryx. Adaptive guidance accelerates reinforcement learning of reasoning models, 2025. URL https://arxiv.org/abs/2506.13923.
- Nguyen et al. [2024] Chien Van Nguyen, Xuan Shen, Ryan Aponte, Yu Xia, Samyadeep Basu, Zhengmian Hu, Jian Chen, Mihir Parmar, Sasidhar Kunapuli, Joe Barrow, Junda Wu, Ashish Singh, Yu Wang, Jiuxiang Gu, Franck Dernoncourt, Nesreen K. Ahmed, Nedim Lipka, Ruiyi Zhang, Xiang Chen, Tong Yu, Sungchul Kim, Hanieh Deilamsalehy, Namyong Park, Mike Rimer, Zhehao Zhang, Huanrui Yang, Ryan A. Rossi, and Thien Huu Nguyen. A survey of small language models, 2024. URL https://arxiv.org/abs/2410.20011.
- Parashar et al. [2025] Shubham Parashar, Shurui Gui, Xiner Li, Hongyi Ling, Sushil Vemuri, Blake Olson, Eric Li, Yu Zhang, James Caverlee, Dileep Kalathil, and Shuiwang Ji. Curriculum reinforcement learning from easy to hard tasks improves llm reasoning, 2025. URL https://arxiv.org/abs/2506.06632.
- Park et al. [2025] Jinyoung Park, Jeehye Na, Jinyoung Kim, and Hyunwoo J. Kim. Deepvideo-r1: Video reinforcement fine-tuning via difficulty-aware regressive grpo, 2025. URL https://arxiv.org/abs/2506.07464.
- Rein et al. [2024] David Rein, Betty Li Hou, Asa Cooper Stickland, Jackson Petty, Richard Yuanzhe Pang, Julien Dirani, Julian Michael, and Samuel R Bowman. Gpqa: A graduate-level google-proof q&a benchmark. In First Conference on Language Modeling, 2024.
- Schulman et al. [2017] John Schulman, Filip Wolski, Prafulla Dhariwal, Alec Radford, and Oleg Klimov. Proximal policy optimization algorithms, 2017. URL https://arxiv.org/abs/1707.06347.
- Shao et al. [2024] Zhihong Shao, Peiyi Wang, Qihao Zhu, Runxin Xu, Junxiao Song, Xiao Bi, Haowei Zhang, Mingchuan Zhang, Y. K. Li, Y. Wu, and Daya Guo. Deepseekmath: Pushing the limits of mathematical reasoning in open language models, 2024. URL https://arxiv.org/abs/2402.03300.
- Shi et al. [2025] Taiwei Shi, Yiyang Wu, Linxin Song, Tianyi Zhou, and Jieyu Zhao. Efficient reinforcement finetuning via adaptive curriculum learning, 2025. URL https://arxiv.org/abs/2504.05520.
- Souza et al. [2025] Débora Souza, Rohit Gheyi, Lucas Albuquerque, Gustavo Soares, and Márcio Ribeiro. Code generation with small language models: A deep evaluation on codeforces, 2025. URL https://arxiv.org/abs/2504.07343.
- Team [2024] Qwen Team. Qwq: Reflect deeply on the boundaries of the unknown. Hugging Face, 2024.
- Wang et al. [2024] Jun Wang, Meng Fang, Ziyu Wan, Muning Wen, Jiachen Zhu, Anjie Liu, Ziqin Gong, Yan Song, Lei Chen, Lionel M. Ni, Linyi Yang, Ying Wen, and Weinan Zhang. Openr: An open source framework for advanced reasoning with large language models, 2024. URL https://arxiv.org/abs/2410.09671.
- Wei et al. [2022] Jason Wei, Xuezhi Wang, Dale Schuurmans, Maarten Bosma, brian ichter, Fei Xia, Ed Chi, Quoc V Le, and Denny Zhou. Chain-of-thought prompting elicits reasoning in large language models. In S. Koyejo, S. Mohamed, A. Agarwal, D. Belgrave, K. Cho, and A. Oh, editors, Advances in Neural Information Processing Systems, volume 35, pages 24824–24837. Curran Associates, Inc., 2022. URL https://proceedings.neurips.cc/paper_files/paper/2022/file/9d5609613524ecf4f15af0f7b31abca4-Paper-Conference.pdf.
- Wei et al. [2025] Yuxiang Wei, Olivier Duchenne, Jade Copet, Quentin Carbonneaux, Lingming Zhang, Daniel Fried, Gabriel Synnaeve, Rishabh Singh, and Sida I Wang. Swe-rl: Advancing llm reasoning via reinforcement learning on open software evolution. arXiv preprint arXiv:2502.18449, 2025.
- Wen et al. [2025] Xumeng Wen, Zihan Liu, Shun Zheng, Zhijian Xu, Shengyu Ye, Zhirong Wu, Xiao Liang, Yang Wang, Junjie Li, Ziming Miao, Jiang Bian, and Mao Yang. Reinforcement learning with verifiable rewards implicitly incentivizes correct reasoning in base llms, 2025. URL https://arxiv.org/abs/2506.14245.
- Wu et al. [2025] Jialong Wu, Shaofeng Yin, Ningya Feng, and Mingsheng Long. Rlvr-world: Training world models with reinforcement learning, 2025. URL https://arxiv.org/abs/2505.13934.
- Xiong et al. [2025] Wei Xiong, Jiarui Yao, Yuhui Xu, Bo Pang, Lei Wang, Doyen Sahoo, Junnan Li, Nan Jiang, Tong Zhang, Caiming Xiong, and Hanze Dong. A minimalist approach to llm reasoning: from rejection sampling to reinforce, 2025. URL https://arxiv.org/abs/2504.11343.
- Xu et al. [2025] Haoran Xu, Baolin Peng, Hany Awadalla, Dongdong Chen, Yen-Chun Chen, Mei Gao, Young Jin Kim, Yunsheng Li, Liliang Ren, Yelong Shen, Shuohang Wang, Weijian Xu, Jianfeng Gao, and Weizhu Chen. Phi-4-mini-reasoning: Exploring the limits of small reasoning language models in math, 2025. URL https://arxiv.org/abs/2504.21233.
- Yang et al. [2024] An Yang, Beichen Zhang, Binyuan Hui, Bofei Gao, Bowen Yu, Chengpeng Li, Dayiheng Liu, Jianhong Tu, Jingren Zhou, Junyang Lin, et al. Qwen2. 5-math technical report: Toward mathematical expert model via self-improvement. CoRR, 2024.
- Yang et al. [2025a] An Yang, Anfeng Li, Baosong Yang, Beichen Zhang, Binyuan Hui, Bo Zheng, Bowen Yu, Chang Gao, Chengen Huang, Chenxu Lv, et al. Qwen3 technical report. arXiv preprint arXiv:2505.09388, 2025a.
- Yang et al. [2025b] Zhicheng Yang, Zhijiang Guo, Yinya Huang, Xiaodan Liang, Yiwei Wang, and Jing Tang. Treerpo: Tree relative policy optimization, 2025b. URL https://arxiv.org/abs/2506.05183.
- Ye et al. [2025] Yixin Ye, Zhen Huang, Yang Xiao, Ethan Chern, Shijie Xia, and Pengfei Liu. Limo: Less is more for reasoning, 2025. URL https://arxiv.org/abs/2502.03387.
- Yu et al. [2025] Qiying Yu, Zheng Zhang, Ruofei Zhu, Yufeng Yuan, Xiaochen Zuo, Yu Yue, Tiantian Fan, Gaohong Liu, Lingjun Liu, Xin Liu, et al. Dapo: An open-source llm reinforcement learning system at scale. CoRR, 2025.
- Yue et al. [2025] Yang Yue, Zhiqi Chen, Rui Lu, Andrew Zhao, Zhaokai Wang, Yang Yue, Shiji Song, and Gao Huang. Does reinforcement learning really incentivize reasoning capacity in llms beyond the base model?, 2025. URL https://arxiv.org/abs/2504.13837.
- Zhang et al. [2025] Jingyi Zhang, Jiaxing Huang, Huanjin Yao, Shunyu Liu, Xikun Zhang, Shijian Lu, and Dacheng Tao. R1-vl: Learning to reason with multimodal large language models via step-wise group relative policy optimization. CoRR, 2025.
- Zheng et al. [2025] Haizhong Zheng, Yang Zhou, Brian R. Bartoldson, Bhavya Kailkhura, Fan Lai, Jiawei Zhao, and Beidi Chen. Act only when it pays: Efficient reinforcement learning for llm reasoning via selective rollouts, 2025. URL https://arxiv.org/abs/2506.02177.
- Zhou et al. [2025] Yuhang Zhou, Jing Zhu, Shengyi Qian, Zhuokai Zhao, Xiyao Wang, Xiaoyu Liu, Ming Li, Paiheng Xu, Wei Ai, and Furong Huang. Disco balances the scales: Adaptive domain- and difficulty-aware reinforcement learning on imbalanced data, 2025. URL https://arxiv.org/abs/2505.15074.
- Zhuang et al. [2025] Xialie Zhuang, Peixian Ma, Zhikai Jia, Shiwei Liu, and Zheng Cao. A technical study into 0.5b reasoning language models, 2025. URL https://arxiv.org/abs/2506.13404.