# Fin-PRM: A Domain-Specialized Process Reward Model for Financial Reasoning in Large Language Models
> These authors contributed equally to this work and conducted the research during their internship at Qwen DianJin Team.Corresponding Author
## Abstract
Process Reward Models (PRMs) have emerged as a promising framework for supervising intermediate reasoning in large language models (LLMs), yet existing PRMs are primarily trained on general or Science, Technology, Engineering, and Mathematics (STEM) domains and fall short in domain-specific contexts such as finance, where reasoning is more structured, symbolic, and sensitive to factual and regulatory correctness. We introduce Fin-PRM, a domain-specialized, trajectory-aware PRM tailored to evaluate intermediate reasoning steps in financial tasks. Fin-PRM integrates step-level and trajectory-level reward supervision, enabling fine-grained evaluation of reasoning traces aligned with financial logic. We apply Fin-PRM in both offline and online reward learning settings, supporting three key applications: (i) selecting high-quality reasoning trajectories for distillation-based supervised fine-tuning, (ii) providing dense process-level rewards for reinforcement learning, and (iii) guiding reward-informed Best-of-N inference at test time. Experimental results on financial reasoning benchmarks, including CFLUE and FinQA, demonstrate that Fin-PRM consistently outperforms general-purpose PRMs and strong domain baselines in trajectory selection quality. Downstream models trained with Fin-PRM yield substantial improvements with baselines, with gains of 12.9% in supervised learning, 5.2% in reinforcement learning, and 5.1% in test-time performance. These findings highlight the value of domain-specialized reward modeling for aligning LLMs with expert-level financial reasoning. Our project resources will be available at https://github.com/aliyun/qwen-dianjin.
## 1 Introduction
Large Language Models (LLMs) have demonstrated remarkable capabilities in complex reasoning tasks, leading to their increasing application in specialized domains such as finance (Yang, Liu, and Wang 2023; Zhu et al. 2025). However, financial reasoning tasks like financial statement analysis, investment strategy formulation, and regulatory compliance assessment demand a level of precision, factuality, and logical coherence that pushes the limits of current models. Therefore, a critical research direction is to align LLM reasoning pathways with expert cognitive processes monitoring tools, such as PRMs (Lightman et al. 2023a; Zhang et al. 2025; Setlur et al. 2024). PRMs selects the best one from multiple responses, often as part of test-time scaling strategies like Best-of-N (Khalifa et al. 2025; Liu et al. 2025), and gives scalarized reward signals to reinforcement learning progress (Zou et al. 2025; Cui et al. 2025). The central challenge for the successful implementation of PRM lies in the creation and curation of high-fidelity datasets, which must feature not only verified outcomes but also granular, step-by-step demonstrations of expert financial reasoning analysis (Lightman et al. 2023b; Zhang et al. 2025). We acknowledge the foundational work of OpenThoughts (Guha et al. 2025), which established a systematic methodology for reasoning data synthesis and validated its principles through comprehensive ablation studies. Following their successful data synthesis framework, we generate reasoning trajectories from a faithful data source(Placing our full trust in OpenThoughts’ recommendation, we have moved to a single data source), Cflue, a knowledge-based Chinese financial benchmark. Leveraging the advanced reasoning model, Deepseek-R1 (DeepSeek-AI et al. 2025), we obtained pairs of trace and solution and constructed a reasoning dataset in finance. Regarding the challenge of obtaining trustworthy reward signals, recent work has been greatly inspired by the effectiveness of LLM-as-a-Judge (Gu et al. 2025). While accept the advancement of LLM-as-a-Judge, we contend that relying solely on this method for the financial domain is often opaque and uninterpretable. We introduce a knowledge verification and verifiable regularization signal to aggregate reward labels, ensuring trained PRM is knowledge aware and interpretable. To enable PRM to effectively learn from the multi-dimensional scoring signals encompassing teacher model trajectory reasoning, large model assessment, and knowledge construction, we propose a novel dual-level training paradigm that simultaneously optimizes step-wise and trajectory-wise evaluation capabilities.
Within this framework, we trained our model, named Fin-PRM, which provides reward signals at both the step and trajectory levels. Fin-PRM used a newly constructed, high-quality 3k financial reasoning dataset for training and show great awareness of step correctness and trajectory logic. We demonstrate the effectiveness of Fin-PRM by performing experimental validation on three methods: Offline data selection for SFT (Muennighoff et al. 2025; Xia et al. 2024), Best-of-N selection (Liu et al. 2025; Snell et al. 2024) and online reinforcement learning (Uesato et al. 2022; Cui et al. 2025).
In summary, our primary contributions include:
A High-Quality Financial Reasoning Dataset: We constructed and curated a new dataset of 3,000 samples, which provides granular, step-by-step reasoning traces with trustful reward label in the financial domain.
A Novel Dual-Level Training Framework: We developed a training paradigm that fuses reward signals at both the step and trajectory levels, enabling the PRM to learn from multi-dimensional feedback and validate its key components through ablation studies.
Comprehensive Experimental Validation: We demonstrated the effectiveness of Fin-PRM by successfully applying it to three distinct tasks—offline data selection, Best-of-N selection, and online reinforcement learning—proving its capability to enhance financial reasoning models
## 2 Related Work
### 2.1 Process Reward Models
Process Reward Models (PRMs) have emerged as a crucial framework for providing step-level supervision and interpretable reward signals in complex reasoning tasks. State-of-the-art PRMs, exemplified by MathShepherd (Wang et al. 2024), Skywork-PRM (He et al. 2024), and Qwen2.5-Math-PRM (Zhang et al. 2025), employ human-annotated supervision with synthetic reward generation to deliver evaluation capabilities across diverse reasoning domains including mathematical problem solving, scientific analysis, and programming. Recent exploratory works such as ReasonFlux-PRM (Zou et al. 2025) combines both step-level and template-guided trace-level reward signals, Open-PRM (Zhang et al. 2024) leverages authoritative ORMs to reverse-engineer process-level supervision signals. In application, PRMs successfully integrated into Best-of-N sampling (Liu et al. 2025), offline data selection (Xie et al. 2023), and online reinforcement learning for model optimization (Bai et al. 2022). However, effective PRM evaluation should derive its reasoning assessment capabilities from concrete thinking trajectories rather than merely final solution correctness, and real-world vertical domain applications of PRMs impose critical requirements for deep domain knowledge mastery. Guided by these thoughts, we design a domain-spcialized framework that integrates trajectory-aware evaluation with expert knowledge validation, enabling more reliable process-level assessment for financal domain.
### 2.2 Data Synthesis for Reasoning Tasks.
High-quality data has proven fundamental to developing effective reasoning models (Gunasekar et al. 2023). Early approaches focused on expanded existing datasets through rule-based transformations and template-driven generation (Wei and Zou 2019). These methods improving data coverage, but lacked the sophistication required for complex reasoning task. LLMs has enabled more advanced synthesis paradigms with distillation-based approaches leveraging powerful teacher models to generate high-quality reasoning traces for training efficient student models (Mukherjee et al. 2023). Notable contributions include WizardMath (Luo et al. 2025) synthesizes reasoning data through instruction evolution, MetaMath (Yu et al. 2024) generates diverse problems with step-by-step solutions, and OpenThoughts (Guha et al. 2025) establishes systematic methodological foundations for reasoning data synthesis through comprehensive ablation studies, providing empirical evidence for data composition principles. Considered that domain-specific applications demand specialized knowledge while maintaining reasoning quality standards, we adopt CFLUE (Zhu et al. 2024) as data source and Deepseek-R1 as teacher model to obtain reasoning trace. Recent advanced approaches employ LLM-as-a-judge for automated reward labeling, which always challenged by inherent limitations including black-box evaluation processes and insufficient reproducibility (Zheng et al. 2023). Building upon these observations, we enhance our reward annotation methodology by integrating expert-based knowledge verification mechanisms, significantly improves the observability and trustworthiness of reward signals, thereby ensuring more reliable evaluation capabilities for complex financial reasoning tasks.
<details>
<summary>x1.png Details</summary>
### Visual Description
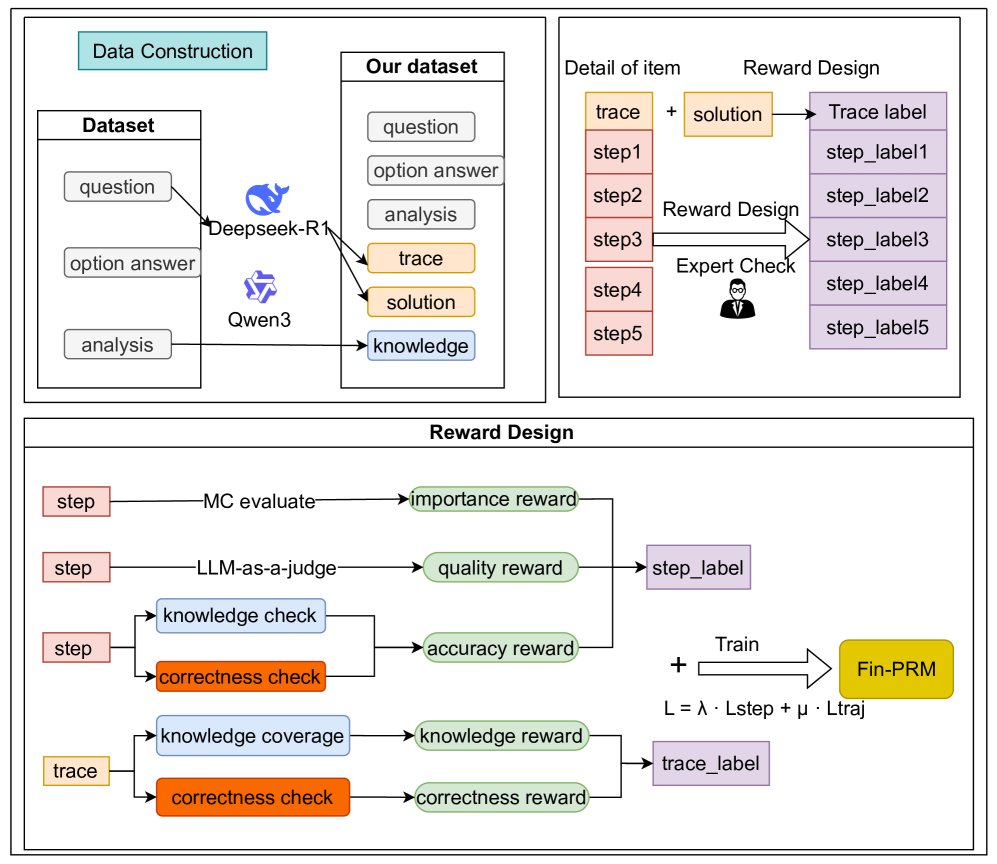
## Diagram: Framework for Dataset Construction and Reward Design for Fin-PRM Training
### Overview
The image is a technical flowchart illustrating a multi-stage process for constructing a dataset and designing a reward system to train a model named "Fin-PRM". The diagram is divided into three primary, bordered sections: "Data Construction" (top-left), "Detail of Item / Reward Design" (top-right), and a larger "Reward Design" section (bottom). The flow describes how raw data is processed by AI models, enriched into a structured dataset, and then used to generate step-level and trace-level labels through various reward mechanisms for model training.
### Components/Axes
The diagram is a flowchart with no traditional chart axes. Its components are boxes (representing data, processes, or models), arrows (representing data flow or transformation), and text labels.
**Key Components & Labels:**
1. **Data Construction (Top-Left Panel):**
* **Input Dataset Box:** Contains three items: `question`, `option answer`, `analysis`.
* **AI Models:** Two model icons/names: `Deepseek-R1` (blue whale icon) and `Qwen3` (purple geometric icon). Arrows flow from the input dataset to these models.
* **Output "Our dataset" Box:** Contains six items: `question`, `option answer`, `analysis`, `trace` (orange background), `solution` (orange background), `knowledge` (blue background). Arrows indicate that `trace` and `solution` are generated by the AI models, while `knowledge` is derived from the `analysis`.
2. **Detail of Item / Reward Design (Top-Right Panel):**
* **Input:** A `trace` (orange box) is broken down into sequential steps: `step1`, `step2`, `step3`, `step4`, `step5` (all in red boxes).
* **Process:** The `trace` is combined with a `solution` (orange box). An arrow labeled `Reward Design` points from the steps to a set of labels. An `Expert Check` (represented by an icon of a person in a suit) also points to this process.
* **Output:** A `Trace label` (purple box) and individual `step_label1` through `step_label5` (purple boxes).
3. **Reward Design (Bottom Panel):**
* **Step-Level Reward Calculation:**
* Input: A `step` (red box).
* Path 1: `step` → `MC evaluate` → `importance reward` (green box).
* Path 2: `step` → `LLM-as-a-judge` → `quality reward` (green box).
* Path 3: `step` branches into `knowledge check` (blue box) and `correctness check` (orange box), which together produce an `accuracy reward` (green box).
* **Aggregation:** The three rewards (`importance`, `quality`, `accuracy`) converge to form a `step_label` (purple box).
* **Trace-Level Reward Calculation:**
* Input: A `trace` (orange box).
* Path 1: `trace` → `knowledge coverage` (blue box) → `knowledge reward` (green box).
* Path 2: `trace` → `correctness check` (orange box) → `correctness reward` (green box).
* **Aggregation:** The two rewards (`knowledge`, `correctness`) converge to form a `trace_label` (purple box).
* **Training Finalization:**
* The `step_label` and `trace_label` are combined with a plus sign (`+`).
* An arrow labeled `Train` points to the final model: `Fin-PRM` (yellow box).
* A loss function is specified below the arrow: `L = λ · Lstep + μ · Ltraj`.
### Detailed Analysis
The process flows as follows:
1. A base dataset containing questions, options, and analysis is processed by two large language models (Deepseek-R1 and Qwen3).
2. This generates an enriched dataset ("Our dataset") that includes reasoning `trace`s and final `solution`s (highlighted in orange) alongside extracted `knowledge` (highlighted in blue).
3. Each `trace` is decomposed into discrete `step`s. These steps, along with the solution, are subjected to a "Reward Design" process, which includes an expert check, to produce both a holistic `Trace label` and individual `step_label`s.
4. The reward design is further detailed: step labels are derived from three reward signals (importance, quality, accuracy), while trace labels are derived from two (knowledge coverage, correctness).
5. All these labeled signals are used to train the `Fin-PRM` model using a composite loss function that balances step-level (`Lstep`) and trajectory-level (`Ltraj`) losses, weighted by parameters λ (lambda) and μ (mu).
### Key Observations
* **Color Coding:** The diagram uses consistent color coding to denote data types: red for steps, orange for trace/solution, blue for knowledge-related components, green for reward signals, and purple for final labels.
* **Dual-Level Analysis:** The framework explicitly separates and designs rewards for both the granular `step` level and the holistic `trace` level.
* **Hybrid Evaluation:** Reward calculation combines automated methods (`MC evaluate`, `LLM-as-a-judge`) with domain-specific checks (`knowledge check`, `correctness check`) and human oversight (`Expert Check`).
* **Model Specificity:** The final model is named `Fin-PRM`, suggesting a focus on financial domain process reward modeling.
### Interpretation
This diagram outlines a sophisticated pipeline for creating a high-quality, process-aware dataset to train a reward model, likely for reasoning or problem-solving tasks in the financial domain (`Fin-`). The core innovation appears to be the multi-faceted reward design. Instead of just evaluating a final answer, the system judges the quality of each reasoning step (`step_label`) and the overall reasoning trajectory (`trace_label`).
The process suggests that raw QA data is insufficient. It must be augmented with expert-like reasoning traces (`trace`) and solutions by powerful LLMs. The subsequent reward modeling then attempts to codify what makes a reasoning step "good" (important, high-quality, accurate) and what makes a full reasoning trace "good" (knowledgeable, correct). By training `Fin-PRM` on these nuanced labels, the goal is likely to create a model that can not only solve problems but also evaluate and guide the reasoning process itself, improving reliability and interpretability in complex domains. The inclusion of an `Expert Check` indicates a human-in-the-loop component to ensure the reward signals align with expert judgment.
</details>
Figure 1: Total process from data construction to model training. Fin-PRM used our dataset with both step-level and trajectory-level reward signals.
## 3 Financial Reasoning Dataset Construction
Capability of the PRM fundamentally rely on the quality of its training data (Ye et al. 2025). In the financial domain, training data must not only feature correct outcomes but also capture the nuances of expert-level reasoning to process-based supervision (Lightman et al. 2023b). This section details our construction of Chain-of-thought dataset for financial reasoning.
### 3.1 Synthesizing Reasoning Trajectories
We select Cflue (Zhu et al. 2024), an authoritative Chinese financial benchmark, as our basic data source. Cflue consists of a wide array of complex questions, accompanied by detailed analyses written by financial experts, which serves as a valuable source of ground-truth knowledge.
Inspired by the systematic data synthesis framework proposed by OpenThoughts (Guha et al. 2025), we leverage Deepseek-R1 to generate structured reasoning traces. The model’s output is structured as a pair $(s,a)$ , where:
- $s=(s_{1},s_{2},\dots,s_{T})$ represents the reasoning trace, a sequence of intermediate steps.
- $a$ is the final, consolidated solution derived from the trace.
Each triplet $(x,s,a)$ serves as a candidate for which we will later generate reward signals.
### 3.2 Financial Knowledge Extraction
Financial reasoning is intensely knowledge-driven. To mitigate reward-hacking (Khalifa et al. 2025), we extract these knowledge as a new base, $\mathcal{K}$ , directly from the analysis of Cflue.
We employ Qwen3-235b-a22b extract key financial terms and their corresponding explanations. For example, from an analysis discussing company valuation, the model might extract:
- Term: Price-to-Book Ratio
- Explanation: A financial ratio used to compare a company’s current market price to its book value.
This knowledge base acts as the trusted external reference for the knowledge verification module during the reward annotation process, ensuring our reward signals are factually grounded. Based on Cflue dataset, our final dataset $\mathcal{D}$ consists of $(x,s,a,\mathcal{K},y,y_{analysis})$ , where $y$ is gold truth answer, $y_{analysis}$ is the expert analysis of the question. We treat $a$ as a sliver truth because the answer teacher model gives maybe wrong.
## 4 Fin-PRM: Domain-Specialized Process Reward Model
In this section, we present the detailed architecture and training methodology of Fin-PRM. Our work is positioned to address the critical need for precise, factual, and interpretable evaluation of LLM reasoning in finance. We begin with a high-level overview of the Fin-PRM framework. Then we detail our method for handling step-level reward signals and trajectory-level signals. Subsequently, we describe our systematic process for reward data construction. Finally, we formulate the training objective that integrates these components.
### 4.1 Overview of Fin-PRM
Fin-PRM is designed to serve as an expert evaluator for reasoning processes generated by LLMs in financial domain. It assesses the quality of a model’s thinking process, rather than just the final answer. To formalize this, we first define the core object of evaluation.
Problem Formulation.
The input for our reward model is a triplet $(x,s,a)$ . Its scoring function, $R_{\phi}$ , can be applied to evaluate either individual reasoning steps or the entire trajectory.
When applied at the step level, Fin-PRM assesses the local correctness and utility of an individual reasoning step $s_{t}$ . The model produces a step-level reward conditioned on the full context:
$$
R_{step}=R_{\phi}(s_{t}\mid x,s_{<t},a) \tag{1}
$$
where $s_{<t}$ is the preceding reasoning history. This score addresses questions like, ”Is this calculation correct?” or ”Is this a logical inference?”.
When applied at the trajectory level, Fin-PRM assesses the global coherence, logical flow, and strategic soundness of the entire reasoning trace $s$ . It produces a holistic score for the complete process:
$$
R_{\mathrm{traj}}=R_{\phi}(s\mid x,a) \tag{2}
$$
This score addresses higher-level questions, such as ”Is this the right overall approach to solve the problem?”.
Training Objective.
The goal of training is to learn the parameters $\phi$ of $R_{\phi}$ such that its predictions align with ground-truth reward signals derived from expert knowledge and verification. The objective is to minimize the discrepancy between the predicted and target rewards:
$$
\min_{\phi}\mathrm{E}_{(x,s,a,\{r_{t}^{\mathrm{{}^{\prime}}}\})\sim\mathcal{D}}\left[\sum_{t=1}^{T}\mathcal{L}\left(R_{\phi}(s_{t}\mid x,s_{<t},a),r_{t}^{\mathrm{{}^{\prime}}}\right)\right] \tag{3}
$$
where $\mathcal{D}$ is our training dataset, $r_{t}^{\mathrm{{}^{\prime}}}$ is the ground-truth reward, and $\mathcal{L}$ is loss function.
### 4.2 Step-level Reward Modeling
To capture the multifaceted nature of a good reasoning step, we decompose our step-level reward into three distinct components: Monte Carlo estimation score $r_{\mathrm{importance}}$ , LLM-as-a-judge score $r_{\mathrm{qual}}$ , and an accuracy score $r_{\mathrm{acc}}$ that verifies its factual correctness.
Importance Score $r_{\mathrm{importance}}$ :
$r_{\mathrm{importance}}$ quantifies the utility of a step by evaluating its likelihood of being on a correct reasoning path. For each step $s_{t}$ in a trace, we prompt Qwen2.5-7b-math to generate $N$ (in our case, $N=8$ ) continuous rollouts until a final answer is reached. $r_{\mathrm{importance}}$ defined as the proportion of these rollouts that yield a correct final answer. This provides a soft-label score reflecting the potential of the current step, if soft-label is not $0$ , hard-label defined as $1$ .
$$
r_{\mathrm{importance}}=\frac{1}{N}\sum_{i=1}^{N}\mathbf{I}(\xi(\mathrm{R}_{\mu,i}(s_{t}\mid x,s_{<t},y))) \tag{4}
$$
where $\mathrm{R}_{\mu,i}(s_{t})$ is the $i$ -th generated completion starting from step $s_{t}$ , $\xi$ is the answer check progress and $\mathbf{I}(\cdot)$ is the indicator function, which returns 1 if the final answer of the rollout is correct and 0 otherwise.
Qualitative Score $r_{\mathrm{qual}}$ :
$r_{\mathrm{qual}}$ captures the abstract quality of a reasoning step. We leverage a powerful LLM, Qwen3-235b-a22b(we also considered chat-gpt-4.1, but observed almost the same score as Qwen3 gives), to evaluate each step $s_{t}$ from semantic coherence, logic soundness, and answer orientation, details of prompt can be found in appendix.
$$
r_{\mathrm{qual}}=\mathrm{R}_{\mathrm{\theta}}(s_{t}\mid x,s_{<t},a) \tag{5}
$$
where the score is prompt to be a scalar between 0 and 1. Against to prior works like Openthoughts and Reasonflux-PRM treat $a$ as a golden truth, we consider that reasoning data constructed for SFT is not suitable for PRM training.
Accuracy Score $r_{\mathrm{acc}}$ :
$r_{\mathrm{acc}}$ provides a robust, quantitative measure of a step’s factual and procedural correctness. It is organized into two parts as following exaplained, specifically designed to anchor the reward signal in ground truth $y$ and knowledge base $\mathcal{K}$ , aims to mitigate issues like LLM hallucination and reward hacking:
Procedural Correctness ( $r_{\mathrm{step\_correctness}}$ ): This sub-score assesses the procedural validity of a given step $s_{t}$ . We employ a powerful LLM as a verifier, prompting it to make a binary assertion (1 for correct, 0 for incorrect) on whether the step $s_{t}$ constitutes a logically sound and relevant action towards reaching the known gold truth, $y$ . Here, the difference between $r_{\mathrm{step\_correctness}}$ and $r_{\mathrm{qual}}$ is that they use different base as their ground truth.
Factual Accuracy ( $r_{\mathrm{knowledge\_acc}}$ ): This sub-score measures the factual accuracy of the content within $s_{t}$ . It systematically validates all identifiable claims and financial terms within the step against our knowledge base $\mathcal{K}$ . This directly counteracts model hallucination by ensuring that the reasoning is built upon verified facts from the trusted expert analysis, $y_{\mathrm{analysis}}$ .
The final accuracy score combines these two facets in a weighted sum:
$$
r_{\mathrm{acc}}=0.5(r_{\mathrm{step\_correctness}}(s_{t},y)+\omega_{k}\cdot r_{\mathrm{knowledge\_acc}}(s_{t},\mathcal{K}_{x})) \tag{6}
$$
Here, the hyperparameter $\omega_{k}$ allows us to adjust the relative importance of factual grounding versus procedural correctness. A higher $\omega_{k}$ would more heavily penalize factual inaccuracies, aligning the model with a stricter standard of verifiability. In our experiments, we set $\omega_{k}=1.0$ , treating both types of correctness as equally critical. This composite score thereby ensures that highly-rated steps are both logically sound and factually impeccable.
### 4.3 Trajectory-level Reward Modeling
Notice that a trajectory consists of correct steps sometimes lead to wrong answer, and PRMs can easily fall into reward hacking. We introduce trajectory-level reward signal combines two parts: an outcome-based correctness score $r_{\mathrm{out}}$ and a knowledge coverage score $r_{\mathrm{cover}}$ .
Outcome correctness score $r_{\mathrm{out}}$
. $r_{\mathrm{out}}$ provides an assessment of the final answer’s correctness. For the tasks in our dataset typically require selecting a final option (e.g., ’A’, ’B’, ’ACD’), we extra model’s chosen option compared directly to the ground-truth correct option, yields a strict binary signal, $r_{\mathrm{out}}\in\{0,1\}$ .
Knowledge coverage score $r_{\mathrm{cover}}$
. A high-quality reasoning process should be comprehensive and well-supported by relevant domain knowledge. $r_{\mathrm{cover}}$ measures the extent to which the reasoning trace $s$ and the final answer $a$ utilize the necessary knowledge terms, calculated as the ratio of relevant knowledge concepts mentioned in generation to the total number of concepts required.
$$
r_{\mathrm{cover}}=\frac{|\phi_{\mathrm{ext}}(s\oplus a)\cap\mathcal{K}_{x}|}{|\mathcal{K}_{x}|} \tag{7}
$$
Here, $\mathcal{K}_{x}\subseteq\mathcal{K}$ is the subset of our knowledge base containing all terms deemed relevant to the prompt $x$ . The function $\phi_{\mathrm{ext}}(\cdot)$ represents the extraction process, implemented through LLMs. $\oplus$ denotes string concatenation.
### 4.4 Reward Data Construction
We construct ground-truth labels by aggregating the multiple signals into a single score for each granularity, which is then binarized.
Step-level Label Construction.
To form a single supervisory signal for each step $s_{t}$ , we aggregate its three distinct reward components—importance, quality, and accuracy—using a dynamic weighting scheme. This approach, based on the softmax function, adaptively emphasizes the score providing the strongest signal. The final continuous score for step $t$ , denoted $r_{t}^{\mathrm{step}}$ , is calculated as:
$$
r_{t}^{\mathrm{step}}=\sum_{k\in\{\mathrm{imp},\mathrm{qual},\mathrm{acc}\}}\mathrm{softmax}\big{(}r_{t}^{\mathrm{imp}},r_{t}^{\mathrm{qual}},r_{t}^{\mathrm{acc}}\big{)}_{k}\cdot r_{t}^{k} \tag{8}
$$
In this formulation, $r_{t}^{k}$ is the raw score for component $k$ at step $t$ . The $\mathrm{softmax}$ function converts the vector of raw scores into a probability distribution, which serves as a set of dynamic weights. The $k$ -th element of this distribution, indicated by the subscript $(\cdot)_{k}$ , is then multiplied by its corresponding raw score $r_{t}^{k}$ .
This method functions as an attention mechanism: a score that is significantly higher than the others will receive a proportionally larger weight in the final sum, allowing its signal to dominate. For instance, a step with exceptionally high factual accuracy ( $r_{t}^{\mathrm{acc}}$ ) will have its contribution amplified, even if other scores are moderate. This is more robust than a fixed-weight average. Finally, this aggregated score $r_{t}^{\mathrm{step}}$ is binarized using a 0.5 threshold to produce the final step label, $L_{t}^{\mathrm{step}}$ .
Trajectory-level Label Construction. For each trajectory, we combine its outcome and coverage scores into a single score, $S_{\mathrm{traj}}$ :
$$
R_{\mathrm{traj}}(s,a)=r_{\mathrm{out}}(a)+\eta\cdot r_{\mathrm{cover}}(s,a) \tag{9}
$$
Here, $\eta$ are the weights for outcome correctness and knowledge coverage. We set $\eta$ to 1.5. This weighting ensures that the knowledge coverage score has a meaningful impact on the final label. The trajectory score is also converted to a binary label, $L_{\mathrm{traj}}$ , using a 1.25 threshold, we select these weights to balance the contribution of these two signals, by using the mean value of their weights as the threshold value, we give the ability to change the hard label to each reward signal.
### 4.5 Training Objective
To train Fin-PRM effectively, we formulate a joint objective to train model through binary cross-entropy (BCE), learning to predict the correctness of both individual steps and entire trajectories. The total loss $\mathcal{L}_{\mathrm{total}}$ :
$$
\mathcal{L}_{\mathrm{total}}=\mathcal{L}_{\mathrm{step}}+\lambda\cdot\mathcal{L}_{\mathrm{traj}} \tag{10}
$$
where $\lambda$ are hyperparameters that balance the contribution of each supervision signal.
The step-level loss, $\mathcal{L}_{\mathrm{step}}$ , is the average loss over all steps in a reasoning trace. It measures the discrepancy between the model’s prediction and the ground-truth step label, $L_{\mathrm{step}}(s_{t})$ :
$$
\mathcal{L}_{\mathrm{step}}=\frac{1}{T}\sum_{t=1}^{T}\mathcal{L}_{\mathrm{BCE}}\Big{(}R_{\phi}(s_{t}\mid x,s_{<t},a),R_{step}\Big{)} \tag{11}
$$
The trajectory-level loss, $\mathcal{L}_{\mathrm{traj}}$ , follows the same principle. It compares the model’s prediction for the entire trajectory against the ground-truth trajectory label, $L_{\mathrm{traj}}(s,a)$ :
$$
\mathcal{L}_{\mathrm{traj}}=\mathcal{L}_{\mathrm{BCE}}\Big{(}R_{\phi}(s,a\mid x),R_{traj}\Big{)} \tag{12}
$$
where $\sigma(\cdot)$ denotes the sigmoid function, which converts the model’s raw logit outputs into probabilities. $\mathcal{L}_{\mathrm{BCE}}(\cdot,\cdot)$ denotes the BCE loss function. For a ground-truth label $L\in\{0,1\}$ and a model logit output $R_{\phi}$ , it is defined as $\mathcal{L}_{\mathrm{BCE}}(R_{\phi},L)=-[L\log\sigma(R_{\phi})+(1-L)\log(1-\sigma(R_{\phi}))]$ , By jointly optimizing this objective, Fin-PRM is trained to make judgments.
## 5 Applications of Fin-PRM
To validate the effectiveness of our framework and the capability of Fin-PRM, we apply three critical use cases and compare its performance against relevant baselines. Supervised Fine-tuning with Data Selection: Using Fin-PRM as an offline filter to curate a high-quality dataset for more efficient and effective SFT. Reward-guided Test-Time Scaling: Employing Fin-PRM at inference time to select the best response from multiple candidates in a Best-of-N (BoN) setting. Online Reward Modeling: Applying Fin-PRM as a reward function to guide the policy optimization through reinforcement learning.
| Method Accuracy (%) | Qwen2.5-7b-instruct 45.3 | Random Selection 43.8 | Math-PRM-7B 56.5 | Math-PRM-72B 57.1 | Fin-PRM (Ours) 58.2 |
| --- | --- | --- | --- | --- | --- |
Table 1: Offline data selection comparison on the CFLUE benchmark. All SFT methods use 1,000 selected samples to fine-tune the Qwen2.5-7B-Instruct base model. The highest performance is in bold.
### 5.1 Supervised Fine-tuning with Data Selection
PRM can be used to identify and select only the most coherent and correct examples from the whole dataset according to the score it gives. Through comparing the capability of student model trained by different selected dataset examples, advancement of Fin-PRM be proved.
We use Qwen3-8B to produce multiple distinct reasoning trajectories for each question, scoring each trajectory through Fin-PRM by the following function:
$$
\hat{R}=\frac{1}{T}\sum_{t=1}^{T}\hat{R}_{\mathrm{step}}(s_{t}\mid x,s_{<t},a)+\zeta\cdot\hat{R}_{\mathrm{traj}}(s,a\mid x) \tag{13}
$$
Here, $\hat{R}_{\mathrm{step}}$ and $\hat{R}_{\mathrm{traj}}$ are the reward scores generated by Fin-PRM or other PRMs. The hyperparameter $\zeta$ balances the contribution of fine-grained step correctness and overall trajectory quality; we found $\zeta=1.0$ to work well in practice.
As shown in Table 1, the selection strategy has a profound impact on model performance. Fine-tuning on randomly selected data degrades performance to 43.8%, highlighting the risk of using noisy synthetic data. In contrast, all PRM-based selection methods provide a substantial boost over the 45.3% base model accuracy. Our domain-specialized Fin-PRM achieves the highest accuracy of 58.2%. This result not only demonstrates a 12.9-point improvement over the base model but also confirms that a finance-aware reward model is superior for curating high-quality reasoning data in this domain.
<details>
<summary>AAAI_BoN.png Details</summary>
### Visual Description
## Line Charts: Performance Comparison on CFLUE and MATH500 Datasets
### Overview
The image contains two vertically stacked line charts comparing the accuracy of five different methods or models as the number of samples (N) increases. The top chart is titled "CFLUE" and the bottom chart is titled "MATH500". Both charts share the same x-axis ("Number of Samples (N)") and y-axis ("Accuracy (%)"). A common legend is positioned at the top of the image.
### Components/Axes
* **Legend (Top Center):** Contains five entries.
* `PASS@N`: Red dashed line with circular markers.
* `Maj@N`: Brown dashed line with circular markers.
* `Fin-PRM`: Black solid line with circular markers.
* `Qwen2.5-MATH-PRM-7B`: Blue dashed line with circular markers.
* `Qwen2.5-MATH-PRM-72B`: Green dashed line with circular markers.
* **X-Axis (Both Charts):** Labeled "Number of Samples (N)". The scale is logarithmic base 2, with tick marks at `2^0` (1), `2^1` (2), `2^2` (4), `2^3` (8), and `2^4` (16).
* **Y-Axis (Both Charts):** Labeled "Accuracy (%)". The scale is linear.
* **CFLUE Chart:** Ranges from approximately 50% to 85%. Major gridlines are at 60%, 70%, and 80%.
* **MATH500 Chart:** Ranges from 55% to 70%. Major gridlines are at 55%, 60%, 65%, and 70%.
### Detailed Analysis
#### **CFLUE Chart (Top)**
* **PASS@N (Red, Dashed):** Shows a strong, consistent upward trend. Starts at ~57% (2^0), rises to ~70% (2^1), ~76% (2^2), ~81% (2^3), and peaks at ~84% (2^4). It is the top-performing method for N ≥ 2.
* **Fin-PRM (Black, Solid):** Shows a moderate upward trend that plateaus. Starts at ~57% (2^0), rises to ~64% (2^1), stays at ~64% (2^2), increases to ~66% (2^3), and ends at ~67% (2^4). It is the second-best method for N ≥ 2.
* **Maj@N (Brown, Dashed):** Shows a fluctuating trend. Starts at ~57% (2^0), dips to ~53% (2^1), rises to ~59% (2^2), increases to ~63% (2^3), and stays at ~63% (2^4).
* **Qwen2.5-MATH-PRM-7B (Blue, Dashed):** Shows a slight downward trend after an initial rise. Starts at ~57% (2^0), rises to ~62% (2^1), stays at ~62% (2^2), drops to ~57% (2^3), and ends at ~56% (2^4).
* **Qwen2.5-MATH-PRM-72B (Green, Dashed):** Shows a relatively flat, slightly fluctuating trend. Starts at ~57% (2^0), dips to ~56% (2^1), rises to ~57% (2^2), dips to ~56% (2^3), and ends at ~57% (2^4). It is the lowest-performing method for N ≥ 2.
#### **MATH500 Chart (Bottom)**
* **PASS@N (Red, Dashed):** Shows a consistent upward trend. Starts at 60% (2^0), rises to ~64% (2^1), ~66% (2^2), ~67% (2^3), and peaks at ~68% (2^4). It is the top-performing method for all N.
* **Qwen2.5-MATH-PRM-72B (Green, Dashed):** Shows a consistent upward trend. Starts at 60% (2^0), rises to ~63% (2^1), ~63% (2^2), ~66% (2^3), and ends at ~66% (2^4). It is the second-best method for N ≥ 2.
* **Fin-PRM (Black, Solid):** Shows a moderate upward trend that plateaus. Starts at 60% (2^0), rises to ~60% (2^1), ~62% (2^2), ~63% (2^3), and ends at ~63% (2^4).
* **Qwen2.5-MATH-PRM-7B (Blue, Dashed):** Shows a moderate upward trend. Starts at 60% (2^0), rises to ~60% (2^1), ~62% (2^2), ~63% (2^3), and ends at ~64% (2^4).
* **Maj@N (Brown, Dashed):** Shows a fluctuating trend. Starts at 60% (2^0), dips to ~57% (2^1), rises to ~61% (2^2), increases to ~63% (2^3), and ends at ~63% (2^4).
### Key Observations
1. **Dominance of PASS@N:** The PASS@N method (red dashed line) achieves the highest accuracy on both datasets across almost all sample sizes (N ≥ 2), showing a strong positive correlation between N and accuracy.
2. **Dataset-Specific Performance:** The relative ranking of methods differs between datasets. Notably, the `Qwen2.5-MATH-PRM-72B` model (green) is the second-best performer on MATH500 but performs poorly on CFLUE. Conversely, `Fin-PRM` (black) is strong on CFLUE but average on MATH500.
3. **Impact of Model Size (Qwen):** On the MATH500 dataset, the larger 72B model consistently outperforms the smaller 7B model. On the CFLUE dataset, their performance is similar and relatively low, with the 7B model sometimes slightly ahead.
4. **Maj@N Volatility:** The Maj@N method (brown) shows a characteristic dip in accuracy at N=2 (`2^1`) on both charts before recovering.
5. **Plateauing Effect:** Most methods show diminishing returns, with accuracy gains slowing or plateauing as N increases from 8 (`2^3`) to 16 (`2^4`).
### Interpretation
This data demonstrates the effectiveness of different sampling and verification strategies for improving the accuracy of language models on mathematical and reasoning tasks (CFLUE and MATH500).
* **PASS@N's superiority** suggests that a strategy of accepting an answer if it appears in any of N samples is highly effective, and its performance scales reliably with more samples.
* The **divergent performance of the Qwen models** across datasets indicates that model specialization or training data alignment plays a crucial role. The 72B model appears better tuned for the type of problems in MATH500, while neither Qwen model excels on CFLUE, suggesting CFLUE may test different skills.
* The **plateauing accuracy** for most methods implies a practical limit to the benefits of simply increasing the number of samples. Beyond a certain point (N=8 or 16), the computational cost of generating more samples may not justify the marginal accuracy gain.
* The **volatility of Maj@N** (majority voting) highlights a potential weakness: with very few samples (N=2), a single incorrect majority can hurt performance, but with more samples, the consensus becomes more reliable.
In summary, the charts argue for the use of PASS@N as a robust scaling strategy and highlight that the optimal model or method is highly dependent on the specific evaluation benchmark.
</details>
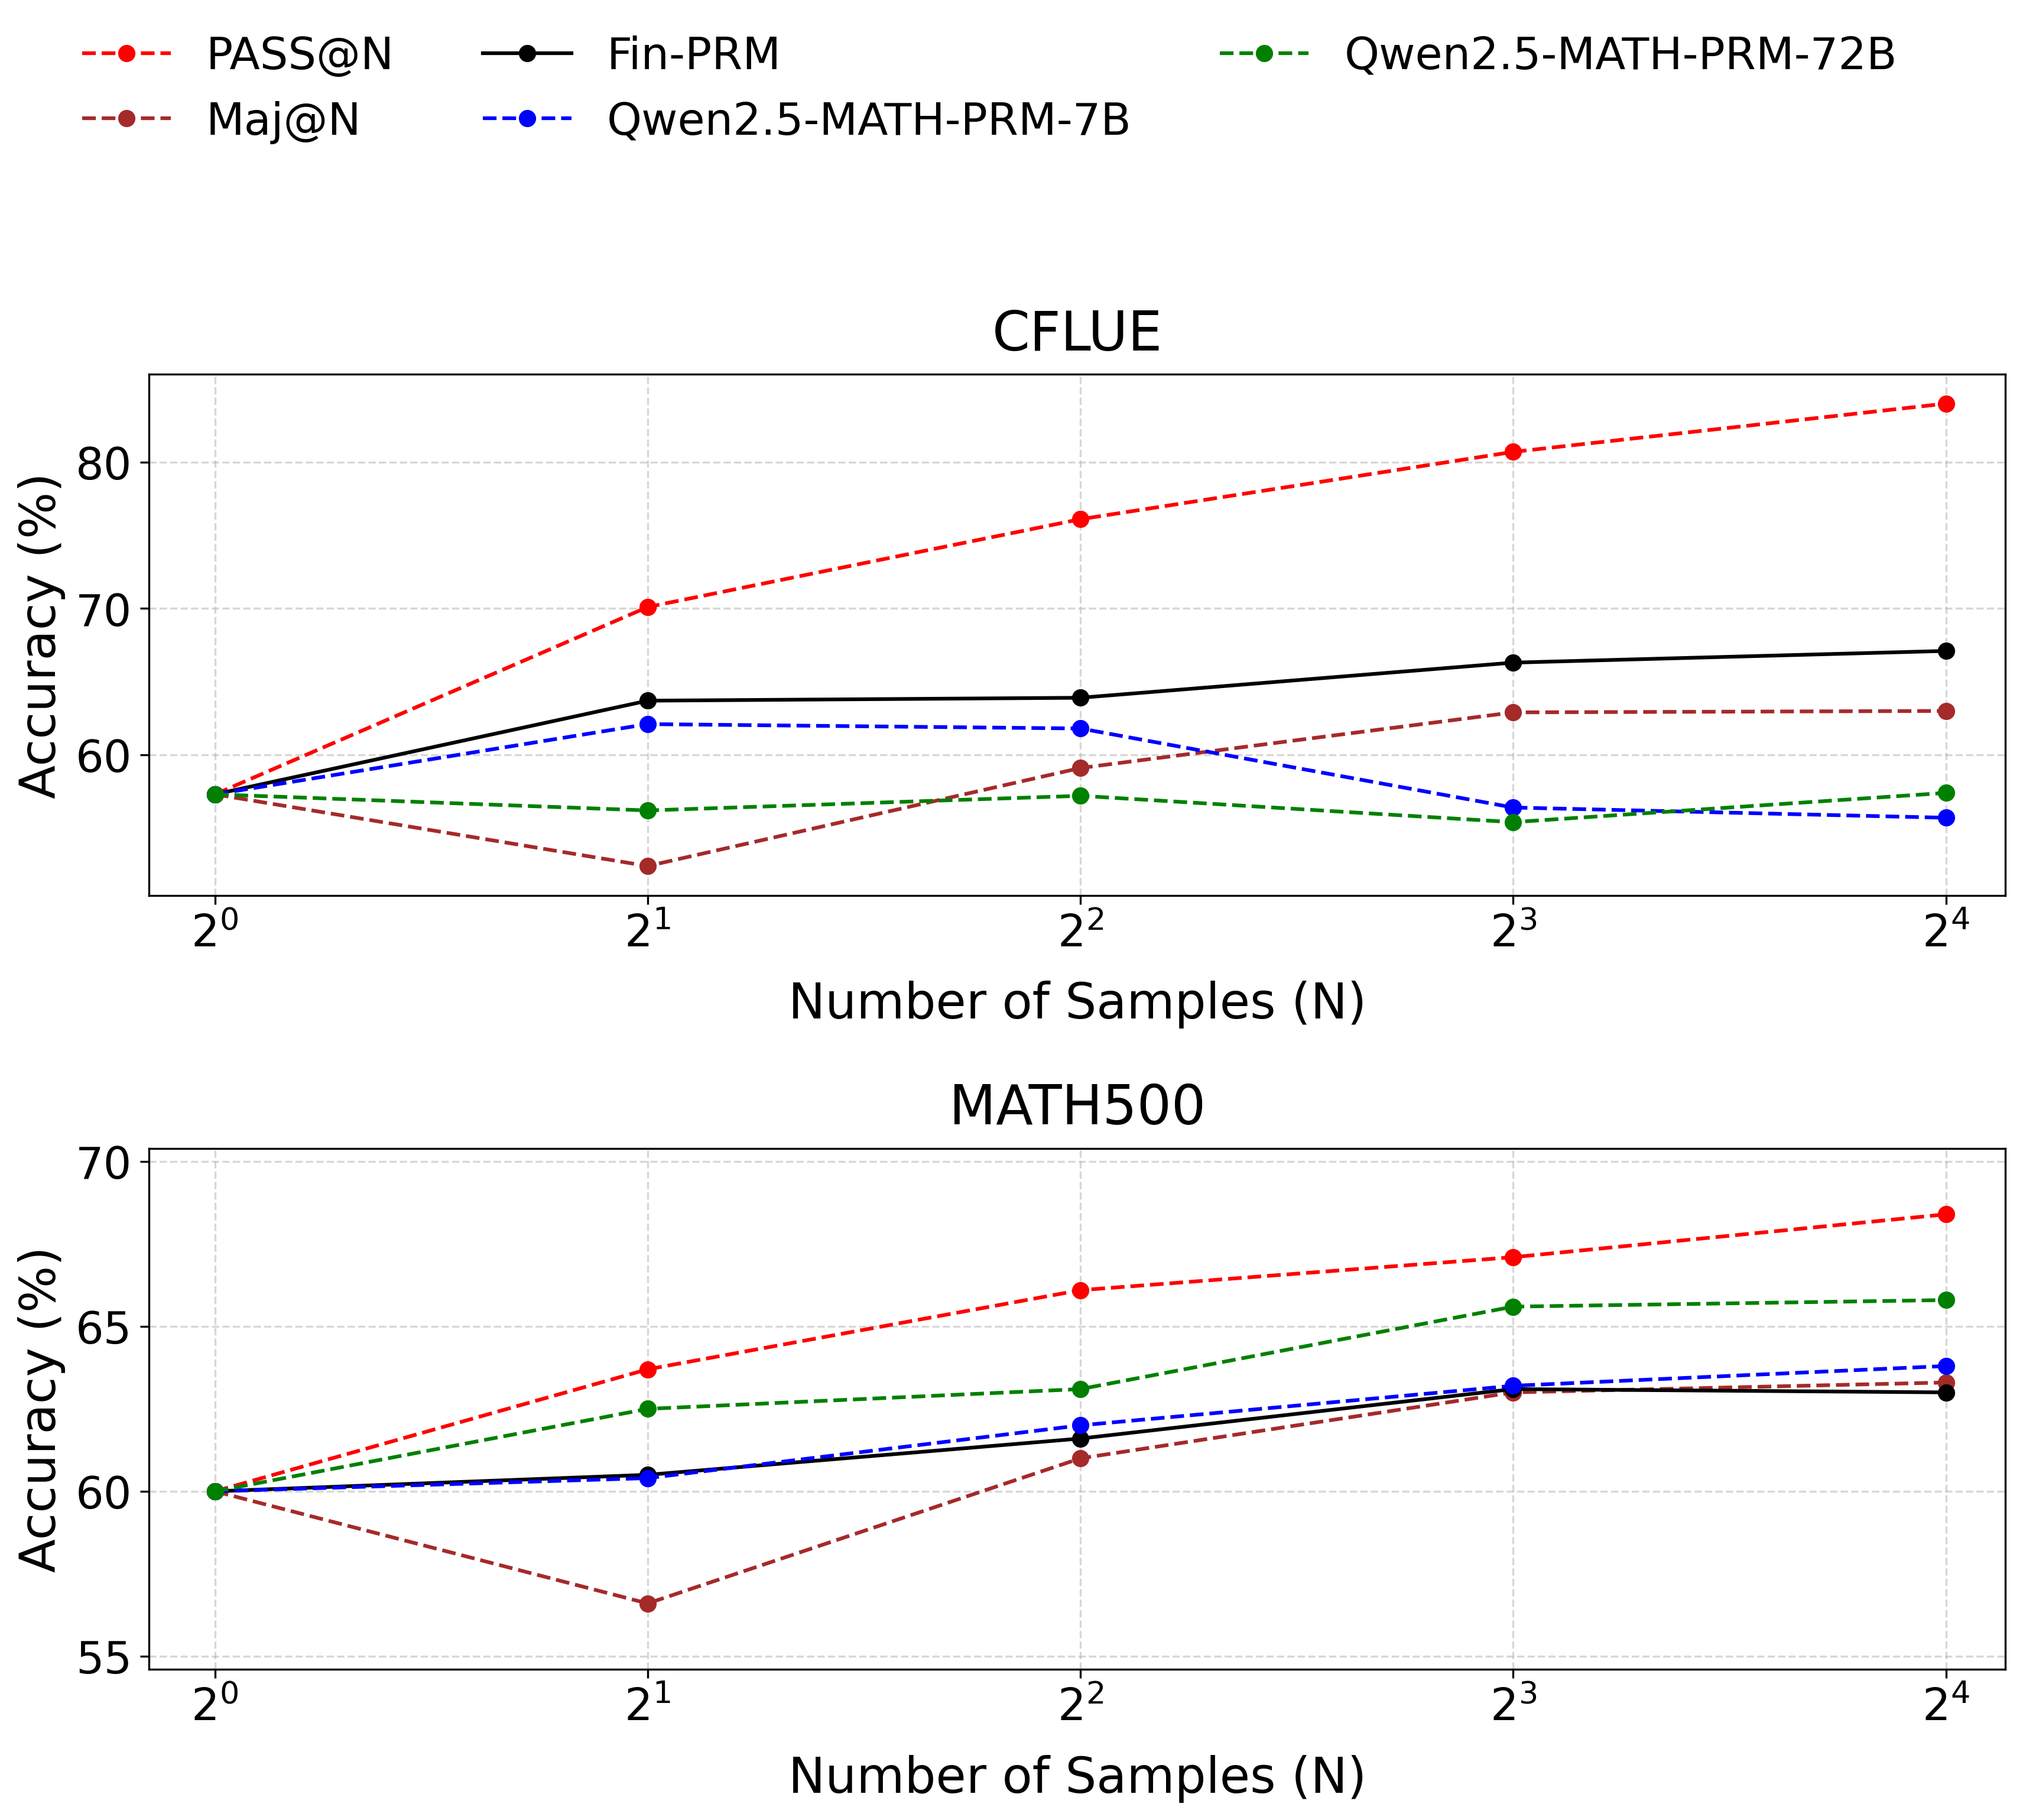
Figure 2: BoN test on Cflue dataset. Fin-PRM is the black line, outperforms all baselines in financial domain. Qwen2.5-Math-PRM-7B shows performance below major-voting when the number of N becomes larger, points crucial needs for domain-specific PRM. The figure below shows that Fin-PRM performs almost identically to proprietary mathematical PRM of the same size in the field of mathematics.
### 5.2 Test-Time Scaling
Another key application is to enhance model performance at inference time through Best-of-N (BoN) selection. This method computes the score from Equation 13 for N candidate answers generated by a policy model to find the best one.
We evaluate performance in our target financial domain. Using Qwen2.5-7B-Instruct as the generator, we perform BoN selection on a 1,000-sample subset of the CFLUE test set for N values of 4, 8, and 16. Fin-PRM is compared against two baselines: a strong, general-domain Qwen2.5-Math-PRM-7B and major voting method. As presented in Figure 2, in the Cflue BoN test, Fin-PRM consistently leads to greater accuracy gains as N increases, outperforming the majority-voting baseline by more than $5.1\$ at N=16. This result highlights its effectiveness for financial reasoning.
To validate the generalization of Fin-PRMs, we conduct the same BoN experiment on an out-of-domain benchmark, Math500.
| Majority Voting Fin-PRM (Ours) Qwen2.5-Math-PRM-7B | 60.0 60.0 60.0 | 56.6 60.5 60.4 | 61.0 61.6 62.0 | 63.0 63.1 63.2 | 63.3 63.0 63.8 |
| --- | --- | --- | --- | --- | --- |
| Qwen2.5-Math-PRM-72B | 60.0 | 62.5 | 63.1 | 65.6 | 65.8 |
Table 2: Best-of-N performance on the out-of-domain Math500 benchmark. Fin-PRM shows better performance than major voting. Best selector performance is in bold.
The results on Math500, shown in Table 2, Fin-PRM demonstrates a respectable baseline capability, proving it does not completely fail on unfamiliar tasks. Its performance closely tracks that of the 7B-scale math-specialized PRM and remains competitive with majority voting. This indicates that while its expert knowledge is sharply honed for finance, Fin-PRM retains a foundational ability to assess logical structure, allowing it to function as a competent generalist evaluator in other domains and demonstrating robust generalization.
### 5.3 Reward signals for RL training
Beyond offline data curation and test-time selection, Fin-PRM’s most dynamic application is providing a composite reward that guides policy optimization through step-aware supervision.
We integrate Fin-PRM into the Group Relative Policy Optimization (Shao et al. 2024) (GRPO) framework. By default, GRPO optimizes for the outcome-level reward, which in our case is $r_{\mathrm{out}}$ . To incorporate the nuanced, process-level supervision from Fin-PRM, we augment this reward with our holistic score $\hat{R}$ (from Equation 13). The new composite reward for a given trace $(s,a)$ is defined as:
$$
r_{\mathrm{rl}}=(1-\delta)\cdot r_{\mathrm{out}}+\delta\cdot\hat{R} \tag{14}
$$
where the hyperparameter $\delta$ controls the relative weight of the process-level reward. For a group of $N$ responses, the advantage is:
$$
A_{\mathrm{rl}}=\frac{r_{\mathrm{rl}}-\mathrm{mean}(\{r_{\mathrm{rl}}\}_{j=1}^{N})}{\mathrm{std}(\{r_{\mathrm{rl}}\}_{j=1}^{N})} \tag{15}
$$
With the Fin-PRM derived advantage term, $A_{\mathrm{comp}}$ , the GRPO objective is updated to:
$$
\begin{array}[]{l}\mathcal{J}_{\mathrm{GRPO}}(\theta)=\mathrm{E}_{x,\{s_{i}\}\sim\pi_{\theta_{\mathrm{old}}}}\Bigg{[}\frac{1}{N}\sum_{i=1}^{N}\frac{1}{T_{i}}\sum_{t=1}^{T_{i}}\Big{(}\\
\qquad\min\Big{\{}\frac{\pi_{\theta}(s_{i,t}|x,s_{i,<t})}{\pi_{\theta_{\mathrm{old}}}(s_{i,t}|x,s_{i,<t})}A_{rl,i},\\
\qquad\quad\mathrm{clip}\big{(}\frac{\pi_{\theta}(s_{i,t}|x,s_{i,<t})}{\pi_{\theta_{\mathrm{old}}}(s_{i,t}|x,s_{i,<t})},1-\epsilon,1+\epsilon\big{)}A_{rl,i}\Big{\}}\\
\qquad-\beta_{\mathrm{KL}}\mathcal{D}_{\mathrm{KL}}(\pi_{\theta}\|\pi_{\mathrm{ref}})\Big{)}\Bigg{]}\end{array} \tag{16}
$$
where $A_{rl,i}$ is the advantage for the $i$ -th sample, $\epsilon$ is the clipping hyperparameter, and the term weighted by $\beta_{\mathrm{KL}}$ is a KL-divergence penalty against a reference policy $\pi_{\mathrm{ref}}$ .
<details>
<summary>AAAI_online.png Details</summary>
### Visual Description
## Line Chart: Model Accuracy Comparison Over Training Steps
### Overview
This image is a line chart comparing the accuracy performance of three different models or methods over a series of training steps. The chart tracks how the accuracy metric changes for each approach as training progresses from step 0 to step 180.
### Components/Axes
* **X-Axis (Horizontal):** Labeled "Step". It represents the progression of training, with major tick marks at intervals of 20, ranging from 0 to 180.
* **Y-Axis (Vertical):** Labeled "Accuracy". It represents the performance metric, with major tick marks at intervals of 0.05, ranging from 0.35 to 0.60.
* **Legend:** Positioned in the top-left corner of the chart area. It contains three entries:
1. **FIN-PRM:** Represented by a blue line with circular markers.
2. **GRPO(Rule-Based):** Represented by an orange line with square markers.
3. **Qwen2.5-Math-PRM-7B:** Represented by a green line with triangular markers.
* **Grid:** A light gray grid is present, aligning with the major tick marks on both axes.
### Detailed Analysis
The chart displays three distinct data series, each with a unique trend.
**1. FIN-PRM (Blue Line, Circle Markers)**
* **Trend Verification:** The line shows a general upward trend, with a period of rapid increase followed by a high-level plateau with minor fluctuations.
* **Data Points (Approximate):**
* Starts at ~0.42 accuracy at step 0.
* Dips slightly to ~0.405 at step 10.
* Begins a steep climb around step 50 (~0.405), crossing 0.50 by step 65.
* Reaches a local peak of ~0.57 at step 100.
* Fluctuates between ~0.55 and ~0.58 from step 100 to 180, ending at approximately 0.575.
**2. GRPO(Rule-Based) (Orange Line, Square Markers)**
* **Trend Verification:** The line shows an initial increase, followed by a sustained plateau, and then a slight decline towards the end.
* **Data Points (Approximate):**
* Starts at ~0.395 at step 0.
* Rises to ~0.42 by step 20.
* Experiences a sharp increase starting around step 55 (~0.445), reaching ~0.52 by step 75.
* Plateaus between ~0.53 and ~0.55 from step 100 to 145.
* Shows a slight downward trend after step 145, ending at approximately 0.525.
**3. Qwen2.5-Math-PRM-7B (Green Line, Triangle Markers)**
* **Trend Verification:** The line is highly volatile in the first half, with a significant spike, followed by a sharp decline and then a stable, low-level performance in the second half.
* **Data Points (Approximate):**
* Starts at ~0.425 at step 0.
* Shows high volatility between steps 20-60, with a notable peak of ~0.475 at step 55.
* Experiences a dramatic drop after step 60, falling to a low of ~0.38 at step 85.
* Recovers slightly and stabilizes, fluctuating narrowly between ~0.395 and ~0.41 from step 90 to 180, ending at approximately 0.405.
### Key Observations
1. **Performance Divergence:** A major divergence occurs around step 60. FIN-PRM and GRPO begin a strong upward trajectory, while Qwen2.5-Math-PRM-7B enters a steep decline.
2. **Peak Performance:** FIN-PRM achieves the highest overall accuracy, peaking near 0.58. GRPO peaks around 0.55. Qwen2.5's peak (~0.475) is significantly lower and occurs much earlier in the training process.
3. **Stability:** In the latter half of training (steps 90-180), FIN-PRM and GRPO maintain relatively high and stable accuracy, while Qwen2.5 stabilizes at a much lower accuracy level.
4. **Initial Phase:** All three models start within a similar accuracy range (~0.395 to 0.425) at step 0.
### Interpretation
The data suggests a comparative analysis of training methodologies or model architectures for a specific task (likely mathematical reasoning, given the model name "Qwen2.5-Math-PRM-7B").
* **FIN-PRM** demonstrates the most effective and robust learning curve. Its steady climb and high final plateau indicate a method that consistently improves and retains performance over many training steps.
* **GRPO(Rule-Based)** also shows strong learning, closely following FIN-PRM's trajectory until about step 100, after which it plateaus at a slightly lower level and shows minor degradation. This could indicate a method that learns quickly but may have a slightly lower performance ceiling or less stability in later stages.
* **Qwen2.5-Math-PRM-7B** exhibits a problematic training dynamic. The early volatility and spike suggest instability or potential overfitting to early training data. The subsequent crash and low-level stabilization imply a failure to generalize or a catastrophic forgetting event, where the model loses previously acquired knowledge. This pattern is a red flag, indicating the training process for this model may be flawed or unsuited for the task compared to the other two methods.
**Overall Implication:** For the task represented by this accuracy metric, the FIN-PRM and GRPO approaches are significantly more effective than the Qwen2.5-Math-PRM-7B approach over the long term. The chart provides strong visual evidence that the choice of method has a dramatic impact on both the learning trajectory and final model performance.
</details>
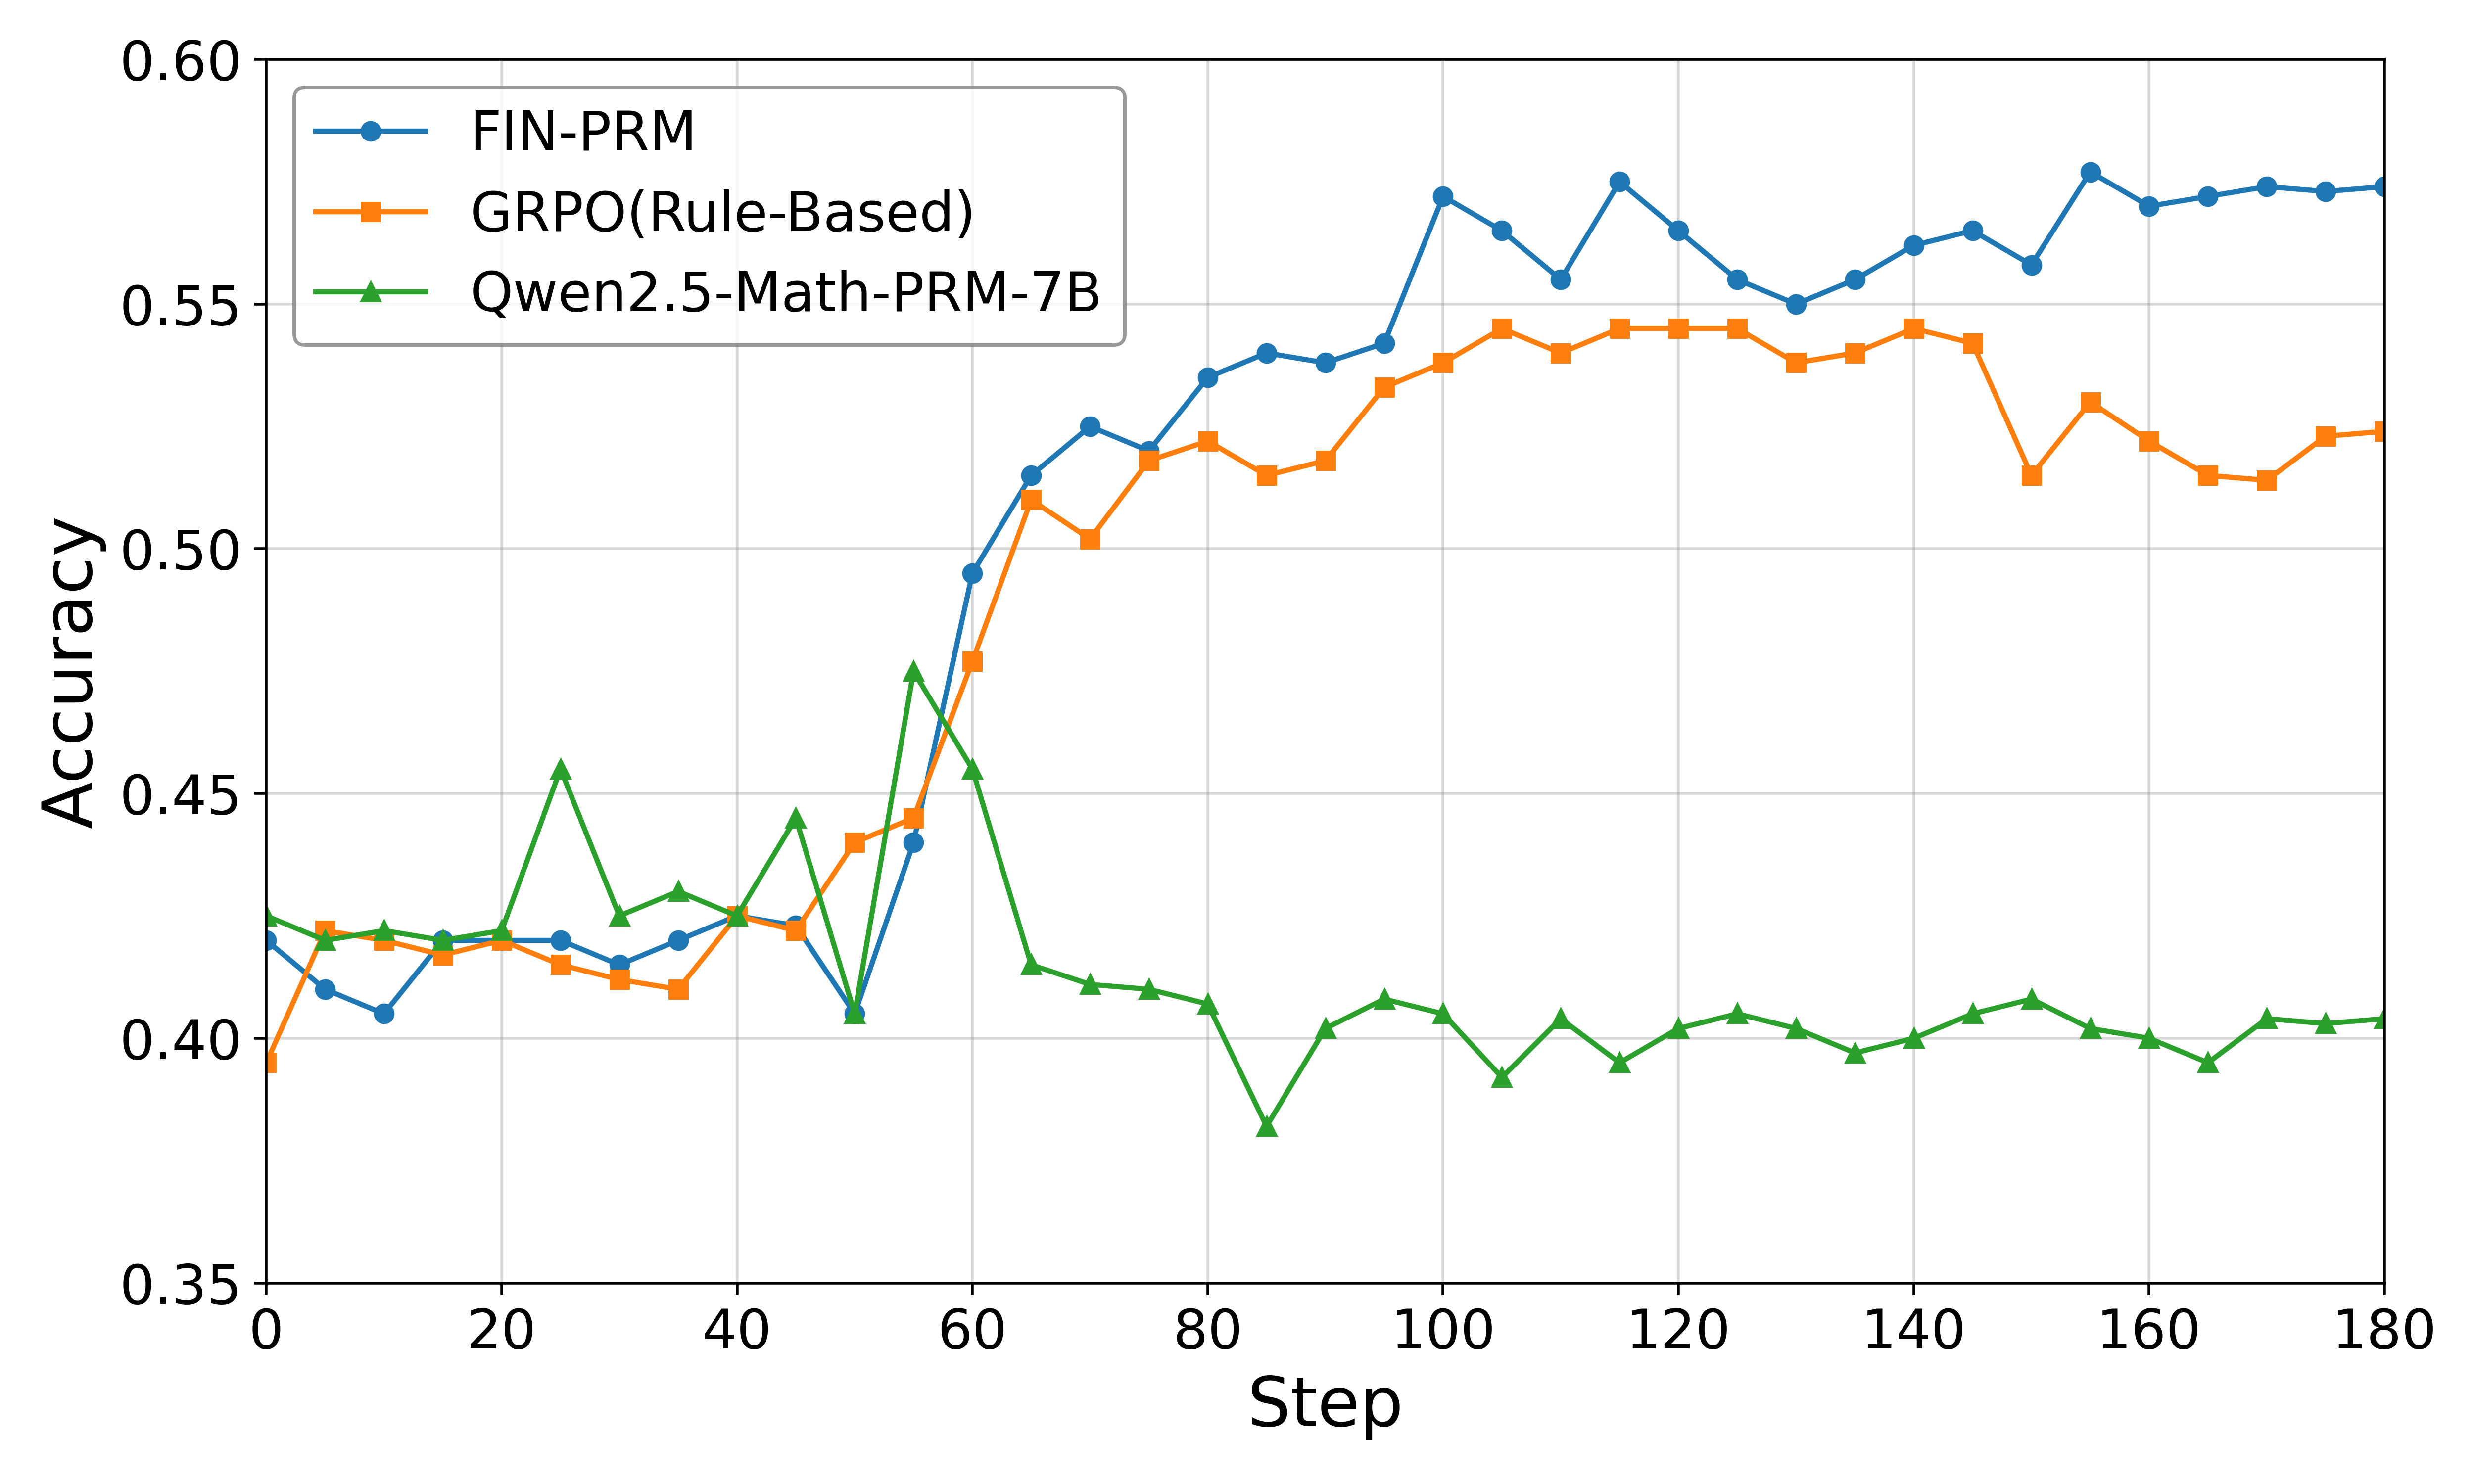
Figure 3: Performance of GRPO policy optimization using different reward signals. The policy model is Qwen2.5-7B-Instruct. We report mean accuracy over multiple runs.
Figure 3 presents the downstream reasoning performance after using different reward signals for GRPO policy optimization. We use Qwen2.5-7B-Instruct as the policy model and compare three reward sources: a rule-based signal using only $r_{\mathrm{out}}$ , the general-domain Qwen2.5-Math-PRM-7B, and our Fin-PRM.
Across all evaluations, using Fin-PRM as the reward source consistently yields the best-performing policy. Integrating Fin-PRM boosts performance on CFLUE to 70.5% and on FinQA to 62.8%, a significant gain of 3.3 points on both benchmarks compared to the rule-based heuristic. Crucially, Fin-PRM also outperforms the strong Qwen2.5-Math-PRM-7B baseline, highlighting that the domain-specific, factually-grounded process supervision it provides is more effective for guiding RL in a specialized domain than a general-purpose reward model. These results demonstrate that the high-quality learned reward signals from Fin-PRM substantially enhance policy optimization, leading to more capable financial reasoning models.
<details>
<summary>AAAI_Ablo.png Details</summary>

### Visual Description
\n
## Line Chart: Accuracy vs. ζ value
### Overview
This is a line chart plotting "Accuracy" on the vertical y-axis against "ζ value" on the horizontal x-axis. It displays four distinct data series, each represented by a different color and marker shape, corresponding to the numerical categories listed in the legend. The chart illustrates how accuracy changes as the ζ value increases from 0.00 to 2.00 for each category.
### Components/Axes
* **Y-axis (Vertical):**
* **Label:** "Accuracy"
* **Scale:** Linear, ranging from 0.62 to 0.68.
* **Major Ticks:** 0.62, 0.63, 0.64, 0.65, 0.66, 0.67, 0.68.
* **Grid:** Light gray horizontal grid lines at each major tick.
* **X-axis (Horizontal):**
* **Label:** "ζ value" (The Greek letter zeta).
* **Scale:** Linear, ranging from 0.00 to 2.00.
* **Major Ticks:** 0.00, 0.25, 0.50, 0.75, 1.00, 1.25, 1.50, 1.75, 2.00.
* **Grid:** Light gray vertical grid lines at each major tick.
* **Legend:**
* **Position:** Top-left corner of the plot area.
* **Entries:**
1. **Blue line with circle markers:** Label "2"
2. **Orange line with square markers:** Label "4"
3. **Green line with triangle markers:** Label "8"
4. **Red line with 'X' markers:** Label "16"
### Detailed Analysis
**Data Series Trends and Approximate Values:**
1. **Series "2" (Blue, Circles):**
* **Trend:** Shows a very slight, gradual upward trend with minor fluctuations. It is the lowest-performing series overall.
* **Key Points (Approximate):**
* Starts at ζ=0.00: Accuracy ≈ 0.631
* Reaches a local minimum around ζ=0.35-0.40: Accuracy ≈ 0.629
* Shows a gentle rise to a plateau between ζ=0.90 and ζ=1.00: Accuracy ≈ 0.637
* Fluctuates slightly between 0.633 and 0.637 for ζ > 1.00.
* Ends at ζ=2.00: Accuracy ≈ 0.635
2. **Series "4" (Orange, Squares):**
* **Trend:** Shows a moderate upward trend until ζ≈1.00, followed by a plateau and a slight decline towards ζ=2.00. Consistently performs above series "2".
* **Key Points (Approximate):**
* Starts at ζ=0.00: Accuracy ≈ 0.641
* Rises steadily to a peak plateau between ζ=0.95 and ζ=1.05: Accuracy ≈ 0.649
* After ζ=1.05, it gradually declines, with a small bump around ζ=1.70.
* Ends at ζ=2.00: Accuracy ≈ 0.641
3. **Series "8" (Green, Triangles):**
* **Trend:** Shows a strong upward trend from ζ=0.00 to ζ≈0.80, then plateaus at a high level with minor fluctuations before a slight decline at the highest ζ values. It is generally the second-highest performing series.
* **Key Points (Approximate):**
* Starts at ζ=0.00: Accuracy ≈ 0.649
* Rises sharply to reach a high plateau around ζ=0.80: Accuracy ≈ 0.670
* Maintains accuracy between ~0.670 and ~0.673 for most of the range ζ=0.80 to ζ=1.75.
* Shows a slight decline after ζ=1.75.
* Ends at ζ=2.00: Accuracy ≈ 0.667
4. **Series "16" (Red, 'X's):**
* **Trend:** Exhibits the most volatile behavior. It starts lower than series "8", rises to become the highest-performing series between ζ≈0.85 and ζ≈1.50, and then declines sharply. It shows significant fluctuations.
* **Key Points (Approximate):**
* Starts at ζ=0.00: Accuracy ≈ 0.656
* Rises with fluctuations, surpassing series "8" around ζ=0.80.
* Reaches its peak values between ζ=0.90 and ζ=1.00: Accuracy ≈ 0.681
* Maintains high accuracy (>0.675) until ζ≈1.50, with a notable dip around ζ=1.10.
* After ζ=1.50, it begins a pronounced downward trend.
* Ends at ζ=2.00: Accuracy ≈ 0.662, falling below series "8".
### Key Observations
1. **Performance Hierarchy:** There is a clear ordering of performance for most of the ζ range: Series "16" and "8" > Series "4" > Series "2". The gap between the top two series ("8" and "16") and the bottom two ("2" and "4") is substantial.
2. **Optimal ζ Range:** All series show improved accuracy as ζ increases from 0.00, reaching optimal or near-optimal performance in the range of ζ ≈ 0.80 to 1.50.
3. **Volatility vs. Stability:** Series "2" and "4" are relatively stable. Series "8" is stable at a high level after its initial rise. Series "16" is the most volatile, achieving the highest peak accuracy but also showing the sharpest decline at high ζ values.
4. **Crossover Point:** Series "16" (red) starts below series "8" (green) but crosses above it around ζ=0.80, indicating that for ζ values greater than ~0.80, the category "16" yields higher accuracy until about ζ=1.80, where they converge again.
### Interpretation
The chart demonstrates a positive correlation between the ζ value and model accuracy for all tested categories (2, 4, 8, 16), up to an optimal point. The data suggests that the parameter represented by ζ has a significant impact on performance.
* **Category Impact:** Higher-numbered categories (presumably representing a model parameter like number of layers, heads, or ensemble size) generally achieve higher maximum accuracy. Category "16" reaches the highest peak (~0.681), suggesting it has the greatest capacity or complexity.
* **The Role of ζ:** The ζ value appears to be a tuning parameter that controls a trade-off. Increasing ζ from 0 improves accuracy, likely by adjusting a regularization strength, learning rate, or similar hyperparameter. However, beyond an optimal range (around ζ=1.0-1.25 for the top performers), further increases become detrimental, especially for the most complex model (category "16"), which suffers a sharp performance drop. This indicates over-regularization or instability at high ζ values.
* **Practical Implication:** To maximize accuracy, one should use a higher-capacity model (category 8 or 16) and tune ζ to the 0.8-1.5 range. Category 8 offers a more stable high performance across a wider ζ range, while category 16 can achieve slightly higher peak accuracy but requires more precise tuning of ζ to avoid the performance cliff after ζ=1.5.
</details>
Figure 4: Ablation study on the ranking score weight $\zeta$ . The plot shows Best-of-N accuracy on the CFLUE test set as a function of $\zeta$ for different numbers of candidates (N). Fin-PRM’s best performance appears in $\zeta$ = 1
## 6 Ablation Study
To better understand the contributions of different components in our framework, we conduct a series of ablation studies on key hyperparameters.
### 6.1 Ablation on Ranking Score Weighting
As described in Equation 13, the hyperparameter $\zeta$ controls the balance between the aggregated step-level reward ( $\hat{R}_{\mathrm{step}}$ ) and the trajectory-level reward ( $\hat{R}_{\mathrm{traj}}$ ) when calculating the final score for ranking candidate solutions. To assess the impact of this balance, we conduct an ablation study by varying $\zeta$ and observing its effect on Best-of-N (BoN) selection performance.
### 6.2 Experimental Setup.
We perform BoN selection on our 1,000-sample CFLUE test set, using the same fine-tuned Qwen2.5-7B-Instruct model as the generator. For N values of 2, 4, 8, and 16, we vary $\zeta$ across the range [0.0, 2.0] and plot the resulting accuracy.
### 6.3 Results and Analysis.
As shown in Figure 4, the model’s performance is sensitive to the value of $\zeta$ . For larger N (specifically N=8 and N=16), we observe a clear and consistent trend: accuracy rises as $\zeta$ increases from 0, reaches a peak near $\zeta=1.0$ , and then gradually declines. This pattern reveals several key insights:
- When $\zeta=0$ , the ranking relies solely on step-level rewards. While this performs reasonably well, it is consistently suboptimal, indicating that step-level correctness alone is insufficient.
- Performance peaks at $\zeta\approx 1.0$ , where step-level and trajectory-level rewards are given roughly equal importance. This suggests that the most effective evaluation considers both the granular correctness of individual steps and the holistic quality of the entire reasoning path.
- As $\zeta$ becomes very large, performance degrades. This implies that over-relying on the trajectory score while ignoring step-level details leads to poorer selection, likely because the model may select trajectories that seem plausible overall but contain critical local flaws.
These results strongly validate our dual-granularity reward design, demonstrating that a balanced integration of both local and global signals is essential for accurately identifying superior reasoning processes. More ablation study about each parameters we used in paper can be found in appendix.
## 7 Discussion
Our experimental results across SFT, Best-of-N, and RL applications consistently demonstrate that Fin-PRM outperforms general-purpose baselines. This success validates our central thesis: for high-stakes domains like finance, effective process supervision requires a reward model that is not just logically coherent but deeply specialized and factually grounded. The key to Fin-PRM’s performance is its dual-level, knowledge-aware architecture. By integrating verifiable reward components ( $r_{\mathrm{acc}}$ and $r_{\mathrm{cover}}$ ) grounded in an expert-derived knowledge base, Fin-PRM moves beyond assessing mere logical plausibility to penalizing factual hallucinations. This confirms that for domains where truth is non-negotiable, a hybrid approach combining LLM-based qualitative assessment with explicit knowledge verification is critical.
While this framework provides a robust proof-of-concept, we acknowledge several limitations that open important avenues for future research: the construction of our 3k-sample dataset, while high-quality, was resource-intensive. To make domain-specific PRMs more accessible, future work should explore efficient, semi-automated methods for generating and annotating such specialized data at scale. Meanwhile, our knowledge base $\mathcal{K}$ is static, which poses a risk in a dynamic field like finance where regulations and market conditions evolve. Integrating dynamic knowledge sources, such as real-time financial news feeds or regulatory update APIs, would be a critical enhancement to prevent knowledge decay and ensure long-term reliability.
We select the hyperparameters in our work through ablation study, which were set fixed. A more advanced approach could involve learning these weights dynamically, perhaps through a meta-learning framework. This would allow the model to adapt the reward composition to the specific demands of each problem, potentially yielding further performance gains. Addressing these challenges is key to moving from a specialized model to an adaptive, continuously improving financial reasoning expert.
## 8 Conclusion
In this work, we introduced Fin-PRM, demonstrating that a domain-specialized, knowledge-aware process reward model significantly enhances financial reasoning. We believe this framework serves as a blueprint for developing trustworthy AI evaluators in other high-stakes fields like law and medicine, promoting a shift towards a portfolio of specialized, reliable models. Our work provides a solid foundation for building the next generation of LLMs capable of expert-level reasoning in specialized, real-world applications.
## References
- Bai et al. (2022) Bai, Y.; Jones, A.; Ndousse, K.; Askell, A.; Chen, A.; DasSarma, N.; Drain, D.; Fort, S.; Ganguli, D.; Henighan, T.; Joseph, N.; Kadavath, S.; Kernion, J.; Conerly, T.; El-Showk, S.; Elhage, N.; Hatfield-Dodds, Z.; Hernandez, D.; Hume, T.; Johnston, S.; Kravec, S.; Lovitt, L.; Nanda, N.; Olsson, C.; Amodei, D.; Brown, T.; Clark, J.; McCandlish, S.; Olah, C.; Mann, B.; and Kaplan, J. 2022. Training a Helpful and Harmless Assistant with Reinforcement Learning from Human Feedback. arXiv:2204.05862.
- Cui et al. (2025) Cui, G.; Yuan, L.; Wang, Z.; Wang, H.; Li, W.; He, B.; Fan, Y.; Yu, T.; Xu, Q.; Chen, W.; Yuan, J.; Chen, H.; Zhang, K.; Lv, X.; Wang, S.; Yao, Y.; Han, X.; Peng, H.; Cheng, Y.; Liu, Z.; Sun, M.; Zhou, B.; and Ding, N. 2025. Process Reinforcement through Implicit Rewards. arXiv:2502.01456.
- DeepSeek-AI et al. (2025) DeepSeek-AI; Guo, D.; Yang, D.; Zhang, H.; Song, J.; Zhang, R.; Xu, R.; Zhu, Q.; Ma, S.; Wang, P.; Bi, X.; Zhang, X.; Yu, X.; Wu, Y.; Wu, Z. F.; Gou, Z.; Shao, Z.; Li, Z.; Gao, Z.; Liu, A.; Xue, B.; Wang, B.; Wu, B.; Feng, B.; Lu, C.; Zhao, C.; Deng, C.; Zhang, C.; Ruan, C.; Dai, D.; Chen, D.; Ji, D.; Li, E.; Lin, F.; Dai, F.; Luo, F.; Hao, G.; Chen, G.; Li, G.; Zhang, H.; Bao, H.; Xu, H.; Wang, H.; Ding, H.; Xin, H.; Gao, H.; Qu, H.; Li, H.; Guo, J.; Li, J.; Wang, J.; Chen, J.; Yuan, J.; Qiu, J.; Li, J.; Cai, J. L.; Ni, J.; Liang, J.; Chen, J.; Dong, K.; Hu, K.; Gao, K.; Guan, K.; Huang, K.; Yu, K.; Wang, L.; Zhang, L.; Zhao, L.; Wang, L.; Zhang, L.; Xu, L.; Xia, L.; Zhang, M.; Zhang, M.; Tang, M.; Li, M.; Wang, M.; Li, M.; Tian, N.; Huang, P.; Zhang, P.; Wang, Q.; Chen, Q.; Du, Q.; Ge, R.; Zhang, R.; Pan, R.; Wang, R.; Chen, R. J.; Jin, R. L.; Chen, R.; Lu, S.; Zhou, S.; Chen, S.; Ye, S.; Wang, S.; Yu, S.; Zhou, S.; Pan, S.; Li, S. S.; Zhou, S.; Wu, S.; Ye, S.; Yun, T.; Pei, T.; Sun, T.; Wang, T.; Zeng, W.; Zhao, W.; Liu, W.; Liang, W.; Gao, W.; Yu, W.; Zhang, W.; Xiao, W. L.; An, W.; Liu, X.; Wang, X.; Chen, X.; Nie, X.; Cheng, X.; Liu, X.; Xie, X.; Liu, X.; Yang, X.; Li, X.; Su, X.; Lin, X.; Li, X. Q.; Jin, X.; Shen, X.; Chen, X.; Sun, X.; Wang, X.; Song, X.; Zhou, X.; Wang, X.; Shan, X.; Li, Y. K.; Wang, Y. Q.; Wei, Y. X.; Zhang, Y.; Xu, Y.; Li, Y.; Zhao, Y.; Sun, Y.; Wang, Y.; Yu, Y.; Zhang, Y.; Shi, Y.; Xiong, Y.; He, Y.; Piao, Y.; Wang, Y.; Tan, Y.; Ma, Y.; Liu, Y.; Guo, Y.; Ou, Y.; Wang, Y.; Gong, Y.; Zou, Y.; He, Y.; Xiong, Y.; Luo, Y.; You, Y.; Liu, Y.; Zhou, Y.; Zhu, Y. X.; Xu, Y.; Huang, Y.; Li, Y.; Zheng, Y.; Zhu, Y.; Ma, Y.; Tang, Y.; Zha, Y.; Yan, Y.; Ren, Z. Z.; Ren, Z.; Sha, Z.; Fu, Z.; Xu, Z.; Xie, Z.; Zhang, Z.; Hao, Z.; Ma, Z.; Yan, Z.; Wu, Z.; Gu, Z.; Zhu, Z.; Liu, Z.; Li, Z.; Xie, Z.; Song, Z.; Pan, Z.; Huang, Z.; Xu, Z.; Zhang, Z.; and Zhang, Z. 2025. DeepSeek-R1: Incentivizing Reasoning Capability in LLMs via Reinforcement Learning. arXiv:2501.12948.
- Gu et al. (2025) Gu, J.; Jiang, X.; Shi, Z.; Tan, H.; Zhai, X.; Xu, C.; Li, W.; Shen, Y.; Ma, S.; Liu, H.; Wang, S.; Zhang, K.; Wang, Y.; Gao, W.; Ni, L.; and Guo, J. 2025. A Survey on LLM-as-a-Judge. arXiv:2411.15594.
- Guha et al. (2025) Guha, E.; Marten, R.; Keh, S.; Raoof, N.; Smyrnis, G.; Bansal, H.; Nezhurina, M.; Mercat, J.; Vu, T.; Sprague, Z.; Suvarna, A.; Feuer, B.; Chen, L.; Khan, Z.; Frankel, E.; Grover, S.; Choi, C.; Muennighoff, N.; Su, S.; Zhao, W.; Yang, J.; Pimpalgaonkar, S.; Sharma, K.; Ji, C. C.-J.; Deng, Y.; Pratt, S.; Ramanujan, V.; Saad-Falcon, J.; Li, J.; Dave, A.; Albalak, A.; Arora, K.; Wulfe, B.; Hegde, C.; Durrett, G.; Oh, S.; Bansal, M.; Gabriel, S.; Grover, A.; Chang, K.-W.; Shankar, V.; Gokaslan, A.; Merrill, M. A.; Hashimoto, T.; Choi, Y.; Jitsev, J.; Heckel, R.; Sathiamoorthy, M.; Dimakis, A. G.; and Schmidt, L. 2025. OpenThoughts: Data Recipes for Reasoning Models. arXiv:2506.04178.
- Gunasekar et al. (2023) Gunasekar, S.; Zhang, Y.; Aneja, J.; Mendes, C. C. T.; Giorno, A. D.; Gopi, S.; Javaheripi, M.; Kauffmann, P.; de Rosa, G.; Saarikivi, O.; Salim, A.; Shah, S.; Behl, H. S.; Wang, X.; Bubeck, S.; Eldan, R.; Kalai, A. T.; Lee, Y. T.; and Li, Y. 2023. Textbooks Are All You Need. arXiv:2306.11644.
- He et al. (2024) He, J.; Wei, T.; Yan, R.; Liu, J.; Wang, C.; Gan, Y.; Tu, S.; Liu, C. Y.; Zeng, L.; Wang, X.; Wang, B.; Li, Y.; Zhang, F.; Xu, J.; An, B.; Liu, Y.; and Zhou, Y. 2024. Skywork-o1 Open Series. https://huggingface.co/Skywork.
- Khalifa et al. (2025) Khalifa, M.; Agarwal, R.; Logeswaran, L.; Kim, J.; Peng, H.; Lee, M.; Lee, H.; and Wang, L. 2025. Process Reward Models That Think. arXiv:2504.16828.
- Lightman et al. (2023a) Lightman, H.; Kosaraju, V.; Burda, Y.; Edwards, H.; Baker, B.; Lee, T.; Leike, J.; Schulman, J.; Sutskever, I.; and Cobbe, K. 2023a. Let’s Verify Step by Step. arXiv:2305.20050.
- Lightman et al. (2023b) Lightman, H.; Kosaraju, V.; Burda, Y.; Edwards, H.; Baker, B.; Lee, T.; Leike, J.; Schulman, J.; Sutskever, I.; and Cobbe, K. 2023b. Let’s Verify Step by Step. arXiv:2305.20050.
- Liu et al. (2025) Liu, R.; Gao, J.; Zhao, J.; Zhang, K.; Li, X.; Qi, B.; Ouyang, W.; and Zhou, B. 2025. Can 1B LLM Surpass 405B LLM? Rethinking Compute-Optimal Test-Time Scaling. arXiv:2502.06703.
- Luo et al. (2025) Luo, H.; Sun, Q.; Xu, C.; Zhao, P.; Lou, J.; Tao, C.; Geng, X.; Lin, Q.; Chen, S.; Tang, Y.; and Zhang, D. 2025. WizardMath: Empowering Mathematical Reasoning for Large Language Models via Reinforced Evol-Instruct. arXiv:2308.09583.
- Muennighoff et al. (2025) Muennighoff, N.; Yang, Z.; Shi, W.; Li, X. L.; Fei-Fei, L.; Hajishirzi, H.; Zettlemoyer, L.; Liang, P.; Candès, E.; and Hashimoto, T. 2025. s1: Simple test-time scaling. arXiv:2501.19393.
- Mukherjee et al. (2023) Mukherjee, S.; Mitra, A.; Jawahar, G.; Agarwal, S.; Palangi, H.; and Awadallah, A. 2023. Orca: Progressive Learning from Complex Explanation Traces of GPT-4. arXiv:2306.02707.
- Setlur et al. (2024) Setlur, A.; Nagpal, C.; Fisch, A.; Geng, X.; Eisenstein, J.; Agarwal, R.; Agarwal, A.; Berant, J.; and Kumar, A. 2024. Rewarding Progress: Scaling Automated Process Verifiers for LLM Reasoning. arXiv:2410.08146.
- Shao et al. (2024) Shao, Z.; Wang, P.; Zhu, Q.; Xu, R.; Song, J.; Bi, X.; Zhang, H.; Zhang, M.; Li, Y. K.; Wu, Y.; and Guo, D. 2024. DeepSeekMath: Pushing the Limits of Mathematical Reasoning in Open Language Models. arXiv:2402.03300.
- Snell et al. (2024) Snell, C.; Lee, J.; Xu, K.; and Kumar, A. 2024. Scaling LLM Test-Time Compute Optimally can be More Effective than Scaling Model Parameters. arXiv:2408.03314.
- Uesato et al. (2022) Uesato, J.; Kushman, N.; Kumar, R.; Song, F.; Siegel, N.; Wang, L.; Creswell, A.; Irving, G.; and Higgins, I. 2022. Solving math word problems with process- and outcome-based feedback. arXiv:2211.14275.
- Wang et al. (2024) Wang, P.; Li, L.; Shao, Z.; Xu, R. X.; Dai, D.; Li, Y.; Chen, D.; Wu, Y.; and Sui, Z. 2024. Math-Shepherd: Verify and Reinforce LLMs Step-by-step without Human Annotations. arXiv:2312.08935.
- Wei and Zou (2019) Wei, J.; and Zou, K. 2019. EDA: Easy Data Augmentation Techniques for Boosting Performance on Text Classification Tasks. arXiv:1901.11196.
- Xia et al. (2024) Xia, M.; Malladi, S.; Gururangan, S.; Arora, S.; and Chen, D. 2024. LESS: Selecting Influential Data for Targeted Instruction Tuning. arXiv:2402.04333.
- Xie et al. (2023) Xie, S. M.; Pham, H.; Dong, X.; Du, N.; Liu, H.; Lu, Y.; Liang, P.; Le, Q. V.; Ma, T.; and Yu, A. W. 2023. DoReMi: Optimizing Data Mixtures Speeds Up Language Model Pretraining. arXiv:2305.10429.
- Yang, Liu, and Wang (2023) Yang, H.; Liu, X.-Y.; and Wang, C. D. 2023. FinGPT: Open-Source Financial Large Language Models. arXiv:2306.06031.
- Ye et al. (2025) Ye, Y.; Huang, Z.; Xiao, Y.; Chern, E.; Xia, S.; and Liu, P. 2025. LIMO: Less is More for Reasoning. arXiv:2502.03387.
- Yu et al. (2024) Yu, L.; Jiang, W.; Shi, H.; Yu, J.; Liu, Z.; Zhang, Y.; Kwok, J. T.; Li, Z.; Weller, A.; and Liu, W. 2024. MetaMath: Bootstrap Your Own Mathematical Questions for Large Language Models. arXiv:2309.12284.
- Zhang et al. (2024) Zhang, K.; Zhang, J.; Li, H.; Zhu, X.; Hua, E.; Lv, X.; Ding, N.; Qi, B.; and Zhou, B. 2024. OpenPRM: Building Open-domain Process-based Reward Models with Preference Trees. ICLR 2024.
- Zhang et al. (2025) Zhang, Z.; Zheng, C.; Wu, Y.; Zhang, B.; Lin, R.; Yu, B.; Liu, D.; Zhou, J.; and Lin, J. 2025. The Lessons of Developing Process Reward Models in Mathematical Reasoning. arXiv:2501.07301.
- Zheng et al. (2023) Zheng, L.; Chiang, W.-L.; Sheng, Y.; Zhuang, S.; Wu, Z.; Zhuang, Y.; Lin, Z.; Li, Z.; Li, D.; Xing, E. P.; Zhang, H.; Gonzalez, J. E.; and Stoica, I. 2023. Judging LLM-as-a-Judge with MT-Bench and Chatbot Arena. arXiv:2306.05685.
- Zhu et al. (2025) Zhu, J.; Chen, Q.; Dou, H.; Li, J.; Guo, L.; Chen, F.; and Zhang, C. 2025. DianJin-R1: Evaluating and Enhancing Financial Reasoning in Large Language Models. arXiv:2504.15716.
- Zhu et al. (2024) Zhu, J.; Li, J.; Wen, Y.; and Guo, L. 2024. Benchmarking Large Language Models on CFLUE - A Chinese Financial Language Understanding Evaluation Dataset. In Ku, L.-W.; Martins, A.; and Srikumar, V., eds., Findings of the Association for Computational Linguistics: ACL 2024, 5673–5693. Bangkok, Thailand: Association for Computational Linguistics.
- Zou et al. (2025) Zou, J.; Yang, L.; Gu, J.; Qiu, J.; Shen, K.; He, J.; and Wang, M. 2025. ReasonFlux-PRM: Trajectory-Aware PRMs for Long Chain-of-Thought Reasoning in LLMs. arXiv:2506.18896.
## Appendix A Appendix
## Table of Contents
- Details on Models and Datasets
- Model Implementations
- Dataset Details
- Details on Reward Signal Construction
- Prompt for Qualitative Score ( $r_{\mathrm{qual}}$ )
- Prompt for Knowledge Extraction
- Additional Experimental Setups
- Fin-PRM Training
- Downstream Tasks (SFT, BoN, GRPO)
- Case Study: Fin-PRM in Action
## Appendix B A. Details on Models and Datasets
### B.1 A.1 Model Implementations
Generator Models.
Throughout our experiments, we utilize several powerful large language models as generators for reasoning traces and candidate solutions:
- Deepseek-R1: A highly capable reasoning model used in our initial data synthesis phase to generate the base reasoning trajectories from the Cflue dataset.
- Qwen3-235b-a22b: A state-of-the-art model used for two critical auxiliary tasks: (1) extracting the structured financial knowledge base $\mathcal{K}$ from expert analyses, and (2) serving as the powerful LLM-as-a-judge to provide the qualitative score, $r_{\mathrm{qual}}$ .
- Qwen2.5-7B-Instruct: A versatile and efficient model used as the base for our Fin-PRM, as well as the student model in our SFT experiments and the policy model in our GRPO and BoN experiments.
Reward Models (Baselines).
To benchmark the performance of Fin-PRM, we compare it against a strong, publicly available, general-purpose PRM:
- Qwen2.5-Math-PRM-7B: A state-of-the-art PRM specialized for the mathematics domain. It is trained on a vast corpus of math reasoning problems and serves as a powerful baseline to highlight the benefits of domain specialization. Its strong performance in a technical domain makes it a challenging benchmark for our finance-specific model.
- Qwen2.5-Math-PRM-72B: A state-of-the-art PRM specialized for the mathematics domain. The larger 72-billion parameter version, included to establish a strong upper-bound for general-purpose PRM performance on our tasks.
### B.2 A.2 Dataset Details
Primary Data Source.
Our entire framework is built upon the CFLUE (Chinese Financial Language Understanding Evaluation) benchmark. We selected CFLUE because it is a high-quality, knowledge-intensive dataset where questions are accompanied by detailed, human-written expert analyses. This unique feature provides the ground-truth knowledge necessary for our fact-checking reward components ( $r_{\mathrm{acc}}$ ).
Synthesized Reasoning Dataset.
We constructed a new dataset of 3,000 samples for training Fin-PRM. Each sample in our dataset, $\mathcal{D}$ , is a tuple $(x,s,a,\mathcal{K}_{x},y,y_{\mathrm{analysis}})$ containing:
- $x$ : The original question from CFLUE.
- $s$ : The reasoning trace generated by Deepseek-R1.
- $a$ : The final answer synthesized by Deepseek-R1.
- $\mathcal{K}_{x}$ : The subset of our global knowledge base $\mathcal{K}$ relevant to question $x$ .
- $y$ : The ground-truth correct answer from CFLUE.
- $y_{\mathrm{analysis}}$ : The ground-truth expert analysis from CFLUE, used to construct $\mathcal{K}$ .
This structure enables our multi-faceted reward signal construction and provides a robust foundation for training a knowledge-aware reward model.
#### Prompt for reasoning trace $s$ and solution $a$
To synthesize the reasoning traces ( $s$ ) and their corresponding solutions ( $a$ ), we prompt the Deepseek-R1 model with a detailed set of instructions. This prompt is designed to elicit a long-form, step-by-step thought process, followed by a clean, final answer. The full prompt is shown in Listing 1. The ‘[Question Text]‘ placeholder is then replaced with the actual question from the CFLUE dataset.
Listing 1: Prompt for Generating Reasoning Traces and Solutions from Deepseek-R1
⬇
1 Your role as an assistant involves thoroughly exploring questions through a systematic long thinking process before providing the final precise and accurate solutions. This requires engaging in a comprehensive cycle of analysis, summarizing, exploration, reassessment, reflection, backtracing, and iteration to develop a well - considered thinking process. Please structure your response into two main sections: Thought and Solution.
2
3 In the Thought section, detail your reasoning process using the specified format:
4 <| begin_of_thought |>
5 {thought with steps separated with ’\ n \ n ’}
6 <| end_of_thought |>
7 Each step should include detailed considerations such as analyzing questions, summarizing relevant findings, brainstorming new ideas, verifying the accuracy of the current steps, refining any errors, and revisiting previous steps.
8
9 In the Solution section, based on various attempts, explorations, and reflections from the Thought section, systematically present the final solution that you deem correct. The solution should maintain a logical, accurate, concise expression style and detail necessary steps needed to reach the conclusion, formatted as follows:
10 <| begin_of_solution |>
11 {final formatted, precise, and clear solution}
12 <| end_of_solution |>
13
14 Now, try to solve the following question through the above guidelines:
15 [Question Text]
#### Prompt for Knowledge Extraction
To construct the ground-truth knowledge base ( $\mathcal{K}_{x}$ ) for each question, we prompt the LLM judge to act as a domain expert. Its task is to read the trusted expert analysis ( $y_{\mathrm{analysis}}$ ) provided in the dataset and extract all key financial terms along with their definitions as presented in the text. This process creates a structured, verifiable source of facts for the downstream accuracy and coverage rewards. The prompt template is detailed in Listing 2.
Listing 2: Template for the Knowledge Extraction Prompt
⬇
1 You are a financial knowledge extraction expert. Read the following expert analysis and identify all key financial terms and concepts. For each term, provide a concise definition based on the text.
2
3 ** Expert Analysis Text:**
4 [Expert Analysis from the Dataset]
5
6 ---
7 ** Your Task:**
8 Output a JSON list where each object represents a key knowledge point.
9
10 ** Output Format (JSON list only):**
11 [
12 {
13 " Term ": "< Identified_Term_1 >",
14 " Explanation ": "< Definition_of_Term_1 >"
15 },
16 {
17 " Term ": "< Identified_Term_2 >",
18 " Explanation ": "< Definition_of_Term_2 >"
19 }
20]
## Appendix C B. Details on Reward Signal Construction
This section provides further details on the prompts used to generate the multi-faceted reward signals described in the main paper. These prompts are designed to elicit structured, machine-readable outputs from a powerful LLM judge (Qwen3-235b-a22b).
### C.1 B.1 Prompt for Qualitative Score ( $r_{\mathrm{qual}}$ )
To assess the intrinsic quality of each reasoning step, we use a structured prompt that asks the LLM judge to evaluate a step ( $s_{t}$ ) based on three criteria. The prompt takes the original question ( $x$ ), the reasoning history ( $s_{<t}$ ), and the current step ( $s_{t}$ ) as input.
The LLM is instructed to provide a score from 0.0 to 1.0 for each of the following aspects, ensuring the output is a machine-parsable JSON object:
- Logical Soundness: How coherent and logically valid is the reasoning within this specific step?
- Step Correctness: Is the information presented in the step factually or procedurally correct, independent of the overall strategy?
- Target Progression: How effectively does this step move the overall reasoning process closer to a correct final answer?
The template for this prompt is shown in Listing 3.
Listing 3: Template for the Qualitative Score Prompt
⬇
1 You are an expert financial analyst. Given the question, the previous reasoning steps, and the current step, evaluate the quality of the ** current step **.
2
3 ** Question:**
4 [Original Question Text]
5
6 ** Reasoning History:**
7 [Reasoning History up to step t -1]
8
9 ** Current Step to Evaluate:**
10 [Text of step t]
11
12 ---
13 ** Your Task:**
14 Provide a JSON object with your evaluation based on three criteria:
15 1. ‘ logical_soundness ‘: How logical is the current step?
16 2. ‘ step_correctness ‘: Is the information in the step correct?
17 3. ‘ target_progression ‘: Does the step help solve the problem?
18
19 ** Output Format (JSON only):**
20 {
21 " logical_soundness ": < float_from_0_to_1 >,
22 " step_correctness ": < float_from_0_to_1 >,
23 " target_progression ": < float_from_0_to_1 >
24}
### C.2 B.2 Prompts for Verifiable and Knowledge-Based Rewards
This subsection details the prompts used to generate rewards that are grounded in external, verifiable information, such as the ground-truth answer or our extracted knowledge base. These prompts are crucial for ensuring the factual correctness and anti-hallucination properties of Fin-PRM.
#### Prompt for Accuracy Score ( $r_{\mathrm{acc}}$ )
The accuracy score is a composite of two verifiable checks. We use distinct prompts for each to ensure a grounded, factual evaluation.
Procedural Correctness Prompt.
This prompt verifies if a step is a valid move towards the known correct answer ( $y$ ), assessing its logical utility in the context of a correct solution path.
Listing 4: Template for Procedural Correctness Prompt
⬇
1 You are a logical verifier. Given the reasoning so far and the known correct answer, determine if the current step is a logically sound and productive move towards that answer.
2
3 ** Question:**
4 [Original Question Text]
5
6 ** Reasoning History:**
7 [Reasoning History up to step t -1]
8
9 ** Correct Final Answer:**
10 [Ground Truth Answer y]
11
12 ** Current Step to Evaluate:**
13 [Text of step t]
14
15 ---
16 ** Your Task:**
17 Is this step a valid, logical progression towards the correct final answer? Respond with a JSON object containing a binary value.
18
19 ** Output Format (JSON only):**
20 { " procedural_correctness ": <1 _for_yes_or_0_for_no > }
Factual Accuracy Prompt.
This prompt validates the claims within a step against the extracted knowledge base ( $\mathcal{K}_{x}$ ), acting as a direct anti-hallucination check.
Listing 5: Template for Factual Accuracy Prompt
⬇
1 You are a fact - checking agent. Verify every factual claim and financial term in the " Current Step " against the provided " Knowledge Base ".
2
3 ** Knowledge Base:**
4 - < Term_1 >: < Definition_1 >
5 - < Term_2 >: < Definition_2 >
6
7 ** Current Step to Evaluate:**
8 [Text of step t]
9
10 ---
11 ** Your Task:**
12 Are all claims and terms in the current step supported by the knowledge base? Respond with a JSON object containing a binary value.
13
14 ** Output Format (JSON only):**
15 { " factual_accuracy ": <1 _if_all_claims_are_supported_or_0_otherwise > }
#### Prompt for Knowledge Coverage ( $r_{\mathrm{cover}}$ )
To calculate the trajectory-level knowledge coverage score, this prompt asks the LLM to verify which of the required knowledge points ( $\mathcal{K}_{x}$ ) were used in the model’s full generated response ( $s$ and $a$ ).
Listing 6: Template for the Knowledge Coverage Prompt
⬇
1 You are a verification agent. Your task is to check if the required financial knowledge points were used in the provided model response.
2
3 ** Required Knowledge Points:**
4 1. < Term_1 >: < Definition_1 >
5 2. < Term_2 >: < Definition_2 >
6...
7
8 ** Model ’ s Reasoning Trace and Answer:**
9 [Model ’ s Full Generated Response]
10
11 ---
12 ** Your Task:**
13 Analyze the model ’ s response and determine how many of the required knowledge points were covered. Output a JSON object with the count and indices of the covered points.
14
15 ** Output Format (JSON only):**
16 {
17 " coverage_number ": < integer >,
18 " coverage_index ": [< list_of_covered_indices >]
19}
## Appendix D C. Additional Experimental Setups
This section provides detailed configurations and hyperparameters for the training of Fin-PRM and its application in the three downstream tasks.
### D.1 C.1 Fin-PRM Training Details
Fin-PRM was trained by fine-tuning the Qwen2.5-7B-Instruct model on our newly constructed financial reasoning dataset. The training objective combined step-level and trajectory-level losses, as described in Equation 16. The key hyperparameters used for training are summarized in Table 3. All training was conducted on NVIDIA A100 GPUs.
Table 3: Hyperparameters for Fin-PRM Training.
| Parameter Base Model Dataset Size | Value Qwen2.5-7B-Instruct 3,000 samples |
| --- | --- |
| Learning Rate | 2e-5 |
| Batch Size | 1(per device) |
| Gradient Accumulation Steps | 2 |
| Max Sequence Length | 8192 |
| Epochs | 3 |
| Optimizer | AdamW |
| LR Scheduler | Cosine with warmup |
| Warmup Steps | 50 |
| Loss Weight ( $\lambda$ in Eq. 16) | 1.0 |
### D.2 C.2 Downstream Task Setups
This subsection details the experimental setups for the three application scenarios: Supervised Fine-Tuning (SFT), Best-of-N (BoN) selection, and Group Relative Policy Optimization (GRPO).
#### SFT with Data Selection
For the offline data selection task, we first used Fin-PRM to score and select the top 1,000 reasoning traces from a larger pool of synthetic data. We then fine-tuned the Qwen2.5-7B-Instruct model on this curated subset. The SFT process used the same set of hyperparameters as the PRM training (see Table 3), ensuring a fair comparison.
#### Best-of-N (BoN) Selection
In the test-time scaling experiments, the policy model (Qwen2.5-7B-Instruct) generated N candidate responses for each question. Fin-PRM then scored each candidate using the composite ranking score from Equation 20. The candidate with the highest score was selected as the final answer. Based on our ablation study (Figure 4), the hyperparameter $\zeta$ was set to 1.0 to give equal weight to step-level and trajectory-level rewards.
#### GRPO Reinforcement Learning
For the online policy optimization, we integrated Fin-PRM into the GRPO framework. The policy model was Qwen2.5-7B-Instruct, initialized from the same base checkpoint as other experiments. The composite reward from Equation 22 was used to calculate advantages. Key GRPO-specific hyperparameters are listed in Table 4.
Table 4: Hyperparameters for GRPO Policy Optimization.
| Parameter Policy Model Samples per Group (N) | Value Qwen2.5-7B-Instruct 6 |
| --- | --- |
| Reward Composition ( $\delta$ in Eq. 22) | 0.5 |
| KL Penalty Coefficient ( $\beta_{\mathrm{KL}}$ ) | 0.001 |
| PPO Clipping Parameter ( $\epsilon$ ) | 0.2 |
| Epochs | 1 |
| Batch Size | 32 |
| Learning Rate | 1e-6 |
## Appendix E D. Case Study: A Data Sample in Detail
To better illustrate the granular nature of our reward signals, this section presents a complete data sample in a format that explicitly links each reasoning step to its corresponding reward score.
Question: A business of a commercial bank that does not constitute on-balance-sheet assets or liabilities but generates non-interest income is called its ( ). Choices: A: Investment business, B: Asset business, C: Intermediary business, D: Liability business
### Thinking Trajectories
Step 1: Analyze the Problem
The problem requires identifying a commercial bank’s business type. The key criteria are: (1) It does not constitute on-balance-sheet assets or liabilities, meaning it is an off-balance-sheet business. (2) It generates non-interest income, such as fees or commissions. The options are A. Investment, B. Asset, C. Intermediary, and D. Liability business. The reasoning must be based on the classification of commercial bank operations. [Step-level reward: 0.644]
Step 2: Summarize Findings
- Asset business (Option B): Involves the use of bank funds, forming on-balance-sheet assets (e.g., loans, securities investments). It primarily generates interest income and does not meet the ”off-balance-sheet” condition. - Liability business (Option D): Involves the bank’s sources of funds, forming on-balance-sheet liabilities (e.g., deposits, borrowings). It primarily incurs interest expenses and does not fit the criteria. - Investment business (Option A): Typically refers to the bank investing in financial instruments (bonds, stocks), which is a subset of asset business. It constitutes on-balance-sheet assets. - Intermediary business (Option C): Refers to the bank acting as a service intermediary, not using its own funds. It is off-balance-sheet and its income comes from fees and commissions (non-interest income). This matches the description. [Step-level reward: 0.769]
Step 3: Brainstorm New Ideas
To test the robustness of the conclusion, this step considers potential edge cases. For instance, do certain investment activities like derivatives trading count? Or do credit card fees (non-interest income) from a liability product complicate the definition? This deepens the analysis beyond a superficial match. [Step-level reward: 0.753]
Step 4: Verify Step Accuracy
This step cross-references the definition of ”intermediary business” with formal regulations, such as a country’s Commercial Bank Law or accounting standards. It confirms that these formal sources align with the conclusion from Step 2, providing an external, factual grounding. [Step-level reward: 0.686]
Step 5: Refine Errors
The model considers and clarifies potential misconceptions. For example, it distinguishes between a contingent liability (like a letter of credit, common in intermediary business) which is off-balance-sheet until triggered, and a direct on-balance-sheet liability. This refines the understanding and prevents oversimplification. [Step-level reward: 0.839]
Step 6: Revisit Previous Steps
The final step involves a full review of the reasoning chain. It confirms that the initial analysis in Step 1 was correct, the evaluation in Step 2 was sound, and the verifications in subsequent steps all support the same conclusion, ensuring the entire trajectory is logically coherent. [Step-level reward: 0.837]
### Final Response
Based on the thought process, the business is the commercial bank’s intermediary business.
- Reason: Intermediary business does not constitute on-balance-sheet assets or liabilities (i.e., it is an off-balance-sheet business) but generates non-interest income (such as fees and commissions) by providing intermediary services (e.g., payment settlement, agency services, consulting).
- Exclusion of other options:
- A. Investment business: Constitutes an on-balance-sheet asset.
- B. Asset business: Directly forms an on-balance-sheet asset.
- D. Liability business: Forms an on-balance-sheet liability.
Therefore, the correct answer is C. Intermediary Business. [Trajectory-level Label: 1 (Correct)]