# Robustness Assessment and Enhancement of Text Watermarking for Google’s SynthID
**Authors**: Xia Han, Qi Li, Jianbing Niand Mohammad Zulkernine
> ∗ Xia Han and Qi Li contributed equally to this work.
## Abstract
Recent advances in LLM watermarking methods such as SynthID-Text by Google DeepMind offer promising solutions for tracing the provenance of AI-generated text. However, our robustness assessment reveals that SynthID-Text is vulnerable to meaning-preserving attacks, such as paraphrasing, copy-paste modifications, and back-translation, which can significantly degrade watermark detectability. To address these limitations, we propose SynGuard, a hybrid framework that combines the semantic alignment strength of Semantic Invariant Robust (SIR) with the probabilistic watermarking mechanism of SynthID-Text. Our approach jointly embeds watermarks at both lexical and semantic levels, enabling robust provenance tracking while preserving the original meaning. Experimental results across multiple attack scenarios show that SynGuard improves watermark recovery by an average of 11.1% in F1 score compared to SynthID-Text. These findings demonstrate the effectiveness of semantic-aware watermarking in resisting real-world tampering. All code, datasets, and evaluation scripts are publicly available at: https://github.com/githshine/SynGuard.
## I Introduction
Text watermarking has emerged as a promising solution for tracing the origin of AI-generated content, offering a lightweight, model-agnostic method for content provenance verification [1, 2]. It identifies generated text from surface form alone, without access to the original prompt or underlying model. This makes watermarking especially appealing in open-world scenarios, where black-box models and unknown sources proliferate.
Among existing approaches, Google DeepMind’s SynthID-Text is state-of-the-art [3], notable as the only watermarking method integrated into a real-world product (Google’s Gemini models), a rare industrial deployment in this domain. It embeds imperceptible statistical signals during generation via tournament sampling, departing from earlier post-hoc or green-list based methods [4, 1]. This approach introduces controlled stochasticity in token selection and shows improved detectability in benign settings. However, its resilience to malicious tampering remains underexplored. Previous studies note the fragility of lexical watermarks under meaning-preserving, surface-altering transformations [5, 6]; SynthID-Text, despite advancements, shares this limitation, motivating deeper analysis of its practical robustness.
In this work, we systematically assess SynthID-Text under real-world meaning-preserving transformations: paraphrasing, synonym substitution, copy-paste rearrangement, and back-translation, attacks preserving semantic content while modifying lexical or syntactic surface form. Results reveal a critical vulnerability: detection accuracy drops sharply even under light paraphrasing or translation. These findings align with prior concerns, highlighting a gap in current capabilities.
To address this, we propose SynGuard, a hybrid scheme integrating Semantic Invariant Robust (SIR) alignment [6] with SynthID’s token-level probabilistic masking. Our method embeds provenance signals at both lexical and semantic levels: the semantic component guides generation toward SIR-favored contexts (enhancing robustness to synonym and paraphrase attacks), while SynthID’s token logic retains seed-derived randomness (resisting keyless removal).
Unlike prior lexical-only approaches [1, 3], SynGuard adds a semantic signal to detect tampering that preserves meaning but alters surface structure. This hybrid design better balances false positive rate and tampering robustness. We formalize this via theoretical analysis (Section V-C), showing semantically consistent transformations rarely suppress SIR-guided scores unless meaning is significantly distorted, one of the first formal analyses of watermark resilience under semantic equivalence.
Empirical evaluation across four attacks shows SynGuard improves average F1 by 11.1% over SynthID-Text, performing especially well under paraphrasing and round-trip translation (common in content reposting and cross-lingual reuse). We uncover a new vulnerability axis: back-translation-induced watermark degradation correlates with translation quality, as poorer machine translation distorts signals more even with preserved semantics. This insight introduces new considerations for evaluating robustness across linguistic contexts and highlights the need for multilingual benchmarks.
Our contributions are summarized as follows:
1. Conduct the first comprehensive robustness evaluation of SynthID-Text under four meaning-preserving transformations: paraphrasing, synonym substitution, copy-paste tampering, back-translation.
1. Propose SynGuard, a hybrid algorithm combining semantic-aware token preferences with token-level probabilistic sampling.
1. Demonstrate SynGuard consistently improves detection robustness, particularly for surface-altered but meaning-preserved content.
1. Reveal back-translation attack vulnerability correlates with machine translation quality, an overlooked axis.
## II Related Work
Text watermarking distinguishes AI vs human text by embedding specific information into text sequences without quality loss. By watermark insertion stage in text generation, methods fall into two types [4]: watermarking for existing text and during generation. The first type adds watermarks via post-processing of existing text, typically via reformatting sentences with Unicode, altering lexicon or syntax. Though easy to implement, they are easy to remove via reformatting/normalization.
Watermarking during generation is achieved by modifying logits in token generation. This approach is more stable, imperceptible, harder for attackers to detect/remove. A key method is the KGW algorithm [1]: it splits vocabulary into green/red lists via pseudorandom seed. Adding positive bias to green list tokens makes them more likely selected than red ones. This skew enables high-confidence post hoc detection. KGW balances robustness and imperceptibility, underpinning recent frameworks [7, 8, 9].
Google DeepMind’s SynthID-Text [3] advances generation-based watermarking by using pseudorandom functions (PRFs) and tournament sampling to guide token generation in a more randomized and less perceptible manner. During the sampling process, each token candidate is assigned $m$ independent $g$ -values $(g_{1},...,g_{m})$ , and the token with the highest total $g$ -value (e.g., the sum of all $g_{i}$ ) among all candidates is selected. These $g$ -values can later be used for watermark detection. This design improves robustness against removal attacks such as truncation and basic paraphrasing.
Despite these strengths, most generation-time watermarking algorithms, including SynthID-Text, do not incorporate semantic information when adjusting logits. As a result, they remain vulnerable to semantic-preserving adversarial attacks. Recent studies have begun exploring semantic-aware watermarking strategies [6, 10, 11]. A Semantic Invariant Robust watermarking algorithm is introduced [6], which maps extracted semantic features from preceding context into the logit space to guide next-token generation. In this approach, semantic similarity becomes a key indicator for detecting watermarks. While promising in terms of robustness, this method relies on additional language models, which increases computational complexity and resource consumption. Furthermore, enforcing semantic consistency reduces output diversity and naturalness.
## III Preliminaries
### III-A Large Language Model
A large language model (LLM) $M$ operates over a defined set of tokens, known as the vocabulary $V$ . Given a sequence of tokens $t=[t_{0},t_{1},\ldots,t_{T-1}]$ , also referred to as the prompt, the model computes the probability distribution over the next token $t_{T}$ as $P_{M}(t_{T}\mid t_{:T-1})$ . The model $M$ then samples one token from the vocabulary $V$ according to this distribution and other sampling parameters (e.g., temperature). This process is repeated iteratively until the maximum token length is reached or an end-of-sequence (EOS) token is generated.
This next-token prediction is typically implemented using a neural network architecture called the Transformer [12]. The process involves two main steps:
1. The Transformer computes a vector of logits $z_{T}=M_{t_{:T-1}}$ over all tokens in $V$ , based on the current context $t_{:T-1}$ .
1. The softmax function is applied to these logits to produce a normalized probability distribution: $P_{M}(t_{T}\mid t_{:T-1})$ .
### III-B SynthID-Text in LLM Text Watermarking
Text watermarking for LLMs operates mainly at two stages: embedding-level (modifying internal embedding vectors, which is complex and less generalizable) and generation-level (altering token generation via logits adjustment or sampling strategies). Generation-level methods include logits-based approaches (e.g., KGW algorithm [1], biasing logits toward “green list” tokens) and sampling-based approaches (e.g., Christ algorithm [13], using pseudorandom functions to guide sampling without logit modification).
SynthID-Text is a sampling-based algorithm featuring a novel tournament sampling mechanism for token selection. Candidate tokens are sampled from the original LLM-generated probability distribution $p_{LM}$ , so higher-probability tokens may appear multiple times in the candidate set. Each candidate token is evaluated using $m$ independent pseudorandom binary watermark functions $g_{1},g_{2},...,g_{m}$ . These functions assign a value of 0 or 1 to a token $x\in V$ based on both the token and a random seed $r\in\mathbb{R}$ : $g_{l}(x,r)\in\{0,1\}.$ The tournament sampling procedure selects the token with statistically high $g$ -values across the $m$ functions, while respecting the base LLM distribution. To detect if a text $t=[t_{1},...,t_{T}]$ is watermarked, the average $g$ -value across all tokens and functions is computed:
$$
\text{Score}(t)=\frac{1}{mT}\sum_{i=1}^{T}\sum_{l=1}^{m}g_{l}(t_{i},r_{i}). \tag{1}
$$
### III-C Text Watermarking Challenges
Compared to watermarking techniques in other media such as images or audio [14, 15, 16, 17], embedding watermarks in text introduces a distinct set of challenges:
Token Budget Constraints: A standard $256\times 256$ image offers over 65K potential pixel positions for embedding watermarks [18]. In contrast, the maximum token length for LLMs like GPT-4 is around 8.2K tokens (with limited access to 32K https://openai.com/index/gpt-4-research/), which is significantly smaller. This limited capacity makes it harder to embed watermarks without detection by human readers and increases vulnerability to adversarial edits. As a result, watermarking algorithms for text require more careful design to ensure both imperceptibility and robustness.
Perturbation Sensitivity: Text data is highly sensitive to editing [19]. While small pixel changes in an image are often imperceptible to the human eye, even minor alterations in a text, such as character replacements or word substitutions, can be easily noticed by readers or detected by spelling and grammar tools. Moreover, replacing entire words can unintentionally alter the meaning, introduce ambiguity, or degrade sentence fluency.
Vulnerability: Watermarks in text are particularly susceptible to removal through common natural language transformations. An attacker can easily re-edit the content by substituting synonyms, or paraphrasing with new sentence structures [20].
## IV Evaluating the Robustness of SynthID-Text
This chapter presents the experimental settings, evaluation metrics, and results from robustness analysis of the SynthID-Text watermarking algorithm. Section VI-A outlines the experimental setup, including the backbone model, dataset, and metrics used for evaluation. Sections IV-B through IV-E report SynthID-Text’s performance under four types of text editing attacks: synonym substitution, copy-and-paste, paraphrasing, and re-translation. Finally, Section IV-F summarizes and compares results across all attack types to provide a comprehensive evaluation.
### IV-A Experimental Setup
Backbone Model and Dataset. All experiments were conducted using Sheared-LLaMA-1.3B [21], a model further pre-trained from meta-llama/Llama-2-7b-hf https://huggingface.co/meta-llama/Llama-2-7b-hf. The model used is publicly available via HuggingFace https://huggingface.co/princeton-nlp/Sheared-LLaMA-1.3B. For the dataset, we adopt the Colossal Clean Crawled Corpus (C4) [22], which includes diverse, high-quality web text. Each C4 sample is split into two segments: the first segment serves as the prompt for generation, while the second (human-written) segment is used as reference text. These unaltered human texts are treated as control data for evaluating the watermark detector’s false positive rate.
Evaluation Metrics. The robustness of SynthID-Text is evaluated using the following metrics:
- True Positive Rate (TPR): The proportion of watermarked texts correctly identified.
- False Positive Rate (FPR): The proportion of unwatermarked texts incorrectly identified as watermarked.
- F1 Score: The harmonic mean of precision and recall, computed at the best threshold.
- ROC-AUC: The area under the Receiver Operating Characteristic (ROC) curve, measuring overall classification performance across all thresholds.
Each experiment was conducted using 200 watermarked and 200 unwatermarked samples, each with a fixed length of $T=200$ tokens. All experiments were implemented using the MarkLLM toolkit [23].
### IV-B Synonym Substitution Attack
Given an original text sequence, the synonym substitution attack aims to replace words with their synonyms until a specified replacement ratio $\epsilon$ is reached, or no further substitutions are possible. This approach maintains semantic fidelity while subtly altering the lexical surface of the text. A well-chosen $\epsilon$ ensures that the semantic meaning remains largely intact, which aligns with the attack’s objective—to disrupt watermark detection without affecting readability or content.
In this work, synonym replacement is guided by a context-aware language model to ensure substitutions remain semantically appropriate. Specifically, we implemented a method that uses WordNet [24], a widely used lexical database of English, to retrieve synonym sets for eligible words. For each target word, a synonym is randomly selected using the NumPy library’s random function [25]. The substitution is further refined using BERT-Large [26], which predicts contextually suitable replacements. The process is repeated iteratively until the desired substitution ratio $\epsilon$ is reached or no more valid substitutions remain. This ensures the altered text remains semantically coherent while maximally disrupting watermark patterns.
Details of the BERT Span Attack. To perform context-aware synonym substitution, BERT-Large https://huggingface.co/google-bert/bert-large-uncased is first used to tokenize the watermarked text. Then, eligible words are iteratively replaced with contextually appropriate synonyms until either the maximum replacement ratio $\epsilon$ is reached or no further substitutions are possible. The substitution process proceeds as follows:
- Randomly select a word that has at least one synonym and replace it with a [MASK] token:
⬇
"I love programming."
"I [MASK] programming."
Listing 1: Word Masking
- Feed the masked sentence into the BERT-Large model, which produces a logits vector over the vocabulary using a forward pass.
- Rank all candidate words based on their logits and select the word with the highest probability to replace the masked token.
BERT-Large is chosen for its bidirectional architecture, allowing it to consider both preceding and succeeding context when predicting the masked word. This contextual understanding ensures that substituted words maintain semantic consistency with the original sentence.
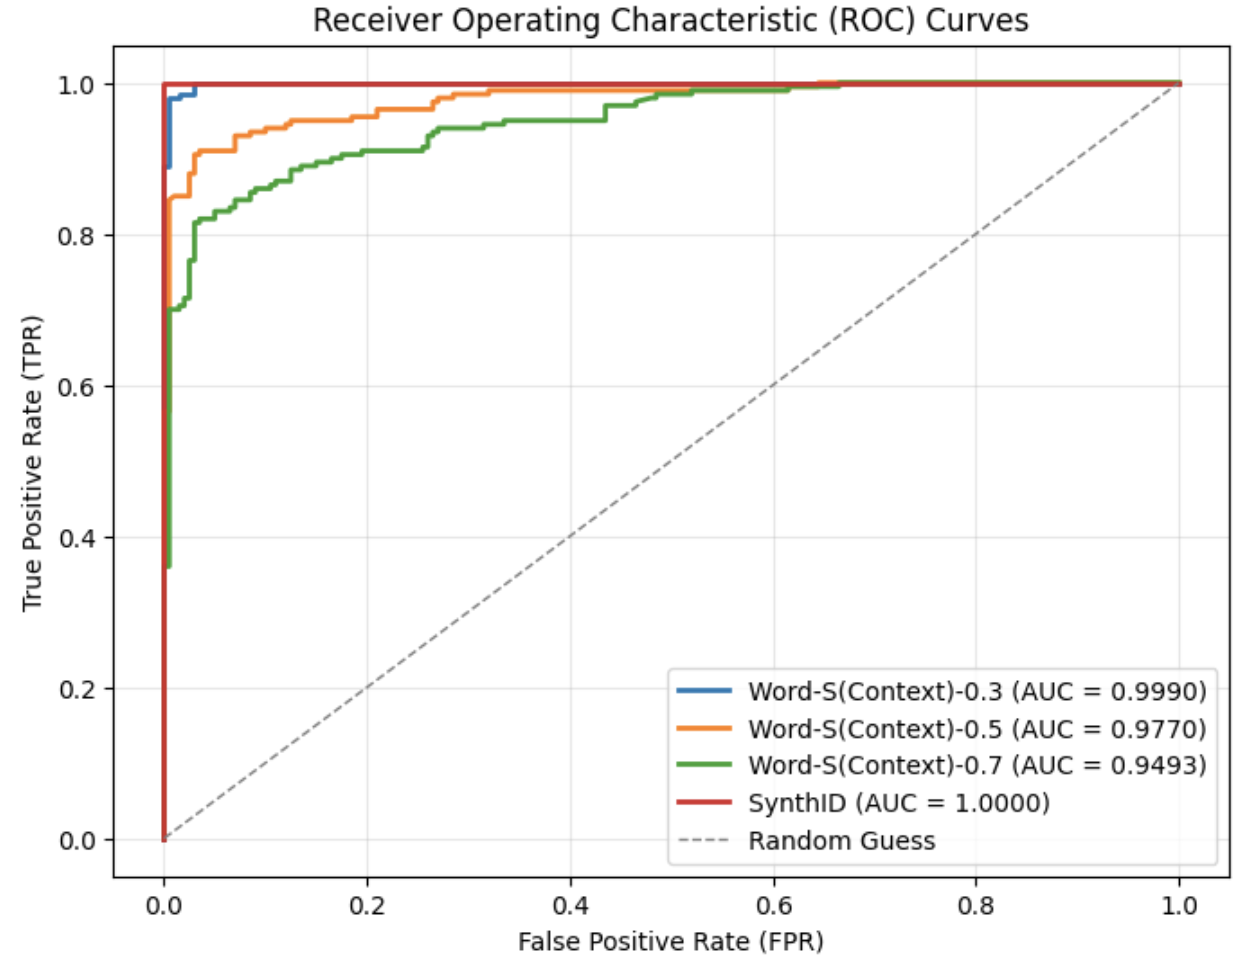
After applying the synonym substitution strategy to a set of 200 watermarked texts, each with a token length of $T=200$ , the resulting ROC curves are presented in Fig. 1. As shown, the area under the curve (AUC) gradually decreases as the replacement ratio increases. Even with a replacement ratio as high as 0.7, the AUC remains above 0.94, and the corresponding F1 score is relatively high at 0.884, as reported in Table I. These results demonstrate that SynthID-Text exhibits strong robustness against context-preserving lexical substitutions.
<details>
<summary>Synonym_Substitution_attack_for_SynthID-Text.png Details</summary>
### Visual Description
## ROC Curve: Receiver Operating Characteristic (ROC) Curves
### Overview
The image displays a Receiver Operating Characteristic (ROC) curve comparing the performance of multiple classification models. The chart plots **True Positive Rate (TPR)** against **False Positive Rate (FPR)** for four distinct methods, with a diagonal dashed line representing random guessing. All models outperform random guessing, with varying degrees of effectiveness.
---
### Components/Axes
- **X-axis**: False Positive Rate (FPR) ranging from 0.0 to 1.0 in increments of 0.2.
- **Y-axis**: True Positive Rate (TPR) ranging from 0.0 to 1.0 in increments of 0.2.
- **Legend**: Located at the bottom-right corner, with four entries:
- **Blue line**: Word-S(Context)-0.3 (AUC = 0.9990)
- **Orange line**: Word-S(Context)-0.5 (AUC = 0.9770)
- **Green line**: Word-S(Context)-0.7 (AUC = 0.9493)
- **Red line**: SynthID (AUC = 1.0000)
- **Dashed gray line**: Random Guess (AUC = 0.5000, implied)
- **Axis markers**: Gridlines at 0.0, 0.2, 0.4, 0.6, 0.8, and 1.0 for both axes.
---
### Detailed Analysis
1. **SynthID (Red line)**:
- Starts at (FPR=0.0, TPR=1.0) and remains perfectly flat at TPR=1.0 across all FPR values.
- AUC = 1.0000, indicating perfect classification performance.
2. **Word-S(Context)-0.3 (Blue line)**:
- Begins at (FPR=0.0, TPR≈0.95) and rises sharply to TPR=1.0 by FPR=0.1.
- Maintains near-perfect TPR (0.98–1.0) for FPR < 0.2.
- AUC = 0.9990, slightly lower than SynthID but still highly effective.
3. **Word-S(Context)-0.5 (Orange line)**:
- Starts at (FPR=0.0, TPR≈0.85) and rises to TPR=1.0 by FPR=0.2.
- Maintains TPR > 0.9 for FPR < 0.4.
- AUC = 0.9770, showing diminishing performance compared to lower-context Word-S.
4. **Word-S(Context)-0.7 (Green line)**:
- Starts at (FPR=0.0, TPR≈0.75) and reaches TPR=1.0 by FPR=0.3.
- TPR drops below 0.9 for FPR > 0.4.
- AUC = 0.9493, the lowest among the Word-S variants.
5. **Random Guess (Dashed gray line)**:
- Diagonal line from (0.0, 0.0) to (1.0, 1.0), representing a baseline AUC of 0.5000.
---
### Key Observations
- **SynthID dominates**: Its perfect AUC and flat TPR=1.0 line indicate it never misclassifies positive samples, regardless of FPR.
- **Context sensitivity**: Word-S performance degrades as context value increases (0.3 > 0.5 > 0.7), suggesting lower-context models are more robust.
- **FPR-TPR tradeoff**: All models show increasing TPR with FPR, but SynthID maintains the steepest initial ascent, minimizing false positives.
- **Random Guess benchmark**: All lines lie above the diagonal, confirming all models outperform random chance.
---
### Interpretation
The data demonstrates that **SynthID** is the optimal model for this classification task, achieving perfect separation between classes. The Word-S models exhibit context-dependent performance, with lower-context configurations (e.g., 0.3) being more effective. The steep initial rise of the Word-S lines suggests strong early discrimination, but their performance plateaus at higher FPRs. The Random Guess line underscores the importance of AUC as a metric—all models achieve AUC > 0.9, indicating high reliability. Notably, SynthID’s AUC=1.0 implies no overlap between positive and negative class distributions, a rare and ideal scenario in classification tasks.
</details>
(a) Overall ROC curves under synonym substitution with different replacement ratios
<details>
<summary>zoom-in_synonym_substitution_attack_for_SynthID.png Details</summary>
### Visual Description
## Chart Type: Zoomed-in ROC Curve (Log-scaled FPR)
### Overview
The image displays a zoomed-in Receiver Operating Characteristic (ROC) curve comparing the performance of three Word-S(Context) models (with context values 0.3, 0.5, and 0.7) against a SynthID baseline. The x-axis uses a logarithmic scale for False Positive Rate (FPR), while the y-axis shows True Positive Rate (TPR). All lines are plotted on a grid with dashed reference lines at TPR=0.98 and FPR=0.01.
### Components/Axes
- **X-axis**: False Positive Rate (FPR, log scale) ranging from 10⁻⁴ to 10⁰ (1.0).
- **Y-axis**: True Positive Rate (TPR) ranging from 0.90 to 1.00.
- **Legend**:
- Blue: Word-S(Context)-0.3 (AUC = 0.9990)
- Orange: Word-S(Context)-0.5 (AUC = 0.9770)
- Green: Word-S(Context)-0.7 (AUC = 0.9493)
- Red: SynthID (AUC = 1.0000)
- **Grid**: Dashed lines at TPR=0.98 and FPR=0.01 for reference.
### Detailed Analysis
1. **Word-S(Context)-0.3 (Blue Line)**:
- Dominates the chart, maintaining TPR ≈ 1.00 across all FPR values.
- Sharp drop to TPR=1.00 at FPR=10⁻², then remains flat.
- AUC = 0.9990 (highest performance).
2. **Word-S(Context)-0.5 (Orange Line)**:
- Starts at TPR=1.00 for FPR < 10⁻².
- Gradual decline in TPR as FPR increases, forming a stepwise curve.
- AUC = 0.9770 (moderate performance).
3. **Word-S(Context)-0.7 (Green Line)**:
- Worst-performing model, with TPR dropping sharply at FPR=10⁻¹.
- Steep decline to TPR=0.94 by FPR=10⁻⁰.
- AUC = 0.9493 (lowest performance).
4. **SynthID (Red Line)**:
- Perfect diagonal line (AUC = 1.0000), representing the theoretical baseline.
- No deviation from the 45° reference line.
### Key Observations
- **Performance Hierarchy**: Word-S(Context)-0.3 > Word-S(Context)-0.5 > Word-S(Context)-0.7.
- **Log Scale Impact**: The logarithmic FPR scale compresses low-FPR regions, emphasizing differences in high-FPR regimes.
- **Baseline Anomaly**: SynthID’s AUC=1.0000 is theoretically impossible in practice, suggesting either idealized data or a mislabeled baseline.
### Interpretation
The chart demonstrates that reducing context values (e.g., 0.3 vs. 0.7) improves model performance in terms of TPR while maintaining low FPR. The SynthID baseline’s perfect AUC is unrealistic, indicating either a theoretical construct or a data artifact. The zoomed-in view highlights critical performance thresholds near TPR=0.98 and FPR=0.01, where Word-S(Context)-0.3 outperforms others by orders of magnitude in FPR reduction. This suggests context-sensitive tuning is critical for high-stakes applications requiring near-perfect recall.
</details>
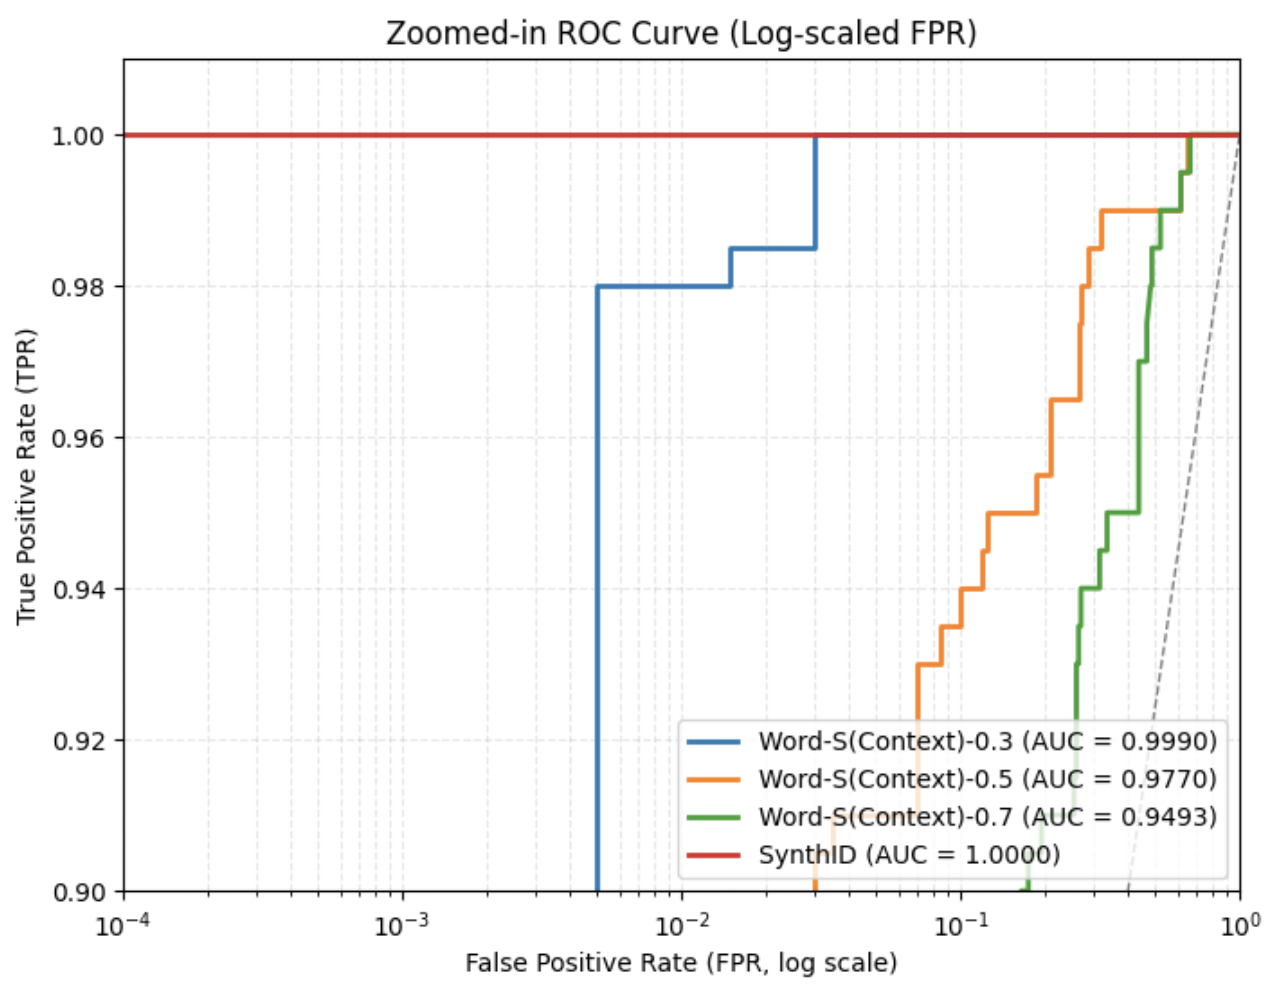
(b) Zoomed-in ROC curves under synonym substitution with different replacement ratios
Figure 1: ROC curves of SynthID-Text under synonym substitution attacks with varying replacement ratios.
TABLE I: Watermark detection accuracy under different synonym substitution attack ratios.
| Attack | TPR | FPR | F1 with best threshold |
| --- | --- | --- | --- |
| No attack | 1.0 | 0.0 | 1.0 |
| Word-S(Context)-0.3 | 0.98 | 0.005 | 0.987 |
| Word-S(Context)-0.5 | 0.91 | 0.035 | 0.936 |
| Word-S(Context)-0.7 | 0.82 | 0.035 | 0.884 |
### IV-C Copy-and-Paste Attack
Unlike synonym substitution attacks, the copy-and-paste attack does not alter the original watermarked text. Instead, it embeds the watermarked segment within a larger body of human-written or unwatermarked content. This type of attack exploits the fact that detection algorithms typically analyze text holistically; by diluting the watermarked portion, the overall watermark signal becomes weaker and harder to detect.
Prior work [9] has shown that when the watermarked portion comprises only 10% of the total text, the attack can outperform many paraphrasing methods in reducing watermark detectability. In this work, we experiment with different copy-and-paste ratios and evaluate the detection performance to assess robustness.
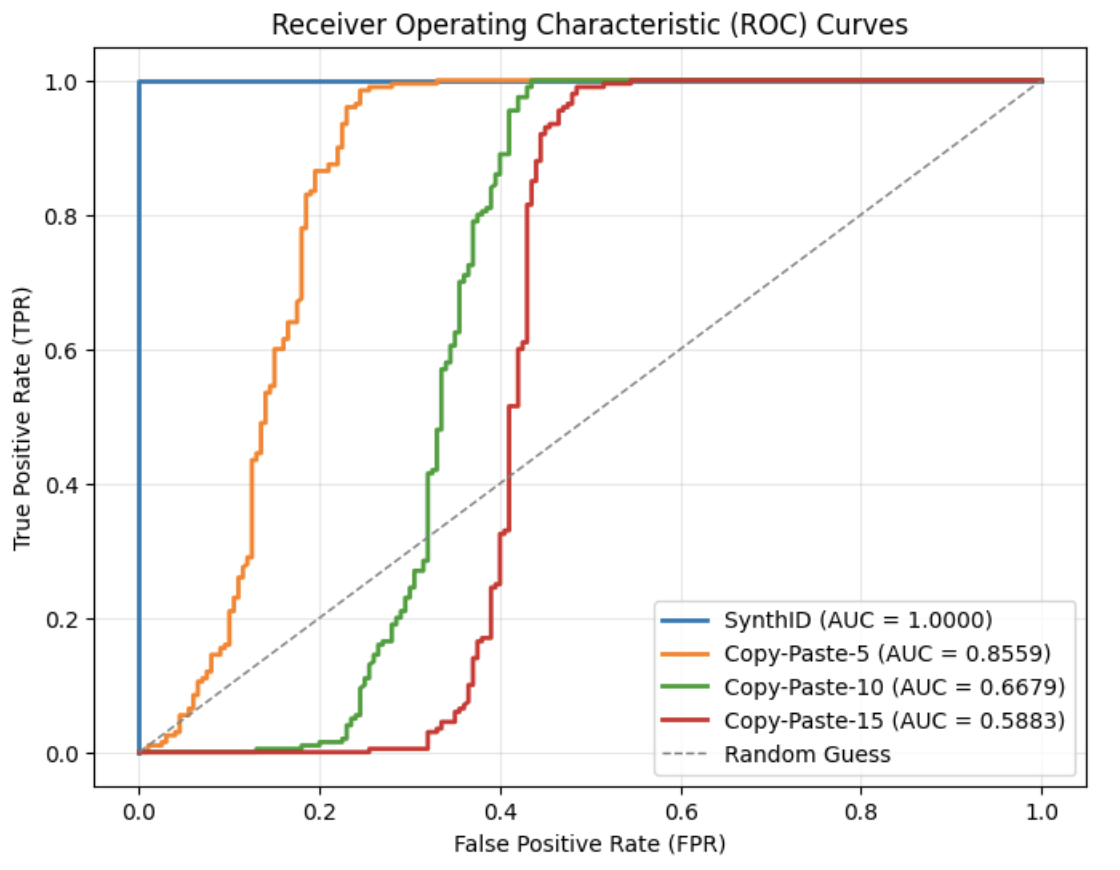
Fig. 2 presents the ROC curves for varying copy-and-paste ratios. The green curve represents the case where the added natural text is ten times longer than the original watermarked text, resulting in an AUC of 0.62—only slightly above random guess. As shown in Table II, the false positive rate (FPR) for ratio $=10$ reaches 0.53, meaning that more than half of unwatermarked texts are incorrectly identified as watermarked. As the copy-and-paste ratio increases, detection performance degrades further. When the ratio reaches 20 or higher, the AUC decreases to around or below 0.5, effectively equating to or falling below random guessing performance.
<details>
<summary>figures/copy-paste_attack_roc.png Details</summary>
### Visual Description
## ROC Curve: Receiver Operating Characteristic (ROC) Curves
### Overview
The image displays a Receiver Operating Characteristic (ROC) curve comparing the performance of four classification models: SynthID, Copy-Paste-5, Copy-Paste-10, and Copy-Paste-15, against a random guess baseline. The curves illustrate the trade-off between True Positive Rate (TPR) and False Positive Rate (FPR) for different classification thresholds.
### Components/Axes
- **X-axis**: False Positive Rate (FPR) ranging from 0.0 to 1.0 in increments of 0.2.
- **Y-axis**: True Positive Rate (TPR) ranging from 0.0 to 1.0 in increments of 0.2.
- **Legend**: Located in the bottom-right corner, with the following entries:
- **SynthID (AUC = 1.0000)**: Blue solid line.
- **Copy-Paste-5 (AUC = 0.8559)**: Orange solid line.
- **Copy-Paste-10 (AUC = 0.6679)**: Green solid line.
- **Copy-Paste-15 (AUC = 0.5883)**: Red solid line.
- **Random Guess**: Gray dashed diagonal line (AUC = 0.5 by definition).
### Detailed Analysis
1. **SynthID (Blue Line)**:
- Starts at (0.0, 0.0) and immediately rises vertically to (0.0, 1.0), then horizontally to (1.0, 1.0).
- Perfect classifier with no false positives (FPR = 0.0) and maximum true positives (TPR = 1.0).
- AUC = 1.0000 (ideal performance).
2. **Copy-Paste-5 (Orange Line)**:
- Begins at (0.0, 0.0), rises steeply to ~(0.2, 0.8), then flattens to (1.0, 0.8).
- AUC = 0.8559, indicating strong but imperfect performance.
- TPR plateaus at ~0.8 as FPR increases beyond 0.2.
3. **Copy-Paste-10 (Green Line)**:
- Starts at (0.0, 0.0), rises gradually to ~(0.4, 0.6), then steeply to (1.0, 0.6).
- AUC = 0.6679, showing moderate performance.
- TPR plateaus at ~0.6 as FPR increases beyond 0.4.
4. **Copy-Paste-15 (Red Line)**:
- Begins at (0.0, 0.0), rises slowly to ~(0.6, 0.4), then steeply to (1.0, 0.4).
- AUC = 0.5883, indicating poor performance.
- TPR plateaus at ~0.4 as FPR increases beyond 0.6.
5. **Random Guess (Gray Dashed Line)**:
- Diagonal line from (0.0, 0.0) to (1.0, 1.0), representing a baseline with no discriminative power.
- AUC = 0.5 (expected for random guessing).
### Key Observations
- **SynthID** outperforms all other models, achieving perfect separation between classes.
- **Copy-Paste** models degrade in performance as the number increases (5 → 10 → 15), with AUC dropping from 0.8559 to 0.5883.
- The **Random Guess** line serves as a critical benchmark, confirming that all models except Copy-Paste-15 outperform random chance.
- All curves converge at (1.0, 1.0), reflecting the theoretical maximum TPR when FPR = 1.0.
### Interpretation
The data suggests that **SynthID** is an optimal classifier for this task, while the **Copy-Paste** models exhibit diminishing returns as their configuration complexity increases (e.g., higher numbers). The steep decline in AUC from Copy-Paste-5 to Copy-Paste-15 implies potential overfitting or parameter instability in larger configurations. The **Random Guess** line underscores the importance of AUC as a metric: models with AUC > 0.5 are better than random, but only SynthID achieves near-perfect performance. This analysis highlights the need for careful model selection and threshold tuning in classification tasks.
</details>
Figure 2: ROC curves under different copy-and-paste attack ratios. The blue curve represents the original SynthID-Text ROC curve without attack; the gray curve indicates random guessing. Other curves depict results under varying ratios, where the ratio denotes how many times longer the inserted natural text is compared to the original watermarked text.
TABLE II: Watermark detection accuracy under different copy-and-paste attack ratios
| Attack | TPR | FPR | F1 with best threshold |
| --- | --- | --- | --- |
| No attack | 1.0 | 0.005 | 0.9975 |
| Copy-and-Paste-5 | 0.985 | 0.27 | 0.874 |
| Copy-and-Paste-10 | 0.995 | 0.53 | 0.788 |
| Copy-and-Paste-20 | 0.99 | 0.565 | 0.775 |
| Copy-and-Paste-30 | 0.99 | 0.565 | 0.775 |
### IV-D Paraphrasing Attack
Paraphrasing attacks aim to modify the structure and wording of a paragraph while preserving its original semantic meaning. This is typically done by rephrasing sentences or altering word choice and sentence order. Therefore, paraphrasing can be characterized along two key dimensions: lexical diversity, which measures variation in vocabulary, and order diversity, which reflects changes in sentence or phrase order.
In this experiment, we adopted the Dipper paraphrasing model [27], which is built on the T5-XXL [22] architecture. Dipper allows fine-tuned control over both lexical and order diversity through configurable parameters. Two levels of lexical diversity were used to conduct the attacks, and the results are shown in Fig. 3.
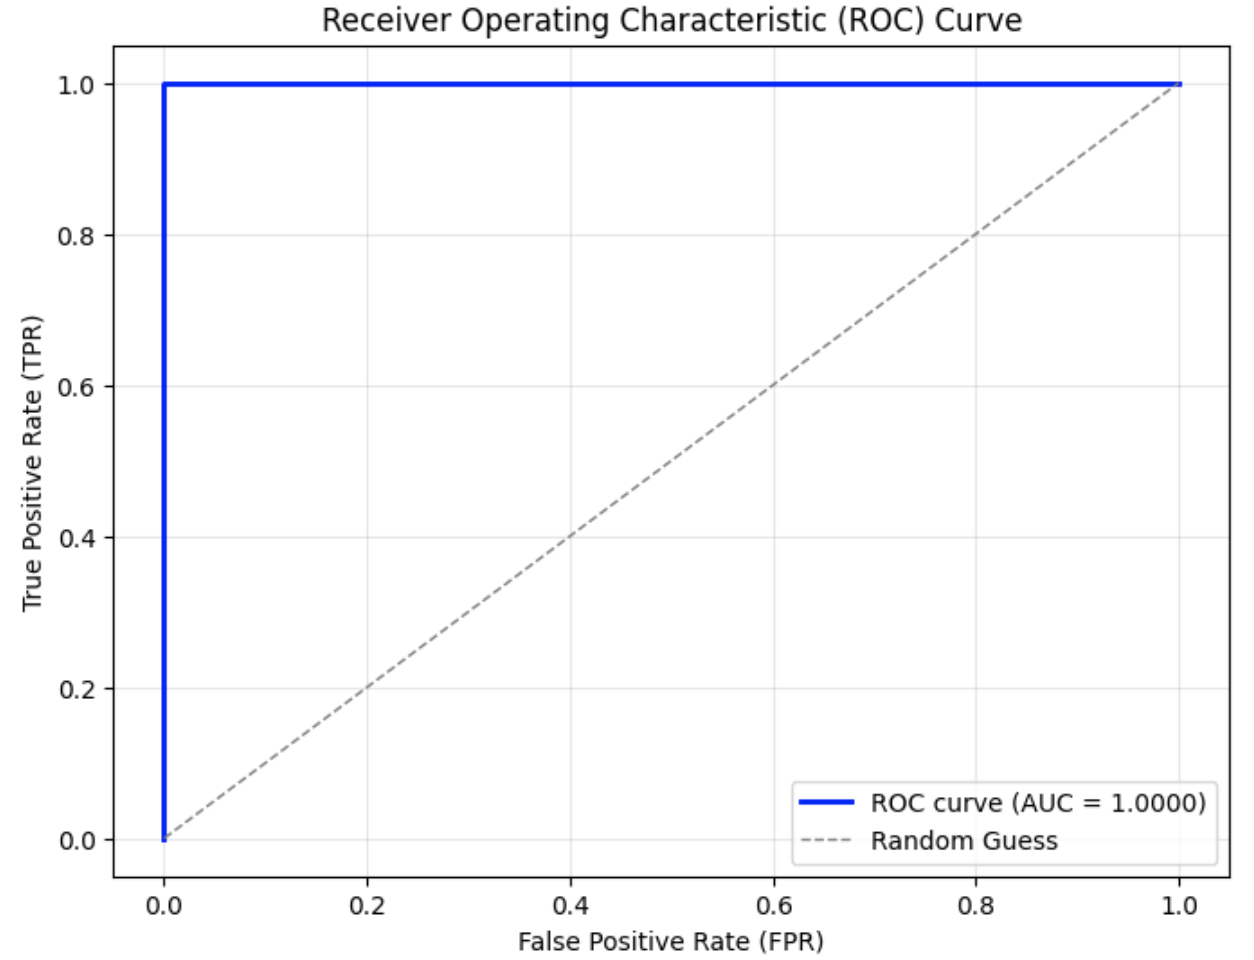
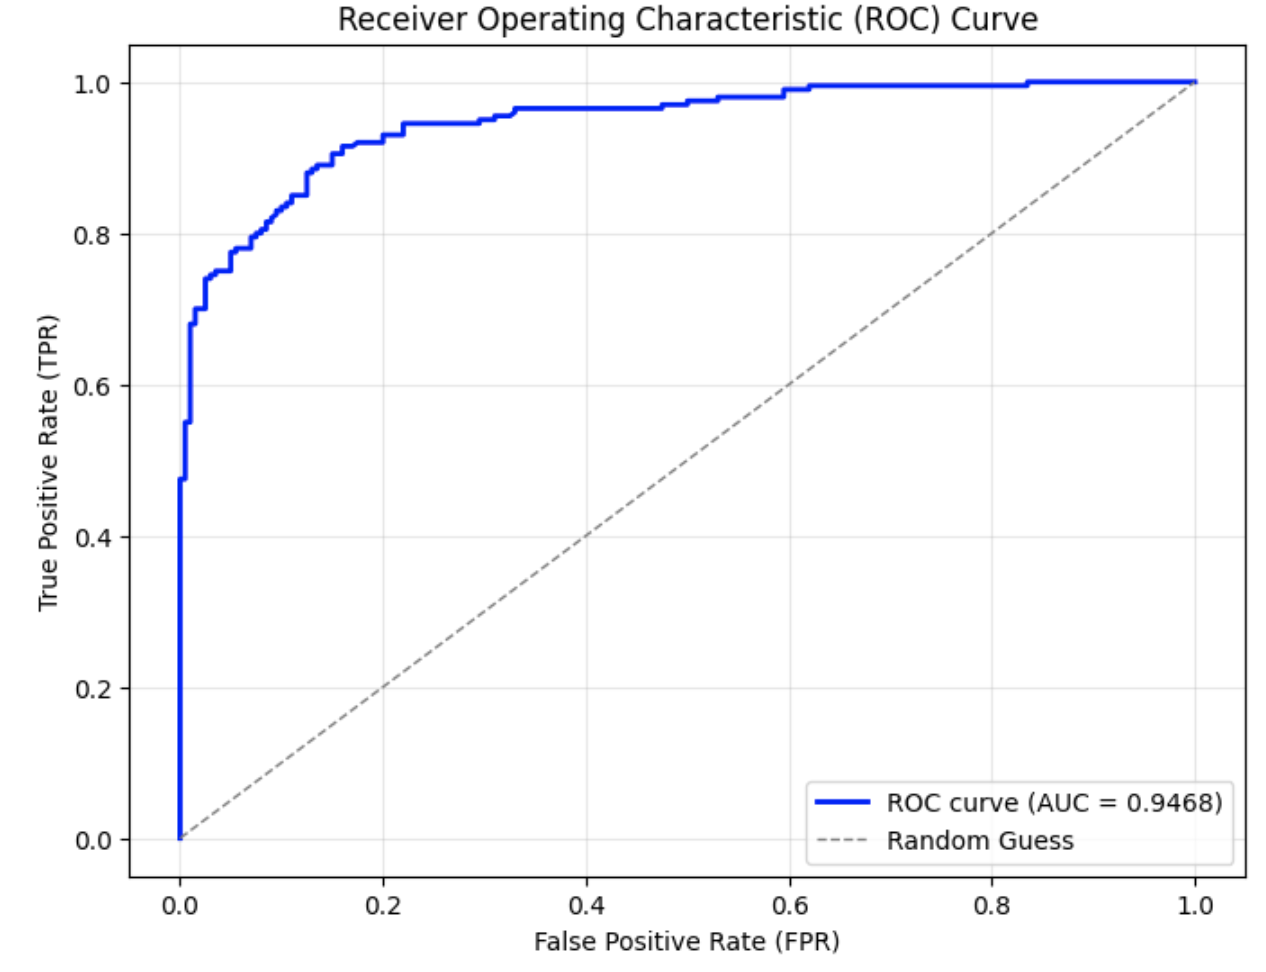
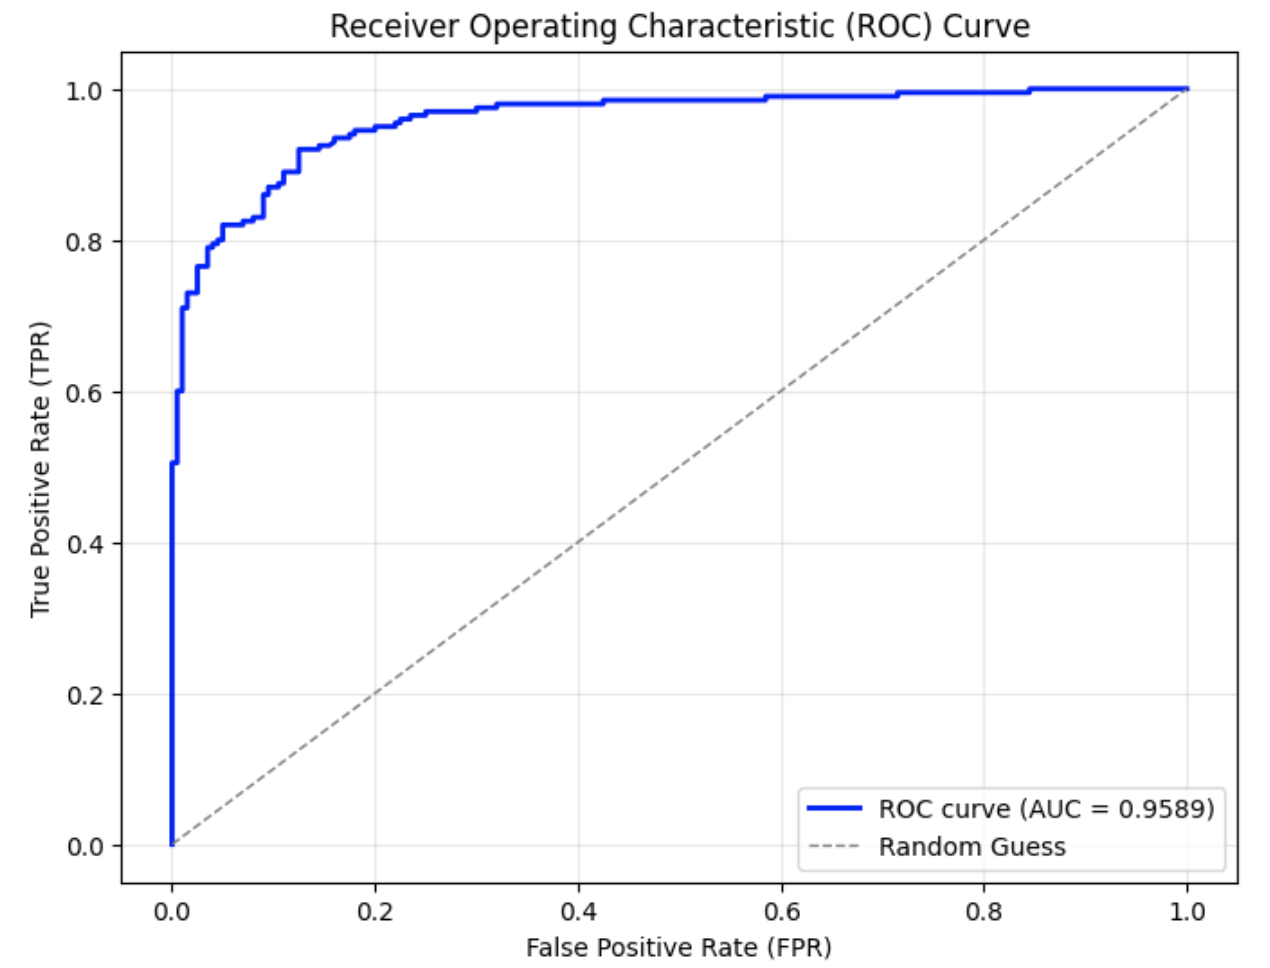
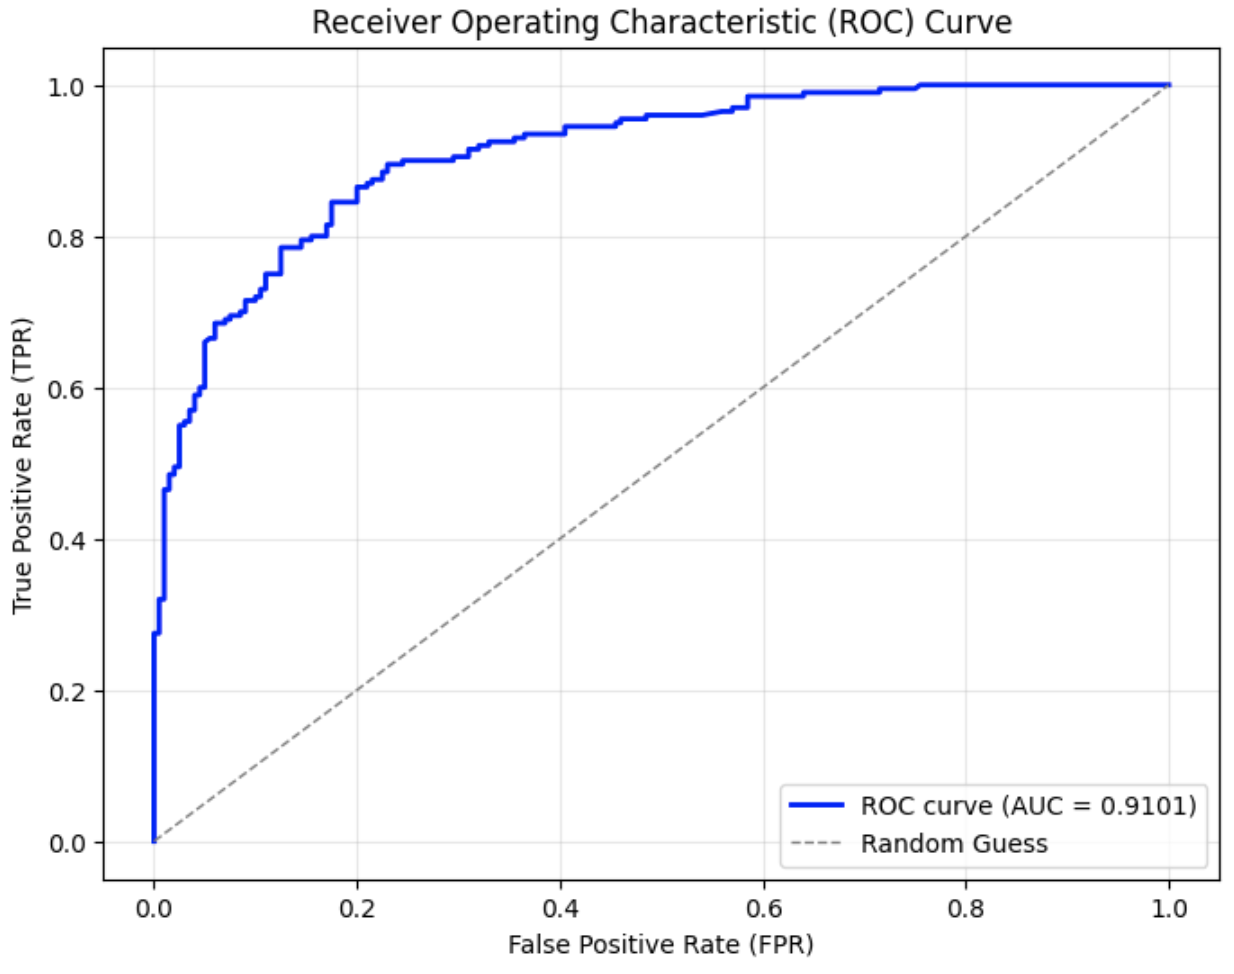
From the graphs, it can be observed that compared to the original ROC curve of SynthID-Text without attack in Fig. 3 (a), the AUC in Fig. 3 (b) and (c) decrease by approximately 0.04–0.05 when only lexical diversity was applied. When both lexical diversity and order diversity were set simultaneously, the AUC experienced a decline to 0.91 in Fig. 3 (d) from 1.00 in the no attack setting. The corresponding FPR and F1 scores are presented in Table III. Particularly, when lex_diversity=10 and order_diversity=5 (shown in the fourth row), the FPR exceeded 20%, and the F1 score dropped to 0.84, indicating a significant reduction in detection accuracy under this paraphrasing condition.
<details>
<summary>figures/SynthID_solo_curve.png Details</summary>
### Visual Description
## Chart/Diagram Type: Receiver Operating Characteristic (ROC) Curve
### Overview
The image depicts a Receiver Operating Characteristic (ROC) Curve, a graphical plot that illustrates the diagnostic ability of a binary classifier system. The curve compares the trade-off between the True Positive Rate (TPR) and the False Positive Rate (FPR) at various threshold settings.
### Components/Axes
- **X-Axis**: Labeled "False Positive Rate (FPR)" with a linear scale from 0.0 to 1.0.
- **Y-Axis**: Labeled "True Positive Rate (TPR)" with a linear scale from 0.0 to 1.0.
- **Legend**: Located in the bottom-right corner, containing two entries:
- **Solid Blue Line**: Labeled "ROC curve (AUC = 1.0000)".
- **Dashed Gray Line**: Labeled "Random Guess".
### Detailed Analysis
- **ROC Curve (Blue Line)**:
- Starts at the origin (0.0, 0.0) and immediately rises vertically to (0.0, 1.0), forming a perfect square.
- Then extends horizontally to (1.0, 1.0).
- The area under the curve (AUC) is explicitly stated as 1.0000, indicating perfect classification.
- **Random Guess Line (Dashed Gray Line)**:
- A straight diagonal line from (0.0, 0.0) to (1.0, 1.0), representing a baseline performance with no discriminative power.
### Key Observations
1. The ROC curve is a perfect square, suggesting the classifier achieves 100% TPR with 0% FPR, which is theoretically ideal but rare in practice.
2. The Random Guess line serves as a reference for random performance, where TPR equals FPR.
3. The AUC value of 1.0000 confirms the classifier’s perfect separation between classes.
### Interpretation
The ROC curve demonstrates a classifier with **perfect performance**, as it achieves maximum TPR without any FPR. This implies the model can distinguish between positive and negative classes with absolute certainty. The Random Guess line highlights the baseline for comparison, emphasizing that the classifier’s performance is far superior to random chance. The AUC of 1.0000 is a theoretical maximum, indicating no overlap between the distributions of positive and negative classes. In real-world scenarios, such a result is uncommon, suggesting either an idealized dataset or a highly optimized model.
</details>
(a) No attack (original SynthID-Text)
<details>
<summary>figures/Dipper-5_synthID.png Details</summary>
### Visual Description
## Chart/Diagram Type: Receiver Operating Characteristic (ROC) Curve
### Overview
The image depicts a Receiver Operating Characteristic (ROC) curve, a graphical plot illustrating the diagnostic performance of a binary classification model. The curve compares the trade-off between the True Positive Rate (TPR) and False Positive Rate (FPR) at various threshold settings. A secondary dashed line represents a "Random Guess" baseline for comparison.
### Components/Axes
- **X-Axis**: Labeled "False Positive Rate (FPR)" with tick marks at 0.0, 0.2, 0.4, 0.6, 0.8, and 1.0.
- **Y-Axis**: Labeled "True Positive Rate (TPR)" with tick marks at 0.0, 0.2, 0.4, 0.6, 0.8, and 1.0.
- **Legend**: Located in the bottom-right corner, containing:
- Solid blue line: "ROC curve (AUC = 0.9468)"
- Dashed gray line: "Random Guess"
### Detailed Analysis
- **ROC Curve (Blue Line)**:
- Begins at (0.0, 0.0) and rises sharply to approximately (0.1, 0.5).
- Gradually increases to (1.0, 1.0), forming a concave curve.
- Key data points:
- (0.0, 0.0)
- (0.1, 0.5)
- (0.2, 0.8)
- (0.3, 0.9)
- (0.4, 0.95)
- (0.5, 0.97)
- (0.6, 0.98)
- (0.7, 0.99)
- (0.8, 1.0)
- (1.0, 1.0)
- The curve’s steep initial ascent indicates high sensitivity at low FPR, followed by a plateau as FPR increases.
- **Random Guess Line (Dashed Gray Line)**:
- A straight diagonal line from (0.0, 0.0) to (1.0, 1.0), representing a model with no discriminative ability.
### Key Observations
1. The ROC curve dominates the random guess line, confirming the model’s superior performance.
2. The AUC (Area Under the Curve) value of **0.9468** suggests excellent discriminative ability (AUC > 0.9 is considered strong).
3. The curve’s plateau near FPR > 0.4 indicates diminishing returns in TPR improvement at higher false positive rates.
### Interpretation
The ROC curve demonstrates that the model effectively distinguishes between positive and negative classes, with an AUC of 0.9468. This high value implies the model has strong predictive power, as it consistently achieves high TPR while maintaining low FPR across most thresholds. The sharp initial rise highlights the model’s ability to identify true positives early, while the gradual flattening suggests trade-offs at higher FPR thresholds. The random guess line serves as a critical benchmark, emphasizing that the model’s performance is not due to chance.
**Note**: All numerical values (e.g., AUC, FPR/TPR points) are approximate, derived from visual inspection of the curve’s trajectory and axis labels.
</details>
(b) Dipper paraphrasing with $lex\_diversity=5$
<details>
<summary>figures/Dipper-10_synthID.png Details</summary>
### Visual Description
## Chart/Diagram Type: Receiver Operating Characteristic (ROC) Curve
### Overview
The image depicts a Receiver Operating Characteristic (ROC) curve, a graphical plot illustrating the diagnostic ability of a binary classifier system. The curve demonstrates the trade-off between the True Positive Rate (TPR) and the False Positive Rate (FPR) at various threshold settings. A high Area Under the Curve (AUC) value indicates superior model performance.
### Components/Axes
- **X-Axis**: Labeled "False Positive Rate (FPR)" with markers at 0.0, 0.2, 0.4, 0.6, 0.8, and 1.0.
- **Y-Axis**: Labeled "True Positive Rate (TPR)" with markers at 0.0, 0.2, 0.4, 0.6, 0.8, and 1.0.
- **Legend**: Located in the bottom-right corner, containing:
- **Blue Solid Line**: "ROC curve (AUC = 0.9589)"
- **Gray Dashed Line**: "Random Guess"
### Detailed Analysis
- **ROC Curve (Blue Solid Line)**:
- Begins at (0.0, 0.0) and rises sharply to approximately (0.1, 1.0), indicating near-perfect TPR at low FPR.
- Plateaus near TPR = 1.0 as FPR increases from 0.1 to 1.0, suggesting minimal degradation in performance despite rising false positives.
- Ends at (1.0, 1.0), aligning with the random guess line at the upper-right corner.
- **Random Guess Line (Gray Dashed Line)**:
- A diagonal line from (0.0, 0.0) to (1.0, 1.0), representing a classifier with no discriminative ability (AUC = 0.5).
### Key Observations
1. The ROC curve dominates the random guess line, confirming the model’s high discriminative power.
2. The steep initial ascent highlights exceptional sensitivity at low FPR, ideal for applications requiring high precision.
3. The plateau at TPR ≈ 1.0 indicates robustness against increasing FPR, maintaining high recall.
4. AUC = 0.9589 (95.89%) signifies near-optimal performance, with only 4.11% of the classification space unaccounted for.
### Interpretation
The ROC curve demonstrates that the classifier is highly effective at distinguishing between classes, with minimal false positives at critical thresholds. The AUC value of 0.9589 suggests the model is suitable for high-stakes applications (e.g., medical diagnostics, fraud detection) where balancing false positives and true positives is critical. The plateau at high TPR implies the classifier maintains reliability even as thresholds are relaxed, though this may come at the cost of increased false alarms in later stages. The sharp rise at low FPR underscores its utility in scenarios prioritizing precision over recall.
</details>
(c) Dipper paraphrasing with $lex\_diversity=10$ aaaaaaa aaaaaaaa
<details>
<summary>figures/Dipper-10-5_SynthID.png Details</summary>
### Visual Description
## Chart/Diagram Type: Receiver Operating Characteristic (ROC) Curve
### Overview
The image displays a Receiver Operating Characteristic (ROC) curve, a graphical plot that illustrates the diagnostic ability of a binary classifier system. The curve compares the trade-off between the True Positive Rate (TPR) and the False Positive Rate (FPR) at various threshold settings. A secondary dashed line represents a "Random Guess" baseline for comparison.
### Components/Axes
- **X-Axis**: Labeled "False Positive Rate (FPR)" with values ranging from 0.0 to 1.0 in increments of 0.1.
- **Y-Axis**: Labeled "True Positive Rate (TPR)" with values ranging from 0.0 to 1.0 in increments of 0.1.
- **Legend**: Located in the bottom-right corner, containing two entries:
- **Blue Solid Line**: "ROC curve (AUC = 0.9101)"
- **Gray Dashed Line**: "Random Guess"
- **Gridlines**: Horizontal and vertical gridlines at 0.0, 0.2, 0.4, 0.6, 0.8, and 1.0 for both axes.
### Detailed Analysis
- **ROC Curve (Blue Solid Line)**:
- Starts at (0.0, 0.0) and rises sharply to (0.05, 0.3), then gradually increases to (0.1, 0.6), (0.2, 0.8), (0.3, 0.9), (0.4, 0.95), (0.5, 0.97), (0.6, 0.98), (0.7, 0.99), (0.8, 0.995), (0.9, 0.998), and ends at (1.0, 1.0).
- The curve exhibits a steep initial ascent, followed by a plateau near the top-right corner, indicating high TPR even as FPR increases.
- **Random Guess Line (Gray Dashed Line)**:
- A straight diagonal line from (0.0, 0.0) to (1.0, 1.0), representing a baseline performance with no discriminative power.
### Key Observations
1. The ROC curve dominates the upper-right quadrant, demonstrating strong discriminative ability.
2. The AUC (Area Under the Curve) value of 0.9101 suggests excellent model performance, as values closer to 1.0 indicate better classification.
3. The steep initial rise of the ROC curve implies high sensitivity to low FPR thresholds.
4. The plateau near (1.0, 1.0) indicates near-perfect TPR at high FPR values.
### Interpretation
The ROC curve illustrates the model's ability to distinguish between classes effectively. The high AUC value (0.9101) confirms the model's robustness, with the curve consistently outperforming the random guess line. The steep initial ascent highlights the model's sensitivity to low FPR thresholds, while the plateau near the top-right corner suggests that the model maintains high TPR even as FPR increases. This trade-off is critical for applications requiring balanced performance, such as medical diagnostics or fraud detection. The "Random Guess" line serves as a benchmark, emphasizing that the model's performance is significantly better than chance.
</details>
(d) Dipper paraphrasing with $lex\_diversity=10$ and $order\_diversity=5$
Figure 3: ROC curves under paraphrasing attacks with different settings.
Note ∗: Due to hardware limitations in Google Colab Pro—specifically, a maximum GPU memory of 40 GB—Dipper could only be run once per session. As a result, the ROC curves were generated in separate runs, requiring a restart between each execution, and are presented across multiple graphs.
TABLE III: Watermark detection accuracy under different paraphrasing attack settings
| Attack | TPR | FPR | F1 with best threshold |
| --- | --- | --- | --- |
| No attack | 1.0 | 0.0 | 1.0 |
| Dipper-5 | 0.915 | 0.16 | 0.882 |
| Dipper-10 | 0.92 | 0.125 | 0.8998 |
| Dipper-10-5 | 0.895 | 0.23 | 0.842 |
Note ∗: In this figure, Dipper- $x$ denotes that the Dipper model was run with a lexical diversity parameter of $x$ , while Dipper- $x$ - $y$ indicates a lexical diversity of $x$ and an order diversity of $y$ .
### IV-E Re-Translation Attack
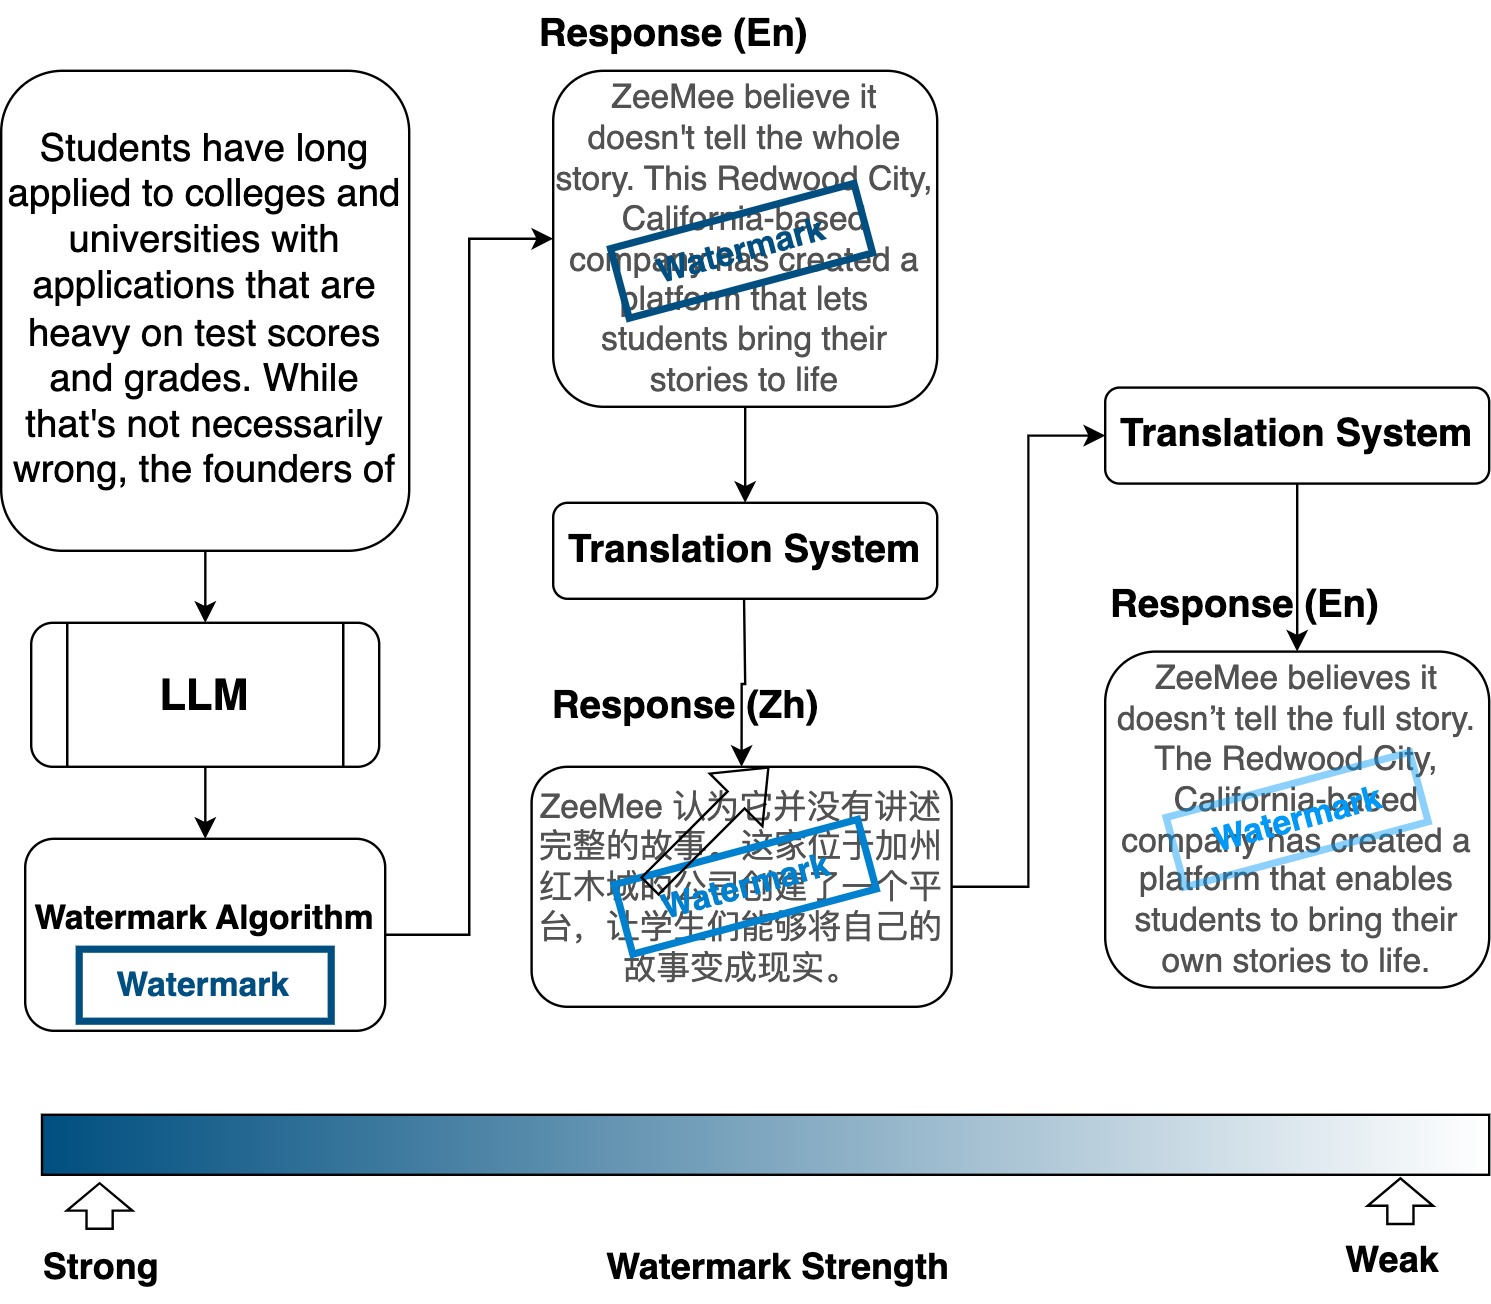
The re-translation attack involves translating the original watermarked text into a pivot language and then translating it back into the original language. This process preserves the overall meaning, but may disrupt the watermark signal due to intermediate transformations applied by a translation model, as illustrated in Fig. 4.
<details>
<summary>figures/watermark_dilution_through_translation.jpg Details</summary>
### Visual Description
## Flowchart: Watermark Integration in Multilingual Response System
### Overview
The diagram illustrates a technical workflow for embedding watermarks in multilingual responses generated by an LLM (Large Language Model) and translation system. It shows text processing, watermark insertion, and strength visualization across English and Chinese outputs.
### Components/Axes
1. **Input Prompt**:
- Text box describing college application practices emphasizing test scores/grades.
2. **Watermark Algorithm**:
- Labeled box with "Watermark" in blue box.
3. **LLM**:
- Rectangular component processing input text.
4. **Translation System**:
- Central component with bidirectional arrows to/from English/Chinese responses.
5. **Watermark Strength Bar**:
- Horizontal gradient bar (dark blue → light blue) labeled "Watermark Strength" with "Strong" (left) and "Weak" (right) markers.
6. **Responses**:
- Two text boxes:
- "Response (En)" (English)
- "Response (Zh)" (Chinese)
### Detailed Analysis
1. **Text Content**:
- **Input Prompt**:
> "Students have long applied to colleges and universities with applications that are heavy on test scores and grades. While that's not necessarily wrong, the founders of..."
- **English Response**:
> "ZeeMee believe it doesn't tell the whole story. This Redwood City, California-based company has created a platform that lets students bring their stories to life."
- **Chinese Response**:
> "ZeeMee 认为它并没有讲述完整的故事。这家位于加州 红木城的公司创建了一个平 台,让学生们能够将自己的 故事变成现实。"
- **Watermark Text**:
- Appears in both responses as "Watermark" (English) and "Watermark" (Chinese).
2. **Flow Direction**:
- Input → LLM → Watermark Algorithm → Translation System → Bilingual Responses.
- Watermark Algorithm feeds into both English and Chinese responses.
3. **Watermark Strength**:
- Bar shows gradient from dark blue (strong) to light blue (weak).
- Watermark placement in responses aligns with "Strong" end of the bar.
### Key Observations
- Watermark is consistently embedded in both language responses.
- Watermark strength visualization suggests adjustable opacity/visibility.
- Chinese response contains identical watermark text despite language difference.
- Translation system preserves watermark integrity across languages.
### Interpretation
This system demonstrates a multilingual watermarking pipeline for AI-generated content. The watermark's presence in both responses indicates language-agnostic embedding capabilities. The strength bar implies tunable robustness, potentially for copyright protection or authenticity verification. The bilingual output suggests the system maintains watermark integrity during translation, which is critical for cross-lingual content tracking. The workflow emphasizes end-to-end watermark preservation through text processing and translation stages.
</details>
Figure 4: Illustration of watermark dilution through translation
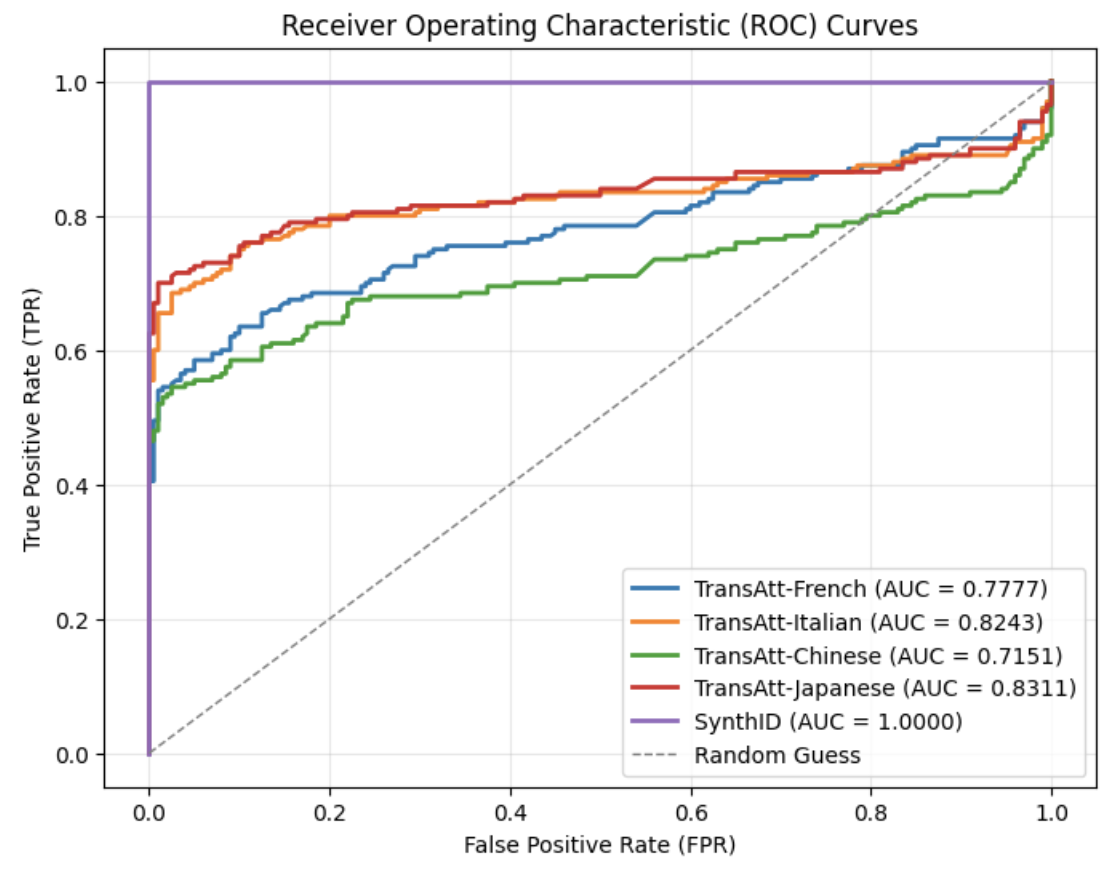
For this experiment, we used the nllb-200-distilled-600M https://huggingface.co/facebook/nllb-200-distilled-600M model, a distilled 600M-parameter variant of NLLB-200 [28]. NLLB-200 is a multilingual machine translation model that supports direct translation between 200 languages and is designed for research purposes. Several different languages were selected as pivot languages, including French, Italian, Chinese, and Japanese. Since the original dataset only consists of English prompts and human-written English completions, the watermarked outputs were first translated into pivot language and then re-translated into English to maintain consistency with the original prompt language.
The ROC curves under this re-translation attacks using different pivot languages are presented in Fig. 5. The results indicate that the choice of pivot language significantly influences the effectiveness of re-translation attacks. French and Italian, which both belong to the Latin language family , share substantial linguistic similarities with English, which has been heavily influenced by Latin. As a result, the round-trip retranslated texts maintain relatively high AUC scores. In contrast, Chinese is more significantly different from English, leading to the lowest AUC observed after re-translation. Surprisingly, Japanese produces the highest AUC among all tested pivot languages, even slightly surpassing Italian. This outcome may be attributed to the specific design of English-to-Japanese translation systems. Given the syntactic differences between Japanese and English (such as SOV versus SVO word order), many modern translation tools adopt a linear translation strategy when translating from English to Japanese [29, 30]. This approach attempts to preserve the original sentence structure as much as possible to enhance translation quality. Consequently, round-trip translation using Japanese tends to retain more of the original semantics and structure, making the re-translation attack less effective. Compared to the baseline performance of SynthID-Text without attack, the F1 score for the re-translation attack using Chinese reduces significantly from 1.00 to 0.711, while the F1 score remains 0.819 for Japanese, which is the highest, as shown in Table IV.
<details>
<summary>Retranslation_attacks_for_SynthID-Text.png Details</summary>
### Visual Description
## Chart/Diagram Type: Receiver Operating Characteristic (ROC) Curves
### Overview
The image displays a Receiver Operating Characteristic (ROC) curve chart comparing the performance of multiple classification models. The chart evaluates models based on their ability to distinguish between classes, with the x-axis representing the False Positive Rate (FPR) and the y-axis representing the True Positive Rate (TPR). A diagonal dashed line (Random Guess) serves as a baseline, while a perfect classifier is represented by a curve along the top-left corner.
### Components/Axes
- **X-axis**: False Positive Rate (FPR), ranging from 0.0 to 1.0.
- **Y-axis**: True Positive Rate (TPR), ranging from 0.0 to 1.0.
- **Legend**: Located in the bottom-right corner, with the following entries:
- **TransAtt-French** (blue, AUC = 0.7777)
- **TransAtt-Italian** (orange, AUC = 0.8243)
- **TransAtt-Chinese** (green, AUC = 0.7151)
- **TransAtt-Japanese** (red, AUC = 0.8311)
- **SynthID** (purple, AUC = 1.0000)
- **Random Guess** (dashed gray line).
### Detailed Analysis
1. **TransAtt-French (blue)**:
- Starts at (0, 0) and rises gradually, reaching ~0.8 TPR at ~0.6 FPR.
- AUC = 0.7777, indicating moderate performance.
2. **TransAtt-Italian (orange)**:
- Slightly outperforms TransAtt-French, with a steeper slope.
- Reaches ~0.85 TPR at ~0.6 FPR.
- AUC = 0.8243.
3. **TransAtt-Chinese (green)**:
- The flattest curve among TransAtt models.
- Reaches ~0.75 TPR at ~0.6 FPR.
- AUC = 0.7151, the lowest among TransAtt models.
4. **TransAtt-Japanese (red)**:
- The steepest TransAtt curve, closely following SynthID.
- Reaches ~0.9 TPR at ~0.6 FPR.
- AUC = 0.8311, the highest among TransAtt models.
5. **SynthID (purple)**:
- A perfect classifier, represented by a horizontal line at TPR = 1.0.
- AUC = 1.0000.
6. **Random Guess (dashed gray)**:
- A diagonal line from (0, 0) to (1, 1), representing random performance.
### Key Observations
- **SynthID** is the only model achieving perfect performance (AUC = 1.0000), suggesting it is a synthetic or idealized model.
- **TransAtt-Japanese** (red) outperforms all other TransAtt models, with the highest AUC (0.8311).
- **TransAtt-Chinese** (green) has the lowest performance among TransAtt models (AUC = 0.7151).
- All TransAtt models outperform the Random Guess line, confirming their utility.
- The curves for TransAtt models show varying trade-offs between FPR and TPR, with Japanese and Italian models being the most effective.
### Interpretation
The chart demonstrates that **SynthID** is the most effective model, likely representing an idealized or synthetic benchmark. Among the TransAtt models, **Japanese** and **Italian** variants show superior performance, while **Chinese** lags behind. The AUC values quantify these differences, with higher values indicating better class separation. The Random Guess line underscores that all models outperform chance. The spatial positioning of the curves (e.g., Japanese curve’s steepness) visually reinforces their relative effectiveness. This analysis highlights the importance of model selection based on language-specific performance metrics.
</details>
Figure 5: ROC curves of re-translation attacks on SynthID
TABLE IV: Watermark detection accuracy under re-translation attacks using different pivot languages
| Attack | TPR | FPR | F1 |
| --- | --- | --- | --- |
| No attack | 1.0 | 0.0 | 1.0 |
| Re-trans-French | 0.675 | 0.155 | 0.738 |
| Re-trans-Italian | 0.76 | 0.11 | 0.813 |
| Re-trans-Chinese | 0.675 | 0.225 | 0.711 |
| Re-trans-Japanese | 0.715 | 0.03 | 0.819 |
### IV-F Summary
Table V summarizes the watermark detection performance of SynthID-Text under various attack scenarios. For the re-translation attack, we present the result for Chinese as it is one of the three most widely spoken languages in the world.
Without any attack, the algorithm achieves a perfect F1 score of 1.0 and a false positive rate (FPR) of 0.0, demonstrating excellent baseline performance in detecting watermarked text. Under synonym substitution attacks, the F1 score decreases to 0.884, slightly below 0.9, indicating a moderate level of resilience to lexical variation.
For the copy-and-paste attack with a length ratio of 10, the F1 score decreases more substantially to 0.788, while the FPR rises sharply to 0.53. This suggests that simply appending large segments of natural (unwatermarked) text can significantly weaken watermark detectability, even if the original watermarked content remains unchanged. The paraphrasing attack, particularly when involving both high lexical diversity (lex_diversity = 10) and syntactic reordering (order_diversity = 5), also lead to a notable decrease in robustness. In this setting, the FPR increases to 0.23, and the F1 score falls to 0.842.
The most severe degradation occurs under the re-translation attack. Translating the watermarked text into Chinese and subsequently back into English results in a significant decline in detection performance: the F1 score falls to 0.711, and the TPR declines to 0.675, only slightly better than random guessing. This highlights the substantial vulnerability of SynthID-Text to semantic-preserving transformations.
These findings suggest that while SynthID-Text remains robust against simple lexical substitutions, it is significantly less effective under complex semantic-preserving attacks such as paraphrasing and round-trip translation, which pose the greatest challenges for reliable watermark detection.
TABLE V: Watermark detection accuracy of SynthID-Text under various attacks
| Attack | TPR | FPR | F1 |
| --- | --- | --- | --- |
| No attack | 1.0 | 0.0 | 1.0 |
| Substitution ( $\epsilon=0.7$ ) | 0.82 | 0.035 | 0.884 |
| Copy-and-Paste (ratio = 10) | 0.995 | 0.53 | 0.788 |
| Paraphrasing (lex_diversity | | | |
| = 10, order_diversity = 5) | 0.895 | 0.23 | 0.842 |
| Re-Translation (Chinese) | 0.675 | 0.225 | 0.711 |
## V SynGuard: An Enhanced SynthID-Text Watermarking
Since SynthID-Text embeds watermarks during the text generation process, if the generated text is regenerated or modified by another translation or language model, the original watermarking signals may be disrupted. As a result, the watermark information is prone to being destroyed. This vulnerability becomes especially apparent in the detection performance when subjected to back-translation attacks. The results could be found in Section VI.
In this section, we introduce a novel watermarking method, SynGuard, which combines the Semantic Invariant Robust (SIR) watermarking algorithm [6] with the SynthID-Text tournament sampling mechanism [3].
### V-A Watermark Embedding
Watermarking algorithms embed watermarks by modifying logits during the token generation process. SynthID-Text achieves this by using the hash values of preceding tokens along with a secret key $k$ to generate pseudorandom numbers. These numbers are then used to guide the token sampling process. This design, based on pseudorandom functions and a fixed key, makes the watermark difficult to remove unless the attacker has access to both the key and the random seed.
However, if the entire text is regenerated by another language model, such as in the back-translation scenario, the watermark signal can be severely degraded. This vulnerability stems from the fact that SynthID-Text does not incorporate semantic understanding into its watermarking process. By contrast, the SIR algorithm [6] embeds watermark signals by mapping semantic features of preceding tokens to specific token preferences. This semantic-aware approach has demonstrated resilience to meaning-preserving transformations.
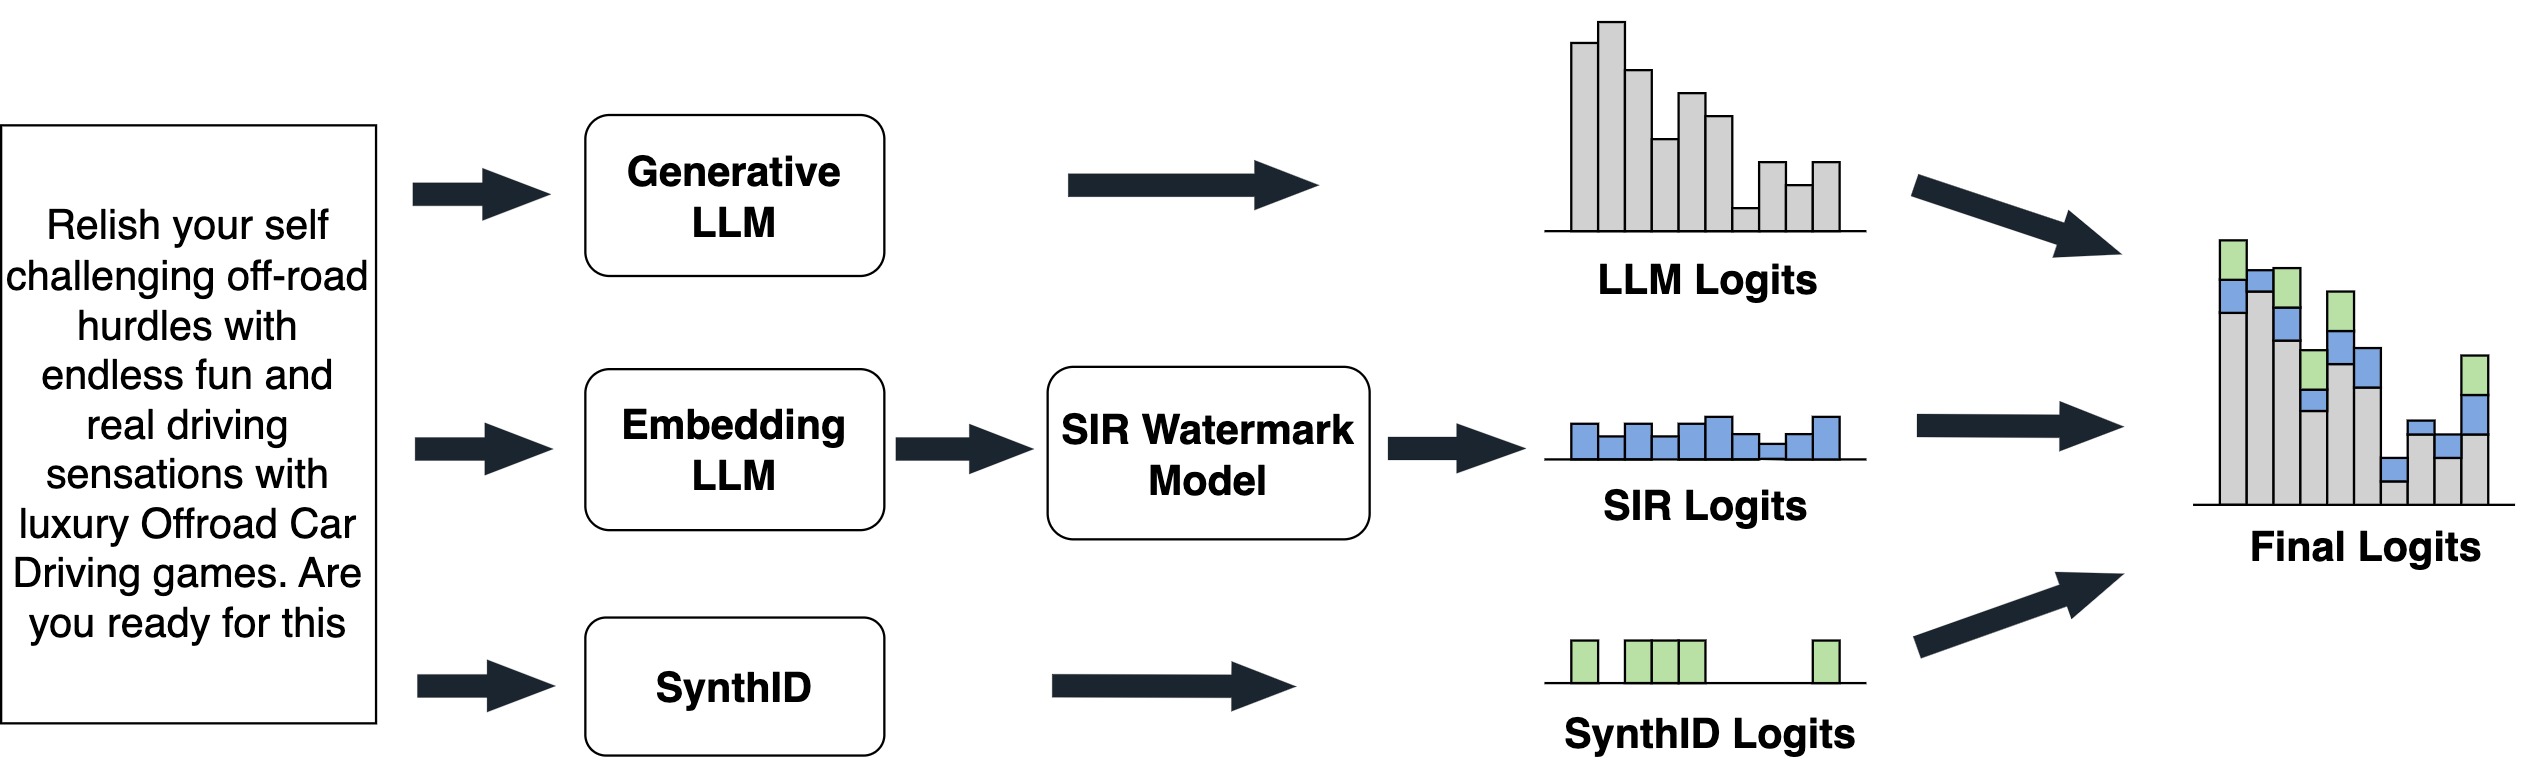
To enhance robustness against semantic perturbations, we propose a hybrid approach that integrates SynthID-Text with SIR. This new method, called SynGuard, generates three separate sets of logits at different stages and combines them to form the final logits vector. This vector is then passed through a softmax function to obtain a probability distribution over the vocabulary $V$ . The three component logits are:
- Base LLM logits: Generated directly from the backbone LLM, representing the standard token probabilities.
- SIR logits: Derived from a semantic watermarking model conditioned on the preceding text, encoding semantic consistency.
- SynthID logits: Computed using the pseudorandom watermarking mechanism based on hash values of tokens, a random seed and a secret key.
The overall embedding process is illustrated in Fig. 6, and the detailed procedure is described in Algorithm 1.
<details>
<summary>figures/new_algorithm_structure.jpg Details</summary>
### Visual Description
## Flowchart: Text-to-Logits Processing Pipeline
### Overview
The image depicts a technical workflow for processing text through multiple machine learning models (LLMs) and generating logit distributions. It includes textual prompts, model components, and visualizations of logit outputs.
### Components/Axes
1. **Text Block (Left Side)**:
- Text: "Relish your self challenging off-road hurdles with endless fun and real driving sensations with luxury Offroad Car Driving games. Are you ready for this"
- Position: Top-left corner, enclosed in a black-bordered box.
2. **Model Components**:
- **Generative LLM**: Connected via a black arrow to "LLM Logits" (bar chart).
- **Embedding LLM**: Connected via a black arrow to "SIR Watermark Model" (bar chart).
- **SynthID**: Connected via a black arrow to "SynthID Logits" (bar chart).
3. **Logit Visualizations**:
- **LLM Logits**: Gray bar chart with 6 bars (heights: ~0.8, 0.7, 0.6, 0.5, 0.4, 0.3).
- **SIR Logits**: Blue bar chart with 6 bars (heights: ~0.5, 0.4, 0.3, 0.2, 0.1, 0.0).
- **SynthID Logits**: Green bar chart with 3 bars (heights: ~0.2, 0.1, 0.0).
- **Final Logits**: Stacked bar chart combining all three logits (gray, blue, green). Heights: ~0.9 (gray), ~0.7 (blue), ~0.5 (green).
### Detailed Analysis
- **LLM Logits**: The tallest bar (~0.8) suggests the Generative LLM produces the highest confidence scores.
- **SIR Logits**: Lower and more uniform distribution (~0.5 max), indicating less variability.
- **SynthID Logits**: Minimal values (~0.2 max), suggesting lower confidence or specificity.
- **Final Logits**: Stacked bars show combined contributions, with the Generative LLM dominating (~0.9).
### Key Observations
1. **Dominance of Generative LLM**: Its logits are consistently higher than other components.
2. **SynthID's Role**: Minimal contribution to final logits, possibly for watermarking or auxiliary tasks.
3. **Final Logits**: Aggregates all models but retains the Generative LLM's dominance.
### Interpretation
The pipeline demonstrates a hierarchical process where the Generative LLM drives the primary output, while SIR and SynthID models add supplementary layers (e.g., watermarking or synthetic data generation). The Final Logits reflect a weighted combination, emphasizing the Generative LLM's role. The SynthID's low logits may indicate it is not a primary contributor but serves a specialized function (e.g., embedding detection). The text block acts as a prompt, guiding the models to generate contextually relevant outputs.
</details>
Figure 6: SynGuard watermark embedding.
Algorithm 1 Watermark Embedding of SynGuard
1: Language model $M$ , prompt $x^{\text{prompt}}$ , text $t=[t_{0},...,t_{T-1}]$ , embedding model $E$ , watermark model $W$ , semantic weight $\delta$ , tournament sampler $G$ , key $k$ , token $x$
2: Generate logits from $M$ : $P_{M}(x^{\text{prompt}},t_{:T-1})$ ;
3: Generate embedding $E_{:T-1}$ ;
4: Get SIR watermark logits $P_{W}(E_{:T-1})$ ;
5: Get SynthID-Text watermark logits $P_{G}(x^{\text{prompt}},k,x)$ ;
6: Compute:
| | $\displaystyle P_{\hat{M}}(x^{\text{prompt}},t_{:T-1})$ | $\displaystyle=P_{M}(x^{\text{prompt}},t_{:T-1})$ | |
| --- | --- | --- | --- |
7: Final watermarked logits $P_{\hat{M}}(t_{T})$
### V-B Watermark Extraction
SynGuard determines whether a given text is watermarked by evaluating both the semantic similarity to the preceding context and the statistical watermark signal encoded as $g$ -values. Intuitively, the more semantically aligned a token is with its context, and the higher its corresponding $g$ -value, the more probable it is that the text was generated by a watermarking algorithm.
Watermark Strength. The probability that a text contains a watermark is quantified by a composite score s. A higher s indicates a higher probability that the text is watermarked. Given a text $t=[t_{0},t_{1},\ldots,t_{T}]$ , we compute two components:
- Semantic similarity score: Let $P_{W}(x_{i},t_{:T-1})$ denote the semantic similarity between the token and the preceding generated text, computed using a pretrained semantic watermark model $W$ . The normalized semantic score is:
$$
s_{\text{semantic}}=\frac{1}{T}\sum\limits{}_{i=0}^{T}\left(P_{W}(x_{i},t_{:T-1})-0\right).
$$
- G-value score: Let $g_{l}$ represent the output of the $l_{th}$ SynthID-Text watermarking function for tokens. The average $g$ -value score is:
$$
s_{\text{g-value}}=\frac{1}{T*m}\sum_{i=0}^{T}\sum_{l=0}^{m}g_{l}(x_{i},t_{:T-1}).
$$
Since $s_{\text{semantic}}\in[-1,1]$ and $s_{\text{g-value}}\in[0,1]$ , we normalize $s_{\text{semantic}}$ to fall within the same range by applying a linear transformation. The final score $s$ is computed as:
$$
s=\delta\cdot\frac{s_{\text{semantic}}+1}{2}+(1-\delta)\cdot s_{\text{g-value}}. \tag{2}
$$
Here, $\delta\in[0,1]$ is a hyperparameter that controls the relative weighting between the semantic similarity signal and the token-level watermark signal. A larger $\delta$ places more emphasis on semantic alignment, while a smaller $\delta$ favors the token sampling randomness.
### V-C Robustness Analysis
To evaluate the robustness of SynGuard, we consider adversaries who attempt to remove or forge the watermark while preserving the underlying semantics. Our hybrid approach combines semantic-awareness from SIR and pseudorandom unpredictability from SynthID, offering both attack robustness and key-based security guarantees.
**Theorem 1**
*Let $t=[t_{0},t_{1},\ldots,t_{T}]$ be a watermarked text and $t^{\prime}$ be a meaning-preserving transformation of $t$ . Then, with high probability, the watermark detection score $s(t^{\prime})$ remains above detection threshold $\tau$ , i.e., the watermark is still detectable.*
* Proof*
The detection score $s$ is a weighted sum of two components: a semantic alignment score $s_{\text{semantic}}$ and a pseudorandom signature score $s_{\text{g-value}}$ . Because $t^{\prime}$ preserves the meaning of $t$ , the contextual embeddings of $t^{\prime}$ remain close to those of $t$ . Let $E(t_{:i})$ denote the semantic embedding of the prefix up to token $t_{i}$ . Since $t^{\prime}$ has nearly the same context at each position in a semantic sense, we have $\|E(t_{:i})-E(t^{\prime}_{:i})\|$ small for all $i$ . The semantic watermark model $W$ is assumed to be Lipschitz continuous [6]:
$$
|P_{W}(E(t_{:i}))-P_{W}(E(t^{\prime}_{:i}))|\leq L\cdot\|E(t_{:i})-E(t^{\prime}_{:i})\|,
$$
where $L>0$ denotes the Lipschitz constant. In other words, the watermark bias for the next token does not drastically change under a semantically invariant perturbation. Consequently, for each token position $i$ , the semantic preference $P_{W}(x_{i},t_{:i-1})$ assigned by $W$ to the actual token $x_{i}$ in $t^{\prime}$ will be close to the value it was for $t$ . If $t$ was watermarked, most tokens had high semantic preference values (the watermark favored those choices); $t^{\prime}$ , using synonymous or rephrased tokens, will on average still yield high $P_{W}$ values for each token, since the tokens remain well-aligned with a similar context. Thus, for each token $x^{\prime}_{i}$ in $t^{\prime}$ , we get
$$
s^{\prime}_{\text{semantic}}=\frac{1}{T}\sum\limits{}_{i=0}^{T}\left(P_{W}(x^{\prime}_{i},t^{\prime}_{:i-1})-0\right)\approx s_{\text{semantic}}-\varepsilon,
$$
for some small $\varepsilon$ . The SynthID component uses a secret key $k$ to generate pseudorandom preferences. Without $k$ , $s^{\prime}_{\text{g-value}}\approx 0.5$ . In the original watermarked $t$ , tokens are biased toward higher $g$ -values. Hence, under semantic-preserving transformation, the g-value component drops to 0.5, but $s_{\text{semantic}}$ remains high. Therefore, the overall score: $s(t^{\prime})=\delta\cdot\frac{s^{\prime}_{\text{semantic}}+1}{2}+(1-\delta)\cdot s^{\prime}_{\text{g-value}}$ is still above threshold if $\delta$ is reasonably large. In conclusion, the watermark remains detectable in $t^{\prime}$ . ∎
**Theorem 2**
*Let $k$ be the watermark key for SynGuard. For any text $u$ not generated by the watermarking algorithm, the probability that $s(u)>\tau$ is exponentially small in $T$ .*
* Proof*
The robustness stems from the pseudorandom behavior of the SynthID component, which introduces a hidden bias into token selection based on a watermark key $k$ . The watermarking model adds a preference signal $g_{k}(x_{i},t_{:T-1})\in[0,1]$ for candidate tokens, and combines it with the semantic alignment score $P_{W}$ . The detector computes a combined score:
| | $\displaystyle s=\frac{\delta}{T}\sum_{i=1}^{T}\frac{P_{W}(x_{i},t_{:T-1})+1}{2}+\frac{(1-\delta)}{T}\sum_{i=1}^{T}g_{k}(x_{i},t_{:T-1}).$ | |
| --- | --- | --- | Now consider an attacker attempting to generate a fake watermarked text without access to $k$ :
- Since $g_{k}$ is keyed and pseudorandom, its outputs are statistically independent of the attacker’s choices.
- Therefore, the second term in $s$ , the SynthID component, behaves like uniform noise with expected value $\approx 0.5$ and variance $O(1/T)$ .
- The first term (semantic preference) is not optimized in the attacker’s text either, since only the original watermarker uses $P_{W}$ for guidance.
- Hence, the attacker’s overall score $s_{\text{fake}}\approx 0.5$ , with small deviations bounded by concentration inequalities. Let $Y_{i}=\frac{P_{W}(x_{i},t_{:i-1})+1}{2}$ and $Z_{i}=g_{k}(x_{i},t_{:i-1})$ , both taking values in $[0,1]$ . Define $X_{i}:=\delta Y_{i}+(1-\delta)Z_{i}$ , so $X_{i}\in[0,1]$ . Since $g_{k}$ is pseudorandom with no attacker control, and $P_{W}$ is optimized only during watermark generation, their expected values over attacker-generated text are both approximately $0.5$ . Hence $\mathbb{E}[X_{i}]=0.5$ . With $\mathbb{E}[X_{i}]=0.5$ , and $X_{1},\dots,X_{T}$ are i.i.d., Hoeffding’s inequality gives:
$$
\Pr(s>\tau)=\Pr\left(\frac{1}{T}\sum_{i=1}^{T}X_{i}>\tau\right)\leq e^{-2T(\tau-0.5)^{2}}.
$$ This shows that for any non-watermarked text $u$ , the probability of it being misclassified as watermarked (i.e., $s(u)>\tau$ ) decays exponentially with length $T$ . Meanwhile, a genuine watermarked text has both components biased upward (semantic tokens aligned and token scores chosen with positive $g_{k}$ bias), yielding $s_{\text{true}}>\tau$ , where $\tau\in(0.6,0.9)$ is the detection threshold. Therefore, false positives (attacker’s text exceeding threshold) are exponentially rare as $T$ increases. Likewise, removal attempts (via editing tokens) cannot reduce the score below threshold unless semantic meaning is also damaged. ∎
## VI Experimental Evaluation
This section presents the experimental settings, evaluation metrics, and results of SynGuard compared to the baselines.
### VI-A Experimental Setup
Backbone Model and Dataset. All experiments were conducted using Sheared-LLaMA-1.3B [21], a model further pre-trained from meta-llama/Llama-2-7b-hf https://huggingface.co/meta-llama/Llama-2-7b-hf and opt-1.3B https://huggingface.co/facebook/opt-1.3b from Meta. These models used are publicly available via HuggingFace. For the dataset, we adopt the Colossal Clean Crawled Corpus (C4) [22], which includes diverse, high-quality web text. Each C4 sample is split into two segments: the first segment serves as the prompt for generation, while the second (human-written) segment is used as reference text. The quality of the generated text is assessed using Perplexity (PPL) scores, which reflect how fluent and natural the output text is. These unaltered human texts are treated as control data for evaluating the watermark detector’s false positive rate.
Evaluation Metrics. The robustness is evaluated using the following metrics: True Positive Rate (TPR), False Positive Rate (FPR), F1 Score, and ROC-AUC. Each experiment was conducted using 200 watermarked and 200 unwatermarked samples, each with a fixed length of $T=200$ tokens, as same as the default setting of [23, 5]. All experiments were implemented using the MarkLLM toolkit [23].
### VI-B Main Results
This section uses the F1 score to demonstrate the detection accuracy of SynGuard, and compares it to the baseline methods, SIR and SynthID-Text. The naturalness of the output texts generated by these three algorithms is also evaluated to assess their textual quality.
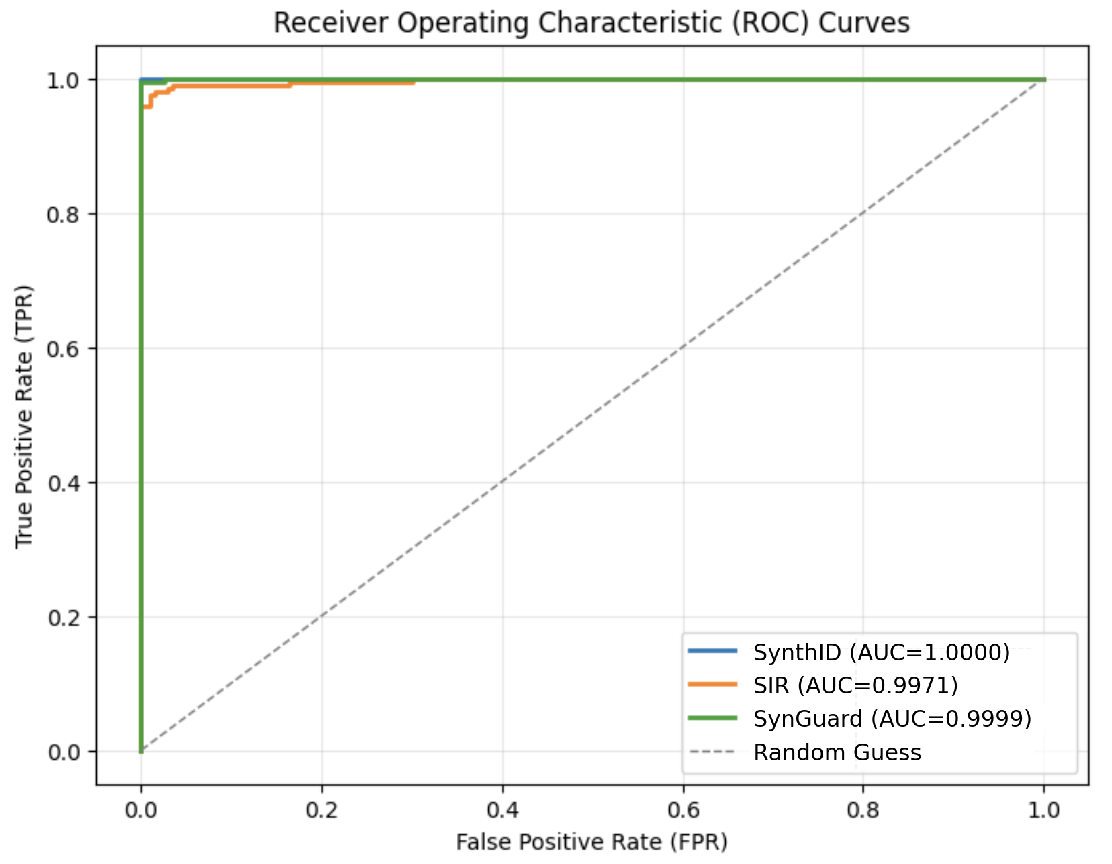
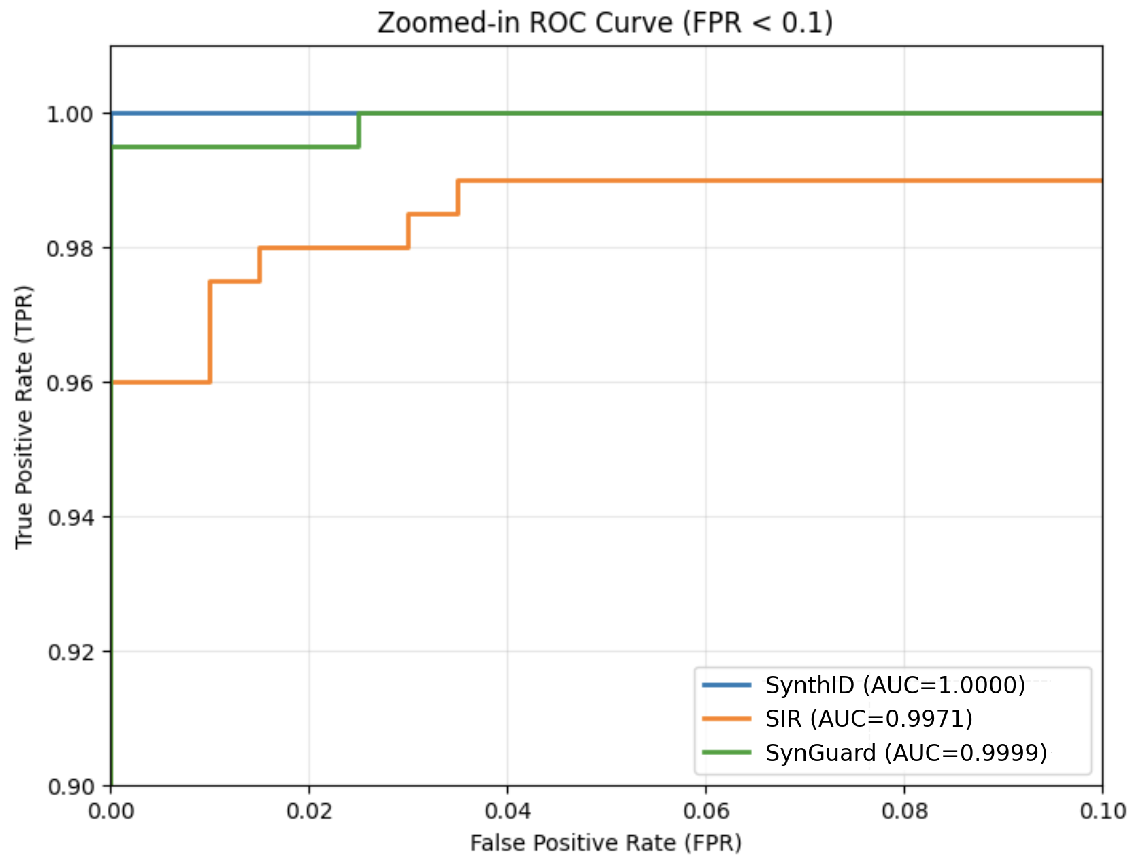
Detection Accuracy and ROC Curves. Fig. 7 (a) illustrates that all three algorithms achieve high detection accuracy, with AUC values above 0.9. From Fig. 7 (b), it is evident that SynthID-Text achieves the highest detection accuracy of 1.00. SIR yields the lowest detection accuracy at 0.9971, exhibiting a noticeable gap compared to SynthID-Text. The detection accuracy of SynGuard is slightly lower than SynthID-Text by only 0.0001, but higher than that of SIR.
<details>
<summary>figures/roc_curves_of_SynthID_SIR_SIR-SynthID.png Details</summary>
### Visual Description
## ROC Curve: Receiver Operating Characteristic (ROC) Curves
### Overview
The image displays a Receiver Operating Characteristic (ROC) curve comparing the performance of three classification models (SynthID, SIR, SynGuard) against a random guess baseline. The curves plot True Positive Rate (TPR) against False Positive Rate (FPR) to evaluate model accuracy.
### Components/Axes
- **X-axis**: False Positive Rate (FPR) ranging from 0.0 to 1.0 in 0.2 increments.
- **Y-axis**: True Positive Rate (TPR) ranging from 0.0 to 1.0 in 0.2 increments.
- **Legend**: Located in the bottom-right corner, with four entries:
- **SynthID** (blue solid line, AUC=1.0000)
- **SIR** (orange solid line, AUC=0.9971)
- **SynGuard** (green solid line, AUC=0.9999)
- **Random Guess** (dashed gray line)
### Detailed Analysis
1. **SynthID (Blue Line)**:
- Starts at (FPR=0.0, TPR=1.0) and remains perfectly flat at TPR=1.0 across all FPR values.
- Indicates **perfect classification performance** with no false positives.
2. **SIR (Orange Line)**:
- Begins at (FPR=0.0, TPR=0.95) and jumps to (FPR=0.05, TPR=0.95) before remaining flat.
- Shows a **minor trade-off** between FPR and TPR at low FPR values, but maintains high accuracy overall.
3. **SynGuard (Green Line)**:
- Starts at (FPR=0.0, TPR=1.0) and remains perfectly flat at TPR=1.0 across all FPR values.
- Matches SynthID's performance but with a slightly lower AUC (0.9999 vs. 1.0000).
4. **Random Guess (Dashed Gray Line)**:
- Diagonal line from (FPR=0.0, TPR=0.0) to (FPR=1.0, TPR=1.0).
- Represents the **baseline performance** for a random classifier.
### Key Observations
- **SynthID** achieves **perfect AUC=1.0000**, indicating no false positives or negatives.
- **SynGuard** has an **AUC=0.9999**, nearly identical to SynthID but with a marginally lower TPR at FPR=0.0.
- **SIR** has an **AUC=0.9971**, slightly lower than the other two models, with a small dip in TPR at FPR=0.05.
- The **Random Guess** line serves as a reference for expected performance by chance.
### Interpretation
The ROC curves demonstrate that **SynthID** and **SynGuard** are highly effective classifiers, with SynthID achieving theoretical perfection. The **SIR** model performs slightly worse but remains robust, with its minor TPR drop at FPR=0.05 suggesting a negligible trade-off between precision and recall. The **Random Guess** line confirms that all models outperform chance. The AUC values (ranging from 0.9971 to 1.0000) indicate that these models are **exceptionally accurate**, with SynthID being the most reliable. The slight differences in AUC between SynthID and SynGuard (1.0000 vs. 0.9999) may reflect minor variations in handling edge cases or data noise.
</details>
(a) ROC curves of three algorithms.
<details>
<summary>figures/zoom-in_rocs_for_3_algorithms.png Details</summary>
### Visual Description
## Chart/Diagram Type: Zoomed-in ROC Curve (FPR < 0.1)
### Overview
The image displays a zoomed-in Receiver Operating Characteristic (ROC) curve focusing on the False Positive Rate (FPR) range of 0.00 to 0.10. The chart compares three classification models: SynthID, SIR, and SynGuard, using their True Positive Rate (TPR) performance across varying FPR thresholds. The chart emphasizes precision in low-FPR scenarios, with axis labels, legends, and AUC (Area Under Curve) metrics provided for each model.
---
### Components/Axes
- **X-Axis**: "False Positive Rate (FPR)" with values from 0.00 to 0.10 in increments of 0.02.
- **Y-Axis**: "True Positive Rate (TPR)" with values from 0.90 to 1.00 in increments of 0.02.
- **Legend**: Located at the bottom-right corner, with three entries:
- **Blue Line**: SynthID (AUC=1.0000)
- **Orange Line**: SIR (AUC=0.9971)
- **Green Line**: SynGuard (AUC=0.9999)
---
### Detailed Analysis
1. **SynthID (Blue Line)**:
- **Trend**: Horizontal line at TPR=1.00 across all FPR values (0.00 to 0.10).
- **Key Data Points**:
- FPR=0.00 → TPR=1.00
- FPR=0.02 → TPR=1.00
- FPR=0.04 → TPR=1.00
- FPR=0.06 → TPR=1.00
- FPR=0.08 → TPR=1.00
- FPR=0.10 → TPR=1.00
2. **SIR (Orange Line)**:
- **Trend**: Stepwise increase in TPR as FPR rises.
- **Key Data Points**:
- FPR=0.00 → TPR=0.96
- FPR=0.02 → TPR=0.98
- FPR=0.04 → TPR=0.98
- FPR=0.06 → TPR=0.98
- FPR=0.08 → TPR=0.98
- FPR=0.10 → TPR=0.98
3. **SynGuard (Green Line)**:
- **Trend**: Slight dip in TPR at FPR=0.02, then stabilizes.
- **Key Data Points**:
- FPR=0.00 → TPR=0.995
- FPR=0.02 → TPR=0.99
- FPR=0.04 → TPR=0.99
- FPR=0.06 → TPR=0.99
- FPR=0.08 → TPR=0.99
- FPR=0.10 → TPR=0.99
---
### Key Observations
1. **SynthID Dominance**: Maintains perfect TPR (1.00) across all FPR thresholds, indicating no false negatives in this range.
2. **SIR Performance**: Shows incremental improvement in TPR as FPR increases, but plateaus at 0.98 after FPR=0.02.
3. **SynGuard Stability**: Exhibits a minor TPR drop at FPR=0.02 (0.995 → 0.99) but remains stable thereafter.
4. **AUC Rankings**: SynthID (1.0000) > SynGuard (0.9999) > SIR (0.9971), reflecting SynthID's superior discriminative ability.
---
### Interpretation
- **Model Performance**: SynthID's perfect TPR suggests it is optimal for scenarios where minimizing false negatives is critical, even at the cost of higher FPR (though FPR is constrained here to <0.1). Its AUC=1.0000 indicates near-perfect separation between classes.
- **Trade-offs**: SIR and SynGuard show trade-offs between TPR and FPR. SIR's stepwise increase implies threshold adjustments, while SynGuard's slight dip at FPR=0.02 may reflect sensitivity to specific edge cases.
- **Practical Implications**: The zoomed-in FPR range (<0.1) highlights models optimized for high-precision applications (e.g., medical diagnostics, fraud detection). SynthID's performance suggests it could be ideal for such use cases, though real-world deployment would require validation beyond this narrow FPR window.
</details>
(b) Zoom-in ROC curves for the three algorithms.
Figure 7: Comparison and zoomed-in view of ROC curves for three watermarking algorithms: SynthID-Text, SIR, and SynGuard.
TABLE VI: Detection accuracy of SynthID-Text, SIR, and SynGuard.
| Algorithm | TPR | FPR | F1 with best threshold | Running Time(s/it) |
| --- | --- | --- | --- | --- |
| SynthID-Text | 1.0 | 0.0 | 1.0 | 6.09 |
| SIR | 0.98 | 0.015 | 0.9825 | 12.50 |
| SynGuard | 0.995 | 0.0 | 0.9975 | 12.93 |
Text Quality. PPL, a metric quantifying a language model’s predictive confidence in text (lower values indicate stronger alignment with the model’s training distribution, though not absolute quality), reveals nuanced watermarking impacts in Fig. 8. SynthID’s watermarked outputs exhibit lower PPL than their unwatermarked counterparts, suggesting its watermarking leverages semantically compatible tokens that align with the model’s learned patterns. In contrast, SIR’s watermarked texts show elevated PPL and broader distribution, indicative of disruptive interventions (e.g., forced token substitutions) that breach local coherence, amplifying predictive uncertainty. Our proposed SynGuard achieves lower PPL for watermarked texts relative to SIR, coupled with a compact distribution and minimal outliers. This arises from its hybrid design: integrating SynthID’s semantic-aware watermark encoding to preserve model-aligned fluency, while introducing stabilization mechanisms to curb output variability. Critically, PPL reflects model familiarity rather than intrinsic quality (e.g., logic or novelty), so these results underscore watermarking’s influence on textual conformity to pre-trained distributions.
Time Overhead. Table VI reports the TPR, FPR, and F1 score for each method. The proposed SynGuard algorithm achieves an F1 score of 0.9975, just 0.25% below the maximum value of 1. Time overhead test results are obtained from an T4 graphics card with 15.0 GB of memory on Google Colab. As can be seen, while significantly improving robustness and text quality, SynGuard did not significantly increase time overhead and is comparable to the SIR scheme.
<details>
<summary>figures/text_quality-PPL.png Details</summary>
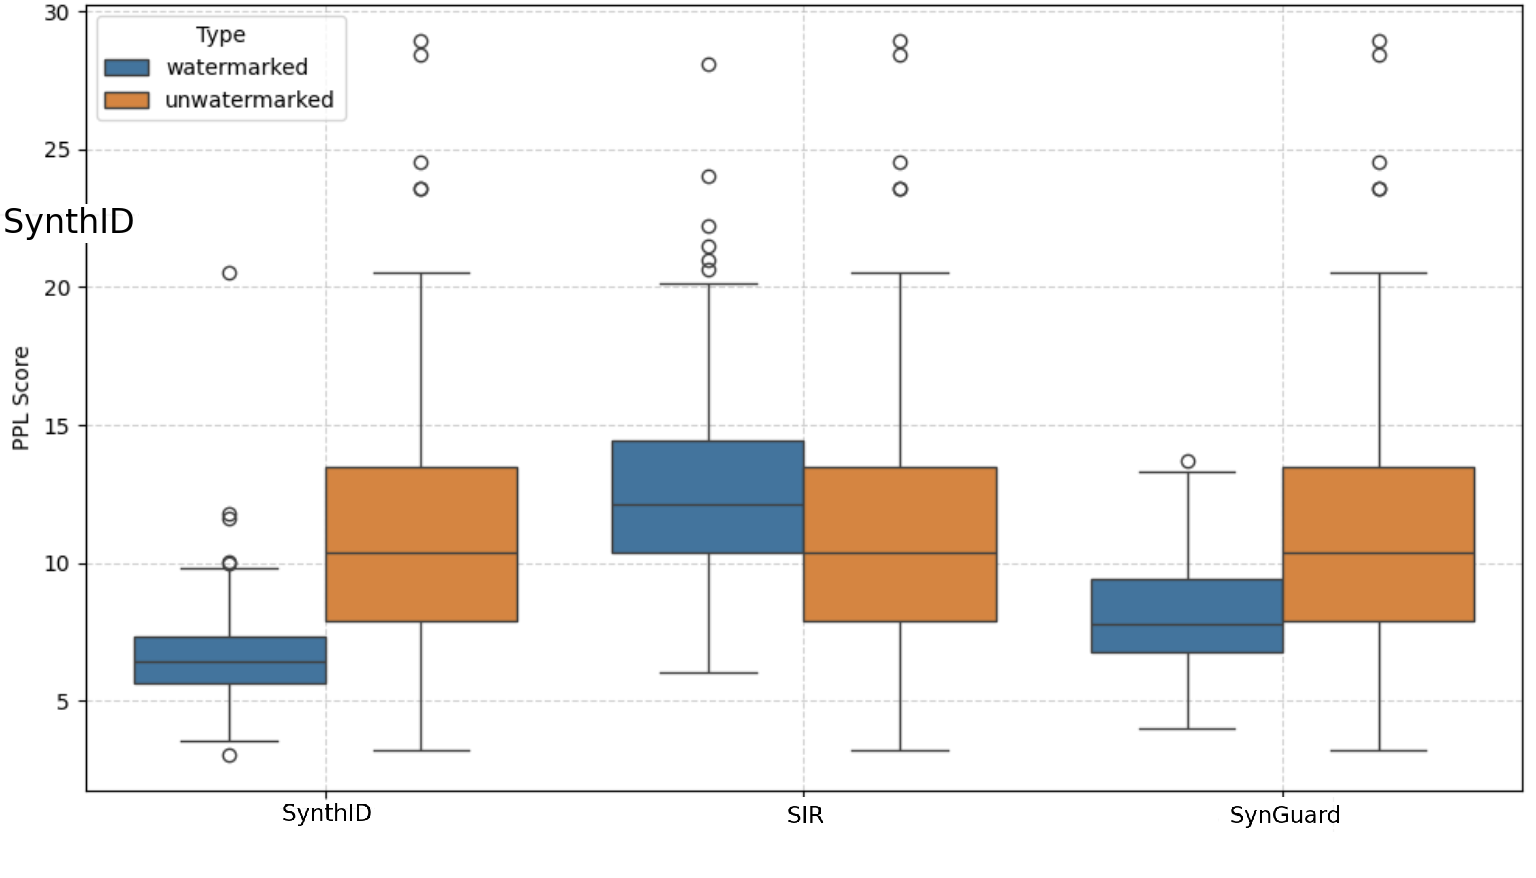
### Visual Description
## Box Plot: PPL Score Comparison Across Methods
### Overview
The image presents a comparative box plot analysis of PPL (Perplexity) scores for three text generation methods: SynthID, SIR, and SynGuard. The data is categorized by two types: watermarked (blue) and unwatermarked (orange). The y-axis represents PPL scores (0–30), while the x-axis lists the three methods. Outliers are marked as individual points beyond the whiskers.
### Components/Axes
- **X-axis (Methods)**:
- SynthID (leftmost)
- SIR (middle)
- SynGuard (rightmost)
- **Y-axis (PPL Score)**:
- Range: 0 to 30 (discrete increments of 5)
- Labels: "PPL Score" with numerical ticks at 0, 5, 10, 15, 20, 25, 30
- **Legend**:
- Top-left corner
- Blue = watermarked
- Orange = unwatermarked
- **Outliers**:
- Represented as open circles beyond whiskers
### Detailed Analysis
#### SynthID
- **Watermarked (blue)**:
- Median: ~6
- IQR: 5–7
- Outliers: 10, 11
- **Unwatermarked (orange)**:
- Median: ~10
- IQR: 8–12
- Outliers: 13, 14
#### SIR
- **Watermarked (blue)**:
- Median: ~12
- IQR: 10–14
- Outliers: 15, 16, 17, 18, 19, 20, 21, 22, 23, 24, 25
- **Unwatermarked (orange)**:
- Median: ~10
- IQR: 8–12
- Outliers: 13, 14, 15, 16, 17, 18, 19, 20, 21, 22, 23, 24, 25
#### SynGuard
- **Watermarked (blue)**:
- Median: ~8
- IQR: 6–10
- Outliers: 11, 12
- **Unwatermarked (orange)**:
- Median: ~12
- IQR: 10–14
- Outliers: 15, 16, 17, 18, 19, 20, 21, 22, 23, 24, 25
### Key Observations
1. **Watermarked vs. Unwatermarked**:
- Watermarked methods consistently show lower median PPL scores (better performance) across all three methods.
- SIR’s watermarked median (~12) is higher than SynthID’s (~6) and SynGuard’s (~8), suggesting SIR’s watermarked outputs are less optimal.
- Unwatermarked scores are higher (worse performance) for all methods, with SynGuard’s unwatermarked median (~12) being the highest.
2. **Outliers**:
- SIR’s watermarked data has the most outliers (15–25), indicating significant variability or anomalies.
- SynGuard’s unwatermarked data also has multiple outliers (15–25), suggesting instability in unwatermarked outputs.
3. **Distribution**:
- SynthID’s watermarked data is tightly clustered (IQR: 5–7), while its unwatermarked data is more spread out (IQR: 8–12).
- SIR’s watermarked data has a wider IQR (10–14) compared to its unwatermarked counterpart (8–12).
### Interpretation
The data suggests that **watermarking improves PPL scores** (i.e., reduces perplexity) across all methods, with SynthID showing the most consistent performance for watermarked outputs. SIR’s watermarked data, while having a higher median than SynthID and SynGuard, exhibits extreme variability (outliers up to 25), which may indicate instability or edge cases in its watermarked outputs. SynGuard’s unwatermarked data has the highest median (~12), suggesting it performs worst among unwatermarked methods. The presence of outliers in SIR and SynGuard’s data highlights potential inconsistencies in their respective methods. This analysis underscores the importance of watermarking for optimizing text generation quality, with SynthID emerging as the most reliable method for watermarked outputs.
</details>
Figure 8: Text Quality Comparison Using PPL.
### VI-C Robustness Evaluation under Attacks
#### VI-C1 Synonym Substitution
For the synonym substitution attack, we evaluated performance under varying substitution ratios: $[0,0.3,0.5,0.7]$ . The resulting ROC curves are shown in Fig. 9. Even with a substitution ratio of 0.7, the AUC decreased by only 1.23% and remained above 0.98. As shown in Table VII, the FPR values remained low across all ratios, and the F1 scores consistently exceeded 0.95. These results highlight the strong robustness of SynGuard against synonym substitution attacks.
<details>
<summary>figures/SIR-SynthID-synonym_substitution-roc.png Details</summary>
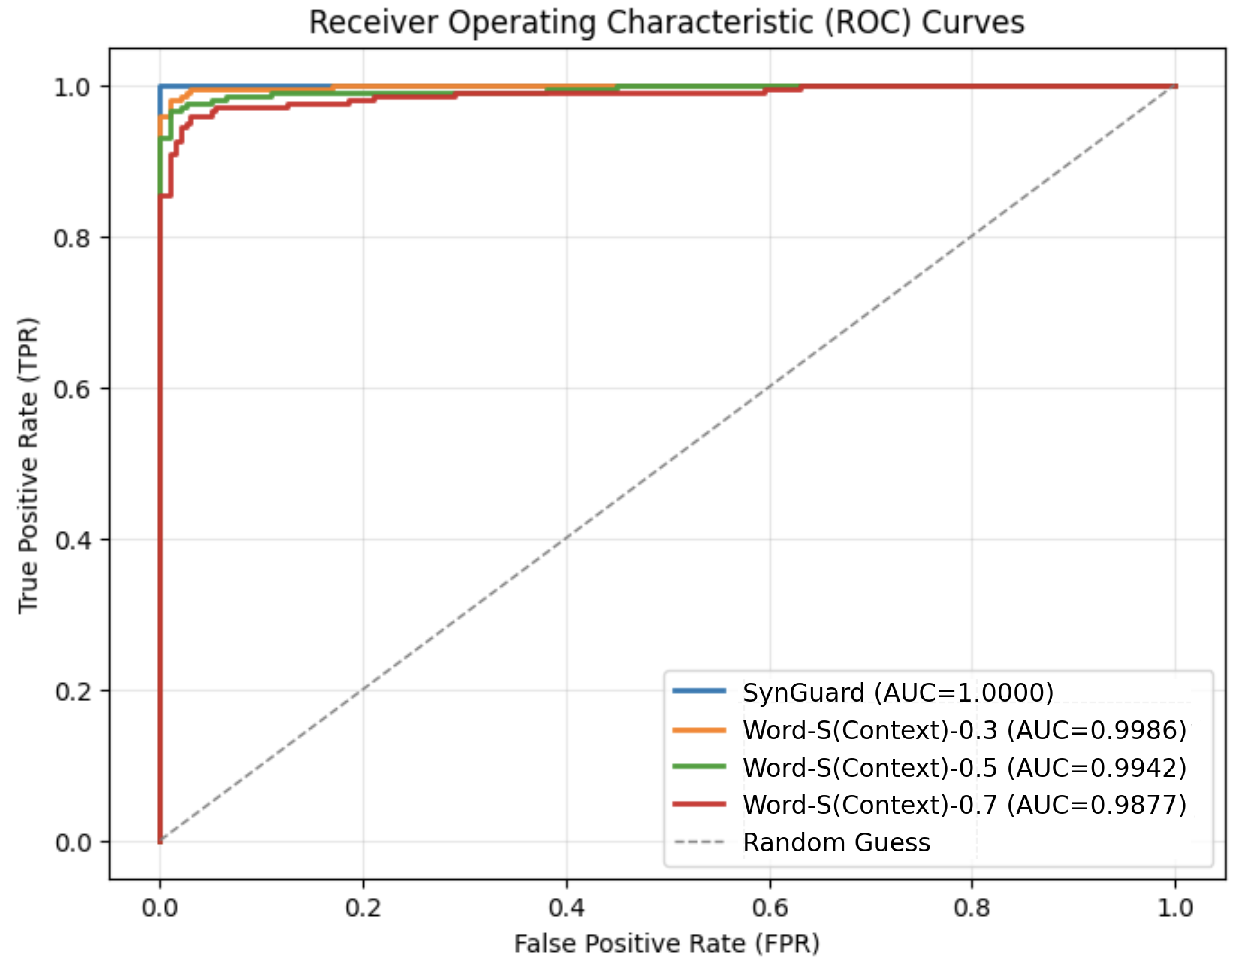
### Visual Description
## Receiver Operating Characteristic (ROC) Curves
### Overview
The image displays a Receiver Operating Characteristic (ROC) curve comparing the performance of multiple classification models. The chart plots **True Positive Rate (TPR)** against **False Positive Rate (FPR)** for different algorithms, with a reference line for random guessing. All models show high performance, with SynGuard achieving near-perfect results.
---
### Components/Axes
- **X-axis**: False Positive Rate (FPR) ranging from 0.0 to 1.0 in increments of 0.2.
- **Y-axis**: True Positive Rate (TPR) ranging from 0.0 to 1.0 in increments of 0.2.
- **Legend**: Located in the bottom-right corner, listing:
- **SynGuard** (AUC = 1.0000) – Blue line.
- **Word-S(Context)-0.3** (AUC = 0.9986) – Orange line.
- **Word-S(Context)-0.5** (AUC = 0.9942) – Green line.
- **Word-S(Context)-0.7** (AUC = 0.9877) – Red line.
- **Random Guess** – Dashed gray diagonal line from (0,0) to (1,1).
---
### Detailed Analysis
1. **SynGuard (Blue Line)**:
- Starts at (FPR=0.0, TPR=1.0) and remains perfectly flat at TPR=1.0 across all FPR values.
- AUC = 1.0000, indicating perfect classification with no trade-off between TPR and FPR.
2. **Word-S(Context)-0.3 (Orange Line)**:
- Begins at (FPR=0.0, TPR≈0.95) and rises sharply to TPR=1.0 by FPR=0.1.
- Maintains TPR=1.0 for FPR > 0.1, with AUC = 0.9986.
3. **Word-S(Context)-0.5 (Green Line)**:
- Starts at (FPR=0.0, TPR≈0.9) and rises to TPR=1.0 by FPR=0.15.
- Remains flat at TPR=1.0 for FPR > 0.15, with AUC = 0.9942.
4. **Word-S(Context)-0.7 (Red Line)**:
- Begins at (FPR=0.0, TPR≈0.85) and reaches TPR=1.0 by FPR=0.2.
- Stays flat at TPR=1.0 for FPR > 0.2, with AUC = 0.9877.
5. **Random Guess (Dashed Gray Line)**:
- Diagonal line from (0,0) to (1,1), representing a baseline performance with no discriminative power.
---
### Key Observations
- **SynGuard** outperforms all other models, achieving perfect TPR at FPR=0.0.
- **Word-S(Context)** models show diminishing performance as the context parameter increases (from -0.3 to -0.7), reflected in lower AUC values.
- All models significantly exceed the random guess line, confirming their utility in classification tasks.
- The steepest rise in TPR occurs for SynGuard and Word-S(Context)-0.3, indicating rapid improvement in sensitivity.
---
### Interpretation
The chart demonstrates that **SynGuard** is the optimal classifier for this dataset, with no trade-off between sensitivity and false alarms. The **Word-S(Context)** models exhibit near-optimal performance but degrade slightly with more negative context parameters. The AUC values confirm that all models are highly effective, though SynGuard’s perfect score suggests it may be tailored to this specific task. The random guess line underscores the importance of model selection, as even the weakest model (Word-S(Context)-0.7) outperforms chance by a wide margin. This visualization highlights the trade-offs in classifier design and the impact of contextual parameters on performance.
</details>
(a) ROC curves
<details>
<summary>figures/new_method_word_sub_zoomin.png Details</summary>
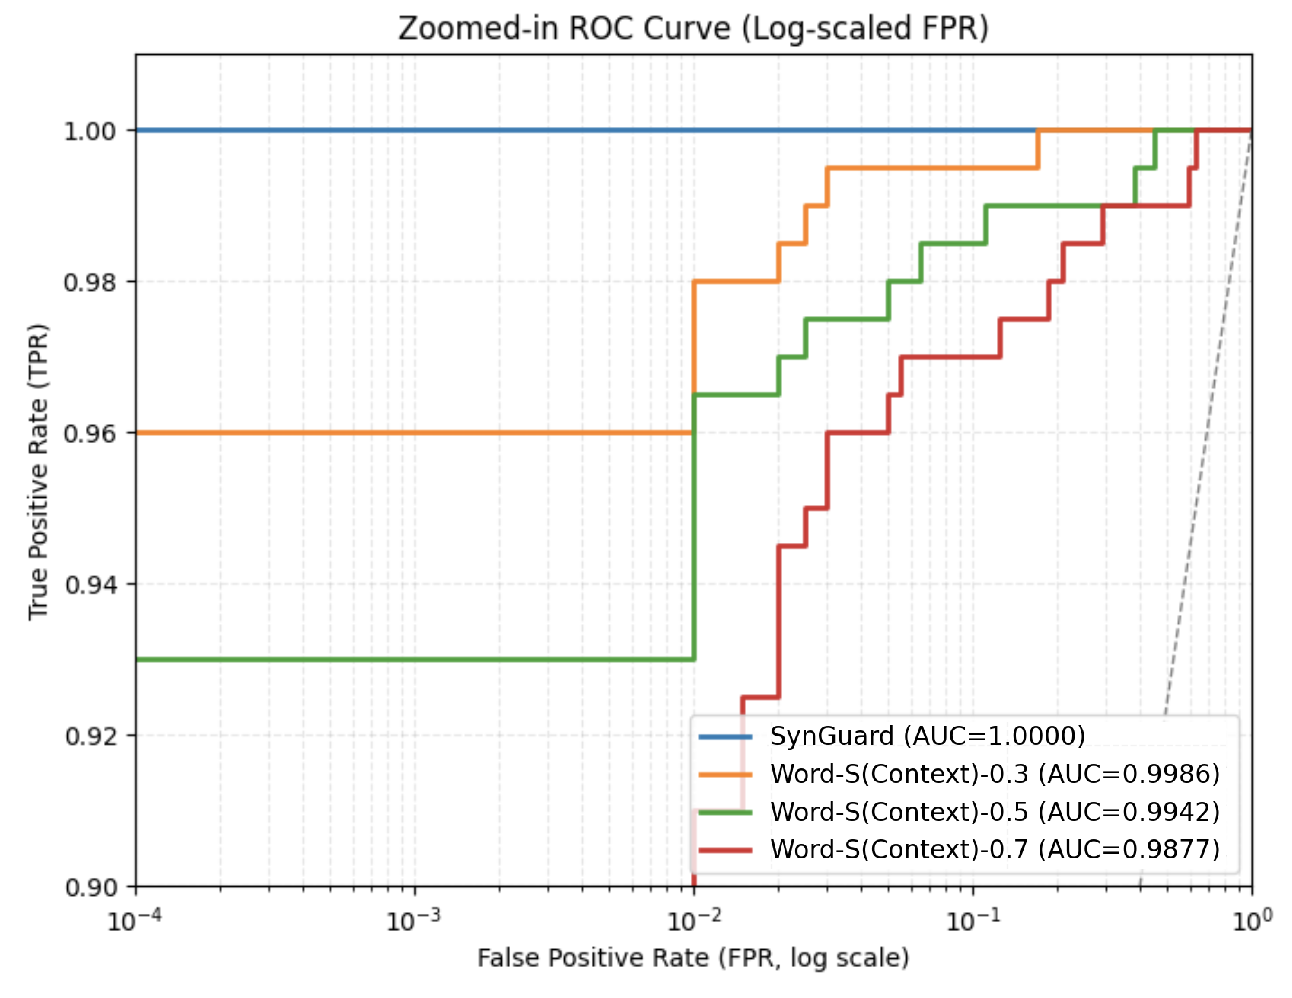
### Visual Description
## Chart/Diagram Type: Zoomed-in ROC Curve (Log-scaled FPR)
### Overview
The image displays a zoomed-in Receiver Operating Characteristic (ROC) curve with a log-scaled False Positive Rate (FPR) axis. It compares the performance of four models: SynGuard and three variants of Word-S with different context parameters. The curve highlights trade-offs between TPR and FPR, with AUC (Area Under the Curve) values provided for each model.
### Components/Axes
- **X-axis**: False Positive Rate (FPR, log scale) ranging from 10⁻⁴ to 10⁰.
- **Y-axis**: True Positive Rate (TPR) ranging from 0.90 to 1.00.
- **Legend**: Located in the bottom-right corner, with four entries:
- **Blue**: SynGuard (AUC=1.0000)
- **Orange**: Word-S(Context)-0.3 (AUC=0.9986)
- **Green**: Word-S(Context)-0.5 (AUC=0.9942)
- **Red**: Word-S(Context)-0.7 (AUC=0.9877)
- **Dashed Line**: Represents the diagonal baseline (TPR = FPR).
### Detailed Analysis
1. **SynGuard (Blue Line)**:
- **Trend**: Horizontal line at TPR=1.00 across all FPR values.
- **Key Data Points**:
- FPR=10⁻⁴ → TPR=1.00
- FPR=10⁻³ → TPR=1.00
- FPR=10⁻² → TPR=1.00
- FPR=10⁻¹ → TPR=1.00
- FPR=10⁰ → TPR=1.00
- **AUC**: 1.0000 (perfect performance).
2. **Word-S(Context)-0.3 (Orange Line)**:
- **Trend**: Stepwise increase in TPR as FPR increases.
- **Key Data Points**:
- FPR=10⁻² → TPR=0.96
- FPR=10⁻¹ → TPR=0.98
- FPR=10⁰ → TPR=1.00
- **AUC**: 0.9986.
3. **Word-S(Context)-0.5 (Green Line)**:
- **Trend**: Stepwise increase in TPR as FPR increases.
- **Key Data Points**:
- FPR=10⁻² → TPR=0.93
- FPR=10⁻¹ → TPR=0.96
- FPR=10⁰ → TPR=0.98
- **AUC**: 0.9942.
4. **Word-S(Context)-0.7 (Red Line)**:
- **Trend**: Stepwise increase in TPR as FPR increases.
- **Key Data Points**:
- FPR=10⁻² → TPR=0.90
- FPR=10⁻¹ → TPR=0.94
- FPR=10⁰ → TPR=0.97
- **AUC**: 0.9877.
### Key Observations
- **SynGuard** achieves perfect TPR (1.00) across all FPR values, indicating no false positives.
- **Word-S** models show diminishing performance with lower context parameters (e.g., -0.7 vs. -0.3).
- The log-scaled FPR axis emphasizes performance at low FPR ranges (e.g., 10⁻² to 10⁻¹).
- The dashed baseline (TPR = FPR) is visually distinct, confirming the models outperform random guessing.
### Interpretation
- **Model Performance**: SynGuard dominates with a perfect ROC curve, suggesting it is the most reliable model. The Word-S models, while effective, exhibit trade-offs between TPR and FPR, with lower context parameters (e.g., -0.7) resulting in higher FPR for equivalent TPR.
- **Log-Scale Insight**: The log-scaled FPR axis highlights the models' ability to handle extreme FPR values, which is critical for applications requiring high precision.
- **Context Parameter Impact**: The decline in AUC from 0.9986 (Context -0.3) to 0.9877 (Context -0.7) indicates that reducing context sensitivity degrades model performance.
- **Practical Implications**: SynGuard’s flawless TPR suggests it is ideal for scenarios where false positives are unacceptable, while Word-S models may be preferable when balancing TPR and FPR is necessary.
</details>
(b) Zoomed-in views
Figure 9: ROC curves of SynGuard under synonym substitution attacks.
TABLE VII: Watermark detection accuracy of SynthID-Text and SynGuard under different synonym substitution attacks
| Attack | SynthID-Text | SynGuard | | | | |
| --- | --- | --- | --- | --- | --- | --- |
| TPR | FPR | F1 | TPR | FPR | F1 | |
| No attack | 1.00 | 0.00 | 1.000 | 1.00 | 0.00 | 1.000 |
| Word-S(Context)-0.3 | 0.98 | 0.005 | 0.987 | 0.98 | 0.01 | 0.985 |
| Word-S(Context)-0.5 | 0.91 | 0.035 | 0.936 | 0.97 | 0.01 | 0.977 |
| Word-S(Context)-0.7 | 0.82 | 0.035 | 0.884 | 0.96 | 0.03 | 0.965 |
#### VI-C2 Copy-and-Paste
For the copy-and-paste attack, the key parameter is the ratio between the length of the natural (or unwatermarked) text into which the watermarked content is pasted and the length of the original watermarked segment. In this experiment, the watermarked content has a fixed length of $T=200$ . We tested three different length ratios: [5, 10, 15], and the results are presented in Fig. 10.
Compared to synonym substitution, the impact of increasing the length ratio is more pronounced. When the copy-and-paste ratio reaches 10, the AUC already falls below 0.9. The detailed FPRs and F1 scores are listed in Table VIII. Increasing the length ratio from 5 to 10 results in only a slight F1 score decrease of approximately 0.56%. However, further increasing the ratio from 10 to 15 leads to a more substantial reduction of approximately 5%, with the F1 score decreasing to 0.848.
<details>
<summary>figures/copy-paste_attack_roc.png Details</summary>

### Visual Description
## ROC Curve: Receiver Operating Characteristic (ROC) Curves
### Overview
The image displays a Receiver Operating Characteristic (ROC) curve comparing the performance of four classification models: SynthID, Copy-Paste-5, Copy-Paste-10, and Copy-Paste-15, against a random guess baseline. The curves illustrate the trade-off between True Positive Rate (TPR) and False Positive Rate (FPR) for different classification thresholds.
### Components/Axes
- **X-axis**: False Positive Rate (FPR) ranging from 0.0 to 1.0 in increments of 0.2.
- **Y-axis**: True Positive Rate (TPR) ranging from 0.0 to 1.0 in increments of 0.2.
- **Legend**: Located in the bottom-right corner, with the following entries:
- **SynthID (AUC = 1.0000)**: Blue solid line.
- **Copy-Paste-5 (AUC = 0.8559)**: Orange solid line.
- **Copy-Paste-10 (AUC = 0.6679)**: Green solid line.
- **Copy-Paste-15 (AUC = 0.5883)**: Red solid line.
- **Random Guess**: Gray dashed diagonal line (AUC = 0.5 by definition).
### Detailed Analysis
1. **SynthID (Blue Line)**:
- Starts at (0.0, 0.0) and immediately rises vertically to (0.0, 1.0), then horizontally to (1.0, 1.0).
- Perfect classifier with no false positives (FPR = 0.0) and maximum true positives (TPR = 1.0).
- AUC = 1.0000 (ideal performance).
2. **Copy-Paste-5 (Orange Line)**:
- Begins at (0.0, 0.0), rises steeply to ~(0.2, 0.8), then flattens to (1.0, 0.8).
- AUC = 0.8559, indicating strong but imperfect performance.
- TPR plateaus at ~0.8 as FPR increases beyond 0.2.
3. **Copy-Paste-10 (Green Line)**:
- Starts at (0.0, 0.0), rises gradually to ~(0.4, 0.6), then steeply to (1.0, 0.6).
- AUC = 0.6679, showing moderate performance.
- TPR plateaus at ~0.6 as FPR increases beyond 0.4.
4. **Copy-Paste-15 (Red Line)**:
- Begins at (0.0, 0.0), rises slowly to ~(0.6, 0.4), then steeply to (1.0, 0.4).
- AUC = 0.5883, indicating poor performance.
- TPR plateaus at ~0.4 as FPR increases beyond 0.6.
5. **Random Guess (Gray Dashed Line)**:
- Diagonal line from (0.0, 0.0) to (1.0, 1.0), representing a baseline with no discriminative power.
- AUC = 0.5 (expected for random guessing).
### Key Observations
- **SynthID** outperforms all other models, achieving perfect separation between classes.
- **Copy-Paste** models degrade in performance as the number increases (5 → 10 → 15), with AUC dropping from 0.8559 to 0.5883.
- The **Random Guess** line serves as a critical benchmark, confirming that all models except Copy-Paste-15 outperform random chance.
- All curves converge at (1.0, 1.0), reflecting the theoretical maximum TPR when FPR = 1.0.
### Interpretation
The data suggests that **SynthID** is an optimal classifier for this task, while the **Copy-Paste** models exhibit diminishing returns as their configuration complexity increases (e.g., higher numbers). The steep decline in AUC from Copy-Paste-5 to Copy-Paste-15 implies potential overfitting or parameter instability in larger configurations. The **Random Guess** line underscores the importance of AUC as a metric: models with AUC > 0.5 are better than random, but only SynthID achieves near-perfect performance. This analysis highlights the need for careful model selection and threshold tuning in classification tasks.
</details>
(a) SynthID-Text
<details>
<summary>figures/copy-and-paste_attack_curves.png Details</summary>
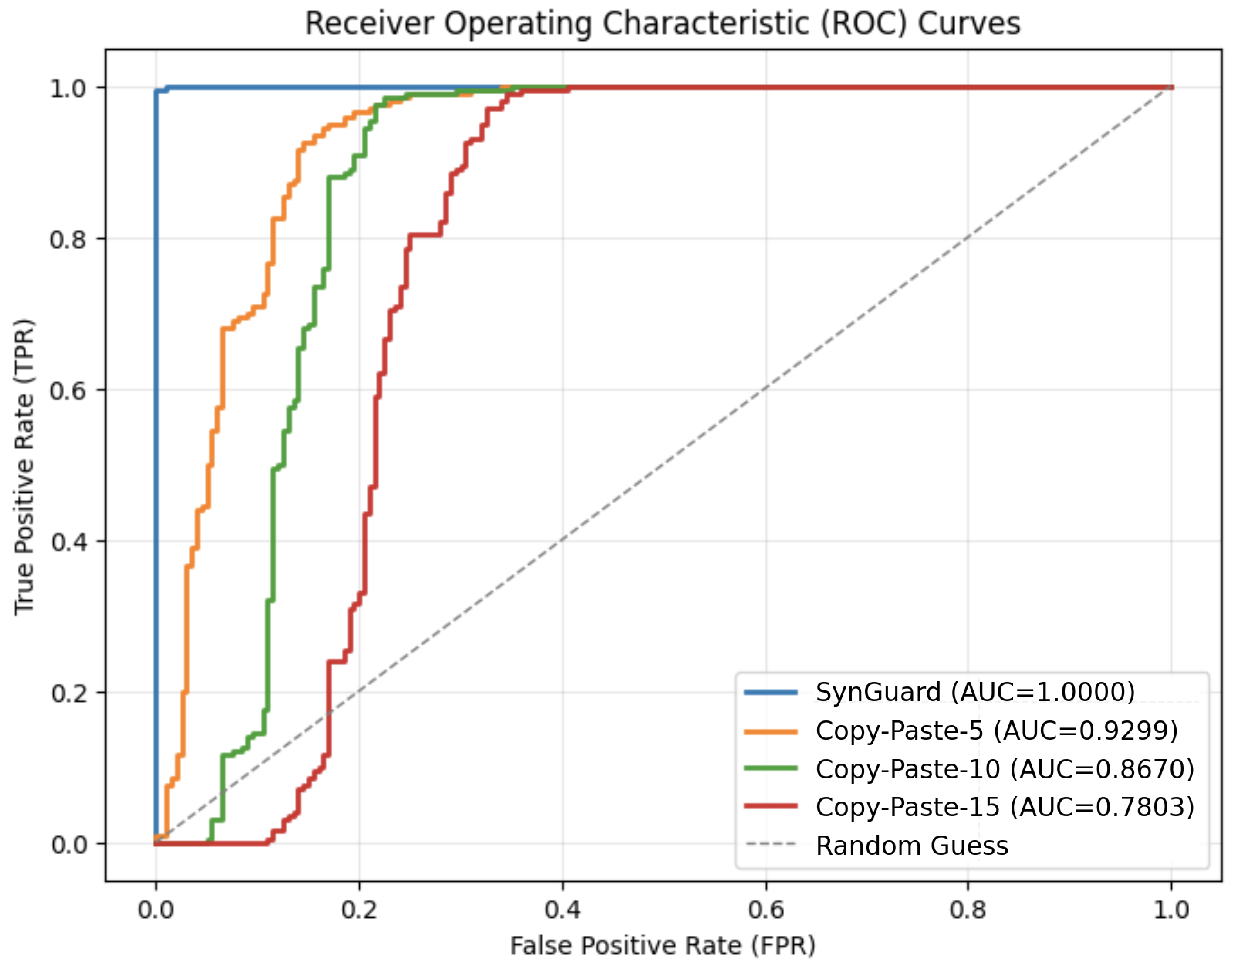
### Visual Description
## ROC Curves: Receiver Operating Characteristic (ROC) Curves
### Overview
The image displays a Receiver Operating Characteristic (ROC) curve chart comparing the performance of four classification models: **SynGuard**, **Copy-Paste-5**, **Copy-Paste-10**, **Copy-Paste-15**, and a **Random Guess** baseline. The chart plots **True Positive Rate (TPR)** against **False Positive Rate (FPR)**, with each model represented by a distinct colored line. The **Random Guess** line is a dashed diagonal reference.
---
### Components/Axes
- **X-axis**: **False Positive Rate (FPR)** (0.0 to 1.0, increments of 0.2).
- **Y-axis**: **True Positive Rate (TPR)** (0.0 to 1.0, increments of 0.2).
- **Legend**: Located in the **bottom-right corner**, with the following entries:
- **SynGuard** (blue line, AUC = 1.0000)
- **Copy-Paste-5** (orange line, AUC = 0.9299)
- **Copy-Paste-10** (green line, AUC = 0.8670)
- **Copy-Paste-15** (red line, AUC = 0.7803)
- **Random Guess** (dashed gray line).
---
### Detailed Analysis
1. **SynGuard (Blue Line)**:
- Starts at (0.0, 0.0) and immediately rises vertically to (0.0, 1.0), then horizontally to (1.0, 1.0).
- **Trend**: Perfect classifier (TPR = 1.0 for all FPR values).
- **AUC**: 1.0000 (maximum possible).
2. **Copy-Paste-5 (Orange Line)**:
- Starts at (0.0, 0.0) and rises steeply to (0.2, 0.8), then gradually increases to (1.0, 1.0).
- **Trend**: High TPR at low FPR, but performance degrades slightly at higher FPR.
- **AUC**: 0.9299.
3. **Copy-Paste-10 (Green Line)**:
- Starts at (0.0, 0.0) and rises to (0.2, 0.6), then gradually increases to (1.0, 1.0).
- **Trend**: Lower TPR than Copy-Paste-5 at low FPR, with a more gradual slope.
- **AUC**: 0.8670.
4. **Copy-Paste-15 (Red Line)**:
- Starts at (0.0, 0.0) and rises to (0.2, 0.4), then gradually increases to (1.0, 1.0).
- **Trend**: Lowest TPR among the Copy-Paste models at low FPR, with the flattest slope.
- **AUC**: 0.7803.
5. **Random Guess (Dashed Gray Line)**:
- Diagonal line from (0.0, 0.0) to (1.0, 1.0).
- **Trend**: Represents a baseline performance (no discrimination).
---
### Key Observations
- **SynGuard** outperforms all other models, achieving a perfect AUC of 1.0000.
- **Copy-Paste-5** is the second-best model, with an AUC of 0.9299, followed by **Copy-Paste-10** (0.8670) and **Copy-Paste-15** (0.7803).
- The **Random Guess** line serves as a reference, showing that all models perform better than random chance.
- The **Copy-Paste** models exhibit a trade-off between TPR and FPR, with higher numbers (e.g., 15) resulting in lower AUC values.
---
### Interpretation
The chart demonstrates that **SynGuard** is the most effective classifier, achieving perfect discrimination (TPR = 1.0 for all FPR values). The **Copy-Paste** models show diminishing performance as the number increases (5 → 10 → 15), likely due to increased complexity or noise in the data. The **Random Guess** line confirms that all models outperform a baseline of random classification. The AUC values quantitatively validate these trends, with higher values indicating better model performance. The step-like progression of the Copy-Paste curves suggests they may be using threshold-based decision rules, while SynGuard’s vertical rise implies a deterministic or highly optimized classification mechanism.
</details>
(b) SynGuard
Figure 10: ROC curves under different copy-and-paste attack ratios for SynthID-Text and SynGuard.
TABLE VIII: Watermark detection accuracy under varying copy-and-paste attack settings
| Attack | SynthID-Text | SynGuard | | | | |
| --- | --- | --- | --- | --- | --- | --- |
| TPR | FPR | F1 | TPR | FPR | F1 | |
| No attack | 1.0 | 0.0 | 1.0 | 1.0 | 0.0 | 1.0 |
| Copy-Paste-5 | 0.985 | 0.245 | 0.883 | 0.95 | 0.17 | 0.896 |
| Copy-Paste-10 | 1.0 | 0.435 | 0.821 | 0.985 | 0.225 | 0.891 |
| Copy-Paste-15 | 0.99 | 0.485 | 0.800 | 0.99 | 0.345 | 0.848 |
#### VI-C3 Paraphrasing
We used the T5 https://huggingface.co/google/t5-v1_1-xxl model for tokenization and the Dipper https://huggingface.co/kalpeshk2011/dipper-paraphraser-xxl model to perform paraphrasing. The key parameters for Dipper are lex_diversity and order_diversity, which respectively control the lexical variation and the reordering of sentences or phrases in the generated text.
In this paraphrasing attack experiment, we explored combinations of lex_diversity values of 5 and 10, and order_diversity values of 0 and 5. The results are shown in Fig. 11. Increasing either parameter, lex_diversity or order_diversity, leads to a decline in detection accuracy. Despite this degradation, even the most aggressive setting (lex_diversity = 10 and order_diversity = 5) still achieves an AUC above 0.95 and an F1 score exceeding 0.92, as reported in Table IX.
<details>
<summary>figures/rocs_for_paraphrasing_synthID.png Details</summary>
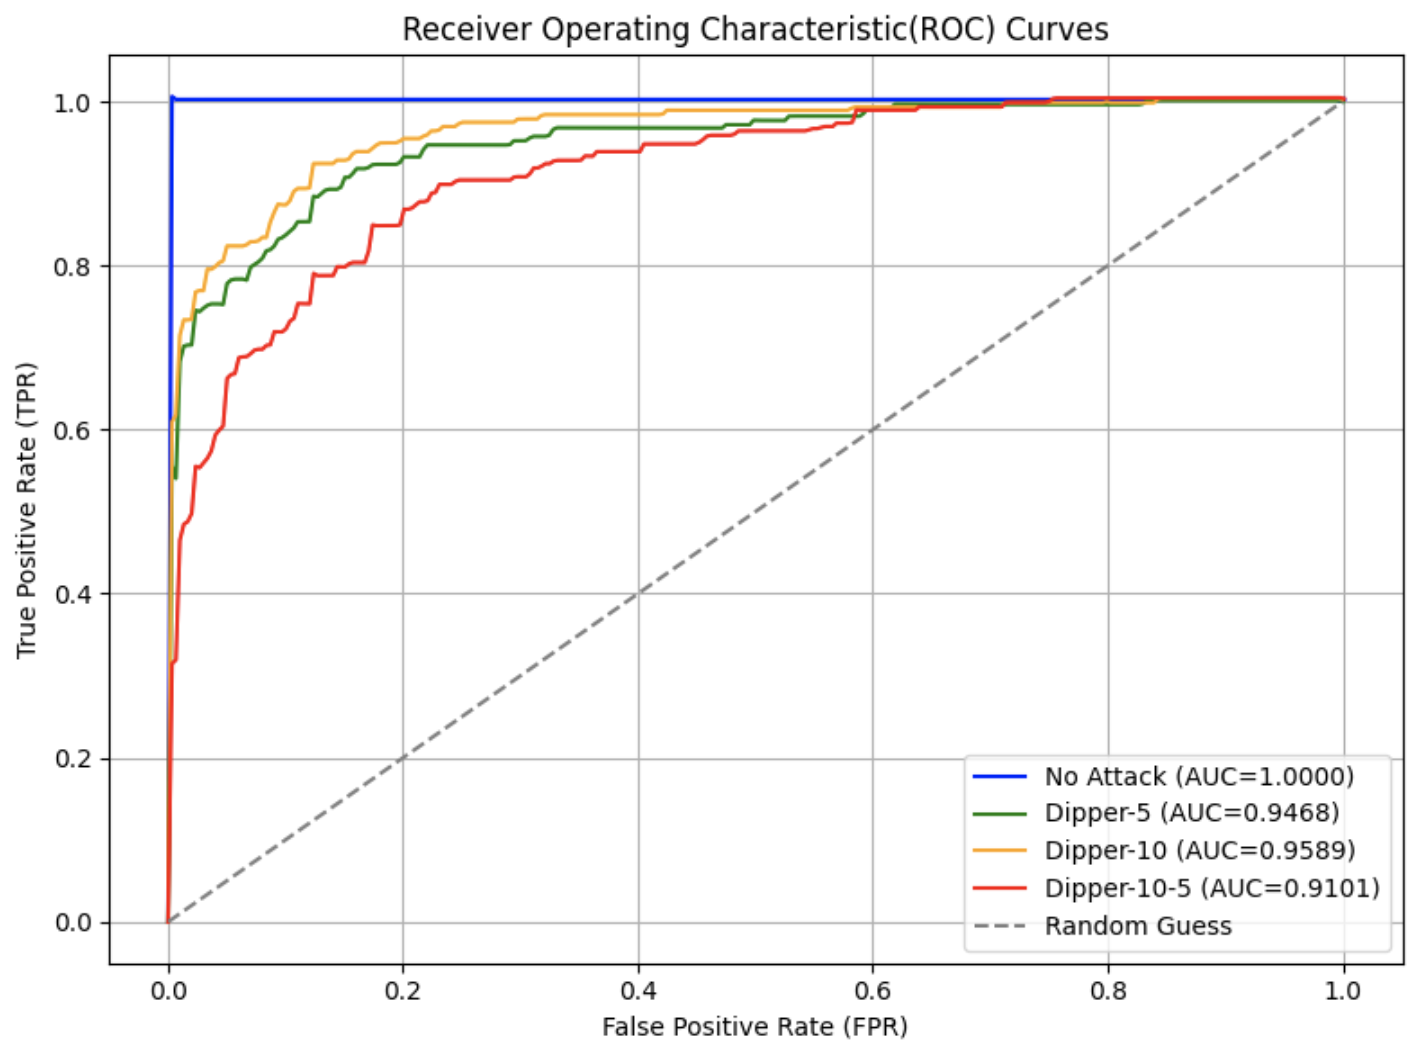
### Visual Description
## ROC Curves: Receiver Operating Characteristic Curves
### Overview
The image displays a Receiver Operating Characteristic (ROC) curve, which visualizes the trade-off between the **True Positive Rate (TPR)** and **False Positive Rate (FPR)** for different classification models. The curves are plotted against a grid with axes ranging from 0.0 to 1.0. A legend identifies five data series, each represented by a distinct color and line style.
### Components/Axes
- **X-axis**: False Positive Rate (FPR) (0.0 to 1.0)
- **Y-axis**: True Positive Rate (TPR) (0.0 to 1.0)
- **Legend**:
- **No Attack** (blue solid line, AUC=1.0000)
- **Dipper-5** (green solid line, AUC=0.9468)
- **Dipper-10** (orange solid line, AUC=0.9589)
- **Dipper-10-5** (red solid line, AUC=0.9101)
- **Random Guess** (gray dashed line)
- **Axis Markers**: Grid lines at 0.0, 0.2, 0.4, 0.6, 0.8, 1.0 for both axes.
### Detailed Analysis
1. **No Attack (Blue Line)**:
- A horizontal line at TPR=1.0 across all FPR values.
- Indicates perfect classification with no false positives.
- AUC=1.0000 (ideal performance).
2. **Random Guess (Gray Dashed Line)**:
- A diagonal line from (0,0) to (1,1).
- Represents a baseline for random classification.
3. **Dipper-5 (Green Line)**:
- Starts at (0,0) and curves upward to the left, reaching TPR≈0.95 at FPR≈0.1.
- AUC=0.9468.
4. **Dipper-10 (Orange Line)**:
- Starts at (0,0) and curves upward to the left, reaching TPR≈0.98 at FPR≈0.05.
- AUC=0.9589 (best among the Dipper models).
5. **Dipper-10-5 (Red Line)**:
- Starts at (0,0) and curves upward to the left, reaching TPR≈0.92 at FPR≈0.15.
- AUC=0.9101 (lowest among the Dipper models).
### Key Observations
- The **No Attack** model achieves perfect performance (AUC=1.0000), suggesting it is optimized for scenarios without attacks.
- **Dipper-10** outperforms other models (AUC=0.9589), indicating superior discrimination between attack and non-attack cases.
- **Dipper-10-5** has the lowest AUC (0.9101), suggesting it is less effective than the other models.
- All models (except Random Guess) outperform the baseline (Random Guess line).
### Interpretation
The ROC curves demonstrate the effectiveness of different models in distinguishing between attack and non-attack scenarios. The **No Attack** model’s perfect performance implies it is tailored for a specific context (e.g., no attacks in the dataset). Among the Dipper models, **Dipper-10** achieves the highest AUC, indicating it balances TPR and FPR most effectively. The **Dipper-10-5** model’s lower AUC suggests it may have suboptimal threshold settings or design choices. The **Random Guess** line serves as a critical benchmark, confirming that all models perform better than random chance.
The curves highlight the importance of model selection and threshold tuning in classification tasks, particularly in security or anomaly detection applications where minimizing false positives is critical.
</details>
(a) SynthID-Text
<details>
<summary>figures/rocs_for_paraphrasing_sir_synthID.png Details</summary>
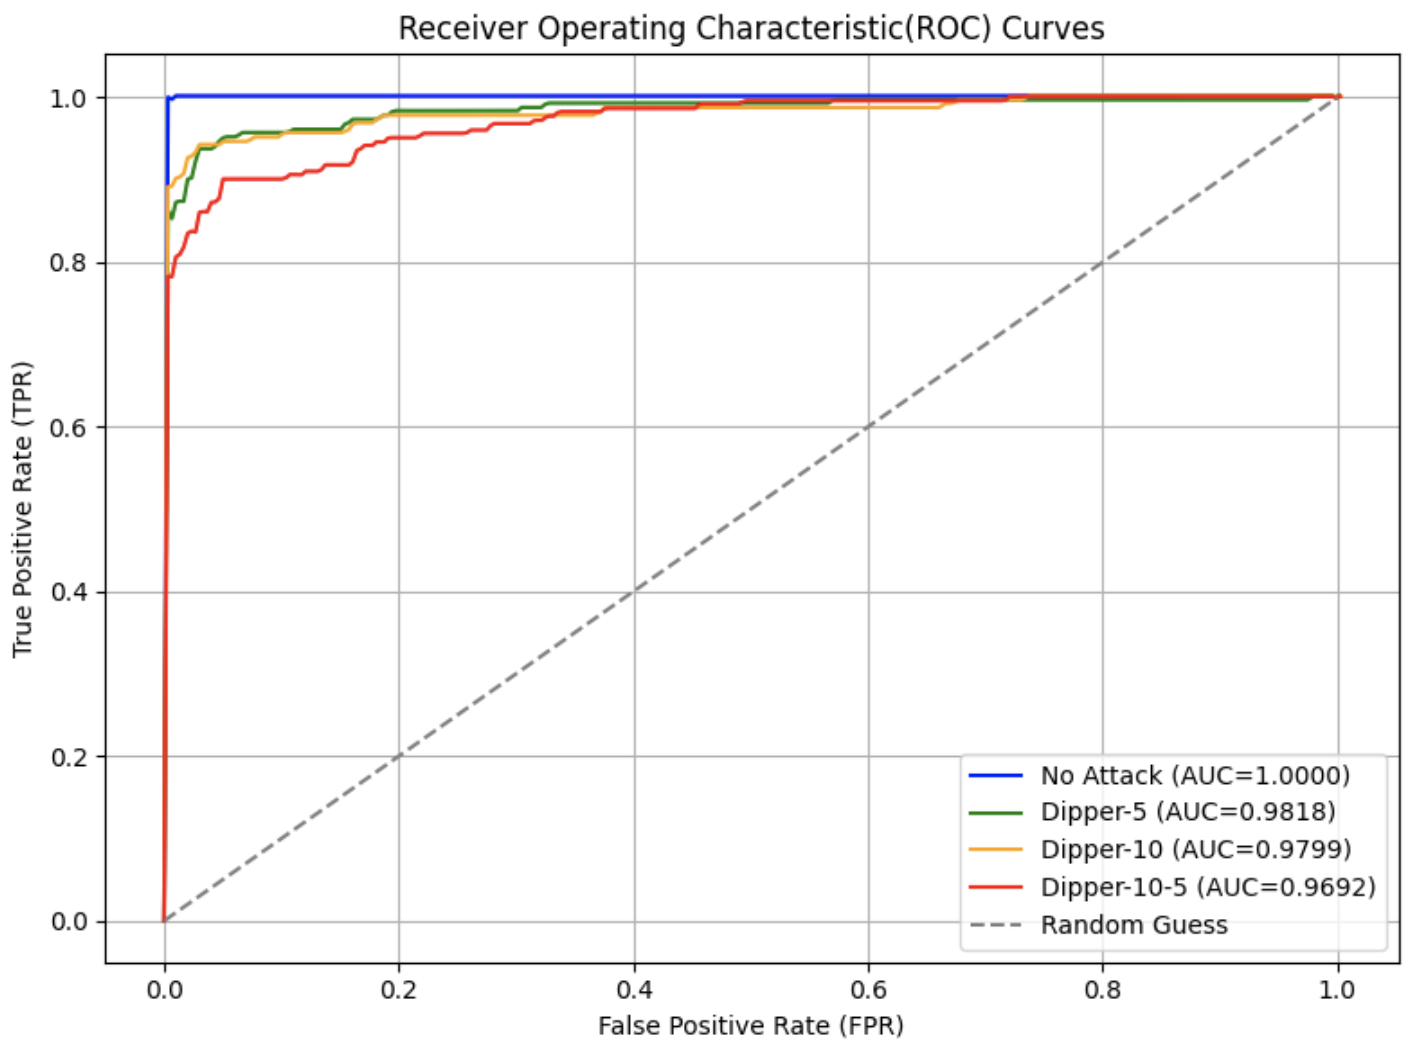
### Visual Description
## Chart: Receiver Operating Characteristic (ROC) Curves
### Overview
The image displays a Receiver Operating Characteristic (ROC) curve chart comparing the performance of four models: "No Attack," "Dipper-5," "Dipper-10," and "Dipper-10-5," against a "Random Guess" baseline. The chart evaluates the trade-off between True Positive Rate (TPR) and False Positive Rate (FPR) for each model, with AUC (Area Under the Curve) values provided in the legend.
### Components/Axes
- **X-axis**: False Positive Rate (FPR), ranging from 0.0 to 1.0 in increments of 0.2.
- **Y-axis**: True Positive Rate (TPR), ranging from 0.0 to 1.0 in increments of 0.2.
- **Legend**: Located in the bottom-right corner, with the following entries:
- **Blue**: No Attack (AUC=1.0000)
- **Green**: Dipper-5 (AUC=0.9818)
- **Orange**: Dipper-10 (AUC=0.9799)
- **Red**: Dipper-10-5 (AUC=0.9692)
- **Dashed Gray**: Random Guess (diagonal line from (0,0) to (1,1)).
### Detailed Analysis
1. **No Attack (Blue Line)**:
- A horizontal line at TPR=1.0, indicating perfect detection with no false positives. This is an idealized scenario, as it suggests no false alarms occur.
- AUC=1.0000 confirms perfect classification.
2. **Dipper-5 (Green Line)**:
- Starts at (0,0) and rises sharply to (1,1), with a smooth, near-linear trajectory.
- AUC=0.9818 indicates high performance, slightly below the ideal.
3. **Dipper-10 (Orange Line)**:
- Similar trajectory to Dipper-5 but with a slightly flatter slope, indicating marginally lower performance.
- AUC=0.9799, slightly lower than Dipper-5.
4. **Dipper-10-5 (Red Line)**:
- Starts at (0,0) but has a more gradual ascent compared to Dipper-5 and Dipper-10.
- AUC=0.9692, the lowest among the Dipper models, suggesting reduced effectiveness.
5. **Random Guess (Dashed Gray Line)**:
- A diagonal line from (0,0) to (1,1), representing a baseline performance where TPR equals FPR.
- All models outperform this baseline.
### Key Observations
- **No Attack** is the only model achieving perfect performance (AUC=1.0000), but this is unrealistic in practice.
- **Dipper-5** outperforms the other Dipper models, with the highest AUC (0.9818).
- **Dipper-10-5** has the lowest AUC (0.9692), indicating it is the least effective among the Dipper variants.
- All models (except No Attack) start at (0,0) and end at (1,1), but their paths diverge, reflecting differences in discrimination ability.
### Interpretation
The ROC curves demonstrate that:
- **No Attack** is theoretically optimal but impractical, as it assumes no false positives.
- **Dipper-5** is the most effective model among the Dipper variants, balancing high TPR and low FPR.
- **Dipper-10-5** underperforms compared to Dipper-5 and Dipper-10, suggesting that its configuration or parameters may be suboptimal.
- The **Random Guess** line serves as a critical benchmark, confirming that all models provide meaningful improvements over chance performance.
The AUC values quantify the models' ability to distinguish between classes, with higher values indicating better performance. The slight decline in AUC from Dipper-5 to Dipper-10-5 highlights the importance of model tuning to maximize discrimination.
</details>
(b) SynGuard
Figure 11: ROC curves under various paraphrasing attack settings for SynthID-Text and SynGuard.
TABLE IX: Watermark detection accuracy under different paraphrasing attack settings
| Attack | SynthID-Text | SynGuard | | | | |
| --- | --- | --- | --- | --- | --- | --- |
| TPR | FPR | F1 | TPR | FPR | F1 | |
| No attack | 1.0 | 0.0 | 1.0 | 1.0 | 0.0 | 1.0 |
| Dipper-5 | 0.915 | 0.16 | 0.882 | 0.935 | 0.03 | 0.952 |
| Dipper-10 | 0.92 | 0.125 | 0.900 | 0.94 | 0.03 | 0.954 |
| Dipper-10-5 | 0.895 | 0.23 | 0.842 | 0.90 | 0.05 | 0.923 |
Note: Dipper- $x$ denotes the lexical diversity is $x$ . Dipper- $x$ - $y$ indicates lexical diversity is $x$ and order diversity is $y$ .
#### VI-C4 Back-translation
For back-translation attack, we employed the nllb-200-distilled-600M https://huggingface.co/facebook/nllb-200-distilled-600M model and googletrans Python library to translate the original English watermarked text into different pivot languages and then back-translate it back into English. The retranslated text was subsequently used for watermark detection. The resulting ROC curves are shown in Fig. 12, and the results under different translators are shown in Table X. It can be observed from the results that the effectiveness of back-translation attacks is related to the translation performance of the translator for the target language, and has little to do with language-specific characteristics. Nllb is a multilingual machine translation model, with a single model handling translation for over 200 languages. In contrast, Google Translate uses dedicated machine translation models for different languages. Among the languages, back-translation attacks based on Chinese show the most significant accuracy drop and the best attack performance, which is generally consistent with the performance of machine translation. Meanwhile, the translation performance between German, French, Italian and English is better, resulting in less accuracy drop.
Notably, while some studies [11] argue that the effectiveness of back-translation attacks is directly tied to language-specific characteristics, our findings suggest this claim is rather limited. We contend that the effectiveness of back-translation attacks is instead associated with the translation performance of the translator on the target language: language-specific characteristics determine the upper bound of machine translation model performance, while the richness of the training corpus further shapes this upper bound. Consequently, language-specific characteristics constitute only one of the indirect factors influencing back-translation attacks.
TABLE X: Comparison of SynGuard watermark detection accuracy under back-translation attacks with different translation tools
| Attack | Nllb-200-distilled-600M | googletrans | | | | |
| --- | --- | --- | --- | --- | --- | --- |
| TPR | FPR | F1 | TPR | FPR | F1 | |
| No attack | 0.995 | 0.0 | 0.9975 | 0.995 | 0.0 | 0.9975 |
| Back-trans-German | 0.762 | 0.095 | 0.821 | 0.930 | 0.058 | 0.936 |
| Back-trans-French | 0.735 | 0.070 | 0.814 | 0.930 | 0.053 | 0.938 |
| Back-trans-Italian | 0.832 | 0.130 | 0.848 | 0.928 | 0.070 | 0.929 |
| Back-trans-Chinese | 0.680 | 0.07 | 0.777 | 0.920 | 0.058 | 0.930 |
| Back-trans-Japanese | 0.807 | 0.095 | 0.848 | 0.900 | 0.010 | 0.942 |
<details>
<summary>ROC_curves_for_re-translation_attack_on_SIR-SynthID.png Details</summary>
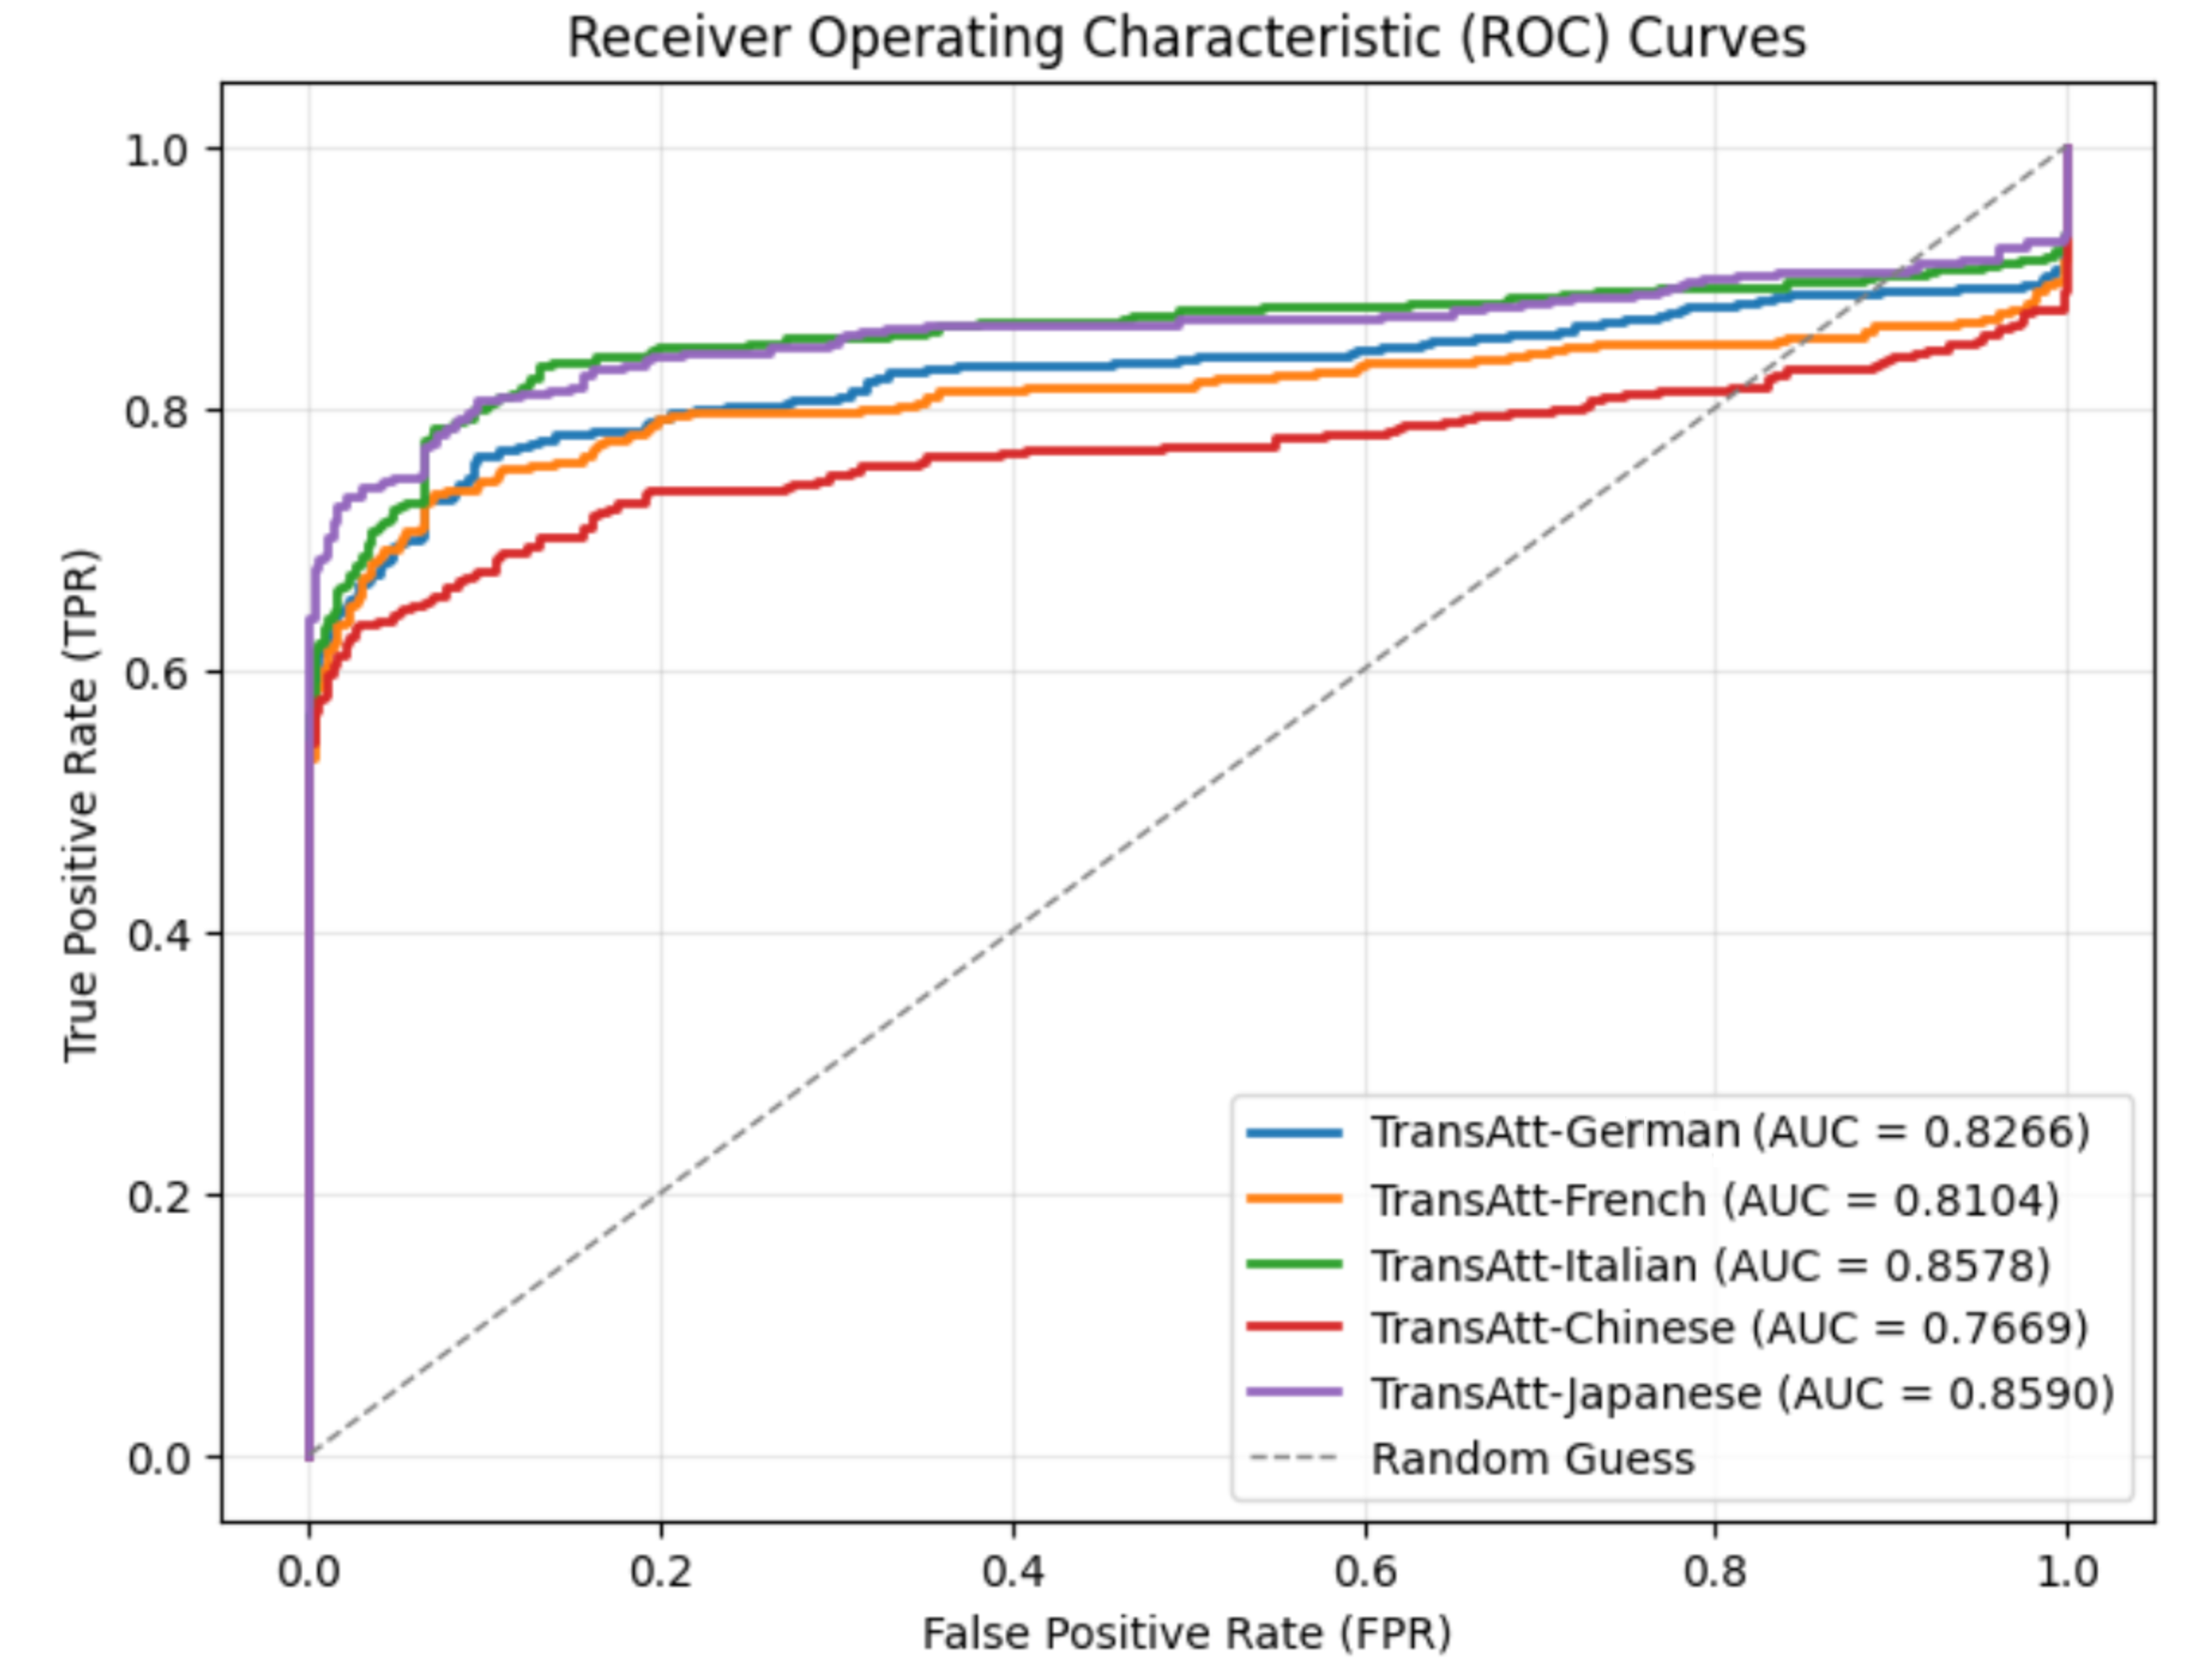
### Visual Description
## Chart: Receiver Operating Characteristic (ROC) Curves
### Overview
The image displays a Receiver Operating Characteristic (ROC) curve chart comparing the performance of a classification model (TransAtt) across five languages: German, French, Italian, Chinese, and Japanese. The chart evaluates the trade-off between the True Positive Rate (TPR) and False Positive Rate (FPR) for each language-specific model, with a dashed line representing a random guess baseline.
### Components/Axes
- **X-axis**: False Positive Rate (FPR), ranging from 0.0 to 1.0 in increments of 0.2.
- **Y-axis**: True Positive Rate (TPR), ranging from 0.0 to 1.0 in increments of 0.2.
- **Legend**: Located in the bottom-right corner, associating colors with languages and their Area Under the Curve (AUC) values:
- Blue: TransAtt-German (AUC = 0.8266)
- Orange: TransAtt-French (AUC = 0.8104)
- Green: TransAtt-Italian (AUC = 0.8578)
- Red: TransAtt-Chinese (AUC = 0.7669)
- Purple: TransAtt-Japanese (AUC = 0.8590)
- Dashed gray: Random Guess (no AUC provided).
### Detailed Analysis
1. **TransAtt-Japanese (Purple)**:
- Starts steeply, achieving high TPR early with minimal FPR.
- Maintains the highest TPR across all FPR values, peaking near 1.0 at FPR ~0.9.
- AUC = 0.8590 (highest among all languages).
2. **TransAtt-Italian (Green)**:
- Follows a similar upward trajectory to the Japanese curve but slightly below it.
- AUC = 0.8578, closely matching the Japanese model.
3. **TransAtt-German (Blue)**:
- Slightly lower TPR than Italian and Japanese, with a gradual increase.
- AUC = 0.8266, indicating moderate performance.
4. **TransAtt-French (Orange)**:
- TPR lags behind German, with a slower rise.
- AUC = 0.8104, reflecting lower discriminative power.
5. **TransAtt-Chinese (Red)**:
- Lowest TPR across all FPR values, with a flatter curve.
- AUC = 0.7669, the poorest performance among the languages.
6. **Random Guess (Dashed Gray Line)**:
- Diagonal line from (0,0) to (1,1), representing chance-level performance.
- All language-specific curves lie above this line, confirming superior model performance.
### Key Observations
- **Performance Hierarchy**: Japanese > Italian > German > French > Chinese.
- **AUC Disparity**: Chinese model underperforms significantly compared to others (AUC = 0.7669 vs. Japanese AUC = 0.8590).
- **Convergence**: All curves approach the top-right corner (TPR = 1.0, FPR = 1.0), but Japanese and Italian models achieve this with lower FPR.
### Interpretation
The ROC curves demonstrate that the TransAtt model's effectiveness varies by language, with Japanese and Italian achieving the highest discrimination between classes (AUC > 0.85). The Chinese model lags behind, suggesting potential challenges in handling linguistic nuances or data quality issues for that language. The Random Guess line establishes a baseline, emphasizing that all models outperform chance. These results highlight the importance of language-specific tuning or data augmentation for underperforming languages like Chinese. The proximity of Japanese and Italian curves suggests similar architectural or training efficacy for these languages.
</details>
(a) NLLB-200-distilled-600M
<details>
<summary>ROC_curves_for_back-translation_using_Google_Translate.png Details</summary>
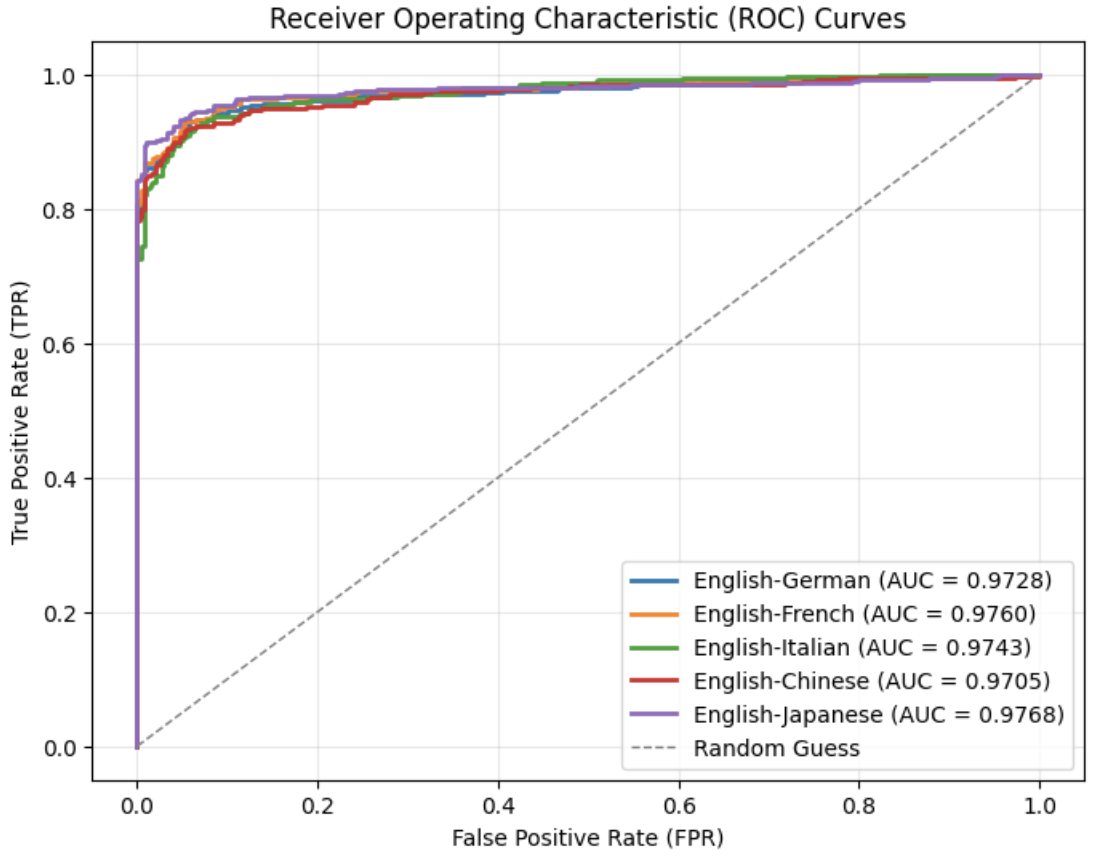
### Visual Description
## Chart: Receiver Operating Characteristic (ROC) Curves
### Overview
The image displays a Receiver Operating Characteristic (ROC) curve chart comparing the performance of a classification model across multiple language pairs. The chart plots True Positive Rate (TPR) against False Positive Rate (FPR) for different language combinations, with a reference line for random guessing.
### Components/Axes
- **X-axis**: False Positive Rate (FPR) ranging from 0.0 to 1.0
- **Y-axis**: True Positive Rate (TPR) ranging from 0.0 to 1.0
- **Legend**: Located in the bottom-right corner, listing:
- English-German (blue, AUC = 0.9728)
- English-French (orange, AUC = 0.9760)
- English-Italian (green, AUC = 0.9743)
- English-Chinese (red, AUC = 0.9705)
- English-Japanese (purple, AUC = 0.9768)
- Random Guess (dashed gray line)
### Detailed Analysis
- **English-Japanese (purple)**: Highest AUC (0.9768), showing the steepest curve with minimal FPR before reaching high TPR.
- **English-French (orange)**: Second-highest AUC (0.9760), closely following English-Japanese.
- **English-Italian (green)**: AUC 0.9743, slightly lower than English-French but still above random.
- **English-German (blue)**: AUC 0.9728, with a slightly flatter curve compared to others.
- **English-Chinese (red)**: Lowest AUC (0.9705) among language pairs, with a more gradual slope.
- **Random Guess (dashed gray)**: Diagonal line from (0,0) to (1,1), serving as a baseline.
### Key Observations
1. All language pairs outperform random guessing (dashed line).
2. English-Japanese and English-French show nearly identical performance (AUC ~0.976).
3. English-Chinese has the lowest AUC (0.9705), indicating relatively poorer model performance.
4. Curves converge near (1,1), suggesting high overall accuracy across all pairs.
### Interpretation
The chart demonstrates that the classification model performs exceptionally well across all tested language pairs, with AUC values consistently above 0.97. The English-Japanese and English-French combinations show the highest discriminative power, while English-Chinese lags slightly behind. The proximity of curves suggests minimal variation in model effectiveness between language pairs, though English-Chinese may require further optimization. The high AUC values (>0.97) indicate strong predictive capability, though the slight differences in performance could reflect language-specific challenges (e.g., syntactic complexity, data scarcity) or model biases.
</details>
(b) Google Translator
Figure 12: ROC curves for back-translation on SynGuard using different translation tools.
### VI-D SynGuard vs. SynthID-Text
Table XI compares SynGuard and SynthID-Text robustness under identical attacks. SynGuard achieves higher F1 scores across all evaluated attacks with the same parameters, with comparable performance in no-attack scenarios. Specifically, SynGuard retains F1 $>$ 0.9 under synonym substitution and paraphrasing, and 0.9 under copy-and-paste, while SynthID-Text drops below 0.9 in all three. For back-translation (the most challenging attack), SynGuard outperforms SynthID-Text, with F1 rising from 0.777 to 0.711, FPR dropping from 0.225 to 0.07. Overall, F1 is improved by 9.3%-13%. These results confirm SynGuard enhances detection robustness across token-level (synonym substitution), sentence-level (paraphrasing), and context-level (copy-and-paste) attacks via semantic-aware watermarking.
Taken collectively, our proposed SynGuard scheme exhibits computational overhead and robustness against text tampering attacks comparable to those of SIR, while demonstrating favorable text quality on par with that of SynthID-Text, thereby integrating the strengths of both approaches.
TABLE XI: Comparison of watermark detection performance between SynGuard and SynthID-Text under various attacks
| Attack | SynGuard | SynthID-Text | | | | | |
| --- | --- | --- | --- | --- | --- | --- | --- |
| Method | Parameters | TPR | FPR | F1 | TPR | FPR | F1 |
| No attack | – | 0.995 | 0.0 | 0.9975 | 1.0 | 0.0 | 1.0 |
| Substitution | $\epsilon=0.7$ | 0.96 | 0.03 | 0.965 | 0.82 | 0.035 | 0.884 |
| Copy-and-Paste | ratio=10 | 0.985 | 0.225 | 0.891 | 0.995 | 0.53 | 0.788 |
| Paraphrasing | lex $=10$ , order $=5$ | 0.9 | 0.05 | 0.923 | 0.895 | 0.23 | 0.842 |
| Back-Translation | language=Chinese | 0.680 | 0.07 | 0.777 | 0.675 | 0.225 | 0.711 |
Note ∗: Bold F1 scores indicate values above 0.9, reflecting strong detection performance. Blue-highlighted TPR or FPR values are below 0.6, suggesting performance close to random guessing. Red-highlighted F1 scores represent the lowest values observed across all tested attacks.
### VI-E Ablation Study
In this subsection, we investigate how the semantic weight $\delta$ affects the performance of the proposed watermarking algorithm. Based on the F1 score and AUC values from this study, we selected an optimal $\delta$ and used it for the robustness evaluations.
Semantic Weight $\delta$ . We introduce a semantic blending factor $\delta\in[0,1]$ , referred to as semantic_weight, to interpolate between the semantic score $s_{\text{semantic}}$ and the g-value-based score $s_{\text{g-value}}$ . A larger $\delta$ emphasizes semantic coherence, while a smaller $\delta$ gives more weight to the g-value randomness statistics.
The ROC curves under different semantic weight settings are shown in Fig. 13. As $\delta$ increases from 0.1 to 0.7, the AUC improves consistently. The zoomed-in view in Fig. 13(b) reveals that the ROC curve for $\delta=0.7$ consistently outperforms the others. From Table XII, we observe that both TPR and F1 score increase as $\delta$ grows. Although the FPR for $\delta=0.7$ is not the lowest, it is only 0.005 higher than that of $\delta=0.5$ and identical to the FPR at $\delta=0.3$ . Therefore, in Session VI, we adopt $\delta=0.7$ as the default setting for the semantic weight in subsequent robustness evaluations.
<details>
<summary>figures/rocs_for_diff_delta.png Details</summary>
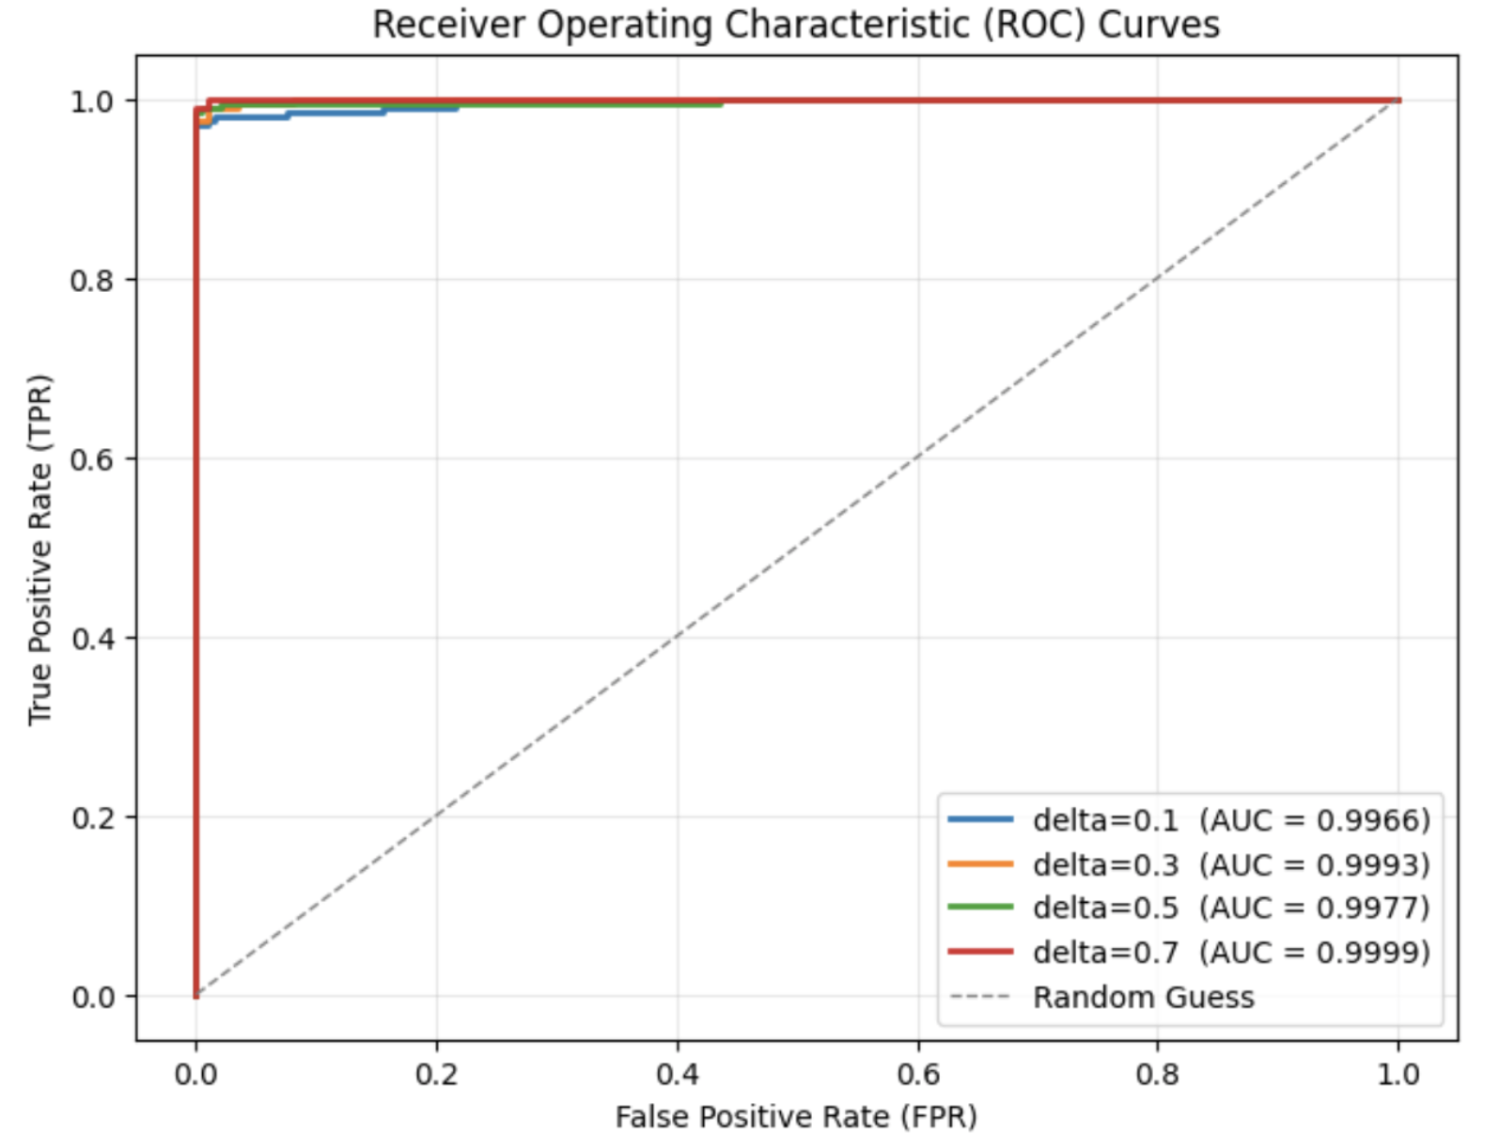
### Visual Description
## ROC Curve: Receiver Operating Characteristic (ROC) Curves
### Overview
The image displays a Receiver Operating Characteristic (ROC) curve, a graphical plot that illustrates the diagnostic ability of a binary classifier system. The chart compares the trade-off between the True Positive Rate (TPR) and the False Positive Rate (FPR) for different classification thresholds (delta values). A dashed line representing a "Random Guess" is included for reference.
---
### Components/Axes
- **X-axis**: False Positive Rate (FPR), ranging from 0.0 to 1.0.
- **Y-axis**: True Positive Rate (TPR), ranging from 0.0 to 1.0.
- **Legend**: Located in the **bottom-right corner**, with the following entries:
- **Blue line**: delta=0.1 (AUC = 0.9966)
- **Orange line**: delta=0.3 (AUC = 0.9993)
- **Green line**: delta=0.5 (AUC = 0.9977)
- **Red line**: delta=0.7 (AUC = 0.9999)
- **Dashed gray line**: Random Guess (baseline performance).
---
### Detailed Analysis
#### Curves and Data Points
1. **Red line (delta=0.7)**:
- **Trend**: Nearly horizontal at TPR=1.0, with a sharp vertical rise at FPR=0.0.
- **Key points**:
- Starts at (FPR=0.0, TPR=0.99) and remains at TPR=1.0 for FPR > 0.0.
- AUC = 0.9999 (highest among all curves).
- **Spatial grounding**: Dominates the upper-right quadrant, indicating near-perfect classification.
2. **Blue line (delta=0.1)**:
- **Trend**: Slightly below the red line, with a gradual rise to TPR=1.0.
- **Key points**:
- Starts at (FPR=0.0, TPR=0.98) and reaches TPR=1.0 at FPR=0.02.
- AUC = 0.9966.
3. **Orange line (delta=0.3)**:
- **Trend**: Similar to the blue line but slightly higher.
- **Key points**:
- Starts at (FPR=0.0, TPR=0.99) and reaches TPR=1.0 at FPR=0.01.
- AUC = 0.9993.
4. **Green line (delta=0.5)**:
- **Trend**: Slightly below the orange line.
- **Key points**:
- Starts at (FPR=0.0, TPR=0.99) and reaches TPR=1.0 at FPR=0.01.
- AUC = 0.9977.
5. **Dashed gray line (Random Guess)**:
- **Trend**: Diagonal line from (0,0) to (1,1), representing random performance.
- **Key points**:
- TPR = FPR at all points (e.g., (0.5, 0.5)).
---
### Key Observations
1. **Performance hierarchy**:
- The red line (delta=0.7) outperforms all others, with the highest AUC (0.9999).
- The blue (delta=0.1) and green (delta=0.5) lines show slightly lower performance, while the orange (delta=0.3) line is intermediate.
2. **Threshold sensitivity**:
- Higher delta values (e.g., 0.7) correspond to better TPR at lower FPR, indicating optimal classification thresholds.
3. **Random Guess baseline**:
- The dashed line confirms that all curves significantly outperform random guessing.
---
### Interpretation
- **Model effectiveness**: The ROC curves demonstrate that the classifier achieves near-perfect performance across all delta values, with the highest AUC (0.9999) for delta=0.7. This suggests the model is highly reliable for binary classification tasks.
- **Threshold trade-offs**:
- Lower delta values (e.g., 0.1) may prioritize sensitivity (higher TPR) at the cost of increased FPR, while higher delta values (e.g., 0.7) optimize for precision (lower FPR) with minimal TPR loss.
- **AUC significance**:
- AUC values close to 1.0 indicate strong discriminative power. The red line’s AUC (0.9999) implies the model is nearly indistinguishable from a perfect classifier.
- **Practical implications**:
- The curves highlight the importance of selecting an appropriate delta value based on the desired balance between TPR and FPR. For instance, delta=0.7 is optimal for scenarios requiring high precision, while delta=0.1 may be preferable for maximizing sensitivity.
---
### Notes on Uncertainty
- All TPR and FPR values are approximate, as the chart lacks explicit numerical annotations for intermediate points. The red line’s TPR=1.0 is inferred from its horizontal alignment, while other curves’ values are estimated based on their relative positions.
- The AUC values are explicitly provided in the legend and are considered precise.
</details>
(a) Regular ROC Curves
*[Error downloading image: figures/rocs_for_diff_delta--zoom-in.png]*
(b) Zoom-in ROC Curves
Figure 13: ROC curves under different semantic weight settings ( $\delta$ )
TABLE XII: Watermark detection accuracy of SynGuard under varying semantic weights ( $\delta$ )
| Semantic Weight $\delta$ | TPR | FPR | F1 with best threshold |
| --- | --- | --- | --- |
| 0.0 | 1.0 | 0 | 1.0 |
| 0.1 | 0.97 | 0 | 0.985 |
| 0.3 | 0.99 | 0.01 | 0.990 |
| 0.5 | 0.99 | 0.005 | 0.992 |
| 0.7 | 1.0 | 0.01 | 0.995 |
| 1.0 | 0.98 | 0.015 | 0.983 |
## VII Conclusions
This paper evaluates SynthID-Text’s robustness across diverse attacks. While SynthID-Text resists simple lexical attacks, it is vulnerable to semantic-preserving transformations like paraphrasing and back translation, which severely reduce detection accuracy. To address this, we propose SynGuard, a hybrid algorithm integrating semantic sensitivity with SynthID-Text’s probabilistic design. Via a semantic blending factor $\delta$ , it balances semantic alignment and sampling randomness, boosting robustness and attack resistance. Under no-attack conditions, both methods perform comparably. For text quality, SynGuard’s slightly higher PPL score (vs. SynthID-Text) remains lower than unwatermarked text, indicating better fluency consistency. Across all attacks, SynGuard consistently outperforms SynthID-Text, improving F1 scores by 9.2%–13% even in pivot-language back-translation attacks (where distortion is worst). These results validate incorporating semantic information into watermarking. Overall, SynGuard is a more resilient strategy for large language models, particularly against prevalent semantic-preserving watermark removal attacks.
## References
- [1] J. Kirchenbauer, J. Geiping, Y. Wen, J. Katz, I. Miers, and T. Goldstein, “A watermark for large language models,” in International Conference on Machine Learning. PMLR, 2023, pp. 17 061–17 084.
- [2] E. N. Crothers, N. Japkowicz, and H. L. Viktor, “Machine-generated text: A comprehensive survey of threat models and detection methods,” IEEE Access, vol. 11, pp. 70 977–71 002, 2023.
- [3] S. Dathathri, A. See, S. Ghaisas, P.-S. Huang, R. McAdam, J. Welbl, V. Bachani, A. Kaskasoli, R. Stanforth, T. Matejovicova, J. Hayes, and N. Vyas, “Scalable watermarking for identifying large language model outputs,” Nature, vol. 634, no. 8035, pp. 818–823, 2024.
- [4] A. Liu, L. Pan, Y. Lu, J. Li, X. Hu, X. Zhang, L. Wen, I. King, H. Xiong, and P. Yu, “A survey of text watermarking in the era of large language models,” ACM Computing Surveys, vol. 57, no. 2, pp. 1–36, 2024.
- [5] Z. Wang, T. Gu, B. Wu, and Y. Yang, “MorphMark: Flexible adaptive watermarking for large language models,” in ACL 2025, pp. 4842–4860.
- [6] A. Liu, L. Pan, X. Hu, S. Meng, and L. Wen, “A semantic invariant robust watermark for large language models,” in ICLR 2024, 2024.
- [7] X. Zhao, P. V. Ananth, L. Li, and Y. Wang, “Provable robust watermarking for ai-generated text,” in ICLR 2024.
- [8] Z. Hu, L. Chen, X. Wu, Y. Wu, H. Zhang, and H. Huang, “Unbiased watermark for large language models,” in ICLR 2024.
- [9] J. Kirchenbauer, J. Geiping, Y. Wen, M. Shu, K. Saifullah, K. Kong, K. Fernando, A. Saha, M. Goldblum, and T. Goldstein, “On the reliability of watermarks for large language models,” in ICLR 2024.
- [10] J. Ren, H. Xu, Y. Liu, Y. Cui, S. Wang, D. Yin, and J. Tang, “A robust semantics-based watermark for large language model against paraphrasing,” in NAACL 2024, pp. 613–625.
- [11] Z. He, B. Zhou, H. Hao, A. Liu, X. Wang, Z. Tu, Z. Zhang, and R. Wang, “Can watermarks survive translation? on the cross-lingual consistency of text watermark for large language models,” in ACL 2024, pp. 4115–4129.
- [12] A. Vaswani, N. Shazeer, N. Parmar, J. Uszkoreit, L. Jones, A. N. Gomez, Ł. Kaiser, and I. Polosukhin, “Attention is all you need,” Advances in neural information processing systems, vol. 30, 2017.
- [13] M. Christ, S. Gunn, and O. Zamir, “Undetectable watermarks for language models,” in COLT 2024, vol. 247, 2024, pp. 1125–1139.
- [14] H. Chen, B. D. Rouhani, C. Fu, J. Zhao, and F. Koushanfar, “Deepmarks: A secure fingerprinting framework for digital rights management of deep learning models,” in ICMR 2019, pp. 105–113.
- [15] T. Qiao, Y. Ma, N. Zheng, H. Wu, Y. Chen, M. Xu, and X. Luo, “A novel model watermarking for protecting generative adversarial network,” Computers & Security, vol. 127, p. 103102, 2023.
- [16] J. Zhang, D. Chen, J. Liao, W. Zhang, H. Feng, G. Hua, and N. Yu, “Deep model intellectual property protection via deep watermarking,” IEEE Transactions on Pattern Analysis and Machine Intelligence, vol. 44, no. 8, pp. 4005–4020, 2021.
- [17] B. Darvish Rouhani, H. Chen, and F. Koushanfar, “Deepsigns: An end-to-end watermarking framework for ownership protection of deep neural networks,” in ASPLOS 2019, pp. 485–497.
- [18] P. Neekhara, S. Hussain, X. Zhang, K. Huang, J. McAuley, and F. Koushanfar, “Facesigns: semi-fragile neural watermarks for media authentication and countering deepfakes,” in ACM Transactions on Multimedia Computing, Communications and Applications, 2024.
- [19] X. Zhao, Y. Wang, and L. Li, “Protecting language generation models via invisible watermarking,” in ICML 2023, vol. 202, pp. 42 187–42 199.
- [20] S. Qiu, Q. Liu, S. Zhou, and W. Huang, “Adversarial attack and defense technologies in natural language processing: A survey,” Neurocomputing, vol. 492, pp. 278–307, 2022.
- [21] M. Xia, T. Gao, Z. Zeng, and D. Chen, “Sheared llama: Accelerating language model pre-training via structured pruning,” in ICLR 2024.
- [22] C. Raffel, N. Shazeer, A. Roberts, K. Lee, S. Narang, M. Matena, Y. Zhou, W. Li, and P. J. Liu, “Exploring the limits of transfer learning with a unified text-to-text transformer,” J. Mach. Learn. Res., 2020.
- [23] L. Pan, A. Liu, Z. He, Z. Gao, X. Zhao, Y. Lu, B. Zhou, S. Liu, X. Hu, L. Wen, I. King, and P. S. Yu, “MarkLLM: An open-source toolkit for LLM watermarking,” in EMNLP 2024, pp. 61–71.
- [24] G. A. Miller, “Wordnet: a lexical database for english,” Communications of the ACM, vol. 38, no. 11, pp. 39–41, 1995.
- [25] C. R. Harris, K. J. Millman, S. J. Van Der Walt, R. Gommers, P. Virtanen, D. Cournapeau, E. Wieser, J. Taylor, S. Berg, N. J. Smith et al., “Array programming with numpy,” Nature, vol. 585, no. 7825, pp. 357–362, 2020.
- [26] J. Devlin, M.-W. Chang, K. Lee, and K. Toutanova, “Bert: Pre-training of deep bidirectional transformers for language understanding,” 2019. [Online]. Available: https://arxiv.org/abs/1810.04805
- [27] K. Krishna, Y. Song, M. Karpinska, J. Wieting, and M. Iyyer, “Paraphrasing evades detectors of ai-generated text, but retrieval is an effective defense,” Advances in Neural Information Processing Systems, vol. 36, pp. 27 469–27 500, 2023.
- [28] M. R. Costa-Jussà, J. Cross, O. Çelebi, M. Elbayad, K. Heafield, K. Heffernan, E. Kalbassi, J. Lam, D. Licht, J. Maillard et al., “No language left behind: Scaling human-centered machine translation,” arXiv preprint arXiv:2207.04672, 2022.
- [29] T. Mizowaki, H. Ogawa, and M. Yamada, “Syntactic cross and reading effort in english to japanese translation,” in Proceedings of the 15th biennial conference of the Association for Machine Translation in the Americas (Workshop 1: Empirical Translation Process Research), 2022, pp. 49–59.
- [30] Y. Sekizawa, T. Kajiwara, and M. Komachi, “Improving japanese-to-english neural machine translation by paraphrasing the target language,” in Proceedings of the 4th Workshop on Asian Translation (WAT2017), 2017, pp. 64–69.