2509.10929
Model: healer-alpha-free
# Clarifying Model Transparency: Interpretability versus Explainability in Deep Learning with MNIST and IMDB Examples
**Authors**: Mitali Raj
> School of Cyber Security and Digital Forensics National Forensic Sciences University New Delhi, India
## Abstract
The impressive capabilities of deep learning models are often counterbalanced by their inherent opacity, commonly termed the "black box" problem, which impedes their widespread acceptance in high-trust domains. In response, the intersecting disciplines of interpretability and explainability, collectively falling under the Explainable AI (XAI) umbrella, have become focal points of research. Although these terms are frequently used as synonyms, they carry distinct conceptual weights. This document offers a comparative exploration of interpretability and explainability within the deep learning paradigm, carefully outlining their respective definitions, objectives, prevalent methodologies, and inherent difficulties. Through illustrative examinations of the MNIST digit classification task and IMDB sentiment analysis, we substantiate a key argument: interpretability generally pertains to a model’s inherent capacity for human comprehension of its operational mechanisms (global understanding), whereas explainability is more commonly associated with post-hoc techniques designed to illuminate the basis for a model’s individual predictions or behaviors (local explanations). For example, feature attribution methods can reveal why a specific MNIST image is recognized as a ’7’, and word-level importance can clarify an IMDB sentiment outcome. However, these local insights do not render the complex underlying model globally transparent. A clear grasp of this differentiation, as demonstrated by these standard datasets, is vital for fostering dependable and sound artificial intelligence.
Index Terms: Deep Learning, Explainable AI (XAI), Model Interpretability, Prediction Explainability, Black Box Systems, Trustworthy AI, MNIST, IMDB, Case Study Analysis, Local Explanations, Global Understanding. publicationid: pubid: XXX-X-XXXX-XXXX-X/XX/$31.00 © 2026 IEEE
## I Introduction
Deep learning (DL) has instigated transformative progress across numerous domains, such as computer vision and natural language processing, frequently demonstrating performance levels that surpass human benchmarks. Nevertheless, the sophisticated, non-linear architecture of DL models, which can encompass millions of adjustable parameters, frequently obscures their internal decision-making pathways. This "black box" attribute fuels apprehensions regarding reliability, accountability, equity, and security, particularly when deployed in critical applications.
To allay such concerns, significant research efforts have been directed towards enhancing the transparency of DL models. Central to this endeavor are two pivotal concepts: interpretability and explainability. Despite their common interchangeable usage, a more detailed examination uncovers crucial distinctions. This paper endeavors to analyze and contrast these notions, anchoring the discussion with tangible examples derived from established DL applications: image recognition on the MNIST dataset and text-based sentiment classification using the IMDB dataset. These case studies will effectively illustrate how specific prediction explanations can be achieved even when a model’s overall global interpretability remains limited.
## II Defining Interpretability and Explainability
No universally endorsed definitions exist for interpretability or explainability, which has led to a degree of terminological fluidity in academic discourse. Nonetheless, practical definitions can be formulated based on prevalent usage and influential research.
### II-A Interpretability
- Definition: The notion of interpretability centers on the extent to which a human observer can grasp the causal relationships or the underlying functional principles governing a model’s decision-making (Lipton, 2018 [3]; Doshi-Velez & Kim, 2017 [2]). The emphasis is on comprehending how the model functions at a systemic level.
- Focus: Intrinsic characteristics of the model, architectural transparency, global understanding.
- Goal: The construction of models that are fundamentally comprehensible to humans, whether in their complete form (global interpretability) or regarding their individual components.
- Example Question: “By what general process does this Convolutional Neural Network (CNN) convert raw pixel data, through its successive layers, into a final digit classification?”
### II-B Explainability (within XAI)
- Definition: Explainability pertains to the capacity to furnish an interface or supplementary data that elucidates a model’s operational behavior, especially its individual predictions, in a manner that is intelligible to humans (Arrieta et al., 2020 [1]). This often entails the application of post-hoc methods to pre-trained models.
- Focus: Justification of model outputs after the fact, understanding at the level of individual predictions, local explanations.
- Goal: The generation of clear rationales for specific instances or for the model’s general behavioral patterns, frequently without needing to make the model’s entire internal architecture transparent.
- Example Question: “What factors led the model to classify this particular MNIST image as a ’3’ rather than an ’8’?” or “Which specific words in this IMDB review instance were most decisive for its ’positive’ sentiment label?”
## III Comparative Analysis
The principal distinctions between interpretability and explainability are outlined in Table I.
TABLE I: Distinguishing Features of Interpretability and Explainability (XAI)
| Core Objective | Comprehend the model’s internal logic/system (Global Understanding). | Understand the rationale for a specific decision/prediction (Local Explanation). |
| --- | --- | --- |
| Methodological Timing | Primarily intrinsic to model design (ante-hoc). | Frequently extrinsic, applied post-training (post-hoc). |
| Preferred Model Type | Leans towards simpler, inherently transparent architectures. | Applicable to complex, opaque models (typical of DL). |
| Reach of Understanding | Can be global (entire model) or modular (components). | Often instance-specific (local predictions), though global approximations are possible. |
| Role of Human User | Human can directly understand the model’s functioning. | Human receives an explanation produced by an auxiliary process. |
| Exemplary Techniques | Simpler models (e.g., linear regression, decision trees), rule induction, concept-based systems (e.g., ProtoPNet). | Feature attribution maps (e.g., Grad-CAM), LIME, SHAP, counterfactual reasoning, attention visualization. |
| Interrelation | An interpretable model is by nature explainable. | An explainable model is not necessarily interpretable. |
## IV Illustrative Case Studies: Anchoring Explainability Concepts
To provide a concrete illustration of this distinction—especially the point that explainability (yielding local explanations) can be attained for opaque models lacking comprehensive interpretability (global understanding)—we investigate two prevalent deep learning scenarios.
### IV-A Case Study 1: MNIST Handwritten Digit Recognition
<details>
<summary>figure1.png Details</summary>
### Visual Description
\n
## SHAP Value Heatmap for Handwritten Digit Classification
### Overview
The image is a technical visualization used in machine learning interpretability, specifically showing SHAP (SHapley Additive exPlanations) values for a model's prediction of a handwritten digit. It consists of three distinct components: the original input image, a corresponding SHAP value heatmap, and a color scale legend.
### Components/Axes
1. **Left Panel (Original Input):** A grayscale image of a handwritten digit "7" on a black background. The digit is composed of white and gray pixels, showing the typical stroke pattern: a horizontal top bar and a diagonal descending stroke.
2. **Right Panel (SHAP Heatmap):** A spatial heatmap overlaid on a light gray background, corresponding pixel-for-pixel with the left image. It uses a diverging blue-to-red color scheme to represent SHAP values.
3. **Bottom Legend (Color Scale):** A horizontal color bar centered at the bottom of the image.
* **Label:** "SHAP value"
* **Scale:** Linear, ranging from approximately **-6e-9** (dark blue) on the left to **+6e-9** (dark red) on the right, with **0** (white/light gray) at the center.
* **Tick Marks:** Labeled at -6, -4, -2, 0, 2, 4, 6. The notation "1e-9" is placed at the far right, indicating all values are multiplied by 10⁻⁹.
### Detailed Analysis
* **Spatial Grounding & Color Cross-Reference:**
* The **red clusters** (positive SHAP values) are concentrated along the primary strokes of the digit "7". The most intense red is located at the top-left corner of the horizontal bar and along the upper portion of the diagonal stroke.
* The **blue clusters** (negative SHAP values) are more scattered and appear in the background areas immediately surrounding the digit's strokes, particularly to the right of the diagonal and below the horizontal bar.
* The **light gray/white areas** (SHAP value ≈ 0) constitute the majority of the background, indicating pixels with minimal contribution to the model's output for this specific prediction.
* **Trend Verification:**
* The visual trend shows a strong positive correlation between the physical location of the digit's strokes and positive SHAP values. The heatmap "highlights" the shape of the 7 in red.
* Conversely, the immediate negative space around the strokes shows a negative contribution (blue).
### Key Observations
1. **Stroke Alignment:** The model's most influential features (highest positive SHAP values) align almost perfectly with the human-perceived strokes of the digit "7".
2. **Negative Contributions:** The presence of blue (negative) pixels adjacent to the strokes suggests the model may be using the contrast between the digit and its immediate background as a feature. Pixels that are "not part of the stroke" in key locations actively reduce the model's confidence in other possible digit classes.
3. **Value Magnitude:** The SHAP values are extremely small (on the order of 10⁻⁹). This is typical for SHAP explanations of classification models with softmax outputs, where values represent contributions to the log-odds before the final probability normalization.
### Interpretation
This visualization provides a Peircean **indexical** explanation of the model's decision-making process. The heatmap acts as a direct index, pointing to the specific pixels in the input that caused the model to increase (red) or decrease (blue) its prediction score for the class "7".
* **What the Data Suggests:** The model has learned a robust representation of the digit "7". It relies heavily on the presence of the top horizontal bar and the diagonal stroke. The negative contributions around the strokes indicate the model also considers the local context—the absence of ink in specific neighboring areas is informative.
* **How Elements Relate:** The left image is the *cause* (input), the right heatmap is the *explanation* (attribution), and the color scale provides the quantitative *magnitude* of attribution. The perfect spatial correspondence between the two panels is critical for the explanation's validity.
* **Notable Anomalies:** There are no significant outliers. The attribution pattern is clean and logically consistent with how a human would recognize the digit. The very small scale of the values is a technical characteristic of the explanation method, not an anomaly in the data pattern.
**Language Declaration:** All text present in the image is in English.
</details>
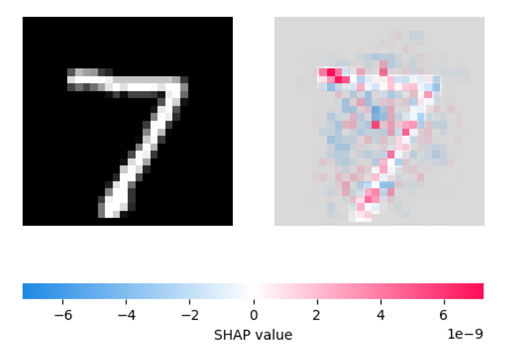
Figure 1: SHAP-based local explanation of a CNN’s prediction for an MNIST digit classified as ’7’. Left: Original input image. Right: SHAP heatmap indicating pixel-level feature contributions; red areas contribute positively to the prediction ’7’, while blue areas contribute negatively.
The MNIST dataset consists of 70,000 grayscale images depicting handwritten digits (0-9). CNNs represent the standard, high-efficacy models for this recognition task.
- The Opaque Nature of the Model: A standard CNN for MNIST typically incorporates several convolutional and pooling layers, followed by fully-connected layers, amounting to potentially millions of parameters. Although the architectural blueprint is human-designed, deciphering precisely how a particular configuration of learned filter weights across all layers culminates in a digit classification presents a formidable challenge. The model’s global operational mechanics remain largely obscure, precluding an easy articulation of its learned comprehensive rule-set for achieving global understanding.
- Attaining Local Explainability (Post-hoc): Notwithstanding the CNN’s opacity, explanations for individual predictions are obtainable.
- Feature Attribution Maps (e.g., Grad-CAM [7], SHAP): For an image classified as a ’7’, such methods can produce a visual heatmap or assign scores that pinpoint the input image pixels most critical to this ’7’ determination (e.g., the horizontal bar and diagonal stroke characteristic of a ’7’). This offers a localized, post-hoc rationale: “The model designated this as ’7’ due to its focus on these ’7’-indicative pixel areas.” (See Fig. 1).
- LIME [5]: LIME can locally approximate the CNN’s decision boundary for a given image by introducing perturbations (like toggling superpixels) and training a simpler, understandable model (such as a sparse linear regressor) on these variations. This would identify which superpixels steered the decision towards ’7’.
- Takeaway from MNIST Analysis: XAI tools empower us to effectively generate a local explanation for why a specific image is assigned a particular digit label by highlighting crucial input features. Nevertheless, these explanations do not transform the entire CNN into a globally interpretable system. We gain insight into the ’why’ for an individual instance, but not necessarily the complete ’how’ of the model’s overarching learned function.
### IV-B Case Study 2: IMDB Movie Review Sentiment Analysis
<details>
<summary>figure2.png Details</summary>
### Visual Description
\n
## Horizontal Bar Chart: LIME Explanation for 'positive' prediction (Instance 5)
### Overview
This image displays a horizontal bar chart generated by LIME (Local Interpretable Model-agnostic Explanations), a machine learning interpretability technique. The chart visualizes the contribution of individual words (features) from a text instance towards a model's 'positive' class prediction. All displayed contributions are negative, indicating these words, in this specific context, pushed the prediction away from 'positive'.
### Components/Axes
* **Chart Title:** "LIME Explanation for 'positive' prediction (Instance 5)" - Located at the top center.
* **Y-Axis (Vertical):** Lists the feature words from the analyzed text instance. The words are, from top to bottom: `movie`, `cheap`, `on`, `this`, `least`, `channel`, `and`, `i`, `doesn`, `see`.
* **X-Axis (Horizontal):** Represents the feature contribution weight. The scale runs from `-0.010` on the far left to `0.000` on the far right, with major tick marks at `-0.010`, `-0.008`, `-0.006`, `-0.004`, `-0.002`, and `0.000`.
* **Data Series:** A single series of horizontal red bars. Each bar originates from the `0.000` line on the right and extends leftward, indicating a negative contribution value.
* **Legend:** Not present. The single color (red) represents the contribution magnitude for each listed word.
### Detailed Analysis
The chart quantifies how much each word contributed to the model's prediction score for the 'positive' class. A negative value means the word made the 'positive' prediction less likely.
**Word Contributions (Approximate Values, read from x-axis):**
1. **movie:** Bar extends to approximately `-0.010`. This is the largest negative contributor.
2. **cheap:** Bar extends to approximately `-0.0085`.
3. **on:** Bar extends to approximately `-0.0085`.
4. **this:** Bar extends to approximately `-0.0085`.
5. **least:** Bar extends to approximately `-0.0085`.
6. **channel:** Bar extends to approximately `-0.008`.
7. **and:** Bar extends to approximately `-0.008`.
8. **i:** Bar extends to approximately `-0.008`.
9. **doesn:** Bar extends to approximately `-0.0078`.
10. **see:** Bar extends to approximately `-0.001`. This is the smallest negative contributor.
**Trend Verification:** All bars slope leftward from the zero line, confirming a consistent trend of negative contributions across all displayed features for this instance.
### Key Observations
1. **Uniform Direction:** Every single word feature shown has a negative contribution weight. There are no positive contributors displayed in this explanation.
2. **Magnitude Clustering:** The contributions for words 2 through 9 (`cheap` to `i`) are clustered within a narrow range (approx. `-0.0078` to `-0.0085`), suggesting similar levels of influence.
3. **Outliers:** `movie` is a clear outlier with the strongest negative pull (approx. `-0.010`). `see` is an outlier in the opposite direction, with a very weak negative contribution (approx. `-0.001`).
4. **Spatial Layout:** The legend (word list) is positioned on the left (y-axis). The data (bars) extend from the right (zero line) towards the left, with their length corresponding to the x-axis scale at the bottom.
### Interpretation
This LIME explanation reveals a counter-intuitive scenario. The model's final prediction for "Instance 5" was 'positive', yet the local explanation highlights that the most influential words *within this specific text snippet* all worked against that prediction.
This suggests one of several possibilities:
* **Compensating Factors:** The overall 'positive' prediction is likely driven by other words or features in the full text that are *not* shown in this top-10 explanation. The negative contributions here are outweighed by stronger positive contributions from other features.
* **Contextual Negation:** Words like "cheap" and "doesn" (likely part of "doesn't") are inherently negative. Their strong negative contribution is expected. The presence of "movie" as the strongest negative contributor is more interesting—it may be a neutral word that, in the specific context of this review (e.g., "this movie is cheap..."), became a negative signal.
* **Model Behavior:** The chart effectively demonstrates LIME's purpose: to provide a local, interpretable snapshot of model reasoning, which can sometimes contradict the global prediction. It shows the model is using these words as negative signals, even if the final classification was positive.
In essence, this chart does not explain *why* the prediction was positive; it explains which parts of *this text* were most responsible for pushing the prediction *away* from positive. The true positive drivers are not visualized here.
</details>
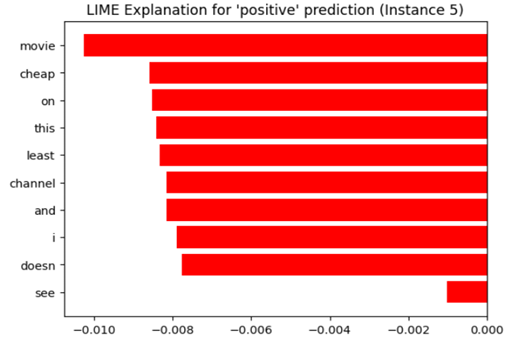
Figure 2: LIME explanation for a positive sentiment prediction on an IMDB movie review. Although the predicted label is positive, the words shown (e.g., "cheap," "least," "channel") had negative contributions to the classification. The explanation helps interpret the model’s local reasoning for this instance.
The IMDB dataset comprises 50,000 movie reviews, each categorized as positive or negative. Models like RNNs (e.g., LSTMs) and Transformers (e.g., BERT) deliver leading performance on this task.
- The Opaque Nature of the Model: Architectures such as LSTMs or Transformers employ intricate sequential data processing and attention mechanisms on input word embeddings. Tracing the transformation of an input sentence’s semantic content through recurrent states or multiple self-attention layers to a final sentiment score is a complex endeavor. The learned representations are high-dimensional, and their precise semantic interpretations are not always readily apparent, making these models inherently uninterpretable for global understanding.
- Attaining Local Explainability (Post-hoc):
- Attention Visualization (Relevant for Transformers): When utilizing a Transformer, attention weights can reveal which words the model emphasized while processing others, or which words received the most attention from the final classification token. For a review classified as ’positive’, strong attention might fall on terms like “excellent,” “brilliant,” or “loved.”
- LIME [5] or SHAP [6]: These techniques can be adapted for text models, for example, by omitting words from a review and observing the consequent shift in prediction probability. They can then allocate importance scores to each word in a specific review, signifying which words were most instrumental in the ’positive’ or ’negative’ classification. An example explanation might be: “This review was classified as negative primarily due to the substantial negative influence of the words ’awful’ and ’waste’.”
- Takeaway from IMDB Analysis: Analogous to the MNIST scenario, XAI methods enable the generation of local explanations for the sentiment prediction of an individual review by identifying key influential textual elements. This yields valuable, localized comprehension. However, the comprehensive internal logic by which the LSTM or Transformer model processes language to discern sentiment remains multifaceted and largely uninterpretable from a global perspective.
## V Synthesizing Insights from Case Studies
The analyses of MNIST and IMDB datasets furnish concrete evidence that:
- Deep learning models, despite their power, frequently function as opaque systems, rendering their global internal processes challenging to interpret for holistic understanding.
- Post-hoc XAI methodologies can deliver valuable local explanations for specific predictions generated by these opaque models. Pixel attribution maps for MNIST images and word-level importance scores for IMDB reviews serve as excellent examples.
- These local explanations address the “why this particular prediction?” query, thereby enhancing localized trust and comprehension.
- Nonetheless, the provision of such local explanations does not inherently render the entire model globally interpretable. The sophisticated underlying mechanisms often remain inscrutable.
- Consequently, a model that is explainable (i.e., for which local justifications for outputs can be produced) is not axiomatically interpretable (i.e., one whose fundamental operations are transparent for global understanding).
## VI General Techniques in Deep Learning
The field offers a spectrum of methods, extending beyond those highlighted in our case studies.
### VI-A Interpretability-focused Techniques (Often "Interpretable by Design" for Global Understanding)
- Structured Attention Mechanisms: Designing models where attention is a constrained, core element can foster interpretability by forcing explicit focus indication.
- Concept-based Architectures (e.g., TCAV): These aim to link model decisions to high-level, human-intelligible concepts.
- Generalized Additive Models (GAMs) / Neural Additive Models (NAMs): These learn a sum of non-linear transformations of individual input features.
- ProtoPNet (Prototypical Part Network): Predictions are made by comparing input segments to learned class-specific prototypes.
- Rule Extraction from Neural Networks: This involves attempts to translate the learned knowledge of a neural network into a set of symbolic rules.
### VI-B Explainability-focused Techniques (Often Post-hoc for Local Explanations)
- Saliency/Feature Attribution Maps (as in MNIST study):
- Gradient-derived: Methods like Vanilla Gradients, Integrated Gradients, Grad-CAM.
- Perturbation-based: Techniques such as occlusion sensitivity, or certain SHAP algorithm variants.
- LIME (Local Interpretable Model-agnostic Explanations) (relevant to MNIST & IMDB studies): This approach locally trains a simpler, interpretable surrogate model.
- SHAP (SHapley Additive exPlanations) (relevant to IMDB & MNIST studies): A game-theoretic method for assessing feature importance.
- Counterfactual Explanations: These identify the minimal input modifications required to change a prediction.
- Influence Functions: These assess the impact of individual training samples on model parameters and predictions.
## VII Importance and Applications
Both interpretability (which targets global understanding) and explainability (which provides local explanations) are vital for endeavors such as building trust, facilitating model debugging, ensuring fairness, meeting regulatory compliance, enabling scientific discovery, and guaranteeing safety in critical systems. The case studies underscore that even when complete global interpretability is unattainable, instance-specific local explainability offers significant value.
## VIII Challenges and Limitations
- Performance vs. Transparency Trade-off: High-accuracy DL models (as used for MNIST/IMDB) frequently lack global interpretability. Simpler, more interpretable alternatives might compromise predictive power. Post-hoc local explanations are often approximations.
- Veracity of Explanations: Validating that local explanations genuinely mirror the model’s reasoning for a specific instance remains a significant hurdle.
- Human-Centricity of Explanations: The definition of an effective or “understandable” local explanation is inherently subjective and varies with context and user.
- Objective Evaluation: Quantifying the quality of global interpretability or a local explanation poses considerable difficulty.
- Resource Intensiveness: Many XAI techniques demand substantial computational resources.
- Breadth of Insight: Most XAI tools deliver local explanations. Achieving a reliable global understanding of entire DL models is a more elusive goal.
## IX The Symbiotic Relationship
Although distinct, interpretability (global understanding) and explainability (local explanations) are not mutually exclusive concepts.
- Incorporating inherently interpretable modules can enhance the coherence and reliability of post-hoc local explanations.
- Local explanation methods can serve as auditing tools for models that are partially interpretable.
The overarching aim is to achieve an adequate level of understanding pertinent to the specific application. This might be realized through an intrinsically globally interpretable model or through an opaque model supplemented by robust local explanations, as demonstrated by our MNIST/IMDB scenarios where local explanations furnish key insights despite the models’ overall complexity.
## X Future Directions
- Development of Inherently Interpretable Deep Learning Systems: Pursuing novel DL architectures that combine high performance with inherent transparency for global understanding.
- Advancement of Causal Explanations: Progressing from correlational feature importance in local explanations towards insights grounded in causal inference.
- Creation of Interactive and Personalized Explanation Interfaces: Designing tools that provide tailored local explanations responsive to user queries.
- Enhancing Robustness and Scrutiny of Explanations: Ensuring that local explanations are resilient to manipulation and are not deceptive.
- Establishment of Standardization and Benchmarking Protocols: Developing common evaluative frameworks for both types of methodologies.
## XI Conclusion
Within the deep learning landscape, interpretability is primarily associated with the inherent comprehensibility of a model’s internal operations, striving for a global understanding of its systemic behavior. This is commonly pursued via architectural choices that promote transparency. Conversely, explainability (XAI) generally entails the use of post-hoc methodologies to offer human-intelligible rationales for specific model outputs, thereby delivering local explanations concerning the behavior of intricate, often opaque, systems.
Our investigations using the MNIST and IMDB datasets, coupled with the practical application of XAI utilities, serve to concretely delineate this difference. For a Convolutional Neural Network (CNN) tasked with MNIST digit classification, explainability techniques such as SHAP or other saliency approaches can produce pixel importance maps. These visualizations identify the pixels most critical to a particular digit’s classification (e.g., elucidating why a given image is identified as a ’7’ by highlighting its formative pixel configurations). In a similar vein, for models like LSTMs or Transformers engaged in IMDB movie review analysis, techniques including LIME or attention mechanisms can yield word importance scores. These scores clarify a sentiment assessment by pinpointing the most influential words or phrases (e.g., explaining why a review is classified as ’positive’ through specific textual cues).
In both instances, while these post-hoc local explanations furnish valuable understanding of why an individual prediction was rendered, the overarching, sophisticated decision-making architecture of these high-performing deep learning models largely remains uninterpretable. The local explanations, by concentrating on input feature attributions for specific outcomes, supply justifications but do not provide a holistic, global grasp of the model’s complete learned logic or its internal operational transformations.
Consequently, although a globally interpretable model is inherently explainable at both local and global scales, a model that is merely explainable—as illustrated by standard DL applications to MNIST and IMDB where local explanations for distinct predictions can be generated—is not necessarily globally interpretable. This distinction holds significant importance. Depending on post-hoc local explainability for complex models is frequently a pragmatic approach; however, recognizing its constraints concerning genuine global model comprehension is essential. Progress in artificial intelligence demands advancements on both fronts: the creation of more intrinsically interpretable models for achieving global understanding, and the refinement of robust explainability techniques for trustworthy local justifications. Such dual development is paramount for cultivating accountable, beneficial, and reliable AI systems.
## References
- [1] A. B. Arrieta, N. Díaz-Rodríguez, J. Del Ser, A. Bennetot, S. Tabik, A. Barbado, et al., “Explainable artificial intelligence (XAI): concepts, taxonomies, opportunities and challenges toward responsible AI,” Information Fusion, vol. 58, pp. 82-115, Jun. 2020.
- [2] F. Doshi-Velez and B. Kim, “Towards a rigorous science of interpretable machine learning,” arXiv preprint arXiv:1702.08608, 2017.
- [3] Z. C. Lipton, “The mythos of model interpretability,” Queue, vol. 16, no. 3, pp. 31-57, May-Jun. 2018.
- [4] C. Molnar, Interpretable machine learning: a guide for making black box models explainable. Lulu.com, 2020. [Online]. Available: https://christophm.github.io/interpretable-ml-book/
- [5] M. T. Ribeiro, S. Singh, and C. Guestrin, “"Why should I trust you?": explaining the predictions of any classifier,” in Proc. 22nd ACM SIGKDD Int. Conf. Knowledge Discovery and Data Mining (KDD), San Francisco, CA, USA, Aug. 2016, pp. 1135-1144.
- [6] S. M. Lundberg and S.-I. Lee, “A unified approach to interpreting model predictions,” in Advances in Neural Information Processing Systems (NIPS), Long Beach, CA, USA, Dec. 2017, pp. 4765-4774.
- [7] R. R. Selvaraju, M. Cogswell, A. Das, R. Vedantam, D. Parikh, and D. Batra, “Grad-cam: visual explanations from deep networks via gradient-based localization,” in Proc. IEEE Int. Conf. Computer Vision (ICCV), Venice, Italy, Oct. 2017, pp. 618-626.