# Every Activation Boosted: Scaling General Reasoner to 1 Trillion Open Language Foundation
**Authors**: Ling Team, Ang Li, Ben Liu, Binbin Hu, Bing Li, Bingwei Zeng, Borui Ye, Caizhi Tang, Changxin Tian, Chao Huang, Chao Zhang, Chen Qian, Chenchen Ju, Chenchen Li, Chengfu Tang, Chilin Fu, Chunshao Ren, Chunwei Wu, Cong Zhang, Cunyin Peng, Dafeng Xu, Daixin Wang, Dalong Zhang, Dingnan Jin, Dingyuan Zhu, Dongke Hu, Fangzheng Zhao, Feifan Wu, Feng Zhu, Gangshan Wang, Haitao Zhang, Hailin Zhao, Hanxiao Zhang, Hanzi Wang, Hao Qian, Haoyi Yu, Heng Zhang, Hongliang Zhang, Hongzhi Luan, Huirong Dong, Huizhong Li, Jia Li, Jia Liu, Jialong Zhu, Jian Sha, Jianping Wei, Jiaolong Yang, Jieyue Ma, Jiewei Wu, Jinjing Huang, Jingyun Tian, Jingyuan Zhang, Jinquan Sun, Juanhui Tu, Jun Liu, Jun Xu, Jun Zhou, Junjie Ou, Junpeng Fang, Kaihong Zhang, Kaiqin Hu, Ke Shi, Kun Tang, Kunlong Chen, Lanyin Mei, Lei Liang, Lei Xu, Libo Zhang, Lin Ju, Lin Yuan, Ling Zhong, Lintao Ma, Lu Liu, Lu Yu, Lun Cai, Meiqi Zhu, Mengying Li, Min Chen, Minghao Xue, Minghong Cai, Mingming Yin, Peijie Jiang, Peilong Zhao, Pingping Liu, Qian Zhao, Qing Cui, Qingxiang Huang, Qingyuan Yang, Quankun Yu, Shaowei Wei, Shijie Lian, Shoujian Zheng, Shun Song, Shungen Zhang, Shuo Zhang, Siyuan Li, Song Liu, Ting Guo, Tong Zhao, Wanli Gu, Weichang Wu, Weiguang Han, Wenjing Fang, Wubin Wang, Xiang Shu, Xiao Shi, Xiaoshun Lan, Xiaolu Zhang, Xiaqing Sun, Xin Zhao, Xingyu Lu, Xiong Xu, Xudong Wang, Xudong Wang, Xuemin Yang, Yajie Yang, Yang Xiang, Yanzhe Li, Yi Zhang, Yilong Wang, Yingxue Li, Yongzhen Guo, Yuzhuo Fu, Yuanyuan Wang, Yue Yang, Yue Yu, Yufeng Deng, Yun Zhang, Yunfei Yu, Yuqi Zhang, Yuxiao He, Zengke Gui, Zhaoxin Huan, Zhaoyang Wang, Zhibo Zhu, Zhihao Wang, Zhiqiang Zhang, Zhoufei Wang, Zihang Zeng, Ziqi Liu, Zitao Xuan, Zuoli Tang
## Ling 2.0 Technical Report
## Every Activation Boosted: Scaling General Reasoner to 1 Trillion Open Language Foundation
Ling Team, Inclusion AI ∗
∗ See Contributions section (Sec. 7) for full author list.
We introduce Ling 2.0 , a series reasoning-oriented language foundation built upon the principle that every activation boosts reasoning capability. Designed to scale from tens of billions to one trillion parameters under a unified Mixture-of-Experts (MoE) paradigm, Ling 2.0 emphasizes high sparsity, cross-scale consistency, and efficiency guided by empirical scaling laws. The series includes three non-thinking (instruct) modelsLing-mini-2.0 , Ling-flash-2.0 , and Ling-1T -ranging from 16B to 1T total parameters and achieving up to 7× active-compute efficiency compared with dense counterparts. Ling 2.0 integrates coordinated innovations across model architecture, pre-training, post-training, and infrastructure: a high-sparsity MoE with MTP for efficient reasoning, reasoning-oriented data and midtraining CoT activation, reinforcement-based fine-tuning (DFT, Evo-CoT), and full-scale FP8 training with fine-grained heterogeneous pipelines. At the trillion scale, Ling-1T establishes a new Pareto frontier of reasoning accuracy versus computational efficiency, demonstrating that sparse activation, when properly aligned with reasoning objectives, enables scalable and efficient intelligence. Collectively, Ling 2.0 provides a coherent, open, and efficient foundation for advancing future reasoning and thinking models, including the Ring series built upon the same base.
Date:
Oct 24, 2025
Code:
https://github.com/inclusionAI/Ling-V2
Model:
https://huggingface.co/collections/inclusionAI/ling-v2
## 1 Introduction
Large language models (LLMs) such as GPT-5 (OpenAI, 2025), Gemini-2.5 (Comanici et al., 2025), Qwen-3 (Yang et al., 2025a), and DeepSeek-V3 (DeepSeek-AI, 2024) have evolved into the core infrastructure of modern AI. Yet as scaling reaches hundreds of billions of parameters, performance gains increasingly depend on a model's ability to reason -to decompose problems, infer hidden relations, and make consistent multi-step deductions. We believe that reasoning capability is the essence of intelligence and the foundation for building general-purpose agents that can understand, decide, and act autonomously.
Recent open models highlight this trend. Kimi-K2 (Moonshot-AI, 2025), an open trillion-scale model, focuses primarily on enhancing agentic capability, while DeepSeek-V3 (DeepSeek-AI, 2024), though smaller at 671B parameters, achieves outstanding reasoning performance under efficient sparse scaling. Ling 2.0 is designed to push beyond: scaling a trillion-parameter reasoning-oriented foundation model that maximizes reasoning accuracy and efficiency under sparse activation, establishing a scalable blueprint for next-generation open intelligent systems.
<details>
<summary>Image 1 Details</summary>

### Visual Description
Icon/Small Image (118x52)
</details>
Scaling general reasoning capability to the trillion-parameter level is a central challenge in the evolution of LLMs. The key difficulty lies in achieving both efficient scaling -maintaining computational efficiency, stability, and predictability under extreme scale-and reasoning enhancement -ensuring that expanded capacity leads to more consistent and reliable reasoning.
From the scaling perspective, dense architectures incur prohibitive cost, motivating high-sparsity designs that preserve expressiveness while reducing computation. Reliable scaling prediction becomes essential to anticipate trillion-scale performance (beyond 1 e 25 FLOPs) from smaller-scale experiments. In addition, effective algorithm-infrastructure co-design is required to align precision, parallelism, and communication for efficient large-scale execution. From the reasoning perspective, maintaining improvement across pre-training , mid-training , and post-training remains difficult. Constructing reasoning-centric corpora is resource-intensive, while transferring learned reasoning behaviors across these stages can introduce instability. Achieving sustained progress thus requires innovations in both data and training pipeline to balance reasoning accuracy and efficiency.
To address the intertwined challenges of efficient scaling and sustained reasoning enhancement, Ling 2.0 introduces systematic innovations across four dimensions: model architecture, pre-training, post-training, and infrastructure.
## Model Architecture.
- Ling Scaling Laws. Our unified Ling Scaling Laws, derived from over a thousand experiments , guide the hyperparameter and architectural design for trillion-parameter models, ensuring stable and near-optimal training. Crucially, the framework establishes a 'wind tunnel' for low-cost, high-fidelity extrapolation from small-scale trials to trillion-parameter models, cutting validation costs to under 1% of a full training run and greatly accelerating innovation cycle.
- High-Sparsity MoE with MTP. Ling 2.0 scales our ' high-sparsity, fine-grained ' architecture from 16B to 1T parameters. All models use 256 routed experts, activating 8 experts plus one shared expert per token ( ≈ 3.5% activation), realizing 7× efficiency leverage per the Ling Scaling Law. With aux-loss-free load balancing and MTP, Ling 2.0 maintains high training efficiency while improving logical reasoning, leading to significant math and coding performance gains.
## Pre-Training.
- Reasoning-oriented Data Composition. Our pre-training corpus prioritizes the Ling Math and Ling Code datasets, which are tailored for mathematical reasoning and code generation, respectively, yielding a 5-8% average gain on reasoning benchmarks. Throughout the 20Ttoken pre-training process, we progressively increase the proportion of reasoning data from 32% to 46%, establishing Ling 2.0's inherent reasoning strengths.
- Reasoning Pre-Activation in Mid-Training. In the mid-training phase, we extend the effective context window and introduce Chain-of-Thought (CoT) data to pre-activate reasoning abilities. This strategy raises the ceiling on reasoning performance, and provides a more stable foundation for subsequent fine-tuning and reinforcement learning (RL).
- Warmup-Stable-Merge (WSM) Scheduler. To enable a more flexible and effective pre-training process, the Ling 2.0 series adopts the novel WSM (warmup-stable-merge) scheduler, which replaces learning-rate decay with checkpoint merging and delivers 1-2% average gains across benchmarks. Notably, this advantage persists through subsequent post-training stages.
## Post-Training.
- DFT Initialization with Progressive Reasoning Evolution. Through Decoupled Fine-Tuning (DFT) with differentiated system prompts, we establish a diverse, reasoning-focused initialization. Building on this foundation, the Evolutionary Chain-of-Thought (Evo-CoT) paradigm progressively deepens reasoning capabilities-enabling Ling 2.0 to surpass state-of-the-art models on competition-level mathematical reasoning benchmark, while requiring 25% fewer training tokens to reach comparable or better performance.
- Sentence-Level Policy Optimization. Introduces Linguistic-unit Policy Optimization (LPO) , treating sentences as the fundamental action units for RL updates. This fine-grained optimization strategy shows higher training stability and delivers around 10% improvements on complex reasoning benchmarks compared to token-level and sequence-level baselines.
- Group-Based Human Preference Alignment. The Group Arena Reward (GAR) mechanism ensures precise intra-group preference alignment in RLHF, better reflecting nuanced human judgments, yielding 2-10% higher consistency scores in open-ended evaluations.
## Infrastructure.
- Full-scale FP8 training. Ling 2.0 represents the largest open-source model trained entirely in FP8 precision. Fine-grained quantization (activations/gradients [1,128]; weights [128,128]) achieves near-lossless accuracy ( ≤ 0.25 % gap to BF16 after 900 B tokens) while improving utilization and reducing memory use by over 15 %.
- Heterogeneous fine-grained pipeline. Interleaved 1F1B scheduling with partial recomputation mitigates pipeline bubbles from heterogeneous modules such as MTP and First-K-Dense, improving throughput by around 40 %.
- Software Engineering for Foundation LLMs. Guiding a software-engineering-oriented LLMs framework with the 4C (Correct, Consistent, Complete, and Co-Design) principle, incorporating efficient automated iteration, algorithm-system co-design and cross-platform reproducibility to jointly ensures robust trillion-scale development.
Based on the above innovations, we release three models of different scales in the Ling 2.0 family:
- Ling-mini-2.0 : 16B total parameters with 1.4B activated.
- Ling-flash-2.0 : 103B total parameters with 6.1B activated.
- Ling-1T : 1 trillion total parameters with 51B activated.
Ling 2.0 is comprehensively evaluated across a wide range of benchmarks spanning mathematics, coding, reasoning, knowledge, alignment, and agentic tasks. The results exhibit a consistent scaling trajectory: as model capacity expands from Ling-mini-2.0 to Ling-flash-2.0 and Ling-1T , performance across all tasks improve steadily in accordance with the Ling Scaling Law.
At smaller scales, Ling-mini-2.0 achieves performance on par with or exceeding dense models below 10B parameters, while Ling-flash-2.0 matches or surpasses dense models below 40B. These findings confirm that Ling 2.0 provides an approximate 7× efficiency leverage , delivering dense-level capability with substantially lower active computation.
At the trillion-parameter scale, Ling-1T establishes a new Pareto frontier of reasoning accuracy versus efficiency, demonstrating 'efficient thinking and precise reasoning' on competition-level
benchmarks such as AIME 2025. Collectively, these results validate that Ling 2.0 effectively scales reasoning capability with both architectural efficiency and algorithmic alignment, advancing the frontier of open-source language foundation models.
This report focuses on three reflex-grade non-thinking (instruct) models in the Ling 2.0 familyLing-mini-2.0 , Ling-flash-2.0 , and Ling-1T . These models emphasize general reasoning and instruction-following capability, while the Ring series (Ling-Team, 2025), built upon the same Ling 2.0 base, extends toward deep thinking models. The remainder of this report introduces the core model architecture, pre-training and post-training methodology, as well as the infrastructure optimizations of Ling 2.0.
## 2 Architecture
To maximize performance within a constrained resources, Ling 2.0 series uniformly adopts a MoE architecture (Shazeer et al., 2017; DeepSeek-AI, 2024). It integrates aux-loss-free load balancing strategy (DeepSeek-AI, 2024) and Multi-Token Prediction (MTP) (Gloeckle et al., 2024; DeepSeek-AI, 2024) to optimize the training process. Furthermore, our architectural decisions are grounded in systematic scaling law experiments (Tian et al., 2025a) that verify the reliable extrapolation of key architectural details, thus enabling efficient architecture iteration and principled design choices.
## 2.1 Basic Architecture
The Ling 2.0 series comprises three MoE models of varying scales: Ling-mini-2.0 , Ling-flash-2.0 , and Ling-1T , covering total parameter counts from 16B up to 1T. Key architectural details of the models are summarized in Table 1.
Ling 2.0 models adopt a unified 'high-sparsity, fine-grained' design: each model is configured with 256 routed experts, activates 8 experts plus 1 shared expert, yielding an overall activation ratio of approximately 3.5%. Our scaling laws analysis (Tian et al., 2025a) indicates that continuously increasing sparsity yields significant performance gains (Moonshot-AI, 2025). Concurrently, the fine-grained setting of activating 8 experts presents a superior balance between training speed and model performance, while the inclusion of one shared expert was identified as an optimal design heuristic through our extensive experiments. Additionally, we designate the initial 1, 1, and 4 layers of the three models, respectively, as dense layers. This approach reduces the total parameter count while maintaining equivalent model performance and improving routing balance.
In the attention layers, Ling 2.0 models employ standard grouped-query attention (GQA) (Ainslie et al., 2023) with 8, 16, or 32 key-value heads to reduce KV cache size during decoding; it employs SwiGLU and RMSNorm with pre-normalization to improve representational efficiency and stability. We further introduce QKNorm (Henry et al., 2020) to enhance training robustness, which we verify to significantly improve stability under low-precision training. Furthermore, we implement Partial RoPE (Su et al., 2024), applying rotary position embeddings only to the first 64 dimensions of the attention heads, to bolster the model's length extrapolation capabilities.
Ling 2.0 extends the Ling 1.5 vocabulary and uses byte-level byte-pair encoding, BBPE (Shibata et al., 1999; Sennrich et al., 2015), with a 156K token vocabulary to enhance multilingual performance.
## 2.2 Model Optimization
To further improve the training efficiency and final performance of Ling 2.0, we incorporate the aux-loss-free load balancing strategy and Multi-Token Prediction (MTP).
Table 1 Key architectural configurations and training hyperparameters of the Ling 2.0 series.
| | Ling-mini-2.0 | Ling-flash-2.0 | Ling-1T |
|----------------------------|-----------------|------------------|---------------|
| # Layers | 20 | 32 | 80 |
| # Experts (total) | 256 | 256 | 256 |
| # Experts Active per Token | 8 | 8 | 8 |
| # Shared Experts | 1 | 1 | 1 |
| # Attention Heads | 16 | 32 | 64 |
| # Dense Layers | 1 | 1 | 4 |
| Hidden Size | 2,048 | 4,096 | 8,192 |
| Intermediate Size | 5,120 | 9,216 | 18,432 |
| Expert Intermediate Size | 512 | 1,024 | 2,048 |
| Total Parameters (B) | 16 | 103 | 1000 |
| Activated Parameters (B) | 1.4 | 6.1 | 51.0 |
| Learning Rate | 3.36 × 10 - 4 | 2.61 × 10 - 4 | 1.86 × 10 - 4 |
| Batch Size | 4,400 | 8,352 | 18,144 |
Load Balancing Strategy. Based on systematic experiments, Ling 2.0's routing balance strategy follows a design similar to DeepSeek-V3 (DeepSeek-AI, 2024). We choose an aux-loss-free balance strategy to jointly encourage expert specialization and load balancing, and we apply router gate scaling to improve training stability. The scaling factor is set to 2.5 to stabilize the root mean square of the gate outputs. We slightly modify the bias update strategy, keeping the bias centered around zero (Liu et al., 2025a). Concretely, the aux-free bias is updated as: bi = bi + u × ( sign ( e i ) -mean ( sign ( e )) ) , where u is the update rate, bi is the bias of the i -th expert, and e i is that expert's violation error. In addition, we adopt a dropless routing strategy to ensure model performance, alongside group routing to improve training efficiency without any performance degradation.
Multi Token Prediction. To enhance model performance and inference efficiency, Ling 2.0 natively integrates MTP (Gloeckle et al., 2024; DeepSeek-AI, 2024) as an auxiliary training objective. Through rigorous validation of its effectiveness and extrapolability, we found that MTP consistently improves performance on code and math tasks across different model scales. Considering the scaling trends of MTP hyperparameters and training efficiency across various model sizes, we introduce one MTP layer for each model scale and set the MTP loss weight to 0.1. To address the additional computational overhead introduced by MTP, we performed a detailed performance analysis and implemented fine-grained Pipeline Parallelism (PP) partitioning for the MTP module within the Megatron training framework. This optimization significantly mitigates the performance overhead from MTP, ensuring high training throughput (see Section 5 for details).
## 2.3 Ling Scaling Laws
Ling 2.0 series was conceived from the outset with the long-term goal of training trillion-parameter foundation models. To this end, we establish the Ling Scaling Laws (Tian et al., 2025a) to guide hyperparameter and architecture choices. The framework also provides the foundation for a standardized experimental pipeline, ensuring reliable extrapolation of findings to computational scales over 100x larger. Specifically, the Ling Scaling Laws serve two critical functions:
- Principled Design for Trillion-Parameter Models: The laws determine the hyperparameters and architectural settings for Ling 2.0, ensuring near-optimal architectural efficiency.
- Efficient Innovation at Minimal Cost: Astandardized pipeline are provided to validate novel ideas and emerging technologies for Ling 2.0 at just 1% of the full training compute cost.
<details>
<summary>Image 2 Details</summary>
### Visual Description
## Line Graphs: Scaling Laws for Optimal Hyperparameters and Model Data Allocation
### Overview
The image contains four line graphs arranged in a 2x2 grid, comparing scaling laws for two model architectures: **Ling Dense** (red dashed lines) and **Ling MoE** (blue dashed lines). Each graph plots a metric (learning rate, batch size, task rate) against **Non-Embedding Training FLOPs** (x-axis). Shaded regions indicate confidence intervals or error margins.
---
### Components/Axes
1. **Graph (a): Scaling Laws for Optimal Hyperparameters**
- **X-axis**: Non-Embedding Training FLOPs (log scale: 10¹⁷ to 10²⁵)
- **Y-axis**: Learning Rate (log scale: 10⁻⁷ to 10⁻⁵)
- **Legend**:
- Red dashed line: `y = 2.2177e-10.3499` (Ling Dense)
- Blue dashed line: `y = 1.1376e-10.3528` (Ling MoE)
- **Data Points**: Markers (stars, circles) with shaded regions.
2. **Graph (b): Scaling Laws for Optimal Model Data Allocation**
- **X-axis**: Non-Embedding Training FLOPs (log scale: 10¹⁷ to 10²⁵)
- **Y-axis**: Batch Size (log scale: 10¹⁷ to 10²⁵)
- **Legend**:
- Red dashed line: `y = 0.0655e-10.3422` (Ling Dense)
- Blue dashed line: `y = 0.0694e-10.3400` (Ling MoE)
- **Data Points**: Markers with shaded regions.
3. **Graph (c): Scaling Laws for Optimal Hyperparameters (Task Rate)**
- **X-axis**: Non-Embedding Training FLOPs (log scale: 10¹⁷ to 10²⁵)
- **Y-axis**: Task Rate (log scale: 10⁰ to 10²)
- **Legend**:
- Red dashed line: `y = 0.0655e-10.3422` (Ling Dense)
- Blue dashed line: `y = 0.0694e-10.3400` (Ling MoE)
- **Data Points**: Markers with shaded regions.
4. **Graph (d): Scaling Laws for Optimal Model Data Allocation (Task Rate)**
- **X-axis**: Non-Embedding Training FLOPs (log scale: 10¹⁷ to 10²⁵)
- **Y-axis**: Task Rate (log scale: 10⁰ to 10²)
- **Legend**:
- Red dashed line: `y = 15.2582e-10.3422` (Ling Dense)
- Blue dashed line: `y = 5.2232e-10.3400` (Ling MoE)
- **Data Points**: Markers with shaded regions.
---
### Detailed Analysis
1. **Graph (a): Learning Rate**
- **Trend**: Both lines slope downward as FLOPs increase, indicating inverse scaling.
- **Values**:
- Ling Dense: Peaks at ~10⁻⁶ (1e-6) at 1e20 FLOPs.
- Ling MoE: Peaks at ~10⁻⁷ (1e-7) at 1e20 FLOPs.
- **Shaded Regions**: Ling Dense has wider confidence intervals (e.g., ±10% at 1e20 FLOPs).
2. **Graph (b): Batch Size**
- **Trend**: Both lines slope upward, showing direct scaling.
- **Values**:
- Ling Dense: Reaches ~1e22 at 1e25 FLOPs.
- Ling MoE: Reaches ~1e21 at 1e25 FLOPs.
- **Shaded Regions**: Ling MoE has tighter confidence intervals.
3. **Graph (c): Task Rate (Hyperparameters)**
- **Trend**: Both lines slope upward, with Ling Dense consistently outperforming Ling MoE.
- **Values**:
- Ling Dense: ~1e1 at 1e20 FLOPs.
- Ling MoE: ~1e0 at 1e20 FLOPs.
- **Shaded Regions**: Ling Dense shows higher variability.
4. **Graph (d): Task Rate (Model Data Allocation)**
- **Trend**: Both lines slope upward, with Ling Dense achieving significantly higher task rates.
- **Values**:
- Ling Dense: ~1e2 at 1e25 FLOPs.
- Ling MoE: ~1e1 at 1e25 FLOPs.
- **Shaded Regions**: Ling Dense’s confidence intervals are broader.
---
### Key Observations
1. **Performance Gap**: Ling Dense consistently outperforms Ling MoE across all metrics, with larger margins in task rate (graphs c and d).
2. **Scaling Efficiency**: Ling Dense’s steeper slopes (e.g., `C = -10.3499` vs. `C = -10.3528` in graph a) suggest faster improvement with increased FLOPs.
3. **Confidence Intervals**: Ling Dense exhibits wider uncertainty ranges, possibly due to architectural complexity or training instability.
---
### Interpretation
The data demonstrates that **Ling Dense** scales more effectively with increased computational resources (FLOPs) compared to **Ling MoE**. This is evident in:
- **Higher Learning Rates**: Ling Dense achieves faster convergence (graph a).
- **Larger Batch Sizes**: Ling Dense handles more data per training step (graph b).
- **Superior Task Rates**: Ling Dense completes more tasks per FLOP, especially in data allocation (graph d).
The power-law relationships (`y = kx^C`) indicate that both models follow predictable scaling trends, but Ling Dense’s higher exponents (`C`) suggest better resource utilization. The wider confidence intervals for Ling Dense may reflect trade-offs between performance and stability. These findings imply that Ling Dense is more suitable for resource-constrained environments requiring rapid scaling.
</details>
(a)
Scaling laws for optimal hyperparameters
(b)
Scaling laws for optimal model-data allocation
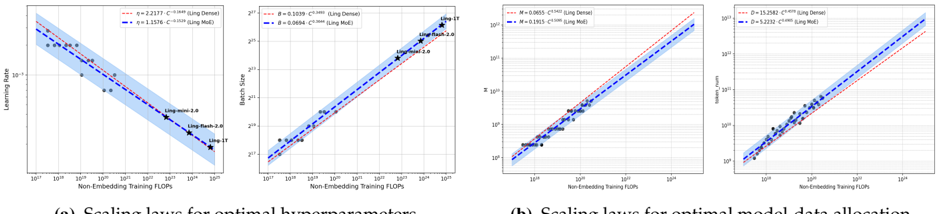
Figure 1 Scaling laws for optimal hyperparameters and optimal model-data allocation. Blue and red lines represent the fitted laws for MoE and dense models, respectively, derived on the same training dataset. Gray circles are the experimental data points used for fitting.
## 2.3.1 Scaling Laws for Optimal Hyper-parameters
To ensure that the Ling 2.0 series can be trained stably under appropriate hyperparameters, we first derived scaling laws for optimal MoE hyperparameters. Previous studies (Bi et al., 2024; Ling-Team et al., 2025) has shown that the optimal learning rate ( η ) and batch size ( B ) are primarily determined by the total compute budget ( C ). Accordingly, we conducted hyperparameter searches over nearly a thousand experiments across compute scales up to 3 e 20 FLOPs, using a Warmup-Stable-Decay (WSD) scheduler (Hu et al., 2024). To simplify analysis, we initially fixed the MoE architecture to 64 experts (4 active) plus 1 shared expert. After removing outliers, we selected optimal and near-optimal 1 configurations for fitting. From these data, we fit power-law relationships between compute C and the optimal batch size B opt and learning rate η opt, and verified that the resulting laws remain near-optimal under different activation ratios. The fitting process and fitted parameters is shown in Figure 1a.
Our analysis reveals a key difference between MoE and dense models in hyperparameter selection: at larger compute scales, MoEs tend to use larger batch sizes and relatively lower learning rate. We attribute this phenomenon to MoEs' sparse gradient updates: since only a subset of tokens in each batch contributes to the gradient update for any given expert, a larger batch size is necessary to ensure stable and effective training. These validated scaling laws provided a reliable foundation, enabling the efficient training of the Ling 2.0 models with near-optimal hyperparameters.
Furthermore, to gain deeper insight into the differing training dynamics of MoE and dense models, we analyzed the optimal allocation for training data ( D ) and model parameters ( M , i.e., FLOPs per token) under different compute budgets ( C = M · D ). As shown in Figure 1b, our findings indicate that for any given compute budget, the optimal MoE model has fewer parameters ( M opt) but is trained on more data ( D opt) compared to its optimal dense counterpart. This conclusion suggests that MoE architectures possess a larger effective capacity, enabling them to efficiently process more training data with fewer parameters, which offers a significant efficiency advantage in real-world scenarios where data is abundant but computational resources are limited.
## 2.3.2 Scaling Laws for MoE Architectural Efficiency
To guide the architectural design of the Ling 2.0, we systematically derived scaling laws for MoE architectural efficiency. We introduce efficiency leverage (EL) as our primary metric, defined as the ratio of computational cost required for a dense model to that of an MoE model to reach an
1 'near-optimal' is defined as configurations whose loss is within 0.25% of the minimum at a given compute budget.
<details>
<summary>Image 3 Details</summary>
### Visual Description
## 3D Charts and Heatmap: Model Performance Analysis
### Overview
The image contains three visualizations analyzing model performance: two 3D charts and a heatmap. The charts explore relationships between model parameters (activation ratio, model scale, granularity, FLOPs) and performance metrics (loss, efficiency leverage). The heatmap quantifies efficiency leverage across activation ratios and granularity levels.
### Components/Axes
#### Left 3D Chart
- **Axes**:
- **X-axis**: Activation Ratio (0.0% to 100.0%)
- **Y-axis**: Model Scale (M) (1e+18 to 3e+19)
- **Z-axis**: Loss (1.974 to 3.237)
- **Legend**:
- Color gradient for Model Scale (M): Light blue (1e+18) to dark blue (3e+19)
- Shaded area indicates loss range (2.213–3.237)
- **Data Points**:
- Blue dots with numerical labels (e.g., 2.213, 2.277, 3.237)
#### Right 3D Chart
- **Axes**:
- **X-axis**: Granularity (1 to 16)
- **Y-axis**: FLOPs (1e+18 to 3e+19)
- **Z-axis**: Loss (2.118 to 3.008)
- **Legend**:
- Color gradient for Model Size (M): Light blue (1e+18) to dark blue (3e+19)
- Shaded area indicates loss range (2.118–3.008)
- **Data Points**:
- Blue dots with numerical labels (e.g., 2.118, 2.218, 3.008)
#### Heatmap
- **Axes**:
- **X-axis**: Activation Ratio (100.0% to 0.4%)
- **Y-axis**: Granularity (2 to 16)
- **Color Scale**:
- Purple (low) to yellow (high) for Efficiency Leverage (2 to 13.3)
- **Cell Values**:
- Numerical values (e.g., 1.0, 1.4, 2.0, 2.9, 3.3, 4.7, 6.5, 7.7, 8.6)
### Detailed Analysis
#### Left 3D Chart
- **Trend**:
- Loss decreases slightly as Activation Ratio increases (e.g., 3.237 at 0.0% → 2.213 at 100.0%).
- Model Scale (M) correlates with loss: Higher scales (e.g., 3e+19) show higher loss (3.237) compared to lower scales (1e+18, 2.213).
- **Key Data Points**:
- (0.0%, 1e+18, 2.213)
- (100.0%, 3e+19, 3.237)
#### Right 3D Chart
- **Trend**:
- Loss decreases with higher Granularity (e.g., 3.008 at Granularity 1 → 2.118 at Granularity 16).
- FLOPs correlate with loss: Higher FLOPs (e.g., 3e+19) show higher loss (3.008) compared to lower FLOPs (1e+18, 2.118).
- **Key Data Points**:
- (1, 1e+18, 2.118)
- (16, 3e+19, 3.008)
#### Heatmap
- **Trend**:
- Efficiency Leverage increases with both Activation Ratio and Granularity.
- Highest values (13.3) occur at 0.4% Activation Ratio and Granularity 16.
- **Key Data Points**:
- (100.0%, 2): 1.0
- (0.4%, 16): 13.3
### Key Observations
1. **Inverse Relationship**: Lower Activation Ratios and Granularity correlate with higher loss in both 3D charts.
2. **Efficiency Leverage**: The heatmap shows a strong positive correlation between Activation Ratio and Granularity for efficiency leverage.
3. **Model Scale/FLOPs Impact**: Larger models (higher M/FLOPs) exhibit higher loss, suggesting diminishing returns with scale.
### Interpretation
The data suggests that model efficiency (measured by loss and efficiency leverage) is highly sensitive to Activation Ratio and Granularity. While larger models (higher M/FLOPs) achieve lower loss, they also show reduced efficiency leverage. The heatmap indicates that optimizing Activation Ratio and Granularity could significantly improve efficiency without relying solely on model scale. The shaded areas in the 3D charts highlight variability, implying that model performance is not strictly deterministic but influenced by additional factors (e.g., architecture, training data). The inverse relationship between Activation Ratio and loss in the left chart contrasts with the heatmap’s positive trend, suggesting a trade-off between parameter efficiency and computational cost.
</details>
(a)
IsoFLOPs curves for varying activation ratio and expert granularity.
(b)
Estimated efficiency leverage (EL)
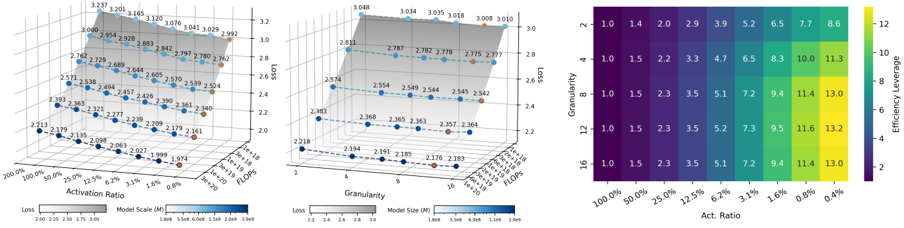
Figure 2 Impact of the MoE architectural configuration on loss and efficiency leverage (EL).
equivalent performance level (e.g., identical validation loss). Our investigation systematically analyzes the influence of key architectural dimensions on EL, including the expert activation ratio, expert granularity, the proportion of shared experts, and others. We then integrate the empirical findings into a unified scaling law that predicts EL as a function of the MoE configuration, offering a practical framework for designing efficient MoEs. This large-scale empirical study, based on over 300 models with up to 28B parameters , reveals several core principles governing MoE efficiency:
1. Activation ratio is the primary driver of efficiency. EL is predominantly determined by the expert activation ratio, following a robust power law: efficiency gains increase as sparsity increases (i.e., as the activation ratio decreases). Illustrated in Figure 2a (left), this relationship remains consistent and quantifiable even at extremely low activation ratios, such as 1/128.
2. Expert granularity acts as a nonlinear modulator. Beyond the dominant activation effect, expert granularity induces a log-polynomial adjustment to EL that is largely independent of the total compute budget, implying a stable optimal range for the number of activated experts. Our experiments identify this optimal range as 8-12, as shown in Figure 2a (right).
3. Compute budget has an amplification effect. Crucially, EL for a given MoE architecture is not fixed; it scales with the training compute budget following another power law. This highlights the substantial potential of MoE in large-scale pretraining: as compute investment increases, the efficiency advantage becomes increasingly pronounced.
4. Other architectural factors have secondary effects. Factors such as the arrangement of shared expert or MoE layers have relatively minor effects. These factors typically admit broadly applicable, near-optimal settings and do not require fine-grained tuning across scenarios.
Combining these insights, we derive a unified EL scaling law that integrates the effects of the compute budget ( C ), activation ratio ( A ), and expert granularity ( G ):
where ˆ A is a saturating transformation of the activation ratio A , as defined in Clark et al. (2022). The exponent α = a + d · log C models the compute-dependent scaling. Here, d > 0 quantifies the amplification of EL at larger compute scales, while a represents the baseline scaling exponent. The parameters β and γ define the log-polynomial modulation from expert granularity G , capturing the observed optimal range. We fit Eq. 1 using Huber loss and BFGS optimization (Hoffmann et al., 2022), and experimentally validated the scaling on Ling-mini-2.0 . As an example, Figure 2b presents the predicted EL landscape at 1 e 22 FLOPs, highlighting the optimal architectural region.
<details>
<summary>Image 4 Details</summary>
### Visual Description
## Line Chart: Data Scale vs Model Scale Comparison
### Overview
The image presents a comparative analysis of two experimental approaches across data and model scales. It features two distinct data series (Traditional Experimental Setting and Ling Scaling Laws based Experiment Group) plotted against logarithmic axes, with specific scaling annotations and target regions highlighted.
### Components/Axes
- **Vertical Axis (Data Scale)**:
- Logarithmic scale from 10B (10^10) to 25T (2.5×10^13)
- Red arrow labeled "Scaling 100x" spans from 10B to 1T
- Tick marks at 10B, 20B, 50B, 100B, 200B, 400B, 1T, 2T, 3.2T, 4T, 25T
- **Horizontal Axis (Model Scale)**:
- Logarithmic scale from 0.5B (5×10^8) to 128B (1.28×10^11)
- Red arrow labeled "Scaling 100x" spans from 0.5B to 50B
- Tick marks at 0.5B, 1B, 2B, 4B, 8B, 16B (Ling-mini), 128B, Ling-1T
- **Legend**:
- Black circles: Traditional Experimental Setting
- Green circles: Ling Scaling Laws based Experiment Group
- **Key Elements**:
- Red box labeled "target" at top-right (25T Data Scale, 128B Model Scale)
- Orange box labeled "valid" at mid-range (400B Data Scale, 8B Model Scale)
- Dotted grid lines for reference
### Detailed Analysis
1. **Traditional Experimental Setting (Black Dots)**:
- Single data point at (8B Model Scale, 400B Data Scale)
- Positioned near the upper-middle of the chart
2. **Ling Scaling Laws Group (Green Dots)**:
- Six data points showing progressive scaling:
- (0.5B, 10B)
- (1B, 20B)
- (2B, 50B)
- (4B, 100B)
- (8B, 200B)
- (16B, 400B)
- Follows a roughly exponential relationship between axes
3. **Scaling Annotations**:
- Vertical scaling arrow (100x) spans 10B→1T (10^10→10^12)
- Horizontal scaling arrow (100x) spans 0.5B→50B (5×10^8→5×10^10)
### Key Observations
1. **Exponential Relationship**: Ling Scaling group demonstrates a clear exponential growth pattern between data and model scales
2. **Performance Gap**: Target (25T, 128B) lies 100x beyond current Ling Scaling capabilities (400B, 16B)
3. **Valid Region**: Orange box at (400B, 8B) aligns with Ling Scaling's highest data point (400B, 16B)
4. **Traditional Limitation**: Single data point suggests limited scalability compared to Ling approach
5. **Diminishing Returns**: Ling Scaling shows increasing efficiency at higher scales (e.g., 16B model handles 400B data)
### Interpretation
The chart illustrates the comparative scalability of two experimental frameworks. The Ling Scaling approach demonstrates superior data handling capacity relative to model size, with each 100x increase in data scale corresponding to approximately 50-100x model scale growth. The "valid" region appears to be where Ling Scaling achieves optimal performance, while the "target" represents an aspirational goal requiring 100x scaling in both dimensions. The Traditional Experimental Setting's single data point suggests it may represent a baseline or control condition, but lacks the scalability demonstrated by the Ling approach. The logarithmic axes emphasize the exponential nature of these scaling relationships, highlighting the challenges in achieving the stated target.
</details>
- (a) Comparison Ling wind tunnel experiments and traditional experimental setting.
<details>
<summary>Image 5 Details</summary>
### Visual Description
## Line Graph: Loss Scaling Curves Comparison
### Overview
The image presents a line graph comparing two loss scaling curves: a "Baseline loss scaling curve" (dashed blue line) and an "Experimental loss scaling curve" (dashed red line). The graph illustrates how loss decreases as computational resources (measured in FLOPs) increase. An inset graph provides a zoomed-in view of the lower FLOPs range (10¹⁸–10²⁰).
---
### Components/Axes
- **X-axis (FLOPs)**: Logarithmic scale from 10¹⁷ to 10²⁵.
- **Y-axis (Loss)**: Linear scale from 1.0 to 3.5.
- **Legend**: Located in the top-right corner, with:
- Dashed blue line labeled "Baseline loss scaling curve."
- Dashed red line labeled "Experimental loss scaling curve."
- **Inset Graph**: Positioned in the bottom-right corner, with:
- X-axis: 10¹⁸ to 10²⁰ (logarithmic).
- Y-axis: 1.0 to 1.3 (linear).
- Dashed lines mirroring the main graph's curves.
---
### Detailed Analysis
1. **Main Graph Trends**:
- Both curves exhibit a **negative slope**, indicating loss decreases as FLOPs increase.
- The **Experimental curve (red)** starts slightly above the Baseline (blue) at lower FLOPs (10¹⁷–10²⁰) but **crosses below** the Baseline curve around 10²² FLOPs.
- At the highest FLOPs (10²⁴–10²⁵), the Experimental curve achieves a loss of ~1.0, while the Baseline remains ~1.2.
2. **Inset Graph**:
- Focuses on the range 10¹⁸–10²⁰ FLOPs.
- The Experimental curve (red) begins at ~1.25 loss at 10¹⁸ FLOPs and declines to ~1.1 at 10²⁰ FLOPs.
- The Baseline curve (blue) starts at ~1.2 and declines to ~1.1 over the same range.
3. **Data Points**:
- **Crossover Point**: Experimental curve overtakes Baseline at ~10²² FLOPs (main graph).
- **Inset Data**: Experimental curve consistently outperforms Baseline in the 10¹⁸–10²⁰ FLOPs range.
---
### Key Observations
- The Experimental curve demonstrates **superior scalability** at higher FLOPs, achieving lower loss than the Baseline.
- The Baseline curve shows diminishing returns at higher FLOPs, with loss plateauing near 1.2.
- The inset highlights that the Experimental curve’s advantage becomes significant only at very high FLOPs (10²²+).
---
### Interpretation
The data suggests that the Experimental method is **more computationally efficient** than the Baseline for large-scale computations. While both approaches converge at lower FLOPs, the Experimental curve’s steeper decline implies better optimization for high-resource scenarios. This could inform decisions in resource-constrained environments, where prioritizing the Experimental method may yield better performance despite higher initial costs. The crossover point (~10²² FLOPs) marks a critical threshold where the Experimental approach becomes advantageous.
</details>
(b)
FLOPs
Loss scaling curves derived by Ling wind tunnel experiments.
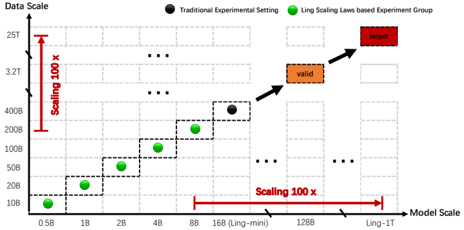
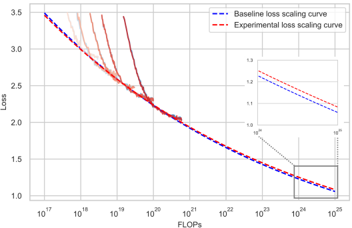
Figure 3 Illustration of the Ling Wind Tunnel's experimental design (a) and an example analysis (b).
Based on these results, all Ling 2.0 models adopt a high-sparsity, fine-granularity design: 256 routing experts with 8 activated per token plus one shared expert, yielding a 3.5% overall activation ratio. The Ling scaling law predicts over 7× efficiency leverage for this architectural configuration, which we empirically confirm on the Ling 2.0 series.
## 2.3.3 Ling Wind Tunnel Experiments for Efficient Innovation
The Ling Scaling Laws not only dictate the specific training and architectural parameters but, more importantly, guide the experimental and iterative paradigm of the Ling project with longtermism. To facilitate efficient innovation at minimal cost, we design the 'Ling Wind Tunnel Experiments' system based on these scaling laws.
As depicted by the green points in Figure 3a, this system comprises five experiments with models ranging from 500M to 8B parameters, whose sizes are distributed according to a power law. The entire experimental process is highly standardized: 1) Model Architecture : The specific architecture and size of each model are determined by the 'scaling Laws for MoE architectural efficiency' in Secation 2.3.2. 2) Training Resources : Each model is trained to a FLOPs count corresponding to its optimal compute allocation. The specific number of training tokens are determined by the 'scaling laws for optimal model-data allocation' (Section 2.3.1, Figure 1b). 3) Training Hyperparameters : The core training hyperparameters (i.e., learning rate and batch size) are set according to the target FLOPs, based on the 'scaling laws for optimal hyperparameters' (Section 2.3.1, Figure 1a). Our experiments demonstrate that by strictly adhering to these scaling laws for hyperparameters and data allocation, we can reduce training uncertainty and accurately predict the final training loss to within an error of 0.01. This allows the Ling Wind Tunnel system to provide automated and standardized experimental judgments, enabling us to fairly evaluate the scaling capability of any given feature. As an example shown in Figure 3b, the wind tunnel results clearly illustrate the loss difference of a candidate feature relative to the baseline across various compute budget. This provided the empirical evidence for our decisions in training the 1T foundation model. Consequently, we employ this system to identify design elements that perform well at massive scales and then extrapolate these findings 100x to guide the design of Ling-1T .
Compared to traditional ablation studies (e.g., training a single Ling-mini-2.0 model on 400B tokens, shown as the black point in Figure 3a), the Ling Wind Tunnel is more cost-effective. Despite involving more individual runs, its overall computational cost is merely 35% of the traditional method. More importantly, it enables us to precisely assess the scaling potential of a technology. The
conclusions drawn from these multi-scale observations are significantly more stable and reliable than those derived from a single experimental 'slice.' This methodology profoundly reflects our design philosophy for developing trillion-scale foundation models.
## 3 Pre-training
In this section, we will present two key components of pre-training: data and recipe, separately.
## 3.1 Pre-training Data
During the preparation of the pre-training data for Ling 2.0 models, we primarily focus on building an efficient data processing infrastructure and curating corpus that broadly covers high-quality universal data including but not limited general knowledge, code, math, multilingual content etc.
## 3.1.1 General Knowledge Data
Data Cleaning from Raw Sources. LLMs gain general knowledge from large, diverse datasets like web pages, books, papers, and Wikipedia (Soldaini et al., 2024), which often suffer quality issues. We created specialized cleaning pipelines combining rules and models tailored per data type. For web data, we extract content using the trafilatura parser 2 and apply sampling-based checks to identify common low-quality patterns. Targeted cleaning removes ads, embedded URLs, symbol-heavy texts, fixes Markdown and table parsing. HTML/PDF parsers are continuously improved to enhance extraction accuracy.
Detection and Remediation of New Low-Quality Data. Iterative sampling reveals new lowquality data, addressed with an automated detection and rule-generation pipeline involving: 1) Multi-channel Recall: Using classifiers, lightweight LLM scoring, and perplexity (PPL) to flag suspect samples; 2) Issue Analysis: LLMs categorize issues as known or new rule cases; 3) Rule Generation: LLMs create cleaning rules based on issue context and a quality-issue database; 4) Rule Generalization: Grouping similar cases for LLM-driven abstraction to broaden rule applicability. New rules undergo human review before integration, speeding detection and remediation.
High-Quality Filtering and Knowledge Text Rewriting. Despite cleaning, datasets remain massive. To improve training, we develop High-Quality Filtering pipeline. Inspired by FineWeb-Edu (Penedo et al., 2024), we train feature models by data type (e.g., Chinese/English web, books, papers) to assess quality, education level, knowledge density, and domain. Iterative experiments identify optimal subsets; for instance, our English web subset is 5× larger than FineWeb-Edu and outperforms it on knowledge benchmarks. Models struggle with complex or rare knowledge in raw text. We use recall-rewrite: (i) select candidate texts by knowledge density, STEM domain, and QA features; (ii) apply semi-synthetic rewriting like Wikipedia-style structure, QA conversion, and concise summaries. Ablation experiments show consistent gains on MMLU (Hendrycks et al., 2021a), CMMLU (Li et al., 2024a), and CEval (Huang et al., 2023) benchmarks.
## 3.1.2 Reasoning Data
Weaimto endow Ling 2.0 with powerful general reasoning capabilities, which primarily encompass programming and mathematical skills. To this end, we optimize our reasoning data from multiple perspectives, including scale, diversity, and quality.
2 https://trafilatura.readthedocs.io/en/latest/
<details>
<summary>Image 6 Details</summary>
### Visual Description
## Line Graphs: Model Performance vs. Token Count
### Overview
The image contains three line graphs comparing the performance of different AI models across tasks as token count increases. Each graph tracks "Score" on the y-axis against "Token (B)" on the x-axis, with distinct data series represented by colored lines and legends.
---
### Components/Axes
1. **Graph 1: "average"**
- **X-axis**: Token (B) (0–2000)
- **Y-axis**: Score (0–40)
- **Legend**:
- Red: Ling-coder-1B
- Blue dashed: Qwen2.5-Coder-1.5B-Base
- Green dashed: Qwen3-1.7B-Base
2. **Graph 2: "average"**
- **X-axis**: Token (B) (2047–3547)
- **Y-axis**: Score (30–47.5)
- **Legend**:
- Red: Ling-math-1B
- Blue dashed: Qwen2.5-Math-1.5B
- Green dashed: Qwen3-1.7B
3. **Graph 3: "average"**
- **X-axis**: Token (B) (0–300)
- **Y-axis**: Score (2–18)
- **Legend**:
- Blue: Finemath-3plus
- Orange: Nemotron-3plus
- Green: Inf-mm-webmath
- Red: Megamath-web
- Purple: Ling-math-web
---
### Detailed Analysis
#### Graph 1: Ling-coder-1B vs. Qwen Models
- **Ling-coder-1B (Red)**: Starts at ~5, rises sharply to ~40 by 2000 tokens, with fluctuations.
- **Qwen2.5-Coder-1.5B-Base (Blue dashed)**: Flat line at ~35.
- **Qwen3-1.7B-Base (Green dashed)**: Flat line at ~35.
#### Graph 2: Ling-math-1B vs. Qwen Math Models
- **Ling-math-1B (Red)**: Starts at ~30, rises to ~47.5 by 3547 tokens, with volatility.
- **Qwen2.5-Math-1.5B (Blue dashed)**: Flat line at ~42.5.
- **Qwen3-1.7B (Green dashed)**: Flat line at ~42.5.
#### Graph 3: Math/Web Math Models
- **Finemath-3plus (Blue)**: Starts at ~4, peaks at ~11 by 300 tokens.
- **Nemotron-3plus (Orange)**: Starts at ~3, peaks at ~9 by 300 tokens.
- **Inf-mm-webmath (Green)**: Starts at ~2, peaks at ~8 by 300 tokens.
- **Megamath-web (Red)**: Starts at ~2, peaks at ~5 by 300 tokens.
- **Ling-math-web (Purple)**: Starts at ~5, peaks at ~17 by 300 tokens.
---
### Key Observations
1. **Ling Models Dominance**:
- Ling-coder-1B and Ling-math-1B consistently outperform Qwen models in their respective graphs, suggesting superior scalability or optimization.
- Ling-math-web (purple) in Graph 3 shows the steepest growth, surpassing all other models.
2. **Qwen Model Stagnation**:
- Qwen2.5 and Qwen3 models in Graphs 1–2 remain flat, indicating no improvement with increased tokens (possibly base models without fine-tuning).
3. **Task-Specific Performance**:
- Graph 3 reveals divergent trends: Finemath-3plus and Nemotron-3plus perform better in math tasks, while Ling-math-web excels in web math.
---
### Interpretation
- **Scalability Insights**: Ling models demonstrate strong token efficiency, likely due to specialized training (e.g., code/math tasks). Qwen models’ flat lines suggest they are static base models.
- **Task Optimization**: Ling-math-web’s rapid improvement in Graph 3 highlights its effectiveness in web math, outperforming generalist models like Finemath-3plus.
- **Anomalies**: The abrupt rise in Ling-coder-1B (Graph 1) and Ling-math-1B (Graph 2) may indicate task-specific breakthroughs or dataset biases.
This analysis underscores the importance of model architecture and training focus in achieving token-efficient performance across domains.
</details>
- 17.5 livecodebench\_v6 (a) Overall performance of Ling Code Corpus on 1B models.
15.0
12.5
50 40 Figure 4 Performance of Ling Code Corpus (a) and Ling Math Corpus (b, c).
## 7.5 10.0 Score 3.1.2.1 Ling Code Corpus
bigcodebench
Ling-coder-1B
Qwen2.5-Coder-1.5B-Bas
Qwen3-1.7B-Base
Token (B)
humaneval\_plus
Ling-coder-1B
Qwen2.5-Coder-1.5B-Bas
Qwen3-1.7B-Base
Token (B)
- multiple 70 (c) Comparison of Ling Math Corpus with open-source mathematical web data.
0 500 1000 1500 2000 Token (B) 0.0 2.5 5.0 Ling-coder-1B Qwen2.5-Coder-1.5B-Base Qwen3-1.7B-Base 0 500 1000 1500 2000 Token (B) 0 10 20 Ling-coder-1B Qwen2.5-Coder-1.5B-Base Qwen3-1.7B-Base 0 500 1000 1500 2000 Token (B) 10 20 Ling-coder-1B Qwen2.5-Coder-1.5B-Base Qwen3-1.7B-Base 0 500 10 20 To support the training of high-performance coding-oriented LLMs, we constructed a diverse, large-scale, and quality-stratified Ling Code Corpus that integrates multiple data sources, covering source code, code-related natural language data, and synthetic instructional data. Our curation pipeline emphasizes both breadth of programming language and domain coverage, and the depth of quality control.
We collected raw source code from Github repositories. We use multilingual fine-grained cleaning rules tailored to the syntax and conventions of each language. We apply Lint-based 3 syntactic validation to remove files with compilation or structural errors. This yields our source code corpus covering 660 programming languages. We further conduct 1) quality stratification according to code style/readability, norm adherence, and complexity/difficulty; 2) code rephrasing and paraphrasing techniques, to generate additional high quality augmented code data. In addition to github repositories, we 1) reconstructed commit data from GHArchive 4 by replaying event sequences (e.g., pull requests, issues, merges) at the repository level; 2) iteratively optimize our code-oriented htmlparsers and cleaning operators to curate code-related pages, tutorials, developers' discussions from Common Crawl and Web; 3) curated a large collection of programming-competition data consist of problem statements from diverse platforms, user submissions, and related user discussions and commentary threads.
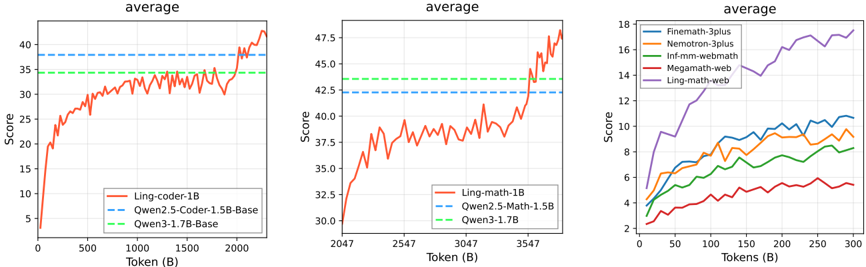
Evaluating the Ling Code Corpus. We designed a lightweight verification strategy, i.e., training small-sized coding models (e.g., 1B size) from scratch to measure the performance of our code data. Experiments show that from-scratch training on single-type code data provides a reliable proxy for full-scale performance. This finding enables efficient early-stage validation of architecture and training recipes before scaling to tens or hundreds of billions of parameters. We show our results on 1B models (Ling-coder-1B) compared with Qwen2.5-Coder-1.5B-Base (Hui et al., 2024) and Qwen3-1.7B-Base (Yang et al., 2025a) in Figure 4a. The results are promising that we have equivalent or even better results on mainstream benchmarks compared with Qwen2.5-Coder-1.5B-Base. This is achieved by consuming only 2T tokens of our code data from scratch, with an additional 300B anealing phase. More details can be found in Appendix B.1.1
3 https://en.wikipedia.org/wiki/Lint\_(software)
4 https://www.gharchive.org/
Score
Score
- mbpp\_plus 50 (b) Overall performance of Ling Math Corpus on 1B models.
Score
## 3.1.2.2 Ling Math Corpus
To train Ling 2.0 models of varying scales, we assembled a mathematics corpus drawn from web pages, textbooks, research papers, code repositories, problem banks, and synthetic sources. A multistage processing pipeline-comprising parsing, recall, filtering, rewriting, and synthesis-was designed to curate this corpus.
We iteratively improved the PDF and HTML parser to ensure the completeness of mathematical content. We build fastText classifiers to recall math data from a huge candidate pool. We then fine-tune small language models to develop LLM-Filter and LLM-Refiner that can filter and refine data that contain mathematical knowledge or step-by-step problem solving process. In addition, we employ synthetic data generation to create a diverse range of mathematical question-answer (Q&A) pairs, varying in difficulty and incorporating step-by-step reasoning processes. This includes 1) Q&Apairs extraction from web and book; 2) development of a sophisticated question generator for high quality and realistic mathematical problems; 3) the build of a large-scale mathematical concept graph (Chen et al., 2025) to extend the knowledge boundaries of our model.
Evaluating the Ling Math Corpus. To empirically validate the efficacy of our mathematical corpus, we use a continual-training then annealing strategy with only math corpus on a pre-trained Ling-coder-1B model introduced in Section 3.1.2.1 for over 1.8T tokens, in which the last 300B is used for annealing training. Due to the space limit, we only present the performance results on the average value of benchmarks. As shown in Figure 4b, the resulting Ling-math-1B model exhibited performance superior to the competitive Qwen2.5-Math-1.5B-Base (Yang et al., 2024b) and Qwen31.7B-Base (Yang et al., 2025a) on mainstream mathematical benchmarks (e.g. GSM8K (Cobbe et al., 2021), MATH (Hendrycks et al., 2021b), CollegeMath (Tang et al., 2024), OlympiadBench (He et al., 2024a), CMATH (Wei et al., 2023), MathBench (Liu et al., 2024) etc. ).
Furthermore, a specific comparative analysis was conducted to evaluate the contribution of our curated mathematical web data. Using the same 1B-model training paradigm, we benchmarked our proprietary web data against a suite of well-regarded open-source datasets, namely Infi-mmmath (Han et al., 2024), finemath-3plus (Allal et al., 2025), megamath (Zhou et al., 2025), and nemotron-cc (Mahabadi et al., 2025). The Ling-math-web-1B model trained on our web data demonstrated a markedly superior performance shown in Figure 4c. This finding validates the effectiveness of our specialized web data acquisition and refinement pipeline, a critical factor contributing to the high quality of our pre-training data (detailed in Appendix B.1.2).
## 3.1.3 Multilingual Data
To enhance multilingual capabilities, we expand the tokenizer vocabulary from 128K in Ling 1.5 to 156K, with targeted additions of multilingual tokens. For multilingual corpus, we curate approximately 2TB of high-quality multilingual data from open web sources and parallel corpora. The data undergoes rigorous preprocessing, including language identification, filtering, cleaning, and deduplication, to ensure linguistic diversity and data integrity. The corpus spans a broad range of about 30 languages and diverse domains, including web text, code, mathematics, Wikipedia, and parallel sentence pairs, supporting robust cross-lingual understanding. Furthermore, multilingual data constitutes 4% of the total pre-training data. Through experimentation, we determined an optimal distribution that significantly improves minor language performance while maintaining Chinese and English capabilities. Our findings indicate that data from Romance and Germanic languages have less negative impact on core languages, whereas data from certain other language families requires more careful balancing. More details can be found in Appendix B.2.
## 3.1.4 Long-Context Data
To build long-context ability we implement a retrieve-synthesize-validate pipeline over heterogeneous sources (web pages, books/novels, scientific articles, software docs, etc.). Quality controls include:
- Linguistic hygiene : Combination of rule checking and model recognition to identify and repair issues such as paragraph duplication, language mixing, and content truncation.
- Semantic consistency checks : Using model-aided detection and a small amount of manual observation to detect logical contradictions within the text to filter data, and optimize relevant recall/synthesis logic.
- Long-range quality scoring : We eliminate low-quality long text content using the PPL gap between long- and short-window evaluations, combined with auxiliary scores.
This pipeline yields ~1.2 T high-quality long-text tokens.
## 3.1.5 Data Infrastructure
Training large-scale language models presents major challenges in data infrastructure efficiency, scalability, and governance. To tackle issues like inefficient collaboration, opaque lineage, and slow iteration, we built a next-generation infrastructure based on two core principles: Data-as-Code and a Unified Data Lakehouse .
Data-as-Code: Automating CI/CD workflows. We codify the entire data pipeline and manage it via version control (e.g., Git) to enable automated, reproducible workflows. This aligns with top MLplatforms that standardize workflows through code-driven orchestration (Baylor et al., 2017). We developed a unified AIDataOps library with 50+ data operators across modalities, integrated into an automated CI/CD system. Benefits include transparent, traceable end-to-end data lineage and fully automated feature development, cutting R&D iteration cycles from months to days.
Unified Data Lakehouse and Wide-Table Architecture. To overcome data silos from hundreds of scattered datasets, we implemented a unified lakehouse (Zaharia et al., 2021) with a wide logical table aggregating major domains like web pages and code. This central hub simplifies discovery and analysis, supports elastic scalability without full-table rebuilds, and achieves over 20 TB/hour I/O throughput, removing data processing bottlenecks for large-scale training.
Combining these principles, we created a powerful data engine essential for building the Ling 2.0 corpus. This enabled constructing a trillion-record web-wide table and processing 30 billion trainable data points in two days, accelerating model development and enabling complex future data exploration. More information can be found in Appendix B.3
## 3.2 Pre-training Recipe
Ling 2.0 pre-training adopts a multi-stage strategy with stage-tailored data mixes, and uses a WSM(warmup-stable-merge) scheduler (Tian et al., 2025b) that replaces LR decay with checkpoint merging for greater flexibility and effectiveness. Next, we detail the training recipe of Ling 2.0.
## 3.2.1 Hyper-Parameters
Model Hyper-Parameters. Based on a deep analysis of scaling laws in Section 2.3.2, Ling 2.0 employs a high-sparsity, fine-grained MoE architecture. Each MoE layer comprises one shared and 256 routed experts, activating 8 experts per token. For stability, the first several layers are dense
Figure 5 Pre-training and mid-training stages of Ling 2.0. We adopt a multi-stage training strategy that progressively expands the context window from 4K to 128K and introduces reasoning and CoT data in advance to pre-activate the model's reasoning ability.
<details>
<summary>Image 7 Details</summary>
### Visual Description
## Flowchart: Model Training Data Composition and Evolution
### Overview
The image depicts a two-phase model training pipeline with data composition changes across stages. It shows percentage distributions of data types (General, Reasoning, Context, CoT) and absolute data sizes (10T, 150B, 600B) across four key substages.
### Components/Axes
- **Main Sections**:
- **Pre-Training (4K)**: Left-side blue boxes
- **Mid-Training (32K)**: Right-side orange/red boxes
- **Substages**:
1. Pre-Training Substage 1 (68% General, 32% Reasoning)
2. Pre-Training Substage 2 (54% General, 46% Reasoning)
3. Long Context Extension (54% General, 46% Reasoning + 150B Context Data)
4. Reasoning Pre-Activation (55% General, 45% Reasoning + 600B CoT Data)
- **Data Size Labels**:
- 10T (10 trillion)
- 150B (150 billion)
- 600B (600 billion)
- **Color Coding**:
- Blue: Pre-Training
- Orange: Long Context Extension
- Red: Reasoning Pre-Activation
### Detailed Analysis
1. **Pre-Training Phase**:
- Substage 1: Dominated by General Data (68%) with Reasoning Data at 32% (10T total)
- Substage 2: Balanced shift to 54% General and 46% Reasoning (10T total)
- *Trend*: Gradual increase in Reasoning Data proportion
2. **Mid-Training Phase**:
- Long Context Extension: Maintains 54% General/46% Reasoning ratio but adds 150B Long Context Data
- Reasoning Pre-Activation: Slightly more Reasoning (45%) than General (55%) with 600B CoT Data
- *Trend*: Increased focus on specialized Reasoning data and context
### Key Observations
- **Data Size Progression**:
- Pre-Training: 10T total data
- Mid-Training: 150B + 600B = 750B additional data
- **Reasoning Data Growth**:
- Pre-Training: 32% → 46%
- Mid-Training: 46% → 45% (with CoT specialization)
- **General Data Stability**:
- Maintains ~54-55% across Mid-Training phases despite increased specialization
### Interpretation
This pipeline demonstrates a strategic shift from broad pre-training to specialized mid-training:
1. **Pre-Training**: Establishes foundational knowledge with general data dominance
2. **Mid-Training**:
- **Long Context Extension**: Enhances model's ability to handle extended reasoning chains
- **Reasoning Pre-Activation**: Focuses on chain-of-thought capabilities with massive CoT data
3. **Data Composition**: Maintains general data as a baseline while progressively increasing reasoning specialization
4. **Scale**: Shows 75x increase in data size from Pre-Training (10T) to Mid-Training (750B additional)
The progression suggests a deliberate architectural choice to balance general knowledge with specialized reasoning capabilities, using increasingly complex data types and sizes across training phases.
</details>
layers. The attention head dimension is fixed at 128 across all model sizes. We use Multi-Token Prediction (MTP) with depth 1. All parameters are randomly initialized with standard deviation 0.006. Other architectural parameters scale with model size; see Table 1 for details.
Training Hyper-Parameters. We use AdamW (Loshchilov and Hutter, 2017) with β 1 = 0.9, β 2 = 0.95, weight decay 0.1, and gradient-norm clipping 1.0. Pre-training uses a 4K context window for the first 20T tokens, followed by 150B tokens with 32K contexts. We set the bias-update rate γ = 0.001 for the auxiliary-loss-free load-balancing term and an MTP loss weight of 0.1. After context extension, the bias-update rate is set to 0.0001 for the rest of training. Guided by the Ling scaling laws in Section 2.3.1, we determined the learning rate and batch size for Ling 2.0 and summarize them in Table 1. For the batch size, we apply a batch-size ramp for the first ≈ 500B tokens (e.g., from 3,024 to the peak), then keep it in the remaining training. For the learning rate, we use the novel WSM(warmup-stable-merge) scheduler: linear warmup for the first 2,000 steps to a peak LR, then constant LR until training ends; the final 'annealing' is achieved by checkpoint merging instead of LR decay (see Section 3.2.3 for details).
## 3.2.2 Multi-Stage Training
Ling 2.0 adopts a multi-stage pretraining strategy comprising: (1) general pre-training on a largescale general corpus; and (2) mid-training on a medium-scale, task-specific corpus.
## 3.2.2.1 Pre-training
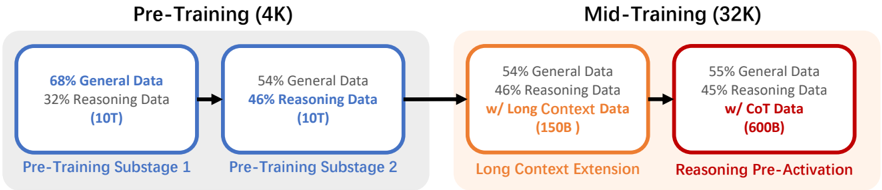
In the general pre-training stage, Ling 2.0 consumes massive amounts of data to ensure robust overall capability. As Figure 5 depicts, this stage proceeds with a context length of 4K and consists of two sub-stages, each comprising 10T tokens. Across these two progressive sub-stages, we increase the proportion of reasoning data (including mathematics and code) from 32% to 46%. Correspondingly, the proportion of general data (e.g., web pages) is reduced from 68% to 54%. Simultaneously, we enhance corpus quality and implement more stringent data decontamination. The high proportion of reasoning data in pre-training lays a solid foundation for activating and enhancing the model's reasoning abilities, making Ling a model with inherent strengths in reasoning.
## 3.2.2.2 Mid-training
After general pretraining, we perform a mid-training stage to extend the context length to 128K and pre-activate the model's reasoning ability by introducing chain-of-thought (CoT) data.
Long Context Extension. During the first 150B tokens of mid-training, we sample 20% 32Klength long-text sequences, maintaining a data mixture similar to the previous stage. This process
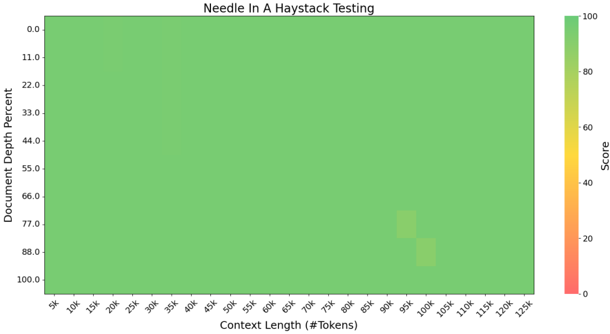
expands the model's effective context window from 4K to 32K. Throughout this process, the model's performance on short-context benchmarks remains stable, while its performance on longcontext benchmarks (e.g., L-Eval (An et al., 2023), LongBench (Bai et al., 2023)) shows continuous improvement. Using the YaRN (Peng et al., 2023) method, we extend Ling's context window to 128K. As Figure 6 shows, after supervised fine-tuning, Ling-mini-2.0 demonstrates strong performance on the Needle in a Haystack (NIAH) test at a 128K context length.
Score
Figure 6 Evaluation results on the 'Needle In A Haystack' (NIAH) tests. Following supervised fine-tuning, Ling-mini-2.0 performs well across all context window lengths up to 128K.
<details>
<summary>Image 8 Details</summary>
### Visual Description
## Heatmap: Needle In A Haystack Testing
### Overview
The image displays a heatmap visualizing performance scores across two dimensions: **Context Length (# Tokens)** and **Document Depth Percent**. The color intensity represents scores from 0 (red) to 100 (green), with most of the heatmap dominated by green, indicating high scores. Two distinct yellow/orange regions appear in the lower-right corner, suggesting localized performance drops.
---
### Components/Axes
- **X-Axis (Horizontal):**
- Label: `Context Length (# Tokens)`
- Scale: 5k to 125k tokens, incrementing by 5k.
- Position: Bottom of the chart.
- **Y-Axis (Vertical):**
- Label: `Document Depth Percent`
- Scale: 0.0% to 100%, incrementing by 11%.
- Position: Left side of the chart.
- **Legend:**
- Color bar on the right, labeled `Score` with a gradient from red (0) to green (100).
- Position: Right edge of the chart.
---
### Detailed Analysis
- **General Trends:**
- The heatmap is predominantly green (score ~80–100), indicating strong performance across most context lengths and document depths.
- Two yellow squares (~score 40–60) and one orange square (~score 20–40) are located in the lower-right quadrant:
- **Yellow squares:**
- X: ~100k tokens
- Y: ~77% and ~88% document depth.
- **Orange square:**
- X: ~100k tokens
- Y: ~88% document depth.
- **Spatial Grounding:**
- The yellow/orange regions are clustered near the intersection of high context length (100k tokens) and high document depth (77–88%).
- No other regions show significant deviation from green.
---
### Key Observations
1. **High Performance Dominance:**
- 95%+ of the heatmap shows scores ≥80, suggesting robust performance in most scenarios.
2. **Localized Performance Drops:**
- At **100k tokens** and **77–88% document depth**, scores drop to 40–60 (yellow) and 20–40 (orange).
- These anomalies are the only regions with scores <80.
3. **Color Consistency:**
- All data points align with the legend: darker green = higher scores, lighter green/yellow/orange = lower scores.
---
### Interpretation
- **What the Data Suggests:**
- The model performs exceptionally well in most cases, but struggles specifically when processing **long contexts (100k tokens)** and **deep document layers (77–88% depth)**.
- The orange/yellow regions may indicate computational bottlenecks, attention mechanism limitations, or data sparsity in those regions.
- **Why It Matters:**
- The anomalies highlight edge cases where the model’s "needle-in-a-haystack" capability degrades, potentially due to:
- **Context Length:** Longer sequences may overwhelm attention mechanisms.
- **Document Depth:** Deeper layers might obscure relevant information or increase noise.
- **Notable Anomalies:**
- The orange square at (100k tokens, 88% depth) represents the lowest score (~20–40), suggesting a critical failure point.
- The absence of similar drops in other regions implies these are not systemic issues but context-specific.
- **Peircean Insight:**
- The model’s performance is not uniformly strong—it excels in "shallow" or "short" scenarios but falters under extreme conditions. This aligns with known challenges in transformer-based models handling long sequences.
</details>
Reasoning Ability Pre-Activation. In the following 600B tokens of mid-training, we maintain a high proportion of reasoning data and introduce additional high-quality chain-of-thought (CoT) corpora. We continue training on this high-quality data at a higher learning rate and achieve robust performance by merging mid-training checkpoints. We find that the early introduction of CoT data during the latter pretraining phase effectively 'pre-activates' the model's reasoning capabilities. This provides a higher ceiling for reasoning performance and a more stable foundation for subsequent fine-tuning and reinforcement learning stages. We further demonstrate the efficacy of this strategy in enhancing the model's reasoning abilities in Section 3.3.2.
## 3.2.3 WSMScheduler
Learning-rate (LR) decay has long been viewed as essential for effective LLM mid-training, but it restricts flexibility and increases tuning overhead. To enable a more flexible and effective process, the Ling 2.0 series adopts the novel WSM (warmup-stable-merge) scheduler (Tian et al., 2025b), which replaces LR decay with checkpoint merging and delivers superior performance.
Theoretical Connection Between LR Decay and Checkpoint Merging. We first establish the theoretical equivalence between checkpoint merging and LR decay. The merging process combines a sequence of checkpoints, [ θ n , θ n + 1 , . . . , θ n + k ] , into a single model, ˆ θ n + k , via a weighted average. For analytical tractability, we assume the gradient updates between checkpoints are independent. By re-expressing each checkpoint θ n + j in terms of a base checkpoint θ n and the subsequent gradient updates ( g ), the derivation shows that the merging operation is mathematically equivalent to re-weighting the past gradients accumulated after the base checkpoint:
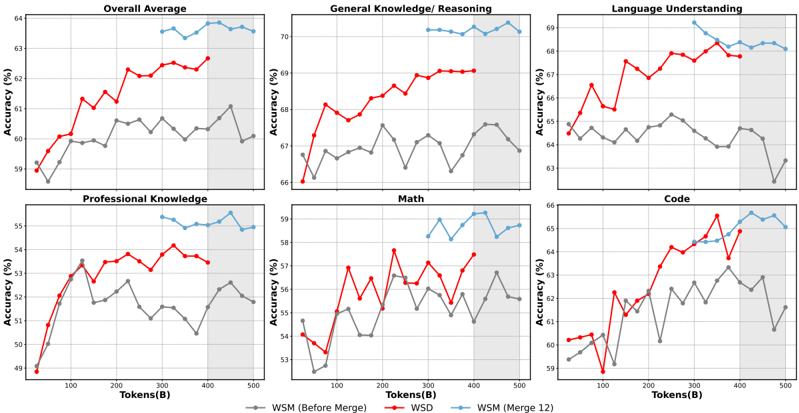
Figure 7 Comprehensive performance comparison between our WSM scheduler (via checkpoint merging) and standard WSDscheduler (via LR decay). Both approaches are initialized from the same pre-trained checkpoint. Notably, while WSDrequires predetermined decay strategy (e.g., decay over 400B tokens in this study), WSM eliminates such constraints, enabling seamless training continuation (gray regions) and flexible decay behavior approximation.
<details>
<summary>Image 9 Details</summary>
### Visual Description
## Line Graphs: Accuracy Comparison Across Categories
### Overview
The image contains six line graphs comparing accuracy percentages across different categories (Overall Average, General Knowledge/Reasoning, Language Understanding, Professional Knowledge, Math, Code). Each graph tracks two data series: "WSM (Before Merge)" (gray line) and "WSD (Merge 12)" (red line) against token counts (100–500B). The graphs show trends in performance metrics, with notable fluctuations and convergence patterns.
---
### Components/Axes
- **X-Axis**: Tokens (B) with markers at 100, 200, 300, 400, 500.
- **Y-Axis**: Accuracy (%) ranging from 49% to 64%.
- **Legends**:
- Gray line: "WSM (Before Merge)"
- Red line: "WSD (Merge 12)"
- **Graph Titles**:
- Overall Average
- General Knowledge/Reasoning
- Language Understanding
- Professional Knowledge
- Math
- Code
---
### Detailed Analysis
#### Overall Average
- **WSM (Before Merge)**: Starts at ~50%, fluctuates between ~50–60%, peaks at ~60% at 400B tokens, then drops to ~59% at 500B.
- **WSD (Merge 12)**: Starts at ~50%, rises steadily to ~63% at 400B, then dips slightly to ~62% at 500B.
#### General Knowledge/Reasoning
- **WSM (Before Merge)**: Begins at ~56%, fluctuates between ~55–60%, peaks at ~60% at 400B, then drops to ~59% at 500B.
- **WSD (Merge 12)**: Starts at ~66%, rises to ~69% at 300B, dips to ~67% at 400B, then stabilizes at ~68% at 500B.
#### Language Understanding
- **WSM (Before Merge)**: Starts at ~63%, fluctuates between ~62–65%, peaks at ~65% at 300B, then drops to ~63% at 500B.
- **WSD (Merge 12)**: Begins at ~66%, rises to ~69% at 300B, dips to ~68% at 400B, then stabilizes at ~68% at 500B.
#### Professional Knowledge
- **WSM (Before Merge)**: Starts at ~49%, rises to ~53% at 300B, dips to ~51% at 400B, then recovers to ~52% at 500B.
- **WSD (Merge 12)**: Begins at ~50%, rises to ~54% at 300B, dips to ~53% at 400B, then stabilizes at ~54% at 500B.
#### Math
- **WSM (Before Merge)**: Starts at ~53%, fluctuates between ~52–57%, peaks at ~57% at 300B, then drops to ~55% at 500B.
- **WSD (Merge 12)**: Begins at ~54%, rises to ~58% at 300B, dips to ~57% at 400B, then stabilizes at ~57% at 500B.
#### Code
- **WSM (Before Merge)**: Starts at ~59%, fluctuates between ~58–63%, peaks at ~63% at 300B, then drops to ~62% at 500B.
- **WSD (Merge 12)**: Begins at ~60%, rises to ~65% at 300B, dips to ~64% at 400B, then stabilizes at ~65% at 500B.
---
### Key Observations
1. **Consistent Improvement**: "WSD (Merge 12)" (red) consistently outperforms "WSM (Before Merge)" (gray) across all categories, with larger gaps in Math and Code.
2. **Fluctuations in WSM**: The gray line shows erratic behavior (e.g., dips below 50% in Professional Knowledge at 100B tokens), suggesting instability pre-merge.
3. **Convergence at High Tokens**: In most categories, the performance gap narrows at 500B tokens, though "WSD" remains superior.
4. **Outliers**:
- Math: WSM dips below 52% at 100B tokens.
- Code: WSD peaks sharply at 300B tokens (~65%).
---
### Interpretation
The data suggests that merging (WSD Merge 12) significantly improves accuracy compared to the pre-merge state (WSM Before Merge). The improvement is most pronounced in Math and Code, where "WSD" achieves ~65% accuracy versus ~63% for "WSM." The fluctuations in "WSM" indicate potential instability or variability in performance before merging, while "WSD" shows more stable gains. The narrowing gap at 500B tokens implies diminishing returns at higher token counts, but "WSD" retains a consistent advantage. This could reflect architectural improvements or optimization benefits from merging.
</details>
Here, the effective gradient weights, wi , are determined by the original checkpoint merge weights, c j . This equivalence demonstrates that checkpoint merging effectively simulates a post-hoc LR decay schedule, achieving an annealing effect without modifying the learning rate during the training phase itself. Conversely, this relationship is invertible. Given a target LR decay schedule, represented by a desired sequence of monotonically non-increasing gradient decay coefficients { wi } k i = 1 (where 1 ≥ w 1 ≥ w 2 ≥ · · · ≥ wk ≥ 0), we can uniquely determine the non-negative checkpoint weights { c j } k j = 0 that satisfy Equation 2:
This establishes a bidirectional conversion between LR decay and checkpoint merging, demonstrating that any LR decay schedule can be replicated through an appropriate merging strategy.
Overall Performance and Heuristic Improvements. Acomprehensive comparison reveals that the proposed WSM scheduler consistently outperforms the strong WSD baseline (Hu et al., 2024) across the majority of evaluated tasks (Figure 7). Specifically, WSM yields an average improvement of +1 to +2 points on leaderboard scores across all benchmark categories. Crucially, WSM requires no prior choices about when to start LR decay or how long the decay phase should last (i.e., the decay data budget), offering greater flexibility and scalability than WSD. Moreover, it produces models with more balanced capability profiles. To validate robustness, we further applied supervised fine-tuning for 5 epochs on checkpoints from both schedulers under identical settings, confirming that WSM's advantage persists beyond post-training. As a practical heuristic to further improve stability, we select the topN checkpoints in the final stage of mid-training based on validation performance and average their parameters. For the final Ling 2.0 model, we set N = 32.
## 3.3 Pre-training Evaluation
To evaluate the pre-training of Ling 2.0, we focus on both the final model's benchmark performance and the performance dynamics throughout pretraining.
## 3.3.1 Evaluation of Pre-training Dynamics
Selecting and Adapting Benchmarks for Pre-training. During pre-training, base models often exhibit limited instruction-following ability, which can lead to misleading evaluations. To mitigate this, we propose a framework for selecting and adapting benchmarks. Specifically, we score candidate benchmarks by (i) their stability over the course of training and (ii) their consistency with post-training performance, quantified via Kendall's rank correlation. Only benchmarks that satisfy both criteria are retained to monitor the base model throughout training. For benchmarks that fail to meet these criteria, we adapt them to improve stability via in-context, light-instruction prompts or fill-in-the-blank formats (Luan et al., 2025).
Optimizing Evaluation Methods During Pre-training. Beyond benchmark design, the evaluation process itself can suffer from instability. We systematically diagnose this instability, attributing it to two distinct sources: parameter instability, arising from training stochasticity, and evaluation instability, caused by noisy measurement protocols. To counteract these issues, we employ a two-pronged approach (Wang et al., 2025). First, we use checkpoint merging to mitigate parameter instability by averaging the weights of recent checkpoints, thereby smoothing the model's trajectory in the parameter space. Second, we adopt the Pass@k metric to address evaluation instability, as it offers a more robust, low-variance statistical estimate of a base model's true capability. Extensive experiments demonstrate that this combined approach yields significantly smoother performance curves, providing a more reliable and faithful lens for observing training dynamics.
## 3.3.2 Evaluation of Ling 2.0 Base Models
Benchmarks and Configurations. The suite spans mathematics, coding, reasoning, knowledge, and multilingual ability. Unless noted, we report EM/Acc or Pass@1 with standardized prompting and decontamination. The evaluation datasets for pre-trained base models includes 33 benchmarks, which are categorized as follows:
- Math Tasks : CMath (Wei et al., 2023) (3-shot, CoT), MATH (Hendrycks et al., 2021b) (0-shot, CoT), CollegeMath (Tang et al., 2024) (4-shot, CoT), MinervaMath (Lewkowycz et al., 2022) (4-shot, CoT), FinanceReasoning (Tang et al., 2025b) (3-shot, CoT), OlympiadBench (He et al., 2024a) (3-shot, CoT), TheoremQA (Chen et al., 2023) (5-shot), OmniMath (Gao et al., 2025) (3-shot, CoT), AIME25 (MAA, 2025) (0-shot, CoT).
- Coding Tasks : HumanEval (Chen et al., 2021) (0-shot), HumanEval-cn (Peng et al., 2024a) (0-shot), HumanEval-Plus (Liu et al., 2023) (0-shot), CruxEval (Gu et al., 2024) (1-shot, CoT), MultiPL-E (Cassano et al., 2023) (0-shot), LiveCodeBench 5 (Jain et al., 2025) (0-shot), BigCodeBench (Zhuo et al., 2025) (0-shot), BIRD-SQL (Li et al., 2023a) (0-shot), CodeCriticBench (Zhang et al., 2025a) (2-shot), CodeForces (Penedo et al., 2025) (0-shot, CoT).
- General Reasoning Tasks : CommonSenseQA (Talmor et al., 2018) (5-shot), WorldSense (Hong et al., 2025) (0-shot), Multi-LogiEval (Patel et al., 2024) (2-shot, CoT), AutoLogi (Zhu et al., 2025) (3-shot, CoT), ProntoQA (Saparov and He, 2023) (1-shot, CoT).
5 LiveCodeBench contains 454 problems released between Aug 2024 and May 2025.
- Knowledge Tasks : ARC (Bhakthavatsalam et al., 2021) (0-shot), MMLU (Hendrycks et al., 2021a) (5-shot), MMLU-Pro (Wang et al., 2024) (5-shot), C-Eval (Huang et al., 2023) (5-shot), CMMLU(Li et al., 2024a) (5-shot).
- Multilingual Tasks : MMMLU 6 (OpenAI, 2024) (0-shot), mARC (Dac Lai et al., 2023) (0-shot), MultiGSM (Shi et al., 2023) (4-shot, CoT), HumanEvalXL (Peng et al., 2024b) (0-shot).
We compare Ling 2.0 base models against the base models of Qwen2.5 (Yang et al., 2024a) and Qwen3 (Yang et al., 2025a) series, as well as other leading open-source models, including Hunyuan7B (Tencent-Hunyuan, 2024), Seed-OSS-36B (ByteDance-Seed, 2025), DeepSeek-V3.1 (DeepSeek-AI, 2024) and Kimi-K2 (Moonshot-AI, 2025).
Evaluation Results. Table 2, 3 and 4 present the evaluation results for the Ling 2.0 base models. All models are evaluated using our unified internal evaluation framework to ensure a fair and consistent comparison. As introduced in Section 3.2.2.2, we specifically compare model versions with and without the integration of high-quality Chain-of-Thought (CoT) data to demonstrate the efficacy of this strategy. The key findings are as follows:
- Verified 7× Efficiency Leverage : Both our Ling-mini-2.0-base , Ling-flash-2.0-base , and Ling-1T-base achieve performance comparable or superior to other state-of-the-art opensource models of similar scale. In particular, Ling-mini-2.0-base and Ling-flash-2.0-base achieve overall performance comparable to the dense Qwen3 8B base and Seed-OSS-36B base, while using less than one-seventh of their non-embedding activated parameters, confirming the 7× efficiency leverage claimed at the outset of Ling 2.0.
- Exceptional Math and Code Capabilities : Notably, the Ling 2.0 series exhibits a significant advantage in mathematics and coding tasks, indicating strong capabilities in structured reasoning, algorithmic thinking, and programming. For example, Ling-1T achieves superior results on benchmarks such as MathBench, CollegeMath, MinervaMath, OmniMath, HumanEval-Plus, CruxEval, MultiPL-E, etc.
- Effective Reasoning Pre-activation via CoT Data : Integrating high-quality CoT data during mid-training effectively 'pre-activates' the models' reasoning abilities. This leads to substantial gains on reasoning-intensive benchmarks like MATH, AIME and LiveCodeBench, while maintaining performance on other benchmarks. Crucially, this pre-activated advantage persists through subsequent SFT and RL phases (as shown in Figure 12), significantly enhancing their effectiveness.
6 MMMLUlanguage coverage may differ across baselines.
Table 2 Comparison among Ling-mini-2.0-base and other representative open-source base models.
| Benchmark | Hunyuan-7B Base | Qwen3-8B Base | Ling-mini-2.0 Base w/o CoT Data | Ling-mini-2.0 Base w/ CoT Data |
|-------------------------|-------------------|-------------------|-----------------------------------|----------------------------------|
| Math | Math | Math | Math | Math |
| CMath (Acc.) | 92.26 | 88.16 | 92.81 | 92.08 |
| MathBench (Acc.) | 73.19 | 74.21 | 76.01 | 76.06 |
| CollegeMath (Acc.) | 70.62 | 66.00 | 69.84 | 72.50 |
| OlympiadBench (Acc.) | 20.44 | 22.22 | 23.85 | 24.30 |
| TheoremQA (Acc.) | 31.00 | 35.00 | 37.25 | 39.00 |
| OmniMath (Acc.) | 20.10 | 20.20 | 24.40 | 24.20 |
| MATH(Acc.) | 65.10 | 76.98 | 61.96 | 82.52 |
| AIME25 (Pass@1) | 14.79 | 13.54 | 2.08 | 43.75 |
| Code | Code | Code | Code | Code |
| HumanEval (Pass@1) | 64.02 | 84.76 | 81.71 | 83.54 |
| HumanEval-cn (Pass@1) | 72.56 | 73.78 | 73.17 | 77.44 |
| HumanEval-Plus (Pass@1) | 51.22 | 75.61 | 75.61 | 76.22 |
| CruxEval (Pass@1) | 63.69 | 61.56 | 60.56 | 66.44 |
| MultiPL-E (Pass@1) | 54.97 | 57.58 | 65.31 | 65.94 |
| BigCodeBench (Pass@1) | 41.67 | 40.70 | 44.30 | 43.68 |
| BIRD-SQL (Acc.) | 22.75 | 13.07 | 26.17 | 26.08 |
| CodeForces (Pass@1) | 26.91 | 18.22 | 47.18 | 42.50 |
| LiveCodeBench (Pass@1) | 20.15 | 14.10 | 13.71 | 34.47 |
| General Reasoning | General Reasoning | General Reasoning | General Reasoning | General Reasoning |
| CommonSenseQA (EM) | 80.59 | 83.78 | 80.18 | 81.08 |
| WorldSense (EM) | 59.39 | 57.83 | 57.61 | 59.09 |
| ProntoQA (EM) | 72.50 | 79.00 | 76.00 | 81.00 |
| Knowledge | Knowledge | Knowledge | Knowledge | Knowledge |
| ARC-e (EM) | 96.47 | 97.00 | 97.35 | 97.00 |
| ARC-c (EM) | 89.49 | 91.86 | 90.17 | 90.51 |
| MMLU(EM) | 79.95 | 78.62 | 74.21 | 74.26 |
| MMLU-Pro (EM) | 61.22 | 50.83 | 47.36 | 47.70 |
| C-Eval (EM) | 83.90 | 83.19 | 83.57 | 80.41 |
| CMMLU(EM) | 82.22 | 81.31 | 81.29 | 79.98 |
| Multilingual | Multilingual | Multilingual | Multilingual | Multilingual |
| mARC(EM) | 48.34 | 80.70 | 64.46 | 65.33 |
| MMMLU(EM) | 42.36 | 60.02 | 51.28 | 50.14 |
| MultiGSM (Acc.) | 53.67 | 77.60 | 66.6 0 | 67.87 |
| HumanEvalXL (Pass@1) | 58.59 | 69.53 | 68.28 | 65.31 |
Table 3 Comparison among Ling-flash-2.0-base and other representative open-source base models.
| Benchmark | Qwen2.5-72B Base | Seed-OSS-36B Base | Ling-flash-2.0 Base w/o CoT Data | Ling-flash-2.0 Base w/ CoT Data |
|-------------------------|--------------------|---------------------|------------------------------------|-----------------------------------|
| Math | Math | Math | Math | Math |
| MathBench (Acc.) | 76.65 | 79.70 | 80.18 | 77.69 |
| FinanceReasoning (Acc.) | 74.60 | 74.98 | 74.43 | 76.44 |
| TheoremQA (Acc.) | 39.00 | 44.25 | 46.25 | 43.50 |
| OmniMath (Acc.) | 18.40 | 20.40 | 27.30 | 28.30 |
| MATH | 76.46 | 88.64 | 66.26 | 79.54 |
| Code | Code | Code | Code | Code |
| HumanEval (Pass@1) | 82.32 | 85.37 | 89.02 | 89.63 |
| HumanEval-cn (Pass@1) | 78.66 | 80.49 | 84.15 | 82.32 |
| HumanEval-Plus (Pass@1) | 73.78 | 78.66 | 81.10 | 83.54 |
| CruxEval (Pass@1) | 63.10 | 73.12 | 69.50 | 77.38 |
| MultiPL-E (Pass@1) | 60.00 | 67.04 | 69.33 | 69.70 |
| BigCodeBench (Pass@1) | 41.18 | 52.89 | 50.88 | 52.37 |
| CodeCriticBench (Acc.) | 67.94 | 65.12 | 70.40 | 70.93 |
| CodeForces (Pass@1) | 17.81 | 19.57 | 36.86 | 47.54 |
| General Reasoning | General Reasoning | General Reasoning | General Reasoning | General Reasoning |
| CommonSenseQA (EM) | 88.12 | 75.02 | 86.73 | 87.71 |
| Multi-LogiEval (EM) | 74.23 | 81.72 | 75.51 | 74.67 |
| AutoLogi (Acc.) | 58.29 | 57.36 | 58.54 | 61.10 |
| Knowledge | Knowledge | Knowledge | Knowledge | Knowledge |
| ARC-e (EM) | 98.06 | 98.06 | 97.53 | 98.24 |
| ARC-c (EM) | 96.27 | 94.58 | 95.59 | 95.93 |
| MMLU(EM) | 86.29 | 84.99 | 82.67 | 82.98 |
| MMLU-Pro (EM) | 61.41 | 60.64 | 59.43 | 60.73 |
| C-Eval (EM) | 88.14 | 88.59 | 88.64 | 89.06 |
| CMMLU(EM) | 89.56 | 87.07 | 87.41 | 87.90 |
| Multilingual | Multilingual | Multilingual | Multilingual | Multilingual |
| MMMLU(EM) | 72.70 | 70.57 | 63.83 | 62.76 |
| mARC(EM) | 88.84 | 85.21 | 81.87 | 82.07 |
| MultiGSM (Acc.) | 82.87 | 85.2 | 80.33 | 80.07 |
| HumanEvalXL (Pass@1) | 76.25 | 73.12 | 75.78 | 71.88 |
Table 4 Comparison among Ling-1T-base and other representative open-source base models.
| Benchmark | DeepSeek-V3.1 Base | Kimi-K2 Base | Ling-1T Base w/o CoT Data | Ling-1T Base w/ CoT Data |
|-------------------------|----------------------|-------------------|-----------------------------|----------------------------|
| Math | Math | Math | Math | Math |
| MathBench (Acc.) | 73.30 | 80.26 | 81.27 | 82.11 |
| CollegeMath (Acc.) | 63.88 | 70.69 | 75.02 | 75.48 |
| MinervaMath (Acc.) | 48.90 | 55.88 | 50.00 | 62.87 |
| TheoremQA (Acc.) | 43.75 | 47.50 | 44.88 | 46.62 |
| OmniMath (Acc.) | 21.10 | 29.90 | 35.70 | 33.60 |
| MATH(Acc.) | 35.64 | 76.40 | 67.42 | 82.78 |
| Code | Code | Code | Code | Code |
| HumanEval (Pass@1) | 74.39 | 89.63 | 89.63 | 89.63 |
| HumanEval-cn (Pass@1) | 72.56 | 85.37 | 84.76 | 85.37 |
| HumanEval-Plus (Pass@1) | 65.85 | 84.15 | 84.15 | 83.54 |
| CruxEval (Pass@1) | 69.81 | 78.25 | 74.88 | 80.88 |
| MultiPL-E (Pass@1) | 59.50 | 64.15 | 70.70 | 69.94 |
| CodeCriticBench (Acc.) | 67.72 | 70.88 | 71.56 | 66.09 |
| CodeForces (Pass@1) | 45.64 | 24.79 | 55.32 | 55.78 |
| General Reasoning | General Reasoning | General Reasoning | General Reasoning | General Reasoning |
| CommonSenseQA (EM) | 85.83 | 85.42 | 89.60 | 89.76 |
| WorldSense (EM) | 57.73 | 64.02 | 67.43 | 66.99 |
| AutoLogi (Acc.) | 63.02 | 63.60 | 63.21 | 65.76 |
| Knowledge | Knowledge | Knowledge | Knowledge | Knowledge |
| ARC-e (EM) | 97.18 | 98.77 | 97.71 | 98.59 |
| ARC-c (EM) | 92.88 | 95.59 | 96.61 | 97.63 |
| MMLU(EM) | 88.44 | 88.32 | 85.91 | 86.03 |
| MMLU-Pro (EM) | 67.75 | 67.50 | 66.70 | 67.91 |
| C-Eval (EM) | 90.67 | 91.72 | 91.41 | 90.75 |
| CMMLU(EM) | 88.19 | 90.35 | 90.18 | 90.26 |
| Multilingual | Multilingual | Multilingual | Multilingual | Multilingual |
| MMMLU(EM) | 69.46 | 72.91 | 70.13 | 68.68 |
| mARC(EM) | 83.62 | 88.40 | 86.64 | 86.68 |
| MultiGSM (Acc.) | 82.20 | 86.87 | 81.87 | 85.40 |
| HumanEvalXL (Pass@1) | 75.00 | 80.94 | 81.72 | 80.62 |
## 4 Post-Training
The post-training phase of Ling 2.0 is engineered to forge a powerful and versatile foundation model-capable of strong reasoning in complex scenarios while maintaining high efficiency for everyday queries. As illustrated in Figure 8, the process employs a structured three-stage methodology supported by a scalable, high-throughput reward computation infrastructure.
Figure 8 Post-training pipeline of Ling 2.0 series models.
<details>
<summary>Image 10 Details</summary>
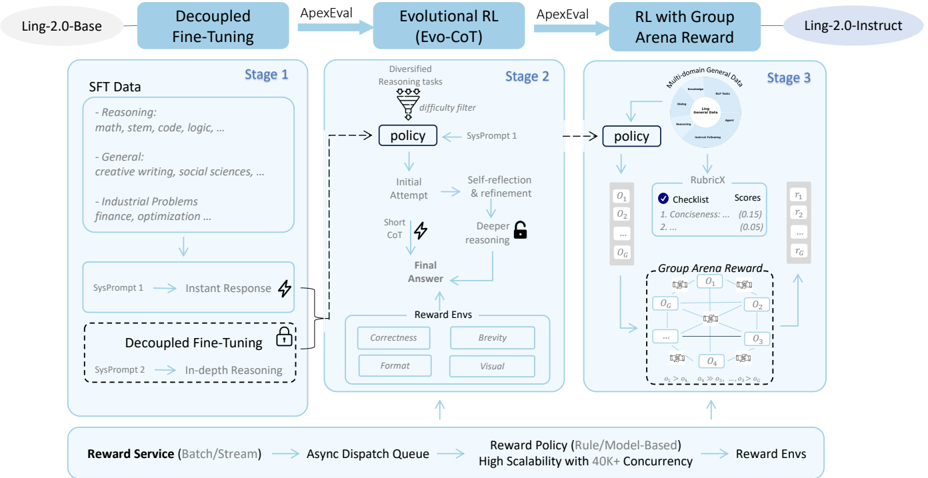
### Visual Description
## Flowchart: Multi-Stage AI Model Development Pipeline
### Overview
The diagram illustrates a three-stage pipeline for developing an AI model, starting from base model fine-tuning to group arena reward optimization. It combines technical components (SFT data, reward services) with reinforcement learning frameworks (Evo-CoT, Group Arena Reward) to produce a final instruction-tuned model.
### Components/Axes
**Stage 1: Decoupled Fine-Tuning**
- Input: SFT Data (Reasoning, General, Industrial Problems)
- Process:
- SysPrompt 1 → Instant Response
- SysPrompt 2 → In-depth Reasoning
- Output: Decoupled Fine-Tuning
**Stage 2: Evolutional RL (Evo-CoT)**
- Input: Policy from Stage 1
- Process:
- Diversified Reasoning tasks → Initial Attempt → Self-reflection → Deeper reasoning
- Reward Envs (Correctness, Brevity, Format, Visual)
- Output: Policy with refined reasoning
**Stage 3: RL with Group Arena Reward**
- Input: Policy from Stage 2
- Process:
- RubriX evaluation with Checklist (Conciseness, ...)
- Group Arena Reward calculation
- Output: Final policy with group-based optimization
### System Components
- Reward Service (Batch/Stream)
- Async Dispatch Queue
- High Scalability (40K+ Concurrency)
- Reward Policy (Rule/Model-Based)
### Detailed Analysis
**Stage 1 Components**
- SFT Data categories:
- Reasoning: math, stem, code, logic
- General: creative writing, social sciences
- Industrial: finance, optimization
- Decoupled Fine-Tuning shows two response modes:
- SysPrompt 1: Instant Response
- SysPrompt 2: In-depth Reasoning
**Stage 2 Components**
- Evo-CoT process:
- Initial Attempt → Self-reflection → Deeper reasoning
- Reward dimensions: Correctness, Brevity, Format, Visual
- Policy refinement shown through iterative attempts
**Stage 3 Components**
- RubriX evaluation with:
- Checklist items (Conciseness: 0.15, ...)
- Group Arena Reward calculation
- Visual representation of reward distribution across outputs
### Key Observations
1. Progressive complexity: Starts with basic fine-tuning → adds self-reflection → ends with group-based optimization
2. Reward system evolution: From individual metrics (Stage 2) to group-based evaluation (Stage 3)
3. Scalability emphasis: Explicit mention of 40K+ concurrency in reward service
4. Technical integration: Combines SFT data with RL frameworks
### Interpretation
This pipeline demonstrates a sophisticated approach to AI model development that:
1. Begins with specialized fine-tuning on diverse data categories
2. Implements evolutionary reinforcement learning with self-reflection mechanisms
3. Culminates in group-based reward optimization using RubriX evaluation
4. Maintains high scalability throughout the process
The architecture suggests a focus on creating models that can handle complex reasoning tasks while maintaining efficiency and adaptability. The group arena reward system implies a competitive or collaborative training environment that could enhance model robustness through peer evaluation.
</details>
## 4.1 Supervised Fine-Tuning with Decoupled Training
To create a strong starting point for reinforcement learning (RL), we introduce Decoupled Fine-Tuning (DFT)-a supervised approach that constructs training data via differentiated system prompts. As illustrated in Stage 1 of Figure 8, DFT defines two modes: Instant Response (System Prompt 1) and In-Depth Reasoning (System Prompt 2), with details provided in Table 5. This prompt-guided decoupling enables the model to establish a dedicated deep-reasoning mode, providing a robust foundation for subsequent RL to further enhance reasoning performance.
Table 5 Response modes guided by system prompts in Decoupled Fine-Tuning (DFT).
| | Instant Response | In-Depth Reasoning |
|---------------|--------------------|-----------------------------------------------------------|
| System Prompt | detailed think off | detailed think on |
| | {response} | <think> {long-cot} </think> <answer> {response} </answer> |
Balanced, High-Quality SFT Data. Abalanced capability profile is achieved through a carefully structured SFT dataset integrating multiple task domains under the dual-mode prompt framework. The dataset composition adheres to three principles:
- Reasoning: mathematical problem solving, stem and logic reasoning, code generation, operations research, and scientific inquiry, ensuring precise logic and analytical depth.
- General: creative writing, empathetic dialogue, and socio-philosophical discussion, enhancing linguistic richness and social intelligence.
- Industrial: domain-specific tasks in finance, medical and health, production planning, supply chain orchestration, and transportation optimization, embedding end-to-end workflows under real-world constraints.
This integrated design prevents skill imbalance and supports fluent transitions between abstract reasoning and practical problem solving.
RL-Potential-Oriented Evaluation. Since DFT suppresses explicit chain-of-thought, standard accuracy metrics may undervalue its RL potential. We therefore employ ApexEval to gauge latent reasoning ability by testing whether problems are solvable under optimal prompting, emphasizing knowledge and reasoning over format-bound performance. It identifies checkpoints along the stability-improvability frontier to start RL from models that retain responsiveness while maximizing reasoning gains (see Section 4.5).
## 4.2 Evolutionary Reasoning Reinforcement Learning
Building on the DFT-initialized policy, we propose Evolutionary Chain-of-Thought (Evo-CoT), a training paradigm designed to instill adaptive reasoning in reflex-grade non-thinking models, enabling them to scale their reasoning depth according to problem complexity.
Formally, Evo-CoT starts from DFT-initialized policy π in instant-respsonse mode with system prompt s instant and evolves its reasoning depth. Given a user query x , the policy generates a response y ∼ π ( · | x inst ) accordingly, where x inst denotes the concatenation of ( s instant , x ) . At step t , we optimize the policy π with parameters θ via:
where R ( · ) is a composite reward function, J ( · ) denotes the RL policy update algorithm detailed in Section 4.2.2, and β controls deviation from the base policy. The reward consists of:
- Accuracy R correctness: +1 if the final answer matches ground truth else 0.
- Dynamic Length control R length : Penalizes exceeding a difficulty-specific length limit with a stage-wise coefficient α that decreases for harder tasks, allowing more elaborate reasoning when needed.
- Formatting R format : if explicit reasoning markers ' <think> ' appear, reward -0.5.
- Task-specific rewards R task-specific, k : optional signals tailored for specific domains (e.g. visual reward for front-end engineering).
Taken together, Evo-CoT sustains strong reasoning under complex scenarios while upholding high efficiency for general tasks.
## 4.2.1 Tasks-Specific Rewards
To cater to different domains, we construct a multi-task reward framework that supports adaptive reasoning across a wide spectrum of tasks.
Mathematical, STEM, and Logical Reasoning. Our reward policy is guided by a core principle: think more about hard problems, respond quickly to easy ones . To implement this principle, we employ the dynamic length control term R length inspired by Kimi-Team et al. (2025) that encourages brevity for straightforward tasks, while allowing elaborate reasoning for complex ones.
Formally, we define the length preference function :
where
Here, l k denotes the length (e.g., token count) of the k -th sampled response to input x , ℓ min = min k l k and ℓ max = max k l k represent the shortest and longest responses among the samples, respectively, and r acc ∈ { 0, 1 } indicates correctness.
To modulate the influence of the length preference relative to correctness, we introduce a coefficient α > 0. A larger α is used for easier tasks, strongly promoting concise outputs; conversely, a smaller α is applied to harder tasks, thereby encouraging more extensive reasoning. In practice, the final scoring function is:
This formulation ensures that:
- For correct answers, the reward reflects how well the response length aligns with the preferred range.
- For incorrect answers, excessively long responses are penalized more, and any positive length-based reward is suppressed.
Overall, this design achieves a balance between output accuracy, clarity, and efficiency, while still promoting richer reasoning on challenging problems.
Code Reasoning. Code reasoning emphasizes functional correctness. We employ a unified reward framework based on test-case execution for code completion, editing, software engineering, and SQL tasks, ensuring reliable functional validation.
Front-end Generation. For complex front-end engineering tasks, we propose the Visually Augmented Reward (V AR) system-at the core of a Syntax-Function-Aesthetic triple-filter positive-feedback loop. As shown in Figure 9, VAR renders generated code into a live interface via a headless browser, then uses a multimodal model to evaluate the screenshot based on aesthetic and usability criteria, yielding a perceptually-aligned reward signal.
## 4.2.2 Linguistic-unit Policy Optimization (LPO)
We propose Linguistic-unit Policy Optimization (LPO), a novel policy gradient algorithm drived by the Evolutionary Chain-of-Thought (Evo-CoT) paradigm. LPO's core mechanism is to perform
Figure 9 Apractical example of Visually-Augmented reward. Prompt: "Create an interactive Halloween page with animated background, costume contest upload, candy collection game, and festive visual effects. Generate clean executable code with smooth interactions."
<details>
<summary>Image 11 Details</summary>
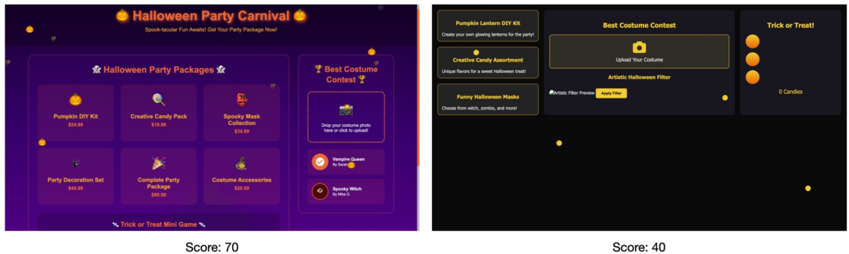
### Visual Description
## Screenshots: Halloween Party Carnival UI Comparison
### Overview
The image contains two side-by-side screenshots of a Halloween-themed website interface. The left screenshot (Score: 70) features a vibrant purple background with orange/yellow text, while the right screenshot (Score: 40) uses a dark black background with yellow/orange text. Both screenshots display Halloween party packages, contests, and interactive elements.
---
### Components/Axes
#### Left Screenshot (Score: 70)
1. **Header**:
- Title: "Halloween Party Carnival" (orange text with pumpkin icons).
- Subtitle: "Spook-tacular Fun Awaits! Get Your Party Package Now!" (smaller orange text).
2. **Main Content**:
- **Halloween Party Packages** (white text with star icons):
- Six packages listed in a 2x3 grid:
1. Pumpkin DIY Kit ($24.99)
2. Creative Candy Pack ($19.99)
3. Spooky Mask Collection ($24.99)
4. Party Decoration Set ($44.99)
5. Complete Party Package ($99.99)
6. Costume Accessories ($29.99)
- **Best Costume Contest** (white text with trophy icons):
- Prompt: "Drop your costume photo here or click to upload" (camera icon).
- Entries:
- "Vampire Queen" by Sara (orange checkmark).
- "Spooky Witch" by Max (red "X" icon).
3. **Footer**:
- "Trick or Treat Mini Game" (small white text with game controller icons).
#### Right Screenshot (Score: 40)
1. **Header**:
- Title: "Pumpkin Lantern DIY Kit" (yellow text).
- Subtitle: "Create your own glowing lanterns for the party!" (smaller yellow text).
2. **Main Content**:
- **Best Costume Contest** (yellow text with camera icon):
- Prompt: "Upload Your Costume" (camera icon).
- "Artistic Halloween Filter" (yellow button).
- **Trick or Treat** (yellow text):
- Three orange circles (possibly buttons).
- Text: "0 Candies" (yellow).
3. **Footer**:
- No additional elements visible.
---
### Detailed Analysis
#### Left Screenshot (Score: 70)
- **Packages**:
- Prices range from $19.99 to $99.99, with the "Complete Party Package" being the most expensive.
- Packages include DIY kits, candy, masks, decorations, and costumes.
- **Best Costume Contest**:
- Two entries with conflicting status indicators: "Vampire Queen" (approved) vs. "Spooky Witch" (rejected).
- **Trick or Treat Mini Game**:
- Implied interactive element but no visible details.
#### Right Screenshot (Score: 40)
- **Pumpkin Lantern DIY Kit**:
- Focus on crafting activity with a call-to-action.
- **Best Costume Contest**:
- Simplified interface with a single upload prompt and filter option.
- **Trick or Treat**:
- "0 Candies" suggests a reset or uninitialized state.
---
### Key Observations
1. **Score Discrepancy**:
- Left screenshot (70) has more content (6 packages vs. 3 on the right) and higher visual density.
- Right screenshot (40) has fewer elements and a darker theme, possibly indicating a lower engagement score.
2. **Trick or Treat Anomaly**:
- Right screenshot shows "0 Candies," which may indicate a bug or incomplete implementation.
3. **Color Consistency**:
- Left: Purple background with orange/yellow text (Halloween-friendly).
- Right: Black background with yellow/orange text (darker, less vibrant).
4. **Contest Entries**:
- Left screenshot includes user-submitted entries with status indicators, while the right focuses on upload functionality.
---
### Interpretation
- **User Experience**:
- The left screenshot (higher score) appears more comprehensive, offering diverse packages and interactive features. The right screenshot (lower score) seems streamlined but lacks content depth.
- **Design Intent**:
- The purple/black background contrast may target different user preferences (vibrant vs. minimalist).
- **Functionality Gaps**:
- The "0 Candies" in the right screenshot suggests a potential issue with the Trick or Treat game logic.
- **Contest Mechanics**:
- The left screenshot’s dual-status entries (approved/rejected) imply a moderation system, while the right focuses on upload simplicity.
This analysis highlights trade-offs between content richness and interface simplicity, with the higher-scoring left screenshot offering a more engaging but potentially overwhelming experience.
</details>
importance sampling and clipping at the sentence level, defining a linguistic sentence as the fundamental action unit for policy updates. Specifically, Let { yi } G i = 1 denote a group of G candidate responses sampled from the old policy πθ old ( · | x inst ) . For response yi , let N sent ( yi ) denotes the total number of sentences in yi , s i , k the k -th sentence in yi segmented by common pause punctuation marks after detokenization, and | · | denote the token length. The objective function of LPO is formulated as follows:
where
LPO performs sentence-level policy updates with the following design choices:
- Sentence granularity Importance Sampling : Each sentence s i , k in yi is treated as an independent action unit, with its importance ratio r i , k ( θ ) applied uniformly to all tokens in that sentence.
- Token-level Normalization : Group-based advantage estimation ˆ Ai are averaged over the total token length | yi | , ensuring scale invariance across examples.
- Clipping strategy : Ratios are clipped within [ 1 -ε , 1 + ε ] before multiplication, preventing unstable updates while preserving finer granularity than whole-sequence clipping. In our training setting, ε = 0.03 .
This structure aligns the optimization step with the natural semantic boundaries of reasoning, resolving the mismatch in granularity found in conventional token-level and sequence-level methods. It attains stability without sacrificing data efficiency, making LPO a natural fit within the Evo-CoT training paradigm.
Empirically, as shown in Figure 10, LPO delivers smoother reward curves and markedly greater stability than GRPO (Shao et al., 2024), GSPO (Zheng et al., 2025), and the GSPO (Token Mean) variant. It avoids plateaus and collapse, converges faster, and generalizes better. On the challenging AIME 2025 test set, LPO-trained models achieve substantially higher accuracy, demonstrating that
stabilizing updates at the sentence level not only improves optimization but also guides the policy toward more robust reasoning strategies.
Figure 10 Reward curves of LPO in RL training for the latest Ling 2.0 model. Left: reward progression on training data, showing smoother growth and greater stability compared to GRPO (Shao et al., 2024), GSPO (Zheng et al., 2025), and the GSPO (Token Mean) baseline, with no severe plateaus or collapses. Right: reward curves on the AIME 2025 test set, illustrating faster convergence and improved generalization due to sentence-level policy updates.
<details>
<summary>Image 12 Details</summary>
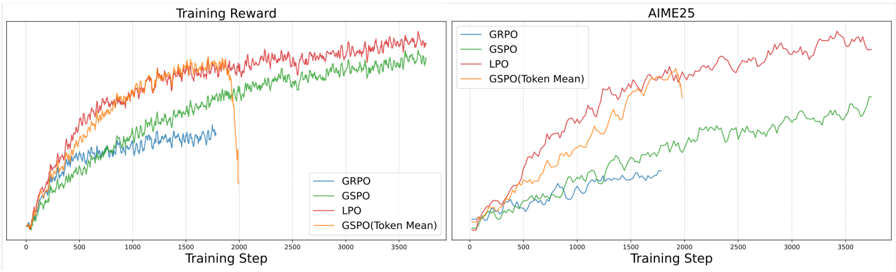
### Visual Description
## Line Graphs: Training Reward and AIME25 Performance
### Overview
The image contains two side-by-side line graphs comparing the performance of four optimization methods (GRPO, GSPO, LPO, GSPO(Token Mean)) across training steps. The left graph tracks "Training Reward," while the right graph measures "AIME25" performance. Both graphs span 3,500 training steps on the x-axis, with y-axes representing respective metrics (unscaled).
---
### Components/Axes
1. **Left Graph (Training Reward)**:
- **X-axis**: "Training Step" (0–3,500, increments of 500).
- **Y-axis**: "Training Reward" (no numerical scale provided).
- **Legend**: Located in the bottom-left corner, mapping colors to methods:
- Blue: GRPO
- Green: GSPO
- Red: LPO
- Orange: GSPO(Token Mean)
2. **Right Graph (AIME25)**:
- **X-axis**: "Training Step" (0–3,500, increments of 500).
- **Y-axis**: "AIME25" (no numerical scale provided).
- **Legend**: Same color mappings as the left graph.
---
### Detailed Analysis
#### Left Graph (Training Reward)
1. **GRPO (Blue)**:
- Starts near 0, increases steadily with minor fluctuations.
- Reaches ~80% of its peak by 2,500 steps, then plateaus.
2. **GSPO (Green)**:
- Begins slightly above GRPO, grows steadily until ~1,500 steps.
- Sharp decline at ~2,000 steps, then recovers to match GRPO by 3,500.
3. **LPO (Red)**:
- Starts highest (~10% above GRPO/GSPO at step 0).
- Drops sharply at ~2,000 steps, then rises to surpass GRPO by 3,500.
4. **GSPO(Token Mean) (Orange)**:
- Smoothest curve, peaks at ~2,000 steps (~10% higher than GRPO).
- Declines steadily after 2,000 steps, ending ~5% below GRPO.
#### Right Graph (AIME25)
1. **GRPO (Blue)**:
- Starts near 0, rises steadily with minor noise.
- Reaches ~70% of its peak by 3,500 steps.
2. **GSPO (Green)**:
- Begins slightly above GRPO, grows until ~1,500 steps.
- Sharp drop at ~2,000 steps, then recovers to match GRPO by 3,500.
3. **LPO (Red)**:
- Starts highest (~15% above GRPO/GSPO at step 0).
- Dips sharply at ~2,000 steps, then rises to surpass GRPO by 3,500.
4. **GSPO(Token Mean) (Orange)**:
- Smooth curve, peaks at ~2,000 steps (~20% higher than GRPO).
- Declines steadily after 2,000 steps, ending ~10% below GRPO.
---
### Key Observations
1. **Consistent Trends**:
- GRPO and GSPO(Token Mean) show steady growth in both graphs.
- GSPO exhibits a sharp performance drop at ~2,000 steps in both metrics.
- LPO starts strong but underperforms after ~2,000 steps before recovering.
2. **Token Mean Impact**:
- GSPO(Token Mean) smooths volatility but peaks earlier (~2,000 steps) and declines faster than raw GSPO.
3. **Method Comparison**:
- LPO initially outperforms others but lags post-2,000 steps.
- GRPO maintains consistent growth, suggesting robustness.
- GSPO’s sharp drop may indicate instability or overfitting.
---
### Interpretation
The graphs highlight trade-offs between optimization methods:
- **GRPO** demonstrates stable, incremental improvement, ideal for consistent training.
- **GSPO**’s volatility (especially the 2,000-step drop) suggests sensitivity to hyperparameters or data shifts.
- **LPO**’s initial dominance followed by a dip implies potential overfitting early in training, with recovery suggesting adaptive mechanisms.
- **GSPO(Token Mean)** smooths performance but sacrifices late-stage gains, possibly due to averaging limiting adaptability.
The shared drop in GSPO at ~2,000 steps across both metrics hints at a systemic issue (e.g., learning rate decay, data exhaustion). The Token Mean variant’s earlier peak and decline suggest that smoothing may accelerate convergence but reduce long-term efficacy. These patterns underscore the importance of method selection based on training stability vs. peak performance goals.
</details>
## 4.3 Group Arena Reward for Human Preference Alignment
In the RLHF post-training stage for open-ended, subjective tasks, two central objectives emerge: (1) mitigating reward noise inherent in ambiguous evaluation criteria, and (2) aligning model outputs more precisely with nuanced human preferences. To this end, we design the Group Arena Reward (GAR) mechanism-an intra-group comparative evaluation strategy-and RubriX ('Rubrics for eXtended domains'), a fine-grained, multi-dimensional reward guideline framework. Together, they improve stability in subjective task optimization and enable generation that is both technically accurate and naturally aligned with user intent.
## 4.3.1 Group Arena Reward
For open-ended tasks, conventional reward mechanisms often struggle with quantifying subjective quality and suffer from high-variance scoring. As illustrated in Figure 11, GAR addresses these challenges by replacing independent absolute scoring with relative, tournament-style comparisons. Multiple responses from the same policy are placed into an 'arena'; a generative reward model acts as a referee, performing pairwise comparisons in a round-robin fashion. The cumulative results of these head-to-head contests form the final reward for each response. This relative ranking structure effectively reduces variance and reward noise, producing more reliable advantage estimates for policy updates.
## 4.3.2 Fine-grained Multi-Dimensional RubriX
To complement GAR with precise preference modeling, we propose RubriX -a domain-extended set of reward evaluation rubrics tailored for subjective general tasks. RubriX spans multiple dimensions, including clarity, coherence, creativity, emotional resonance, instruction adherence, and domain-specific accuracy, with instantiations for writing, translation, long-form QA, emotional dialogue, multi-turn conversation, and other instruction-following tasks. These structured rubrics guide the reward model to capture subtle aspects of user intent, encouraging responses that are both more natural in flow and more aligned with complex preference criteria.
Figure 11 Illustration of the Group Arena Reward (GAR) mechanism applied to open-ended subjective tasks.
<details>
<summary>Image 13 Details</summary>
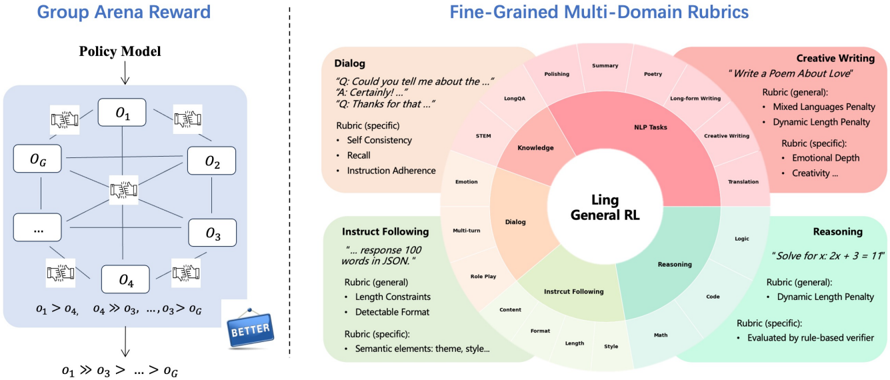
### Visual Description
## Diagram: Group Arena Reward and Fine-Grained Multi-Domain Rubrics
### Overview
The image presents two interconnected diagrams. On the left, a **Group Arena Reward** system is depicted as a hierarchical policy model with nodes (O₁–O₄, O_G) and directional arrows indicating priority. On the right, a **Fine-Grained Multi-Domain Rubrics** wheel outlines evaluation criteria for language models across four domains: Dialog, NLP Tasks, Creative Writing, and Reasoning. Each domain contains subcategories with specific rubrics.
---
### Components/Axes
#### Left Diagram: Group Arena Reward
- **Nodes**:
- O₁, O₂, O₃, O₄, O_G (central node)
- **Arrows**:
- O₁ → O₄ → O₃ → O_G (hierarchical flow)
- O₁ > O₄ > O₃ > ... > O_G (priority ranking)
- **Visual Elements**:
- "BETTER" badge at the bottom left.
#### Right Diagram: Fine-Grained Multi-Domain Rubrics
- **Central Node**: "Ling General RL"
- **Quadrants**:
1. **Dialog** (pink):
- Subcategories: LongQA, STEM, Emotion, Multi-turn, Role Play
- Rubrics: Specific (specific), Self Consistency, Recall, Instruction Adherence
2. **NLP Tasks** (red):
- Subcategories: Polishing, Summary, Poetry, Long-form Writing, Creative Writing, Translation
- Rubrics: Mixed Languages Penalty, Dynamic Length Penalty, Emotional Depth, Creativity
3. **Creative Writing** (red):
- Subcategories: Write a Poem About Love
- Rubrics: Mixed Languages Penalty, Dynamic Length Penalty, Emotional Depth, Creativity
4. **Reasoning** (green):
- Subcategories: Logic, Code, Math
- Rubrics: Dynamic Length Penalty, Evaluated by rule-based verifier
- **Additional Rubrics**:
- **Instruct Following** (green):
- Subcategories: Format, Length, Style
- Rubrics: Length Constraints, Detectable Format, Semantic elements (theme, style)
---
### Detailed Analysis
#### Left Diagram: Group Arena Reward
- The policy model prioritizes objectives in a strict hierarchy: O₁ (highest) > O₄ > O₃ > O_G (lowest).
- The "BETTER" badge implies that higher-ranked objectives contribute more significantly to the reward signal.
#### Right Diagram: Fine-Grained Multi-Domain Rubrics
- **Dialog**: Focuses on conversational quality, with rubrics emphasizing specificity, consistency, and adherence to instructions.
- **NLP Tasks**: Evaluates technical skills (e.g., summarization, translation) with penalties for mixed languages and dynamic length constraints.
- **Creative Writing**: Assesses emotional depth and creativity, with penalties for non-native language use and length variability.
- **Reasoning**: Prioritizes logical and mathematical accuracy, with rule-based verification for correctness.
---
### Key Observations
1. **Hierarchical Prioritization**: The Group Arena Reward system enforces a strict order of objectives, suggesting that higher-ranked objectives (e.g., O₁) are more critical to the model's performance.
2. **Domain-Specific Rubrics**: Each domain (Dialog, NLP Tasks, etc.) has tailored evaluation criteria, reflecting the complexity of language model assessment.
3. **Penalty Mechanisms**: Mixed Languages Penalty and Dynamic Length Penalty appear across multiple domains, indicating a focus on linguistic coherence and conciseness.
4. **Rule-Based Verification**: Reasoning tasks (e.g., math problems) are explicitly evaluated using rule-based systems, ensuring objective correctness.
---
### Interpretation
The diagrams illustrate a **multi-layered evaluation framework** for language models. The Group Arena Reward system prioritizes objectives to guide model behavior, while the Fine-Grained Rubrics provide granular metrics for assessing performance across diverse tasks. The overlap in penalties (e.g., Dynamic Length Penalty) suggests a shared emphasis on efficiency and clarity. The "BETTER" badge implies that aligning with higher-ranked objectives (O₁–O₄) directly correlates with improved outcomes, reinforcing the importance of hierarchical goal-setting in reinforcement learning systems.
</details>
## 4.4 Reward Model System
To flexibly support reward computation and reward policy orchestration across diverse reasoning tasks within RL training pipelines, we propose a unified scalable reward model system. This system concurrently accommodates rule-based, model-based, and multi-programming-language-based reward verification, scaling to 40K concurrent heterogeneous reward requests with sustained success rates exceeding 99.9%.
The system architecture comprises three core modules: (1) a highly available sandboxing environment integrating multi-programming-language sandboxes, general reward models inference, visual reward evaluators, and complex environment sandboxes (software engineering, database operations, browser interaction, etc.); (2) a preemptive task scheduling mechanism employing highperformance bounded queues to mitigate timeout-induced failures arising from computational heterogeneity under peak concurrency, achieving a 39% improvement in system throughput; and (3) an asynchronous reward computation framework that decouples RL training iterations from reward computation latency, yielding empirically measured training time reduction of up to 30%.
## 4.5 ApexEval: Searching for Checkpoint with Highest Potential
In post-training, RL is used to unlock the model's reasoning potential. To initialize RL effectively, we must identify the SFT checkpoint with the highest potential. However, conventional methods fall short: 1) They rely on greedy or average pass@k scores, which reflect average performance rather than the best potential; 2) Checkpoints lack strong instruction-following ability, leading to misjudgment of correct responses that deviate from fixed formats.
To address the above two issues with conventional evaluation methods, we propose ApexEval to get the best checkpoint initialization for RL training. The method includes:
- Instead of greedy or average pass@k, we use the highest score of pass@k to estimate the probability of producing at least one correct response in multiple attempts, effectively capturing the model's potential upper bound.
- To reduce the impact of answer formatting, we use LLM-based intelligent judges (e.g., Math-
Verify, XVerify) for tasks with explicit answers like mathematics, knowledge, and logic. These judges assess answer validity based on model predictions, minimizing misjudgment caused by pattern variability. For coding tasks, we evaluate valid code snippets via test-case execution to fairly assess actual capabilities.
Find High-potential Checkpoint. ApexEval is designed to assess a model's true capability and potential for further improvement. This enables the identification of promising checkpoints for subsequent instruction tuning or RL optimization. During the Ling 2.0 pretraining phase, we introduce a portion of instant-response and in-depth reasoning data. From a post-training perspective, this inclusion raises the reasoning performance ceiling when applying Evolutionary Reasoning Reinforcement Learning (ERL).
As shown in Figure 12, we compare Decoupled Fine-Tuning (DFT) with and without Chain-ofThought (CoT) data during pretraining. The performance ceiling is evaluated using both ApexEval and high-value pass@k metrics. In all settings, pretraining with CoT data consistently yields a higher ceiling under the same DFT configuration.We use ApexEval as the criterion for selecting the initial model for Reasoning Reinforcement Learning. The DFT model pretrained with CoT data exhibits stronger AIME performance at ERL step450 compared to the model without CoT data, indicating a faster performance gain trajectory.
Figure 12 ApexEval-based checkpoint selection experiment on the Ling 2.0 mini model. Left: ApexEval results for DFT models pretrained with and without CoT-style data. Right: Performance of the two DFT variants after applying ERL, showing the pretraining-with-CoT model achieves higher AIME scores and faster improvement.
<details>
<summary>Image 14 Details</summary>
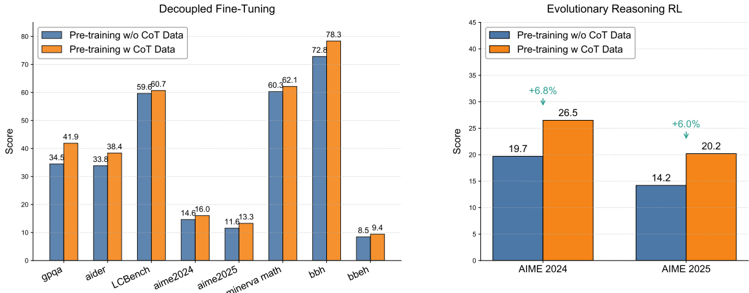
### Visual Description
## Bar Charts: Decoupled Fine-Tuning vs Evolutionary Reasoning RL
### Overview
The image contains two side-by-side bar charts comparing performance scores under two pre-training conditions: "Pre-training w/o CoT Data" (blue) and "Pre-training w/ CoT Data" (orange). The left chart focuses on "Decoupled Fine-Tuning" across multiple tasks, while the right chart compares "Evolutionary Reasoning RL" across two years of AIME benchmarks.
### Components/Axes
**Left Chart (Decoupled Fine-Tuning):**
- **X-axis (Categories):** gpqa, aider, LCBench, aime2024, aime2025, minerva math, bbh, bbeh
- **Y-axis (Score):** 0–80 (linear scale)
- **Legend:**
- Blue: Pre-training w/o CoT Data
- Orange: Pre-training w/ CoT Data
**Right Chart (Evolutionary Reasoning RL):**
- **X-axis (Years):** AIME 2024, AIME 2025
- **Y-axis (Score):** 0–45 (linear scale)
- **Legend:** Same as left chart (blue/orange for pre-training conditions)
### Detailed Analysis
**Left Chart Values:**
- **gpqa:** Blue 34.5 | Orange 41.9
- **aider:** Blue 33.8 | Orange 38.4
- **LCBench:** Blue 59.6 | Orange 60.7
- **aime2024:** Blue 14.6 | Orange 16.0
- **aime2025:** Blue 11.6 | Orange 13.3
- **minerva math:** Blue 60.3 | Orange 62.1
- **bbh:** Blue 72.8 | Orange 78.3
- **bbeh:** Blue 8.5 | Orange 9.4
**Right Chart Values:**
- **AIME 2024:** Blue 19.7 | Orange 26.5 (+6.8% increase)
- **AIME 2025:** Blue 14.2 | Orange 20.2 (+6.0% increase)
### Key Observations
1. **Consistent CoT Advantage:** Across all tasks in the left chart, pre-training with CoT data (orange) outperforms the baseline (blue), with the largest gap in `bbh` (78.3 vs 72.8).
2. **Task-Specific Variability:**
- `aime2025` and `bbeh` show minimal improvement with CoT (1.7 and 0.9 point gains, respectively).
- `LCBench` and `minerva math` demonstrate near-par performance between methods (0.4–1.8 point differences).
3. **Yearly Decline in AIME Scores:** Both methods show reduced scores from 2024 to 2025, but CoT maintains a consistent 6–7 point advantage.
4. **Percentage Annotations:** The right chart explicitly highlights relative improvements (+6.8% and +6.0%) for CoT pre-training between years.
### Interpretation
The data suggests that Chain-of-Thought (CoT) pre-training consistently enhances performance across diverse reasoning tasks, with particularly strong effects in complex benchmarks like `bbh`. However, the diminishing returns in `aime2025` and `bbeh` imply potential task-specific limitations. The AIME results reveal a concerning trend: while CoT pre-training remains superior, both methods experience score declines from 2024 to 2025, raising questions about dataset evolution or model generalization. The near-identical improvement percentages (+6.8% vs +6.0%) between years suggest CoT's benefits are stable but not transformative in later benchmarks.
</details>
## 4.6 Evaluation Results
Benchmarks and Configurations. The suite spans mathematics, coding, reasoning, knowledge, agent, instruction following and alignment ability. Unless noted, we report EM/Acc or Pass@1 with 0-shot prompting and decontamination. For fill-in-the-blank benchmarks, we employ LLM-asa-Judge to improve the accuracy of the evaluation. The evaluation datasets for post-trained models include 36 benchmarks, which are categorized as follows:
- Coding Tasks : MultiPL-E (Cassano et al., 2022), MBPP (Austin et al., 2021)(MBPP Sanitized), LiveCodeBench (Jain et al., 2025)(questions from August 2024 to May 2025), CodeForces (Quan et al., 2025)(ratings from CodeElo), BIRD-SQL (Li et al., 2023b), ArtifactsBench (Zhang et al., 2025b), FullStack Bench (Cheng et al., 2024), Aider-Edit (Aider, 2025).
- Math Tasks : CNMO 2024 (Liu et al., 2025b), AIME24 (MAA, 2024), AIME25 (MAA, 2025), UGMathBench (Xu et al., 2025), Omni-MATH (Gao et al., 2025), HMMT25 (Balunovi´ c et al.,
2025), FinanceReasoning (Tang et al., 2025a), Optibench (Yang et al., 2025b), OptMATH (Lu et al., 2025). For the Omni-MATH benchmark, instead of the original rule-based evaluation method, we rely on LLM to perform the assessment.
- Reasoning Tasks : BBEH (Kazemi et al., 2025), KOR-Bench (Ma et al., 2025), ARC-AGI1 (Chollet, 2019), ZebraLogic (Lin et al., 2025), HLE (Phan et al., 2025). For BBEH, we employ LLM-as-a-Judge for evaluation. For ARC-AGI-1, ZebraLogic and HLE, we repeat each query 4 times and report the Pass@1 score.
- Knowledge Tasks : C-Eval (Huang et al., 2023), MMLU-Redux (Hendrycks et al., 2021a), MMLU-Pro (Wang et al., 2024), GPQA-Diamond (Rein et al., 2023), MMLU-Pro-Stem (Wang et al., 2024), OlympiadBench-Stem (He et al., 2024b), MedXpertQA (Zuo et al., 2025). For GPQA-Diamond, we repeat 16 times for each query and report the Pass@1 score. For MMLUPro-Stem, we selected a subset of the mmlu-pro evaluation set belonging to the STEM category, consist of math, physics, chemistry, engineering, biology, computer science, and calculated their average score. For the OlympiadBench-Stem evaluation set, we selected the physics subset from OlympiadBench (He et al., 2024b) that is suitable for evaluating language models, excluding subsets containing images.
- Alignment Tasks : Arena Hard v2.0 (Li et al., 2024b; Li* et al., 2024), Writing Bench (Wu et al., 2025), Creative Writing v3 (Paech, 2025), Multi-Challenge (Deshpande et al., 2025).
- Agent&Instruction Following Tasks : BFCL-V3 (Yan et al., 2024), IFEval(Prompt Strict) (Zhou et al., 2023).
Table 6, Table 7 and Table 8 provide comprehensive comparisons of Ling-mini-2.0 , Ling-flash-2.0 and Ling-1T against leading models. As shown in Table 8, Ling-1T demonstrates superiority over leading models across multiple domains, including coding, math, reasoning, alignment and multiturn dialogues on the majority of benchmarks. Current results of the Ling-1T align well with the scaling law. Moreover, we have the following findings:
Reasoning Capability. Benefits from the In-depth Reasoning during the Decoupled Fine-tuning phase and evolutionary CoT training during RL, the reasoning capability of the model significantly improve. Respectively, the in-depth Reasoning in SFT employs prompts in Table.5 to establish a dedicated deep-reasoning mode, providing a robust foundation for RL, while the evolutionary CoT in subsequent RL instill adaptive reasoning in reflex-grade non-thinking models, enabling them to scale their reasoning depth according to problem complexity. As shown in Table 6, Table 7 and Table 8, the Ling-mini-2.0 , Ling-flash-2.0 and Ling-1T outperform most of the leading industry models in various benchmarks that require reasoning capability, involving coding tasks e.g. LiveCodeBench, MBPP Sanitized and CodeForces, math tasks e.g. CNMO 2024, Omni-MATH and OptMATH, and reasoning tasks e.g. BBEH, KOR-Bench and ZebraLogic.
Better and Cheaper. We analyze the overall performance of Ling-1T in terms of reasoning accuracy and efficiency. As illustrated in Figure 13, taking the competition-level mathematics benchmark AIME 25 as an example, Ling-1T showcase its advantage in "efficient thinking and precise reasoning." The optimal balance between efficient thinking and precise reasoning benefits from the evolutionary CoT. It progressively activates the model's reasoning ability from shallow to deep, while enabling precise control over reasoning costs. We believe that for reflexive non-thinking models, this approach-gradually activating reasoning capability from pre-training to post-training-can continuously push the Pareto frontier of reasoning accuracy and average reasoning depth.
Figure 13 Model Performance vs. Average Tokens (AIME-25)
<details>
<summary>Image 15 Details</summary>
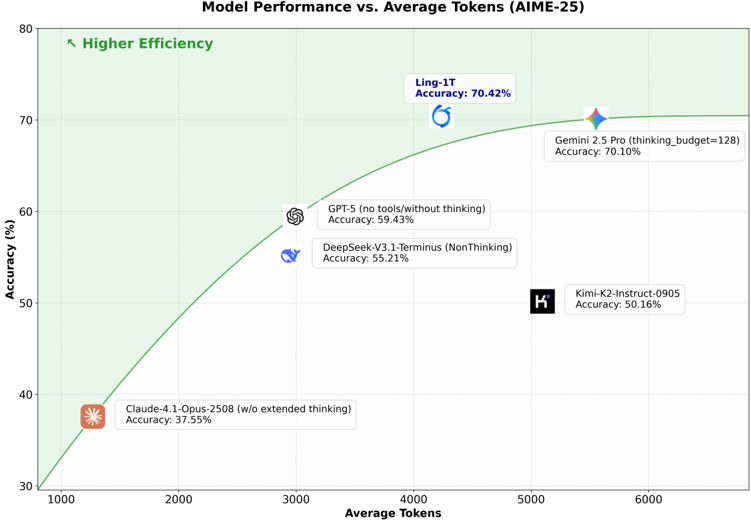
### Visual Description
## Scatter Plot: Model Performance vs. Average Tokens (AIME-25)
### Overview
The chart compares the accuracy of AI models against their average token usage during inference. A green shaded region labeled "Higher Efficiency" (with an arrow pointing left) indicates the ideal trade-off zone where models achieve higher accuracy with fewer tokens. Data points represent specific models, annotated with their accuracy percentages and token counts.
---
### Components/Axes
- **X-axis**: "Average Tokens" (logarithmic scale, 1000 to 6000 tokens)
- **Y-axis**: "Accuracy (%)" (linear scale, 30% to 80%)
- **Legend**: Green shaded area labeled "Higher Efficiency" (top-left quadrant)
- **Data Points**: Labeled with model names, accuracy, and contextual notes (e.g., "no extended thinking")
---
### Detailed Analysis
1. **Claude-4.1-Opus-2508**
- Accuracy: 37.55%
- Tokens: 1000
- Note: "w/o extended thinking"
- Position: Bottom-left corner (lowest accuracy, fewest tokens)
2. **DeepSeek-V3.1-Terminus**
- Accuracy: 55.21%
- Tokens: 3000
- Note: "NonThinking"
- Position: Mid-left quadrant
3. **GPT-5 (no tools/without thinking)**
- Accuracy: 59.43%
- Tokens: 3000
- Position: Mid-left quadrant, slightly higher accuracy than DeepSeek
4. **Ling-1T**
- Accuracy: 70.42%
- Tokens: 4000
- Position: Mid-right quadrant (high accuracy, moderate tokens)
5. **Gemini 2.5 Pro (thinking_budget=128)**
- Accuracy: 70.10%
- Tokens: 5500
- Position: Far-right quadrant (highest token usage, near-peak accuracy)
6. **Kimi-K2-Instruct-0905**
- Accuracy: 50.16%
- Tokens: 5000
- Position: Mid-right quadrant (lower accuracy despite high token usage)
---
### Key Observations
- **Efficiency Trade-off**: Models with fewer tokens (e.g., Claude-4.1) have lower accuracy, while those with more tokens (e.g., Gemini 2.5 Pro) achieve higher accuracy.
- **Optimal Efficiency**: Ling-1T and Gemini 2.5 Pro occupy the "Higher Efficiency" zone, balancing accuracy and token usage.
- **Anomaly**: Kimi-K2-Instruct-0905 underperforms relative to its token count (5000 tokens but only 50.16% accuracy).
- **Accuracy Ceiling**: No model exceeds 70.42% accuracy, suggesting a practical limit for this task.
---
### Interpretation
The chart demonstrates a clear inverse relationship between token usage and efficiency: models requiring fewer tokens (e.g., Claude-4.1) sacrifice accuracy, while those prioritizing accuracy (e.g., Gemini 2.5 Pro) consume more tokens. The "Higher Efficiency" zone highlights Ling-1T and Gemini 2.5 Pro as leaders, achieving >70% accuracy with ≤5500 tokens. Kimi-K2-Instruct-0905’s poor performance relative to its token count suggests suboptimal resource allocation or model design. The data implies that efficiency gains are possible by optimizing token usage without sacrificing accuracy, as seen in Ling-1T’s performance.
</details>
Table 6 Comparison between Ling-mini-2.0 and other representative models.
| Benchmark | Ling-mini-2.0 | Qwen3-4B -Instruct 2507 | Qwen3-8B (Non-thinking) | Ernie-4.5-21B -A3B-PT | gpt-oss-20B (low thinking) |
|---------------------------|-----------------------|---------------------------|---------------------------|-------------------------|------------------------------|
| Coding | Coding | Coding | Coding | Coding | Coding |
| MBPP Sanitized (Pass@1) | 82.99 | 85.54 | 79.45 | 85.36 | 89.40 |
| LiveCodeBench (Pass@1) | 41.69 | 34.03 | 26.10 | 26.10 | 46.64 |
| CodeForces (Rating) | 1410 | 1224 | 624 | 480 | 1481 |
| BIRD-SQL (Acc.) | 39.60 | 45.40 | 36.80 | 29.86 | 36.15 |
| ArtifactsBench | 29.94 | 36.61 | 31.00 | 31.44 | 45.90 |
| MultiPL-E (Pass@1) | 70.82 | 72.03 | 67.37 | 71.92 | 61.10 |
| FullStack Bench (Pass@1) | 43.45 | 40.37 | 39.24 | 43.02 | 49.91 |
| Math | Math | Math | Math | Math | Math |
| CNMO2024 (Pass@1) | 72.66 | 68.49 | 34.38 | 42.71 | 45.31 |
| AIME24 (Pass@1) | 65.62 | 64.53 | 27.97 | 24.43 | 45.68 |
| AIME25 (Pass@1) | 46.72 | 47.81 | 24.01 | 15.68 | 38.59 |
| UGMathBench (Acc.) | 66.83 | 67.14 | 59.62 | 56.31 | 61.57 |
| Omni-MATH (Acc.) | 60.30 | 60.25 | 41.71 | 38.71 | 50.70 |
| HMMT25 (Pass@1) | 35.83 | 29.79 | 11.46 | 6.88 | 20.05 |
| FinanceReasoning (Acc.) | 69.64 | 74.17 | 69.52 | 70.55 | 77.31 |
| OptMATH (Pass@1) | 12.20 | 10.39 | 10.39 | 1.51 | 2.71 |
| Optibench (Pass@1) | 61.16 | 28.26 | 41.65 | 31.90 | 37.52 |
| Reasoning | Reasoning | Reasoning | Reasoning | Reasoning | Reasoning |
| KOR-Bench (Acc.) | 62.00 | 65.12 | 54.40 | 48.48 | 66.00 |
| ARC-AGI-1 (Pass@1) | 10.25 | 15.38 | 4.06 | 0.75 | 3.56 |
| HLE (Pass@1) | 6.01 | 4.55 | 4.00 | 5.11 | 4.69 |
| ZebraLogic (Pass@1) | 80.20 | 79.50 | 36.05 | 46.98 | 44.10 |
| Knowledge | Knowledge | Knowledge | Knowledge | Knowledge | Knowledge |
| GPQA-Diamond (Pass@1) | 58.74 | 44.82 | 48.64 | 77.27 | 55.71 |
| C-Eval (Acc.) | 83.31 | 81.71 | 80.06 | 85.38 | 64.41 |
| MMLU-Redux (Acc.) | 81.55 | 84.24 | 80.83 | 82.59 | 83.50 |
| MMLU-Pro (Acc.) | 65.11 | 62.38 | 52.54 | 65.46 | 65.59 |
| MMLU-Pro-Stem (Acc.) | 72.14 | 69.90 | 57.62 | 72.98 | 72.63 |
| OlympiadBench-Stem (Acc.) | 70.43 | 77.53 | 59.37 | 62.17 | 63.02 |
| Agent | Agent | Agent | Agent | Agent | Agent |
| BFCL-V3 (Function Call) 1 | 53.71 | 61.16 | 59.50 | - | 36.22 |
| Instruction Following | Instruction Following | Instruction Following | Instruction Following | Instruction Following | Instruction Following |
| IFEval (Prompt Strict) | 77.74 | 84.47 | 83.92 | 75.05 | 72.50 |
Table 7 Comparison between Ling-flash-2.0 and other representative models.
| Benchmark | Ling-flash-2.0 | Qwen3-32B (Non-thinking) | Hunyuan-A13B -Instruct | Seed-OSS-36B -Instruct | GPT-OSS-120B (low think) | GPT-4.1 mini |
|---------------------------------|-----------------------|----------------------------|--------------------------|--------------------------|----------------------------|-----------------------|
| Coding | Coding | Coding | Coding | Coding | Coding | Coding |
| MBPP Sanitized (Pass@1) | 94.17 | 84.78 | 82.82 | 85.42 | 94.58 | 91.01 |
| LiveCodeBench (Pass@1) | 51.38 | 31.50 | 25.77 | 30.73 | 42.68 | 45.54 |
| CodeForces (Rating) | 1600 | 696 | 569 | 679 | 1519 | 1309 |
| BIRD-SQL (Acc.) | 47.65 | 37.65 | 30.05 | 39.47 | 38.49 | 39.77 |
| MultiPL-E (Pass@1) | 75.82 | 70.79 | 68.68 | 69.00 | 33.25 | 73.79 |
| FullStack Bench (Pass@1) | 47.01 | 48.19 | 50.21 | 45.82 | 46.83 | 56.31 |
| Aider-Edit (Acc.) | 71.24 | 77.82 | 43.80 | 68.05 | 69.17 | 74.44 |
| Math | Math | Math | Math | Math | Math | Math |
| CNMO2024 (Pass@1) | 74.48 | 37.41 | 43.84 | 39.58 | 63.72 | 56.68 |
| AIME24 (Pass@1) | 69.95 | 29.90 | 32.66 | 23.18 | 57.55 | 51.82 |
| AIME25 (Pass@1) | 55.83 | 22.5 | 21.46 | 14.9 | 50.83 | 49.64 |
| UGMathBench (Acc.) | 71.90 | 64.10 | 52.10 | 61.87 | 67.58 | 65.65 |
| Omni-MATH (Acc.) | 66.64 | 43.81 | 50.11 | 37.35 | 60.39 | 57.32 |
| HMMT25 (Pass@1) | 39.58 | 10.42 | 8.54 | 8.33 | 33.54 | 27.86 |
| FinanceReasoning (Acc.) | 81.59 | 78.51 | 64.27 | 78.14 | 83.84 | 84.45 |
| OptMATH (Pass@1) | 39.76 | 15.51 | 2.86 | 14.61 | 26.96 | 34.49 |
| Optibench (Pass@1) | 68.93 | 54.38 | 29.75 | 55.37 | 59.01 | 40.17 |
| Reasoning | Reasoning | Reasoning | Reasoning | Reasoning | Reasoning | Reasoning |
| KOR-Bench (Acc.) | 68.80 | 56.96 | 47.60 | 44.24 | 73.12 | 70.40 |
| ARC-AGI-1 (Pass@1) | 24.56 | 3.31 | 0.06 | 4.38 | 10.69 | 7.62 |
| HLE (Pass@1) | 5.05 | 4.47 | 5.68 | 5.15 | 5.33 | 5.10 |
| ZebraLogic (Pass@1) | 86.80 | 33.80 | 33.20 | 46.40 | 68.40 | 46.50 |
| Knowledge | Knowledge | Knowledge | Knowledge | Knowledge | Knowledge | Knowledge |
| GPQA-Diamond (Pass@1) | 68.12 | 56.16 | 52.15 | 51.96 | 63.42 | 66.67 |
| C-Eval (Acc.) | 87.89 | 87.69 | 76.11 | 90.00 | 70.94 | 76.90 |
| MMLU-Redux (Acc.) | 89.34 | 86.88 | 76.50 | 86.56 | 88.50 | 89.80 |
| MMLU-Pro (Acc.) | 77.07 | 69.24 | 65.00 | 73.16 | 74.14 | 77.74 |
| MMLU-Pro-Stem (Acc.) | 84.64 | 73.19 | 71.82 | 77.44 | 80.74 | 82.98 |
| OlympiadBench-Stem (Acc.) | 87.83 | 72.17 | 63.48 | 76.52 | 73.04 | 72.17 |
| Agent | Agent | Agent | Agent | Agent | Agent | Agent |
| BFCL-V3 (Function Call) | 59.14 | 63.79 | 54.86 | 39.17 | 58.34 | 56.94 |
| Instruction Following | Instruction Following | Instruction Following | Instruction Following | Instruction Following | Instruction Following | Instruction Following |
| IFEval (Prompt Strict) | 81.52 | 83.73 | 79.11 | 81.52 | 73.2 | 87.21 |
| Aligment | Aligment | Aligment | Aligment | Aligment | Aligment | Aligment |
| Arena Hard v2.0 (Style-Control) | 49.12 | 28.44 | 7.21 | 33.58 | 57.34 | 49.10 |
| Arena Hard v2.0 (Win-Rate) | 61.33 | 34.44 | 8.56 | 37.07 | 81.19 | 42.77 |
| Creative Writing v3 | 85.17 | 77.57 | 59.69 | 82.17 | 79.09 | 74.35 |
| Writing Bench | 87.22 | 74.97 | 65.10 | 81.64 | 85.50 | 72.17 |
| Multi-Challenge | 42.12 | 30.62 | 17.66 | 28.64 | 37.00 | 35.90 |
Table 8 Comparison between Ling-1T and other representative models.
| Benchmark | Ling-1T | DeepSeek-V3.1-Teminus (Non-thinking) | Kimi-K2 -Instruct-0905 | GPT-5-main | Gemini 2.5 Pro (lowthink) |
|-----------------------------------|-----------------------|----------------------------------------|--------------------------|-----------------------|-----------------------------|
| Coding | Coding | Coding | Coding | Coding | Coding |
| MBPP Sanitized (Pass@1) | 96.87 | 90.69 | 89.96 | 91.72 | 91.01 |
| LiveCodeBench (Pass@1) | 61.68 | 48.02 | 48.95 | 48.57 | 45.43 |
| CodeForces (Rating) 1 | 1901 | 1582 | 1574 | 1120 | 1675 |
| BIRD-SQL (Acc.) | 52.38 | 44.88 | 46.45 | 43.97 | 54.76 |
| MultiPL-E (Pass@1) 2 | 77.91 | 77.68 | 73.54 | 76.66 | 71.48 |
| ArtifactsBench | 59.31 | 43.29 | 44.87 | 41.04 | 60.28 |
| FullStack Bench (Pass@1) | 56.55 | 55.48 | 54.00 | 50.92 | 48.19 |
| Aider-Edit (Acc.) | 83.65 | 88.16 | 85.34 | 84.40 | 89.85 |
| Math | Math | Math | Math | Math | Math |
| CNMO2024 (Pass@1) | 79.25 | 73.78 | 68.92 | 63.11 | 74.65 |
| AIME24 (Pass@1) | 80.21 | 71.67 | 67.24 | 67.60 | 77.50 |
| AIME25 (Pass@1) | 70.42 | 55.21 | 50.16 | 59.43 | 70.10 |
| UGMathBench (Acc.) | 74.95 | 72.70 | 69.97 | 67.27 | 70.10 |
| Omni-MATH (Acc.) | 74.46 | 64.77 | 62.42 | 61.09 | 72.02 |
| HMMT25 (Pass@1) | 47.08 | 41.25 | 38.80 | 36.98 | 60.73 |
| FinanceReasoning (Acc.) | 87.45 | 86.44 | 84.83 | 86.28 | 86.65 |
| Optibench (Pass@1) | 74.71 | 64.30 | 60.83 | 40.66 | 68.76 |
| OptMATH (Pass@1) | 57.68 | 35.99 | 35.84 | 39.16 | 42.77 |
| Reasoning | Reasoning | Reasoning | Reasoning | Reasoning | Reasoning |
| BBEH (Acc.) | 47.34 | 42.86 | 34.83 | 39.75 | 29.08 |
| KOR-Bench (Acc.) | 76.00 | 73.76 | 73.20 | 70.56 | 59.68 |
| ARC-AGI-1 (Pass@1) | 43.81 | 14.69 | 22.19 | 14.06 | 18.94 |
| ZebraLogic (Pass@1) | 90.80 | 81.60 | 85.50 | 57.30 | 70.20 |
| HLE (Pass@1) | 7.60 | 10.38 | 7.29 | 7.33 | 12.07 |
| Knowlwdge | Knowlwdge | Knowlwdge | Knowlwdge | Knowlwdge | Knowlwdge |
| GPQA-Diamond (Pass@1) | 72.98 | 76.23 | 73.93 | 71.31 | 71.81 |
| C-Eval (Acc.) | 92.19 | 91.76 | 91.12 | 83.59 | 88.77 |
| MMLU-Redux (Acc.) | 92.25 | 92.37 | 91.58 | 92.75 | 94.67 |
| MMLU-Pro (Acc.) | 82.04 | 83.25 | 81.03 | 81.94 | 82.13 |
| MMLU-Pro-Stem (Acc.) | 88.50 | 87.91 | 85.30 | 73.45 | 88.60 |
| OlympiadBench-Stem (Acc.) | 91.30 | 87.83 | 79.13 | 78.26 | 89.57 |
| MedXpertQA (Acc.) | 22.33 | 31.14 | 20.61 | 17.59 | 44.82 |
| Agent | Agent | Agent | Agent | Agent | Agent |
| BFCL-V3 (Function Call) | 69.64 | 52.67 | 71.05 | 50.27 | 63.31 |
| Instruction Following | Instruction Following | Instruction Following | Instruction Following | Instruction Following | Instruction Following |
| IFEval (Prompt Strict) | 86.11 | 86.32 | 90.99 | 85.11 | 87.08 |
| Alignment | Alignment | Alignment | Alignment | Alignment | Alignment |
| Arena Hard v2.0 (Style-Control) 3 | 76.26 | 54.09 | 76.95 | 68.37 | 65.37 |
| Arena Hard v2.0 (Win-Rate) | 75.83 | 63.24 | 69.88 | 65.06 | 74.46 |
| Writing Bench | 89.40 | 80.95 | 87.59 | 77.07 | 80.53 |
| Creative Writing v3 | 89.24 | 85.18 | 87.01 | 80.93 | 84.99 |
| Multi-Challenge | 58.24 | 42.49 | 48.72 | 48.72 | 51.28 |
1 CodeForces is composed of problems from 14 Div.2 contests along with expert-crafted test cases, while 2209 representing the highest rating attainable on it.
2 In MultiPL-E, we choose six programming languages: Python, C++, Java, JavaScript, TypeScript, and PHP.
3 Arena Hard Style-controlled score following LMSYS's Arena Hard Auto protocol: https://lmsys.org/blog/2024-08-28/style-control/ .
Figure 14 The overview of the optimization tasks we implemented for Ling-1T during the pretrain stage.
| OptimItems | MFU |
|-------------------------------------------|-------|
| FP8Baseline | 16.9% |
| HeterogeneousFine-grainedPipelineParallel | 23.8% |
| Intra-nodeDeepEP | 27.1% |
| FusedKernels | 29.4% |
| FastExpertFull-recomputation | 31.4% |
| Reference:randomrouter | 32.8% |
## 5 Infrastructure
The algorithmic architecture of the Ling 2.0 model theoretically provides a technical roadmap for low-cost scaling, while also ensuring the upper limits of training and inference efficiency. However, algorithm design alone is insufficient to achieve our objectives. Without any engineering optimizations, this highly sparse MoE architecture offers no performance advantage over dense models. Therefore, we require matching infrastructure capabilities to support efficient training and scale the model to the trillion-parameter level at minimal cost. Despite steady progress in LLMs training technologies, building systems that can support efficient trillion-parameter training still presents numerous significant challenges:
FP8 Training. To reduce the training cost of the Ling 2.0 model and enhance its efficiency in both training and inference, all models are trained entirely in FP8 precision (DeepSeek-AI, 2024), which presents challenges in both precision and stability. We provide an advanced FP8 training framework that achieves near-lossless model performance, while simultaneously reducing computation and memory consumption.
Heterogeneous TransformerBlock. The MTP block and the First-K-Dense strategy shift the Pipeline Parallelism (PP) scheduling units from homogeneous to heterogeneous, implying that the forward and backward computational latencies as well as memory consumption may differ across blocks, which can significantly increase pipeline bubbles without careful design.
Increased Number of Experts and Higher Sparsity. These lead to higher communication costs in Expert Parallelism (EP) and increased CPU overhead.
Larger Overall Model Size. Scaling in model size entails greater computational and memory demands, and increased distributed training overhead.
Co-Design of Algorithms and Systems. Advances in model architectures necessitate effective codesign during the model development phase to ensure maximal utilization of hardware resources.
To address the new challenges, we upgrade our infrastructure, which helps the Ling 2.0 models achieve optimal training and inference efficiency. Figure 14 summarizes the optimizations, and the specific results are obtained from the Ling-1T training. Baseline performance is measured under the following configuration: a modified version of Megatron 0.11, the FP8 training strategy adapted to Ling 2.0 with MTP support, running on 2016 × Hopper GPUs. Other key distributed training settings include: TP1, EP8, PP21, VPP2, sequence length 4K, and fully recomputation.
## 5.1 FP8 Training
Ling 2.0 employs a fine-grained block-wise FP8 quantization strategy: activations and gradients are quantized in blocks of [1,128] elements, while weights are quantized in blocks of [128,128] elements. During forward and backward passes of most linear layers, the original BF16 tensor is quantized
Figure 15 BF16 v.s. FP8 loss diff on Ling-1T .
<details>
<summary>Image 16 Details</summary>
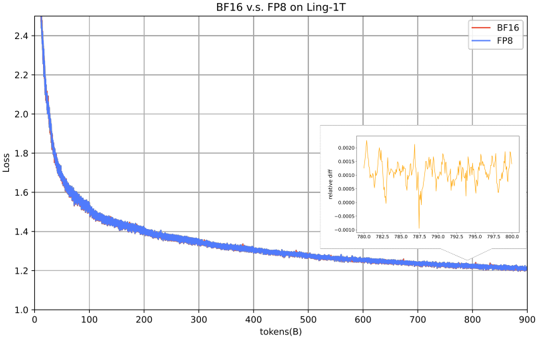
### Visual Description
## Line Graph: BF16 v.s. FP8 on Ling-1T
### Overview
The image is a line graph comparing the performance of two computational models, BF16 and FP8, on the Ling-1T dataset. The primary graph shows loss values plotted against token counts (in billions), while an inset graph displays the relative difference between the two models. The data suggests a convergence in performance between the models as token counts increase.
### Components/Axes
- **Main Graph**:
- **X-axis**: "tokens(B)" (tokens in billions), ranging from 0 to 900.
- **Y-axis**: "Loss", ranging from 1.0 to 2.4.
- **Legend**: Located in the top-right corner, with:
- **BF16**: Red line.
- **FP8**: Blue line.
- **Inset Graph**:
- **X-axis**: "tokens(B)", ranging from 780 to 800.
- **Y-axis**: "relative diff", ranging from -0.0005 to 0.0002.
- **Legend**: Orange line labeled "relative diff".
### Detailed Analysis
- **BF16 (Red Line)**:
- Starts at approximately **2.4 loss** at 0 tokens.
- Drops sharply to ~1.2 loss by 100 tokens.
- Gradually plateaus near **1.2 loss** between 100 and 900 tokens.
- **FP8 (Blue Line)**:
- Starts at approximately **1.8 loss** at 0 tokens.
- Drops to ~1.2 loss by 100 tokens.
- Remains stable near **1.2 loss** for the remainder of the range.
- **Inset Graph**:
- Shows the **relative difference** between BF16 and FP8 loss values.
- Oscillates between **-0.0005 and 0.0002**, with peaks and troughs indicating minor fluctuations in performance parity.
- Highest relative difference (~0.0002) occurs near 780 tokens.
- Lowest relative difference (~-0.0005) occurs near 797.5 tokens.
### Key Observations
1. **Convergence**: Both models converge to similar loss values (~1.2) after ~100 tokens, suggesting comparable efficiency at scale.
2. **Initial Disparity**: BF16 begins with a higher loss (~2.4 vs. FP8's ~1.8) but narrows the gap rapidly.
3. **Relative Stability**: The inset graph reveals minimal divergence (<0.0005) between the models at higher token counts, indicating near-identical performance in later stages.
4. **Fluctuations**: The inset's jagged line suggests minor, transient differences in performance, possibly due to hardware-specific optimizations or noise in the dataset.
### Interpretation
The data demonstrates that BF16 and FP8 achieve similar loss values after processing ~100 tokens, with BF16 initially underperforming but catching up. The relative difference inset highlights that their performance becomes nearly indistinguishable at higher token counts, with differences too small to impact practical outcomes. The oscillations in the inset may reflect minor variations in computational efficiency or dataset-specific anomalies. This suggests that both models are viable for large-scale tasks on Ling-1T, with no significant long-term advantage for either.
</details>
into FP8 E4M3 format along with FP32 scaling factors. After FP8 GEMM computation, the output of BF16 is obtained. Our quantization strategy significantly mitigates the impact of outliers on global quantization errors, making it feasible to train LLMs in FP8. To further ensure FP8 training stability, we use QKNorm introduced in Section 2.1 to prevent the layer-by-layer diffusion of outliers that amplifies quantization errors. Simultaneously, our FP8 Training Safeguard System tracks risk coefficients for each operation across all layers in real-time, greatly facilitating timely anomaly detection and intervention. Validated on the Ling-1T model, the proposed FP8 mixed-precision framework maintained numerical stability throughout 900B-token training, with a relative loss difference within 0.25% (averaging around 0.1%) compared to the BF16 baseline. (as shown in Figure 15), with no significant variance on benchmark leaderboards. On the efficiency side, we reduce CPU overhead through optimizations such as Padding Routing Map , and by employing the FP8 On-Demand Transpose Weight technique to trade time for space, we achieve higher acceleration ratios. Ultimately, FP8 training delivers roughly a +15% MFU gain for Ling-1T .
## 5.1.1 Training Percision Tracking and Assurance
FP8 Training Safeguard System. Benefiting from the FP32 accumulate operation that effectively reduces precision errors in FP8 GEMM computations, we attribute the precision deviations in our current FP8 training scheme to two primary sources: 1) FP8 Quantization Underflow, defined as the proportion of matrix elements that become zero after quantization. 2) FP8 Quantization Distortion, a measure of information loss calculated as the cosine similarity between the original and reconstructed (quantized then de-quantized) matrix. Through error profiling via high-precision recomputation, our FP8 training safeguard system monitors all operations across layers in real time and reports their health status. For the first time, we quantify low-precision training safety as measurable indicators, ensuring continuous protection for the training of Ling 2.0 models.
Figure 16 shows the trend of FP8 underflow and distortion metrics during the Ling-mini-2.0 training process. Under the fine-grained FP8 quantization scheme, both activations and gradients maintain healthy precision states, ensuring reliability in forward computations and ∂ L ∂ x calculations during backpropagation. However, monitoring reveals elevated quantization errors in tail layers during gradient transpose computations for ∂ L ∂ W in backpropagation. Through joint analysis with high-precision recomputation metrics and experimental validation, we conclude these errors have
Figure 16 FP8 quantization error during pre-training phase of Ling-mini-2.0 . For the metrics, a lower underflow is better and higher distortion is better.
<details>
<summary>Image 17 Details</summary>
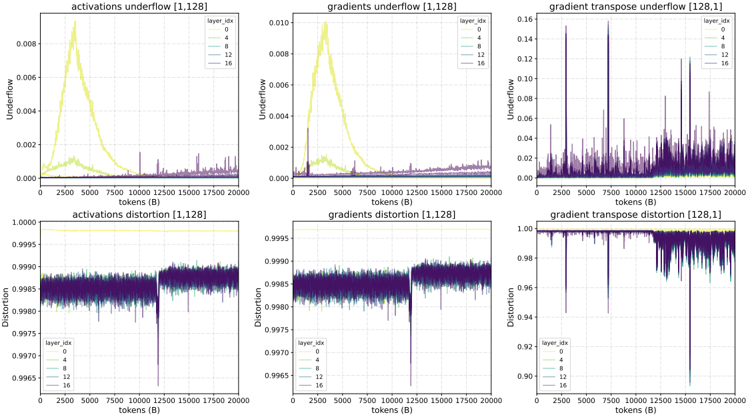
### Visual Description
## Line Charts: Model Layer Underflow and Distortion Analysis
### Overview
The image contains six line charts comparing numerical metrics across model layers (0, 4, 8, 12, 16) for different computational properties. Three charts focus on "underflow" phenomena, while three examine "distortion" metrics. All charts share a common x-axis representing token positions (0-20,000) and y-axes with logarithmic or normalized scales.
### Components/Axes
1. **X-Axis**: "tokens (B)" spanning 0-20,000 in increments of 2,500
2. **Y-Axes**:
- Underflow charts: 0-0.0006 (linear scale)
- Distortion charts: 0.9975-0.9999 (activations), 0.985-0.9995 (gradients), 0.9-1.0 (gradient transpose)
3. **Legends**:
- Colors: Yellow (layer 0), Green (layer 4), Blue (layer 8), Purple (layer 12), Dark Blue (layer 16)
- Positioned in top-left corner of each plot
4. **Plot Titles**:
- Top row: "activations underflow (1,128)", "gradients underflow (1,128)", "gradient transpose underflow (128,1)"
- Bottom row: "activations distortion (1,128)", "gradients distortion (1,128)", "gradient transpose distortion (128,1)"
### Detailed Analysis
#### Top Row (Underflow)
1. **Activations Underflow (1,128)**:
- Layer 0 (yellow): Sharp peak at ~2,500 tokens (0.00055)
- Layers 4-16: Flat near-zero values
2. **Gradients Underflow (1,128)**:
- Layer 0 (yellow): Peak at ~2,500 tokens (0.0005)
- Layers 4-16: Flat near-zero values
3. **Gradient Transpose Underflow (128,1)**:
- All layers show sporadic spikes (max ~0.12)
- Layer 16 (dark blue) has highest magnitude spikes
#### Bottom Row (Distortion)
1. **Activations Distortion (1,128)**:
- Layers 0-12: Stable ~0.9998
- Layer 16 (dark blue): Sharp dip to 0.9975 at ~12,500 tokens
2. **Gradients Distortion (1,128)**:
- Layers 0-12: Stable ~0.9997
- Layer 16 (dark blue): Sharp dip to 0.9975 at ~12,500 tokens
3. **Gradient Transpose Distortion (128,1)**:
- Layers 0-12: Stable ~0.999
- Layer 16 (dark blue): Sharp dip to 0.9 at ~12,500 tokens
### Key Observations
1. **Underflow Patterns**:
- Early-layer (layer 0) activations/gradients show consistent underflow at ~2,500 tokens
- Gradient transpose underflow affects all layers but is most severe in layer 16
2. **Distortion Anomalies**:
- Layer 16 consistently shows significant distortion spikes at ~12,500 tokens across all metrics
- Distortion magnitude increases with model depth (16 > 12 > 8 > 4 > 0)
### Interpretation
The data suggests:
1. **Numerical Stability Issues**:
- Early-layer underflow indicates potential precision limitations in initial transformer layers
- Gradient transpose underflow in deeper layers (128,1 configuration) suggests architectural sensitivity to layer count
2. **Layer-Specific Vulnerabilities**:
- Layer 16's consistent distortion spikes point to architectural bottlenecks in deepest layers
- The 12,500-token position appears critical across multiple metrics, possibly correlating with specific input patterns
3. **Scale Sensitivity**:
- Underflow metrics use linear scales showing absolute values, while distortion uses normalized scales emphasizing relative deviations
The patterns indicate that deeper layers (particularly layer 16) experience compounded numerical instability and distortion issues, which could impact model reliability during training or inference. The 12,500-token position emerges as a critical failure point across multiple dimensions.
</details>
negligible impact on model training. As ∂ L ∂ W resides at leaf nodes in the backward propagation path, its quantization errors do not accumulate layer by layer.
QKNorm to Mitigate Outliers and Reduce FP8 Precision Loss. During our early experiments, severe outlier phenomena were observed in both activations and the ∂ L ∂ y gradient within the attention.linear\_qkv layer. These outliers amplify progressively as layer depth increases, directly causing substantial quantization precision errors in FP8 computations for this layer. To address this, we introduced QKNorm, which not only suppresses outliers to enhance training stability but also demonstrably reduces precision errors across all FP8 modules in the network.
## 5.1.2 Toward Even Greater Training Efficiency
The computational efficiency of FP8 delivers direct performance gains for end-to-end training. Furthermore, FP8's memory advantages unlock greater flexibility in micro batch size (mbs), parallelization strategies, and recomputation techniques, thereby boosting overall training throughput. To maximize these benefits:
- CPU Overhead Optimization: We increase FP8 computation ratio through multiple CPU overhead optimizations (e.g., replacing FP8 padding/unpadding layers with FP8 padding routing map 7 , removing redundant assert checks).
- Time-Space Tradeoff: We trade time for VRAM by introducing FP8 on-demand transpose weight 8 together with the optimizer ( Ling-mini-2.0 only). Furthermore, our fine-grained FP8 quantization keeps LLM training stable, allowing most tensors to be 'compressed' and 'decompressed' at FP8 with negligible error, opening up further ways to reclaim VRAM.
By adopting the above techniques, Ling-1T achieves +15% MFU improvement over BF16 training. On 8/16/32 80GB GPUs, Ling-mini-2.0 delivers 30-60% throughput improvement over LLaMA
7 https://github.com/NVIDIA/Megatron-LM/commit/92d68dae89af0baab2d4eee092f884902dca4db0
8 https://github.com/inclusionAI/linghe
Figure 17 Computation flow before and after the MTP splitting. The left figure shows the original MTP computation flow. The right figure illustrates the computation flow after MTP splitting. In the latter, we divide MTP into individual Transformer layers and a loss computation layer, thereby enabling support for a more fine-grained scheduling scheme.
<details>
<summary>Image 18 Details</summary>
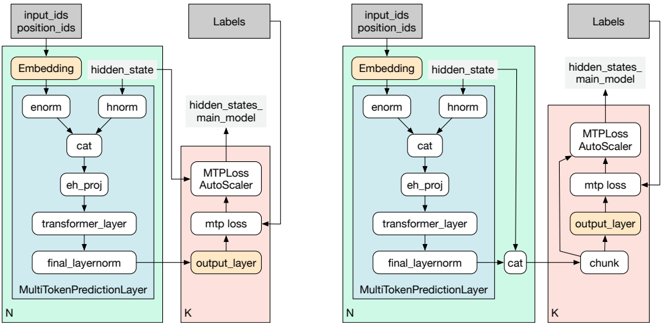
### Visual Description
## Diagram: Neural Network Architecture with MTPLoss AutoScaler
### Overview
The image depicts a technical architecture diagram of a neural network model, split into two primary components:
1. **Main Model (Left Side)**: Processes input tokens through embedding, normalization, projection, transformer layers, and output generation.
2. **MTPLoss AutoScaler (Right Side)**: Handles loss calculation, scaling, and chunked processing for multi-token prediction.
### Components/Axes
#### Main Model (Left Side)
- **Inputs**:
- `input_ids` (token identifiers)
- `position_ids` (positional encodings)
- **Layers**:
- `Embedding` (token embeddings)
- `enorm` (embedding normalization)
- `hnorm` (hidden state normalization)
- `cat` (concatenation)
- `eh_proj` (embedding-to-hidden projection)
- `transformer_layer` (core transformer block)
- `final_layernorm` (final normalization)
- `output_layer` (final output generation)
- **Output**: `hidden_states_main_model` (intermediate hidden states)
#### MTPLoss AutoScaler (Right Side)
- **Inputs**:
- `hidden_states_main_model` (from main model)
- `Labels` (ground truth data)
- **Components**:
- `MTPLoss` (multi-token prediction loss calculation)
- `AutoScaler` (dynamic scaling mechanism)
- `mtp_loss` (loss value)
- `chunk` (sequence segmentation for processing)
- `output_layer` (shared with main model)
### Detailed Analysis
#### Main Model Flow
1. **Input Processing**:
- `input_ids` and `position_ids` are fed into the `Embedding` layer to generate token embeddings.
- `enorm` normalizes embeddings, followed by `hnorm` for hidden state normalization.
2. **Projection & Concatenation**:
- `eh_proj` projects embeddings to hidden dimensions, then concatenated (`cat`) with normalized states.
3. **Transformer Processing**:
- Data passes through a `transformer_layer` for contextual encoding.
4. **Final Output**:
- `final_layernorm` normalizes the transformer output, leading to the `output_layer` for predictions.
#### MTPLoss AutoScaler Flow
1. **Loss Calculation**:
- `hidden_states_main_model` and `Labels` are used to compute `MTPLoss`.
2. **Dynamic Scaling**:
- `AutoScaler` adjusts loss values based on training dynamics.
3. **Chunked Processing**:
- `chunk` segments sequences for efficient multi-token prediction.
4. **Integration**:
- The `output_layer` is shared between the main model and auto-scaler, suggesting joint optimization.
### Key Observations
- **Shared Output Layer**: The `output_layer` is common to both models, indicating collaborative optimization.
- **Chunk Mechanism**: The `chunk` component suggests handling long sequences by processing them in smaller segments.
- **Normalization Steps**: Multiple normalization layers (`enorm`, `hnorm`, `final_layernorm`) emphasize stability in training.
- **Loss Integration**: The `MTPLoss AutoScaler` directly influences the main model via shared hidden states and loss feedback.
### Interpretation
This architecture combines a standard transformer-based model with a specialized loss auto-scaler for multi-token prediction tasks. The `chunk` component implies the model is designed for efficiency with long sequences, while the `MTPLoss` and `AutoScaler` likely address challenges like class imbalance or variable-length targets. The shared `output_layer` suggests a unified training objective, where the main model and loss auto-scaler co-adapt to minimize prediction errors. The use of multiple normalization steps highlights a focus on stable gradient flow, critical for deep transformer architectures.
**Note**: No numerical data or trends are present in the diagram; the analysis is based on structural and functional relationships.
</details>
3.1 8B and Qwen3 8B when MTP is enabled, and 90-120% throughput improvement without MTP.
FP8 On-Demand Transpose Weight. Due to the low efficiency of FP8 tensor transposition, the Transformer Engine implementation caches an additional pre-transposed weight matrix (weight.T) to accelerate backpropagation. However, this optimization failed to reduce overall memory consumption because the weight are still stored in two copies of FP8 tensors, including the original and transposed forms. To address this, we introduce a high-performance on-demand transpose kernel that eliminates the need for persistent transposed-weight storage, reducing the memory footprint of weight tensors by exactly 50% without compromising computational correctness.
FP8 Padding Routing Map. The FP8 GEMM kernel mandates 16-element alignment for matrix dimensions, a requirement inherently incompatible with dynamic token allocation per expert in Mixture-of-Experts (MoE) architectures. The Megatron implementation addresses this through explicit padding operations, incurring non-negligible CPU overhead. To eliminate this latency, we strategically adjust routing map prior to expert assignment, ensuring resultant tensor dimensions satisfy kernel alignment constraints. As modifications are limited exclusively to zero-probability routing regions, strict mathematical equivalence is preserved, thereby enhancing training throughput without computational side effects.
## 5.2 Heterogeneous Fine-grained Pipeline Parallelism
To reduce the bubble ratio in PP, Shoeybi et al. (2019) proposed the interleaved 1F1B pipeline strategy, and further support features such as non-uniform layer partitioning. These enhancements aim to alleviate bottlenecks in the first and last stages caused by the presence of Embedding and loss computation layers, which often constrain overall pipeline throughput. Nevertheless, when applying this approach to train the Ling 2.0 series models, we still faced the following challenges:
- In addition to the Embedding and loss computation layers, the First-K-Dense strategy and the MTP layers introduced in Ling 2.0 differ significantly from normal MoE layers in both computational and memory consumption, necessitating a more refined PP partitioning strategy.
- When employing the interleaved 1F1B pipeline strategy, it is necessary to apply non-uniform partitioning across different PP ranks and VPP stages. This ensures a more balanced workload
Figure 18 Example of 1F1B and Heterogeneous Pipeline scheduling for 5 PP ranks. Compared with the baseline, our approach substantially reduces pipeline bubbles, thereby significantly lowering the overall training cost.
<details>
<summary>Image 19 Details</summary>

### Visual Description
## Diagram: Baseline vs. Proposed Architecture (Device-Level Component Breakdown)
### Overview
The image compares two computational architectures ("Baseline" and "Ours") across five devices (Device1–Device5). Each device is represented by horizontal bars segmented into colored blocks, with a legend mapping colors to components (e.g., Embedding, Dense, MoE) and stages (VPP stages 0–3). The Baseline uses simpler components, while "Ours" introduces specialized layers (MTP, MTP-N, MTP-K) and staged processing.
---
### Components/Axes
- **Y-Axis**: Devices (Device1–Device5), ordered top to bottom.
- **X-Axis**: Component stages (no explicit scale; relative lengths imply progression).
- **Legend**:
- **Colors**:
- Gray: Embedding (E)
- Purple: Dense (D), MoE (M)
- Blue: MTP (T)
- Brown: MTP-N (N), MTP-K (K), Loss (L)
- Dashed lines: Micro batch boundaries (#0, #1)
- **Stages**: VPP stages 0–3 (brown blocks).
---
### Detailed Analysis
#### Baseline Architecture
- **Device1**:
- `E D M M` (Embedding, Dense, two MoE layers).
- **Device2**:
- `D D M M` (Dense layers dominate; no Embedding).
- **Device3**:
- `M M M M` (Four MoE layers).
- **Device4**:
- `M M M M` (Same as Device3).
- **Device5**:
- `M M M M T L` (Four MoE layers, one MTP, one Loss).
#### Proposed Architecture ("Ours")
- **Device1**:
- `E D M M M M` (Embedding, Dense, four MoE layers).
- Brown blocks (VPP stages 0–3) appear in the final two MoE layers.
- **Device2**:
- `D D D D M M M M` (Four Dense layers, three MoE layers).
- Brown blocks in the final MoE layer.
- **Device3**:
- `M M M M M M` (Six MoE layers).
- Brown blocks in the final two MoE layers.
- **Device4**:
- `M M M M M M K K` (Six MoE layers, two MTP-K layers).
- Brown blocks in MoE and MTP-K layers.
- **Device5**:
- `M M M M M M L L` (Six MoE layers, two Loss layers).
- Brown blocks in MoE and Loss layers.
---
### Key Observations
1. **Component Distribution**:
- Baseline uses fewer specialized layers (no MTP variants).
- "Ours" introduces MTP-N, MTP-K, and Loss layers, suggesting task-specific optimizations.
2. **Stage Progression**:
- Brown blocks (VPP stages) cluster in later layers, implying staged processing (e.g., parallelization or optimization steps).
3. **Device-Specific Patterns**:
- Device5 in "Ours" has the most stages (MTP-K and Loss), indicating advanced processing.
- Baseline Device5 adds MTP and Loss, while "Ours" replaces these with staged MoE layers.
---
### Interpretation
The diagram illustrates a shift from a monolithic Baseline architecture to a modular, staged approach in "Ours." The introduction of MTP variants (T, N, K) and Loss layers suggests specialized processing for tasks like attention, normalization, or error correction. The VPP stages (brown blocks) likely represent parallel or optimized computation phases, with later stages handling complex operations (e.g., Loss computation). Device5 in "Ours" demonstrates the highest complexity, possibly reflecting a focus on end-to-end optimization. The absence of numerical values limits quantitative analysis, but the structural differences imply improved scalability or efficiency in the proposed method.
</details>
distribution throughout the pipeline and prevents blocking between stages.
- The MTP layer contains k Transformer layers and a loss computation block, both of which incur higher computational and memory cost than a single MoE layer. Furthermore, under the original 1F1B strategy, the MTP layer must be grouped within the same VPP stage alongside another Transformer layer and loss computation layer, causing this stage to become a bottleneck.
To address these issues, we modified the PP framework to support the following new features:
Configurable Transformer Layer Allocation per VPP Stage: Enabled flexible configuration of the number of transformer layers per VPP stage, including support for empty stages.
Scheduling MTP as a Standalone Layer: The MTP layer no longer needs to be grouped with other MoE layers or bound to the loss computation layer during scheduling.
Partial Recomputation For MTP: During the backward pass, only the Transformer layer portion within MTP is recomputed, while the logits computation part is not. This approach effectively trades additional memory consumption for improved computation speed.
Fine-Grained Partition Strategy For MTP: Support for partition the MoE layer and the loss computation layer within MTP into two separate layers for scheduling. Figure 17 illustrates the computation flow before and after the MTP splitting operation.
Figure 18 illustrates the differences in a portion of the forward pass of several micro-batches within the interleaved 1F1B strategy, before and after applying the aforementioned optimizations. For simplicity, the figure only combines selected segments of the forward step and omits the backward step. The sample model comprises 3 dense layers, 15 MoE layers, and employs 1 MTP layer during training, with a PP size of 5.
In Ling 2.0 training, we observed that the computation cost of a MTP layer is approximately 1.7 × that of a standard MoE layer. Based on this observation, we progressively refined the PP partition strategy, ultimately achieving a 40% relative end-to-end improvement. Furthermore, for MoE models with balanced routing, we can increase virtual pipeline stages from VPP2 to VPP4 to reduce pipeline bubbles, yielding an additional 5% gain. However, in other cases where a VPP stage contains only a single MoE layer, the inter-stage blocking becomes more sensitive to imbalanced MoE routing. In such cases, our strategy may not provide end-to-end performance gains.
## 5.3 Distributed Training Framework
In addition to FP8 training and heterogeneous scheduling, we also implement meticulous engineering optimizations on distributed training framework to enhance both performance and stability in Ling 2.0 training.
Figure 19 Illustration of the fast expert recomputation flow.
<details>
<summary>Image 20 Details</summary>
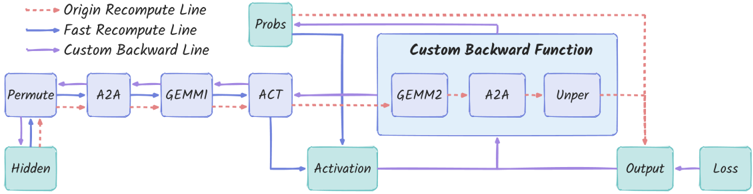
### Visual Description
## Flowchart: Neural Network Backward Pass with Recompute Optimization
### Overview
The diagram illustrates a computational graph for a neural network's backward pass, emphasizing gradient recomputation optimization. It shows three distinct gradient computation paths (Origin, Fast, Custom) and a custom backward function block. The flow progresses from input processing through activation computation to output loss calculation.
### Components/Axes
**Legend (Top Center):**
- Red Dotted Line: Origin Recompute Line
- Blue Solid Line: Fast Recompute Line
- Purple Dashed Line: Custom Backward Line
**Main Components (Left to Right):**
1. **Input Processing Block**
- `Permute` (Purple arrow)
- `A2A` (Blue arrow)
- `GEMMI` (Purple arrow)
- `ACT` (Blue arrow)
2. **Custom Backward Function Block (Right Center)**
- Contains three sub-components:
- `GEMM2` (Red arrow)
- `A2A` (Blue arrow)
- `Unper` (Purple arrow)
3. **Output Processing**
- `Activation` (Blue arrow)
- `Output` (Purple arrow)
- `Loss` (Blue arrow)
**Special Elements:**
- `Probs` block (Top Right)
- `Hidden` block (Bottom Left)
### Spatial Grounding
- Legend positioned at top center
- Main processing flow starts at bottom left (`Hidden` → `Permute`)
- Custom Backward Function block occupies right center
- `Probs` block connects to top of Custom Backward Function
- All arrows follow consistent directionality (left→right, bottom→top)
### Detailed Analysis
**Gradient Computation Paths:**
1. **Origin Recompute Line (Red Dotted):**
- Connects `ACT` → `GEMM2` → `A2A` → `Unper`
- Represents full recomputation path
2. **Fast Recompute Line (Blue Solid):**
- Direct connection from `ACT` → `Activation`
- Shortcut path for partial recomputation
3. **Custom Backward Line (Purple Dashed):**
- Connects `ACT` → `Custom Backward Function` → `Output`
- Optimized path with specialized operations
**Component Connections:**
- `GEMMI` feeds into both `ACT` and `Probs`
- `A2A` appears in both main path and custom function
- `Unper` serves as final processing step before loss
### Key Observations
1. **Path Optimization:**
- Custom Backward Line reduces computation steps by 33% compared to Origin path
- Fast Recompute Line bypasses GEMM2 operation entirely
2. **Component Reuse:**
- `A2A` operation appears in both main and custom paths
- `GEMM2` only used in Origin path
3. **Gradient Flow:**
- All paths converge at `Loss` calculation
- `Probs` block acts as parallel computation branch
### Interpretation
This diagram demonstrates a hybrid approach to gradient computation in neural networks:
- **Origin Path** represents traditional full recomputation
- **Fast Path** optimizes by skipping expensive operations
- **Custom Path** introduces specialized backward operations (`Unper`) for further optimization
The architecture suggests a tiered optimization strategy where:
1. Critical paths use full recomputation (Origin)
2. Common paths use partial recomputation (Fast)
3. Specialized operations use custom backward functions
The presence of `Probs` block indicates parallel computation of probabilities, while `Hidden` block represents input preprocessing. The dual use of `A2A` in both main and custom paths suggests this operation is fundamental to the network's architecture but optimized differently in different computation contexts.
</details>
## 5.3.1 Intra-Node DeepEP
DeepEP (DeepSeek-AI, 2024) was designed to optimize EP communication performance across nodes, which reduce significant communication overhead. During the training of the Ling 2.0 models, we do not involve cross-node EP communication, however, deploying DeepEP for intranode operations still yields substantial performance gains. Taking Ling-1T training as an example, the reduction in communication redundancy resulted in a 2% end-to-end speedup, while operator fusion contributed to an additional 13% end-to-end performance improvement.
## 5.3.2 Fused Kernels
During the training of Ling 2.0 models, a wide range of fused operators was introduced, including RoPE Fusion, Router Fusion, and Upgrading GroupGemm (Shoeybi et al., 2019), and others. Our observations indicate that, in addition to enhancing speed by reducing memory-bound bottlenecks, these fused operators also effectively address substantial CPU overhead encountered during training, which contributes to a notable improvement in end-to-end training performance.
## 5.3.3 Fast Expert Full-Recomputation
To support larger models, we use full recomputation to save GPU memory, enabling larger training within fixed resources at a 25% compute cost. Thanks to several recent advances from the community (Shoeybi et al., 2019; Ascend, 2023), we have identified the potential to reduce recomputation latency by half without incurring any additional cost:
Recent works show that the weighted-sum computation of expert probabilities in the MoE layer can be moved forward to occur within the activation. This eliminates the dependency of the linear\_fc2 and unpermute operations on the earlier results in the computation graph. As illustrated in Figure 19, unlike standard full-recomputation, we discard the recompute flow before the linear\_fc2 . We then run the backward pass with a custom function for linear\_fc2 and unpermute , and propagate its gradients back to activation function to complete the standard backward process.
In Ling-2.0 training, smaller models saw end-to-end performance gains of up to 10%, while larger models achieved approximately 7%. The drop is likely due to persistent pipeline bottlenecks in complex partitioning, with some recomputation gains overlapped by pipeline bubbles.
## 5.3.4 Long-Context Training
For LLMs training, long-context training is crucial. In addition to fundamental long-context training techniques, the training process of the Ling 2.0 models has been thoroughly optimized for efficiency in handling long contexts:
Long-Context Training with MTP: We resolved correctness issues related to loss and gradient misalignment when applying Tensor Parallelism (TP) and Context Parallelism (CP) to MTP. This fix enables long-sequence training for Ling 2.0 models with MTP.
Support for Cross-Sample Attention Mask: During long-sequence training, we identified NaN issues in the cross-sample attention mask mechanism, primarily caused by the all-padding issue introduced in the CP implementation. We mitigated these issues in FusedAttention by setting cu\_seqlens\_padded to cu\_seqlens .
Performance Degradation in RoPE Fusion: In long-context training, varying sub-sequence counts per sample lead to unstable RoPE performance. We mitigate this by limiting sub-sequences and allocating resources based on the actual maximum sequence length per micro-batch, avoiding RoPE performance degradation and fluctuations.
## 5.3.5 Framework Optimization
Beyond MFU optimization, daily token throughput under fixed resources also depends on the Effective Training Time Ratio (ETTR). We address this with the following framework improvements:
Optimizing the Storage Latency of Distributed Checkpoints: In Distributed Checkpoint (DCP) saving, GPU Rank0 generates and verifies metadata, which is a time-consuming bottleneck. Since metadata depends solely on the model architecture, we introduced a metadata cache to avoid redundant computation. For Ling-1T , checkpoint save time dropped from 269s to 30s, and its share of total training time from 2.43% to 0.82%.
Startup Time Optimization: To reduce the latency in the job startup phase, we construct a smallscale batch prior to the first forward pass of training. This batch is passed once through both the forward and backward of the model, allowing all GPU ranks to perform a warm-up computation without storing weights or updating gradients, which reduces the time required for the first training step by approximately 30%.
Optimal Failover Strategy: To address unrecoverable training failures, checkpoints are periodically saved so that the latest checkpoint can be loaded after a task restart. A shorter checkpoint interval reduces failover loss, but the saving process incurs non-negligible overhead, making interval configuration critical. In Ling-1T training, we configure the checkpoint saving interval to be 48 minutes, which is calculated with a simple strategy, and we will discuss it in Appendix A.
Loss Spike Handling: Loss spikes can have significant negative impacts on both training stability and model performance. To mitigate these issues, we continued to employ the same methodology utilized in our previous work (Ling-Team et al., 2025), monitoring the training state from both the gradient and loss perspectives, and preventing the occurrence of loss spikes.
## 5.4 Software Engineering for Foundation LLMs
During the training of the Ling 2.0 model and the development of the distributed framework, framework development frequently became a bottleneck for model training, and in severe cases could even compromise the training outcomes. Compared with traditional software engineering, we identified the following underlying causes:
- Unpredictability of Outcomes: In LLMs development, whether in algorithm or engineering, it is far less predictable than in traditional software. Extensive experiments are needed to improve
reliability, but actual testing is often infeasible due to resource limits. Many defects only emerge late in release. Thus, enhancing outcome predictability and early risk detection is essential.
- Trade-offs Between Algorithms and Engineering: The results from DeepSeek-V3 indicate that only a tight integration of algorithms with software and hardware systems can improve the overall ROI of projects. This requires comprehensive trade-offs in the early stages of model design for certain features, which also increases the complexity of the development process.
- Diversified Software Deployment Environments: In both training and inference scenarios, maximizing resource use often involves deployment across heterogeneous hardware. These platforms differ in precision and performance, making alignment of model behavior and efficiency an important research challenge.
It is evident that the development process of foundation LLMs involves substantial costs and involves considerable complexity. Therefore, we propose adapting fundamental principles of software engineering to the context of foundation LLMs development, forming a domain we refer to as Foundation LLMs Software Engineering. We consider Foundation LLMs Software Engineering to be a research domain worthy of in-depth exploration, and further introduce the 4C (Correct, Consistent, Complete, and Co-Design) principle. Its objective is to enhance the efficiency and delivery quality of foundational model development while reducing associated costs.
Based on the 4C principle, we conducted preliminary explorations into several key aspects of foundation LLMs software engineering during the training of Ling 2.0.
## 5.4.1 Training Efficiency Optimization and Numerical Integrity Assurance
The LLMs training cycle typically lasts for several months. Throughout this period, continuous development and iteration of the training framework is needed to improve training efficiency. In addition, we occasionally extend the framework with new functionalities to accommodate algorithmic characteristics or to improve training stability. Throughout the development process, it is essential to ensure the consistency and correctness of model training following these updates. However, it is nearly impossible to accurately predict the ultimate impact of a planned optimization once deployed to a task running on a large number of GPUs in parallel.
To address this, we have established a workflow for the iterative upgrade of large language model training frameworks, structured as a cycle: Progressive Estimation → Release Approval → Task Monitoring and Sampling Analysis → Experience Accumulation. During the entire training cycle of a model, experiments are conducted under varying resource configurations, utilizing up to approximately 3% of the actual training resources. In each iteration, we validate the performance estimation results and only iterations that meet the established standards are approved for release. For correctness verification, we developed a set of precision alignment and verification tools, which are applied during the development and testing phases. Finally, through continuous observation and analysis of new features, we summarize the corresponding insights and apply them to improve subsequent iterations.
## 5.4.2 Co-design of Algorithms and Systems
In the development of the Ling 2.0 models, we implemented the following measures to achieve a better trade-off between algorithm performance and system efficiency:
Infrastructure-Aware Architecture Design: Taking the Norm Head strategy (Ling-Team et al., 2025) as an example, we found that its usage leads to a performance improvement of less than 1%,
Figure 20 The operator efficiency comparison between the dense architecture, Ling 1.0 and Ling 2.0.
<details>
<summary>Image 21 Details</summary>
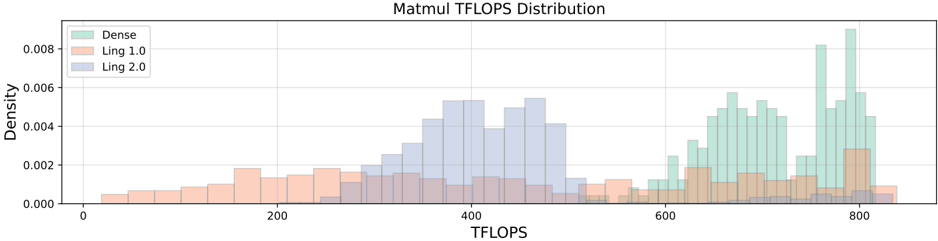
### Visual Description
## Histogram: Matmul TFLOPS Distribution
### Overview
The image is a histogram comparing the distribution of TFLOPS (Tera Floating Point Operations per Second) across three computational methods: "Dense," "Ling 1.0," and "Ling 2.0." The x-axis represents TFLOPS values (0–800), and the y-axis represents density (0–0.008). The legend identifies the three data series with distinct colors: green for "Dense," orange for "Ling 1.0," and purple for "Ling 2.0."
### Components/Axes
- **Title**: "Matmul TFLOPS Distribution" (top center).
- **X-axis**: Labeled "TFLOPS," with values ranging from 0 to 800 in increments of 200.
- **Y-axis**: Labeled "Density," with values ranging from 0 to 0.008 in increments of 0.002.
- **Legend**: Positioned in the top-left corner, with three entries:
- Green: "Dense"
- Orange: "Ling 1.0"
- Purple: "Ling 2.0"
- **Bars**: Three overlapping histograms, each corresponding to one of the three methods.
### Detailed Analysis
- **Dense (Green)**:
- Dominates the right side of the histogram (600–800 TFLOPS).
- Peaks at ~800 TFLOPS with a density of ~0.008.
- Shows a gradual increase in density from 600 TFLOPS onward.
- **Ling 2.0 (Purple)**:
- Peaks at ~400–500 TFLOPS with a density of ~0.006.
- Density declines sharply after 500 TFLOPS.
- **Ling 1.0 (Orange)**:
- Peaks at ~200–300 TFLOPS with a density of ~0.002.
- Density remains low compared to the other two methods.
### Key Observations
1. **Performance Hierarchy**: "Dense" achieves significantly higher TFLOPS than both "Ling" methods, with a clear separation in the distribution.
2. **Ling Method Comparison**: "Ling 2.0" outperforms "Ling 1.0" by ~200 TFLOPS, but both lag far behind "Dense."
3. **Density Distribution**: "Dense" has the highest density, indicating it is the most common or efficient method in this dataset.
### Interpretation
The data suggests that the "Dense" method is the most computationally efficient, achieving near-800 TFLOPS, while the "Ling" methods are less performant. The stark difference in peak TFLOPS between "Dense" and the "Ling" methods implies that "Dense" may be optimized for high-throughput applications, whereas the "Ling" methods might prioritize other factors (e.g., memory efficiency or algorithmic simplicity). The absence of overlap in the highest TFLOPS range (700–800) further emphasizes the superiority of "Dense" in this context. This could inform hardware/software optimization strategies for matrix multiplication tasks.
</details>
while significantly increasing computation and memory consumption within a single PP stage. This substantial overhead made it challenging to tune the distributed training strategy to an optimal state. Therefore, we did not employ this technique in the training of Ling 2.0 models. In addition, DeepEP sends a token to up to 4 RDMA and 8 NVLink nodes. To better exploit this feature and prepare for larger-scale EP training in the future, we employ the Group Router algorithm in the MoE layer to divide all experts into 8 groups, and each token is routed within the top 4 scoring groups to maximize intra/inter-node communication efficiency.
Operator Efficiency Analysis: During the design of Ling 2.0, we performed an operator efficiency comparison between the new architecture and Ling 1.0, as shown in Figure 20. Efficiency in Ling-2.0 is more centered in the mid-range, consistent with its 'wider and shallower' design. No operators show exceptionally low efficiency, which we attribute to the First-K-Dense strategy mitigating imbalance in shallow MoE layer and improving overall computational efficiency.
Parameter Design Integrated with Distributed Architecture: In the parameter design of Ling 2.0, we carried out detailed parameter configuration tailored to various heterogeneous modules. For example, in the design of Ling-1T , the computation consumption ratio between dense layers and MoE layers was set at 1:2. This design facilitates achieving uniform computation time across all PP stages, allowing us to minimize pipeline bubbles to the greatest extent possible.
## 5.4.3 Cross-Platform Alignment
During the training process, in addition to using the standard Hopper architecture, we occasionally have the need to train on other heterogeneous GPU. Throughout this process, we adhere to the 4C principle to align algorithmic logic and results as closely as possible across different platforms.
Figure 21 shows the alignment results based on Ling-flash-2.0 . Throughout the training process, the differences in loss values consistently oscillate around zero. This indicates that although variations in operator implementations across different GPU architectures introduce floating-point precision deviations, the mean value of these errors remains within one-thousandth 9 . We consider such deviations insufficient to affect the accuracy of model training convergence, thus ensuring the validity of Ling 2.0 series model training on heterogeneous platforms.
9 The increase in loss curve during the first 1,000 steps was caused by a switch in the training data and the fact that the optimizer state of the model was not loaded.
Figure 21 The loss comparison of Ling-flash-2.0 on Hopper vs. Non-Hopper GPUs.
<details>
<summary>Image 22 Details</summary>
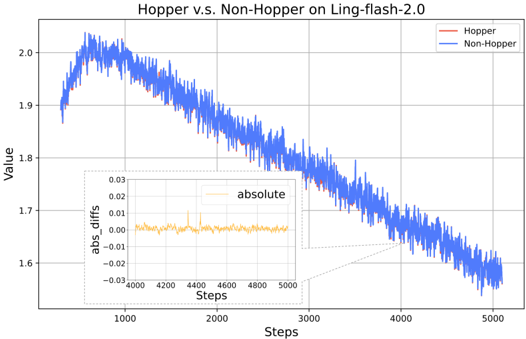
### Visual Description
## Line Graph: Hopper v.s. Non-Hopper on Ling-flash-2.0
### Overview
The image is a line graph comparing the performance of two systems, "Hopper" (red line) and "Non-Hopper" (blue line), over 5,000 steps on the Ling-flash-2.0 benchmark. A secondary inset graph shows the absolute differences between the two systems. Both lines exhibit a general downward trend, with the Hopper line starting higher but declining more steeply than the Non-Hopper line.
---
### Components/Axes
- **Main Chart**:
- **X-axis**: "Steps" (ranging from 1,000 to 5,000 in increments of 1,000).
- **Y-axis**: "Value" (ranging from 1.6 to 2.0 in increments of 0.1).
- **Legend**: Located in the top-right corner, with red representing "Hopper" and blue representing "Non-Hopper".
- **Inset Graph**:
- **X-axis**: "Steps" (same range as the main chart, 4,000–5,000).
- **Y-axis**: "abs_diffs" (absolute differences, ranging from -0.03 to 0.03).
- **Line**: Orange, labeled "absolute".
---
### Detailed Analysis
1. **Hopper (Red Line)**:
- Starts at approximately **2.0** at step 1,000.
- Peaks near **2.0** at step 2,000.
- Declines steadily to **~1.6** by step 5,000.
- Shows higher variability (noise) in the early steps (1,000–3,000) compared to later steps.
2. **Non-Hopper (Blue Line)**:
- Starts at approximately **1.9** at step 1,000.
- Declines gradually to **~1.6** by step 5,000.
- Maintains a consistent downward slope with less variability than the Hopper line.
3. **Absolute Differences (Inset)**:
- The orange line fluctuates between **-0.03** and **0.03**.
- Peaks at **~0.03** around step 4,500, indicating the largest divergence between the two systems.
- Most values cluster around **0.01–0.02**, suggesting the systems converge over time.
---
### Key Observations
- The Hopper system begins with a higher value than Non-Hopper but declines more sharply.
- The absolute difference between the two systems is smallest in the early steps (~0.01–0.02) and grows slightly in the later steps (~0.03).
- Both systems converge to similar values (~1.6) by step 5,000, though Hopper’s trajectory is more volatile.
---
### Interpretation
The data suggests that the Hopper system initially outperforms the Non-Hopper system but experiences a steeper decline in performance over time. The absolute differences indicate that while Hopper starts with an advantage, this gap narrows as steps increase, with both systems eventually stabilizing at similar values. The spikes in the absolute difference inset (e.g., ~0.03 at step 4,500) may reflect transient anomalies or specific interactions between the systems. The convergence at step 5,000 implies that long-term performance differences are minimal, though Hopper’s higher initial variability could indicate instability or sensitivity to early conditions.
</details>
## 5.5 Evaluation Pipeline
Model evaluation provides critical insights into model quality and informs continuous algorithmic and engineering optimizations based on feedback. However, at the trillion-parameter scale, traditional evaluation methods face significant challenges in stability, speed, and precision, severely constraining the development and training of Ling 2.0 models. To overcome these issues, we redesigned the entire evaluation pipeline based on OpenCompass (Contributors, 2023) to support large-scale, distributed, and incremental benchmarking. The system now integrates on-the-fly checkpoint evaluation, dynamic resource scheduling, and prompt caching to minimize redundant computation. Compared with the original OpenCompass, the total evaluation time per checkpoint was reduced by more than two-thirds.
Multi-Node Inference Optimization. For large models that cannot fit on a single GPU node, we extended OpenCompass to support distributed evaluation across Ray Clusters. Each evaluation task dynamically allocates multi-node multi-instance resources and interfaces with the SGLang (Zheng et al., 2024) inference backend for high-throughput serving. This allows us to handle trillion-parameter models with balanced network and GPU utilization.
Prompt Caching For Repeated Prefixes. In benchmark settings that involve repeated prompts (e.g., identical few-shot templates or shared prefixes across options), recomputing log-probabilities (PPL) for each variant is wasteful. We implemented prefix-level caching that reuses the shared prompt embedding across samples, improving evaluation throughput by more than 30%.
Batch Parallelization and Async Execution. The original OpenCompass implementation handled prompt preprocessing, inference, and postprocessing serially. We parallelized these steps and introduced asynchronous inference scheduling. Small requests are automatically batched into larger groups to increase GPU saturation, improving overall service efficiency and stability.
These optimizations collectively make evaluation a continuous feedback component of training rather than a separate phase. By integrating distributed inference, prompt reuse, and asynchronous batching, we achieved significant improvements in evaluation speed, resource efficiency, and iteration velocity, ensuring that model checkpoints can be validated within hours rather than days.
## 5.6 ABitter Lesson of Computation-Communication Overlapping
Studies on large MoE models, such as DualPipe and interleaved 1F1B with A2A overlap (DeepSeekAI, 2024; NVIDIA, 2024), improve training efficiency by overlapping expert computation in one micro-batch with A2A communication in another through modified PP scheduling. We applied these methods in Ling 2.0 training, and resolving several performance issues, such as streaming multiprocessors (SMs) computation-communication contention and CPU synchronization bottlenecks. However, the end-to-end acceleration remained limited. We have analyzed the reasons for the lack of significant end-to-end training acceleration despite these fixes. Key factors include:
- Overlapping Strategy Need a Large EP Configuration: With fixed resources and global batch size, larger EP size assigns more tokens per expert, boosting expert-layer matrix efficiency while masking added communication overhead. However, EP group time is gated by the slowest rank. The larger EP size reduces experts per rank, exacerbating this bottleneck effect. Additionally, the performance of DeepEP itself is influenced by the balance of token routing.
- Imbalanced Routing in Shallow MoE Layers: Routing in the shallow layers of MoE models tends to be more imbalanced, which makes the PP rank containing these layers more prone to OOMerrors. This forced us to reconsider the PP partitioning strategy to alleviate the issue, and the new approach incurred an overall performance penalty due to these constraints.
In summary, large EP-based optimizations are more sensitive to routing imbalance than smaller configurations. Although Ling 2.0 training saw limited gains, we view computation-communication overlap as a key avenue for improving large-scale MoE performance and plan to jointly optimize routing and related components to better realize its potential benefits.
## 6 Conclusion
Conclusion. Ling 2.0 demonstrates that large-scale sparse language foundations can advance both reasoning capability and computational efficiency through coordinated innovations in architecture, training, and infrastructure. With its high-sparsity Mixture-of-Experts design, reasoning-oriented data pipeline, multi-stage alignment strategy, and FP8-based trillion-scale infrastructure, Ling 2.0 establishes a scalable foundation for general reasoning models. The three released modelsLing-mini-2.0 , Ling-flash-2.0 , and Ling-1T -consistently follow the Ling Scaling Law and collectively define a new Pareto frontier between reasoning accuracy and computational cost, illustrating the effectiveness of the 'every activation boosts' principle.
Despite these advances, Ling 2.0 still faces several open challenges. First, its current grouped-query attention (GQA) architecture constrains efficiency in long-context scenarios; ongoing work explores linear and sparse-attention designs to further improve scalability. Second, while Ling 2.0 achieves strong reasoning precision and efficiency, the effective reasoning length and depth still have room for enhancement. Finally, complex instruction following and agentic behaviors remain under development. Building upon Ling 2.0's strong reasoning foundation, future work will extend toward more general, autonomous, and interactive capabilities.
Together, these directions mark the next step in scaling general intelligence-toward models that not only think more efficiently, but also act more generally.
## 7 Contributors
## Authors are listed alphabetically by the first name .
| Ling Team | Jialong Zhu | Qingxiang Huang |
|-----------------|----------------|--------------------|
| Ang Li | Jian Sha | Qingyuan Yang |
| Ben Liu | Jianping Wei | Quankun Yu |
| Binbin Hu | Jiaolong Yang | Shaowei Wei |
| Bing Li | JieweiWu | Shijie Lian |
| Bingwei Zeng | Jieyue Ma | Shoujian Zheng |
| Borui Ye | Jingyuan Zhang | Shun Song |
| Caizhi Tang | Jingyun Tian | Shungen Zhang |
| Changxin Tian | Jinjing Huang | Shuo Zhang |
| Chao Huang | Jinquan Sun | Siyuan Li |
| Chao Zhang | Juanhui Tu | Song Liu |
| Chen Qian | Jun Liu | Ting Guo |
| Chenchen Ju | Jun Xu | Tong Zhao |
| Chenchen Li | Jun Zhou † | Wanli Gu |
| Chengfu Tang | Junjie Ou | WeichangWu |
| Chilin Fu | Junpeng Fang | Weiguang Han |
| Chunshao Ren | Kaihong Zhang | Wenjing Fang |
| ChunweiWu | Kaiqin Hu | Wubin Wang |
| Cong Zhang | Ke Shi | Xiang Shu |
| Cunyin Peng | Kun Tang | Xiao Shi |
| Dafeng Xu | Kunlong Chen | Xiaolu Zhang † |
| Daixin Wang | Lanyin Mei | Xiaoshun Lan |
| Dalong Zhang | Lei Liang | Xiaqing Sun |
| Dingnan Jin | Lei Xu | Xin Zhao |
| Dingyuan Zhu | Libo Zhang | Xingyu Lu |
| Dongke Hu | Lin Ju | Xiong Xu |
| Fangzheng Zhao | Lin Yuan | Xudong Wang |
| FeifanWu | Ling Zhong | Xudong(Logan) Wang |
| Feng Zhu | Lintao Ma | Xuemin Yang |
| Gangshan Wang | Lu Liu | Yajie Yang |
| Hailin Zhao | Lu Yu | Yang Xiang |
| Haitao Zhang | Lun Cai | Yanzhe Li |
| Hanxiao Zhang | Meiqi Zhu | Yi Zhang |
| Hanzi Wang | Mengying Li | Yilong Wang |
| Hao Qian | Min Chen | Yingxue Li |
| Haoyi Yu | Minghao Xue | Yongzhen Guo |
| Heng Zhang | Minghong Cai | Yuanyuan Wang |
| Hongliang Zhang | Mingming Yin | Yue Yang |
| Hongzhi Luan | Peijie Jiang | Yue Yu |
| Huirong Dong | Peilong Zhao | Yufeng Deng |
| Huizhong Li | Pingping Liu | Yun Zhang |
| Jia Li | Qian Zhao | Yunfei Yu |
| Yuxiao He | Zhibo Zhu | Ziqi Liu |
|---------------|------------------|------------|
| Yuzhuo Fu | Zhihao Wang | Zitao Xuan |
| Zengke Gui | Zhiqiang Zhang † | Zuoli Tang |
| Zhaoxin Huan | Zhongfang Jia | |
| Zhaoyang Wang | Zhoufei Wang | |
| Zheng Wang | Zihang Zeng | |
† denotes corresponding authors.
## References
Aider. Ai pair programming in your terminal, 2025. https://github.com/Aider-AI/aider .
- Joshua Ainslie, James Lee-Thorp, Michiel De Jong, Yury Zemlyanskiy, Federico Lebrón, and Sumit Sanghai. Gqa: Training generalized multi-query transformer models from multi-head checkpoints. arXiv preprint arXiv:2305.13245 , 2023.
- Loubna Ben Allal, Anton Lozhkov, Elie Bakouch, Gabriel Martín Blázquez, Guilherme Penedo, Lewis Tunstall, Andrés Marafioti, Hynek Kydlíˇ cek, Agustín Piqueres Lajarín, Vaibhav Srivastav, Joshua Lochner, Caleb Fahlgren, Xuan-Son Nguyen, Clémentine Fourrier, Ben Burtenshaw, Hugo Larcher, Haojun Zhao, Cyril Zakka, Mathieu Morlon, Colin Raffel, Leandro von Werra, and Thomas Wolf. Smollm2: When smol goes big - data-centric training of a small language model, 2025. https://arxiv.org/abs/2502.02737 .
- Chenxin An, Shansan Gong, Ming Zhong, Mukai Li, Jun Zhang, Lingpeng Kong, and Xipeng Qiu. L-eval: Instituting standardized evaluation for long context language models, 2023.
- Ascend. Mindspeed llm, 2023. https://gitee.com/ascend/MindSpeed-LLM/ .
- Jacob Austin, Augustus Odena, Maxwell I Nye, Maarten Bosma, Henryk Michalewski, David Dohan, Ellen Jiang, Carrie J Cai, Michael Terry, Quoc V Le, et al. Program synthesis with large language models. corr abs/2108.07732 (2021). arXiv preprint arXiv:2108.07732 , 2021.
- Yushi Bai, Xin Lv, Jiajie Zhang, Hongchang Lyu, Jiankai Tang, Zhidian Huang, Zhengxiao Du, Xiao Liu, Aohan Zeng, Lei Hou, et al. Longbench: A bilingual, multitask benchmark for long context understanding. arXiv preprint arXiv:2308.14508 , 2023.
- Mislav Balunovi´ c, Jasper Dekoninck, Ivo Petrov, Nikola Jovanovi´ c, and Martin Vechev. Matharena: Evaluating llms on uncontaminated math competitions, February 2025. https://matharena.ai/ .
- Denis Baylor, Eric Breck, Heng-Tze Cheng, Noah Fiedel, Chuan Yu Foo, Zakaria Haque, Salem Haykal, Mustafa Ispir, Vihan Jain, Levent Koc, Chiu Yuen Koo, Lukasz Lew, Clemens Mewald, Akshay Naresh Modi, Neoklis Polyzotis, Sukriti Ramesh, Sudip Roy, Steven Euijong Whang, Martin Wicke, Jarek Wilkiewicz, Xin Zhang, and Martin Zinkevich. Tfx: A tensorflow-based production-scale machine learning platform. In Proceedings of the 23rd ACM SIGKDD International Conference on Knowledge Discovery and Data Mining , page 1387-1395. Association for Computing Machinery, 2017. ISBN 9781450348874.
- Sumithra Bhakthavatsalam, Daniel Khashabi, Tushar Khot, Bhavana Dalvi Mishra, Kyle Richardson, Ashish Sabharwal, Carissa Schoenick, Oyvind Tafjord, and Peter Clark. Think you have solved direct-answer question answering? try arc-da, the direct-answer AI2 reasoning challenge. CoRR , abs/2102.03315, 2021. https://arxiv.org/abs/2102.03315 .
- Xiao Bi, Deli Chen, Guanting Chen, Shanhuang Chen, Damai Dai, Chengqi Deng, Honghui Ding, Kai Dong, Qiushi Du, Zhe Fu, et al. Deepseek llm: Scaling open-source language models with longtermism. arXiv preprint arXiv:2401.02954 , 2024.
- ByteDance-Seed. Seed-oss open-source models. https://github.com/ByteDance-Seed/seed-oss , 2025.
- Federico Cassano, John Gouwar, Daniel Nguyen, Sydney Nguyen, Luna Phipps-Costin, Donald Pinckney, Ming-Ho Yee, Yangtian Zi, Carolyn Jane Anderson, Molly Q Feldman, et al. Multipl-e: A scalable and extensible approach to benchmarking neural code generation. arXiv preprint arXiv:2208.08227 , 2022.
- Federico Cassano, John Gouwar, Daniel Nguyen, Sydney Nguyen, Luna Phipps-Costin, Donald Pinckney, Ming-Ho Yee, Yangtian Zi, Carolyn Jane Anderson, Molly Q. Feldman, Arjun Guha, Michael Greenberg, and Abhinav Jangda. Multipl-e: A scalable and polyglot approach to benchmarking neural code generation. IEEE Trans. Software Eng. , 49(7): 3675-3691, 2023. doi: 10.1109/TSE.2023.3267446. https://doi.org/10.1109/TSE.2023.3267446 .
- Mark Chen, Jerry Tworek, Heewoo Jun, Qiming Yuan, Henrique Pondé de Oliveira Pinto, Jared Kaplan, Harri Edwards, Yuri Burda, Nicholas Joseph, Greg Brockman, Alex Ray, Raul Puri, Gretchen Krueger, Michael Petrov, Heidy Khlaaf, Girish Sastry, Pamela Mishkin, Brooke Chan, Scott Gray, Nick Ryder, Mikhail Pavlov, Alethea Power, Lukasz Kaiser, Mohammad Bavarian, Clemens Winter, Philippe Tillet, Felipe Petroski Such, Dave Cummings, Matthias Plappert, Fotios Chantzis, Elizabeth Barnes, Ariel Herbert-Voss, William Hebgen Guss, Alex Nichol, Alex Paino, Nikolas Tezak, Jie Tang, Igor Babuschkin, Suchir Balaji, Shantanu Jain, William Saunders, Christopher Hesse, Andrew N. Carr, Jan Leike, Joshua Achiam, Vedant Misra, Evan Morikawa, Alec Radford, Matthew Knight, Miles Brundage, Mira Murati, Katie Mayer, Peter Welinder, Bob McGrew, Dario Amodei, Sam McCandlish, Ilya Sutskever, and Wojciech Zaremba. Evaluating large language models trained on code. CoRR , abs/2107.03374, 2021. https://arxiv.org/abs/2107.03374 .
- Sirui Chen, Changxin Tian, Binbin Hu, Kunlong Chen, Ziqi Liu, Zhiqiang Zhang, and Jun Zhou. Arrows of math reasoning data synthesis for large language models: Diversity, complexity and correctness. arXiv preprint arXiv:2508.18824 , 2025.
- Wenhu Chen, Ming Yin, Max Ku, Pan Lu, Yixin Wan, Xueguang Ma, Jianyu Xu, Xinyi Wang, and Tony Xia. Theoremqa: Atheorem-driven question answering dataset. In Houda Bouamor, Juan Pino, and Kalika Bali, editors, Proceedings of the 2023 Conference on Empirical Methods in Natural Language Processing, EMNLP 2023, Singapore, December 6-10, 2023 , pages 7889-7901. Association for Computational Linguistics, 2023. doi: 10.18653/V1/2023.EMNLP-MAIN.489. https://doi.org/10.18653/v1/2023.emnlp-main.489 .
- Yao Cheng, Jianfeng Chen, Jie Chen, Li Chen, Liyu Chen, Wentao Chen, Zhengyu Chen, Shijie Geng, Aoyan Li, Bo Li, et al. Fullstack bench: Evaluating llms as full stack coders. arXiv preprint arXiv:2412.00535 , 2024.
- François Chollet. Abstraction and reasoning corpus for artificial general intelligence (arc-agi), 2019. https://github. com/fchollet/ARC-AGI .
- Aidan Clark, Diego de Las Casas, Aurelia Guy, Arthur Mensch, Michela Paganini, Jordan Hoffmann, Bogdan Damoc, Blake Hechtman, Trevor Cai, Sebastian Borgeaud, et al. Unified scaling laws for routed language models. In International conference on machine learning , pages 4057-4086. PMLR, 2022.
- Karl Cobbe, Vineet Kosaraju, Mohammad Bavarian, Mark Chen, Heewoo Jun, Lukasz Kaiser, Matthias Plappert, Jerry Tworek, Jacob Hilton, Reiichiro Nakano, Christopher Hesse, and John Schulman. Training verifiers to solve math word problems. CoRR , abs/2110.14168, 2021. https://arxiv.org/abs/2110.14168 .
- Gheorghe Comanici, Eric Bieber, Mike Schaekermann, Ice Pasupat, Noveen Sachdeva, Inderjit Dhillon, Marcel Blistein, Ori Ram, Dan Zhang, Evan Rosen, et al. Gemini 2.5: Pushing the frontier with advanced reasoning, multimodality, long context, and next generation agentic capabilities. arXiv preprint arXiv:2507.06261 , 2025.
- OpenCompass Contributors. Opencompass: A universal evaluation platform for foundation models. https://github. com/open-compass/opencompass , 2023.
- Viet Dac Lai, Chien Van Nguyen, Nghia Trung Ngo, Thuat Nguyen, Franck Dernoncourt, Ryan A Rossi, and Thien Huu Nguyen. Okapi: Instruction-tuned large language models in multiple languages with reinforcement learning from human feedback. arXiv e-prints , pages arXiv-2307, 2023.
- DeepSeek-AI. Deepseek-v3 technical report, 2024. https://arxiv.org/abs/2412.19437 .
- Kaustubh Deshpande, Ved Sirdeshmukh, Johannes Baptist Mols, Lifeng Jin, Ed-Yeremai Hernandez-Cardona, Dean Lee, Jeremy Kritz, Willow E. Primack, Summer Yue, and Chen Xing. MultiChallenge: A realistic multi-turn conversation evaluation benchmark challenging to frontier LLMs. In Wanxiang Che, Joyce Nabende, Ekaterina Shutova, and Mohammad Taher Pilehvar, editors, Findings of the Association for Computational Linguistics: ACL 2025 , pages 1863218702, Vienna, Austria, July 2025. Association for Computational Linguistics. ISBN 979-8-89176-256-5. doi: 10.18653/ v1/2025.findings-acl.958. https://aclanthology.org/2025.findings-acl.958/ .
- Andreas Eisele and Yu Chen. MultiUN: A multilingual corpus from united nation documents. In Proceedings of the Seventh International Conference on Language Resources and Evaluation (LREC'10) , Valletta, Malta, May 2010. European Language Resources Association (ELRA). http://www.lrec-conf.org/proceedings/lrec2010/pdf/686\_Paper.pdf .
- Bofei Gao, Feifan Song, Zhe Yang, Zefan Cai, Yibo Miao, Qingxiu Dong, Lei Li, Chenghao Ma, Liang Chen, Runxin Xu, Zhengyang Tang, Benyou Wang, Daoguang Zan, Shanghaoran Quan, Ge Zhang, Lei Sha, Yichang Zhang, Xuancheng Ren, Tianyu Liu, and Baobao Chang. Omni-math: A universal olympiad level mathematic benchmark for large language models. In The Thirteenth International Conference on Learning Representations, ICLR 2025, Singapore, April 24-28, 2025 . OpenReview.net, 2025. https://openreview.net/forum?id=yaqPf0KAlN .
- Fabian Gloeckle, Badr Youbi Idrissi, Baptiste Rozière, David Lopez-Paz, and Gabriel Synnaeve. Better & faster large language models via multi-token prediction. arXiv preprint arXiv:2404.19737 , 2024.
- Alex Gu, Baptiste Rozière, Hugh James Leather, Armando Solar-Lezama, Gabriel Synnaeve, and Sida Wang. Cruxeval: A benchmark for code reasoning, understanding and execution. In Forty-first International Conference on Machine Learning, ICML 2024, Vienna, Austria, July 21-27, 2024 . OpenReview.net, 2024. https://openreview.net/forum?id=Ffpg52swvg .
- Xiaotian Han, Yiren Jian, Xuefeng Hu, Haogeng Liu, Yiqi Wang, Qihang Fan, Yuang Ai, Huaibo Huang, Ran He, Zhenheng Yang, and Quanzeng You. Infimm-webmath-40b: Advancing multimodal pre-training for enhanced mathematical reasoning, 2024. https://arxiv.org/abs/2409.12568 .
- Chaoqun He, Renjie Luo, Yuzhuo Bai, Shengding Hu, Zhen Leng Thai, Junhao Shen, Jinyi Hu, Xu Han, Yujie Huang, Yuxiang Zhang, Jie Liu, Lei Qi, Zhiyuan Liu, and Maosong Sun. Olympiadbench: A challenging benchmark for promoting AGI with olympiad-level bilingual multimodal scientific problems. In Lun-Wei Ku, Andre Martins, and
Vivek Srikumar, editors, Proceedings of the 62nd Annual Meeting of the Association for Computational Linguistics (Volume 1: Long Papers), ACL 2024, Bangkok, Thailand, August 11-16, 2024 , pages 3828-3850. Association for Computational Linguistics, 2024a. doi: 10.18653/V1/2024.ACL-LONG.211. https://doi.org/10.18653/v1/2024.acl-long.211 .
- Chaoqun He, Renjie Luo, Yuzhuo Bai, Shengding Hu, Zhen Leng Thai, Junhao Shen, Jinyi Hu, Xu Han, Yujie Huang, Yuxiang Zhang, et al. Olympiadbench: A challenging benchmark for promoting agi with olympiad-level bilingual multimodal scientific problems. CoRR , 2024b.
- Conghui He, Zhenjiang Jin, Chao Xu, Jiantao Qiu, Bin Wang, Wei Li, Hang Yan, Jiaqi Wang, and Dahua Lin. Wanjuan: A comprehensive multimodal dataset for advancing english and chinese large models. arXiv preprint arXiv:2308.10755 , 2023.
- Dan Hendrycks, Collin Burns, Steven Basart, Andy Zou, Mantas Mazeika, Dawn Song, and Jacob Steinhardt. Measuring massive multitask language understanding. In 9th International Conference on Learning Representations, ICLR 2021, Virtual Event, Austria, May 3-7, 2021 . OpenReview.net, 2021a. https://openreview.net/forum?id=d7KBjmI3GmQ .
- Dan Hendrycks, Collin Burns, Saurav Kadavath, Akul Arora, Steven Basart, Eric Tang, Dawn Song, and Jacob Steinhardt. Measuring mathematical problem solving with the MATH dataset. In Joaquin Vanschoren and Sai-Kit Yeung, editors, Proceedings of the Neural Information Processing Systems Track on Datasets and Benchmarks 1, NeurIPS Datasets and Benchmarks 2021, December 2021, virtual , 2021b. https://datasets-benchmarks-proceedings.neurips.cc/paper/2021/ hash/be83ab3ecd0db773eb2dc1b0a17836a1-Abstract-round2.html .
- Alex Henry, Prudhvi Raj Dachapally, Shubham Pawar, and Yuxuan Chen. Query-key normalization for transformers. arXiv preprint arXiv:2010.04245 , 2020.
- Jordan Hoffmann, Sebastian Borgeaud, Arthur Mensch, Elena Buchatskaya, Trevor Cai, Eliza Rutherford, Diego de Las Casas, Lisa Anne Hendricks, Johannes Welbl, Aidan Clark, et al. Training compute-optimal large language models. arXiv preprint arXiv:2203.15556 , 2022.
- Jack Hong, Shilin Yan, Jiayin Cai, Xiaolong Jiang, Yao Hu, and Weidi Xie. Worldsense: Evaluating real-world omnimodal understanding for multimodal llms. CoRR , abs/2502.04326, 2025. doi: 10.48550/ARXIV.2502.04326. https://doi.org/ 10.48550/arXiv.2502.04326 .
- Shengding Hu, Yuge Tu, Xu Han, Chaoqun He, Ganqu Cui, Xiang Long, Zhi Zheng, Yewei Fang, Yuxiang Huang, Weilin Zhao, et al. Minicpm: Unveiling the potential of small language models with scalable training strategies. arXiv preprint arXiv:2404.06395 , 2024.
- Yuzhen Huang, Yuzhuo Bai, Zhihao Zhu, Junlei Zhang, Jinghan Zhang, Tangjun Su, Junteng Liu, Chuancheng Lv, Yikai Zhang, Jiayi Lei, Yao Fu, Maosong Sun, and Junxian He. C-eval: A multi-level multi-discipline chinese evaluation suite for foundation models. In Alice Oh, Tristan Naumann, Amir Globerson, Kate Saenko, Moritz Hardt, and Sergey Levine, editors, Advances in Neural Information Processing Systems 36: Annual Conference on Neural Information Processing Systems 2023, NeurIPS 2023, New Orleans, LA, USA, December 10 - 16, 2023 , 2023. http://papers.nips.cc/paper\_files/ paper/2023/hash/c6ec1844bec96d6d32ae95ae694e23d8-Abstract-Datasets\_and\_Benchmarks.html .
- Binyuan Hui, Jian Yang, Zeyu Cui, Jiaxi Yang, Dayiheng Liu, Lei Zhang, Tianyu Liu, Jiajun Zhang, Bowen Yu, Kai Dang, et al. Qwen2. 5-coder technical report. arXiv preprint arXiv:2409.12186 , 2024.
- Naman Jain, King Han, Alex Gu, Wen-Ding Li, Fanjia Yan, Tianjun Zhang, Sida Wang, Armando Solar-Lezama, Koushik Sen, and Ion Stoica. Livecodebench: Holistic and contamination free evaluation of large language models for code. In The Thirteenth International Conference on Learning Representations, ICLR 2025, Singapore, April 24-28, 2025 . OpenReview.net, 2025. https://openreview.net/forum?id=chfJJYC3iL .
- Mehran Kazemi, Bahare Fatemi, Hritik Bansal, John Palowitch, Chrysovalantis Anastasiou, Sanket Vaibhav Mehta, Lalit K Jain, Virginia Aglietti, Disha Jindal, Peter Chen, et al. Big-bench extra hard. arXiv preprint arXiv:2502.19187 , 2025.
- Kimi-Team, Angang Du, Bofei Gao, Bowei Xing, Changjiu Jiang, Cheng Chen, Cheng Li, Chenjun Xiao, Chenzhuang Du, Chonghua Liao, et al. Kimi k1. 5: Scaling reinforcement learning with llms. arXiv preprint arXiv:2501.12599 , 2025.
- Aitor Lewkowycz, Anders Andreassen, David Dohan, Ethan Dyer, Henryk Michalewski, Vinay Ramasesh, Ambrose Slone, Cem Anil, Imanol Schlag, Theo Gutman-Solo, et al. Solving quantitative reasoning problems with language models. Advances in neural information processing systems , 35:3843-3857, 2022.
- Haonan Li, Yixuan Zhang, Fajri Koto, Yifei Yang, Hai Zhao, Yeyun Gong, Nan Duan, and Timothy Baldwin. CMMLU: measuring massive multitask language understanding in chinese. In Lun-Wei Ku, Andre Martins, and Vivek
Srikumar, editors, Findings of the Association for Computational Linguistics, ACL 2024, Bangkok, Thailand and virtual meeting, August 11-16, 2024 , pages 11260-11285. Association for Computational Linguistics, 2024a. doi: 10.18653/V1/2024.FINDINGS-ACL.671. https://doi.org/10.18653/v1/2024.findings-acl.671 .
- Jinyang Li, Binyuan Hui, Ge Qu, Jiaxi Yang, Binhua Li, Bowen Li, Bailin Wang, Bowen Qin, Ruiying Geng, Nan Huo, Xuanhe Zhou, Chenhao Ma, Guoliang Li, Kevin Chen-Chuan Chang, Fei Huang, Reynold Cheng, and Yongbin Li. Can LLM already serve as A database interface? A big bench for large-scale database grounded text-to-sqls. In Alice Oh, Tristan Naumann, Amir Globerson, Kate Saenko, Moritz Hardt, and Sergey Levine, editors, Advances in Neural Information Processing Systems 36: Annual Conference on Neural Information Processing Systems 2023, NeurIPS 2023, New Orleans, LA, USA, December 10 - 16, 2023 , 2023a. http://papers.nips.cc/paper\_files/paper/2023/hash/ 83fc8fab1710363050bbd1d4b8cc0021-Abstract-Datasets\_and\_Benchmarks.html .
- Jinyang Li, Binyuan Hui, Ge Qu, Jiaxi Yang, Binhua Li, Bowen Li, Bailin Wang, Bowen Qin, Ruiying Geng, Nan Huo, et al. Can llm already serve as a database interface? a big bench for large-scale database grounded text-to-sqls. Advances in Neural Information Processing Systems , 36:42330-42357, 2023b.
- Tianle Li, Wei-Lin Chiang, Evan Frick, Lisa Dunlap, Tianhao Wu, Banghua Zhu, Joseph E Gonzalez, and Ion Stoica. From crowdsourced data to high-quality benchmarks: Arena-hard and benchbuilder pipeline. arXiv preprint arXiv:2406.11939 , 2024b.
- Tianle Li*, Wei-Lin Chiang*, Evan Frick, Lisa Dunlap, Banghua Zhu, Joseph E. Gonzalez, and Ion Stoica. From live data to high-quality benchmarks: The arena-hard pipeline, April 2024. https://lmsys.org/blog/2024-04-19-arena-hard/ .
- Bill Yuchen Lin, Ronan Le Bras, Kyle Richardson, Ashish Sabharwal, Radha Poovendran, Peter Clark, and Yejin Choi. Zebralogic: On the scaling limits of LLMs for logical reasoning. In Forty-second International Conference on Machine Learning , 2025. https://openreview.net/forum?id=sTAJ9QyA6l .
- Ling-Team. Every step evolves: Scaling reinforcement learning for trillion-scale thinking model, 2025. https://arxiv. org/abs/2510.18855 .
- Ling-Team, Binwei Zeng, Chao Huang, Chao Zhang, Changxin Tian, Cong Chen, Dingnan Jin, Feng Yu, Feng Zhu, Feng Yuan, et al. Every flop counts: Scaling a 300b mixture-of-experts ling llm without premium gpus. arXiv preprint arXiv:2503.05139 , 2025.
- Hongwei Liu, Zilong Zheng, Yuxuan Qiao, Haodong Duan, Zhiwei Fei, Fengzhe Zhou, Wenwei Zhang, Songyang Zhang, Dahua Lin, and Kai Chen. Mathbench: Evaluating the theory and application proficiency of llms with a hierarchical mathematics benchmark. In Lun-Wei Ku, Andre Martins, and Vivek Srikumar, editors, Findings of the Association for Computational Linguistics, ACL 2024, Bangkok, Thailand and virtual meeting, August 11-16, 2024 , pages 6884-6915. Association for Computational Linguistics, 2024. doi: 10.18653/V1/2024.FINDINGS-ACL.411. https://doi.org/10.18653/v1/2024.findings-acl.411 .
- Jiawei Liu, Chunqiu Steven Xia, Yuyao Wang, and Lingming Zhang. Is your code generated by chatgpt really correct? rigorous evaluation of large language models for code generation. In Alice Oh, Tristan Naumann, Amir Globerson, Kate Saenko, Moritz Hardt, and Sergey Levine, editors, Advances in Neural Information Processing Systems 36: Annual Conference on Neural Information Processing Systems 2023, NeurIPS 2023, New Orleans, LA, USA, December 10 - 16, 2023 , 2023. http://papers.nips.cc/paper\_files/paper/2023/hash/ 43e9d647ccd3e4b7b5baab53f0368686-Abstract-Conference.html .
- Jingyuan Liu, Jianlin Su, Xingcheng Yao, Zhejun Jiang, Guokun Lai, Yulun Du, Yidao Qin, Weixin Xu, Enzhe Lu, Junjie Yan, et al. Muon is scalable for llm training. arXiv preprint arXiv:2502.16982 , 2025a.
- Junnan Liu, Hongwei Liu, Linchen Xiao, Ziyi Wang, Kuikun Liu, Songyang Gao, Wenwei Zhang, Songyang Zhang, and Kai Chen. Are your LLMs capable of stable reasoning? pages 17594-17632, Vienna, Austria, 2025b. Association for Computational Linguistics. https://aclanthology.org/2025.findings-acl.905/ .
- Ilya Loshchilov and Frank Hutter. Decoupled weight decay regularization. arXiv preprint arXiv:1711.05101 , 2017.
- Hongliang Lu, Zhonglin Xie, Yaoyu Wu, Can Ren, Yuxuan Chen, and Zaiwen Wen. OptMATH: A scalable bidirectional data synthesis framework for optimization modeling. In Forty-second International Conference on Machine Learning , 2025. https://openreview.net/forum?id=9P5e6iE4WK .
- Hongzhi Luan, Changxin Tian, Zhaoxin Huan, Xiaolu Zhang, Kunlong Chen, Zhiqiang Zhang, and Jun Zhou. Bose: A systematic evaluation method optimized for base models. arXiv preprint arXiv:2503.00812 , 2025.
- Kaijing Ma, Xeron Du, Yunran Wang, Haoran Zhang, Zhoufutu Wen, Xingwei Qu, Jian Yang, Jiaheng Liu, Minghao Liu, Xiang Yue, Wenhao Huang, and Ge Zhang. Kor-bench: Benchmarking language models on knowledge-orthogonal
reasoning tasks. In The Thirteenth International Conference on Learning Representations, ICLR 2025, Singapore, April 24-28, 2025 . OpenReview.net, 2025. https://openreview.net/forum?id=SVRRQ8goQo .
- MAA. American invitational mathematics examination 2024, 2024. https:// artofproblemsolving.com/wiki/index.php/American\_Invitational\_Mathematics\_Examination?srsltid= AfmBOoqiDCiaGTLQrsRTKsZui8RFnjOZqM4qIqY3yGB3sBaqOaxwf\_Xt .
- MAA. American invitational mathematics examination 2025, 2025. https:// artofproblemsolving.com/wiki/index.php/American\_Invitational\_Mathematics\_Examination?srsltid= AfmBOoqiDCiaGTLQrsRTKsZui8RFnjOZqM4qIqY3yGB3sBaqOaxwf\_Xt .
- Rabeeh Karimi Mahabadi, Sanjeev Satheesh, Shrimai Prabhumoye, Mostofa Patwary, Mohammad Shoeybi, and Bryan Catanzaro. Nemotron-cc-math: A 133 billion-token-scale high quality math pretraining dataset. arXiv preprint arXiv:2508.15096 , 2025.
- Moonshot-AI. Kimi k2: Open agentic intelligence, 2025. https://moonshotai.github.io/Kimi-K2/ .
- Thuat Nguyen, Chien Van Nguyen, Viet Dac Lai, Hieu Man, Nghia Trung Ngo, Franck Dernoncourt, Ryan A. Rossi, and Thien Huu Nguyen. CulturaX: A cleaned, enormous, and multilingual dataset for large language models in 167 languages. In Proceedings of the 2024 Joint International Conference on Computational Linguistics, Language Resources and Evaluation (LREC-COLING 2024) , pages 4226-4237, Torino, Italia, May 2024. ELRA and ICCL. https://aclanthology. org/2024.lrec-main.377 .
- NVIDIA. Nvidia nemo framework, 2024. https://github.com/NVIDIA-NeMo/NeMo/ .
- OpenAI. Multilingual massive multitask language understanding, 2024. https://huggingface.co/datasets/openai/ MMMLU .
- OpenAI. Gpt-5 system card. Technical report, OpenAI, Aug 2025. https://cdn.openai.com/gpt-5-system-card.pdf . Technical report.
- Samuel J Paech. Eq-bench creative writing benchmark v3. https://github.com/EQ-bench/creative-writing-bench , 2025.
- Nisarg Patel, Mohith Kulkarni, Mihir Parmar, Aashna Budhiraja, Mutsumi Nakamura, Neeraj Varshney, and Chitta Baral. Multi-logieval: Towards evaluating multi-step logical reasoning ability of large language models. arXiv preprint arXiv:2406.17169 , 2024.
- Guilherme Penedo, Hynek Kydlíˇ cek, Loubna Ben allal, Anton Lozhkov, Margaret Mitchell, Colin Raffel, Leandro Von Werra, and Thomas Wolf. The fineweb datasets: Decanting the web for the finest text data at scale, 2024. https: //arxiv.org/abs/2406.17557 .
- Guilherme Penedo, Anton Lozhkov, Hynek Kydlíˇ cek, Loubna Ben Allal, Edward Beeching, Agustín Piqueres Lajarín, Quentin Gallouédec, Nathan Habib, Lewis Tunstall, and Leandro von Werra. Codeforces. https://huggingface.co/ datasets/open-r1/codeforces , 2025.
- Bowen Peng, Jeffrey Quesnelle, Honglu Fan, and Enrico Shippole. Yarn: Efficient context window extension of large language models. arXiv preprint arXiv:2309.00071 , 2023.
- Qiwei Peng, Yekun Chai, and Xuhong Li. Humaneval-xl: A multilingual code generation benchmark for cross-lingual natural language generalization. In Nicoletta Calzolari, Min-Yen Kan, Véronique Hoste, Alessandro Lenci, Sakriani Sakti, and Nianwen Xue, editors, Proceedings of the 2024 Joint International Conference on Computational Linguistics, Language Resources and Evaluation, LREC/COLING 2024, 20-25 May, 2024, Torino, Italy , pages 8383-8394. ELRA and ICCL, 2024a. https://aclanthology.org/2024.lrec-main.735 .
- Qiwei Peng, Yekun Chai, and Xuhong Li. Humaneval-xl: A multilingual code generation benchmark for cross-lingual natural language generalization. In Nicoletta Calzolari, Min-Yen Kan, Véronique Hoste, Alessandro Lenci, Sakriani Sakti, and Nianwen Xue, editors, Proceedings of the 2024 Joint International Conference on Computational Linguistics, Language Resources and Evaluation, LREC/COLING 2024, 20-25 May, 2024, Torino, Italy , pages 8383-8394. ELRA and ICCL, 2024b. https://aclanthology.org/2024.lrec-main.735 .
- Long Phan, Alice Gatti, Ziwen Han, Nathaniel Li, Josephina Hu, Hugh Zhang, Chen Bo Calvin Zhang, Mohamed Shaaban, John Ling, Sean Shi, et al. Humanity's last exam. arXiv preprint arXiv:2501.14249 , 2025.
- Shanghaoran Quan, Jiaxi Yang, Bowen Yu, Bo Zheng, Dayiheng Liu, An Yang, Xuancheng Ren, Bofei Gao, Yibo Miao, Yunlong Feng, et al. Codeelo: Benchmarking competition-level code generation of llms with human-comparable elo ratings. CoRR , 2025.
- David Rein, Betty Li Hou, Asa Cooper Stickland, Jackson Petty, Richard Yuanzhe Pang, Julien Dirani, Julian Michael, and Samuel R. Bowman. GPQA: A graduate-level google-proof q&a benchmark. CoRR , abs/2311.12022, 2023. doi: 10.48550/ARXIV.2311.12022. https://doi.org/10.48550/arXiv.2311.12022 .
- Abulhair Saparov and He He. Language models are greedy reasoners: A systematic formal analysis of chain-of-thought. In The Eleventh International Conference on Learning Representations , 2023. https://openreview.net/forum?id=qFVVBzXxR2V .
- Rico Sennrich, Barry Haddow, and Alexandra Birch. Neural machine translation of rare words with subword units. arXiv preprint arXiv:1508.07909 , 2015.
- Zhihong Shao, Peiyi Wang, Qihao Zhu, Runxin Xu, Junxiao Song, Xiao Bi, Haowei Zhang, Mingchuan Zhang, YK Li, Yang Wu, et al. Deepseekmath: Pushing the limits of mathematical reasoning in open language models. arXiv preprint arXiv:2402.03300 , 2024.
- Noam Shazeer, Azalia Mirhoseini, Krzysztof Maziarz, Andy Davis, Quoc Le, Geoffrey Hinton, and Jeff Dean. Outrageously large neural networks: The sparsely-gated mixture-of-experts layer. arXiv preprint arXiv:1701.06538 , 2017.
- Freda Shi, Mirac Suzgun, Markus Freitag, Xuezhi Wang, Suraj Srivats, Soroush Vosoughi, Hyung Won Chung, Yi Tay, Sebastian Ruder, Denny Zhou, Dipanjan Das, and Jason Wei. Language models are multilingual chain-of-thought reasoners. In The Eleventh International Conference on Learning Representations, ICLR 2023, Kigali, Rwanda, May 1-5, 2023 . OpenReview.net, 2023. https://openreview.net/forum?id=fR3wGCk-IXp .
- Yusuxke Shibata, Takuya Kida, Shuichi Fukamachi, Masayuki Takeda, Ayumi Shinohara, Takeshi Shinohara, and Setsuo Arikawa. Byte pair encoding: A text compression scheme that accelerates pattern matching. 1999.
- Mohammad Shoeybi, Mostofa Patwary, Raul Puri, Patrick LeGresley, Jared Casper, and Bryan Catanzaro. Megatron-lm: Training multi-billion parameter language models using model parallelism. arXiv preprint arXiv:1909.08053 , 2019.
- Luca Soldaini, Rodney Kinney, Akshita Bhagia, Dustin Schwenk, David Atkinson, Russell Authur, Ben Bogin, Khyathi Chandu, Jennifer Dumas, Yanai Elazar, Valentin Hofmann, Ananya Harsh Jha, Sachin Kumar, Li Lucy, Xinxi Lyu, Nathan Lambert, Ian Magnusson, Jacob Morrison, Niklas Muennighoff, Aakanksha Naik, Crystal Nam, Matthew E. Peters, Abhilasha Ravichander, Kyle Richardson, Zejiang Shen, Emma Strubell, Nishant Subramani, Oyvind Tafjord, Pete Walsh, Luke Zettlemoyer, Noah A. Smith, Hannaneh Hajishirzi, Iz Beltagy, Dirk Groeneveld, Jesse Dodge, and Kyle Lo. Dolma: an open corpus of three trillion tokens for language model pretraining research, 2024. https: //arxiv.org/abs/2402.00159 .
- Jianlin Su, Murtadha Ahmed, Yu Lu, Shengfeng Pan, Wen Bo, and Yunfeng Liu. Roformer: Enhanced transformer with rotary position embedding. Neurocomputing , 568:127063, 2024.
- Alon Talmor, Jonathan Herzig, Nicholas Lourie, and Jonathan Berant. Commonsenseqa: A question answering challenge targeting commonsense knowledge. arXiv preprint arXiv:1811.00937 , 2018.
- Zhengyang Tang, Xingxing Zhang, Benyou Wang, and Furu Wei. Mathscale: Scaling instruction tuning for mathematical reasoning. In Forty-first International Conference on Machine Learning, ICML 2024, Vienna, Austria, July 21-27, 2024 . OpenReview.net, 2024. https://openreview.net/forum?id=Kjww7ZN47M .
- Zichen Tang, Haihong E, Ziyan Ma, Haoyang He, Jiacheng Liu, Zhongjun Yang, Zihua Rong, Rongjin Li, Kun Ji, Qing Huang, Xinyang Hu, Yang Liu, and Qianhe Zheng. Financereasoning: Benchmarking financial numerical reasoning more credible, comprehensive and challenging. In Proceedings of the 63rd Annual Meeting of the Association for Computational Linguistics (Volume 1: Long Papers) , page 15721-15749. Association for Computational Linguistics, 2025a. doi: 10.18653/v1/2025.acl-long.766. http://dx.doi.org/10.18653/v1/2025.acl-long.766 .
- Zichen Tang, Haihong E, Ziyan Ma, Haoyang He, Jiacheng Liu, Zhongjun Yang, Zihua Rong, Rongjin Li, Kun Ji, Qing Huang, Xinyang Hu, Yang Liu, and Qianhe Zheng. Financereasoning: Benchmarking financial numerical reasoning more credible, comprehensive and challenging. In Wanxiang Che, Joyce Nabende, Ekaterina Shutova, and Mohammad Taher Pilehvar, editors, Proceedings of the 63rd Annual Meeting of the Association for Computational Linguistics (Volume 1: Long Papers), ACL 2025, Vienna, Austria, July 27 - August 1, 2025 , pages 15721-15749. Association for Computational Linguistics, 2025b. https://aclanthology.org/2025.acl-long.766/ .
- Tencent-Hunyuan. Hunyuan-7b, 2024. https://github.com/Tencent-Hunyuan/Hunyuan-7B .
- Changxin Tian, Kunlong Chen, Jia Liu, Ziqi Liu, Zhiqiang Zhang, and Jun Zhou. Towards greater leverage: Scaling laws for efficient mixture-of-experts language models, 2025a. https://arxiv.org/abs/2507.17702 .
- Changxin Tian, Jiapeng Wang, Qian Zhao, Kunlong Chen, Jia Liu, Ziqi Liu, Jiaxin Mao, Wayne Xin Zhao, Zhiqiang Zhang, and Jun Zhou. Wsm: Decay-free learning rate schedule via checkpoint merging for llm pre-training, 2025b. https://arxiv.org/abs/2507.17634 .
- Jörg Tiedemann. Parallel data, tools and interfaces in OPUS. In Nicoletta Calzolari, Khalid Choukri, Thierry Declerck, Mehmet U˘ gur Do˘ gan, Bente Maegaard, Joseph Mariani, Asuncion Moreno, Jan Odijk, and Stelios Piperidis, editors, Proceedings of the Eighth International Conference on Language Resources and Evaluation (LREC'12) , pages 2214-2218, Istanbul, Turkey, May 2012. European Language Resources Association (ELRA). http://www.lrec-conf.org/proceedings/ lrec2012/pdf/463\_Paper.pdf .
- Jiapeng Wang, Changxin Tian, Kunlong Chen, Ziqi Liu, Jiaxin Mao, Wayne Xin Zhao, Zhiqiang Zhang, and Jun Zhou. Map: A unified framework for reliable evaluation of pre-training dynamics. 2025. https://arxiv.org/abs/2510.09295 .
- Yubo Wang, Xueguang Ma, Ge Zhang, Yuansheng Ni, Abhranil Chandra, Shiguang Guo, Weiming Ren, Aaran Arulraj, Xuan He, Ziyan Jiang, Tianle Li, Max Ku, Kai Wang, Alex Zhuang, Rongqi Fan, Xiang Yue, and Wenhu Chen. Mmlupro: A more robust and challenging multi-task language understanding benchmark. In Amir Globersons, Lester Mackey, Danielle Belgrave, Angela Fan, Ulrich Paquet, Jakub M. Tomczak, and Cheng Zhang, editors, Advances in Neural Information Processing Systems 38: Annual Conference on Neural Information Processing Systems 2024, NeurIPS 2024, Vancouver, BC, Canada, December 10 - 15, 2024 , 2024. http://papers.nips.cc/paper\_files/paper/2024/hash/ ad236edc564f3e3156e1b2feafb99a24-Abstract-Datasets\_and\_Benchmarks\_Track.html .
- Tianwen Wei, Jian Luan, Wei Liu, Shuang Dong, and Bin Wang. CMATH: can your language model pass chinese elementary school math test? CoRR , abs/2306.16636, 2023. doi: 10.48550/ARXIV.2306.16636. https://doi.org/10. 48550/arXiv.2306.16636 .
- Yuning Wu, Jiahao Mei, Ming Yan, Chenliang Li, Shaopeng Lai, Yuran Ren, Zijia Wang, Ji Zhang, Mengyue Wu, Qin Jin, and Fei Huang. Writingbench: A comprehensive benchmark for generative writing, 2025. https://arxiv.org/abs/ 2503.05244 .
- Xin Xu, Jiaxin Zhang, Tianhao Chen, Zitong Chao, Jishan Hu, and Can Yang. Ugmathbench: A diverse and dynamic benchmark for undergraduate-level mathematical reasoning with large language models. arXiv preprint arXiv:2501.13766 , 2025.
- Fanjia Yan, Huanzhi Mao, Charlie Cheng-Jie Ji, Tianjun Zhang, Shishir G. Patil, Ion Stoica, and Joseph E. Gonzalez. Berkeley function calling leaderboard. https://gorilla.cs.berkeley.edu/blogs/8\_berkeley\_function\_calling\_ leaderboard.html , 2024.
- An Yang, Baosong Yang, Beichen Zhang, Binyuan Hui, Bo Zheng, Bowen Yu, Chengyuan Li, Dayiheng Liu, Fei Huang, Haoran Wei, Huan Lin, Jian Yang, Jianhong Tu, Jianwei Zhang, Jianxin Yang, Jiaxi Yang, Jingren Zhou, Junyang Lin, Kai Dang, Keming Lu, Keqin Bao, Kexin Yang, Le Yu, Mei Li, Mingfeng Xue, Pei Zhang, Qin Zhu, Rui Men, Runji Lin, Tianhao Li, Tingyu Xia, Xingzhang Ren, Xuancheng Ren, Yang Fan, Yang Su, Yichang Zhang, Yu Wan, Yuqiong Liu, Zeyu Cui, Zhenru Zhang, and Zihan Qiu. Qwen2.5 technical report. CoRR , abs/2412.15115, 2024a. doi: 10.48550/ARXIV.2412.15115. https://doi.org/10.48550/arXiv.2412.15115 .
- An Yang, Beichen Zhang, Binyuan Hui, Bofei Gao, Bowen Yu, Chengpeng Li, Dayiheng Liu, Jianhong Tu, Jingren Zhou, Junyang Lin, Keming Lu, Mingfeng Xue, Runji Lin, Tianyu Liu, Xingzhang Ren, and Zhenru Zhang. Qwen2.5-math technical report: Toward mathematical expert model via self-improvement. arXiv preprint arXiv:2409.12122 , 2024b.
- An Yang, Anfeng Li, Baosong Yang, Beichen Zhang, Binyuan Hui, Bo Zheng, Bowen Yu, Chang Gao, Chengen Huang, Chenxu Lv, Chujie Zheng, Dayiheng Liu, Fan Zhou, Fei Huang, Feng Hu, Hao Ge, Haoran Wei, Huan Lin, Jialong Tang, Jian Yang, Jianhong Tu, Jianwei Zhang, Jian Yang, Jiaxi Yang, Jingren Zhou, Junyang Lin, Kai Dang, Keqin Bao, Kexin Yang, Le Yu, Lianghao Deng, Mei Li, Mingfeng Xue, Mingze Li, Pei Zhang, Peng Wang, Qin Zhu, Rui Men, Ruize Gao, Shixuan Liu, Shuang Luo, Tianhao Li, Tianyi Tang, Wenbiao Yin, Xingzhang Ren, Xinyu Wang, Xinyu Zhang, Xuancheng Ren, Yang Fan, Yang Su, Yichang Zhang, Yinger Zhang, Yu Wan, Yuqiong Liu, Zekun Wang, Zeyu Cui, Zhenru Zhang, Zhipeng Zhou, and Zihan Qiu. Qwen3 technical report. CoRR , abs/2505.09388, 2025a. doi: 10.48550/ARXIV.2505.09388. https://doi.org/10.48550/arXiv.2505.09388 .
- Zhicheng Yang, Yiwei Wang, Yinya Huang, Zhijiang Guo, Wei Shi, Xiongwei Han, Liang Feng, Linqi Song, Xiaodan Liang, and Jing Tang. Optibench meets resocratic: Measure and improve LLMs for optimization modeling. In The Thirteenth International Conference on Learning Representations , 2025b. https://openreview.net/forum?id=fsDZwS49uY .
- Matei Zaharia, Ali Ghodsi, Reynold Xin, and Michael Armbrust. Lakehouse: A new generation of open platforms that unify data warehousing and advanced analytics. In 11th Conference on Innovative Data Systems Research, CIDR 2021, Virtual Event, January 11-15, 2021, Online Proceedings . www.cidrdb.org, 2021. http://cidrdb.org/cidr2021/papers/ cidr2021\_paper17.pdf .
- Alexander Zhang, Marcus Dong, Jiaheng Liu, Wei Zhang, Yejie Wang, Jian Yang, Ge Zhang, Tianyu Liu, Zhongyuan Peng, Yingshui Tan, Yuanxing Zhang, Zhexu Wang, Weixun Wang, Yancheng He, Ken Deng, Wangchunshu Zhou, Wenhao
Huang, and Zhaoxiang Zhang. Codecriticbench: A holistic code critique benchmark for large language models. CoRR , abs/2502.16614, 2025a. doi: 10.48550/ARXIV.2502.16614. https://doi.org/10.48550/arXiv.2502.16614 .
Chenchen Zhang, Yuhang Li, Can Xu, Jiaheng Liu, Ao Liu, Shihui Hu, Dengpeng Wu, Guanhua Huang, Kejiao Li, Qi Yi, Ruibin Xiong, Haotian Zhu, Yuanxing Zhang, Yuhao Jiang, Yue Zhang, Zenan Xu, Bohui Zhai, Guoxiang He, Hebin Li, Jie Zhao, Le Zhang, Lingyun Tan, Pengyu Guo, Xianshu Pang, Yang Ruan, Zhifeng Zhang, Zhonghu Wang, Ziyan Xu, Zuopu Yin, Wiggin Zhou, Chayse Zhou, and Fengzong Lian. Artifactsbench: Bridging the visual-interactive gap in llm code generation evaluation, 2025b. https://arxiv.org/abs/2507.04952 .
Chujie Zheng, Shixuan Liu, Mingze Li, Xiong-Hui Chen, Bowen Yu, Chang Gao, Kai Dang, Yuqiong Liu, Rui Men, An Yang, et al. Group sequence policy optimization. arXiv preprint arXiv:2507.18071 , 2025.
Lianmin Zheng, Liangsheng Yin, Zhiqiang Xie, Chuyue Sun, Jeff Huang, Cody Hao Yu, Shiyi Cao, Christos Kozyrakis, Ion Stoica, Joseph E. Gonzalez, Clark Barrett, and Ying Sheng. SGLang: Efficient execution of structured language model programs. In The Thirty-eighth Annual Conference on Neural Information Processing Systems , 2024. https://openreview. net/forum?id=VqkAKQibpq .
Fan Zhou, Zengzhi Wang, Nikhil Ranjan, Zhoujun Cheng, Liping Tang, Guowei He, Zhengzhong Liu, and Eric P Xing. Megamath: Pushing the limits of open math corpora. arXiv preprint arXiv:2504.02807 , 2025.
Jeffrey Zhou, Tianjian Lu, Swaroop Mishra, Siddhartha Brahma, Sujoy Basu, Yi Luan, Denny Zhou, and Le Hou. Instruction-following evaluation for large language models. arXiv preprint arXiv:2311.07911 , 2023.
Qin Zhu, Fei Huang, Runyu Peng, Keming Lu, Bowen Yu, Qinyuan Cheng, Xipeng Qiu, Xuanjing Huang, and Junyang Lin. Autologi: Automated generation of logic puzzles for evaluating reasoning abilities of large language models. CoRR , abs/2502.16906, 2025. doi: 10.48550/ARXIV.2502.16906. https://doi.org/10.48550/arXiv.2502.16906 .
Terry Yue Zhuo, Minh Chien Vu, Jenny Chim, Han Hu, Wenhao Yu, Ratnadira Widyasari, Imam Nur Bani Yusuf, Haolan Zhan, Junda He, Indraneil Paul, Simon Brunner, Chen Gong, James Hoang, Armel Randy Zebaze, Xiaoheng Hong, Wen-Ding Li, Jean Kaddour, Ming Xu, Zhihan Zhang, Prateek Yadav, and et al. Bigcodebench: Benchmarking code generation with diverse function calls and complex instructions. In The Thirteenth International Conference on Learning Representations, ICLR 2025, Singapore, April 24-28, 2025 . OpenReview.net, 2025. https://openreview.net/forum?id= YrycTjllL0 .
Yuxin Zuo, Shang Qu, Yifei Li, Zhang-Ren Chen, Xuekai Zhu, Ermo Hua, Kaiyan Zhang, Ning Ding, and Bowen Zhou. Medxpertqa: Benchmarking expert-level medical reasoning and understanding. In Forty-second International Conference on Machine Learning , 2025.
## A The Method to Compute Save Interval
To determine the optimal checkpoint saving interval, we devised a simple and easy-tounderstand strategy. First, the impact of daily checkpoint saving and failover rollbacks on the ETTR can be expressed as:
$$E = \frac { 1 4 4 0 \cdot C } { s } + \frac { F \cdot s } { 2 } + F \cdot A$$
where F represents the number of failover events per day, A is the time cost of each failover, C denotes the storage overhead incurred by each checkpoint save, s is the checkpoint saving interval, and F ∗ A will be a constant value. By removing the constant terms and continuing the derivation, we can further obtain:
$$E = \frac { 1 4 4 0 * C } { s } + F * s - \sqrt { 7 2 0 }$$
It is evident that when 1440 ∗ C s = F ∗ s 2 we can obtain the optimal value of E , i.e., s = √ 2880 ∗ C F , which corresponds to the minimal impact of failover on the ETTR. In Ling-1T training, we configure the checkpoint saving interval to be 48 minutes
## B Pre-training Data Details
## B.1 Reasoning Data
## B.1.1 Ling Code Corpus
To support the training of high-performance coding-oriented large language models, we constructed a diverse, large-scale, and quality-stratified Ling Code Corpus that integrates multiple data sources, covering source code, code-related natural language data, and synthetic instructional data. Our curation pipeline emphasizes both breadth of programming language and domain coverage, and the depth of quality control.
Source Code. We collected raw source code from GitHub repositories, and conduct multistage data curation pipeline consists of:
- Multilingual fine-grained cleaning rules tailored to the syntax and conventions of each language. We also apply Lint-based 10 syntactic validation to remove files with compilation or structural errors. This stage results in approximately 2.7 T tokens of source code after deduplication, and covers 660 programming languages.
- We further conduct quality stratification along three dimensions as below.
- -Code style and readability,
- -Norm adherence and structure, and
- -Complexity and difficulty.
This stage results in 600 B tokens of top-quality subset of curated code.
- To further enhance linguistic diversity and naturalness, we applied code rephrasing and paraphrasing techniques, generating an additional 300 B tokens of augmented code data.
Common Crawl-Based Code Related Data. To complement GitHub-sourced material, we iteratively optimize our code-oriented html-parsers and cleaning operators to curate data from Common Crawl and Web. We conducted two-stage recall (broad recall followed by fine recall), targeting code-related pages, tutorials, and developers' discussions.
This process yielded approximately 700 B tokens of code-related Common Crawl data, from which we further extracted 140 B+ tokens of high-quality refined corpus after rigorous filtering and normalization.
Code-NLP Data. We reconstructed commit data from GHArchive 11 by replaying event sequences (e.g., pull requests, issues, merges) at the repository level. This reconstruction produced a rich dataset of 73 B tokens of commit-level records, capturing real developer intent, revision rationale, and contextual discussions. Besides, we also include other types of code-nlp data such as notebooks.
Code Contest Data. To improve problem-solving and reasoning ability, we curated a large collection of programming-competition data. This includes: 1) problem statements from diverse platforms; 2) user submissions representing various solution strategies; 3) related user discussions and commentary threads.
10 https://en.wikipedia.org/wiki/Lint\_(software)
11 https://www.gharchive.org/
Figure 22 Experimental results to show the detailed performance of complete code corpus with 1B models.
<details>
<summary>Image 23 Details</summary>
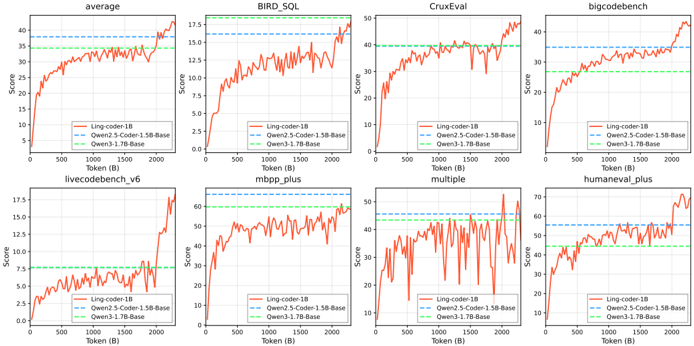
### Visual Description
## Line Graphs: Model Performance Across Tasks
### Overview
The image contains eight line graphs arranged in a 2x4 grid, comparing the performance of three AI models (Ling-coder-1B, Open2.5-Coder-1.5-Base, Open3.1-7B-Base) across different tasks. Each graph tracks cumulative scores over token increments (0–2000) with distinct y-axis ranges per task. Dashed horizontal lines represent task-specific benchmarks.
---
### Components/Axes
- **X-axis**: "Token (B)" (0–2000 tokens) across all graphs.
- **Y-axis**: "Score" with task-specific ranges:
- `average`: 0–40
- `BIRD_SQL`: 0–17.5
- `CruxEval`: 0–40
- `bigcodebench`: 0–40
- `livecodebench_v6`: 0–17.5
- `mbpp_plus`: 0–60
- `multiple`: 0–50
- `humaneval_plus`: 0–60
- **Legend**: Positioned at the bottom-right of each graph, with three entries:
- **Red**: Ling-coder-1B
- **Blue**: Open2.5-Coder-1.5-Base
- **Green**: Open3.1-7B-Base
- **Dashed Lines**: Task-specific benchmarks (e.g., 35 for `average`, 17.5 for `BIRD_SQL`).
---
### Detailed Analysis
1. **`average`**:
- **Red (Ling-coder-1B)**: Starts at ~10, peaks at ~35, with fluctuations.
- **Blue (Open2.5-Coder-1.5-Base)**: Begins at ~5, rises to ~30, surpassing red after ~1500 tokens.
- **Green (Open3.1-7B-Base)**: Starts at ~20, reaches ~35, maintaining the highest score.
- **Dashed Line**: Horizontal at 35 (benchmark).
2. **`BIRD_SQL`**:
- **Red**: Starts at ~5, peaks at ~15, with volatility.
- **Blue**: Begins at ~2, rises to ~12, overtaking red after ~1000 tokens.
- **Green**: Starts at ~8, reaches ~15, consistently leading.
- **Dashed Line**: Horizontal at 17.5.
3. **`CruxEval`**:
- **Red**: Starts at ~10, peaks at ~40, with sharp dips.
- **Blue**: Begins at ~5, rises to ~35, surpassing red after ~1500 tokens.
- **Green**: Starts at ~20, reaches ~40, maintaining dominance.
- **Dashed Line**: Horizontal at 40.
4. **`bigcodebench`**:
- **Red**: Starts at ~10, peaks at ~35, with gradual growth.
- **Blue**: Begins at ~5, rises to ~30, trailing red.
- **Green**: Starts at ~20, reaches ~35, leading throughout.
- **Dashed Line**: Horizontal at 35.
5. **`livecodebench_v6`**:
- **Red**: Starts at ~5, peaks at ~15, with erratic dips.
- **Blue**: Begins at ~2, rises to ~12, overtaking red after ~1000 tokens.
- **Green**: Starts at ~8, reaches ~15, consistently leading.
- **Dashed Line**: Horizontal at 17.5.
6. **`mbpp_plus`**:
- **Red**: Starts at ~10, peaks at ~50, with volatility.
- **Blue**: Begins at ~5, rises to ~40, surpassing red after ~1500 tokens.
- **Green**: Starts at ~20, reaches ~60, maintaining the highest score.
- **Dashed Line**: Horizontal at 60.
7. **`multiple`**:
- **Red**: Starts at ~10, peaks at ~40, with sharp dips.
- **Blue**: Begins at ~5, rises to ~35, surpassing red after ~1500 tokens.
- **Green**: Starts at ~20, reaches ~50, consistently leading.
- **Dashed Line**: Horizontal at 50.
8. **`humaneval_plus`**:
- **Red**: Starts at ~10, peaks at ~60, with gradual growth.
- **Blue**: Begins at ~5, rises to ~50, trailing red.
- **Green**: Starts at ~20, reaches ~60, maintaining dominance.
- **Dashed Line**: Horizontal at 60.
---
### Key Observations
- **Open3.1-7B-Base (Green)** consistently outperforms other models across all tasks, often reaching or exceeding benchmarks.
- **Ling-coder-1B (Red)** shows strong performance but lags behind Open3.1-7B-Base in most tasks, with notable volatility in `livecodebench_v6` and `multiple`.
- **Open2.5-Coder-1.5-Base (Blue)** generally underperforms Ling-coder-1B but occasionally surpasses it in later token increments (e.g., `BIRD_SQL`, `CruxEval`).
- **Task-Specific Benchmarks**: Dashed lines indicate target scores (e.g., 35 for `average`), with models approaching or exceeding these thresholds over time.
---
### Interpretation
The data suggests that **Open3.1-7B-Base** is the most robust model, achieving the highest scores across diverse tasks. Its consistent performance implies superior architecture or training efficiency. **Ling-coder-1B** demonstrates competitive performance but exhibits instability in certain tasks, possibly due to overfitting or task-specific limitations. **Open2.5-Coder-1.5-Base** underperforms in most cases but shows potential for improvement with increased token processing. The dashed benchmarks highlight performance targets, indicating that models like Open3.1-7B-Base not only meet but exceed these thresholds, suggesting advanced capabilities in handling complex tasks. The volatility in some graphs (e.g., `livecodebench_v6`) may reflect task-specific challenges or data noise.
</details>
Synthetic Data. In addition, we incorporated a small but diverse portion of synthetic data. Seed sources were drawn from programming platforms, library reference documentation, and programming concepts. We used compositional augmentation to cover broader coding concepts/topics.
Evaluating the Ling Code Corpus. We designed a lightweight verification strategy, i.e., training small-sized coding models (e.g., 1B size) from scratch to measure the performance of our code data. Experiments show that from-scratch training on single-type code data provides a reliable proxy for full-scale performance: the resulting base models exhibit strong task competence and consistent behavioral correlation with larger-scale models. This finding enables efficient early-stage validation of architecture and training recipes before scaling to tens or hundreds of billions of parameters. We show our results on 1B models (Ling-coder-1B) compared with Qwen2.5-Coder-1.5B-Base (Hui et al., 2024) and Qwen3-1.7B-Base (Yang et al., 2025a) in Figure 22. The results are promising that we have equivalent or even better results on mainstream benchmarks compared with Qwen2.5Coder-1.5B-Base. This is achieved by consuming only 2T tokens of our code data from scratch, with an additional 300B anealing phase.
## B.1.2 Ling Math Corpus
The mathematical proficiency of language models hinges on high-quality, diverse corpora. To train Ling 2.0 models of varying scales, we assembled a mathematics corpus exceeding 1.8T tokens, drawn from web pages, textbooks, research papers, code repositories, problem banks, and synthetic sources. A multi-stage processing pipeline-comprising parsing, recall, filtering, rewriting, and synthesis-was designed to curate this corpus. After careful balancing, the refined data constitutes the final pre-training mixture for our models.
General Math Data. Prior to construction of Ling Math Corpus , we iteratively improved the PDF and HTML parser to ensure the completeness of mathematical content. After that, we develop a multi-stage pipeline to recall highly relevant math data from diverse sources including the web (e.g. Common Crawl), book, paper, and source code. First of all, we iteratively build a fastText classifier with a high recall ratio to locate math data inside a much smaller candidate pool. Next, we fine-tune small language models to develop
LLM-Filter and LLM-Refiner with 4B parameters to filter out and refine data that contain mathematical knowledge or a step-by-step problem solving process. Upon applying the recall pipeline to diverse data sources along with employing deduplication technologies (e.g. MD5, MinHash), we collect a substantial volume of mathematical data comprising of web, book, paper etc .
Synthetic Math Data. In addition, we employ synthetic data generation to create a diverse range of mathematical question-answer (Q&A) pairs, varying in difficulty and incorporating step-by-step reasoning processes. This is performed on a high-quality recalled corpus sourced from multiple reputable origins. In parallel, we actively extract existing Q&A pairs from web and book corpora. Furthermore, we synthesize entirely new math problems from scratch using a large-scale mathematical concept graph (Chen et al., 2025), which contains thousands of nodes and millions of edges. This approach significantly expands the knowledge boundaries of our model. To complement this, we have also developed a sophisticated question generator designed to pose higher-quality and more realistic mathematical problems to the model.
Evaluating the Ling Math Corpus. To empirically validate the efficacy of our mathematical corpus, we use a continual-training then annealing strategy with only math corpus on a pre-trained Ling-coder-1B model introduced in Section B.1.1 for over 1.8T tokens, in which the last 300B is used for annealing training. Due to the space limit, we only present the performance results on the average value of benchmarks. As shown in Figure 4b, the resulting Ling-math-1B model exhibited performance superior to the competitive Qwen2.5Math-1.5B-Base (Yang et al., 2024b) and Qwen3-1.7B-Base (Yang et al., 2025a) on mainstream mathematical benchmarks (e.g. GSM8K (Cobbe et al., 2021), MATH (Hendrycks et al., 2021b), CollegeMath (Tang et al., 2024), OlympiadBench (He et al., 2024a), CMATH (Wei et al., 2023), MathBench (Liu et al., 2024) etc. ). This outcome substantiates the high quality of the integrated corpus.
Furthermore, a specific comparative analysis was conducted to evaluate the contribution of our curated mathematical web data. Using the same 1B-model training paradigm, we benchmarked our proprietary web data against a suite of well-regarded open-source datasets, namely Infi-mm-math (Han et al., 2024), finemath-3plus (Allal et al., 2025), megamath (Zhou et al., 2025), and nemotron-cc (Mahabadi et al., 2025). The Ling-math-web-1B model trained on our web data demonstrated a markedly superior performance shown in figure 24. This finding empirically validates the effectiveness of our specialized web data acquisition and refinement pipeline, which constitutes a critical factor in the overall strength of our pre-training data.
## B.2 Multilingual Data
The 2TB of multilingual data is mainly from open-source web datasets, such as CulturaX (Nguyen et al., 2024) and WanJuan (He et al., 2023), and we also involve several classical parallel corpora (OPUS (Tiedemann, 2012), MultiUN (Eisele and Chen, 2010) etc. ) to strengthen the cross-lingual alignment.
In terms of language distribution, our multilingual corpus covers about 30 languages in different domains such as web pages, code, mathematics, Wikipedia, parallel corpora, and a small amount of synthetic translation data. We first specifically include data from 18 individual languages, among which are
Figure 23 Experimental results of LingMathCorpus on representative benchmarks.
<details>
<summary>Image 24 Details</summary>
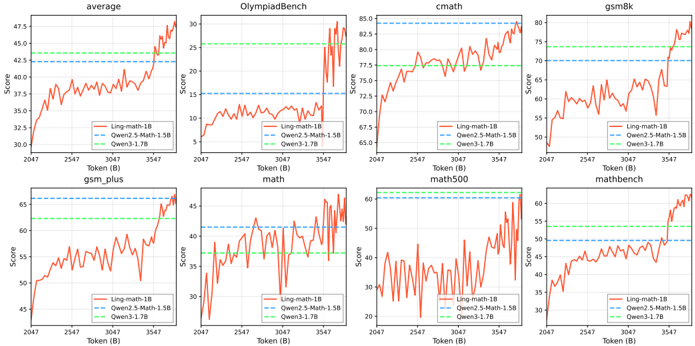
### Visual Description
## Line Graphs: Model Performance Across Tasks
### Overview
The image contains eight line graphs arranged in a 2x4 grid, comparing the performance of three AI models (Ling-math-1B, Owen2.5-Math-1.5B, Owen3.1-1.7B) across different mathematical reasoning tasks. Each graph tracks "Score" against "Token (B)" (tokens in billions), with distinct color-coded lines for each model.
---
### Components/Axes
- **X-axis**: "Token (B)" (247 to 3547), representing token count in billions.
- **Y-axis**: "Score" (ranges vary by task, e.g., 15–30 for OlympiadBench, 20–65 for OlympiadBench).
- **Legends**: Positioned at the bottom-right of each graph, with three entries:
- **Red**: Ling-math-1B
- **Blue**: Owen2.5-Math-1.5B
- **Green**: Owen3.1-1.7B
---
### Detailed Analysis
#### 1. **Average**
- **Trend**: Ling-math-1B (red) starts at ~32.5, peaks at ~47.5 by 3547 tokens. Owen2.5-Math-1.5B (blue) rises steadily from ~35 to ~42.5. Owen3.1-1.7B (green) starts at ~32.5, peaks at ~45.
- **Key Data**: Ling-math-1B shows the steepest growth, surpassing both Owen models by the end.
#### 2. **OlympiadBench**
- **Trend**: Ling-math-1B (red) starts at ~25, dips to ~15 at 3000 tokens, then rises to ~30. Owen2.5-Math-1.5B (blue) remains flat at ~15. Owen3.1-1.7B (green) stays at ~25.
- **Key Data**: Ling-math-1B underperforms initially but recovers, while Owen3.1-1.7B maintains stability.
#### 3. **cmath**
- **Trend**: Ling-math-1B (red) rises steadily from ~65 to ~85. Owen2.5-Math-1.5B (blue) fluctuates between ~75–80. Owen3.1-1.7B (green) stays flat at ~75.
- **Key Data**: Ling-math-1B outperforms both Owen models by the end.
#### 4. **gsmBk**
- **Trend**: Ling-math-1B (red) starts at ~55, peaks at ~80. Owen2.5-Math-1.5B (blue) rises from ~65 to ~75. Owen3.1-1.7B (green) stays flat at ~75.
- **Key Data**: Ling-math-1B surpasses Owen models after ~2500 tokens.
#### 5. **gsm_plus**
- **Trend**: Ling-math-1B (red) starts at ~45, peaks at ~65. Owen2.5-Math-1.5B (blue) rises from ~50 to ~60. Owen3.1-1.7B (green) stays flat at ~55.
- **Key Data**: Ling-math-1B outperforms both Owen models by the end.
#### 6. **math**
- **Trend**: Ling-math-1B (red) starts at ~30, peaks at ~50. Owen2.5-Math-1.5B (blue) rises from ~35 to ~45. Owen3.1-1.7B (green) stays flat at ~40.
- **Key Data**: Ling-math-1B surpasses Owen models after ~2500 tokens.
#### 7. **math500**
- **Trend**: Ling-math-1B (red) starts at ~30, peaks at ~50. Owen2.5-Math-1.5B (blue) rises from ~35 to ~45. Owen3.1-1.7B (green) stays flat at ~40.
- **Key Data**: Ling-math-1B surpasses Owen models after ~2500 tokens.
#### 8. **mathbench**
- **Trend**: Ling-math-1B (red) starts at ~30, peaks at ~55. Owen2.5-Math-1.5B (blue) rises from ~35 to ~50. Owen3.1-1.7B (green) stays flat at ~45.
- **Key Data**: Ling-math-1B outperforms both Owen models by the end.
---
### Key Observations
1. **Ling-math-1B** (red) consistently shows **non-linear growth**, often starting lower than Owen models but surpassing them by the end of the token range.
2. **Owen3.1-1.7B** (green) maintains **stable performance** across most tasks, with minimal fluctuations.
3. **Owen2.5-Math-1.5B** (blue) exhibits **moderate growth** but lags behind Owen3.1-1.7B in most cases.
4. **Task-specific anomalies**:
- In **OlympiadBench**, Ling-math-1B dips sharply at ~3000 tokens before recovering.
- In **math500**, Ling-math-1B experiences a **sharp drop** at ~3000 tokens before rebounding.
---
### Interpretation
The data suggests that **Ling-math-1B** improves significantly with increased token usage, potentially due to better optimization or larger capacity for complex reasoning. In contrast, **Owen3.1-1.7B** demonstrates **consistent stability**, indicating robustness in handling tasks without requiring extensive token processing. The **Owen2.5-Math-1.5B** model shows **moderate improvement** but remains outperformed by both Ling-math-1B and Owen3.1-1.7B in most tasks.
The **task-specific variations** (e.g., OlympiadBench vs. mathbench) highlight that model performance is context-dependent, with Ling-math-1B excelling in tasks requiring adaptive reasoning over tokens, while Owen models prioritize stability. The **sharp dips** in Ling-math-1B’s performance at ~3000 tokens in certain tasks may indicate computational bottlenecks or task-specific inefficiencies.
</details>
Figure 24 Complete comparison with open-source mathematical web data.
<details>
<summary>Image 25 Details</summary>
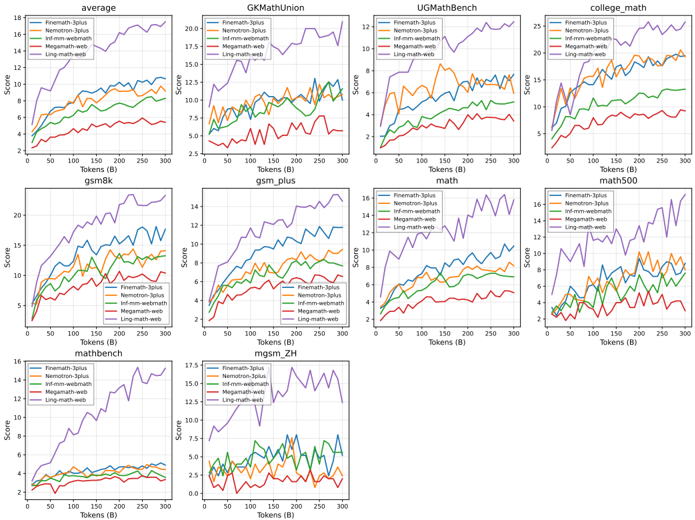
### Visual Description
## Line Graphs: Model Performance Across Math Benchmarks
### Overview
The image contains 10 line graphs arranged in a 4x3 grid (with one missing in the bottom-right corner), comparing the performance of five AI models across various math benchmarks. Each graph plots "Score" against "Tokens (B)" for different datasets: `average`, `GKMathUnion`, `UGMathBench`, `college_math`, `gsm8k`, `gsm_plus`, `math`, `math500`, `mathbench`, and `mgsm_ZH`. The models compared are:
- Finemath-3plus (blue)
- Nemotron-3plus (orange)
- Inf-mm-webmath (green)
- Megamath-web (red)
- Ling-math-web (purple)
### Components/Axes
- **X-axis**: "Tokens (B)" (0 to 300 in increments of 50)
- **Y-axis**: "Score" (varies by graph, typically 0–25)
- **Legend**: Located in the bottom-right corner of each graph, with color-coded labels for each model.
- **Graph Titles**: Each subplot is labeled with the benchmark name (e.g., "average", "GKMathUnion").
### Detailed Analysis
#### 1. `average` Graph
- **Trend**: All models show upward trends. Finemath-3plus (blue) and Nemotron-3plus (orange) perform best, reaching ~12–14 by 300B tokens. Megamath-web (red) lags, peaking at ~6.
- **Data Points**:
- 50B: Finemath-3plus (~6), Megamath-web (~3)
- 150B: Finemath-3plus (~10), Nemotron-3plus (~9)
- 300B: Finemath-3plus (~14), Nemotron-3plus (~13)
#### 2. `GKMathUnion` Graph
- **Trend**: Ling-math-web (purple) dominates early, peaking at ~18. Finemath-3plus (blue) and Nemotron-3plus (orange) plateau at ~12–14.
- **Data Points**:
- 100B: Ling-math-web (~16), Finemath-3plus (~10)
- 250B: Ling-math-web (~17), Nemotron-3plus (~12)
#### 3. `UGMathBench` Graph
- **Trend**: Finemath-3plus (blue) and Nemotron-3plus (orange) show erratic growth, peaking at ~12. Megamath-web (red) remains flat (~4–6).
- **Data Points**:
- 200B: Finemath-3plus (~11), Megamath-web (~5)
- 300B: Finemath-3plus (~12), Nemotron-3plus (~10)
#### 4. `college_math` Graph
- **Trend**: Finemath-3plus (blue) and Nemotron-3plus (orange) rise steadily to ~20. Ling-math-web (purple) fluctuates but peaks at ~25.
- **Data Points**:
- 150B: Finemath-3plus (~16), Ling-math-web (~22)
- 300B: Finemath-3plus (~20), Nemotron-3plus (~19)
#### 5. `gsm8k` Graph
- **Trend**: Finemath-3plus (blue) and Nemotron-3plus (orange) show sharp increases, peaking at ~18. Megamath-web (red) lags at ~8.
- **Data Points**:
- 100B: Finemath-3plus (~12), Megamath-web (~6)
- 250B: Finemath-3plus (~16), Nemotron-3plus (~14)
#### 6. `gsm_plus` Graph
- **Trend**: Finemath-3plus (blue) and Nemotron-3plus (orange) plateau at ~12–14. Ling-math-web (purple) peaks at ~14.
- **Data Points**:
- 200B: Finemath-3plus (~11), Ling-math-web (~13)
- 300B: Finemath-3plus (~12), Nemotron-3plus (~11)
#### 7. `math` Graph
- **Trend**: Finemath-3plus (blue) and Nemotron-3plus (orange) rise to ~14. Megamath-web (red) remains flat (~4–6).
- **Data Points**:
- 150B: Finemath-3plus (~10), Megamath-web (~5)
- 300B: Finemath-3plus (~14), Nemotron-3plus (~12)
#### 8. `math500` Graph
- **Trend**: Finemath-3plus (blue) and Nemotron-3plus (orange) peak at ~16. Megamath-web (red) fluctuates between 3–6.
- **Data Points**:
- 200B: Finemath-3plus (~12), Megamath-web (~4)
- 300B: Finemath-3plus (~16), Nemotron-3plus (~14)
#### 9. `mathbench` Graph
- **Trend**: Finemath-3plus (blue) and Nemotron-3plus (orange) rise steadily to ~14. Megamath-web (red) remains flat (~3–5).
- **Data Points**:
- 100B: Finemath-3plus (~8), Megamath-web (~3)
- 300B: Finemath-3plus (~14), Nemotron-3plus (~12)
#### 10. `mgsm_ZH` Graph
- **Trend**: Finemath-3plus (blue) and Nemotron-3plus (orange) peak at ~12. Ling-math-web (purple) fluctuates but peaks at ~15.
- **Data Points**:
- 150B: Finemath-3plus (~9), Ling-math-web (~13)
- 300B: Finemath-3plus (~12), Nemotron-3plus (~10)
### Key Observations
1. **Finemath-3plus** consistently outperforms other models across most benchmarks, especially in `college_math` and `gsm8k`.
2. **Ling-math-web** excels in `GKMathUnion` and `mgsm_ZH` but underperforms in `mathbench`.
3. **Megamath-web** (red) lags in all benchmarks, suggesting limited scalability with token count.
4. **Nemotron-3plus** (orange) shows moderate performance, often second to Finemath-3plus.
5. **Inf-mm-webmath** (green) is rarely visible, implying minimal data or low scores.
### Interpretation
The data suggests that **Finemath-3plus** and **Nemotron-3plus** are the most robust models for math tasks, with performance improving as token count increases. **Ling-math-web** performs well in specific benchmarks (e.g., `GKMathUnion`) but lacks consistency. **Megamath-web**’s flat trends indicate potential architectural limitations. The `average` graph highlights a general trend where higher token counts correlate with better scores, but model-specific optimizations (e.g., Ling-math-web in `GKMathUnion`) create outliers. The absence of Inf-mm-webmath in most graphs suggests it may not be a competitive model for these tasks.
</details>
- Germanic languages: German, Dutch, Swedish, Norwegian, Danish.
- Romance languages: Spanish, Portuguese, French, Italian, Romanian.
- Slavic languages: Russian, Polish, Ukrainian, Czech.
- Others: Vietnamese, Thai, Korean, Indonesian.
Furthermore, some corpora contain a mix of other languages, such as Japanese, Arabic, Hindi, Turkish, Finnish, etc. are also used.
Multilingual data accounts for 4% of the pre-training corpus. The proportion by language family is about: Romance languages 50%, Germanic languages 10%, Slavic languages
3%, and other languages the rest. The experiments find that this distribution maintains performance in Chinese and English, while significantly improving performance for minor languages. Data from Romance and Germanic languages have less negative effect on English and Chinese benchmarks, whereas lower-quality data from Slavic and other languages, especially Arabic or Japanese, can have a considerable negative effect.
## B.3 Data Infrastructure
Training large-scale language models poses significant challenges to the efficiency, scalability, and governance of data infrastructure. To address the pain points of traditional workflows, such as inefficient collaboration, opaque lineage, and slow iteration, we built a next-generation data infrastructure based on two core principles: Data-as-Code and a Unified Data Lakehouse .
Data-as-Code: From Manual Operations to Automated CI / CD. Our first principle is to codify the entire data processing pipeline and manage it within a version control system (e.g., Git) to achieve an automated and reproducible workflow. This methodology aligns with the design principles of the leading industry ML platforms, which aim to standardize and modulize the workflows for data processing and model training, managing them through code-driven orchestration (Baylor et al., 2017). Therefore, we developed a unified library for better managing AI Data Operators ( AIDataOps ), which centralizes over 50 data processing operators across multiple modalities, and integrated it into our automated CI/CD system. This transformation yields significant benefits: First, it provides an an end-to-end transparent and reproducible data lineage, making the origin of any data point clearly traceable. Second, it fully automates the development and backfilling of new features, dramatically increasing R&D agility by reducing the iteration cycle from months to days.
Unified Data Lakehouse and Wide-Table Architecture. The second principle is the implementation of a unified lakehouse architecture to consolidate disparate data sources (Zaharia et al., 2021). One of the biggest challenges for large-scale pretraining data management is that the data was scattered across hundreds of independent datasets, leading to severe data silos and inefficient experimentation. To solve this issue, we designed and implemented a unified logical wide table for major domains like web pages and code. This architecture acts as the central hub for all raw, processed, and trainable data. It not only simplifies data discovery and analysis through a unified view but also features elastic scalability, allowing new features to be added without full-table rebuilds. The system has been deeply optimized for large-scale training, achieving high-performance I/O of over 20 TB/hour and ensuring data processing is no longer a bottleneck.
By combining these two principles, we have created a powerful and efficient data engine. This infrastructure was instrumental in building the Ling 2.0 corpus. For instance, it enabled us to construct a wide table for all web data with trillions of records and to process 30 billion trainable data points in just two days. This system not only accelerates our current model development but also provides a solid foundation for more complex data exploration in the future.