# Adaptive Data Flywheel: Applying MAPE Control Loops to AI Agent Improvement
## Abstract
Enterprise AI agents must continuously adapt to maintain accuracy, reduce latency, and remain aligned with user needs. We present a practical implementation of a data flywheel in NVInfo AI, NVIDIA’s Mixture-of-Experts (MoE) Knowledge Assistant serving over 30,000 employees. By operationalizing a MAPE-driven data flywheel, we built a closed-loop system that systematically addresses failures in retrieval-augmented generation (RAG) pipelines and enables continuous learning. Over a 3-month post-deployment period, we monitored feedback and collected 495 negative samples. Analysis revealed two major failure modes: routing errors (5.25%) and query rephrasal errors (3.2%). Using NVIDIA NeMo microservices, we implemented targeted improvements through fine-tuning. For routing, we replaced a Llama 3.1 70B model with a fine-tuned 8B variant, achieving 96% accuracy, a 10× reduction in model size, and 70% latency improvement. For query rephrasal, fine-tuning yielded a 3.7% gain in accuracy and a 40% latency reduction. Our approach demonstrates how human-in-the-loop (HITL) feedback, when structured within a data flywheel, transforms enterprise AI agents into self-improving systems. Key learnings include approaches to ensure agent robustness despite limited user feedback, navigating privacy constraints, and executing staged rollouts in production. This work offers a repeatable blueprint for building robust, adaptive enterprise AI agents capable of learning from real-world usage at scale.
## I Introduction
Enterprise adoption of generative AI (GenAI) agents has accelerated rapidly, with applications ranging from knowledge retrieval to workflow automation. However, the performance of these systems often deteriorates post-deployment due to evolving user intent, domain drift, and the absence of systematic feedback integration. A central challenge in operationalizing such agents lies in enabling them to continuously adapt based on real-world usage patterns and user feedback, without requiring full-scale retraining or infrastructure overhauls.
While retrieval-augmented generation (RAG) pipelines and Mixture-of-Experts (MoE) architectures have improved the relevance and efficiency of enterprise AI agents, most production deployments remain static and reactive. Feedback mechanisms, if present, are frequently decoupled from the model improvement process. This disconnect results in stagnant accuracy, increasing latency, and declining user trust. There is a pressing need for closed-loop systems that can monitor agent performance, analyze failure modes, and execute targeted optimizations in a cost-efficient and privacy-aware manner.
In this work, we introduce a MAPE-based data flywheel framework that enables continuous learning in enterprise AI agents through a modular, feedback-driven pipeline. Adapted from self-adaptive control loops, this framework supports the deployment of agents that evolve incrementally over time. We apply this approach to NVIDIA’s deployment of NVInfo AI, an internal Knowledge Assistant Agent that serves over 30,000 employees across diverse domains including engineering, operations, HR, and sales. NVInfo AI integrates user feedback with performance telemetry to identify actionable failure signals and execute targeted updates using parameter-efficient fine-tuning (PEFT) and model specialization.
Over a three-month observation window, we collected and analyzed 495 negative feedback samples, revealing two dominant sources of failure: routing errors (5.25 %) and query rephrasal errors (3.2 %). Utilizing NVIDIA NeMo microservices, we applied lightweight, component-specific fine-tuning strategies to improve performance.
- For routing, we reduced model size by a factor of ten (from 70 billion to 8 billion parameters) while maintaining 96% accuracy and reducing latency by 70%.
- For query rephrasal, we achieved a 3.7% improvement in accuracy (measured on a synthetic dataset generated from manually analyzed incorrect queries, expanded to 5,000 examples and split 80/10/10), along with a 40% reduction in response latency.
This work makes three key contributions:
- We demonstrate a novel application of the MAPE control loop to the domain of GenAI agent improvement, bridging observability and action in a continuous feedback pipeline.
- We present an empirical analysis of post-deployment failure modes in a production-grade enterprise AI agent, informed by real user feedback.
- We provide a modular implementation blueprint using NVIDIA NeMo microservices, offering a practical architecture for organizations seeking to build adaptive and self-correcting AI agents.
## II Background and Related Work
### II-A From MAPE-K to Agentic AI: Foundations of Self-Adaptive Systems
The MAPE-K (Monitor, Analyze, Plan, Execute – Knowledge) reference model, introduced by IBM [1], remains foundational for designing self-adaptive software systems by structuring behavior into a control loop that continuously responds to environmental changes, with its modular architecture enabling broad adoption across multiple domains [2, 3, 4, 5, 6]. Central to its evolution is the Knowledge component, which supports long-term reasoning and intelligent adaptation, especially when integrated with machine learning to enable predictive and causal decision-making [7, 8, 9]. Within agentic AI frameworks, MAPE-K cycles are increasingly embedded in autonomous agents to drive real-time, decentralized adaptation that enables intelligent decision-making and responsive behavior in dynamic environments [10, 11]. As reinforcement learning and GenAI capabilities are incorporated into these loops, agents gain the ability to synthesize adaptive strategies and reason across modalities [12]. These advancements illustrate MAPE-K’s synergy with the data flywheel paradigm: each monitoring cycle enriches the knowledge base, fueling increasingly effective planning and adaptation through a self-reinforcing loop [13].
### II-B Modular Pipelines for Scalable RAG: Retrieval, Routing, and Rephrasal
As enterprises adopt Retrieval-Augmented Generation (RAG) through staged pipelines that involve retrieval, grounding, reasoning, and feedback, they increasingly realize its value for scalability, compliance, and trustworthy AI, positioning RAG as a core enabler of intelligent adaptive systems [14]. By grounding large language models in enterprise knowledge and facilitating continuous real-world feedback, RAG complements the MAPE-K trajectory and reinforces the data flywheel paradigm [15, 16]. To support enterprise RAG deployments at scale, expert routing has emerged as a key architectural strategy for enabling adaptive, modular reasoning. Modular approaches such as Mixture of Experts (MoE) and multi-agent systems [17, 18] dynamically direct inputs to specialized components using techniques like embedding selectors, symbolic routing, and LLM-as-a-Router, enhancing efficiency and task-specific alignment [19, 20]. A complementary strand of research focuses on query understanding and rephrasal, which are critical for strengthening RAG pipelines. By mitigating ambiguity and poorly structured queries, these methods enhance retrieval accuracy and reduce hallucinations [21, 22]. Recent advances leverage LLM-based rephrasal, semantic parsing, and uncertainty-aware frameworks such as RaFe and Omni-RAG to clarify intent, improve retrievability, and boost response reliability in enterprise contexts [23, 24, 25].
As these pipelines scale, the choice of model architecture becomes critical for balancing performance and cost. While 8B models offer lower latency and cost, they typically underperform compared to 70B models [26, 27, 28]. Parameter-efficient fine-tuning methods such as Low-Rank Adaptation (LoRA) and Quantized Low-Rank Adaptation (QLoRA) narrow this gap by adapting smaller models to specific tasks with minimal overhead, achieving near-parity in performance while reducing memory and compute demands by up to 100 $\times$ . This enables up to 60–80% savings in GPU costs without compromising accuracy [29, 30, 31, 32].
### II-C Feedback and Evaluation: Closing the Adaptation Loop
To close the loop in these adaptive systems, human-in-the-loop (HITL) pipelines serve as a critical counterpart to automated feedback mechanisms. By embedding human expertise into monitoring, annotation, and evaluation stages, HITL workflows enhance the reliability and contextual accuracy of enterprise RAG deployments, particularly in high-stakes domains where model errors can lead to significant consequences [33, 34]. Modern approaches integrate subject matter experts, active learning, weak supervision, and toolkits such as Snorkel, Label Studio, and Prodigy to reduce annotation effort while enabling scalable and domain-aligned feedback cycles that continuously refine model behavior [35, 36, 37].
Robust evaluation plays a vital role in transforming HITL and system-generated feedback into actionable signals for model refinement. As a key driver of the data flywheel, it determines which behaviors to reinforce, retrain, or discard. Beyond traditional metrics like accuracy and latency, emerging methods such as LLM-as-a-Judge, reward modeling, and preference-based scoring more effectively capture alignment and robustness [38, 39, 40, 41, 42].
### II-D MAPE-K-Aligned Data Flywheel for Self-Improving Enterprise GenAI Systems
Despite significant advances in retrieval, expert routing, rephrasal, fine-tuning, HITL feedback, and evaluation, enterprise GenAI systems often lack a cohesive architecture to support continuous adaptation. These components are typically implemented in isolation, limiting coordination between observability, retraining, and evaluation workflows. This fragmentation hampers responsiveness and diminishes reliability in production environments.
This paper presents the first comprehensive application of MAPE-K principles to the improvement of AI agents in enterprise settings. We introduce a MAPE-K-aligned data flywheel architecture that consolidates monitoring, analysis, planning, and execution into a modular, closed-loop pipeline. Leveraging NVIDIA’s NeMo Microservices [43, 44, 45, 46], our framework integrates observability, feedback ingestion, fine-tuning, and evaluation, and supports secure, low-latency deployment across cloud, on-premises, and hybrid environments with built-in policy enforcement and real-time feedback handling [47, 48].
By applying control-theoretic foundations to retrieval-augmented, multi-agent GenAI systems, our approach enables dynamic, self-improving behavior in production. The data flywheel continuously refines the knowledge base through each cycle of monitoring and evaluation, guiding targeted adaptations over time. This architecture provides a scalable and reliable foundation for building enterprise GenAI systems that evolve with real-world usage.
## III System Architecture
### III-A NVInfo AI: Mixture of Experts Architecture
Before describing the Adaptive Data Flywheel, we first present the underlying AI system it enhances. The NVInfo AI system operates as NVIDIA’s internal enterprise chatbot which provides services to more than 30,000 staff members spread across different locations worldwide. The system operates with an advanced Mixture of Experts (MoE) framework which optimizes its performance when processing various enterprise information requests.
#### III-A1 Architecture Components
The NVInfo AI system consists of multiple essential components (Figure 2, Appendix A) which work together to generate precise answers that understand user context.
- User Interface: The intranet portal functions as the main access point which allows staff members to ask questions and handles complex business information requirements across various domains. The system offers
- User questions through natural language while maintaining context understanding
- Response Generation in table, lists and formatted data structure
- Source references which link directly to SharePoint documentation
- Follow-up question suggestions generated from conversational context
- Feedback system which uses thumbs up/down buttons to help agents improve their performance.
- Router Module: The system uses Llama 3.1 70B as its initial large language model to classify user queries which then get sent to one of seven specialized experts.
- Financial Info Expert (earnings reports, transcripts)
- IT Help & HR Benefits Expert (ServiceNow knowledge and catalog)
- SharePoint Expert (intranet content)
- Holidays Expert (region-specific holiday calendars)
- Cafe Menu Expert (cafeteria information)
- People Expert (organization charts, reporting chains)
- NVIDIA Policies Expert (corporate policies and procedures)
- Query Processing Pipeline: The system processes queries through multiple stages after they pass through the router module.
1. Conversation Rephrasing: Incorporates prior turns for multi-turn dialogue.
1. Query Variations: Generates multiple rephrasings to improve retrieval coverage.
1. Retriever: Conducts semantic document searches across all available document collections.
1. Re-ranking & De-duplication: Ranks documents based on their relevance while removing duplicate results.
1. Answer Generation: Creates a unified response by processing the retrieved information.
1. Citation Generation: Produces trustworthy source links which enable users to verify information sources.
1. Suggested Follow-ups: Generates additional questions which help users discover new content while enhancing their interaction with the system.
#### III-A2 NVInfo AI Conversation and Feedback Collection
NVInfo AI system responds to user inquiries and simultaneously records extensive conversational data and user feedback information. The system records detailed response metrics and structured feedback metrics which get processed through a single data pipeline for system monitoring, evaluation and performance enhancement (Figure 3, Appendix B).
- User Interaction: The NVInfo User Interface enables Users to initiate queries. The NVInfo Agent receives input from the interface to execute query interpretation, information retrieval and response generation.
- Response Metrics Collection: The system generates NVInfo Response Metrics for every response it produces to enable observability and future analysis. The system tracks the following information points
- Query – the original user input
- Response – the agent’s output
- Category – the knowledge source from which information was retrieved
- Expert Selected – subject-matter expert or expert route chosen
- Time Taken – latency observed across different components in the agentic AI workflow
- Agent Thought – reasoning trace behind the response
- Rephrased Query – any reformulation of the user’s input
- IR Results – intermediate retrieval results
- Prompts – the prompt(s) used in response generation
- Guardrail Metrics – policy or safety checks applied to the response
These metrics are stored in DynamoDB, allowing fast, scalable storage of large volumes of response data.
- Feedback Metrics Collection: Users can give direct feedback through the thumbs up / thumbs down system after reviewing their responses. Users can access a feedback modal through these icons which allows them to add more details about their feedback. The system records the following NVInfo Feedback Metrics:
- Positive or negative signal (thumbs up/down)
- Contextual reasons for feedback, such as:
- Usefulness of cited sources
- Relevance of the generated response
- Clarity and completeness of the output
- Suggestions for improvement
These structured feedback metrics are stored in a SQL Database, making them easy to query for analytics and fine-grained error analysis.
- Unified Data Pipeline: The data ingestion pipeline receives both response metrics from DynamoDB and feedback metrics from the SQL Database. The data transformation process within this pipeline creates a uniform schema structure while adding supplementary information and establishing signal type connections to achieve system interaction understanding. The processed data moves to a central Data Lake where it becomes available for comprehensive analysis, continuous monitoring, and iterative improvements to the NVInfo AI system.
#### III-A3 Performance Characteristics
The baseline NVInfo AI operated with the following system metrics before Data Flywheel implementation:
- Average response time: $\,\sim\,$ 12 seconds per query
- LLM as judge ratings: 4.2 correctness score out of 5 measured on our regression dataset (see Appendix F)
- Weekly query volume: $\,\sim\,$ 2000 unique queries across 800 unique users
This Mixture of Experts framework serves as the base structure which our Adaptive Data Flywheel system uses to enhance particular experts through user feedback analysis.
<details>
<summary>dataflywheel_architecture.png Details</summary>
### Visual Description
\n
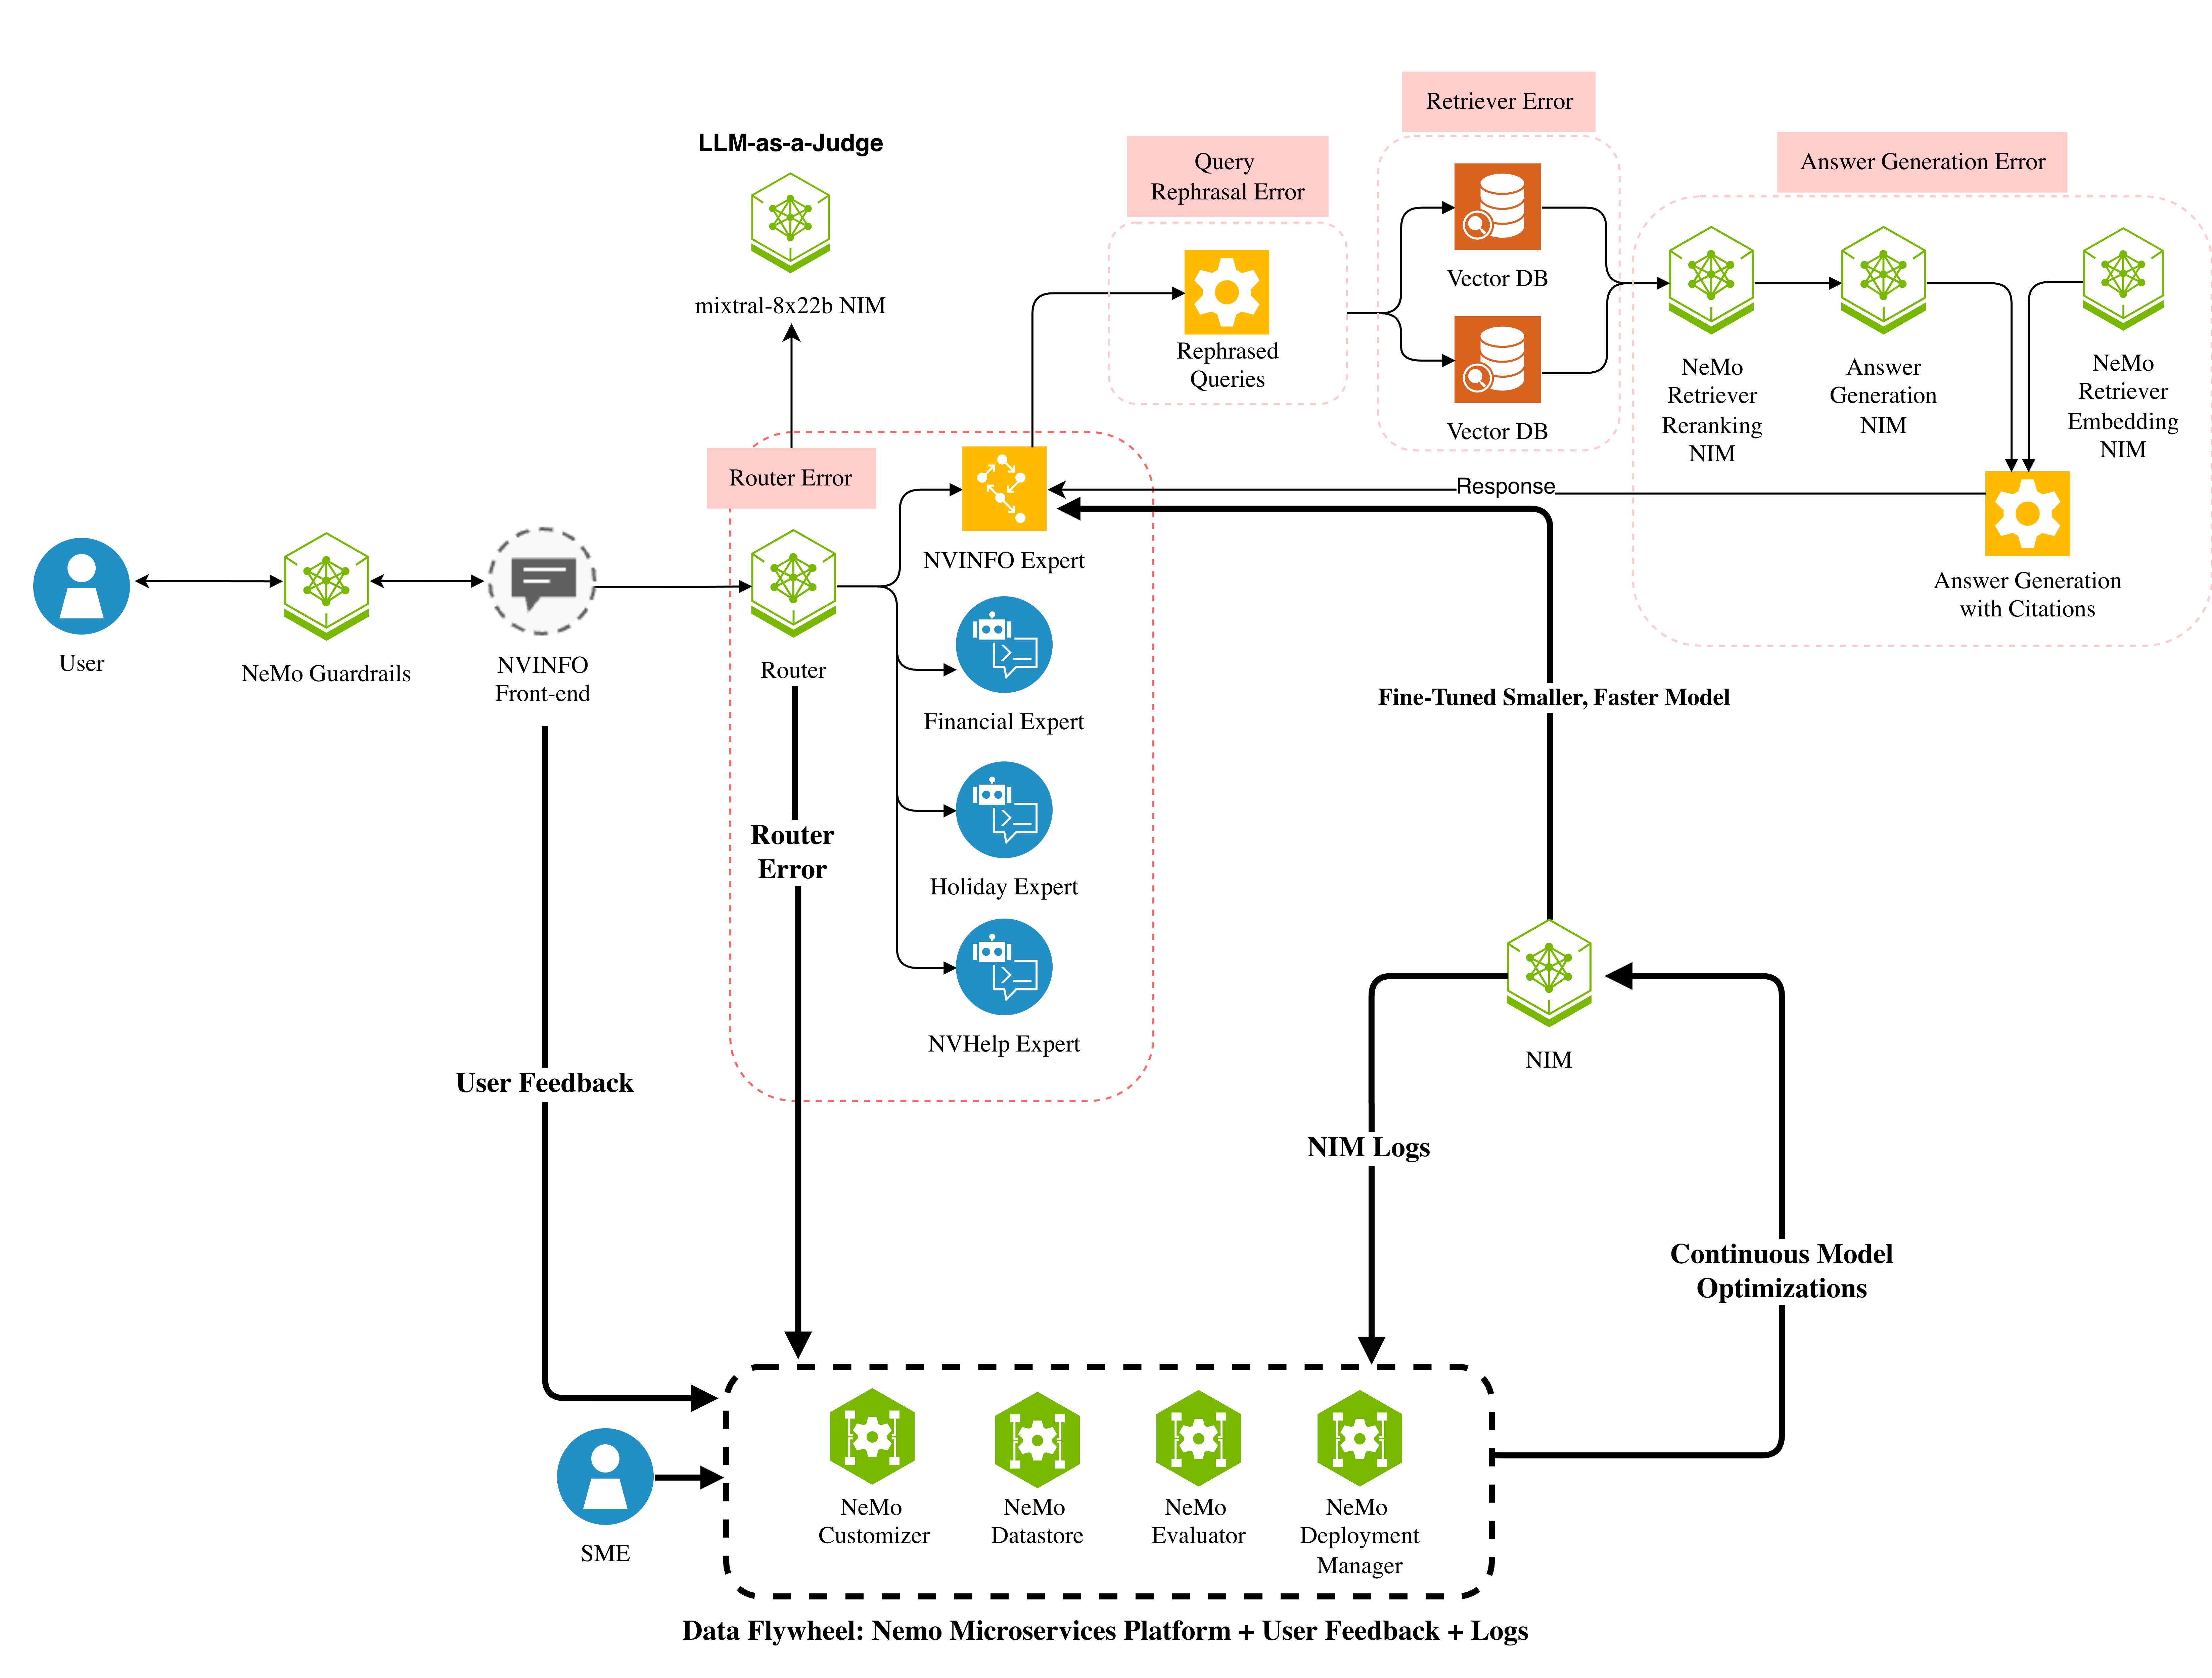
## Diagram: Nemo Microservices Platform Data Flow
### Overview
This diagram illustrates the data flow within the Nemo Microservices Platform, incorporating user interaction, expert systems, model fine-tuning, and continuous optimization. The diagram depicts a complex system with multiple components interacting through various pathways, including feedback loops and error handling mechanisms. The overall structure suggests a pipeline for processing user queries, leveraging expert knowledge, and refining the underlying models.
### Components/Axes
The diagram features the following key components:
* **User:** Represented by a blue icon.
* **SME (Subject Matter Expert):** Represented by a blue icon.
* **Nemo Guardrails:** A green hexagonal component.
* **NINFO Front-end:** A green hexagonal component.
* **Router:** A green hexagonal component.
* **NINFO Expert:** A diamond-shaped component containing sub-components: Financial Expert, Holiday Expert, and NVHelp Expert.
* **LLM-as-a-Judge:** A rectangular component.
* **Vector DB:** Two rectangular components labeled "Vector DB".
* **Nemo Retriever Reranking NIM:** A green hexagonal component.
* **Answer Generation NIM:** A green hexagonal component.
* **Nemo Retriever Embedding NIM:** A green hexagonal component.
* **Answer Generation with Citations:** A green hexagonal component.
* **Fine-Tuned Smaller, Faster Model:** A rectangular component.
* **NIM Logs:** A rectangular component.
* **Continuous Model Optimizations:** A rectangular component.
* **Nemo Customizer:** A green hexagonal component.
* **Datastore:** A green hexagonal component.
* **Nemo Evaluator:** A green hexagonal component.
* **Nemo Deployment Manager:** A green hexagonal component.
The diagram also includes labels for error types: "Router Error", "Query Rephrasal Error", "Retriever Error", and "Answer Generation Error". Arrows indicate the direction of data flow.
### Detailed Analysis or Content Details
The data flow can be described as follows:
1. **User Interaction:** A User interacts with the system, initiating a query.
2. **Nemo Guardrails:** The query passes through Nemo Guardrails.
3. **NINFO Front-end:** The query is then processed by the NINFO Front-end.
4. **Routing:** The query is routed, potentially encountering a "Router Error".
5. **NINFO Expert System:** The query is directed to the NINFO Expert system, which branches into Financial, Holiday, and NVHelp Experts.
6. **LLM-as-a-Judge:** The output from the NINFO Expert is evaluated by the LLM-as-a-Judge.
7. **Query Rephrasing:** If necessary, the query is rephrased, potentially leading to a "Query Rephrasal Error".
8. **Vector Database Interaction:** The rephrased query interacts with the Vector DB, potentially encountering a "Retriever Error".
9. **Nemo NIMs:** The Vector DB response is processed by Nemo Retriever Reranking NIM, Answer Generation NIM, and Nemo Retriever Embedding NIM.
10. **Answer Generation:** An answer is generated, potentially with citations, and may encounter an "Answer Generation Error".
11. **Fine-Tuned Model:** The generated answer is processed by the Fine-Tuned Smaller, Faster Model.
12. **NIM Logs & Continuous Optimization:** NIM Logs are generated and used for Continuous Model Optimizations.
13. **User Feedback Loop:** User Feedback is collected and fed back into the system, influencing the Nemo Customizer, Datastore, Nemo Evaluator, and Nemo Deployment Manager.
14. **SME Interaction:** SMEs interact with the Nemo Customizer, Datastore, Nemo Evaluator, and Nemo Deployment Manager.
The diagram uses arrows to indicate the flow of data. The thickness of the arrows varies, suggesting different levels of data flow intensity. The color coding (green, blue, red) likely represents different types of components or data streams.
### Key Observations
* The system incorporates multiple feedback loops, particularly through User Feedback and NIM Logs, indicating a focus on continuous improvement.
* The presence of error labels (Router Error, Query Rephrasal Error, Retriever Error, Answer Generation Error) suggests a robust error handling mechanism.
* The NINFO Expert system is a central component, providing specialized knowledge to the system.
* The LLM-as-a-Judge plays a critical role in evaluating and refining the output.
* The system integrates both real-time processing (through the main data flow) and offline optimization (through NIM Logs and Continuous Model Optimizations).
### Interpretation
This diagram represents a sophisticated AI-powered platform designed for information retrieval and answer generation. The architecture emphasizes modularity, with distinct components responsible for specific tasks. The inclusion of expert systems, LLM-based evaluation, and continuous optimization suggests a commitment to accuracy, relevance, and adaptability. The feedback loops are crucial for learning and improving the system's performance over time. The error handling mechanisms indicate a proactive approach to identifying and addressing potential issues.
The "Data Flywheel" label at the bottom suggests that the system is designed to become more effective with increased usage and feedback, creating a virtuous cycle of data collection, model refinement, and improved user experience. The system appears to be designed for complex queries that require specialized knowledge and nuanced understanding. The separation of concerns into distinct microservices (Nemo components) allows for independent scaling and maintenance. The use of a Vector DB suggests a semantic search capability, enabling the system to understand the meaning of queries rather than simply matching keywords. The overall design reflects a modern approach to AI development, prioritizing flexibility, scalability, and continuous improvement.
</details>
Figure 1: Adaptive Data Flywheel Architecture showing the MAPE control loop implementation for AI agent improvement
#### III-A4 RAG System Challenges
Before introducing our solution, it is important to understand the failure points inherent in RAG-based systems. Figure 4 illustrates the failure modes observed in production, ordered by their occurrence in the processing pipeline (see Appendix C):
The RAG pipeline encounters multiple processing challenges throughout its entire operation:
1. Router - Query Understanding: Misclassification of user intent leading to wrong expert selection. Example: ”vacation days” queries routed to Holiday Expert instead of Policies Expert (5.25% of our failures).
1. Query Rephrasing Error: Incorrect expansion or interpretation of queries for the selected agent. Example: ”RESS planning team” incorrectly rephrased as ”Resource Planning team” instead of ”Real Estate & Site Services” (3.2% of failures).
1. Retriever Error: Failure to find relevant documents which exist in the knowledge base because of semantic search limitations or embedding mismatches.
1. Reranking Error: Retrieved documents incorrectly prioritized which results in important information being hidden beyond the context window threshold.
1. LLM Hallucination: The model produces believable yet false information when it lacks sufficient context which leads to confident but incorrect responses.
1. Citation Generation Error: Incorrect or missing source references which decreases answer reliability and blocks users from verifying the information.
1. Answer Generation Error: A poor final response by combining retrieved context which results in incomplete or unclear answers even though it has access to correct information.
The MAPE control loop of our Adaptive Data Flywheel system solves these problems by implementing automatic detection and correction of these system failures.
### III-B Adaptive Data Flywheel Overview
Building upon the NVInfo AI architecture and addressing RAG system challenges, Figure 1 illustrates how our Adaptive Data Flywheel wraps around the core system to enable continuous improvement. The flywheel contains the four MAPE phases with dedicated components for AI agent management which operate through a unified knowledge base.
#### III-B1 Monitor Component ( M in MAPE)
1. Problem: The numerous failure points in RAG pipelines make it challenging to identify between situational and systemic problems. Systemic problems remain undetected until users file complaints which results in negative user experiences and delayed solution implementation.
1. Solution: We implemented a comprehensive monitoring system that tracks both direct user feedback (thumbs up/down) and implicit signals (re-queries, session abandonment). Table I shows two examples out of 495 queries that users gave a ”thumbs-down” in the first three months after release. These queries demonstrate how two specific data points could be generalized into larger patterns for developers to address.
1. Challenges: The collection of user feedback in AI systems encounters multiple obstacles which reduce the quality of evaluation signals. The main problem stems from insufficient user engagement because users only provide feedback to a limited extent which results in unrepresentative data collection. Users tend to report negative feedback more frequently because they focus on sharing their dissatisfaction with unsatisfactory results instead of verifying positive outcomes. The process of data collection becomes harder because organizations need to remove all personally identifiable information (PII) from query–response pairs while following strict privacy and security regulations. The available feedback data remains incomplete because users mainly provide basic binary feedback such as thumbs up or down without explaining their reasons for dissatisfaction. Users sometimes provide incorrect feedback through comments that fail to pinpoint the actual cause of their negative ratings. The combination of these factors makes it difficult to obtain dependable feedback that can help systems improve their performance.
1. Learnings: User feedback collection needs systems that combine user-friendly interfaces with privacy protection features to achieve better participation rates and useful data insights. The system should allow users to rate content directly and complete brief surveys and follow step-by-step prompts for feedback collection while maintaining full compliance with GDPR and CCPA regulations and enterprise data protection policies that ban personal information storage. The system should record both direct ratings and indirect feedback indicators which include user interaction statistics, search pattern changes and repeated query attempts. The system needs to request positive feedback through confirmation questions (e.g. “Was this answer helpful?”) together with negative feedback collection methods. Real-time feedback processing systems need to be established for immediate input evaluation and classification to shorten model improvement cycles.
TABLE I: Representative Error Examples Captured by Monitor Component During 3-Month Deployment
| ”What is the role of the RESS planning team at NVIDIA?” | Unable to find answer - RESS incorrectly expanded to ”Resource Planning team” instead of ”Real Estate & Site Services” | Query Rephrasing | Failed to retrieve correct department information |
| --- | --- | --- | --- |
| ”How many vacation days does NVIDIA Canada have?” | ”I don’t have enough information to answer this question” | Router Error | Sent to Holiday Expert instead of Policies Expert |
#### III-B2 Analyze Component ( A in MAPE)
1. Problem: Raw feedback data tends to lack actionable insights. The RAG pipeline contains multiple failure points (see Figure 4) which makes it difficult to identify original causes and determine which components caused the errors. Without accurate error attribution, developers may introduce fixes that fail to significantly improve answer quality.
1. Solution: We developed systematic error attribution techniques combining manual analysis with automated classification. From 495 thumbs-down samples:
- Routing Errors: 26/495 (5.25%) - Queries sent to wrong expert
- Rephrasal Errors: $\sim$ 3.2% (extrapolated from analyzing 250/495 samples)
Although the NVInfo expert routing classifier demonstrated high overall accuracy, our analysis revealed that certain low-frequency query classes exhibited poor data representation. This distributional imbalance led to occasional misclassifications within those specific subsets. Recognizing this gap, we designed targeted experiments to enrich the data and improve performance in those underrepresented domains. Specific examples identified:
- Routing Error: ”How many vacation days does NVIDIA Canada have?” was sent to NVINFO’s Holiday Expert instead of the Policies Expert
- Rephrasal Error: ”RESS planning team” incorrectly rephrased as ”NVIDIA Resource Planning team” instead of ”Real Estate & Site Services”
1. Challenges: The RAG pipeline contains multiple failure points throughout its different stages as shown in Section III. The propagation of initial routing mistakes through subsequent components leads to cascading errors which grow more severe with each stage. The process of manual analysis creates a bottleneck because expert review is needed to perform accurate attribution. The identification of root causes becomes difficult when issues present as ambiguous failures because multiple dependent factors create the overall error.
1. Learnings: The RAG pipeline needs tracing functionality to track queries, retrieval operations and model choices because this will help developers debug the system efficiently and identify where failures occur. The attribution models which use heuristics or machine learning classifiers help identify which stages of the pipeline produce errors. The system needs to distinguish between model-related breakdowns and non-model problems because this separation enables developers to identify LLM-related errors from retrieval and ranking system errors. The evaluation of different system configurations (chunking methods and embedding models) through A/B testing will show their individual performance effects. The process of error classification and root-cause identification becomes faster through automated issue labeling which uses weak supervision or heuristic tagging methods.
#### III-B3 Plan Component ( P in MAPE)
1. Problem: The developers need to make extensive modifications across multiple system components to fix the fundamental problems they have discovered. The combination of restricted labeled data, privacy restrictions and specialized domain requirements makes standard model retraining methods ineffective.
1. Solution: We developed targeted data curation and fine-tuning strategies for different problems leveraging NVIDIA NeMo microservices: Routing Error Remediation:
- Collected user feedback + SME corrected completions
- Used LLM-as-a-Judge: 140 incorrect routing identified, 32 truly incorrect
- Created ground truth: 761 data points (729 original + 32 corrections)
- Final dataset: 685 samples after removing duplicates (60/40 train/test split)
Rephrasal Error Remediation:
- Collected user feedback and manually analyzed 250/495 thumbs-down samples
- 10 incorrect rephrasal identified, shortlisted 4
- Synthetic data generation: Generated 5,000 synthetic samples using 4 shortlisted examples as few-shot prompts to Llama 3.1 405B (see Appendix G)
- Final dataset: 5,000 synthetic data samples (80/10/10 train/validation/test split)
Implementation Tools:
- NeMo Curator: Data processing and cleaning
- NeMo Customizer: Model fine-tuning and adaptation
- NeMo Evaluator: Model evaluation and testing
- NeMo Guardrails: Safety and quality assurance
1. Challenges: Developing targeted remediation strategies presents several challenges. The available training data consists of restricted labeled information because 495 production cases includes only 32 incorrect routing examples and 10 incorrect rephrasing instances. The learning process becomes more difficult because enterprise terminology and acronyms need specialized knowledge to understand their context. The model size requirements force developers to find an optimal point between performance and response time for maintaining system performance. The quality of synthetic data remains a problem because artificial examples need to exactly replicate actual user input and error behavior to achieve success.
1. Learnings: The LLM-as-a-Judge approach delivered excellent results by accurately detecting routing errors at a rate of 77%. The few-shot synthetic data generation method demonstrated excellent results because it needed only four to five examples to create high-quality training data. The domain-specific fine-tuning of smaller models produced results that were comparable to those of larger 70B models. The NVIDIA NeMo microservices stack modular design allowed developers to quickly test and optimize individual components which sped up the entire development cycle.
#### III-B4 Execute Component ( E in MAPE)
1. Problem: The deployment of enhanced models to production requires various sequential operations which help reduce system downtime. The deployment of 70B parameter models leads to negative impacts on user experience and operational efficiency because they tend to have higher latency and cost.
1. Solution: Using NVIDIA NeMo Customizer, we executed model fine-tuning and progressive deployment: Router Optimization Results:
- Baseline: Llama 3.1 70B - 96% accuracy, 0.26s latency
- Fine-tuned: Llama 3.1 8B - 96% accuracy, 0.08s latency
- Achievement: 10x model size reduction, 70% latency reduction
Rephrasal Enhancement Results:
- Baseline: Llama 3.1 70B - 73.8% accuracy, 1.9s latency
- Fine-tuned: Llama 3.1 8B - 77.5% accuracy, 1.1s latency
- Achievement: 3.7% accuracy improvement, 40% latency reduction
1. Challenges: The system faces major production risks because any unwanted changes will affect more than 30,000 users by degrading system performance. The system requires effective rollback mechanisms to perform fast updates and reduce system downtime during problematic changes. The system requires ongoing performance tracking to monitor change effects on different query domains while maintaining uniform quality standards. The deployment process requires teams to work together effectively because data scientists need to coordinate with engineers and operations staff to handle dependencies and preserve system stability.
1. Learnings: The deployment process should include Canary and staged deployments to introduce changes to limited user groups before complete system deployment helps protect against unexpected system problems. The implementation of defined rollback procedures enables teams to safely return to previous updates when performance deterioration occurs. The monitoring of essential performance indicators including accuracy, latency and user feedback after deployment helps detect system deterioration at its beginning stages. The release process benefits from clear handoffs between data scientist, engineer and product manager which enables effective team collaboration. Users will develop more trust in new model versions when organizations maintain open communication about system updates.
## IV Experimental Evaluation
### IV-A Experimental Setup
We evaluated our Data Flywheel implementation on NVIDIA’s NVInfo bot through systematic feedback analysis and targeted improvements:
- User Base: 800 active users per week
- Feedback Dataset: 1,224 human feedback samples from production (729 thumbs-up, 495 thumbs-down)
- Baseline Models: Llama 3.1 70B for routing and query rephrasal
- Fine-tuning Models: Llama 3.1 8B, Llama 3.2 3B/1B
- Infrastructure: NVIDIA NeMo Customizer microservices for customization
### IV-B Error Analysis from User Feedback
Through analysis of 495 negative feedback samples, we identified two primary failure modes:
TABLE II: Error Classification from User Feedback
| Routing Errors Rephrasal Errors Other Errors | 26/495 $\sim$ 16/495 453/495 | 5.25% 3.2% (extrapolated) 91.5% |
| --- | --- | --- |
Example failures identified:
- Routing Error: ”How many vacation days does NVIDIA Canada have?” was incorrectly routed to Holiday Expert instead of Policies Expert
- Rephrasal Error: ”What is the role of the RESS planning team?” failed due to incorrect expansion (RESS = Real Estate & Site Services)
### IV-C Fine-Tuning Results
#### IV-C1 Infrastructure and Fine tuning Method
To address key failure modes in the NVInfo RAG pipeline, we adopted LoRA via PEFT to optimize critical components such as routing and query rephrasal. LoRA enables targeted updates to transformer weights using lightweight, low-rank matrices, making it well suited for rapid iteration on curated failure samples without requiring full model retraining.
All fine-tuning was performed on an NVIDIA DGX Station equipped with 4× A100 GPUs (80 GB each), which provided the compute capacity needed for efficient parallel training on long-sequence, high-volume datasets.
#### IV-C2 Expert Routing Optimization
After gathering user feedback and incorporating subject-matter expert (SME) corrections, we compiled a curated dataset. In total, we collected 761 data points, consisting of 729 original samples and 32 additional corrections generated by the LLM-as-Judge. After removing duplicates, the dataset was reduced to 685 unique samples. For experimentation, we adopted a 60/40 split between training and testing sets.
TABLE III: Router Fine-Tuning Results: 10x Model Size Reduction
| Llama 3.1 70B (baseline) | 96% | 0.26 |
| --- | --- | --- |
| Llama 3.1 8B (no tuning) | 14% | 0.08 |
| Llama 3.1 8B + prompt-tuning | 86% | 0.08 |
| Llama 3.1 8B + fine-tuning | 96% | 0.08 |
| Llama 3.2 3B + fine-tuning | 94% | – |
| Llama 3.2 1B + fine-tuning | 94% | – |
Key achievement: Maintained 96% accuracy while reducing model size by 10x and latency by 70%.
#### IV-C3 Query Rephrasal Enhancement
We manually analyzed 250 samples, from which we identified 10 candidates for rephrasing. To further expand the dataset, we generated 5,000 synthetic samples using the Llama 3.1 405B model with few-shot examples. For downstream experiments, the data was partitioned into an 80/10/10 split across training, validation, and test sets.
TABLE IV: Query Rephrasal Fine-Tuning Results
| Llama 3.1 70B (baseline) Llama 3.1 8B Fine-Tuned | 73.8% 77.5% | 1.9 1.1 |
| --- | --- | --- |
Key achievement: 3.7% accuracy improvement with 40% latency reduction and 10x model size reduction.
### IV-D Improvements Achieved Through the Data Flywheel
Table V shows examples of issues resolved through the data flywheel.
TABLE V: Examples of Corrected Issues through Data Flywheel
| ”What is the role of the RESS planning team at NVIDIA?” | Rephrasal Error: Incorrectly expanded to ”Resource Planning team” | Correct Rephrase: ”NVIDIA RESS planning team role”, ”RESS planning team responsibilities” | The role of RESS (Real Estate and Site Services) Planning team is to manage site operations, support lease delivery… |
| --- | --- | --- | --- |
| ”How many vacation days does NVIDIA Canada have?” | Router Error: Sent to Holiday Expert instead of Policies Expert | Correctly routed to Policies Expert | According to the Canada Vacation Policy, employees receive… |
## V Discussion
### V-A Key Achievements
#### V-A1 Model Size and Efficiency
The model achieved a 10× reduction in size from 70B to 8B parameters while maintaining 96% routing accuracy. The results show that domain-specific models with smaller sizes can achieve comparable performance to their larger general-purpose counterparts when fine-tuned properly. The model size reduction enabled a 70% decrease in latency which made real-time applications more practical.
#### V-A2 Accuracy Improvements
The 3.7% improvement in query rephrasal accuracy shows significant advancement for production systems although it seems small at first glance. The combination of faster performance through reduced latency by 40% and improved accuracy leads to enhanced user experience through quicker and more accurate system interactions.
#### V-A3 Systematic Error Identification
The analysis of 495 feedback samples revealed that routing errors combined with rephrasal errors made up less than 10% of all system failures at 5.25% and 3.2% respectively. The results indicate that the retrieval and ranking and generation stages of the RAG pipeline need further optimization efforts.
### V-B Practical Challenges Encountered
#### V-B1 Low Feedback Participation
The system received feedback from 495 employees out of 30,000 users which shows difficulties in obtaining large-scale feedback data. The insufficient number of participants in the study creates sampling bias which reduces the generalizability of the obtained results. The system uses query reformulation as an additional data source but it does not replace the need for direct user feedback.
#### V-B2 Manual Analysis Bottleneck
The process of reviewing 250 samples for rephrasal errors took too much time and proved to be unworkable at scale. The feedback pipeline faces a major bottleneck because LLM-as-Judge helps identify routing errors but there is no automated solution for this process.
#### V-B3 Privacy and Compliance
The enterprise policies restricted storing complete query-response pairs which restricted thorough analysis of the data. The process of handling feedback data became more complicated because of PII removal requirements and GDPR and CCPA compliance regulations.
#### V-B4 Synthetic Data Generation
The creation of 5,000 synthetic examples for rephrasal training proved successful. The process of maintaining high-quality and contextually accurate data required advanced prompt engineering techniques and validation procedures which raised operational costs for data augmentation.
### V-C Implications for Enterprise AI
#### V-C1 Proprietary Data as Differentiator
The research proves that properly managed enterprise data through a data flywheel system creates a sustainable business advantage for organizations. Real-world usage data serves as the foundation for developing AI agents which become both adaptive and resilient.
#### V-C2 Importance of Modular Architecture
NVIDIA NeMo tools consisting of Curator and Customizer and Evaluator and Guardrails proved essential for establishing the data flywheel system. The platform’s modular design allowed separate optimization of individual components and fast development cycles which are essential for enterprise flexibility.
#### V-C3 TCO Reduction Through Model Optimization
The model size reduction by 10 times delivered better performance while simultaneously reducing infrastructure expenses. Organizations that operate multiple AI agents can achieve substantial TCO reductions through optimization efforts which preserve service quality standards.
### V-D Future Work
#### V-D1 Automated Error Attribution
The development of machine learning classifiers which can identify all RAG pipeline errors stands as the main objective. The system will achieve better scalability in root cause analysis through automated error classification which decreases human involvement in review processes.
#### V-D2 Continuous Learning Without Forgetting
The ability to update models continuously while preserving current performance levels and preventing catastrophic forgetting remains vital for supporting incremental learning progress in changing enterprise environments.
#### V-D3 Multi-Agent Coordination
The data flywheel concept should advance to support coordinated development between different specialized agents which represents a logical progression. System-wide intelligence and stable performance in complex enterprise systems depend on coordinated efforts between different system components.
## VI Conclusion
The research presented real-world data flywheel implementation results for NVInfo Knowledge Assistant at NVIDIA which showed how enterprise AI agents can learn from their errors to improve their performance. The MAPE framework enabled us to convert user feedback into quantifiable performance enhancements which improved both model accuracy and user interaction quality.
Our main accomplishments included reducing model size by 10 times (from 70B to 8B parameters) while achieving 96% routing accuracy and improving query rephrasal accuracy by 3.7% and decreasing latency by 40%. The experimental results confirm that optimized smaller models perform at least as well as larger models while reducing operational expenses.
The evaluation of 495 feedback samples showed that routing errors and rephrasal errors combined to make up only 8.45% of total failure cases thus becoming the most suitable targets for optimization efforts. The targeted refinement approach using restricted training data produced substantial performance enhancements which proved the effectiveness of focused model improvement without needing extensive retraining.
The deployment process revealed two essential lessons about the challenges of obtaining large-scale feedback data and the restrictions that enterprise privacy regulations create. The solution we developed using implicit signal detection and synthetic data creation and privacy-friendly processing methods provides organizations with a functional method to handle their data collection and privacy restrictions.
The success of enterprise workflows in the future will depend on continuous AI agent improvement capabilities. Organizations that establish data flywheel systems will experience faster AI system development and operational efficiency and enhanced user satisfaction. Enterprise AI success depends on creating adaptive systems which learn from all user interactions rather than seeking flawless models at deployment. AI agents that receive feedback-based learning capabilities will develop into self-enhancing assets which improve their capabilities and value through continuous evolution.
## References
- [1] IBM Corporation, “An architectural blueprint for autonomic computing (4th ed.),” IBM White Paper, 2006.
- [2] D. L. Iglesia and D. Weyns, “Mape-k formal templates to rigorously design behaviors for self-adaptive systems,” ACM Transactions on Autonomous and Adaptive Systems, vol. 10, no. 3, p. Article 15, October 2015, 31 pages.
- [3] P. Arcaini, E. Riccobene, and P. Scandurra, “Modeling and analyzing mape-k feedback loops for self-adaptation,” in 2015 IEEE/ACM 10th International Symposium on Software Engineering for Adaptive and Self-Managing Systems, Florence, Italy, 2015, pp. 13–23.
- [4] E. Rutten, N. Marchand, and D. Simon, “Feedback control as mape-k loop in autonomic computing,” in Software Engineering for Self-Adaptive Systems III. Assurances, ser. Lecture Notes in Computer Science, R. de Lemos, D. Garlan, C. Ghezzi, and H. Giese, Eds. Springer, Cham, 2017, vol. 9640.
- [5] A. Romero-Garcés, A. Hidalgo-Paniagua, M. González-García, and A. Bandera, “On managing knowledge for mape-k loops in self-adaptive robotics using a graph-based runtime model,” Applied Sciences, vol. 12, no. 17, p. 8583, 2022.
- [6] J. Andersson, M. Caporuscio, M. D’Angelo et al., “Architecting decentralized control in large-scale self-adaptive systems,” Computing, vol. 105, pp. 1849–1882, 2023.
- [7] O. Gheibi, D. Weyns, and F. Quin, “Applying machine learning in self-adaptive systems: A systematic literature review,” ACM Transactions on Autonomous and Adaptive Systems, vol. 15, no. 3, p. Article 9, September 2020.
- [8] I. Abdennadher, “Daacs: A decision approach for autonomic computing systems,” The Journal of Supercomputing, vol. 78, pp. 3883–3904, 2022.
- [9] N. Belhaj, “Generic autonomic service management for component-based applications,” Ph.D. dissertation, Université Paris Saclay (COmUE), 2018, artificial Intelligence [cs.AI].
- [10] K. Patel, “Agentic ai for self-healing production lines: Autonomous root cause analysis & correction,” Journal of Information Systems Engineering and Management, 2025.
- [11] C.-E. Hrabia, M. Lützenberger, and S. Albayrak, “Towards adaptive multi-robot systems: self-organization and self-adaptation,” The Knowledge Engineering Review, vol. 33, p. E16, 2018.
- [12] J. Li, M. Zhang, N. Li, D. Weyns, Z. Jin, and K. Tei, “Generative ai for self-adaptive systems: State of the art and research roadmap,” ACM Transactions on Autonomous and Adaptive Systems, vol. 19, no. 3, p. Article 13, September 2024.
- [13] B. P. Sanwouo, C. Quinton, and P. Temple, “Breaking the loop: Aware is the new mape-k,” in Proceedings of the 33rd ACM International Conference on the Foundations of Software Engineering (FSE Companion ’25). New York, NY, USA: Association for Computing Machinery, 2025, pp. 626–630.
- [14] R. Akkiraju, A. Xu, D. Bora, T. Yu, L. An, V. Seth, A. Shukla, P. Gundecha, H. Mehta, A. Jha, and P. Raj, “Facts about building retrieval augmented generation-based chatbots,” arXiv preprint arXiv:2407.07858, 2024.
- [15] Microsoft Research, “Arena learning: Build data flywheel for llms post-training via simulated chatbot arena,” 2024.
- [16] NVIDIA, “Maximize ai agent performance with data flywheels using nvidia nemo microservices,” NVIDIA Developer Blog, 2025.
- [17] W. Cai, J. Jiang, F. Wang, J. Tang, S. Kim, and J. Huang, “A survey on mixture of experts in large language models,” IEEE Transactions on Knowledge and Data Engineering, 2025.
- [18] Y. Zhou, T. Lei, H. Liu, N. Du, Y. Huang, V. Zhao, A. M. Dai, Q. V. Le, and J. Laudon, “Mixture-of-experts with expert choice routing,” in Advances in Neural Information Processing Systems, vol. 35, 2022, pp. 7103–7114.
- [19] J.-C. Y. Chen, S. Yun, E. Stengel-Eskin, T. Chen, and M. Bansal, “Symbolic mixture-of-experts: Adaptive skill-based routing for heterogeneous reasoning,” arXiv preprint arXiv:2503.05641, 2025.
- [20] S. Chen, W. Jiang, B. Lin, J. Kwok, and Y. Zhang, “Routerdc: Query-based router by dual contrastive learning for assembling large language models,” in Advances in Neural Information Processing Systems, vol. 37, 2024, pp. 66 305–66 328.
- [21] R. Li, L. He, Q. Liu, Z. Zhang, H. Yu, Y. Ye, L. Zhu, and Y. Su, “Unirag: Unified query understanding method for retrieval augmented generation,” in Proceedings of the 63rd Annual Meeting of the Association for Computational Linguistics (ACL 2025), 2025, pp. 14 163–14 178.
- [22] G. Dong, X. Li, Y. Zhang, and M. Deng, “Leveraging llm-assisted query understanding for live retrieval-augmented generation,” arXiv preprint arXiv:2506.21384, 2025.
- [23] S. Mao, Y. Jiang, B. Chen, X. Li, P. Wang, X. Wang, P. Xie, F. Huang, H. Chen, and N. Zhang, “Rafe: Ranking feedback improves query rewriting for rag,” arXiv preprint arXiv:2405.14431, 2024.
- [24] A. Yang, C. Chen, and K. Pitas, “Just rephrase it! uncertainty estimation in closed-source language models via multiple rephrased queries,” arXiv preprint arXiv:2405.13907, 2024.
- [25] A. Shrivastava, S. Desai, A. Gupta, A. Elkahky, A. Livshits, A. Zotov, and A. Aly, “Retrieve-and-fill for scenario-based task-oriented semantic parsing,” arXiv preprint arXiv:2202.00901, 2022.
- [26] MyScale, “Llama 3.1 models: 405b vs 70b vs 8b - which one to choose?” 2024.
- [27] Amazon AWS, “Announcing llama 3.1 405b, 70b, and 8b models from meta in amazon bedrock,” 2024.
- [28] BentoML, “Benchmarking llm inference backends,” 2023.
- [29] E. J. Hu, Y. Shen, P. Wallis, Z. Allen-Zhu, Y. Li, S. Wang, L. Wang, and W. Chen, “Lora: Low-rank adaptation of large language models,” in International Conference on Learning Representations (ICLR), vol. 1, no. 2, 2022, p. 3.
- [30] T. Dettmers, A. Pagnoni, A. Holtzman, and L. Zettlemoyer, “Qlora: Efficient finetuning of quantized llms,” in Advances in Neural Information Processing Systems, vol. 36, 2023, pp. 10 088–10 115.
- [31] E. N. Coleman, L. Quarantiello, Z. Liu, Q. Yang, S. Mukherjee, J. Hurtado, and V. Lomonaco, “Parameter-efficient continual fine-tuning: A survey,” arXiv preprint arXiv:2504.13822, 2025.
- [32] J. Kim, J. Lee, G. Park, B. Kim, S. J. Kwon, D. Lee, and Y. Lee, “An inquiry into datacenter tco for llm inference with fp8,” arXiv preprint arXiv:2502.01070, 2025.
- [33] V. Vats, M. B. Nizam, M. Liu, Z. Wang, R. Ho, M. S. Prasad, V. Titterton, S. V. Malreddy, R. Aggarwal, Y. Xu, and L. Ding, “A survey on human-ai teaming with large pre-trained models,” arXiv preprint arXiv:2403.04931, 2024.
- [34] J. Gama, I. Žliobaitė, A. Bifet, M. Pechenizkiy, and A. Bouchachia, “A survey on concept drift adaptation,” ACM Computing Surveys, vol. 46, no. 4, p. 44, 2014.
- [35] A. Ratner, S. Bach, H. Ehrenberg, J. Fries, S. Wu, and C. Ré, “Snorkel: rapid training data creation with weak supervision,” Proceedings of the VLDB Endowment, vol. 11, no. 3, pp. 269–282, 2017.
- [36] Quotient Blog, “Subject-matter expert language liaison (smell): A framework for aligning llm evaluators to human feedback,” 2024.
- [37] D. Gong, P. Lu, Z. Wang, M. Zhou, and X. He, “Training agents with weakly supervised feedback from large language models,” arXiv preprint arXiv:2411.19547, 2024.
- [38] M. T. R. Laskar, S. Alqahtani, M. S. A. Bari, M. Rahman, M. A. M. Khan, H. Khan, I. Jahan, A. Bhuiyan, C. W. Tan, M. R. Parvez, and E. Hoque, “A systematic survey and critical review on evaluating large language models: Challenges, limitations, and recommendations,” arXiv preprint arXiv:2407.04069, 2024.
- [39] M. Gao, X. Hu, X. Yin, J. Ruan, X. Pu, and X. Wan, “Llm-based nlg evaluation: Current status and challenges,” Computational Linguistics, pp. 1–27, 2025.
- [40] S. Tan, S. Zhuang, K. Montgomery, W. Y. Tang, A. Cuadron, C. Wang, R. A. Popa, and I. Stoica, “Judgebench: A benchmark for evaluating llm-based judges,” arXiv preprint arXiv:2410.12784, 2024.
- [41] E. Frick, T. Li, C. Chen, W.-L. Chiang, A. N. Angelopoulos, J. Jiao, B. Zhu, J. E. Gonzalez, and I. Stoica, “How to evaluate reward models for rlhf,” arXiv preprint arXiv:2410.14872, 2024.
- [42] L. Zheng, W.-L. Chiang, Y. Sheng, S. Zhuang, Z. Wu, Y. Zhuang, Z. Lin, Z. Li, D. Li, E. Xing, and H. Zhang, “Judging llm-as-a-judge with mt-bench and chatbot arena,” in Advances in Neural Information Processing Systems, vol. 36, 2023, pp. 46 595–46 623.
- [43] NVIDIA, “Nemo — build, monitor, and optimize ai agents,” 2025, accessed: 2025-09-09.
- [44] NVIDIA Docs, “About evaluating — nvidia nemo microservices,” 2025, accessed: 2025-09-09.
- [45] NVIDIA, “Overview of nemo microservices,” 2025, accessed: 2025-09-09.
- [46] Constellation Research, “Nvidia nemo microservices generally available, aims for ai agent data flywheel,” 2025, accessed: 2025-09-09.
- [47] Unit8, “Road to on-premise llm adoption – part 3,” 2024, accessed: 2025-09-09.
- [48] Bitrock, “A comparative analysis of open-source large language models on hugging face,” 2024, accessed: 2025-09-09.
## Appendix A NVInfo AI Architecture
NVInfo AI Architecture
<details>
<summary>nvinfo_architecture.png Details</summary>
### Visual Description
\n
## Diagram: System Architecture for Response Generation
### Overview
This diagram depicts a system architecture for response generation. The system comprises several key components working in concert to produce coherent and contextually relevant responses.
### Components
1. **Input Module:**
* Receives user queries or prompts.
* Performs initial processing, such as tokenization and cleaning.
* Formats the input for subsequent modules.
2. **Contextual Understanding Module:**
* Analyzes the input to determine the user's intent and relevant context.
* Utilizes Natural Language Understanding (NLU) techniques.
* May involve entity recognition, sentiment analysis, and topic modeling.
3. **Knowledge Retrieval Module:**
* Accesses and retrieves information from various knowledge sources.
* Knowledge sources include:
* **Vector Database:** Stores embeddings of documents for semantic search.
* **Relational Database:** Contains structured data for factual information.
* **External APIs:** Provides access to real-time data and services.
4. **Response Generation Module:**
* Generates a response based on the contextual understanding and retrieved knowledge.
* Employs Large Language Models (LLMs) for text generation.
* Techniques used:
* **Prompt Engineering:** Crafting effective prompts to guide the LLM.
* **Few-shot Learning:** Providing examples to improve response quality.
* **Reinforcement Learning from Human Feedback (RLHF):** Fine-tuning the LLM based on human preferences.
5. **Output Module:**
* Formats the generated response for presentation to the user.
* May involve post-processing steps, such as grammar correction and style refinement.
* Delivers the response through appropriate channels (e.g., text, voice).
### Data Flow
1. User input enters the **Input Module**.
2. The **Input Module** passes the processed input to the **Contextual Understanding Module**.
3. The **Contextual Understanding Module** determines the user's intent and context.
4. The **Contextual Understanding Module** triggers the **Knowledge Retrieval Module** to fetch relevant information.
5. The **Knowledge Retrieval Module** retrieves information from **Vector Database**, **Relational Database**, and **External APIs**.
6. The **Knowledge Retrieval Module** provides the retrieved knowledge to the **Response Generation Module**.
7. The **Response Generation Module** generates a response using the LLM and relevant techniques.
8. The **Response Generation Module** sends the generated response to the **Output Module**.
9. The **Output Module** formats and delivers the response to the user.
### Technologies Used
| Component | Technology |
| -------------------------- | -------------------------- |
| Input Module | NLTK, SpaCy |
| Contextual Understanding | BERT, RoBERTa |
| Knowledge Retrieval | FAISS, PostgreSQL, REST APIs |
| Response Generation | GPT-3, LaMDA, PaLM |
| Output Module | Flask, Django |
### Future Enhancements
* Implement a feedback loop to continuously improve response quality.
* Integrate with more knowledge sources.
* Enhance the contextual understanding module with more sophisticated NLU techniques.
* Explore different LLM architectures and training methods.
* Add support for multi-modal input (e.g., images, audio).
</details>
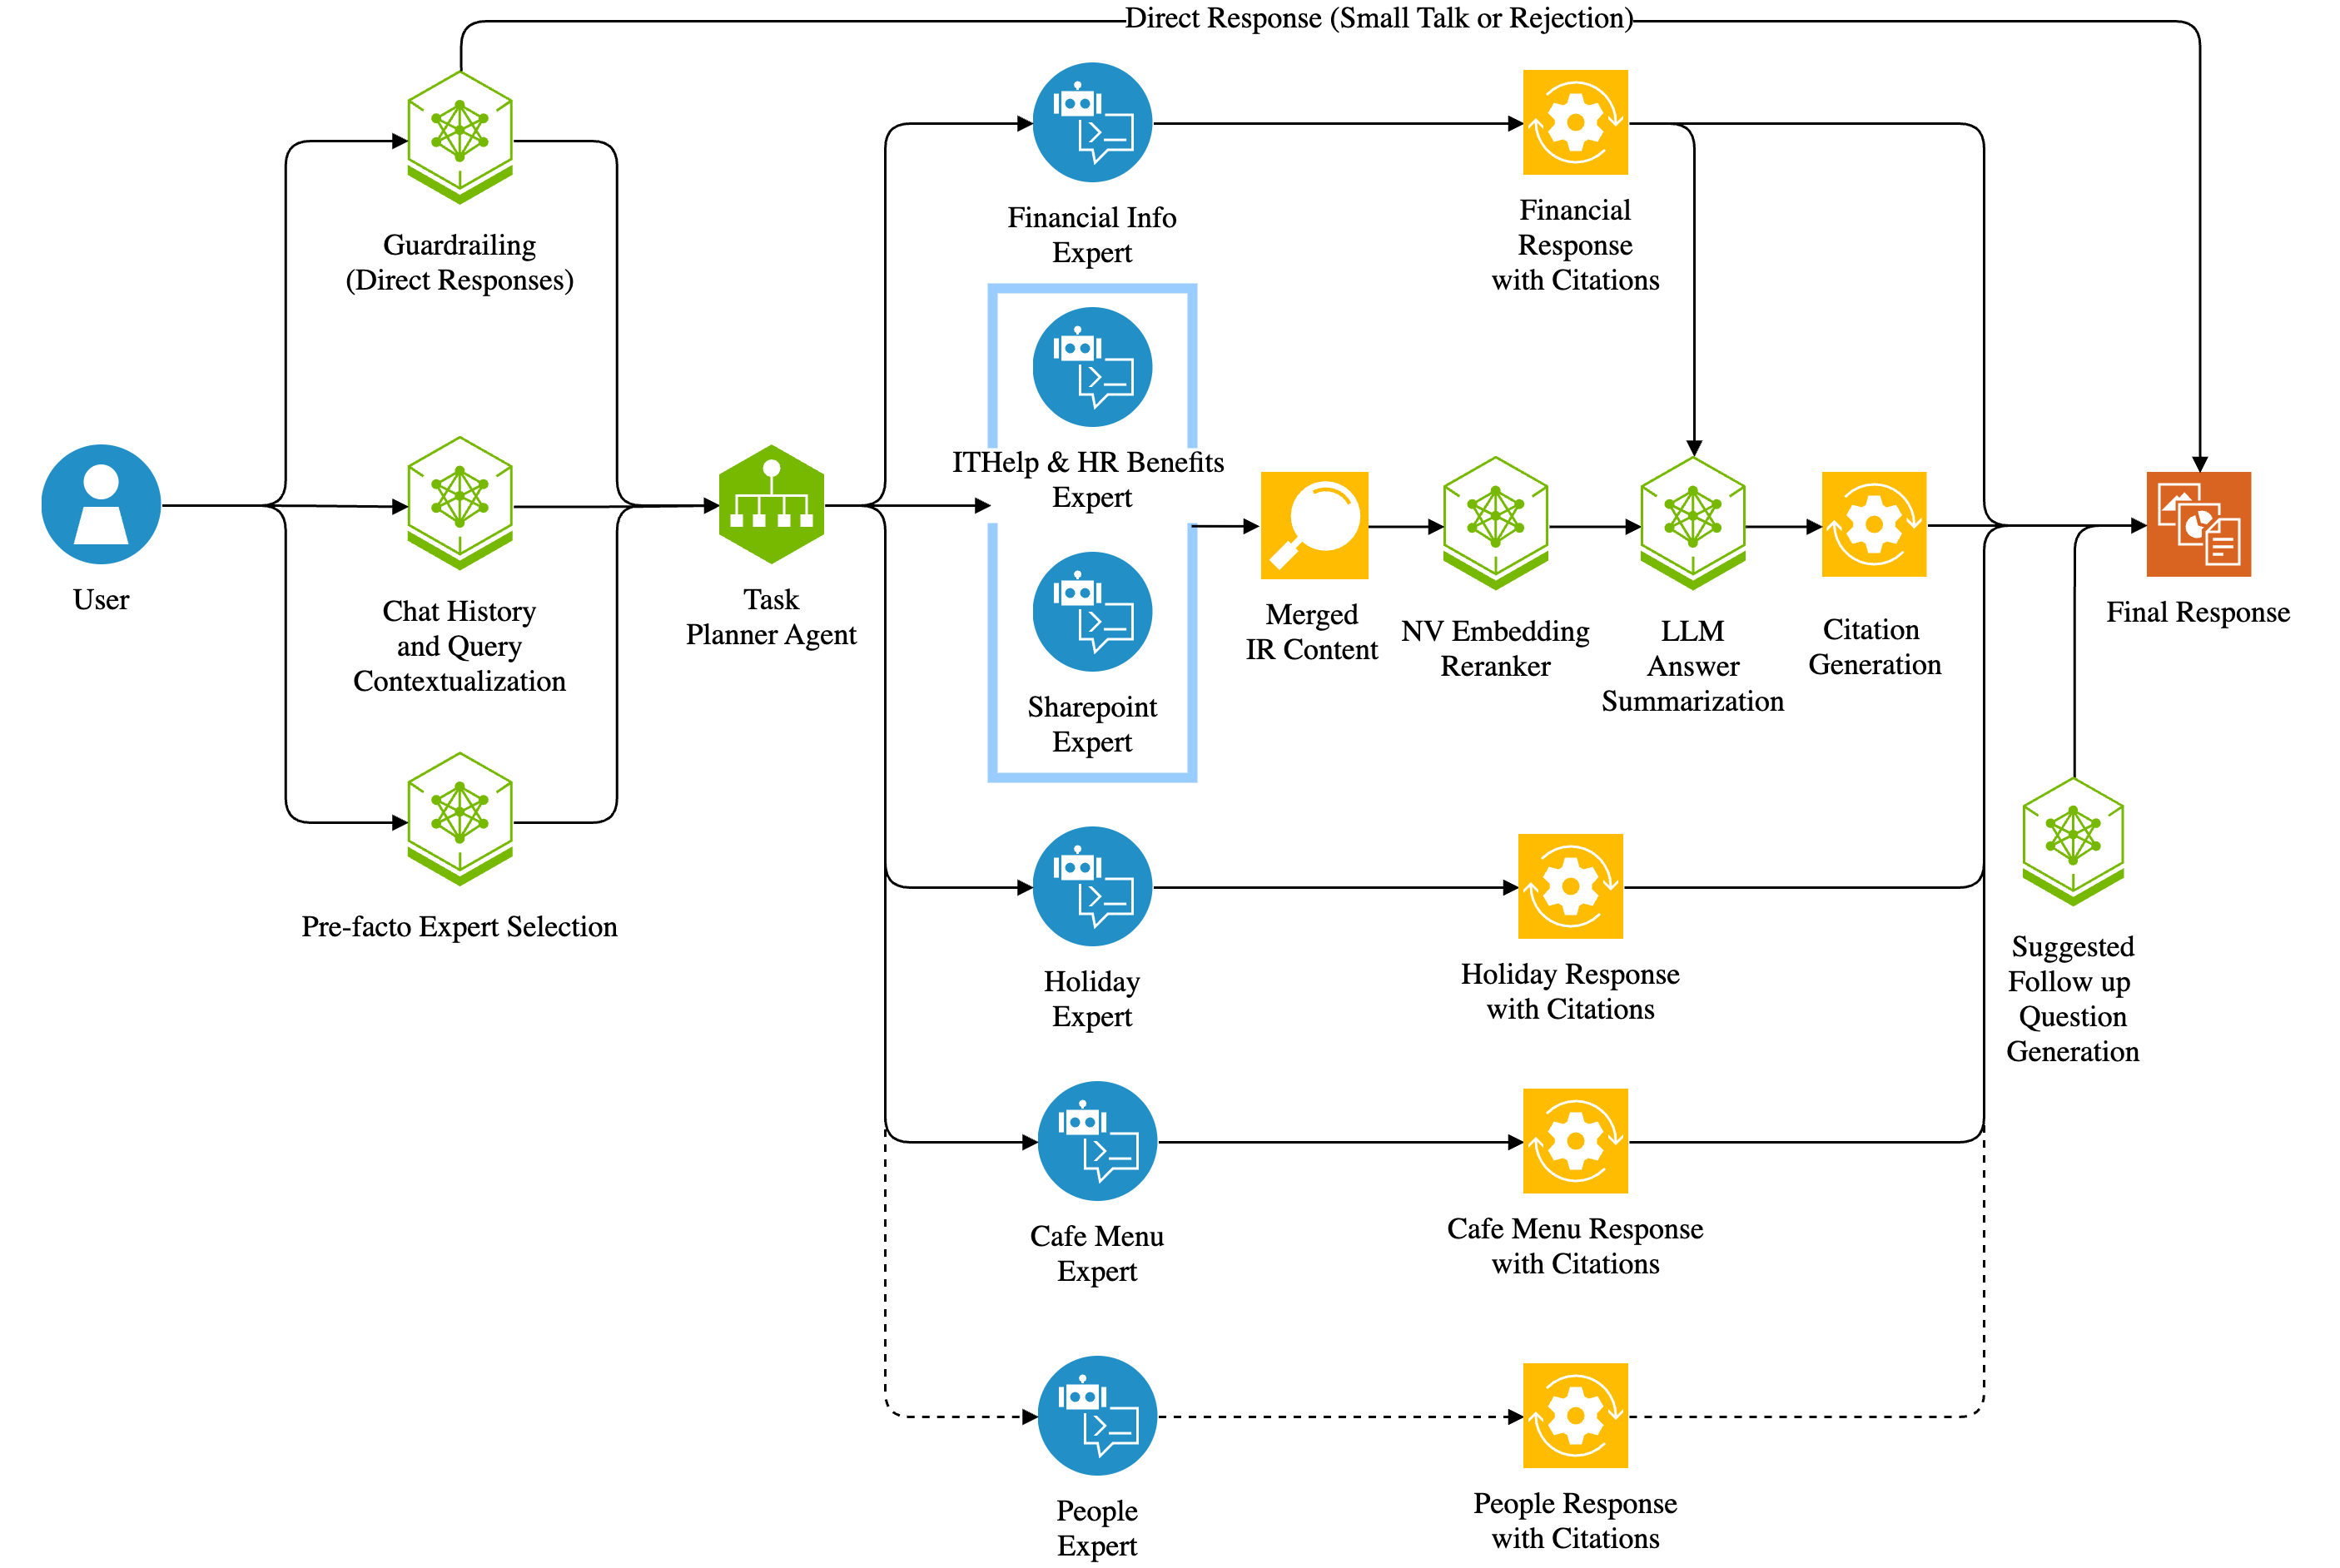
Figure 2: NVInfo AI Mixture of Experts Architecture showing the complete RAG pipeline with Router, seven specialized domain experts, query rephrasing, retrieval, reranking, answer generation, and citation generation components
The architecture shown in Figure 2 illustrates the complete NVInfo AI system, which processes employee queries through a sophisticated pipeline:
- Router: Classifies incoming queries and routes them to the appropriate domain expert
- Seven Domain Experts: Specialized models for Financial Info, IT Help & HR Benefits, SharePoint, Holidays, Cafe Menu, People, and NVIDIA Policies
- Query Processing Pipeline: Includes rephrasing, retrieval, reranking, answer generation, and citation generation
- Feedback Loop: Captures user satisfaction signals for continuous improvement
## Appendix B NVInfo Response and Feedback Capture Architecture
NVInfo Response and Feedback Capture Architecture
<details>
<summary>nvinfo_data_capture.png Details</summary>
### Visual Description
\n
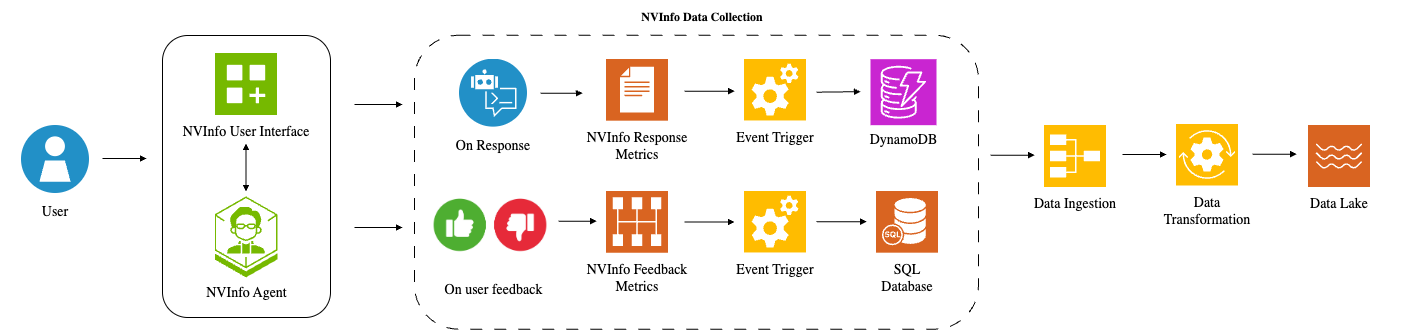
## Diagram: NVInfo Data Collection Flow
### Overview
This diagram illustrates the data collection flow for NVInfo, starting from user interaction and culminating in data storage in a Data Lake. The process is split into two main paths: one based on response metrics and another based on user feedback. Both paths involve event triggering, data ingestion, and transformation before reaching the Data Lake.
### Components/Axes
The diagram consists of the following components:
* **User:** Represented by a blue silhouette.
* **NVInfo User Interface:** A blue square with a grid of smaller squares and a plus sign.
* **NVInfo Agent:** A green hexagon with a stylized face.
* **On Response:** A light blue speech bubble with a document icon.
* **NVInfo Response Metrics:** A white rectangle with a document icon.
* **On user feedback:** A red thumbs-up/thumbs-down icon.
* **NVInfo Feedback Metrics:** A red rectangle with a bar graph icon.
* **Event Trigger:** Represented by a yellow gear icon.
* **DynamoDB:** A blue cylinder representing a database.
* **SQL Database:** A green cylinder representing a database.
* **Data Ingestion:** A yellow rectangle.
* **Data Transformation:** A yellow gear icon.
* **Data Lake:** A light blue wavy shape.
* **NVInfo Data Collection:** A dashed grey rectangle encompassing the entire data flow.
Arrows indicate the direction of data flow.
### Detailed Analysis or Content Details
The diagram shows a two-branch data collection process:
**Branch 1: Response Metrics**
1. A User interacts with the NVInfo User Interface.
2. The NVInfo Agent processes the interaction.
3. "On Response" data is generated.
4. "NVInfo Response Metrics" are collected.
5. An "Event Trigger" is activated.
6. Data is stored in DynamoDB.
7. Data is then passed through "Data Ingestion" and "Data Transformation".
8. Finally, data is stored in the "Data Lake".
**Branch 2: User Feedback**
1. A User interacts with the NVInfo User Interface.
2. The NVInfo Agent processes the interaction.
3. "On user feedback" data is generated.
4. "NVInfo Feedback Metrics" are collected.
5. An "Event Trigger" is activated.
6. Data is stored in a SQL Database.
7. Data is then passed through "Data Ingestion" and "Data Transformation".
8. Finally, data is stored in the "Data Lake".
Both branches converge at "Data Ingestion" and proceed through "Data Transformation" to the "Data Lake".
### Key Observations
* The diagram highlights a dual-path data collection strategy, capturing both automated response metrics and explicit user feedback.
* Different database technologies (DynamoDB and SQL Database) are used for storing data from the two branches.
* The "Event Trigger" component appears to be a central element in initiating the data pipeline for both branches.
* The Data Lake serves as the final destination for all collected data.
### Interpretation
The diagram illustrates a robust data collection architecture designed to capture a comprehensive view of NVInfo's performance and user experience. The separation of response metrics and user feedback allows for different types of data to be stored and processed appropriately. DynamoDB, a NoSQL database, is likely used for the high-volume, rapidly changing response metrics, while the SQL Database is used for the more structured user feedback data. The Data Lake provides a centralized repository for all data, enabling further analysis and insights. The use of Event Triggers suggests a real-time or near real-time data processing pipeline. The overall design emphasizes data-driven decision-making and continuous improvement of the NVInfo system. The diagram does not provide any quantitative data, but rather focuses on the flow and components of the data collection process.
</details>
Figure 3: NVInfo AI Response and Feedback Capture Architecture showing the complete data collection, ingestion and transformation components
The figure 3 illustrates the end-to-end data flow from user interaction with the NVInfo AI system to structured data storage for future system improvement. It highlights two main types of data captured(response metrics and user feedback metrics) and their subsequent processing.
- User Interaction and Metrics Collection: The data flow begins when a user interacts with the NVInfo User Interface, which connects to the NVInfo Agent, a domain-aware generative AI assistant that delivers structured, context-rich responses with citations. Each response is logged as part of NVInfo Response Metrics, capturing details such as query intent, routing, latency, and completeness. If the user provides feedback (e.g., thumbs up or down), NVInfo Feedback Metrics are recorded, including sentiment, error types, and optional comments. These metrics trigger events that stream response data to DynamoDB and feedback data to a SQL database, enabling structured downstream processing.
- Data Ingestion and Transformation: A centralized data ingestion pipeline runs every 4 hours via a scheduled cron job to extract the latest response and feedback records from DynamoDB and SQL databases. This ensures timely synchronization while minimizing system load during peak usage periods.
- PySpark-based Data Transformation: The ingested data is processed through a PySpark-based pipeline that performs cleaning, normalization, and enrichment. It maps feedback to specific conversation sessions, standardizes sentiment scores, and parses routing and rephrasal trace logs to identify failure modes. The resulting structured views capture model-side performance metrics such as routing accuracy and response latency, as well as user-side indicators like feedback sentiment and interaction quality, together providing a holistic picture of system effectiveness.
- Data Lake Storage: The structured outputs are stored in a scalable data lake for long-term access and analysis. These views support downstream tasks such as dashboarding, fine-tuning, error analysis, and offline evaluation, contributing to continuous improvement of the NVInfo Agent.
## Appendix C RAG System Failure Points
RAG System Failure Points
<details>
<summary>failure_points_in_rag.png Details</summary>
### Visual Description
## Diagram: NVIDIA Retrieval Augmented Generation (RAG) Error Flow
### Overview
This diagram illustrates the flow of a user prompt through a Retrieval Augmented Generation (RAG) system, specifically focusing on potential error sources at each stage. The system utilizes multiple "Experts" to handle different types of queries, and the diagram highlights how errors can propagate through the process, leading to issues in answer generation. The diagram is oriented from left to right, showing the progression from user input to final answer.
### Components/Axes
The diagram consists of the following components:
* **User:** Represented by a blue icon on the far left.
* **Prompt:** A speech bubble icon, receiving input from the User.
* **Experts:** Four distinct expert modules:
* NVIDIA Policies Expert (top)
* IT Help & HR Benefits Expert (center-left)
* NVIDIA Company Info Expert (center)
* NVIDIA Holiday Expert (bottom-left)
* Financial Earnings Expert (bottom)
* **Router:** A hexagonal icon, directing the prompt to the appropriate Expert.
* **Rephrased Queries:** A gear icon, representing the output of query rephrasing.
* **Retriever:** A cylinder icon, responsible for retrieving relevant information.
* **Reranker:** A hexagonal icon, re-ranking the retrieved information.
* **Answer Generation:** A gear icon, generating an answer based on the retrieved and re-ranked information.
* **Citation Generation:** A hexagonal icon, generating citations for the answer.
* **Answer Generation with Citations:** A rectangular box, representing the final output.
* **Error Nodes:** Various hexagonal icons labeled with specific error types:
* Query Rephrasal Error
* Router Error
* Retriever Error
* Reranking Error
* LLM Hallucination Error
* Citation Generation Error
* Answer Generation Error
The diagram uses arrows to indicate the flow of information. The color coding is as follows:
* Blue: User and Prompt
* Light Blue: Experts
* Yellow: Router and Router Error
* Orange: Query Rephrasal and Query Rephrasal Error
* Red: Retriever and Retriever Error
* Green: Reranker and Reranking Error
* Purple: LLM and LLM Hallucination Error
* Teal: Citation Generation and Citation Generation Error
* Pink: Answer Generation and Answer Generation Error
* Grey: Rephrased Queries
### Detailed Analysis or Content Details
The diagram shows the following flow:
1. A **User** provides a **Prompt**.
2. The **Prompt** is sent to a **Router**.
3. The **Router** directs the prompt to one of the four **Experts**: NVIDIA Policies Expert, IT Help & HR Benefits Expert, NVIDIA Company Info Expert, NVIDIA Holiday Expert, or Financial Earnings Expert.
4. A **Router Error** can occur at this stage.
5. The selected Expert generates **Rephrased Queries**.
6. A **Query Rephrasal Error** can occur during this process.
7. The **Rephrased Queries** are sent to a **Retriever**.
8. A **Retriever Error** can occur during retrieval.
9. The retrieved information is sent to a **Reranker**.
10. A **Reranking Error** can occur during re-ranking.
11. The re-ranked information is sent to an **Answer Generation** module (likely a Large Language Model - LLM).
12. An **LLM Hallucination Error** can occur during answer generation.
13. The generated answer is sent to **Citation Generation**.
14. A **Citation Generation Error** can occur during citation generation.
15. Finally, the **Answer Generation with Citations** is produced.
16. An **Answer Generation Error** can occur during the final answer generation stage.
The diagram shows that errors can occur at multiple points in the process, and these errors are explicitly labeled. The flow is largely linear, with branching occurring at the Router stage.
### Key Observations
* The diagram highlights the complexity of a RAG system and the numerous potential points of failure.
* The inclusion of specific error types (e.g., "LLM Hallucination Error") suggests a focus on mitigating these issues.
* The diagram does not provide any quantitative data or performance metrics. It is a qualitative representation of the system's architecture and potential error sources.
* The diagram emphasizes the importance of robust error handling and monitoring in a RAG system.
### Interpretation
This diagram is a conceptual overview of a RAG pipeline, specifically designed to identify and visualize potential error sources. It suggests that the developers of this system are aware of the challenges associated with building reliable RAG applications, such as the potential for LLMs to generate inaccurate or misleading information (hallucinations). The diagram's focus on error propagation indicates a desire to understand how errors at one stage can impact the overall quality of the generated answers. The use of multiple "Experts" suggests a modular approach to knowledge retrieval, allowing the system to handle a wide range of queries. The diagram serves as a valuable tool for system designers and engineers, helping them to prioritize error mitigation efforts and improve the overall robustness of the RAG pipeline. The diagram does not provide any information about the specific algorithms or techniques used in each component, nor does it offer any insights into the frequency or severity of the different error types. It is a high-level representation of the system's architecture and potential vulnerabilities.
</details>
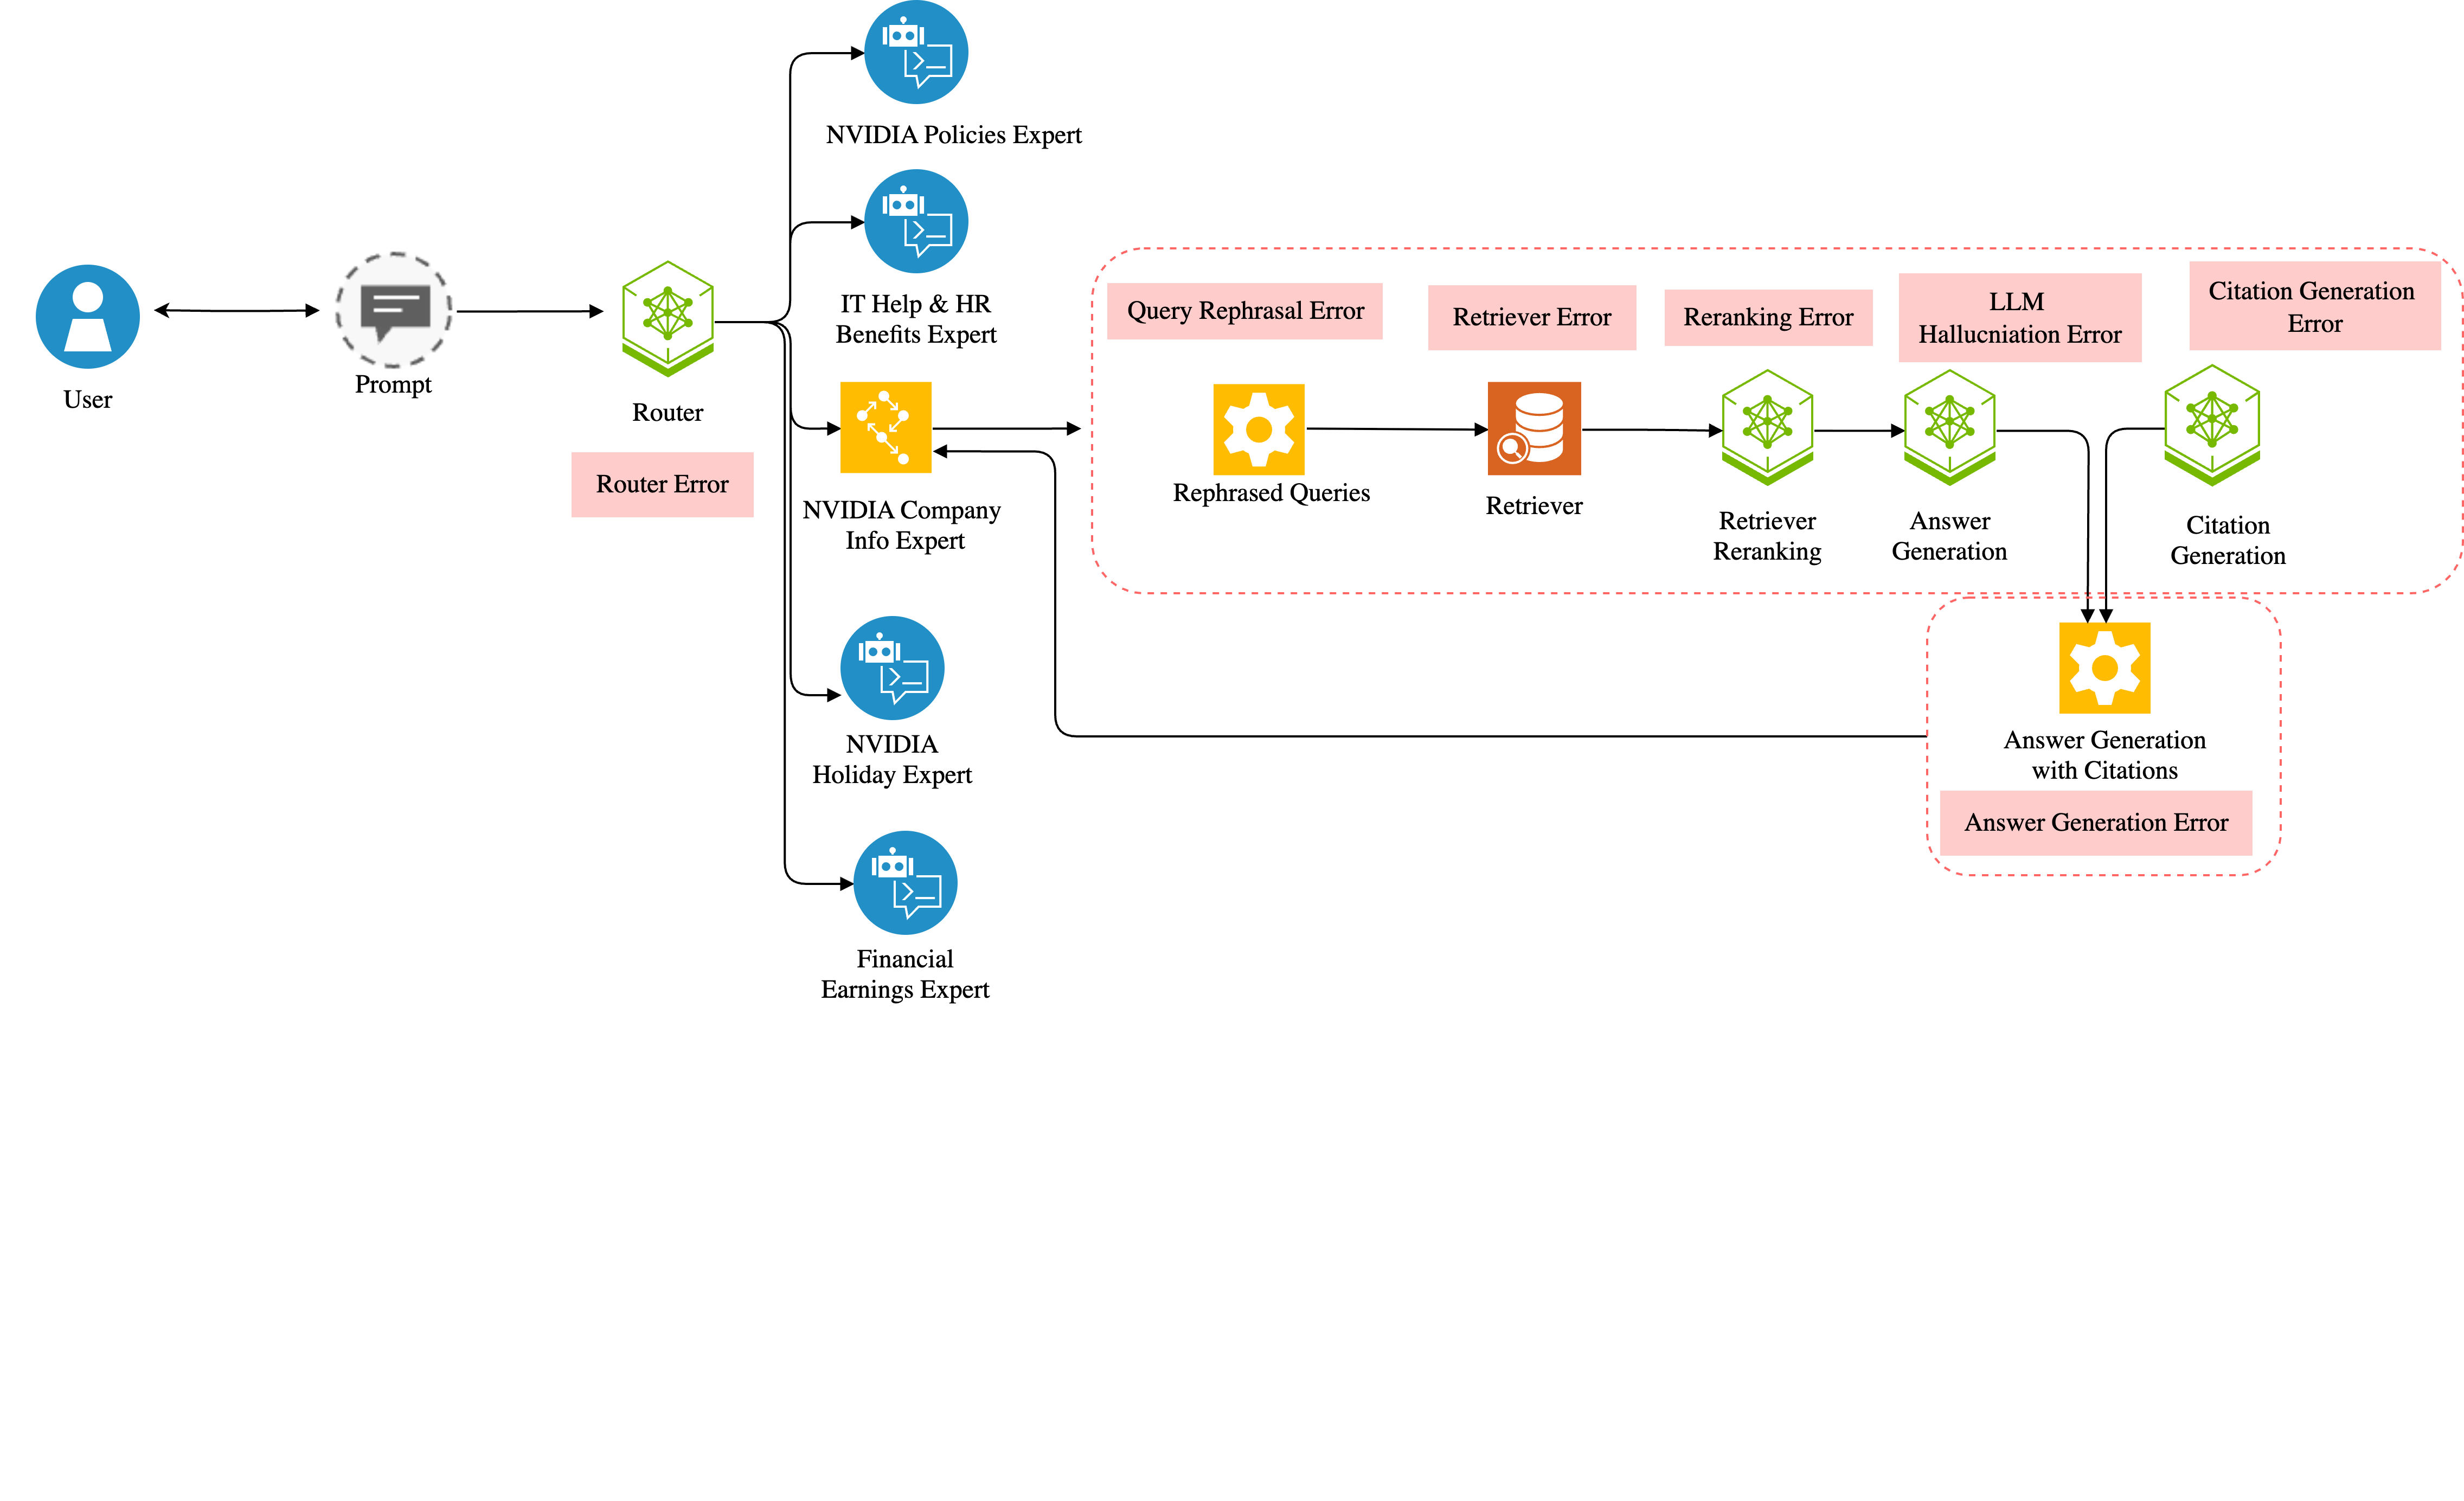
Figure 4: Sequential failure points in the RAG pipeline from query routing to answer generation
The RAG pipeline, as shown in Figure 4, faces challenges at each processing stage. These failure points were identified through analysis of 495 negative feedback samples collected over 3 months:
- Router - Query Understanding: Misclassification of user intent (5.25% of failures)
- Query Rephrasing Error: Incorrect query expansion (3.2% of failures)
- Retriever Error: Failure to find relevant documents despite their existence
- Reranking Error: Incorrect prioritization of retrieved documents
- LLM Hallucination: Generation of plausible but incorrect information
- Citation Generation Error: Incorrect or missing source attribution
- Answer Generation Error: Poor synthesis of retrieved context
## Appendix D NVInfo Interface Examples
NVInfo Interface Examples
<details>
<summary>IT_Help_QA.png Details</summary>
### Visual Description
\n
## Screenshot: Remote Employee Monitor Ordering Instructions
### Overview
This is a screenshot of a chat or messaging interface, likely a help desk or internal support system. The content details the process for a remote employee to order a monitor, including steps, alternative methods, and links to relevant resources. The interface includes user input fields for follow-up questions.
### Components/Axes
The screenshot contains the following elements:
* **User Input:** "I am a remote employee. How do I order a monitor?" (Top-left)
* **Response Text:** A block of text detailing the monitor ordering process.
* **Numbered Steps:** A list of four steps for ordering a monitor.
* **Links:** Three links to additional resources, each with a corresponding icon.
* **Follow-up Questions:** Three pre-defined questions the user can select.
* **Icons:** Small circular icons next to the links.
* **Reference Numbers:** Numbers in brackets ([1], [2], [3]) within the text, linking to the resources.
### Detailed Analysis or Content Details
The response text provides the following information:
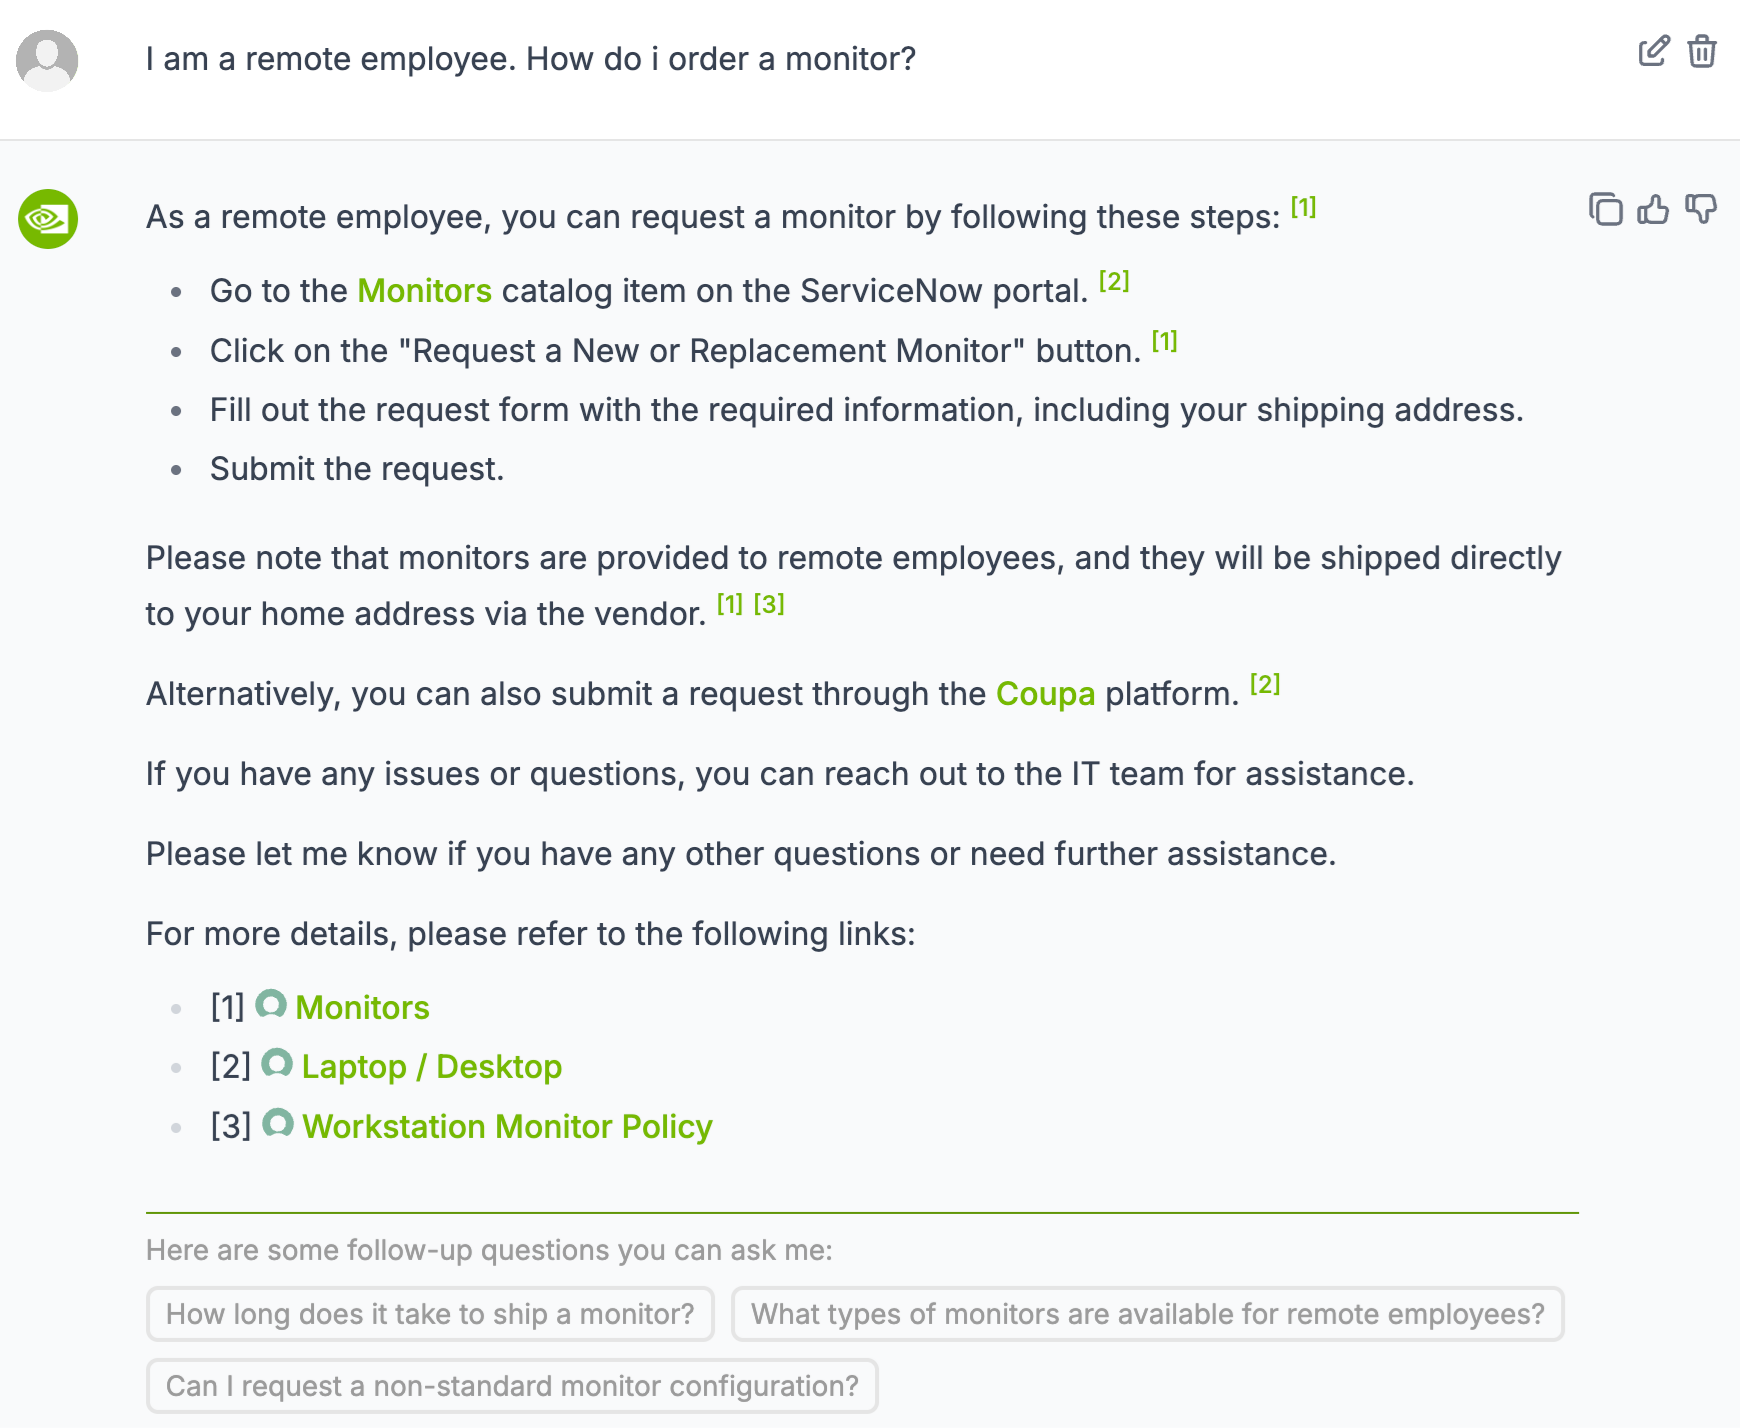
1. **Ordering Steps:**
* Go to the Monitors catalog item on the ServiceNow portal.
* Click on the "Request a New or Replacement Monitor" button.
* Fill out the request form with the required information, including your shipping address.
* Submit the request.
2. **Shipping Information:** Monitors are provided to remote employees and shipped directly to their home address via the vendor.
3. **Alternative Ordering Method:** Requests can also be submitted through the Coupa platform.
4. **Support Contact:** The IT team is available for assistance with any issues or questions.
5. **Links:**
* [1] Monitors
* [2] Laptop / Desktop
* [3] Workstation Monitor Policy
6. **Follow-up Questions:**
* How long does it take to ship a monitor?
* What types of monitors are available for remote employees?
* Can I request a non-standard monitor configuration?
### Key Observations
* The response is structured and provides clear, step-by-step instructions.
* Multiple ordering options are available (ServiceNow and Coupa).
* The inclusion of follow-up questions suggests common inquiries.
* The reference numbers link the text to specific resources, enhancing usability.
### Interpretation
The data suggests a well-defined process for remote employees to obtain monitors. The provision of multiple ordering channels and readily available support indicates a focus on employee convenience and satisfaction. The pre-defined follow-up questions highlight potential areas of confusion or frequent requests, allowing for proactive support. The links to policies and catalogs demonstrate a commitment to transparency and self-service. The overall tone is helpful and informative, aiming to resolve the user's query efficiently. The use of reference numbers is a good practice for linking information and reducing ambiguity. The interface is designed to be user-friendly and facilitate a smooth ordering experience.
</details>
(a) IT Help Expert providing technical support for WFH monitor ordering
<details>
<summary>Financial_Earning_QA.png Details</summary>
### Visual Description
\n
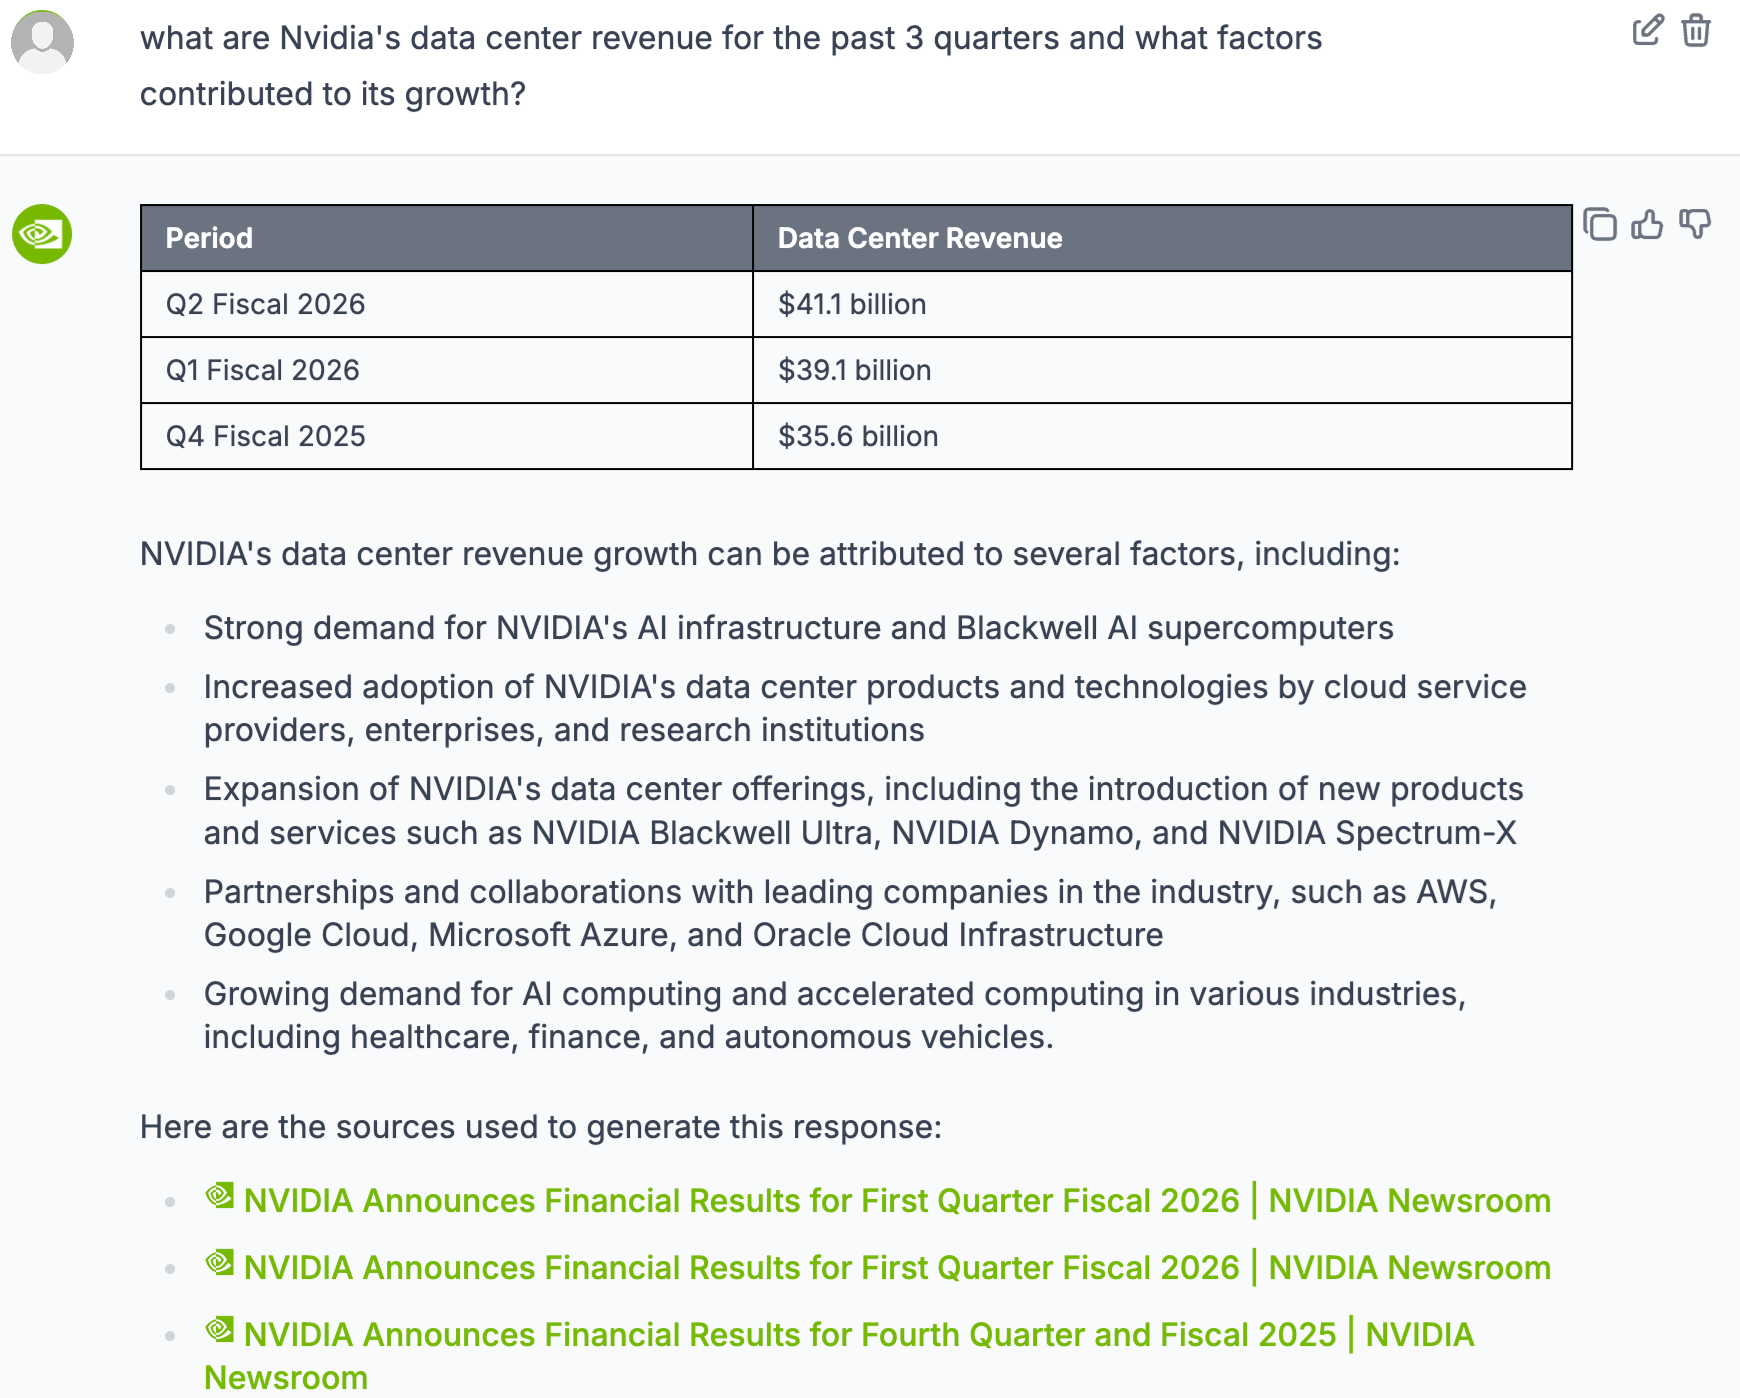
## Table: NVIDIA Data Center Revenue
### Overview
The image presents a table displaying NVIDIA's data center revenue for the past three fiscal quarters, along with a list of factors contributing to its growth. The table is accompanied by a textual explanation of these contributing factors and a list of sources used to generate the response.
### Components/Axes
The table has two columns: "Period" and "Data Center Revenue". The "Period" column lists the fiscal quarter and year. The "Data Center Revenue" column displays the revenue amount in billions of US dollars.
### Detailed Analysis or Content Details
The table contains the following data points:
* **Q2 Fiscal 2026:** $41.1 billion
* **Q1 Fiscal 2026:** $39.1 billion
* **Q4 Fiscal 2025:** $35.6 billion
The revenue shows an upward trend over the three reported periods. The revenue increased from $35.6 billion in Q4 Fiscal 2025 to $39.1 billion in Q1 Fiscal 2026, and further increased to $41.1 billion in Q2 Fiscal 2026.
The text below the table lists the following factors contributing to NVIDIA's data center revenue growth:
* Strong demand for NVIDIA's AI infrastructure and Blackwell AI supercomputers.
* Increased adoption of NVIDIA's data center products and technologies by cloud service providers, enterprises, and research institutions.
* Expansion of NVIDIA's data center offerings, including the introduction of new products and services such as NVIDIA Blackwell Ultra, NVIDIA Dynamo, and NVIDIA Spectrum-X.
* Partnerships and collaborations with leading companies in the industry, such as AWS, Google Cloud, Microsoft Azure, and Oracle Cloud Infrastructure.
* Growing demand for AI computing and accelerated computing in various industries, including healthcare, finance, and autonomous vehicles.
The sources used to generate the response are:
* NVIDIA Announces Financial Results for First Quarter Fiscal 2026 | NVIDIA Newsroom
* NVIDIA Announces Financial Results for Fourth Quarter and Fiscal 2025 | NVIDIA Newsroom
### Key Observations
The data demonstrates a consistent growth in NVIDIA's data center revenue over the three reported quarters. The contributing factors highlight the increasing demand for AI and accelerated computing, NVIDIA's strong position in the market, and its strategic partnerships.
### Interpretation
The data suggests that NVIDIA is experiencing significant growth in its data center business, driven by the increasing demand for AI and accelerated computing. The company's investments in new products and services, as well as its partnerships with leading cloud providers, are contributing to its success. The consistent revenue increase indicates a strong market position and positive future outlook for NVIDIA's data center business. The repeated listing of the first source suggests a possible error or emphasis on that particular announcement. The factors listed are all interconnected, creating a positive feedback loop where increased demand leads to further investment and innovation, which in turn drives even greater demand.
</details>
(b) Financial Earnings Expert analyzing quarterly revenue growth
<details>
<summary>HR_Benefits_QA.png Details</summary>
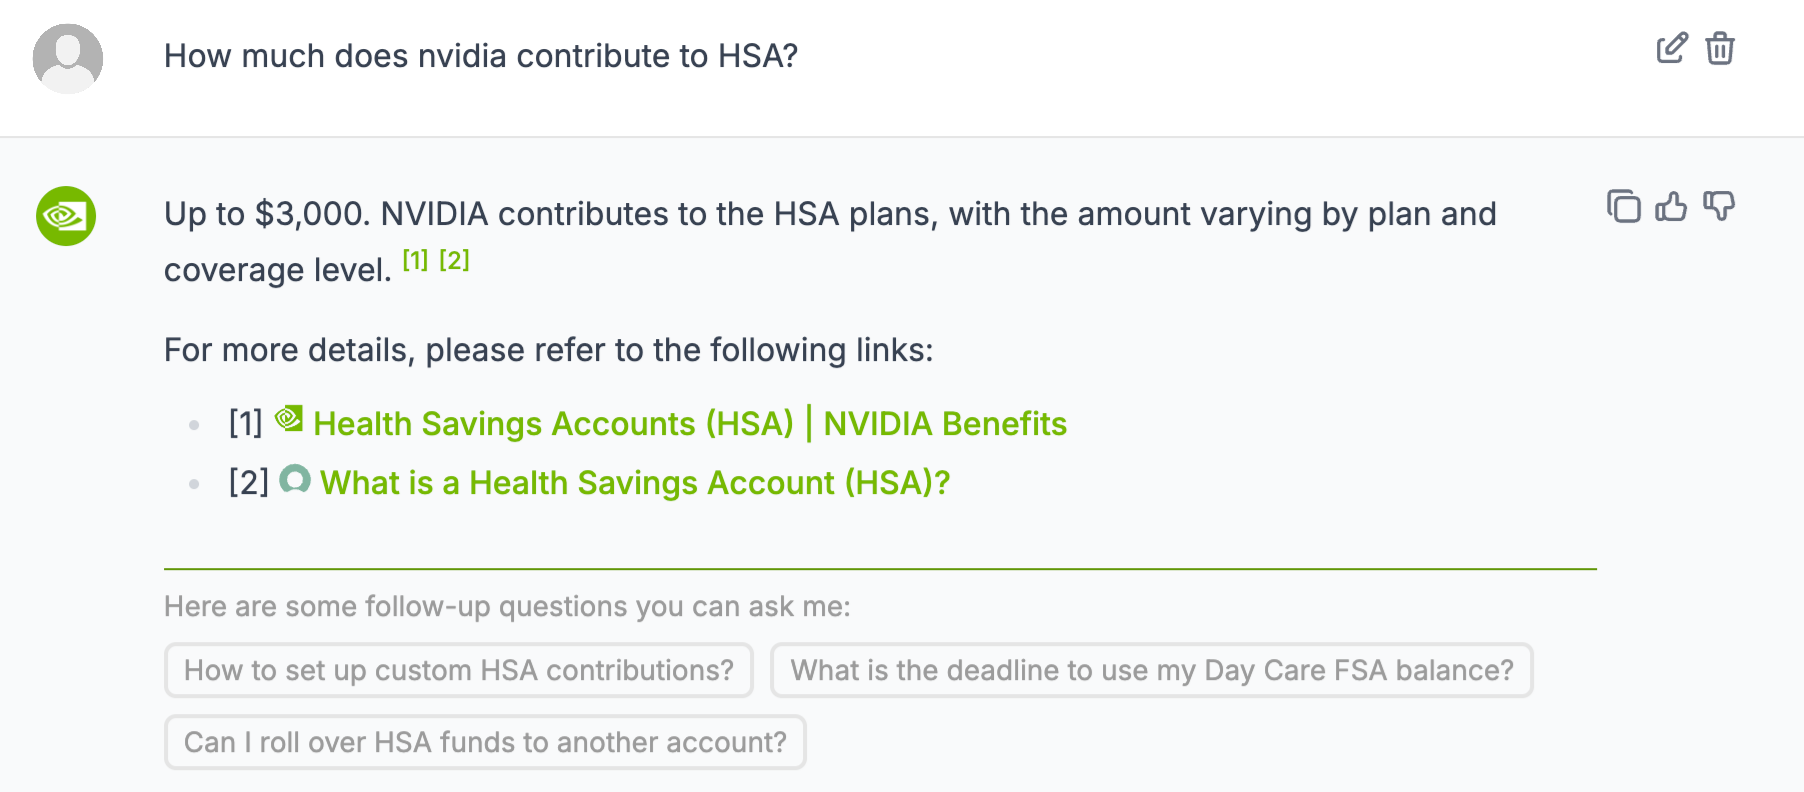
### Visual Description
\n
## Screenshot: NVIDIA HSA Contribution Information
### Overview
This is a screenshot of a question-and-answer interface, likely from a chatbot or help center, regarding NVIDIA's contribution to Health Savings Accounts (HSAs). The interface presents a concise answer followed by links to more detailed information and suggestions for follow-up questions.
### Components/Axes
The screenshot contains the following elements:
* **Question:** "How much does NVIDIA contribute to HSA?" (Top-left)
* **Answer:** "Up to $3,000. NVIDIA contributes to the HSA plans, with the amount varying by plan and coverage level. [1] [2]" (Center)
* **Links:**
* "[1] 🔗 Health Savings Accounts (HSA) | NVIDIA Benefits" (Center)
* "[2] 🔗 What is a Health Savings Account (HSA)?" (Center)
* **Follow-up Questions:**
* "How to set up custom HSA contributions?" (Bottom-left)
* "What is the deadline to use my Day Care FSA balance?" (Bottom-center)
* "Can I roll over HSA funds to another account?" (Bottom-right)
* **Icons:** Edit, Delete, Upvote/Downvote (Top-right and Center-right)
### Detailed Analysis or Content Details
The primary information is that NVIDIA contributes "Up to $3,000" to HSAs. The contribution amount is not fixed and depends on the employee's specific "plan and coverage level." The screenshot provides links to external resources for more detailed information.
### Key Observations
The answer is deliberately vague, providing a maximum contribution amount but emphasizing variability based on individual plans. The inclusion of follow-up questions suggests the system anticipates users needing further clarification. The presence of upvote/downvote icons indicates a feedback mechanism for the answer's usefulness.
### Interpretation
The data suggests NVIDIA offers an HSA benefit, but the specific contribution amount is personalized. The system is designed to provide a quick answer while directing users to more comprehensive resources if needed. The follow-up questions highlight common concerns related to HSA management. The "Up to $3,000" phrasing is a common tactic to attract attention while maintaining flexibility in the actual contribution amounts. The links provided are likely to NVIDIA's internal benefits portal and a general resource explaining HSAs, respectively.
</details>
(c) HR Benefits Expert explaining HSA contribution details
<details>
<summary>NVIDIA_product_doc_QA.png Details</summary>
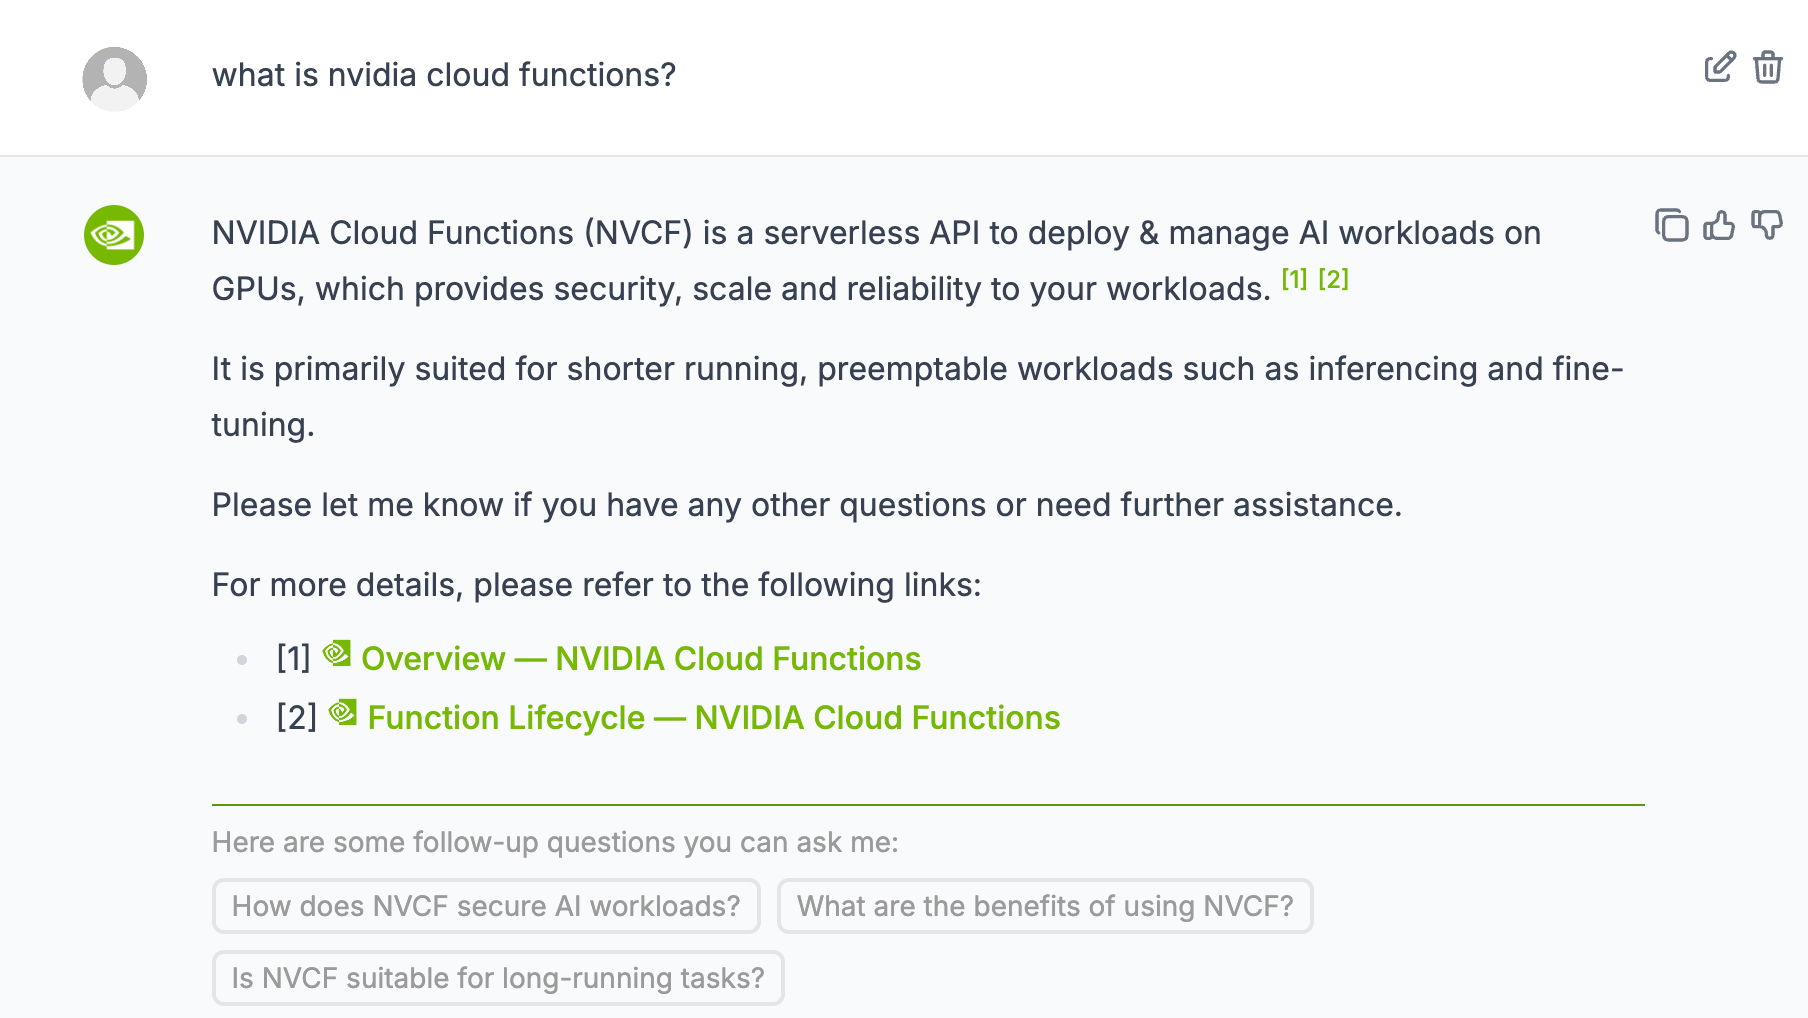
### Visual Description
\n
## Screenshot: NVIDIA Cloud Functions Information
### Overview
This is a screenshot of a conversational interface (likely a chatbot) responding to the query "what is nvidia cloud functions?". The response provides a definition of NVIDIA Cloud Functions (NVCF), its primary use cases, and links to further documentation. It also suggests follow-up questions.
### Components/Axes
The screenshot contains the following elements:
* **User Query:** "what is nvidia cloud functions?" (top-left)
* **Chatbot Response:** A block of text defining NVCF.
* **Links:** Two hyperlinks to NVIDIA Cloud Functions documentation.
* **Suggested Follow-up Questions:** Three buttons with potential follow-up questions.
### Detailed Analysis or Content Details
The chatbot's response states:
"NVIDIA Cloud Functions (NVCF) is a serverless API to deploy & manage AI workloads on GPUs, which provides security, scale and reliability to your workloads.<sup>[1] [2]</sup>
It is primarily suited for shorter running, preemptable workloads such as inferencing and fine-tuning.
Please let me know if you have any other questions or need further assistance.
For more details, please refer to the following links:
* [1] 🔗 Overview — NVIDIA Cloud Functions
* [2] 🔗 Function Lifecycle — NVIDIA Cloud Functions"
The suggested follow-up questions are:
* "How does NVCF secure AI workloads?"
* "What are the benefits of using NVCF?"
* "Is NVCF suitable for long-running tasks?"
### Key Observations
The response is concise and informative, focusing on the core features and use cases of NVCF. The inclusion of links to further documentation and suggested follow-up questions encourages further exploration. The superscript numbers indicate citations.
### Interpretation
The data suggests that NVIDIA is positioning Cloud Functions as a solution for deploying and managing AI workloads, particularly those that are short-lived and require GPU acceleration. The emphasis on security, scale, and reliability indicates these are key selling points. The suggested follow-up questions reveal common concerns or areas of interest for potential users, such as security, benefits, and suitability for different workload types. The chatbot interface is designed to provide quick answers and guide users towards more detailed information.
</details>
(d) Company Info Expert providing NVC function information
Figure 5: Representative NVInfo AI interface examples showing mixture-of-experts responses across different enterprise domains
The interface examples above demonstrate the system’s capabilities:
- IT Support (Fig. 5(a)): Shows step-by-step guidance for ordering WFH equipment through the ServiceNow portal
- Financial Analysis (Fig. 5(b)): Provides quarterly revenue data with year-over-year growth metrics and detailed breakdowns
- HR Benefits (Fig. 5(c)): Displays HSA contribution tables with employer matching details for different fiscal quarters
- Product Documentation (Fig. 5(d)): Explains technical concepts like NVIDIA Cloud Functions with architecture overview
## Appendix E Prompt for router error LLM-as-a-judge classification
Prompt for router error LLM-as-a-judge classification
⬇
1 Question: How do I submit a referral?
2 Tools: [’ it_benefits_help ’, ’ nvinfo_policies_expert ’]
3 Reasoning: This question is related to NVIDIA policy which means it should be sent to either ’ it_benefits_help ’ or ’ nvinfo_policies_expert ’.
4 Answer: YES
5
6 Question: When can I sign up for a new health plan?
7 Tools: [’ finance_expert ’]
8 Reasoning: This question is related to employee benefits which means it should be sent to ’ it_benefits_help ’ instead of ’ finance_expert ’.
9 Answer: NO
10
11 Question: what was NVIDIA ’ s Q3 revenue in fiscal 2024?
12 Tools: [’ finance_expert ’]
13 Reasoning: This question is related to NVIDIA ’ s earnings which means it should go to ’ finance_expert ’.
14 Answer: YES
15
16 Question: Is Mercedes Benz using NVIDIA ’ s digital twin technology?
17 Tools: [’ it_benefits_help ’, ’ nvinfo_policies_expert ’]
18 Reasoning: This question is related to NVIDIA ’ s products and therefore should have gone to ’ it_benefits_help ’.
19 Answer: YES
20
21 Question: What is the vacation policy at NVIDIA?
22 Tools: [’ nvinfo_holiday_expert ’]
23 Reasoning: This question is related to NVIDIA policy which means it should be sent to either ’ it_benefits_help ’ or ’ nvinfo_policies_expert ’.
24 Answer: NO
25
26 Question: When is the next free day at NVIDIA?
27 Tools: [’ nvinfo_holiday_expert ’]
28 Reasoning: The user is trying to find the date of a holiday which means that the question should be sent to [’ nvinfo_holiday_expert ’].
29 Answer: YES
30
31 Question: When is the first open stock sale period in 2025?
32 Tools: [’ finance_expert ’]
33 Reasoning: This question is related to NVIDIA ’ s company finances and should therefore be sent to ’ finance_expert ’.
34 Answer: YES
35
36 Question: How many unused vacation days can I carry over?
37 Tools: [’ it_benefits_help ’, ’ nvinfo_policies_expert ’]
38 Reasoning: This question is related to NVIDIA policy and employee benefits which means it should be sent to either ’ it_benefits_help ’ or ’ nvinfo_policies_expert ’.
39 Answer: YES
40
41 Question: Who heads up wwfo?
42 Tools: [’ finance_expert ’]
43 Reasoning: This question is related to NVIDIA ’ s leadership which means that it should be sent to ’ finance_expert ’.
44 Answer: YES
45
46 Question: Who is John Smith?
47 Tools: [’ finance_expert ’]
48 Reasoning: The user is trying to find information about a specific person which means that this question should go to ’ it_benefits_help ’ or ’ nvinfo_policies_expert ’.
49 Answer: NO
50
51 Question: What are the latest hardware offerings by nvidia?
52 Tools: [’ it_benefits_help ’, ’ nvinfo_policies_expert ’]
53 Reasoning: This question is related to NVIDIA ’ s products and therefore should have gone to ’ it_benefits_help ’.
54 Answer: YES
55
56 Question: What is gb200 nvl72?
57 Tools: [’ finance_expert ’]
58 Reasoning: This question is related to NVIDIA ’ s products and therefore should have gone to ’ it_benefits_help ’.
59 Answer: NO
60
61 Question: When will the 2025 free days be officially announced?
62 Tools: [’ it_benefits_help ’, ’ nvinfo_policies_expert ’]
63 Reasoning: This question is related to NVIDIA ’ s policies or benefits, so it should be sent to ’ it_benefits_help ’ or ’ nvinfo_policies_expert ’.
64 Answer: YES
65
66 Question: Does nvidia offer financial advice services?
67 Tools: [’ finance_expert ’]
68 Reasoning: This question is related to NVIDIA ’ s policies or benefits, so it should be sent to ’ it_benefits_help ’ or ’ nvinfo_policies_expert ’.
69 Answer: NO
70
71 Question: What was the year - over - year (YoY) and quarter - over - quarter (QoQ) growth for Q2 Fiscal 2025?
72 Tools: [’ finance_expert ’]
73 Reasoning: This question is related to NVIDIA ’ s earnings and should therefore be routed to ’ finance_expert ’.
74 Answer: YES
75
76 Question: How do I order a mouse?
77 Tools: [’ it_benefits_help ’, ’ nvinfo_policies_expert ’]
78 Reasoning: This question is related to procuring a work accessory, which means that it should go to either ’ it_benefits_help ’ or ’ nvinfo_policies_expert ’.
79 Answer: YES
80
81 Question: I ’ m getting a VPN error
82 Tools: [’ finance_expert ’]
83 Reasoning: This question is related to an IT issue, which means that it should go to either ’ it_benefits_help ’ or ’ nvinfo_policies_expert ’.
84 Answer: NO
85
86 QUERY: {query}
87 TOOLS: {experts}
Listing 1: Prompt for router error LLM-as-a-judge classification (complete example)
## Appendix F Regression dataset
Regression Dataset
The NVInfo regression dataset is actively curated and regularly updated, currently comprising around 300 queries that cover a range of domains including NVIDIA benefits, holidays, company policies, and IT Help. Each query in the dataset contains the corresponding ground truth and expected citation values. LLM-as-judge framework is leveraged to evaluate the quality of NvInfo generated answers against the regression dataset. The criteria for judgment is based on metrics such as correctness, helpfulness, and conscientiousness.
## Appendix G Synthetic data generation
Synthetic data generation
As part of our continuous improvement efforts, we identified that refining the way queries are phrased could significantly enhance retrieval accuracy. Given that our retrieval system is highly sensitive to keyword usage, an in-depth analysis of existing feedback was conducted. During this analysis, we discovered that decomposing certain queries into sub-queries improved the recall of relevant information from our internal retrieval systems. This, in turn, led to more accurate and contextually appropriate responses. To tackle this, we conducted a detailed review of about 250 examples from our ”thumbs down” feedback dataset, focusing specifically on queries related to our SharePoint expert system. We noticed that some queries weren’t retrieving the most relevant information due to a lack of understanding of NVIDIA-specific acronyms or context. By manually rephrasing these queries, we found that we could significantly improve the retrieval of the intended information. From an initial set of 250 examples, we identified 10 key candidates showcasing common patterns of misinterpretation or context loss. For instance, the query ”I am based in the netherlands, when is pay day?” was initially rephrased as ”payday schedule united states, employer pay dates usa.” We manually corrected this to ”payday schedule netherlands” and ”netherlands pay days.” To extend this improvement beyond the feedback dataset, we integrated these rephrased examples into our synthetic data generation pipeline. We leveraged these examples as few-shot prompts for our large language model. By providing SharePoint-related website content as context, we instructed the LLM to generate both original and rephrased queries for all documents. This method allowed us to produce approximately 5,000 rephrased queries, thereby enriching our dataset and facilitating more effective fine-tuning of the agent. This focused enhancement significantly improved the SharePoint expert’s ability to retrieve and deliver the most relevant information with increased accuracy.
Prompt for Synthetic Data Generation
You are a data annotator generating questions, answers, and rephrased questions from an input document and its URL. Guidelines •
Identify key phrases and entities in the document and generate questions around them. •
Generate questions answerable using information contained in the input document. •
Do not write questions that require viewing the document to understand the question. •
Avoid phrases like “according to the document/author”, “in this document”, etc. •
Questions may also be key phrases found in the document. •
Ensure the document contains the complete answer to your question. •
Provide enough context in the question to lead to the specific answer in the document. •
Vary phrasing, vocabulary, complexity, and type of questions. •
Do not copy exact phrasing; use your own words. •
Prefix questions with Question: and answers with Answer:. •
Rephrase each question at least twice (query decomposition/expansion) to aid search. •
Final output must be a Python list. •
Rephrased queries are short, concise keyword/entity mixes; you may replace nvidia with employer or company. •
Provide two or more rephrased queries preserving intent and timeframe. •
If the question asks for “the next X date” without time context, append YYYY (current or next year) in rephrased queries. Example: Question: “when is the next NTech conference” $\rightarrow$ “upcoming ntech 2024”, “ntech dates 2024”, “ntech schedule 2025”. Use the EnterpriseKnowledge tool when The user asks for non-sensitive information such as organization info, direct reports, phone numbers, benefits alternate ID, email addresses, working addresses, tax explanations, updating SSN instructions, or stock trading policies. Your action format MUST be ⬇ Thought: Provide a short analysis of your understanding from the Question. Process: I need to use the Enterprise Knowledge tool Action: EnterpriseKnowledge Action Input: A single line Python list of rephrased queries MUST be generated. Strict JSON schema (return nothing else) ⬇ { "type": "object", "properties": { "Question": { "type": "string", "description": "Generated Question from the input document." }, "Answer": { "type": "string", "description": "Corresponding Answer from the input document that answers the Question." }, "Thought": { "type": "string", "description": "Short analysis of your understanding from the Question." }, "Process": { "type": "string", "description": "I need to use the Enterprise Knowledge tool." }, "Action": { "type": "string", "description": "EnterpriseKnowledge" }, "Action Input": { "type": "list", "description": "A single line Python list of rephrased queries." } } } Examples Input Document: <Content of input document> Input Document url: <url of input document> Output ⬇ { "Question": "I am based in the Netherlands, when is pay day?", "Answer": "25th of every month", "Thought": "Payroll timing question; include location keywords in rephrased queries.", "Process": "I need to use the Enterprise Knowledge tool", "Action": "EnterpriseKnowledge", "Action Input": [ "payday schedule netherlands", "netherlands pay days" ] } Input Document: <Content of input document> Input Document url: <url of input document> Output ⬇ { "Question": "point me to gpu fcv page?", "Answer": "https://nvidia.sharepoint.com/sites/TechnicalTraining/ASIC%20teams.aspx", "Thought": "Needs GPU FCV (Full Chip Verification) page.", "Process": "I need to use the Enterprise Knowledge tool", "Action": "EnterpriseKnowledge", "Action Input": [ "gpu fcv page company", "fcv gpu url" ] } Input Document: <Content of input document> Input Document url: <url of input document> Output ⬇ { "Question": "ok, i’m looking for an nvidia icon for biotech / pharmaceuticals to use in a presentation. can you help me find that?", "Answer": "https://nvidia.sharepoint.com/sites/nvinfo/brand/Pages/default.aspx", "Thought": "Needs a company icon for biotech/pharma use.", "Process": "I need to use the Enterprise Knowledge tool", "Action": "EnterpriseKnowledge", "Action Input": [ "company icons", "company logos biotech" ] } Task output format Generate 3 pairs by following the instructions based on the Input Document. Strictly return only a Python list of pairs and nothing else. Input Document: <Content of input document> Input Document url: <url of input document> Output: ###