# REVEAL: Reasoning-enhanced Forensic Evidence Analysis for Explainable AI-generated Image Detection
**Authors**: Huangsen Cao, Qin Mei, Zhiheng Li, Yuxi Li, Ying Zhang, Chen Li, Zhimeng Zhang, Xin Ding, Yongwei Wang, Jing LYU and Fei Wu
> Huangsen Cao, Qin Mei, Zhiheng Li, Zhimeng Zhang, Yongwei Wang, Fei Wu are with Zhejiang University. E-mail: huangsen_cao, yongwei.wang, Yuxi Li, Ying Zhang, Chen Li, Jing Lyu are with WeChat Vision, Tencent Inc. Ding Xin is with Nanjing University of Information Science and Technology.
## Abstract
With the rapid advancement of generative models, visually realistic AI-generated images have become increasingly difficult to distinguish from authentic ones, posing severe threats to social trust and information integrity. Consequently, there is an urgent need for efficient and truly explainable image forensic methods. Recent detection paradigms have shifted towards explainable forensics. However, state-of-the-art approaches primarily rely on post-hoc rationalizations or visual discrimination, lacking a verifiable chain of evidence. This reliance on surface-level pattern matching limits the generation of causally grounded explanations and often results in poor generalization. To bridge this critical gap, we introduce REVEAL-Bench, the first reasoning-enhanced multimodal benchmark for AI-generated image detection that is explicitly structured around a chain-of-evidence derived from multiple lightweight expert models, then records step-by-step reasoning traces and evidential justifications. Building upon this dataset, we propose REVEAL (R easoning- e nhanced Forensic E v id e nce A na l ysis), an effective and explainable forensic framework that integrates detection with a novel expert-grounded reinforcement learning. Our reward mechanism is specially tailored to jointly optimize detection accuracy, explanation fidelity, and logical coherence grounded in explicit forensic evidence, enabling REVEAL to produce fine-grained, interpretable, and verifiable reasoning chains alongside its detection outcomes. Extensive experimental results demonstrate that REVEAL significantly enhances detection accuracy, explanation fidelity, and robust cross-model generalization, benchmarking a new state of the art for explainable image forensics.
Index Terms: AI-generated image detection, Explainable AI, Forensic reasoning.
<details>
<summary>x1.png Details</summary>
### Visual Description
## Process Diagram: Multi-Perspective Image Authenticity Detection
### Overview
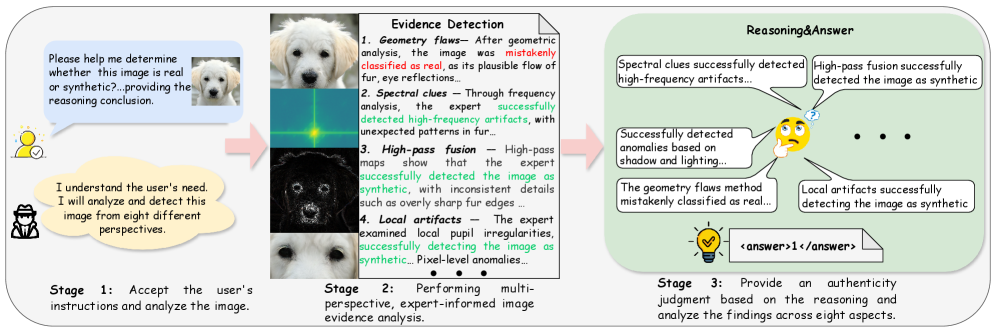
This image is a process flow diagram illustrating a three-stage methodology for determining whether a given image is real or synthetic (AI-generated). The diagram uses a combination of user interaction icons, sample images, textual descriptions, and a reasoning flowchart to explain the system's operation. The overall flow moves from left to right, indicated by large pink arrows connecting the stages.
### Components/Axes
The diagram is segmented into three distinct horizontal stages, each contained within a rounded rectangle or implied area.
**Stage 1: Accept the user's instructions and analyze the image.**
* **Location:** Leftmost section.
* **Components:**
* A user icon (person with a checkmark) with a speech bubble containing the query: "Please help me determine whether this image is real or synthetic?... providing the reasoning conclusion." A small thumbnail of a white puppy is attached to the bubble.
* Below the user, an "analyst" icon (person with a hat and magnifying glass) with a thought bubble stating: "I understand the user's need. I will analyze and detect this image from eight different perspectives."
**Stage 2: Performing multi-perspective, expert-informed image evidence analysis.**
* **Location:** Central section.
* **Components:**
* A vertical column of four sample images of the same white puppy, each demonstrating a different analysis technique.
* A document icon labeled "Evidence Detection" containing a numbered list of four analysis methods. The text is as follows:
1. **Geometry flaws** – After geometric analysis, the image was mistakenly classified as real, ignoring its plausible flow of fur, eye reflections.
2. **Spectral clues** – Through frequency analysis, the expert successfully detected high-frequency artifacts, with unexpected patterns in fur...
3. **High-pass Fusion** – High-pass maps show that the expert successfully detected the image as synthetic, with inconsistent details such as overly sharp fur edges...
4. **Local artifacts** – The expert examines local pupil irregularities, successfully classifying the image as synthetic. Pixel-level anomalies...
* The text contains highlighted keywords in red ("mistakenly", "successfully") and green ("successfully", "successfully").
**Stage 3: Provide an authenticity judgment based on the reasoning and analyze the findings across eight aspects.**
* **Location:** Rightmost section, within a large rounded rectangle titled "Reasoning&Answer".
* **Components:**
* A central thinking emoji (🤔) connected by lines to five rectangular thought bubbles, representing synthesized conclusions from the analysis.
* The text in the thought bubbles reads:
* "Spectral clues successfully detected high-frequency artifacts..."
* "High-pass fusion successfully detected the image as synthetic"
* "Successfully detected anomalies based on shadow and lighting..."
* "The geometry flaws method mistakenly classified as real..."
* "Local artifacts successfully detecting the image as synthetic"
* An ellipsis ("...") indicates additional, unlisted reasoning points.
* A lightbulb icon (💡) points to a final answer box containing: `<answer>1</answer>`.
### Detailed Analysis
The diagram explicitly details four of the eight promised analysis perspectives in Stage 2:
1. **Geometry Flaws:** This method failed in this instance, incorrectly classifying the image as real. The reason given is that it ignored plausible biological details like fur flow and eye reflections.
2. **Spectral Clues:** This method succeeded. It used frequency analysis to detect high-frequency artifacts, noting unexpected patterns in the fur texture.
3. **High-pass Fusion:** This method succeeded. It used high-pass filtered maps to identify inconsistent details, specifically citing "overly sharp fur edges" as a sign of synthesis.
4. **Local Artifacts:** This method succeeded. It focused on micro-details like pupil irregularities and pixel-level anomalies to classify the image as synthetic.
The reasoning in Stage 3 consolidates these findings. The successful methods (Spectral, High-pass, Local) are noted as having detected synthetic traits, while the failed Geometry method is noted as having made a mistake. The final output is a binary answer tag `<answer>1</answer>`, which, given the context of successful synthetic detection, likely corresponds to "synthetic" or "fake."
### Key Observations
* **Method Performance:** There is a clear contrast between the failure of the "Geometry flaws" method and the success of the other three detailed methods. This highlights that different analytical perspectives can yield conflicting initial results.
* **Evidence Synthesis:** The "Reasoning&Answer" stage does not simply take a vote. It lists the conclusions from each method, including the erroneous one, suggesting a meta-analysis or weighting process occurs before the final judgment.
* **Visual Coding:** The use of red for "mistakenly" and green for "successfully" in the Stage 2 text provides immediate visual feedback on the outcome of each analysis technique.
* **Process Completeness:** While the diagram details only four methods, the text in both Stage 1 and Stage 3 explicitly mentions analysis from "eight different perspectives," indicating the full system is more comprehensive than this excerpt shows.
### Interpretation
This diagram outlines a robust, multi-faceted forensic approach to image authentication. It demonstrates that no single analysis technique is infallible; the geometry-based method was fooled in this case. The system's strength lies in its **ensemble approach**—running multiple, diverse expert analyses (geometric, spectral, frequency-domain, local artifact detection) and then synthesizing their results.
The process mirrors a scientific or investigative peer-review system. Individual "experts" (algorithms) present their evidence and conclusions. A higher-level reasoning stage then evaluates this collective evidence, acknowledging both successes and failures, to reach a final, more reliable verdict. The final `<answer>1</answer>` is not the output of a single test but the result of a reasoned consensus built from cross-referenced, multi-perspective evidence. This methodology is designed to be resilient against sophisticated synthetic images that might fool any single detection approach.
</details>
Figure 1: Overview of the proposed REVEAL framework for reasoning-enhanced explainable synthetic image detection. The framework consists of three main stages: (1) receiving user instructions, (2) performing expert-grounded multi-perspective evidence detection, and (3) conducting reasoning through the chain of evidence (CoE) to derive a reliable decision with justifications.
## 1 Introduction
With the rapid evolution of generative artificial intelligence techniques such as Generative Adversarial Networks (GANs) [goodfellow2014generative, karras2019style] and Diffusion Models [dhariwal2021diffusion], the visual realism of synthesized content has advanced to a level that can easily deceive human perception. While these advanced models have unlocked unprecedented creative and economic potential in fields like digital art, design, and film production, they have also raised significant concerns regarding misinformation, privacy violations, and copyright issues. The continual progress in advanced diffusion models such as FLUX [black-forest-labs_flux_2024] and SD3.5 [esser2024scaling], along with autoregressive generation methods (e.g., VAR [tian2024visual]), has further intensified the challenge of distinguishing between real and synthetic content, making reliable detection an urgent research priority.
<details>
<summary>x2.png Details</summary>
### Visual Description
## Diagram: Comparison of Two MLLM-Based Image Authenticity Classification Processes
### Overview
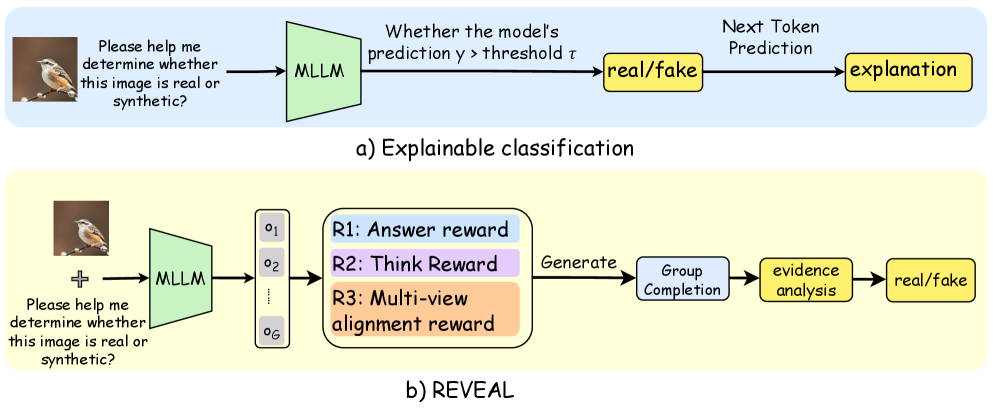
The image displays two flowcharts illustrating different methodological approaches for using a Multimodal Large Language Model (MLLM) to determine if an input image is real or synthetic (fake). The top diagram (a) depicts a straightforward "Explainable classification" pipeline. The bottom diagram (b) illustrates a more complex process named "REVEAL," which incorporates multiple outputs and reward-based refinement. Both processes begin with the same user prompt and an example input image of a bird.
### Components/Axes
The image is divided into two distinct horizontal sections:
1. **Top Section (a):** Has a light blue background. Labeled "a) Explainable classification" at the bottom center.
2. **Bottom Section (b):** Has a light yellow background. Labeled "b) REVEAL" at the bottom center.
**Common Elements:**
* **Input Image:** A small photograph of a bird (appears to be a robin) on a branch, positioned at the far left of both diagrams.
* **Input Prompt:** Text adjacent to the image reads: "Please help me determine whether this image is real or synthetic?"
* **MLLM Component:** Represented by a green trapezoid labeled "MLLM".
* **Output Labels:** Final classification outputs are in yellow rounded rectangles labeled "real/fake".
**Diagram (a) - Explainable Classification Components (Left to Right):**
1. Input Image & Prompt.
2. Green "MLLM" trapezoid.
3. A decision node described by text: "Whether the model's prediction y > threshold τ".
4. Yellow "real/fake" output box.
5. An arrow from "real/fake" points to a final yellow box labeled "explanation".
**Diagram (b) - REVEAL Components (Left to Right):**
1. Input Image & Prompt.
2. Green "MLLM" trapezoid.
3. A vertical stack of grey boxes labeled "o₁", "o₂", ..., "o_G", representing multiple outputs or samples.
4. A large rounded rectangle containing three colored reward function blocks:
* Blue: "R1: Answer reward"
* Purple: "R2: Think Reward"
* Orange: "R3: Multi-view alignment reward"
5. An arrow labeled "Generate" leads to a light blue box: "Group Completion".
6. An arrow leads to a yellow box: "evidence analysis".
7. A final arrow leads to the yellow "real/fake" output box.
### Detailed Analysis
**Process Flow for (a) Explainable Classification:**
The flow is linear and singular. The MLLM processes the input once. Its internal prediction score (`y`) is compared to a predefined threshold (`τ`). Based on this binary decision, it outputs a "real" or "fake" label and then generates a textual explanation for that decision.
**Process Flow for (b) REVEAL:**
The flow is iterative and multi-faceted. The MLLM generates multiple outputs (`o₁` through `o_G`). These outputs are evaluated by a composite reward system (R1, R2, R3) that assesses the answer, the reasoning ("Think"), and alignment across multiple views. This reward signal guides a "Group Completion" process, which synthesizes the outputs. The completed group undergoes "evidence analysis" before a final "real/fake" classification is made.
**Spatial Grounding & Legend:**
* In both diagrams, the flow is strictly left-to-right.
* The **green trapezoid** consistently represents the core MLLM component.
* **Yellow rounded rectangles** consistently represent final output states ("real/fake", "explanation", "evidence analysis").
* The **light blue background** in (a) and **light yellow background** in (b) serve as visual containers to separate the two distinct methodologies.
* In diagram (b), the reward functions are color-coded (blue, purple, orange) within their container, but these colors do not map to other elements in the flowchart.
### Key Observations
1. **Complexity Gradient:** Diagram (b) is significantly more complex than (a), introducing parallel generation (`o₁...o_G`), a multi-objective reward model, and a group-based synthesis step.
2. **Explanation Timing:** In (a), the "explanation" is generated *after* the classification decision. In (b), the "evidence analysis" (which could be seen as a form of explanation) is an integral step *before* the final classification.
3. **Decision Mechanism:** (a) relies on a simple threshold on a single prediction. (b) relies on aggregating and analyzing multiple outputs guided by learned rewards.
4. **Terminology:** (b) uses more specific terms like "Group Completion" and "evidence analysis," suggesting a more structured reasoning process compared to the generic "explanation" in (a).
### Interpretation
These diagrams contrast two paradigms for AI-assisted authenticity detection:
* **Diagram (a) represents a "Direct Inference with Justification" model.** It's a classic classifier that makes a decision and then rationalizes it. The process is transparent but potentially simplistic, as the explanation is post-hoc and may not reflect the true decision-making process. The threshold `τ` is a critical, fixed parameter.
* **Diagram (b) represents a "Deliberative, Reward-Driven Reasoning" model (REVEAL).** This approach treats the problem as a reasoning task rather than pure classification. By generating multiple hypotheses (`o₁...o_G`) and optimizing for rewards related to answer quality, reasoning depth ("Think"), and consistency ("Multi-view alignment"), it aims for a more robust and verifiable conclusion. The "Group Completion" and "evidence analysis" steps suggest a process akin to debate or peer review among the model's own outputs, potentially leading to higher accuracy and more trustworthy explanations that are integral to the decision, not an afterthought.
The progression from (a) to (b) illustrates a trend in advanced AI systems: moving from single-pass prediction to multi-step, self-critiquing, and reward-optimized reasoning chains for complex tasks where justification and reliability are as important as the final answer.
</details>
Figure 2: a) Existing post-hoc rationalization detection. b) REVEAL framework, a reasoning-enhanced paradigm for truly explainable forensic analysis.
Recent research [wang2020cnn, chai2020makes, wang2023dire, ojha2023towards, liu2024forgery, tan2024rethinking] has made notable progress in detecting AI-generated images. However, most traditional methods focus solely on discrimination, offering limited forensic analysis. The emergence of multimodal large language models (MLLMs) offers new opportunities, enabling models to combine visual perception with textual descriptions. Recent endeavours such as GPT-4 based detection [jia2024can], AIGI-Holmes [zhou2025aigi], FakeBench [li2025fakebench], and RAIDX [li2025raidx] have initiated this transition towards explainability. Yet, as illustrated in Figure 2, these methods share fundamental limitations: they primarily rely on post-hoc rationalizations or leverage the MLLMs merely as a powerful general-purpose visual classifier to identify high-level visual anomaly patterns (e.g.“unnatural lighting”, “blurry edge”). They fail to construct a causally grounded reasoning-based forensic pipeline where specialized evidence is systematically collected, analyzed, and synthesized through logical deduction. Specifically, these prior works: 1) use datasets (e.g. FakeBench [li2025fakebench]) that lack fine-grained, structured evidence, limiting support for deep causal reasoning; and 2) rely on methods (e.g. RAIDX [li2025raidx] with RAG) where explanations exhibit surface-level coherence derived from pattern matching, rather than being grounded in verifiable forensic evidence traces.
The critical gap highlights two major challenges in developing reasoning-enhanced synthetic image detection: 1) Lack of a reasoning-oriented forensic dataset. Existing datasets contain either binary labels or shallow textual justifications, without structured and rigorous chain-of-evidence annotations necessary to build auditable forensic judgments. 2) Limited reasoning-based explainability. Current MLLM-based detectors tend to produce post-hoc rationalizations instead of verifiable reasoning chains, leading to fragile generalization and unreliable claims in the forensic context.
To this end, we introduce REVEAL-Bench, a novel reasoning-oriented benchmark for AI-generated image forensics. Our data generation pipeline is fundamentally distinct from existing approaches: we shift from general visual correlation to expert-grounded evidence analysis. For each image, we first leverage eight lightweight expert models to provide structured, reliable, low-level forensic evidence. Such evidence then forms the input for a subsequent large model to generate a chain-of-evidence (CoE) annotation. By consolidating the multi-round forensic analysis from these specialized experts into a single, structured CoE trace, REVEL-Bench becomes the first dataset to explicitly provide an expert-grounded, verifiable forensic analysis that connects low-level cues to high-level conclusions.
Building upon this dataset, we propose the REVEAL framework, a two-stage training paradigm designed to enforce reasoning-based forensic evidence analysis. In the first stage, we employ a supervised fine-tuning (SFT) to teach the MLLM the canonical CoE structure. In the second stage, we introduce R-GRPO (Reasoning-enhanced Group Relative Preference Optimization), an expert-grounded policy optimization algorithm, featuring a novel reward function critical for enhancing the logical coherence and verifiability of forensic analysis. Specifically, R-GRPO jointly optimizes (i) detection accuracy, (ii) reasoning stability, and (iii) multi-view consistency. The novel optimization enforces the MLLM to perform logical synthesis over explicit forensic evidence rather than simple visual pattern matching, thereby achieving accurate, reliable, and explainable forensic analysis.
In summary, our work makes three major contributions:
REVEAL-Bench. We pioneer the first reasoning-based and explainable dataset for AI-generated image detection. Unlike prior datasets that offer only post-hoc explanations, REVEAL-Bench is uniquely structured around expert-grounded, verifiable forensic evidence that embeds an explicit chain-of-evidence following a systematic evidence-then-reasoning paradigm.
REVEAL Framework. We introduce the REVEAL Framework, a progressive two-stage training paradigm designed to instill standardized and explainable reasoning in multimodal LLMs. Its core, R-GRPO, optimizes the MLLM to perform logical synthesis for forensic evidence, jointly enhancing accuracy, reasoning consistency, and generalization.
Empirical Performance. Our approach achieves superior detection accuracy, generalization, and explanation fidelity, benchmarking a new state of the art for reasoning-based forensic research.
## 2 Related Work
#### Detection of AI-Generated Fake Images
The rapid evolution of generative models, e.g., GANs [goodfellow2014gan, esser2021taming], autoregressive models [oord2017vqvae], diffusion-based models [esser2024rectifiedflow, song2020ddim, ho2020ddpm, gu2022vqdiffusion, saharia2022imagen, ji2025mllm], has driven AI-generated images to near-photorealistic quality, challenging conventional detection methods. Early forensic studies focused on traditional manipulations like splicing or copy-move, analyzing noise inconsistencies, boundary anomalies, or compression artifacts [zhou2018manipulation, li2022splicing]. Researchers then shifted focus to generation artifacts, such as up-sampling grid effects, texture mismatches, or abnormal high-frequency decay [frank2020frequency, liu2020texture, dzanic2020fourier]. For example, the Spectral Learning Detector [karageorgiou2025spectral] models the spectral distribution of authentic images, treating AI-generated samples as out-of-distribution anomalies, achieving consistent detection across generators. However, as generators incorporate post-processing techniques like super-resolution, these low-level statistical clues become increasingly subtle and less reliable for robust detection.
Recent methods employ general-purpose feature extractors, such as CNN- or ViT-based detectors, to learn discriminative features directly. While lightweight CNNs achieve strong benchmark performance [ladevic2024cnn], methods like the Variational Information Bottleneck (VIB) network [zhang2025vib] aim to enhance generalization by constraining feature representations through the information bottleneck principle to retain only task-relevant information. Post-hoc Distribution Alignment (PDA) [wang2025pda] attempts to improve robustness to unseen generators by aligning regenerated and real distributions to detect unseen generators. Recently, NPR [tan2024rethinking] has become a representative approach by capturing low-level artifacts, demonstrating strong generalization capability. Similarly, HyperDet [cao2024hyperdet] and AIDE [yan2024sanity] achieve robust generalization through high-frequency spectrum analysis. Despite their discriminatory power, these approaches remain limited in forensic value, as their conclusions rely on global statistics and lack the semantic, verifiable evidence required for comprehensive explainability.
#### Explainable AI-generated Image Detection
The emergence of MLLMs [liu2023visual, wang2024qwen2] has accelerated the development of explainable image forensics by leveraging their advanced cross-modal understanding [wu2024comprehensive, talmor2019commonsenseqa]. Early efforts reformulated detection as a Visual Question Answering (VQA) task [jia2024can, keita2025bi, chang2023antifakeprompt], allowing MLLMs to provide accompanying descriptive text. FatFormer [liu2024forgery] extended this with a forgery-aware adapter to improve generalization on the CLIP-ViT [radford2021learning] encoder.
Subsequent studies focused on constructing task-specific multimodal datasets for fine-tuning. FakeBench [li2025fakebench] and LOKI [ye2024loki] provide synthetic images with manually written, high-level forgery descriptions. Holmes-Set [zhou2025aigi] utilized small models for initial image filtering and a Multi-Expert Jury mechanism to generate postt-hoc explanatory texts. At the methodological level, FakeShield [xu2024fakeshield], ForgerySleuth [sun2024forgerysleuth], ForgeryGPT [liu2024forgerygpt] and SIDA [huang2025sida] fine-tune MLLMs to achieve explainable forgery detection and localization. AIGI-Holmes [zhou2025aigi] integrates low-level visual experts with reasoning modules. RAIDX [li2025raidx] combines retrieval-augmented generation (RAG) [lewis2020retrieval] with GRPO optimization to improve the ability to describe texts.
Critically, existing datasets and methods suffer from two key limitations: First, the explanations are attributed to post-hoc rationalizations, often relying on the MLLM’s general knowledge and visual classification capabilities, failing to achieve logical synthesis of specialized forensic evidence. Second, they lack structured, fine-grained forensic evidence required to support a verifiable causal link between low-level artifacts and the final forensic judgments.
## 3 REVEAL-Bench
<details>
<summary>x3.png Details</summary>
### Visual Description
## Diagram: Multi-Stage Image Forgery Detection Framework
### Overview
The image is a technical flowchart and process diagram illustrating a comprehensive framework for detecting synthetic or forged images. It details a pipeline that moves from data curation and expert filtering to evidence collection and final synthesis of a chain-of-evidence for a conclusive judgment. The diagram combines flowcharts, a circular data visualization, annotated example images, and a textual step-by-step analysis process.
### Components/Axes
The diagram is segmented into four primary regions:
1. **Top-Left: Data Curation & Pre-filtering**
* **Flowchart Elements:**
* Input Sources: "Chameleon Fake2M" and "Autoregressive GAN Diffusion".
* Process: "Pre-filtering" leading to "Expert Filtering (Lightweight Model as Expert)".
* Expert Filtering Criteria (listed in two columns):
* Left Column: "Local artifacts", "Spectral clues", "Pixel noise", "Spatial consistency".
* Right Column: "Geometry flaws", "Shadow logic", "Texture fusion", "High-pass fusion".
* **Circular Data Visualization (Sunburst Chart):**
* **Center Label:** "Image Dataset".
* **Inner Ring:** Divided into two halves:
* Top Half (Green): "Real" with count "30000".
* Bottom Half (Blue): "Fake" with count "30000".
* **Outer Ring:** Sub-categories for Real and Fake images, with associated counts. The legend is embedded as labels around the ring.
* **Real Sub-categories (Green segments, clockwise from top):**
* "COCO" (count: 10000)
* "CelebA-HQ" (count: 5000)
* "FFHQ" (count: 5000)
* "LSUN" (count: 5000)
* "MetFaces" (count: 2500)
* "其他" (Other) (count: 2500)
* **Fake Sub-categories (Blue segments, clockwise from bottom):**
* "StyleGAN" (count: 5000)
* "StyleGAN2" (count: 5000)
* "StyleGAN3" (count: 5000)
* "Diffusion" (count: 5000)
* "GigaGAN" (count: 5000)
* "其他" (Other) (count: 5000)
2. **Top-Right: Expert-grounded Evidence Collection**
* **Central Process:** "prompt design" connected to an icon of a person (the expert).
* **Input Clues (List in a box):** Same as the Expert Filtering criteria from the top-left section.
* **Output Examples (Speech Bubbles):** Three examples of expert analysis outcomes.
* **Bubble 1 (Top, Green Checkmark):** "The expert *successfully* detected that the image is synthetic. Please analyze the local artifacts in the image."
* **Bubble 2 (Middle, Green Checkmark):** "The expert *successfully* detected that the image is synthetic. Please analyze the forgery using spectral clues."
* **Bubble 3 (Bottom, Red X):** "The expert *failed* to detect that the image is synthetic. Please analyze it's authenticity using high-pass fusion."
* **Detailed Analysis Boxes (Right side):** Three boxes elaborating on specific clue types.
* **Box 1 (Top, Pink):** "Local artifacts: By observing the bird's eyes, we find that the *reflection of the eyeball* is missing."
* **Box 2 (Middle, Orange):** "Spectral clues: Periodic artifacts of the synthesized image are *revealed along the spectral axis*."
* **Box 3 (Bottom, Green):** "High-pass fusion: By examining the high-frequency map, it is observed that the area around the bird appears *smooth and contains no signs of forgery*."
* **LLM Icons:** Two circular icons labeled "LLM" are connected to the analysis boxes, suggesting a Large Language Model assists in generating these analyses.
3. **Bottom-Left: Chain-of-Evidence Synthesis**
* **Title:** "Chain-of-Evidence Synthesis".
* **Subtitle:** "visual evidence" with eye icons.
* **Image Grid:** A 2x2 grid of bird images with annotations.
* Top-left: A bird on a branch (original?).
* Top-right: The same bird with a green bounding box around its head.
* Bottom-left: A grayscale, high-frequency filtered version of the bird image.
* Bottom-right: A heatmap or spectral analysis visualization of the bird image, with a bright spot highlighted by a green box.
4. **Bottom-Right: Consolidated Analysis Process**
* **Flow Arrow:** A large curved arrow labeled "consolidate" points from the "Expert-grounded Evidence Collection" section to this box.
* **Text Block:** A detailed, numbered step-by-step analysis process enclosed in `<think>` and `<answer>` tags.
* **`<think>` Content:**
1. "Initial observation checks texture and lighting anomalies."
2. "Detailed inspection identifies uniform surfaces and missing imperfections."
3. "Spatial analysis compares object-background alignment and projection logic."
4. "Shadow consistency test detects overly perfect lighting patterns."
5. "High-frequency analysis examines fine-grain texture irregularities."
6. "Frequency spectrum evaluation reveals abnormal energy distributions."
7. "Synthesizing all clues, the image is determined to be synthetic."
* **`<answer>` Content:** "1" (This likely corresponds to a binary classification, e.g., 1 for "synthetic/fake").
### Detailed Analysis
* **Data Flow:** The process is linear and iterative. It starts with a curated dataset of 60,000 images (30k real, 30k fake from various sources). A lightweight "expert" model pre-filters images based on eight forgery clue categories. A more detailed, prompt-based expert (potentially an LLM) then collects evidence using these clues. The outcomes (success/failure) and specific findings (missing reflections, spectral artifacts) are documented. Visual evidence is synthesized, and all clues are consolidated into a final 7-step analytical narrative leading to a binary decision.
* **Language:** The primary language is English. The only non-English text is the Chinese characters "其他" (meaning "Other") found in two segments of the outer ring of the circular dataset chart.
* **Spatial Grounding:**
* The circular dataset chart is in the bottom-left quadrant of the top-left section.
* The "prompt design" expert icon is centrally located in the top-right section.
* The three detailed analysis boxes (Local artifacts, Spectral clues, High-pass fusion) are stacked vertically on the far right of the top-right section.
* The 2x2 image grid is in the bottom-left corner of the entire diagram.
* The consolidated analysis text block occupies the bottom-right quadrant.
### Key Observations
1. **Multi-Modal Evidence:** The framework relies on diverse evidence types: visual (local artifacts), signal-processing (spectral, high-frequency), and logical (shadow, geometry, spatial consistency).
2. **Expert-LLM Collaboration:** The diagram suggests a hybrid system where an "expert" model (possibly a vision model) performs detection, and an LLM assists in interpreting clues and generating explanatory text.
3. **Failure Case Included:** The diagram explicitly includes a failure case (the red X bubble), indicating the framework is designed to analyze and learn from its mistakes.
4. **Balanced Dataset:** The training/validation dataset is perfectly balanced (50% real, 50% fake) and sourced from a wide variety of both real-world (COCO, CelebA) and generative model (StyleGAN variants, Diffusion) origins.
5. **Synthesis is Key:** The final step is not just detection but the synthesis of a coherent "chain-of-evidence" narrative, moving from observation to conclusion.
### Interpretation
This diagram outlines a sophisticated, explainable AI system for image forgery detection. It moves beyond simple binary classification by:
* **Emphasizing Explainability:** Every detection is accompanied by a specific, human-readable reason (e.g., "missing eyeball reflection," "abnormal energy distributions"). This is crucial for trust and debugging.
* **Structured Reasoning:** The 7-step `<think>` process mirrors a forensic investigator's methodology, suggesting the system is designed to mimic and augment human expert reasoning.
* **Robustness Through Diversity:** By checking eight distinct clue categories, the system is less likely to be fooled by forgeries that might pass one type of test but fail another. The inclusion of a failure case highlights an ongoing challenge—some forgeries may appear "smooth" and lack high-frequency artifacts, requiring reliance on other, potentially subtler clues.
* **Practical Pipeline:** The flow from a large, curated dataset through pre-filtering to detailed analysis represents a scalable approach, where lightweight models handle initial screening, and more computationally expensive analysis is reserved for ambiguous cases.
The framework's core principle is that a conclusive judgment of forgery should be supported by a consolidated chain of multiple, independent pieces of visual and analytical evidence.
</details>
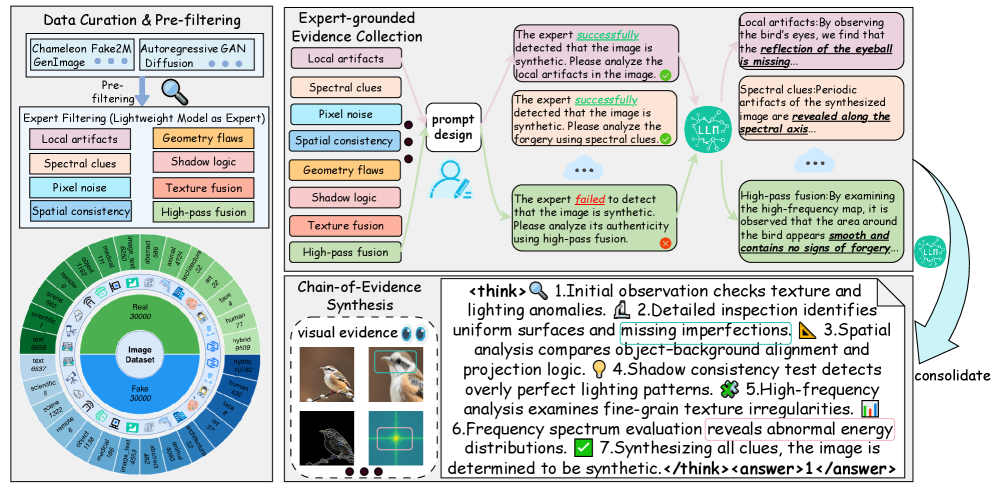
Figure 3: The pipeline of REVEAL-Bench. This figure illustrates our data processing pipeline, which consists of three stages: Data Curation & Pre-filtering, Expert-grounded Evidence Collection, and Chain-of-Evidence (CoE) Synthesis
As illustrated in Figure 3, this study constructs the REVEAL-Bench dataset through a rigorous, three-stage pipeline designed for reasoning-based image forensic: Data Curation & Pre-filtering, Expert-grounded Evidence Collection, and Chain-of-Evidence (CoE) Synthesis. This approach is fundamentally distinct as it replaces manual, subjective labeling with a process that systematically integrates verifiable evidence from specialized models with the logical synthesis capabilities of large vision-language models. The resulting dataset contains explicit, expert knowledge-grounded Chain-of-Evidence annotations, which is crucial for training forensic detectors with superior transparency and generalization capability.
#### Data Curation & Prefiltering
To ensure sufficient content, generator, and artifact diversity, we aggregate several prominent AI-generated detection benchmarks, including CNNDetection [wang2020cnn], UnivFD [ojha2023towards], AIGCDetectBenchmark [zhong2023patchcraft], GenImage [zhu2023genimage], Fake2M [lu2023seeing], and Chameleon [yan2024sanity]. This yielded in an initial corpus of approximately 5,120K synthetic images and 850K authentic images. To manage annotation costs while ensuring high data quality, we implemented a stratified sampling strategy based on automated quality assessments [talebi2018nima] and image resolution. Specifically, we sampled images based on aesthetic scores (50% high, 30% medium, 20% low), and image resolution, high-resolution ( $≥$ 512 $×$ 512) images at 50%, medium-resolution (384 $×$ 384–512 $×$ 512) images at 30%, and low-resolution ( $<$ 384 $×$ 384) images at 20%. Images were also semantically classified into 13 major categories (e.g., humans, architecture, artworks). After rigorous multi-stage filtering and preprocessing to eliminate non-representative or low-quality samples, we finalized a balanced corpus of 30K synthetic and 30K real images, which serves as the foundation for subsequent expert annotation
#### Expert-grounded Evidence Collection
To enable fine-grained, verifiable forensic analysis, we design and employ a set of eight lightweight and specialized expert models [li2025improving, sarkar2024shadows, tan2024rethinking, cao2024hyperdet, tan2024frequency, li2025optimized], each dedicated to screening and localizing a distinct category of synthetic artifact (as depicted in Figure 3). This is a crucial distinction from prior work, such as AIGI-Holmes [zhou2025aigi], which uses experts primarily for global filtering. Our experts, by contrast, provide structured, machine-readable evidence, including artifact masks and diagnostic labels. These eight outputs constitute the necessary forensic evidence foundation. By conditioning the LVLM on these high-fidelity, structured references, we ensure the final generated explanations are faithful, logically consistent, and verifiable against objective, low-level artifact data. This expert-grounded decompositional analysis effectively bridges the gap between small-model perception of artifacts and large-model logical reasoning.
<details>
<summary>x4.png Details</summary>
### Visual Description
\n
## Diagram: Two-Stage Training Process for Multimodal Large Language Model (MLLM) Image Authenticity Detection
### Overview
The image is a technical flowchart illustrating a two-stage training methodology for a Multimodal Large Language Model (MLLM) designed to determine whether a given image is real or synthetic. The process is divided into "Stage 1: CoE Tuning" and "Stage 2: R-GRPO," showing the flow of data, model processing, and reward mechanisms.
### Components/Axes
The diagram is split into two primary panels by a vertical dashed line.
**Left Panel: Stage 1: CoE Tuning**
* **Input Prompt:** A text box at the top reads: "Please help me determine whether this image is real or synthetic?"
* **Input Image:** A photograph of a small bird (appears to be a sparrow or similar species) is shown to the right of the prompt.
* **Visual Tokens:** Below the prompt and image are two rows of colored squares, likely representing visual embeddings or tokens.
* Top row: 5 orange squares.
* Bottom row: 5 yellow squares.
* **Model:** A rounded rectangle labeled "MLLM" with a flame icon (🔥) on its left side. Arrows from the prompt, image, and tokens point into this box.
* **Model Output:** A large text box below the MLLM contains a structured response:
* `<think>`
* `<answer> 1 </answer>`
* The phrase "synthetic traces" is highlighted in blue text.
* The number "1" in the answer tag is highlighted in orange text.
* **Loss Functions:** Two arrows point downward from the output box:
* A blue arrow labeled `L_think` originates from the `<think>` tag from Completion 1.
* Evaluation: A robot icon evaluates similarity. A decision diamond checks for "match", "similar", or "mismatch".
* Output: Green box "R=1" for match, yellow box "R=0.5" for similar, red box "R=0" for mismatch.
* **Multi-view alignment reward:**
* **Match Scenario (Green Checkmark):**
* Input Text: `<think>`
* The phrases "structural irregularities" and "high-frequency artifacts" are in blue text.
* Input Images: Four small thumbnail images showing different views/processing of the bird's eye (original, zoomed, possibly filtered).
* Evaluation: A robot icon assesses alignment between the textual description and the visual evidence across views.
* Output: Green box "R=1".
* **Mismatch Scenario (Red X):**
* Input Text: `<think>`
* The phrase "appears natural" is in red text, and "artifacts" is in blue text.
* Evaluation: The same robot icon assesses alignment.
* Output: Red box "R=0".
* **Feedback Loop:** A green arrow loops from the reward outputs back to the MLLM in the input stage, indicating a reinforcement learning update.
### Detailed Analysis
The diagram meticulously outlines a training pipeline.
**Stage 1 (CoE Tuning):** This stage focuses on teaching the MLLM to produce a structured "Chain of Evidence" (CoE) reasoning process (`<think>` tag) before giving a final binary classification (`<answer>` tag, where 1 likely means "synthetic"). The separate loss functions (`L_think` and `L_answer`) suggest the model is trained to optimize both the quality of its reasoning and the accuracy of its final answer.
**Stage 2 (R-GRPO):** This stage employs a reinforcement learning technique, likely "Reinforcement Learning with Group Relative Policy Optimization" (R-GRPO). It generates multiple candidate responses (Completions 1 to G) for a given input. Each completion is then scored by three complementary reward models:
1. **Answer Reward:** A simple binary check for factual correctness of the final answer.
2. **Think Reward:** Evaluates the quality and similarity of the reasoning chain against a reference or ideal reasoning path, allowing for partial credit (R=0.5).
3. **Multi-view Alignment Reward:** This is the most complex component. It verifies if the model's textual reasoning (e.g., "eyeball shows structural irregularities") is grounded in and consistent with visual evidence from multiple processed views of the image (e.g., zoomed, high-pass filtered). A mismatch between the textual claim and the visual evidence results in a zero reward.
### Key Observations
* **Structured Output Mandate:** The model is explicitly trained to separate its reasoning (`<think>`) from its conclusion (`<answer>`).
* **Multi-Faceted Evaluation:** The system doesn't just check if the answer is right; it scrutinizes *how* the model arrived at the answer, rewarding coherent, evidence-based reasoning.
* **Visual Grounding is Critical:** The "Multi-view alignment reward" is a key innovation. It forces the model's textual reasoning to be verifiable against visual data, combating hallucination. The example shows that claiming an eyeball looks "natural" while visual filters show artifacts leads to a penalty.
* **Color Coding for Clarity:** The diagram uses consistent color coding: green for correct/match (R=1), yellow/orange for partial credit or components (R=0.5, tokens, answer), and red for incorrect/mismatch (R=0). Blue text highlights key evidence phrases in the reasoning.
### Interpretation
This diagram describes a sophisticated training framework aimed at creating a more reliable and interpretable AI for detecting synthetic media. The core innovation lies in moving beyond simple answer-based training.
The **CoE Tuning** stage instills a habit of explicit, step-by-step reasoning. The **R-GRPO** stage then refines this behavior using reinforcement learning with a multi-dimensional reward signal. The most significant aspect is the **Multi-view Alignment Reward**, which directly addresses a major weakness of large language models: the potential for generating plausible-sounding but visually ungrounded text. By requiring the model's described evidence ("structural irregularities") to align with what can be seen in different image views, the system encourages the development of genuine visual understanding rather than pattern-matching on text alone.
The process suggests that for high-stakes tasks like authenticity detection, it is insufficient for an AI to simply be accurate. It must also be *explainable* in a way that is *verifiable* against the source data. This framework aims to produce models whose reasoning can be audited and trusted because it is tied to observable visual features.
</details>
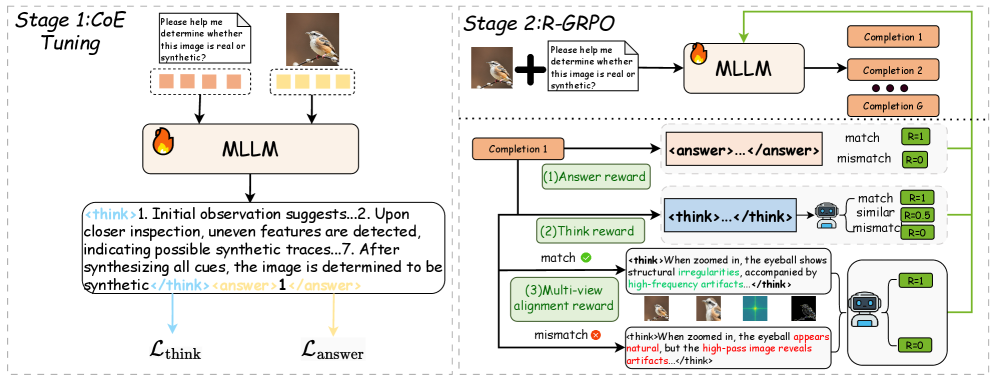
Figure 4: Overview of REVEAL. The pipeline mainly consists of two stages: CoE Tuning and R-GRPO.
#### Chain-of-Evidence Synthesis
As shown in Figure 3, after the specialized expert annotation, the initial eight rounds of multi-perspective diagnostic outputs are diverse and fragmented. To construct a unified and progressive reasoning dataset suitable for Chain-of-Thought (CoT) fine-tuning, we leverage a high-capacity LVLM (Qwen-2.5VL-72B [bai2025qwen2]) to perform structured knowledge consolidation. This process reconstructs the diverse, specialized evidence into a single, cohesive, and auditable reasoning trace, formatted using a standard <think> $⋯$ </think> $·$ <answer> $⋯$ </answer> structure.
Fundamentally distinct from existing datasets like AIGI-Holmes [zhou2025aigi] and FakeBench [li2025fakebench], which merely provide generic explanations, REVEAL-Bench explicitly formalizes the link between low-level expert evidence and high-level judgments. This two-stage pipeline transforms the detection tasks into a reasoning task, offering coherent CoE annotations that enhance logical consistency, minimizing annotation noise, and support supervision paradigms with advanced reinforcement learning techniques to improve explanation fidelity and generalization.
## 4 Methodology
### 4.1 Overview of REVEAL
As illustrated in Figure 4, the overall training pipeline adopts a two-stage progressive training paradigm inspired by advanced policy optimization-based reinforcement learning techniques [guo2025deepseek].
We first perform supervised fine-tuning (SFT) on a consolidated Chain-of-Evidence (CoE) dataset to obtain a base policy that can deduce the required forensic reasoning procedure. While this stage establishes the fundamental reasoning-based forensic structure, the resulting model still exhibits limitations in logical consistency, forensic accuracy, and robustness. To mitigate these limitations, we propose a novel reinforcement learning algorithm: R easoning- e nhanced Forensic E vid e nce A na l ysis (R-GRPO). R-GRPO extends beyond standard Group Relative Policy Optimization (GRPO) by incorporating a task-specific composite reward that dynamically aligns forensic reasoning trajectories and stabilizes policy updates, significantly enhancing semantic consistency and reasoning robustness.
### 4.2 Progressive Multimodal Training for AI-Generated Image Detection
We introduce REVEAL (Reasoning-enhanced Forensic Evidence AnaLysis), a progressive multimodal training framework comprising two sequential stages designed to cultivate robust, logically consistent, and verifiable forensic reasoning in multimodal models.
Stage 1: Chain-of-Evidence Tuning (CoE Tuning). In the initial stage, we perform cold-start supervised fine-tuning to establish a stable, stepwise reasoning policy and a consistent output paradigm built upon the REVEAL-Bench dataset. Let $x$ denote the visual input, $z=(z_1,\dots,z_T)$ denote the tokenized reasoning sequence (Chain-of-Evidence, CoE), and $y$ denote the final classification label. We adopt an explicit joint reasoning–decision modeling paradigm, where the final prediction $y$ is conditioned on the explicit reasoning trace $z$ . This formulation enforces a think-then-answer mechanism, fundamentally distinct from post-hoc rationalizations (e.g. modeling $p(y\mid x)$ and then $p(z\mid x,y)$ ), thereby achieving causally grounded genuine explanations.
Concretely, we factorize the joint conditional probability as
$$
p(y,z\mid x) = p(z\mid x) p(y\mid x,z), \tag{1}
$$
which structurally encourages the model to first generate verifiable reasoning evidence and subsequently derive the final prediction conditioned directly on that reasoning process.
Maximizing the likelihood under (1) corresponds to minimizing the following negative log-likelihood loss:
$$
L_NLL(x,y,z;θ) = -\log p_θ(z\mid x) - \log p_θ(y\mid x,z). \tag{2}
$$
For training control and to explicitly balance the emphasis on reasoning quality versus final decision accuracy, we decompose $L_NLL$ into two components, the reasoning generation loss $L_think$ and the answer loss $L_answer$ ,
$$
L_think = -∑_t=1^T\log p_θ(z_t\mid z_<t,x), \tag{3}
$$
$$
L_answer = -\log p_θ(y\mid x,z), \tag{4}
$$
We then employ a weighted composite SFT loss:
$$
L_SFT=\begin{aligned} &(1-α) L_think+α L_answer+η KL\big(π_pre\|π_θ\big).\end{aligned} \tag{5}
$$
where $α∈(0,1)$ controls the relative importance of the answer loss versus the reasoning trace, the KL regularization term constrains the fine-tuned policy $π_θ$ to remain proximal to the pretrained policy $π_pre$ , effectively mitigating catastrophic forgetting.
Stage 2: Reasoning-enhanced Group Relative Policy Optimization (R-GRPO).
Group Relative Policy Optimization (GRPO). Group Relative Policy Optimization (GRPO) is a reinforcement learning technique that stabilizes policy updates by comparing a group of candidate trajectories, rather than relying on the noisy reward signals of individual samples. Given an input $x$ , we sample a group of $K$ trajectories $\{τ_i\}_i=1^K$ from the current policy $π_θ$ , where each trajectory $τ_i$ consists of an intermediate reasoning trace $z_i$ and a final output $y_i$ . A group-based composite reward $R_group(τ_i)$ is computed for each trajectory, and the group-relative advantage $A_i$ is defined by subtracting the mean group reward $\overline{R}_group$ :
$$
\displaystyle A_i \displaystyle=R_group(τ_i)-\overline{R}_group, \displaystyle\overline{R}_group \displaystyle=\frac{1}{K}∑_j=1^KR_group(τ_j). \tag{6}
$$
The GRPO objective maximizes the expected group-relative log-probability, regularized by a KL penalty for stable policy convergence:
$$
\max_θ E\Big[∑_i=1^KA_i\logπ_θ(τ_i\mid x)\Big] - λ_KL KL\big(π_old\|π_θ\big). \tag{7}
$$
Reasoning-enhanced GRPO (R-GRPO). To employ GRPO for forensic analysis tasks, we propose R-GRPO, which augments the objective with a task-aware composite reward specifically designed to capture forensic fidelity and reasoning robustness. Let $y$ denote the generated answer, $y^∗$ the reference answer, $z=(z_1,\dots,z_T)$ the reasoning tokens, and $\{v_m(x)\}_m=1^M$ a set of multi-visual visual evidence (e.g., spectral representations, high-pass filtered images, and localized artifact patches).
Rationale for Agent-based Reward Modeling. In preliminary experiments, we observed that simple metric-based rewards (e.g. using cosine similarity of sentence embeddings for $r_sem$ ) fail to adequately reflect the semantic and contextual logic required for high-quality forensic explanations. Therefore, we introduce a dedicated large language model as an intelligent agent (Agent) to evaluate responses. This Agent-based assessment considers contextual logic, explanation coherence, and factual consistency against the provided structured evidence, thereby generating a more human-aligned and interpretable reward signal than purely metric-based approaches (see Appendix A for details).
R-GRPO defines three complementary, evidence-driven reward components:
(1) Answer Reward $r_sem$ . This binary reward ensures the accuracy of the detection:
$$
r_sem(y,y^∗)=\begin{cases}1,&if y=y^∗,\\
0,&otherwise.\end{cases} \tag{8}
$$
(2) Think Reward $r_think$ . This reward quantifies the quality and structural integrity of the reasoning trace $z$ .
Let $z=(z_1,\dots,z_T)$ be the generated reasoning trace and $z^∗=(z^∗_1,\dots,z^∗_T^∗)$ the ground-truth reasoning trace (when available). Define a perturbed trace $\tilde{z}=(z)$ . Then
$$
r_think(z,z^∗,\tilde{z}) = A_sem(z,z^∗)+A_logic(z,\tilde{z}), \tag{9}
$$
where $A_sem$ measures alignment between the generated and reference reasoning, and $A_logic(z,\tilde{z})$ evaluates the logical coherence of the trace. Crucially, $A_logic$ evaluates the logical coherence by penalizing the model if minor structural perturbations $\tilde{z}$ severely alter the inferred conclusion. This mechanism forces the model to maintain sequential consistency and ensure the reasoning steps are robustly connected.
(3) Multi-view Alignment Reward $r_view$ . This reward encourages the generated reasoning trace $z$ to be robustly grounded in evidence that persists across different forensic views of the image.
$$
r_view(z,x) = A_view\Big(z,\{v_m(x)\}_m=1^M\Big), \tag{10}
$$
where $A_view$ measures fidelity of the reasoning to the multi-view visual evidence $\{x_m\}$ . By requiring alignment with evidence visible under different transformations (e.g., spectral, high-pass), this reward promotes cross-artifact generalization and enables the self-supervised discovery of novel, transformation-invariant artifacts.
The composite trajectory reward $R(τ)$ combines these terms:
$$
\displaystyle R(τ)= \displaystyleλ_sr_sem(y,y^∗)+λ_tr_think(z,z^∗,\tilde{z}) \displaystyle+λ_vr_view(z,x), \tag{11}
$$
where $λ_s,λ_t,λ_v≥ 0$ are tunable parameters balancing the rewards. For improved stability, rewards are standardized within each sampled group before calculating the advantage $\widehat{A}_i$ :
$$
\widehat{R}(τ_i)=\frac{R(τ_i)-μ_group}{σ_group}, \tag{12}
$$
$$
μ_group=\frac{1}{K}∑_jR(τ_j), \tag{13}
$$
$$
σ_group=std(\{R(τ_j)\}) \tag{14}
$$
and the normalized group-relative advantage is
$$
\widehat{A}_i=\widehat{R}(τ_i)-\frac{1}{K}∑_j\widehat{R}(τ_j). \tag{15}
$$
Unified GRPO with the R-GRPO objective. Combining the original GRPO formulation (7) with the R-GRPO composite reward (11), the unified optimization objective becomes
$$
\max_θ E\Big[∑_i=1^K\widehat{A}_i\logπ_θ(τ_i\mid x)\Big] - λ_KL KL\big(π_old\|π_θ\big), \tag{16}
$$
where $\widehat{A}_i$ encodes both the group-relative comparison and the reasoning-enhanced composite reward.
This evidence-enhanced reward signals can effectively guide the model to optimize its reasoning trajectories, enforcing both stability and logical coherence in verifiable forensic evidence analysis.
## 5 Experiments
### 5.1 Experimental Settings
TABLE I: Comparison of REVEAL-bench with previous datasets. REVEAL-bench is the first reasoning dataset for synthetic image detection.
Dataset #Image Explanation Multiview Fusion Reasoning Process CNNDetection [wang2020cnn] 720k ✗ ✗ ✗ GenImage [zhu2023genimage] 1M ✗ ✗ ✗ FakeBench [li2025fakebench] 6K ✓ ✗ ✗ Holmes-Set [zhou2025aigi] 69K ✓ ✓ ✗ REVEAL-bench 60K ✓ ✓ ✓
To comprehensively evaluate the performance of REVEAL, we conduct experiments on two datasets: REVEAL-Bench and GenImage [zhu2023genimage] (see Table I). REVEAL-Bench, the first chain-of-evidence-based explainable dataset for synthetic image detection, serves as the in-domain dataset for training and evaluation. GenImage, a large-scale synthetic image dataset containing images generated by multiple generation methods, is used as an out-of-domain dataset to assess generalization. We train REVEAL on REVEAL-Bench and systematically evaluate its performance on both datasets (see Appendix B for detailed training settings). Building on this evaluation setup, we further investigate several core aspects of REVEAL’s capabilities. In particular, we study the impact of different MLLMs used as vision–language backbones, conduct ablation experiments to quantify the contribution of R-GRPO, and assess the model’s robustness under diverse perturbation settings. Appendix C reports the few-shot training results, and Appendix D provides a systematic comparison with existing large-scale model-based detectors.
Baselines We compare REVEAL with state-of-the-art AI-generated image detection methods, including CNNSpot [wang2020cnn], UnivFD [ojha2023towards], NPR [tan2024rethinking], HyperDet [cao2024hyperdet], AIDE [yan2024sanity] and VIB-Net [zhang2025towards]. To ensure a fair comparison, we retrain these methods using the official code under the same experimental settings and datasets.
Evaluation metrics Following existing research, we adopt Accuracy (ACC) as our evaluation metric. Accuracy is defined as the proportion of correctly predicted samples among the total number of samples, reflecting the overall correctness of a classification model. Since our detection results are provided by the MLLM in textual form (Real/Fake), we convert these texts into binary labels to compute accuracy, while baseline methods use the default thresholds provided by their official code. Moreover, because the output of the MLLM is interpretable text rather than logit values, we do not consider metrics that require logit values for computation, such as Average Precision (AP), in our evaluation.
### 5.2 Generalization across datasets
TABLE II: REVEAL demonstrates superior generalization across both in-domain and out-of-domain evaluations. REVEAL outperforms the best competing method by 3.87 %.
| CNNSpot [wang2020cnn] UnivFD [ojha2023towards] NPR [tan2024rethinking] | 87.80 86.95 95.40 | 62.45 75.00 84.80 | 74.25 84.35 88.85 | 73.85 80.95 88.05 | 63.55 85.50 85.10 | 73.60 71.75 94.30 | 73.70 82.00 87.05 | 71.35 80.70 84.45 | 39.45 88.45 88.95 | 68.89 81.74 88.55 |
| --- | --- | --- | --- | --- | --- | --- | --- | --- | --- | --- |
| HyperDet [cao2024hyperdet] | 93.25 | 68.40 | 91.85 | 92.30 | 100.0 | 67.05 | 89.20 | 80.45 | 57.65 | 82.24 |
| AIDE [yan2024sanity] | 95.25 | 79.90 | 95.90 | 94.95 | 87.75 | 90.35 | 94.85 | 90.10 | 91.10 | 91.13 |
| VIB-Net [zhang2025towards] | 67.05 | 53.25 | 60.25 | 57.85 | 65.00 | 68.55 | 60.85 | 52.55 | 38.00 | 58.15 |
| REVEAL | 95.31 | 93.75 | 97.81 | 97.19 | 95.00 | 86.88 | 96.25 | 95.94 | 96.88 | 95.00 |
Table II reports the performance of REVEAL on the in-domain dataset REVEAL-bench and the out-of-domain benchmark GenImage. The results indicate that REVEAL, leveraging a Chain-of-Evidence (CoE) reasoning-and-forensics mechanism, achieves superior cross-domain generalization compared to baseline lightweight binary classifiers: it maintains higher accuracy and more stable performance on GenImage. In the in-domain setting, smaller classifiers, such as those using methods like NPR [tan2024rethinking] and AIDE [yan2024sanity], are more prone to overfitting, demonstrating stronger fitting ability to domain-specific statistical regularities and subtle signals. As a result, REVEAL’s performance in-domain is comparable to that of these compact models. However, REVEAL excels in terms of cross-domain generalization. These findings suggest that while smaller models remain attractive for tasks prioritizing computational efficiency and in-domain accuracy, REVEAL better preserves and propagates key reasoning cues across domains. Therefore, there is a clear trade-off between generalization and domain-specific fit that should inform deployment choices. Notably, in the context of synthetic-image detection, reasoning-based forensic approaches, like REVEAL, exhibit particularly robust generalization.
### 5.3 Generalization across Base MLLMs
TABLE III: Performance across different MLLMs, showing larger models exhibit consistently stronger detection capability.
Training Scheme Phi-3.5 Qwen2.5- VL-3b Qwen2.5- VL-7b llava- v1.5-7b llava- v1.5-13b CoE Tuning 83.75 87.18 85.73 91.56 93.06 CoE Tuning+G-GRPO 87.19 89.06 92.19 92.81 95.31
The proposed algorithm in this study demonstrates strong generalizability and can be flexibly applied to a variety of multimodal large model architectures. To validate the effectiveness of our method, we conduct experiments using Qwen2.5-VL [bai2025qwen2], LLaVA-1.5-VL [liu2023visual], and Phi-3.5 as representative training frameworks. As shown in Table III, the results indicate that our approach achieves excellent detection performance and robust generalization across different multimodal large models.
Furthermore, we observe that as the model size increases, the detection capability improves significantly. This trend suggests the existence of a scaling law for synthetic image detection within the context of large models, similar to other tasks in the large model domain. As multimodal models continue to grow, their ability to handle complex tasks such as synthetic image detection becomes increasingly effective, demonstrating a direct correlation between model scale and performance.
### 5.4 Ablation Studies
TABLE IV: Ablation study of the impact of CoE Tuning, GRPO, and R-GRPO on model accuracy on REVEAL-Bench.
| ✗ | ✗ | ✗ | 61.21 |
| --- | --- | --- | --- |
| ✓ | ✗ | ✗ | 85.73 |
| ✓ | ✓ | ✗ | 91.56 |
| ✓ | ✗ | ✓ | 95.31 |
We conducted ablation experiments to investigate the role of reasoning datasets in synthetic image detection. As shown in Table IV, we first evaluated the performance of models trained without reasoning data (i.e., non-Reasoning SFT) and compared them with models fine-tuned using reasoning data (i.e., CoE Tuning). Additionally, we tested the effects of applying simple GRPO and our proposed R-GRPO method on performance improvement. The experimental results demonstrate that reasoning datasets significantly enhance the performance of MLLMs in synthetic image detection, with models lacking reasoning data performing close to random levels. Moreover, applying G-GRPO further improved the performance, highlighting the critical role of R-GRPO in this task.
### 5.5 Robustness Evaluation of REVEAL
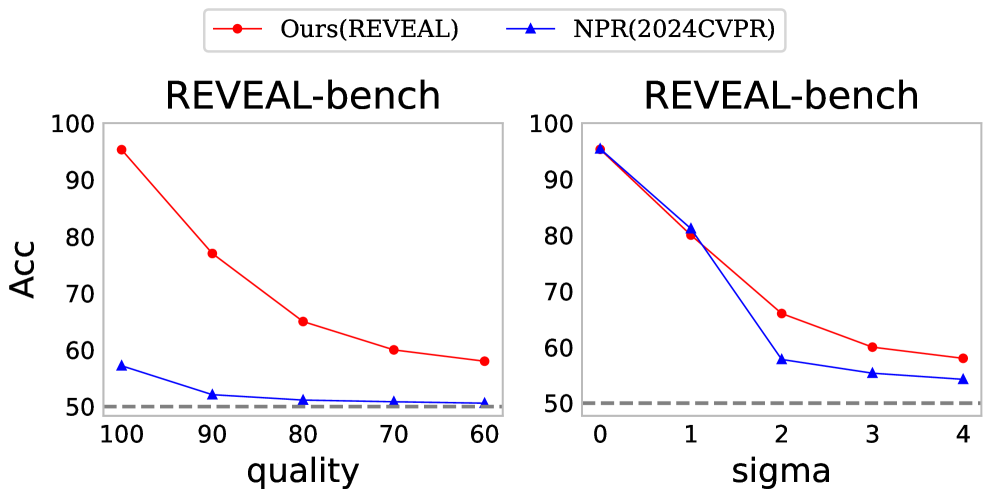
<details>
<summary>x5.png Details</summary>
### Visual Description
\n
## Line Charts: REVEAL-bench Performance Comparison
### Overview
The image displays two side-by-side line charts comparing the performance of two methods, "Ours(REVEAL)" and "NPR(2024CVPR)", on the "REVEAL-bench" benchmark. The charts plot accuracy ("ACC") against two different independent variables: "quality" (left chart) and "sigma" (right chart). A legend is positioned at the top center of the entire figure.
### Components/Axes
* **Legend:** Located at the top center, spanning both charts.
* Red line with circular markers: `Ours(REVEAL)`
* Blue line with triangular markers: `NPR(2024CVPR)`
* **Left Chart:**
* **Title:** `REVEAL-bench` (centered above the plot area).
* **Y-axis:** Label is `ACC`. Scale ranges from 50 to 100, with major ticks at 50, 60, 70, 80, 90, 100.
* **X-axis:** Label is `quality`. The scale is descending, with major ticks at 100, 90, 80, 70, 60.
* **Baseline:** A dashed gray horizontal line is present at y=50.
* **Right Chart:**
* **Title:** `REVEAL-bench` (centered above the plot area).
* **Y-axis:** Label is `ACC`. Scale is identical to the left chart (50 to 100).
* **X-axis:** Label is `sigma`. Scale is ascending, with major ticks at 0, 1, 2, 3, 4.
* **Baseline:** A dashed gray horizontal line is present at y=50.
### Detailed Analysis
**Left Chart (ACC vs. quality):**
* **Trend Verification:**
* **Ours(REVEAL) [Red Line]:** Shows a strong, consistent downward slope. Accuracy decreases significantly as the `quality` value decreases (moves from 100 to 60).
* **NPR(2024CVPR) [Blue Line]:** Shows a very shallow downward slope, remaining relatively flat and close to the baseline.
* **Data Points (Approximate):**
* **quality=100:** Ours ≈ 96, NPR ≈ 57
* **quality=90:** Ours ≈ 77, NPR ≈ 52
* **quality=80:** Ours ≈ 65, NPR ≈ 51
* **quality=70:** Ours ≈ 60, NPR ≈ 51
* **quality=60:** Ours ≈ 58, NPR ≈ 50
**Right Chart (ACC vs. sigma):**
* **Trend Verification:**
* **Ours(REVEAL) [Red Line]:** Shows a downward slope that is steepest between sigma=0 and sigma=2, then becomes more gradual.
* **NPR(2024CVPR) [Blue Line]:** Also shows a downward slope, with a very steep drop between sigma=1 and sigma=2, after which it flattens.
* **Data Points (Approximate):**
* **sigma=0:** Ours ≈ 96, NPR ≈ 96 (lines overlap)
* **sigma=1:** Ours ≈ 80, NPR ≈ 81
* **sigma=2:** Ours ≈ 66, NPR ≈ 58
* **sigma=3:** Ours ≈ 60, NPR ≈ 55
* **sigma=4:** Ours ≈ 58, NPR ≈ 54
### Key Observations
1. **Performance Gap:** The "Ours(REVEAL)" method consistently outperforms "NPR(2024CVPR)" in terms of accuracy across all tested conditions in both charts, except at sigma=0 and sigma=1 in the right chart where performance is nearly identical.
2. **Sensitivity to Quality:** The left chart reveals that "Ours(REVEAL)" is highly sensitive to the `quality` parameter, with accuracy dropping by approximately 38 percentage points as quality decreases from 100 to 60. In contrast, "NPR(2024CVPR)" is largely insensitive, dropping only about 7 points over the same range.
3. **Sensitivity to Sigma:** Both methods degrade as `sigma` increases. The degradation is most severe for both between sigma=1 and sigma=2. After sigma=2, the rate of decline slows for both, but "Ours(REVEAL)" maintains a consistent lead of about 5-8 accuracy points.
4. **Baseline Proximity:** In the left chart, the "NPR(2024CVPR)" method's performance hovers just above the 50% baseline (random guess level) for most quality values, indicating very limited effectiveness under those conditions.
### Interpretation
The data suggests a fundamental trade-off and difference in robustness between the two methods.
* **The "Ours(REVEAL)" method** appears to be a higher-capacity model that achieves superior peak performance (at high quality/low sigma) but is more susceptible to performance degradation as input conditions worsen (lower quality, higher sigma). Its steep decline in the left chart indicates its effectiveness is heavily dependent on high-quality input data.
* **The "NPR(2024CVPR)" method** demonstrates lower peak performance but greater stability, particularly against variations in the `quality` parameter. Its flat line in the left chart suggests it may be a simpler or more regularized model that is less affected by input quality but also cannot leverage high-quality inputs to achieve high accuracy.
* **The sigma parameter** appears to represent a form of noise or difficulty scaling that negatively impacts both models. The fact that both models start at the same point (sigma=0) and then diverge suggests that "Ours(REVEAL)" has a better inherent mechanism for handling this specific type of perturbation, allowing it to maintain a performance advantage as difficulty increases.
In summary, the charts position "Ours(REVEAL)" as the more powerful but sensitive method, while "NPR(2024CVPR)" is a more stable but lower-performance baseline. The choice between them would depend on whether the application prioritizes maximum accuracy under ideal conditions or consistent, albeit lower, performance across a wider range of input qualities.
</details>
Figure 5: The accuracy comparison between the two methods under various perturbation conditions.
To evaluate the robustness of REVEAL against common post-processing distortions, we conducted a systematic robustness study on the REVEAL-bench dataset. The experiments apply two typical post-processing operations to the original test images: Gaussian blur ( $σ=1,2,3,4$ ) and JPEG compression (quality = 90, 80, 70, 60). For each distortion level, we compare REVEAL with the state-of-the-art baseline methods (results are shown in Figure 5). The results indicate that REVEAL demonstrates stronger robustness and improved cross-domain generalization across the considered post-processing settings.
## 6 Conclusion
We presented REVEAL, a reasoning-centered approach for explainable AI-generated image detection. First, we introduced REVEAL-Bench, the first dataset organized around expert-grounded, verifiable forensic evidence and an explicit chain-of-evidence following an evidence-then-reasoning paradigm. Second, we proposed the REVEAL Framework, a progressive two-stage training scheme whose core component R-GRPO explicitly teaches multimodal LLMs to perform logical synthesis over forensic evidence, jointly improving accuracy, reasoning consistency, and generalization. Empirically, REVEAL attains superior detection accuracy, stronger out-of-domain generalization, and higher explanation fidelity, establishing a new state of the art for reasoning-based image forensics.