# Nanbeige4-3B Technical Report: Exploring the Frontier of Small Language Models
**Authors**: Nanbeige LLM Lab, Boss Zhipin
<details>
<summary>x1.png Details</summary>

### Visual Description
Icon/Small Image (195x51)
</details>
## Abstract
We present Nanbeige4-3B, a family of small-scale but high-performing language models. Pretrained on 23T high-quality tokens and finetuned on over 30 million diverse instructions, we extend the boundary of the scaling law for small language models. In pre-training, we design a Fine-Grained Warmup-Stable-Decay (FG-WSD) training scheduler, which progressively refines data mixtures across stages to boost model performance. In post-training, to improve the quality of the SFT data, we design a joint mechanism that integrates deliberative generation refinement and chain-of-thought reconstruction, yielding substantial gains on complex tasks. Following SFT, we employ our flagship reasoning model to distill Nanbeige4-3B through our proposed Dual Preference Distillation (DPD) method, which leads to further performance gains. Finally, a multi-stage reinforcement learning phase was applied, leveraging verifiable rewards and preference modeling to strengthen abilities on both reasoning and human alignment. Extensive evaluations show that Nanbeige4-3B not only significantly outperforms models of comparable parameter scale but also rivals much larger models across a wide range of benchmarks. The model checkpoints are available at https://huggingface.co/Nanbeige.
<details>
<summary>figures/nbg_performance.png Details</summary>
### Visual Description
## Bar Chart Composite: AI Model Benchmark Performance
### Overview
The image displays a composite of eight bar charts, organized into four thematic categories, comparing the performance of six different AI models across various standardized benchmarks. The models compared are: **Nanbeige4-3B** (highlighted in teal), **Qwen3-4B-2507**, **Qwen3-8B**, **Qwen3-14B**, **Qwen3-32B**, and **Qwen3-30B-A3B-2507** (all in shades of gray). The charts are grouped under the headings: Mathematical Reasoning, Scientific Reasoning, Tool Use & Coding, and Human Preference Alignment.
### Components/Axes
* **Chart Structure:** Eight individual bar charts arranged in a 2x4 grid.
* **Categories (Top Headers):**
* Top Left: **Mathematical Reasoning**
* Top Right: **Scientific Reasoning**
* Bottom Left: **Tool Use & Coding**
* Bottom Right: **Human Preference Alignment**
* **Sub-Charts (Benchmark Titles):**
* Under Mathematical Reasoning: **AIME 2024**, **AIME 2025**
* Under Scientific Reasoning: **GPQA-Diamond**, **SuperGPQA**
* Under Tool Use & Coding: **BFCL-v4**, **Fullstack Bench**
* Under Human Preference Alignment: **ArenaHard-V2**, **Multi-Challenge**
* **X-Axis (All Charts):** Lists the six model names. The labels are rotated approximately 45 degrees for readability.
* **Y-Axis (All Charts):** Represents the benchmark score. The scale is not explicitly numbered with ticks, but the numerical value is printed directly above each bar.
* **Legend/Color Key:**
* **Teal Bar:** Nanbeige4-3B
* **Gray Bars (from left to right):** Qwen3-4B-2507, Qwen3-8B, Qwen3-14B, Qwen3-32B, Qwen3-30B-A3B-2507.
### Detailed Analysis
#### **Mathematical Reasoning**
1. **AIME 2024:**
* Nanbeige4-3B: **90.4** (Highest)
* Qwen3-4B-2507: **83.3**
* Qwen3-8B: **76.0**
* Qwen3-14B: **79.3**
* Qwen3-32B: **81.4**
* Qwen3-30B-A3B-2507: **89.2** (Second highest)
* *Trend:* Nanbeige4-3B leads, followed closely by the largest Qwen model (30B-A3B). Performance dips for the mid-sized Qwen models (8B, 14B, 32B).
2. **AIME 2025:**
* Nanbeige4-3B: **85.6** (Highest)
* Qwen3-4B-2507: **81.3**
* Qwen3-8B: **67.3**
* Qwen3-14B: **70.4**
* Qwen3-32B: **72.9**
* Qwen3-30B-A3B-2507: **85.0** (Very close second)
* *Trend:* Similar pattern to AIME 2024. Nanbeige4-3B and Qwen3-30B-A3B-2507 are nearly tied at the top, with a significant drop for the 8B, 14B, and 32B models.
#### **Scientific Reasoning**
1. **GPQA-Diamond:**
* Nanbeige4-3B: **82.2** (Highest)
* Qwen3-4B-2507: **67.2**
* Qwen3-8B: **62.0**
* Qwen3-14B: **64.0**
* Qwen3-32B: **68.7**
* Qwen3-30B-A3B-2507: **73.4**
* *Trend:* Clear lead for Nanbeige4-3B. Performance generally increases with model size within the Qwen series, but all are below Nanbeige4-3B.
2. **SuperGPQA:**
* Nanbeige4-3B: **53.2** (Highest)
* Qwen3-4B-2507: **46.7**
* Qwen3-8B: **39.1**
* Qwen3-14B: **46.8**
* Qwen3-32B: **54.1** (Slightly higher than Nanbeige4-3B)
* Qwen3-30B-A3B-2507: **56.8** (Highest)
* *Trend:* This is the only benchmark where a Qwen model (Qwen3-30B-A3B-2507) clearly outperforms Nanbeige4-3B. Qwen3-32B also scores slightly higher. The smallest Qwen model (8B) performs notably worse.
#### **Tool Use & Coding**
1. **BFCL-v4:**
* Nanbeige4-3B: **53.8** (Highest)
* Qwen3-4B-2507: **44.9**
* Qwen3-8B: **42.2**
* Qwen3-14B: **45.4**
* Qwen3-32B: **47.9**
* Qwen3-30B-A3B-2507: **48.6**
* *Trend:* Nanbeige4-3B holds a clear lead. Performance among Qwen models improves with scale but remains below Nanbeige4-3B.
2. **Fullstack Bench:**
* Nanbeige4-3B: **48.0**
* Qwen3-4B-2507: **47.1**
* Qwen3-8B: **51.5**
* Qwen3-14B: **55.7**
* Qwen3-32B: **58.2** (Highest)
* Qwen3-30B-A3B-2507: **54.4**
* *Trend:* This benchmark shows a different pattern. Nanbeige4-3B is not the leader. Performance generally increases with Qwen model size, peaking at Qwen3-32B.
#### **Human Preference Alignment**
1. **ArenaHard-V2:**
* Nanbeige4-3B: **60.0** (Tied for Highest)
* Qwen3-4B-2507: **40.5**
* Qwen3-8B: **26.4** (Lowest across all charts)
* Qwen3-14B: **39.9**
* Qwen3-32B: **48.4**
* Qwen3-30B-A3B-2507: **60.0** (Tied for Highest)
* *Trend:* Nanbeige4-3B and Qwen3-30B-A3B-2507 are tied at the top. There is a very sharp drop for the Qwen3-8B model.
2. **Multi-Challenge:**
* Nanbeige4-3B: **41.2**
* Qwen3-4B-2507: **41.8** (Slightly higher than Nanbeige4-3B)
* Qwen3-8B: **35.8**
* Qwen3-14B: **36.4**
* Qwen3-32B: **39.2**
* Qwen3-30B-A3B-2507: **49.4** (Highest)
* *Trend:* Qwen3-30B-A3B-2507 is the clear leader. Nanbeige4-3B is competitive but slightly outperformed by the smaller Qwen3-4B-2507.
### Key Observations
1. **Nanbeige4-3B Dominance:** The Nanbeige4-3B model (teal) achieves the highest score in 6 out of the 8 benchmarks presented (AIME 2024, AIME 2025, GPQA-Diamond, SuperGPQA, BFCL-v4, ArenaHard-V2).
2. **Strongest Competitor:** The **Qwen3-30B-A3B-2507** model is the most consistent high performer among the Qwen series, often coming in a close second or even surpassing Nanbeige4-3B (as in SuperGPQA, Fullstack Bench, and Multi-Challenge).
3. **Performance vs. Scale (Qwen Series):** Within the Qwen models, performance generally improves with increasing parameter size (from 4B to 32B), but this is not perfectly linear. The 30B-A3B-2507 variant often outperforms the standard 32B model.
4. **Notable Low Point:** The **Qwen3-8B** model shows a significant performance dip, particularly in the ArenaHard-V2 benchmark where it scores only 26.4, the lowest value in the entire composite.
5. **Benchmark Variability:** No single model dominates every category. The relative performance shifts between mathematical, scientific, coding, and alignment-focused tasks.
### Interpretation
This composite chart provides a comparative snapshot of AI model capabilities across a diverse evaluation suite. The data suggests that **Nanbeige4-3B** is a highly capable and well-rounded model, excelling particularly in reasoning-heavy tasks (Math, Science, GPQA). Its strength in the ArenaHard-V2 benchmark also indicates good alignment with human preferences.
The **Qwen3 series** demonstrates a clear scaling law, with larger models generally performing better. The **Qwen3-30B-A3B-2507** variant appears to be a particularly efficient or well-tuned architecture, as it frequently matches or beats the larger standard 32B model and competes directly with Nanbeige4-3B. Its victory in the **Multi-Challenge** benchmark suggests superior handling of diverse, complex tasks.
The poor showing of **Qwen3-8B** on ArenaHard-V2 is an outlier that may indicate a specific weakness in that model's alignment or a mismatch with that particular benchmark's evaluation criteria. Overall, the charts illustrate that model performance is highly task-dependent, and choosing the "best" model requires considering the specific application domain (e.g., math vs. coding vs. general assistant tasks). The visualization effectively communicates these nuanced comparisons through clear, direct score labeling and consistent color coding.
</details>
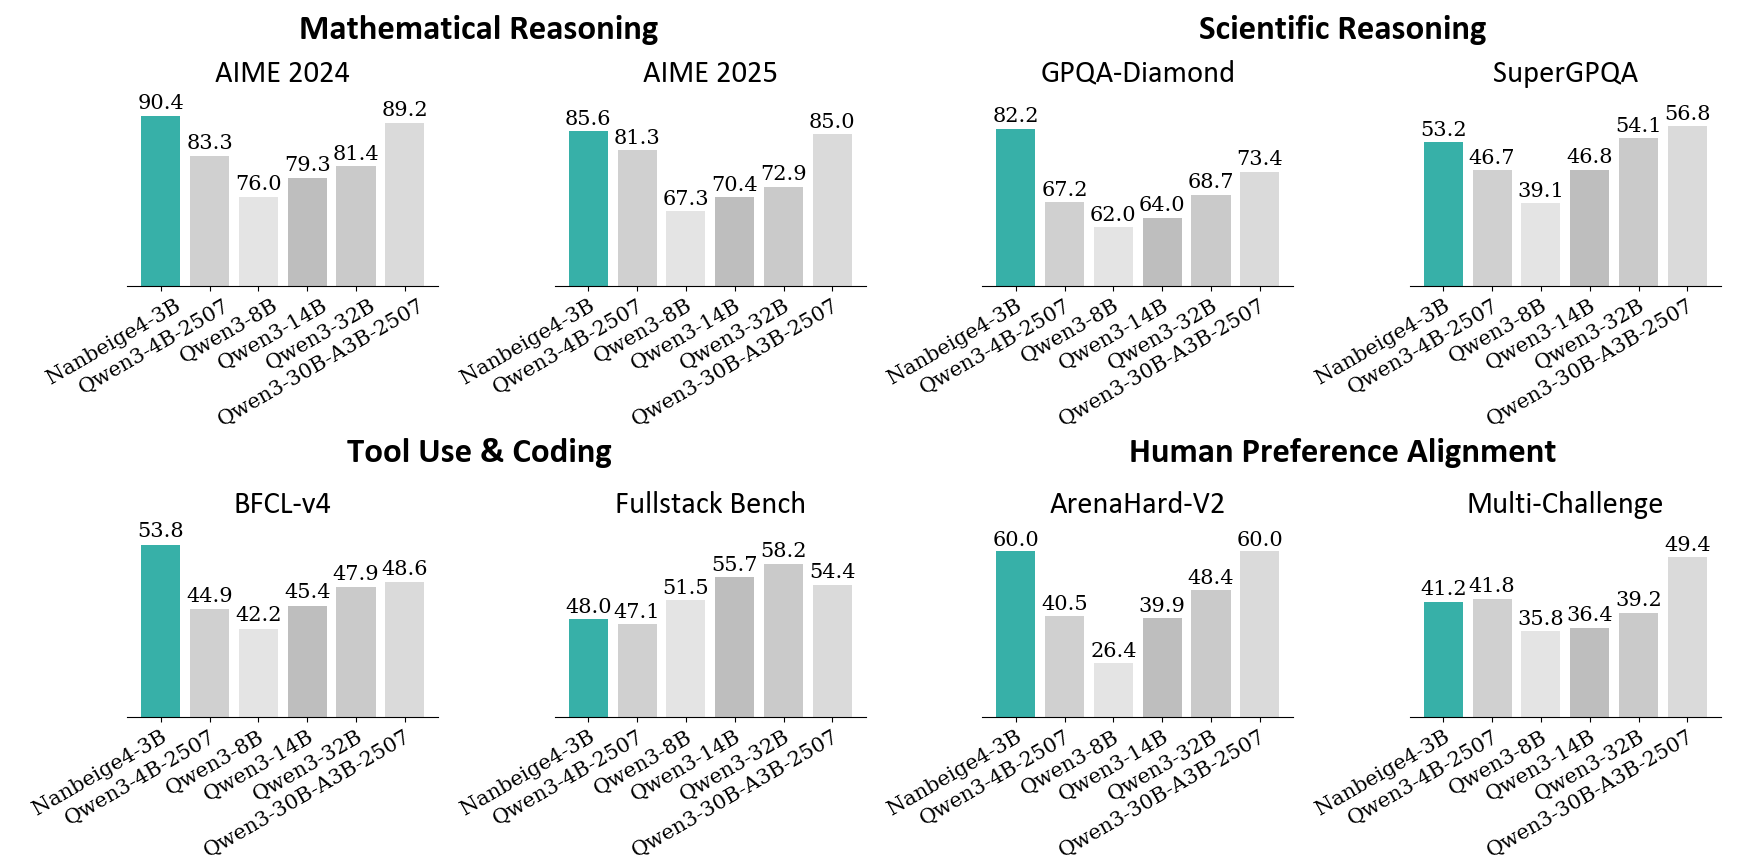
Figure 1: Performance Comparison between Nanbeige4-3B-Thinking and Qwen series models.
## 1 Introduction
In recent years, we have witnessed the emergence of capable large-scale language models ranging from hundreds of billions to trillions of parameters yang2025qwen3; DBLP:journals/corr/abs-2508-06471; deepseekai2025deepseekr1incentivizingreasoningcapability; lingteam2025activationboostedscalinggeneral. They have demonstrated remarkable reasoning abilities and have become a pivotal driving force in the evolution of artificial intelligence. Despite their impressive performance, these models come with substantial inference costs in deployment and high training expenses for research, whether for full-scale replication or fine-tuning. This scenario underscores the importance of exploring the potential of Small Language Models (SLMs) as a resource-efficient alternative.
In this work, we present the Nanbeige4-3B model family. Despite their compact size, they exhibit remarkably strong and well-balanced capabilities in mathematics, scientific reasoning, human preference alignment, creative writing, and tool use—substantially outperforming many larger models. These results highlight the effectiveness of our training methodology and clearly demonstrate that small, well-engineered models can achieve performance that surpasses far larger models.
To provide a clear sense of the model’s capability, we compare Nanbeige4-3B against the Qwen3 series across multiple parameter scales. For the base models, we conduct several post-training runs using identical SFT datasets, where Nanbeige4-3B-Base significantly outperforms Qwen3-8B-Base. For the reasoning model, Nanbeige4-3B-Thinking demonstrates overall performance that surpasses Qwen3-14B on average. Notably, it even outperforms the substantially larger Qwen3-32B and Qwen3-30B-A3B on mathematical and scientific reasoning, as well as on specific dimensions concerning tool use and human preference alignment. Moreover, in terms of creative writing ability, Nanbeige4-3B-Thinking approaches the performance of several state-of-the-art large models, as elaborated in the WritingBench Leaderboard November 2025.
Table 1: Performance comparison between Nanbeige4-3B-Thinking and other large parameter-scale models on WritingBench wu2025writingbenchcomprehensivebenchmarkgenerative. Scores are taken from the official leaderboard.
| Model | Overall | Academic & Engineering | Finance & Business | Politics & Law | Literature & Arts | Education | Advertising & Marketing |
| --- | --- | --- | --- | --- | --- | --- | --- |
| GPT-5 | 83.87 | 84.46 | 83.78 | 82.21 | 85.26 | 85.64 | 82.34 |
| Qwen-235B-A22B-Thinking | 82.34 | 83.43 | 83.44 | 79.67 | 82.68 | 84.52 | 80.94 |
| Doubao-Seed-1.6-Thinking | 79.29 | 80.79 | 79.74 | 78.05 | 78.37 | 81.48 | 77.95 |
| Gemini-2.5-Pro | 79.26 | 79.59 | 78.24 | 78.69 | 80.92 | 81.30 | 77.27 |
| Nanbeige4-3B-Thinking-2511 | 79.03 | 80.77 | 82.37 | 77.41 | 76.05 | 80.81 | 76.55 |
| Deepseek-R1-0528 | 78.92 | 78.79 | 78.38 | 77.27 | 80.91 | 80.41 | 78.44 |
| Grok-4 | 74.65 | 75.44 | 73.99 | 73.08 | 74.66 | 77.48 | 74.73 |
| O4-mini | 72.90 | 76.04 | 73.19 | 71.26 | 69.87 | 75.91 | 72.66 |
| O3-mini | 68.02 | 69.52 | 68.61 | 66.92 | 66.54 | 71.48 | 65.95 |
In this report, we present a comprehensive overview of the model training pipeline—from the pre-training to the post-training process, and highlight the techniques that most substantially contribute to our model’s performance improvements. Specifically, Nanbeige4-3B is featured with the following technologies to improve model capabilities:
Pre-training with Hybrid Data Filtering and Fine-Grained WSD.
- Hybrid Data Filtering. To enable more precise filtering of high-quality data, we develop a hybrid strategy combining tagging-based scoring su2025nemotroncctransformingcommoncrawl; zhao2024decoratelmdataengineeringcorpus with retrieval-based recalling DBLP:journals/corr/abs-2401-14624, obtaining the final comprehensive training corpus consists of 23 trillion tokens high-quality data.
- Fine-Grained WSD. We introduce a Fine-Grained Warmup-Stable-Decay (FG-WSD) scheduler to maximize the utility of high-quality data. This approach employs a fine-grained and quality-progressive data curriculum, in which the stable stage is partitioned into multiple phases with progressively refined data mixtures. Evaluations demonstrate that our method yields substantial improvements over the vanilla WSD scheduler hu2024minicpmunveilingpotentialsmall; liu2024deepseek.
Post-training with Multi-Stage SFT, Distillation, and Reinforcement Learning.
- Multi-Stage SFT. We first fine-tune our base model on over 30 million cleaned samples related to math, science, and code to establish strong reasoning capabilities. Subsequently, we apply curriculum learning with increasingly diverse and more challenging instructions to ensure robust performance across a wide range of tasks. To further improve the quality of SFT responses, we introduce an innovative approach that combines deliberative learning with Chain-of-Thought (CoT) reconstruction: we first refine the Solution component to make it superior, then reconstruct a corresponding CoT that logically leads to this improved solution. This yields high-quality SFT training examples that significantly outperform those generated via rejection sampling.
- Distillation. Following SFT, we employ the Nanbeige flagship reasoning model as the teacher to distill the Nanbeige4-3B student model, with our proposed Dual Preference Distillaition (DPD) method. In particular, we innovate the loss function design: on the one hand, the student model learns to mimic the teacher’s output distribution as a policy model; on the other hand, it is simultaneously trained to distinguish between high-quality and low-quality responses.
- Reinforcement Learning. Building upon the distilled model, we conduct multi-stage RL training to further boost performance. We design a suite of reward and verification strategies tailored to different training phases—including STEM reasoning, coding, and human preference alignment—ensuring consistent and stable improvements throughout.
Building on the techniques described above, we develop a base model Nanbeige4-3B-Base, and a reasoning-enhanced model Nanbeige4-3B-Thinking. To support the community and foster open, reproducible research in LLMs, we open-source the Nanbeige4-3B model family. We hope this will empower researchers and developers to explore advanced training methodologies, accelerate innovation in reasoning-centric models, and contribute to a more open and collaborative AI ecosystem.
## 2 Pre-Training
In this section, we first describe the construction of our pre-training dataset and the corresponding training recipe, followed by an evaluation of the Nanbeige4-3B-Base model’s performance.
### 2.1 Pre-Training Data
During the construction of the pre-training corpus for Nanbeige4-3B, we extensively collect high-quality and diverse data. Our corpus encompasses a diverse range of web pages, scholarly articles, books, source code, and other materials. To strengthen the grasp of the human world, we not only extract clean text from HTML documents but also develop a highly efficient PDF text-extraction pipeline. We further augment the pre-training mix with synthetic data that target specialized competencies: these take the form of question–answer pairs, textbooks, lecture notes, and long chain-of-thought samples, which constitute 15% of the total pre-training tokens.
### 2.2 Pre-Training Recipe
In developing the training recipe for Nanbeige4-3B, we focus on two key issues:
1. How to identify high-quality data while filtering out low-quality samples.
1. How to make full use of the selected data to further improve performance.
In the subsequent parts of this section, we first introduce how data quality is assessed and annotated, and then present how these quality ratings are utilized during training to enhance model performance.
#### 2.2.1 Data Quality Identify
To retain high-quality samples while filtering out low-quality ones, we access the quality of each data entry in the corpus using two complementary strategies: (1) multi-dimensional tagging that inspects intrinsic attributes, and (2) similarity-based scoring against a curated set of high-quality seed data to assess extrinsic alignment.
Multi-dimensional tagging. We adopt a similar workflow as in prior research on pre-training data quality assessment hu2024minicpmunveilingpotentialsmall; su2025nemotroncctransformingcommoncrawl. This involves constructing a comprehensive labeling system, sampling and annotating data using a strong model, distilling the annotations to a smaller model for scalable annotation, and finally applying weighted ranking to select high-quality samples. Our labeling framework spans two key aspects: format and content. Initially, we define over 60 dimensions, including knowledge density, reasoning density, and text fluency, etc. Based on fine-grained experiments and multiple criteria such as inter-dimension similarity, we further filter these candidates and ultimately retain a final set of 20 dimensions. We annotate all pre-training data along these 20 dimensions and further perform extensive validation and optimization experiments to refine their effectiveness. Empirical analyses reveal two key findings. First, content-related labels are markedly more predictive of data quality than format-related ones. Second, a fine-grained 0–9 scoring scheme provides substantially more accurate data selection than a binary 0–1 labeling strategy.
Similarity-based scoring. We build a retrieval database containing hundreds of billions of entries, supporting efficient hybrid text-based and vector-based retrieval. With this robust retrieval infrastructure, we continuously iterate on seed data curation, as well as the retrieval methodologies. For the seed data, we prioritize samples that rank high within our quality tagging framework while ensuring data provenance from reliable and authoritative sources. This dual-criteria approach guarantees that our foundational dataset maintains both exceptional quality standards and trustworthy origins. For the retrieval methodology, we conduct extensive experiments on how to balance between similarity scores and quality assessments. We discover that applying retrieval strategies on top of our quality labeling system enables more precise identification and selection of high-quality data.
By combining multi-dimensional tagging with similarity-based scoring, we filter out tens of trillions of tokens that do not meet our criteria and retain 12.5 trillion high-quality training data. From these 12.5 tokens, we further select 6.5 trillion tokens of even higher quality for up-sampling two or more epochs, ultimately forming our final 23 trillion token training corpus.
#### 2.2.2 Data Utility Scheduler
To fully leverage the selected data for further performance improvement, we introduce a novel learning rate scheduler named Fine-Grained Warmup-Stable-Decay (FG-WSD). This scheduler increases the learning rate during an initial warm-up phase, maintains it across multiple carefully designed stable stages, and finally applies a smooth decay. The multi-stage stable phases provide greater room for exploration based on the previously obtained data scores, while preventing the undesirable coupling between data ordering and learning rate changes.
Cosine Decay vs. WSD vs. FG-WSD Pre-training learning rate schedulers generally fall into two categories: warmup-cosine-decay touvron2023llamaopenefficientfoundation; touvron2023llama2openfoundation; grattafiori2024llama3herdmodels and warmup-stable-decay (WSD) hu2024minicpmunveilingpotentialsmall; liu2024deepseek; minimax2025minimaxm1scalingtesttimecompute. Through experimental validation, we find that when the data quality during the annealing phase is sufficiently high, warmup-stable-decay significantly outperforms warmup-cosine-decay. Consequently, we adopt the WSD approach as our foundational scheduling strategy. Building upon this baseline, we further introduce an enhanced variant: FG-WSD (Fine-Grained WSD). Recognizing that the WSD schedule maintains a constant learning rate during the stable phase, we optimize the data resampling strategy accordingly. Rather than uniformly sampling high-quality data throughout the entire training process, FG-WSD divides training into multiple fine-grained stages and progressively increases the proportion of higher-quality data mixtures in later stages.
Preliminary Experiments. We verify the effectiveness of FG-WSD on a 1B-parameter model with a fixed 100B-token corpus in the decay stage. The stable phase consumes one epoch of 500B medium-quality (MQ) tokens and two epochs of 250B high-quality (HQ) tokens, for a total of 1T stable-phase tokens. Under vanilla WSD, these 1T tokens are shuffled uniformly: every sample is drawn from a static 1:1 mixture of HQ and MQ data. FG-WSD, by contrast, splits the stable phase into two contiguous stages. Stage 1 processes 750B tokens composed of one epoch of HQ data (250B tokens) plus one epoch of MQ data (500B tokens). Stage 2 then continues for an additional 250B-token containing only HQ subset.
Table 2: Performance comparison between vanilla WSD scheduler and our proposed Fine-Grained WSD scheduler. The experiment is implemented on 1B parameter scale model with 1T tokens.
| Learing Rate Scheduler | GSM8k | Cmath | BBH | MMLU | CMMLU | MMLU-Pro |
| --- | --- | --- | --- | --- | --- | --- |
| Vanallia WSD | 27.1 | 34.5 | 29.3 | 49.2 | 50.3 | 16.87 |
| Fine-Grained WSD | 34.3 | 39.5 | 31.6 | 50.6 | 51.9 | 18.64 |
Table 3: Training stages of the FG-WSD scheduler in Nanbeige4-3B-Base, with corresponding data usage and learning rates.
| Stage | Training Tokens | Learning Rate |
| --- | --- | --- |
| Warmup Stage | 0.1T | 0 $→$ 4.5e-4 |
| Diversity-Enriched Stable Stage | 12.4T | Constant 4.5e-4 |
| High-Quality Stable Stage | 6.5T | Constant 4.5e-4 |
| Decay Stage | 4T | 4.5e-4 $→$ 1.5e-6 |
As shown in Table 2, our FG-WSD method outperforms the vanilla WSD approach across all benchmarks For GSM8k, Cmath, and BBH, we run 3-shot evaluation. For MMLU, CMMLU, and MMLU-Pro, we run 5-shot evaluation. Notably, the improvement is more pronounced on mathematical and reasoning tasks (e.g., GSM8K cobbe2021trainingverifierssolvemath, CMATH wei2023cmathlanguagemodelpass, and BBH suzgun2022challengingbigbenchtaskschainofthought) compared to knowledge and science benchmarks (e.g., MMLU hendrycks2021measuringmassivemultitasklanguage, CMMLU li2024cmmlumeasuringmassivemultitask, and MMLU-Pro wang2024mmluprorobustchallengingmultitask). This is because our quality scoring framework prioritizes reasoning density over knowledge density during high-quality data selection.
After validating the effectiveness of FG-WSD using a 1B-parameter model trained on 1T tokens, we scale the method up to the full training corpus of Nanbeige4-3B-Base. The overall training pipeline is organized into four well-defined stages: Warmup, Diversity-Enriched Stable, High-Quality Stable, and Decay. The amount of training tokens allocated to each stage, as well as the corresponding learning-rate schedules, are summarized in Table 3. A noteworthy aspect of the final decay stage is the use of the ABF (Adjusting Base Frequency) method xiong2023effectivelongcontextscalingfoundation, which enables us to extend the model’s context length to 64K. This long-context capability allows the model to fully ingest synthetic long chain-of-thought traces, books, academic articles, and large-scale code repositories without truncation, ensuring that high-value long-form data is preserved throughout training.
### 2.3 Post-SFT Evaluation for Base Model
Beyond evaluating base-model capabilities through few-shot evaluation, post-SFT downstream performance offers a more informative indicator, as virtually all production systems ultimately rely on instruction-tuned variants. We therefore fine-tune Nanbeige4-3B-Base and the open-source Qwen3-Base series with an identical supervised fine-tuning (SFT) pipeline and compared the resulting checkpoints on six representative benchmarks: AIME 2024, AIME 2025, GPQA rein2023gpqagraduatelevelgoogleproofqa, MATH-500 lightman2023letsverifystepstep, LiveCodeBench-V5, and LiveCodeBench-V6 jain2024livecodebenchholisticcontaminationfree.
To ensure robustness, we repeat the procedure with three independent SFT datasets, including Nemotron-Post-Training-Dataset-V1 NemotronPostTrainingDatasetV1, Ring-Lite-SFT-Data ringteam2025ringlitescalablereasoningc3postabilized, and OpenThoughts-3 guha2025openthoughtsdatarecipesreasoning, aggregating 9 SFT training runs in total. For each dataset, we randomly sample 500,000 instances and train for 2 epochs. To ensure a rigorously controlled and fair comparison, we keep all training hyperparameters identical across the different base models.
Table 4: Comparison of base models on reasoning benchmarks after fine-tuning.
| SFT Dataset | Base Model | AIME 24 | AIME 25 | Math-500 | GPQA | LCB-V5 | LCB-V6 |
| --- | --- | --- | --- | --- | --- | --- | --- |
| Nemotron-Post-Training-V1 | Qwen3-4B-Base | 24.6 | 25.0 | 90.4 | 44.6 | 15.9 | 17.0 |
| Qwen3-8B-Base | 37.9 | 29.6 | 91.1 | 48.9 | 27.6 | 28.1 | |
| Nanbeige4-3B-Base | 52.9 | 40.8 | 93.4 | 53.4 | 35.9 | 34.0 | |
| Ring-Lite-SFT | Qwen3-4B-Base | 40.4 | 31.3 | 93.6 | 51.4 | 20.7 | 22.5 |
| Qwen3-8B-Base | 50.0 | 35.8 | 94.4 | 55.1 | 30.2 | 29.5 | |
| Nanbeige4-3B-Base | 56.8 | 45.3 | 95.5 | 57.7 | 33.3 | 33.2 | |
| Openthoughts3 | Qwen3-4B-Base | 52.9 | 42.1 | 93.2 | 49.6 | 27.2 | 27.5 |
| Qwen3-8B-Base | 60.4 | 47.1 | 95.0 | 55.3 | 35.2 | 34.4 | |
| Nanbeige4-3B-Base | 62.4 | 49.2 | 94.6 | 56.9 | 40.9 | 38.8 | |
As shown in Table 4, across all experimental settings, Nanbeige4-3B-Base not only delivers substantial improvements over Qwen3-4B-Base, but also consistently outperforms the much larger Qwen3-8B-Base, despite being only half its size. These results indicate that our model provides a markedly stronger initialization for developing downstream reasoning models.
## 3 Post-Training
In this section, we introduce each stage of the post-training process in detail. The overall post-training pipeline for Nanbeige4-3B-Thinking is illustrated in Figure 2. Initially, we conduct two fine-tuning stages—cold-start SFT and overall SFT—to equip the model with fundamental reasoning capabilities across a wide range of tasks. Subsequently, a knowledge-distillation phase is employed to further enhance performance. Finally, the model undergoes multi-stage RL training to achieve additional improvements in multiple domain skills.
<details>
<summary>x2.png Details</summary>

### Visual Description
## Diagram: AI Model Training Pipeline Flowchart
### Overview
The image displays a horizontal, four-stage flowchart illustrating a sequential pipeline for training an AI model. The process flows from left to right, indicated by gray arrows connecting each stage. Each stage is represented by a rectangular box with a gray header containing the stage name and a white body containing the primary focus and specific data domains or methods.
### Components/Axes
The diagram consists of four distinct components (stages) arranged linearly:
1. **Stage 1 (Far Left):**
* **Header (Gray Box):** `Cold Start SFT`
* **Body (White Box):**
* **Primary Focus (Bold):** `Foundational Reasoning Skills`
* **Specific Domains (Regular text in parentheses):** `(Math/Code/STEM)`
2. **Stage 2 (Center-Left):**
* **Header (Gray Box):** `Overall SFT`
* **Body (White Box):**
* **Primary Focus (Bold):** `General/Curriculum Learning`
* **Specific Data Types (Regular text in parentheses):** `(General Conversation/Agent/Reasoning Curriculum Data)`
3. **Stage 3 (Center-Right):**
* **Header (Gray Box):** `Distillation`
* **Body (White Box):**
* **Primary Focus (Bold):** `Dual-Level Preference Distillation`
* **Process Description (Regular text in parentheses):** `(Large Model → Small Model)`
4. **Stage 4 (Far Right):**
* **Header (Gray Box):** `RL`
* **Body (White Box):**
* **Primary Focus (Bold):** `Multi-Stage RL With Robust Reward System`
* **Alignment Targets (Regular text in parentheses):** `(STEM/Code/Human Preference Alignment)`
**Flow Direction:** A solid gray arrow points from the right edge of the "Cold Start SFT" box to the left edge of the "Overall SFT" box. An identical arrow connects "Overall SFT" to "Distillation," and a final arrow connects "Distillation" to "RL." This establishes a strict, unidirectional sequence.
### Detailed Analysis
The diagram outlines a progressive training methodology:
1. **Cold Start SFT (Supervised Fine-Tuning):** The pipeline begins by instilling core, domain-specific reasoning abilities in the model using data from Mathematics, Coding, and STEM fields.
2. **Overall SFT:** The model's training is then broadened. It undergoes general supervised fine-tuning on a more diverse dataset that includes general conversation, agent-based interactions, and structured reasoning curricula.
3. **Distillation:** This stage involves compressing the knowledge and capabilities from a larger "teacher" model into a smaller, more efficient "student" model. The term "Dual-Level" suggests this distillation may operate on multiple layers or aspects of the model's knowledge.
4. **RL (Reinforcement Learning):** The final stage uses reinforcement learning with a robust reward system to align the model's outputs. The alignment targets are specified as STEM, Code, and Human Preferences, indicating the reward model is trained to favor responses that are accurate in technical domains and preferred by human evaluators.
### Key Observations
* **Sequential Dependency:** The arrows clearly indicate that each stage is a prerequisite for the next. The model cannot jump to general learning without first acquiring foundational skills, nor can it be distilled or aligned via RL before being trained via SFT.
* **Progressive Scope:** The training focus evolves from narrow and technical (Math/Code/STEM) to broad (General Conversation) and then back to targeted alignment (STEM/Code/Human Preference).
* **Methodological Progression:** The techniques advance from standard Supervised Fine-Tuning (SFT) to Knowledge Distillation and finally to Reinforcement Learning, representing increasing complexity in the training objective.
* **Efficiency Consideration:** The explicit inclusion of a "Distillation" stage (Large Model → Small Model) highlights a concern for model size and inference efficiency in the final product.
### Interpretation
This flowchart represents a sophisticated, multi-phase strategy for developing a capable and aligned AI assistant. The pipeline is designed to build competence systematically:
1. **Foundation First:** It prioritizes establishing robust reasoning in structured domains (STEM) before exposing the model to the noise and variability of open-ended conversation. This is a "curriculum learning" approach, teaching fundamentals before applications.
2. **Knowledge Transfer & Compression:** The distillation phase is critical for practical deployment. It suggests the training process may initially create a very large, powerful model, whose capabilities are then transferred to a smaller, cost-effective model suitable for production use.
3. **Alignment as the Final Step:** Placing Reinforcement Learning (RL) last indicates that alignment with human preferences and technical accuracy is treated as a refinement process applied to a model that has already acquired substantial knowledge and skills. The "Robust Reward System" is key to ensuring this alignment is stable and effective.
4. **Overall Goal:** The pipeline aims to produce a model that is not only knowledgeable and capable in technical and conversational domains but also efficient (via distillation) and helpful/harmless (via RL-based alignment). It reflects a modern, holistic approach to AI development that balances capability, efficiency, and safety.
</details>
Figure 2: Nanbeige4-3B-Thinking Post-Training Pipeline
### 3.1 Cold Start Supervised Fine-tuning
On top of the base model, we first perform a cold-start supervised fine-tuning (SFT) stage to establish a robust foundation for reasoning. This stage focuses on high-quality reasoning data. After systematic cleaning and filtering, we collect approximately 30 million QA samples of mathematical, code, and subject-area problem-solving and reasoning. Based on this dataset, we construct a training corpus with a context length of 32K tokens, comprising approximately 50% mathematical reasoning, 30% scientific reasoning, and 20% code-related tasks. The objective of the cold-start stage is to strengthen the model’s chain-of-thought reasoning and structured response abilities wei2022chainofthought; wang2022selfconsistency, providing a solid foundation for subsequent capability expansion.
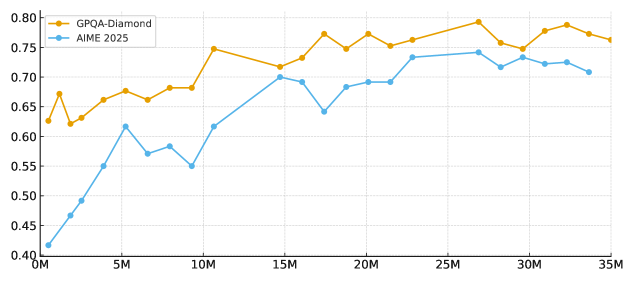
Scaling SFT Instructions. While some recent technical reports suggest that tens or hundreds of thousands of high-quality instructions are sufficient for supervised-finetuning, our experiments on Nanbeige4-3B reveal a different trend. As shown in Figure 3, when controlling for data distribution and overall quality, scaling the cold-start SFT instruction set from hundreds of thousands to tens of millions of examples continues to produce substantial improvements on challenging reasoning benchmarks such as AIME 2025 and GPQA-Diamond, without a clear early saturation point. Motivated by this empirical observation, we explicitly adopt a Scaling SFT Instructions strategy. Rather than relying on a compact instruction set, we train the model during the cold-start stage on tens of millions of carefully curated instructions. This large-scale instruction regime provides the model with a stronger initial reasoning prior and stabilizes its chain-of-thought generation policy, thereby creating a more reliable foundation for subsequent training stages.
<details>
<summary>x3.png Details</summary>
### Visual Description
## Line Chart: Performance Comparison of GPQA-Diamond vs. AIME 2025
### Overview
The image is a line chart comparing the performance of two entities, labeled "GPQA-Diamond" and "AIME 2025," across a range of values on the x-axis. The chart plots a performance metric (y-axis) against a scale measured in millions (x-axis). Both series show a general upward trend with fluctuations.
### Components/Axes
* **Chart Type:** Line chart with markers.
* **X-Axis:**
* **Label:** Not explicitly stated, but values are in millions (M).
* **Scale:** Linear, from 0M to 35M.
* **Major Tick Marks:** 0M, 5M, 10M, 15M, 20M, 25M, 30M, 35M.
* **Y-Axis:**
* **Label:** Not explicitly stated, but represents a performance metric (likely accuracy or score).
* **Scale:** Linear, from 0.40 to 0.80.
* **Major Tick Marks:** 0.40, 0.45, 0.50, 0.55, 0.60, 0.65, 0.70, 0.75, 0.80.
* **Legend:**
* **Position:** Top-left corner of the chart area.
* **Series 1:** "GPQA-Diamond" - Represented by an orange line with circular markers.
* **Series 2:** "AIME 2025" - Represented by a blue line with circular markers.
### Detailed Analysis
**Trend Verification:**
* **GPQA-Diamond (Orange Line):** The line shows a general upward trend from left to right, with several local peaks and troughs. It starts around 0.63, dips slightly, then climbs with volatility, reaching its highest point near 0.79 around 27M.
* **AIME 2025 (Blue Line):** This line also shows a general upward trend but starts much lower and exhibits more pronounced volatility, including a significant dip around 17M. It begins near 0.42 and ends near 0.71.
**Data Point Extraction (Approximate Values):**
The following table lists the approximate y-values for each data point, read from the chart at each marked x-axis interval. Values are estimated based on the grid lines.
| X-Axis (Millions) | GPQA-Diamond (Orange) | AIME 2025 (Blue) |
| :--- | :--- | :--- |
| 0M | ~0.63 | ~0.42 |
| ~1M | ~0.67 | ~0.46 |
| ~2M | ~0.62 | ~0.49 |
| ~3M | ~0.64 | ~0.55 |
| ~4M | ~0.66 | ~0.61 |
| 5M | ~0.68 | ~0.57 |
| ~6M | ~0.66 | ~0.58 |
| ~7M | ~0.68 | ~0.55 |
| ~8M | ~0.68 | ~0.61 |
| ~9M | ~0.75 | ~0.62 |
| 10M | ~0.73 | ~0.65 |
| ~11M | ~0.71 | ~0.70 |
| ~12M | ~0.73 | ~0.69 |
| ~13M | ~0.77 | ~0.64 |
| ~14M | ~0.75 | ~0.68 |
| 15M | ~0.77 | ~0.69 |
| ~16M | ~0.75 | ~0.69 |
| ~17M | ~0.76 | ~0.73 |
| ~18M | ~0.79 | ~0.74 |
| ~19M | ~0.76 | ~0.72 |
| 20M | ~0.75 | ~0.73 |
| ~21M | ~0.78 | ~0.72 |
| ~22M | ~0.79 | ~0.71 |
| ~23M | ~0.77 | ~0.73 |
| 25M | ~0.76 | ~0.71 |
| ~26M | ~0.79 | ~0.73 |
| ~27M | ~0.77 | ~0.71 |
| 30M | ~0.76 | ~0.71 |
| ~31M | ~0.77 | ~0.73 |
| ~32M | ~0.76 | ~0.71 |
| 35M | ~0.76 | ~0.71 |
### Key Observations
1. **Consistent Performance Gap:** The GPQA-Diamond (orange) line is consistently above the AIME 2025 (blue) line across the entire x-axis range, indicating superior performance on this metric.
2. **Converging Trend:** The gap between the two lines appears to narrow slightly as the x-axis value increases, particularly after the 15M mark.
3. **Volatility:** Both lines are volatile, but AIME 2025 shows more dramatic swings, most notably a sharp dip to ~0.64 at approximately 17M.
4. **Peak Performance:** GPQA-Diamond reaches its peak (~0.79) around 18M and 27M. AIME 2025 peaks (~0.74) around 19M.
5. **Starting Points:** There is a large initial disparity at 0M (~0.63 vs. ~0.42).
### Interpretation
The chart demonstrates that the "GPQA-Diamond" method or model consistently achieves higher scores on the measured performance metric compared to "AIME 2025" across all tested scales (from 0 to 35 million). The general upward trend for both suggests that performance improves with the scale represented on the x-axis (which could be model size, training data, or another resource).
The narrowing gap might indicate that AIME 2025 benefits more from scaling at higher magnitudes, or that GPQA-Diamond's performance gains begin to plateau. The significant volatility, especially in the AIME 2025 series, suggests its performance is less stable or more sensitive to specific conditions at certain scales. The dip at ~17M for AIME 2025 is a notable anomaly that would warrant investigation in a technical context—it could represent a point of instability, a change in methodology, or an experimental artifact.
Without explicit axis labels, the precise nature of the performance metric and the scaling factor remains unknown, but the relative comparison and trends are clear.
</details>
Figure 3: Cold-start SFT scaling (0.5M–35M) on NBG4-3B reasoning benchmarks.
### 3.2 Overall Supervised Fine-Tuning
After the model acquires initial reasoning capabilities, we perform an Overall SFT stage ouyang2022instructgpt; wang2022selfinstruct; zhou2023lima to further enhance its general abilities and task diversity. The training corpus combines general conversation and writing data (covering everyday dialogue and multiple genres), agent-style interaction data (tool use, task decomposition, planning, and execution), harder reasoning data that targets the weak spots revealed in the cold-start stage, and code-related tasks that reinforce programming and code understanding. Using a 64K context length, we mix the data as roughly 40% mathematical and subject-specific reasoning, 30% general QA and writing, 20% agent scenarios, and 10% coding tasks, which systematically improves the model’s general dialogue ability, task execution, and adaptation to diverse application scenarios while maintaining strong reasoning performance. In the following section, we provide a detailed description of our data processing pipeline.
<details>
<summary>x4.png Details</summary>
### Visual Description
## Diagram: Two-Stage Process for Generating High-Quality Solutions and Training Data
### Overview
The image is a technical flowchart illustrating a two-stage process for refining solutions and generating training data for a "Thinking Model." The process is divided into two main phases: **① Solution Refinement** and **② CoT Reconstruction**. The diagram uses a combination of solid and dashed boxes, directional arrows, and color-coded labels to depict the flow of data and operations between various models and components.
### Components/Axes
The diagram is structured into two horizontal sections, each with a numbered title.
**Section ①: Solution Refinement**
* **Input:** A box labeled **"Instruction"** on the far left.
* **Primary Process Branches:** The "Instruction" feeds into two parallel green-outlined boxes:
1. **"Teacher Generate"** (top branch)
2. **"Dynamic Evaluation Checklist"** (bottom branch)
* **Core Iterative Loop:** A large, dashed orange box titled **"Iterative Critique & Refinement (Loop)"**. This loop contains two orange-outlined boxes:
* **"Multi-Model Evaluator"** with sub-text: "Score & Critique based on Dynamic Checklist".
* **"Answer Revision Model"** with sub-text: "Rewrite answer based on feedback".
* **Loop Arrows & Labels:**
* An arrow from "Teacher Generate" to the loop is labeled **"Draft"**.
* An arrow from "Dynamic Evaluation Checklist" to the loop is labeled **"Criteria"**.
* An arrow from "Multi-Model Evaluator" to "Answer Revision Model" is labeled **"Critique"**.
* An arrow from "Answer Revision Model" back to "Multi-Model Evaluator" is labeled **"New Candidate"**.
* **Output:** A yellow-outlined box on the far right labeled **"High-Quality Final Solution"**.
**Section ②: CoT Reconstruction**
* **Input:** A green-outlined box on the left labeled **"Construct Input"** with sub-text: "Prompt + Solution". This input is derived from the "High-Quality Final Solution" above, indicated by a connecting arrow.
* **Core Process:** A large, dashed blue box titled **"CoT Generation"**. This contains three blue-outlined boxes in sequence:
1. **"CoT Completion Model"**
2. **"Generate Summary"**
3. **"Generate CoT"**
* **Output:** A yellow-outlined box on the far right labeled **"Thinking Model SFT Data"**.
### Detailed Analysis
The diagram details a sophisticated pipeline for creating high-quality supervised fine-tuning (SFT) data.
1. **Solution Refinement Stage:** This stage takes an initial "Instruction" and uses a teacher model to generate a draft solution. Concurrently, a dynamic checklist is created to serve as evaluation criteria. These two elements feed into an iterative loop where a "Multi-Model Evaluator" scores and critiques the draft against the checklist. The critique is passed to an "Answer Revision Model," which rewrites the solution. This revised "New Candidate" is fed back into the evaluator, creating a loop that continues until a "High-Quality Final Solution" is produced.
2. **CoT (Chain-of-Thought) Reconstruction Stage:** The refined solution from Stage 1 is combined with the original prompt to "Construct Input." This input is processed by a "CoT Completion Model." The output then goes through a two-step generation process: first to "Generate Summary," and then to "Generate CoT." The final output is "Thinking Model SFT Data," which is presumably used to train a model to perform step-by-step reasoning.
### Key Observations
* **Iterative Core:** The heart of the first stage is a closed-loop system ("Critique" -> "Revision" -> "New Candidate"), emphasizing continuous improvement over a single-pass generation.
* **Dynamic Evaluation:** The use of a "Dynamic Evaluation Checklist" suggests the criteria for a good solution are not static but are generated or adapted based on the specific instruction.
* **Two-Stage Pipeline:** The process is explicitly sequential. The output of the solution refinement stage is a mandatory input for the chain-of-thought reconstruction stage.
* **Color Coding:** Green is used for input/generation components, orange for the iterative evaluation/revision loop, blue for the CoT generation pipeline, and yellow for final outputs.
### Interpretation
This diagram outlines a methodology for creating superior training data for reasoning models. The **Solution Refinement** stage acts as a quality filter, using multi-model critique and iterative revision to elevate a basic solution into a high-quality one. This addresses the common problem of noisy or low-quality data in model training.
The **CoT Reconstruction** stage then takes this polished solution and reverse-engineers the reasoning process (the Chain-of-Thought) that could lead to it. This is a form of "process supervision" data generation. Instead of just training a model on the final answer (the solution), it is trained on the intermediate reasoning steps (the CoT), which is known to improve model performance on complex, multi-step tasks.
The overall pipeline suggests a focus on **data quality over quantity**. By investing computational resources into refining solutions and reconstructing their reasoning traces, the resulting "Thinking Model SFT Data" is likely to be more effective for training models that need to perform deliberate, step-by-step problem-solving. The "Dynamic Checklist" is a key innovation, implying the system self-generates its own standards for success, making the process adaptable to a wide variety of instructions.
</details>
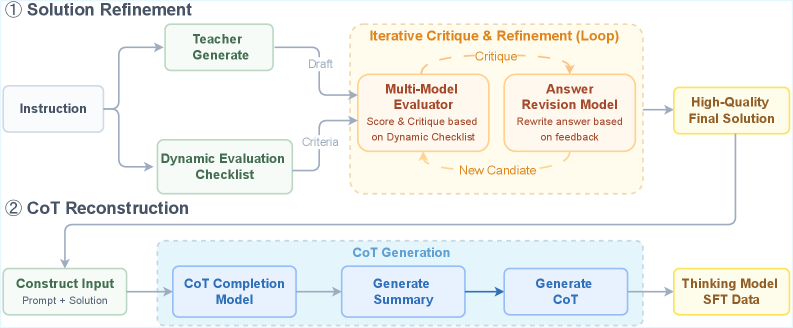
Figure 4: Deliberative generation refinement and CoT completion
Solution Refinement. To enhance the model’s overall output quality on complex tasks, we develop a unified mechanism that combines deliberative generation refinement with chain completion tencent2025hunyuanturbos. Specifically, for each instruction, the system first constructs a tailored multi-dimensional evaluation checklist by selecting appropriate criteria from a predefined pool according to the instruction’s semantics and task type, and then adopts this checklist as an explicit constraint for the current evaluation round. The checklist selectively integrates criteria such as correctness, completeness, consistency, executability, and safety, and further refines each criterion into concrete checkpoints to enable fine-grained assessment of candidate responses. In the next iteration, the system dynamically selects from a pool of teacher models the one that performs best on the current instruction and has it co-generate candidate answers with the current SFT/Thinking model. An evaluation model then conducts cross-evaluation and comparative scoring of all candidates against a predefined checklist, producing structured feedback that highlights error locations, missing steps, and optimization suggestions. This feedback drives the Thinking model through iterative generate–review–revise cycles, continuously improving the quality of the solution.
CoT Reconstruction. After multiple rounds of deliberation and rewriting, although the final solution quality is greatly improved, the original chain of thought is often disrupted or lost, making it difficult to obtain supervision signals that simultaneously provide a high-quality final answer and a stable, learnable reasoning process. To address this, we additionally train a chain-completion model. When constructing training data for the Thinking model, we feed this model with the concatenation of the instruction and the final solution after multi-round refinement. Empirically, generating a summarized first improves followability, so the model first generates a brief summary chain of thought and then produces an explicit chain of thought that is consistent with the final answer. Finally, we concatenate the completed chain of thought and the final answer as the target output and use it as the training sample for the Thinking model, thus restoring a structured and well-aligned reasoning supervision signal while preserving answer quality.
After integrating the above mechanism into the Overall SFT stage, the model’s alignment with human preferences is significantly improved: on the Arena-Hard v2 benchmark, the score improves by 16%, with no degradation in reasoning capability li2024arenahard.
Function Call Supporting. Our model provides native support for the function-call paradigm, enabling seamless tool invocation through formally defined and standardized parameter specifications. During the overall SFT stage, we proportionally increase the amount of function-call (FC) data to further strengthen this capability. To enhance the model’s proficiency in function calling, we incorporate both open-source and synthetic data. For the open-source portion, we unify data formats and reconstruct responses so that each sample strictly adheres to our function-call schema and includes an explicit reasoning path. For the synthetic portion, we deploy real-world environments and leverage strong models (e.g., Nanbeige3.5-Pro) to generate high-quality trajectories via rejection sampling. In addition, we adopt a multi-agent framework to simulate realistic user–assistant–tool interactions, creating data that span diverse scenarios and a wide range of difficulty levels yang2025toolmind.
<details>
<summary>x5.png Details</summary>
### Visual Description
\n
## System Architecture Diagram: Student Model Training via Teacher Distillation and DPO
### Overview
This image is a technical flowchart illustrating a machine learning training pipeline. It depicts a process where a smaller "Student Model" (NBG4-3B) is trained using outputs from a larger "Teacher Model" (NBG3.5-Pro) and preference data. The system combines Sequence-level Direct Preference Optimization (DPO) loss with token-level distillation losses to update the student model.
### Components/Axes
The diagram is organized into three main regions from left to right: **Data Preparation**, **Model Forward Pass**, and **Loss Calculation & Update**.
**1. Data Preparation (Left Region):**
* **Input:** A "Query" box at the top-left.
* **Models:** Two parallel boxes below the query:
* "Student Model (NBG4-3B-SFT)"
* "Teacher Model (NBG3.5-Pro)"
* **Samples:** Each model generates a sample:
* Student Model → "Negative Sample"
* Teacher Model → "Positive Sample"
* **Filtering:** Both samples feed into a "Pair-wise Preference Filter" box with the annotation: "[Ensure Positive >> Negative]".
* **Output:** The filter outputs to a "Training Data" box.
**2. Model Forward Pass (Center Region):**
* The "Training Data" and the original "Query" are used as input to the core "Student Model (NBG4-3B)".
* This model produces two outputs:
* An arrow labeled "Student Logits" points to the right.
* An arrow labeled "Teacher Logits" originates from the "Teacher Model (NBG3.5-Pro)" in the left region and points to the right, bypassing the student model.
**3. Loss Calculation & Update (Right Region):**
This region is enclosed in a dashed yellow box and contains three parallel loss computation modules, all receiving "Teacher Logits" and "Student Logits".
* **Top Module: "Sequence-level DPO Loss"**
* Contains two score bars: "Positive Score" (orange) and "Negative Score" (blue).
* An arrow between them is labeled "Maximize Margin".
* **Middle Module: "Positive Token-level Distillation"**
* Shows two probability distribution curves: "Teacher Prob" (gray) and "Student Prob" (blue).
* An arrow between them is labeled "Minimize KL" (Kullback-Leibler divergence).
* **Bottom Module: "Negative Token-level Distillation"**
* Identical structure to the middle module: "Teacher Prob" (gray) and "Student Prob" (blue) curves with a "Minimize KL" arrow.
* **Final Output:** The outputs of all three modules converge into a final box labeled "Joint Loss" with the formula: `L_Dpo + L_pos + L_neg`.
* **Update Loop:** An arrow labeled "Update" flows from the "Joint Loss" box back to the "Student Model (NBG4-3B)" in the center, completing the training loop.
### Detailed Analysis
The diagram specifies a multi-objective training strategy:
1. **Preference Learning:** The "Pair-wise Preference Filter" ensures the training data consists of query-response pairs where the teacher's response (positive) is explicitly preferred over the student's initial response (negative).
2. **Hybrid Loss Function:** The student model is updated to minimize a composite loss:
* **`L_Dpo` (Sequence-level):** Optimizes the model to assign a higher score (margin) to the preferred (positive) sequence over the dispreferred (negative) one.
* **`L_pos` (Token-level):** Uses knowledge distillation (minimizing KL divergence) to make the student's token-level probability distribution for the *positive* sample match the teacher's distribution.
* **`L_neg` (Token-level):** Similarly distills knowledge for the *negative* sample, aligning the student's distribution with the teacher's on the less preferred output.
### Key Observations
* **Model Naming Convention:** The student model is referred to as "NBG4-3B-SFT" (likely Supervised Fine-Tuned) during data generation and as "NBG4-3B" during the core training loop, suggesting the SFT version is a starting point.
* **Asymmetric Role:** The teacher model (NBG3.5-Pro) is only used to generate the positive sample and provide logits for distillation; it is not updated.
* **Dual Distillation:** The system performs distillation on both positive and negative samples, which is a nuanced approach to transfer the teacher's behavior comprehensively.
* **Spatial Flow:** The layout clearly separates the one-time data preparation (left) from the iterative training loop (center and right).
### Interpretation
This diagram represents a sophisticated **knowledge distillation and alignment pipeline** for training a compact language model (3B parameters). The core innovation is the **joint optimization** of three distinct learning signals:
1. **Preference Alignment (DPO):** Teaches the model *what* is better (positive vs. negative responses).
2. **Behavioral Cloning (Distillation):** Teaches the model *how* the teacher thinks, by mimicking its internal probability distributions at the token level for both good and bad responses.
The "Pair-wise Preference Filter" is a critical component, acting as a gatekeeper to ensure the training signal is clean and the positive sample is indeed superior. The overall goal is to produce a student model that not only prefers the teacher's outputs but also internalizes the teacher's reasoning patterns, leading to a more capable and aligned smaller model. The use of "NBG" in model names suggests this may be part of a specific model family or project.
</details>
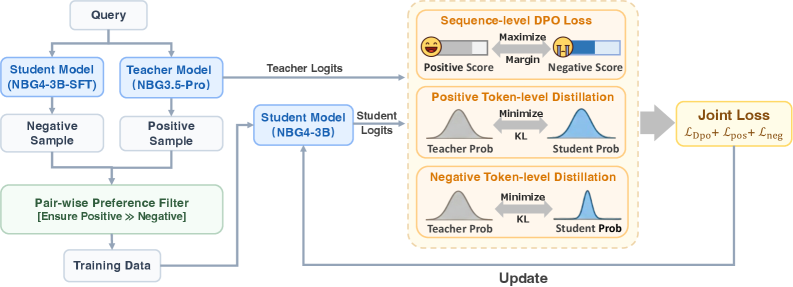
Figure 5: Overview of the Dual-Level Preference Distillation (DPD) framework
### 3.3 Dual-level Preference Distillation
We propose Dual-Level Preference Distillation (DPD), a joint training framework that harmonizes token-level knowledge distillation with sequence-level preference optimization. In this framework, Direct Preference Optimization (DPO) rafailov2023dpo acts as a sequence-level decision-boundary regularizer, maximizing the margin between positive and negative responses. Simultaneously, we introduce token-level supervision from the teacher model’s probability distribution on both sample types. This dual-granularity setup improves instruction-following behavior and subjective preference alignment, and at the same time, substantially enhances the model’s complex reasoning capabilities.
For data construction, positive samples are obtained by sampling multiple responses from the teacher model Nanbeige3.5-Pro for the same instruction, followed by model-based scoring and rule-based filtering to select the highest-scoring answer. Negative samples are generated by sampling from the 3B student model under training. These candidates are then passed through automatic evaluation and rule-based checks, and only those whose quality and scores are significantly worse than the corresponding positive sample are retained.
For the optimization objective, we use a joint loss that combines token-level probability distillation with a sequence-level DPO preference loss. On positive samples, the student model is trained to match the Nanbeige3.5 Pro probability distribution at each token. On negative samples, we also apply a distillation loss, where the teacher provides a reference distribution for the incorrect responses generated by the student, reducing the probability of highly confident erroneous tokens and increasing the probability of under-estimated but reasonable alternatives. This design enhances the model’s ability to correct its own mistakes and to recognize errors. The sequence level DPO preference loss, implemented as a margin constraint, explicitly enlarges the score gap between positive and negative responses, thereby sharpening the decision boundary and improving style alignment.
Using the Nanbeige4-3B SFT model as the baseline, training with this framework yields consistent and substantial relative gains on multiple internal and public benchmarks: around an 8% improvement on challenging mathematical benchmarks such as AIME 2024 and AIME 2025 emergentmind2025aime, about a 10% gain on scientific reasoning tasks such as GPQA rein2023gpqa, and roughly a 30% improvement on BFCL V4, which emphasize tool use and problem decomposition patil2025bfcl. At the same time, Arena-style subjective preference evaluations still show an improvement of around 8% li2024arenahard. Furthermore, incorporating an RL phase on top of this distillation framework yields substantially larger gains compared to initiating RL directly from the SFT baseline.
### 3.4 Reinforcement Learning
Large-scale supervised fine-tuning and distillation provide a strong foundation for the reasoning ability of NBG4-3B. We further bootstrap both its reasoning capability and human preference alignment through reinforcement learning (RL). Instead of conducting a single-stage RL procedure on a mixed corpus spanning multiple knowledge domains yang2025qwen3, we adopt a multi-stage RL framework, where each stage targets a specific ability dimension. To fully exploit the potential of each stage, we perform on-policy data filtering with the latest model before every RL phase. For each phase, we adopt appropriate reward models or verifiers based on the features of the training data.
#### 3.4.1 On-Policy Data Filtering
During multi-stage RL training, the model’s reasoning ability improves after each stage. Due to cross-domain knowledge transfer, samples that were previously challenging may become trivial in later stages and contribute little to further improvement. To maintain a high-quality learning signal, we apply on-policy data filtering before each RL stage using the model from the previous stage.
Concretely, we use the model from the preceding stage to compute the avg@16 accuracy for every question and retain only those samples whose pass rate lies strictly between 10% and 90%. This focuses training on problems that are neither trivial nor unsolvable, thereby maximizing the effectiveness of each RL update.
#### 3.4.2 Multi-Stage Reinforcement Learning
To enhance reasoning ability across domains, we employ multi-stage RL rather than a single mixed-corpus paradigm. While mixed-corpus training can yield strong cross-domain transfer cheng2025revisitingreinforcementlearningllm, we observe that it often slows progress in specific domains: the model may spend many updates to achieve marginal gains in more challenging skills. For example, when jointly training on advanced mathematics and competitive programming data, the model tends to improve more on mathematics than on competitive coding. To address this imbalance, we organize RL into multiple stages, each focused on a single domain. This allows the model to concentrate its capacity on domain-specific skills at each stage while still benefiting from cross-domain transfer over the full training pipeline.
We adopt on-policy GRPO shao2024deepseekmathpushinglimitsmathematical for each RL stage, with several enhancements for stablized training. In particular, we remove the KL penalty term and mask the loss for truncated sequences, following the insights of DAPO yu2025dapoopensourcellmreinforcement. We organize the training into three RL stages as follows.
STEM RL with Agentic Verifier. We use STEM-focused RL as the first stage, motivated by prior findings that STEM training provides strong cross-domain transfer. Our dataset consists of question–answer pairs in mathematics and the natural sciences. For mathematical problems, we collect diverse data from open-source datasets. For science problems spanning physics, chemistry, and biology, we use proprietary competition-level collections. For problems with multiple sub-parts, we rewrite each sub-problem into a self-contained question with a complete context.
In STEM domains, reference answers and model output may express equivalent numerical results in different symbolic forms. To provide accurate training signals, we employ a tool-augmented verifier that calls Python interpreter to perform exact computation and simplification CosineVerifier. This agentic verifier enables robust judgments that go beyond string-matching rules.
Practical Coding RL with Synthetic Test Functions. This stage aims to enhance practical coding ability across multiple programming languages and task scenarios. We design a multi-agent system to synthesize problems paired with executable test functions. To ensure the correctness and completeness of the synthetic data chou2025autocodebenchlargelanguagemodels, we adopt a reverse-generation procedure: we first synthesize the solution and its corresponding test functions, and only then generate the natural-language problem description. Concretely, it first retrieves high-quality code snippets from GitHub, then refines or evolves these snippets into self-contained, verifiable solutions and produces paired public and private test functions. Finally, all candidate triples (problem, solution, test function) are validated via sandboxed execution to guarantee reliability. During RL training, these test functions are executed to provide a binary reward signal based on whether the generated solution passes all tests.
Human Preference Alignment RL with Pairwise Reward Model. In the final stage, we focus on aligning the model with human preferences on tasks such as creative writing and role-playing. Since these tasks prefer open-ended responses without fixed reference answers, many prior works rely on general-purpose language models to score the human preference alignment of candidate responses li2024crowdsourced. However, using a general language model as a reward model has two key drawbacks: (i) it often requires a lengthy chain of thought before reaching a final verdict, which is highly time-consuming; and (ii) RL training is prone to reward hacking. To address these issues, we train a pairwise reward model that can express preferences using only a few tokens, while exhibiting strong resistance to reward hacking.
During reinforcement learning (RL) training, we first sample diverse instructions that are both challenging and clearly specified. We then prompt strong baseline models (e.g., Nanbeige3.5-Pro) to generate high-quality reference responses. Each rollout produced by the policy model Nanbeige4-3B is paired with its corresponding reference response, and the pairwise reward model assigns a preference-based score that serves as the reward signal for policy optimization.
### 3.5 Post-Training Evaluation
Table 5: Comparison between Nanbeige4-3B-Thinking and Qwen series reasoning models.
| Benchmark | Qwen3-4B- 2507 | Qwen3-8B- 2504 | Qwen3-14B- 2504 | Qwen3-30A3- 2507 | Qwen3-32B 2504 | Nanbeige4-3B- 2511 |
| --- | --- | --- | --- | --- | --- | --- |
| Mathematical Reasoning | | | | | | |
| AIME2025 | 81.3 | 67.3 | 70.4 | 85.0 | 72.9 | 85.6 |
| AIME2024 | 83.3 | 76.0 | 79.3 | 89.2 | 81.4 | 90.4 |
| Scientific Reasoning | | | | | | |
| GPQA-Diamond | 67.2 | 62.0 | 64.0 | 73.4 | 68.7 | 82.2 |
| SuperGPQA | 46.7 | 39.1 | 46.8 | 56.8 | 54.1 | 53.2 |
| Tool Use & Coding | | | | | | |
| BFCL-V4 | 44.9 | 42.2 | 45.4 | 48.6 | 47.9 | 53.8 |
| Fullstack Bench | 47.1 | 51.5 | 55.7 | 54.4 | 58.2 | 48.0 |
| Human Preference Alignment | | | | | | |
| ArenaHard-V2 | 40.5 | 26.4 | 39.9 | 60.0 | 48.4 | 60.0 |
| Multi-Challenge | 41.8 | 35.8 | 36.4 | 49.4 | 39.2 | 41.2 |
We evaluate Nanbeige4-3B on a diverse suite of benchmarks to more comprehensively assess its performance. For each benchmark, we conduct multiple evaluation runs and report the average score across these repeated trials (e.g., avg@8 denotes the mean score computed over eight independent repetitions). Our evaluation encompasses the following benchmarks:
- Mathematical Reasoning: AIME 2025, AIME 2024 emergentmind2025aime (reported as avg@8)
- Scientific Reasoning: GPQA-Diamond rein2023gpqagraduatelevelgoogleproofqa, superGPQA pteam2025supergpqascalingllmevaluation (avg@3)
- Tool Use & Coding: BFCL-V4 patil2025bfcl, Fullstack-Bench bytedanceseedfoundationcodeteam2025fullstackbenchevaluatingllms (avg@3)
- Human Preference Alignment: Arena-Hard V2 li2024crowdsourced, Multi-Challenge sirdeshmukh2025multichallengerealisticmultiturnconversation (avg@3)
For all benchmarks, we use a sampling temperature of 0.6 and top-p of 0.95, and we set the maximum generation length to 64k tokens. We compare Nanbeige4-3B against a series of open-source small language models: Qwen3-4B, Qwen3-8B, Qwen3-14B, Qwen3-30B-A3B, and Qwen3-32B. We report metrics of other models with recommended hyperparameters in our environment. Table 5 presents the evaluation results.
Experimental results show that Nanbeige4-3B excels at demanding reasoning tasks despite its compact size. It sets new state-of-the-art averages on AIME 2024, AIME 2025 and GPQA-Diamond, outperforming models with up to 10× more parameters, including Qwen3-32B and Qwen3-30B-A3B. Beyond mathematics and science, the model demonstrates strong tool-use proficiency, scoring 53.8 on BFCL-V4—an absolute gain of 5.2 points over Qwen3-30B-A3B. Human-preference alignment is equally notable: Nanbeige4-3B matches the 60.0 point top score on Arena-Hard V2, yielding a 50% relative improvement over Qwen3-4B.
In addition to the benchmark results from our locally deployed evaluations, Nanbeige4-3B also demonstrates outstanding performance in external public evaluations. As shown in Table 1, Nanbeige4-3B-Thinking-2511 ranks among the top models on the WritingBench Leaderboard (November 2025), showcasing writing capabilities across diverse scenarios that are on par with much larger models.
## 4 Conclusion
In this work, we introduce Nanbeige4-3B, a compact yet highly capable 3-billion-parameter language model that redefines what small-scale models can achieve through innovation on data and training paradigm. Trained on a meticulously curated 23 trillion tokens of high-quality data and enhanced with novel post-training techniques—including chain-of-thought introspection and refinement, advanced reinforcement learning, and knowledge distillation—Nanbeige4-3B demonstrates remarkable reasoning and generation capabilities across diverse domains.
Despite its modest size, Nanbeige4-3B outperforms open-source counterparts such as Qwen3-8B and Qwen3-14B on challenging benchmarks, including AIME, SuperGPQA, Arena-Hard V2, and BFCL-V4. Notably, in the latest official WritingBench leaderboard, the Nanbeige4-3B-Thinking-2511 achieves top-tier performance, rivaling that of large-scale models like Deepseek-R1-0528. Nanbeige4-3B thus establishes a new lightweight flagship paradigm, offering high capability, efficiency, and accessibility for both research and real-world deployment.
Looking ahead, we aim to further extend the capabilities of small-scale models to even more complex challenges, such as autonomous software engineering (SWE), deep-research agents, and diverse real-world cross-scenario tool use tasks.
## Appendix A Author List
Authors are listed in alphabetical order by first name. Names marked with an asterisk (*) denote individuals who were previously affiliated with our team. Yang Song is the corresponding author and can be reached at songyang@kanzhun.com.
Chen Yang, Guangyue Peng, Jiaying Zhu, Ran Le, Ruixiang Feng, Tao Zhang, Wei Ruan, Xiaoqi Liu *, Xiaoxue Cheng, Xiyun Xu, Yang Song †, Yanzipeng Gao *, Yiming Jia, Yun Xing, Yuntao Wen, Zekai Wang, Zhenwei An, Zhicong Sun, Zongchao Chen